routine analytical chemistry sub-group · during 2002, the coresta routine analytical chemistry...
TRANSCRIPT

16 June 2008
Page 1 of 23
Routine Analytical ChemistrySub-Group
Technical Report
2004 and 2006 Collaborative Studies for Ammonia in Tobacco
May 2008
Co-ordinators:Linda Crumpler (Chairman), R.J. Reynolds Tobacco Co., Winston-Salem, North CarolinaLinda Drake (Secretary and Study Co-ordinator), British American Tobacco, Southampton, UK
Statistics:Linda Drake

16 June 2008
Page 2 of 23
TABLE OF CONTENTS
1. BACKGROUND ...........................................................................................3
2. SUMMARY...................................................................................................3
2.1 STUDY 1 (2004) ..................................................................................3
2.2 STUDY 2 (2006) ..................................................................................4
3. CONCLUSION.............................................................................................5
APPENDICES:.................................................................................................6
APPENDIX A .............................................................................................6
APPENDIX B .............................................................................................7
APPENDIX C ...........................................................................................14
APPENDIX D ...........................................................................................17
APPENDIX E ...........................................................................................18
APPENDIX F............................................................................................18
APPENDIX F............................................................................................19
APPENDIX G ...........................................................................................20
APPENDIX H ...........................................................................................21
APPENDIX I.............................................................................................22
APPENDIX J ............................................................................................23

16 June 2008
Page 3 of 23
1. BACKGROUND
During 2002, the CORESTA Routine Analytical Chemistry (RAC) sub-group organised and carried out a collaborative study to determine ammonia in tobacco. This was part of a larger study that included nicotine, sugars, moisture and nitrate in tobacco. The main outcome of this study was that, in the absence of a CORESTA Recommended Method (CRM), there was not a common approach to the analysis of ammonia in tobacco amongst the sub-group labs.
During the September 2003 sub-group meeting it was agreed that the Industry had a need for a harmonised approach to the analysis of ammonia in tobacco. A suggestion was made that a questionnaire be drafted and sent to prospective participants requesting details on the various methods used to analyse for ammonia in tobacco. This was done in late 2003.
At the April 2004 sub-group meeting the different approaches highlighted in the questionnaires were presented alongside an outline proposal for a future harmonisation study protocol. A summary of the different approaches used is to be found in APPENDIX A. The group agreed with the proposal and RJR volunteered to draft a method and protocol with BATUK procuring and distributing suitable samples.
The method, protocol and 7 samples of ground tobacco were distributed to 16 volunteer sub-group laboratories during May/June 2004. Details of these can be found in APPENDICES B; C & D. Laboratories were instructed to follow the protocol as closely as possible.
The data from this 2004 study, along with the summary of the methods used, was presented at the September 2004 RAC sub-group meeting and is summarised in section 2.1.
However, the main outcome from this study was that there were insufficient laboratories following the protocol to provide data that could be used to calculate robust R & r statistics according to ISO 5725 in support of a new CRM for the analysis of ammonia in tobacco.
A decision was made at the October 2005 meeting to repeat the study but only involving laboratories who were able to strictly follow the protocol so that sufficient data could be obtained to support R & r statistical evaluation. The data from this 2006 study is discussed in section 2.2.
Historically, Continuous Flow Analysis (CFA) has been the preferred technique for this analysis, but more laboratories are now using the more sophisticated Ion Chromatography (IC). Laboratories were therefore invited during this second study to submit IC data if they were not able to analyse using CFA.
2. SUMMARY
2.1 STUDY 1 (2004)
The 7 samples had the following approximate concentrations:-

16 June 2008
Page 4 of 23
Sample ID % Ammonia (wwb)A 0.8B 0.6C 0.2D 0.3E 0.3F 0.4G 0.4
The proposed method is to be found in APPENDIX B with the protocol in APPENDIX C.
The list of participating laboratories is to be found in APPENDIX D.
16 sets of samples were distributed and 15 sets of results received within the required timescale. Thirteen of these had used the CFA technique, one a rapid method and one IC. Three of the laboratories had submitted obviously outlying data which were checked directly with the laboratories and because one of the laboratories (laboratory 6) admitted to having a technical problem, their data was removed from the study. The data from these 14 laboratories is to be found in APPENDIX E.
On examining the summary of the chemistries used by these laboratories (APPENDIX F) it was apparent the only 3 laboratories had strictly followed the protocol. This was clearly insufficient data to support the recommendation of a CRM for ammonia in tobacco.
During October 2005 a note was sent out to the sub-group asking how many laboratories would be in a position to strictly follow the protocol should there be a further study. 10 laboratories promised to follow the CFA protocol and 9 laboratories also indicated their willingness to test using IC. As these numbers were promising, the sub-group agreed to repeat the study, but only using 5 samples.
2.2 STUDY 2 (2006)
In February 2006, 5 samples were duly despatched to the volunteer labs.
The 5 samples had the following approximate concentrations:-
Sample ID % Ammonia (wwb)A 0.8B 0.6C 0.3D 0.3E 0.4
The method and protocol was as per the first study, with instructions to the laboratories that had the capability to analyse using IC to use their own in-house method.
The list of participating laboratories for the second study is in APPENDIX G.

16 June 2008
Page 5 of 23
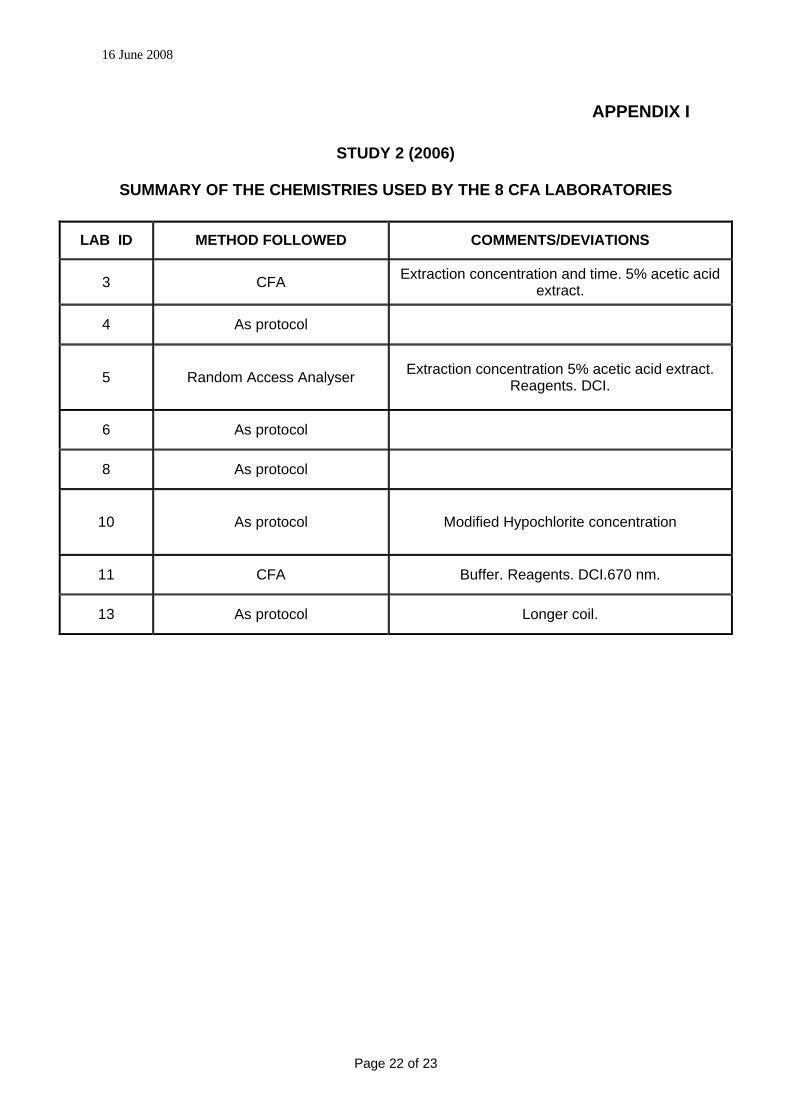
Of the 8 laboratories that used CFA, only 3 were able to strictly follow the protocol, which was disappointing as this meant that there would be insufficient data to support the recommendation of a CRM. The data from this second study is to be found in APPENDIX H. The table of the methods used is in APPENDIX I.
Of the 8 laboratories who had initially promised to use an IC approach, data was received from 3 labs. This data is to be found in APPENDIX H. The information on the IC methods used is in APPENDIX J. Even though one the labs used a different analytical approach compared to the other two labs (mainly in terms of extraction and elution media), the overall results are very well in line with the CFA data. Moreover, the between-lab variability of the 3 labs using IC was very acceptable and no trend of the results was observed when comparing the two analytical approaches. The data consistency between the ammonia results obtained by CFA and IC has to be confirmed however on a larger scale with more participating IC labs.
3. CONCLUSION
There is still insufficient data to support the recommendation of a CRM for Ammonia in tobacco despite two back to back studies carried out by the RAC sub-group. However, thegroup did feel that it is important to publish and make available the data and methods used from these studies, hence the issuing of this report.

16 June 2008
Page 6 of 23
APPENDICES:
APPENDIX A
AMMONIA IN TOBACCO – SUMMARY OF THE RANGE OF APPROACHES USED DURING 2002 STUDY.
ASPECT APPROACHExtraction
concentration1 g in 25 ml
0.1 g in 100 ml
Extraction medium Aqueous Acidic
Extraction time20 minutes 30 minutes 60 minutes
Filtration device Whatman 40 paper 0.45 µm disc
Reference material Ammonium sulphate Ammonium chloride
Standard range 0 to 12 ppm 0 to 70 ppm
Sample to wash ratio 1:0.7 1:3
Wavelength640 nm 660 nm 670 nm

16 June 2008
Page 7 of 23
APPENDIX B
Tobacco – Method for the Determination of Ammonia – Continuous Flow Analysis Method
April 2004
1. Scope
This method is intended for use in the quantitative determination of ammonia in aqueous extracts of tobacco matrices. This method is valid over a wide range of concentrations. The applicable range may be extended by changing the detector sensitivity, sample dilution, or amount of sample used.
2. Principle
An aqueous extract of tobacco is prepared and ammonia is determined by the reaction with salicylate and hypochlorite in a buffered alkaline solution. Sodium Nitroprusside is used as a catalyst. The resulting color is measured at 660 nm.
3. Equipment/Apparatus
3.1 Equipment
3.1.1 Rapid Flow Analyzer (Model 300) System, Astoria-Pacific International or equivalent, consisting of:
AutosamplerMicropumpCartridge BasePhotometerAnalytical Cartridges for ammonia
3.1.2 Astoria-Pacific FASPAC Data Acquisition Software or equivalent.
3.1.3 Gyrotory Shaker – New Brunswick Scientific – model G-10 or equivalent.
3.1.4 Dispenser – Wheaton Omnispense or equivalent.
3.1.5 Mettler AT200 Analytical Balance or equivalent.
3.2 Apparatus
3.2.1 Erlenmeyer Flasks - 125-mL, with stoppers or equivalent.
3.2.2 Filter Paper - Schleicher & Schuell 560 pleated or equivalent.
3.2.3 Vials - Polyethylene with caps (10-mL) or equivalent.
3.2.4 Sample Cups – 2-mL, Fisherbrand 02-544 or equivalent.

16 June 2008
Page 8 of 23
4. Reagents
4.1 Sodium Hydroxide – 20% solution (Lab Chem # LC24090-2) or equivalent.
4.2 Sodium Potassium Tartrate (Fisher # S387-500) or equivalent.
4.3 Sodium Phosphate, dibasic (Fisher # S374-500) or equivalent.
4.4 Sodium Hydroxide pellets (Fisher # S318) or equivalent.
4.5 Sodium Chloride (Fisher # S271-1) or equivalent.
4.6 Sulfuric Acid (Fisher # A300-500) or equivalent.
4.7 Sodium Salicylate (Fisher # S395-500) or equivalent.
4.8 Sodium Hypochlorite (Clorox bleach Note: Any commercially available brand of liquid bleach containing 5.25% hypochlorite and no other additives is sufficient).
4.9 Ammonium Sulfate (Fisher # A938-500) or equivalent.
4.10 Brij-35 surfactant (Astoria-Pacific # 90-0710-04) or equivalent
5. Prepare Test Portion of Sample for Analysis
5.1 Accurately weigh approximately 0.5000 (� .01) grams of “as received” tobacco material into a clean, dry 125-mL Erlenmeyer flask. Record the weight.
6. Extract and Filter
6.1 Add exactly 100 mL of deionized water. Stopper the flask and shake for 30 minutes at 300 rpm on an orbital shaker. Filter extract through Schleicher and Schuell 560 pleated filter paper into a 10-mL polyethylene receiving vial. Place cap on vial until ready to analyze. Capped vials can be stored overnight under refrigeration prior to analysis if necessary.
7. Set-Up Instrument
7.1 Set up the ammonia RFA-300 (1 channel) instrument, including the analytical cartridge, photometer, and sampler, as shown in the flow diagram (Figure 1).
7.2 Turn power on to all units of the system. Start pump and flush system with deionized water containing surfactant ( ~ 1% w/v Brij) for a minimum of 15 minutes until bubble pattern has stabilized. Connect reagent pump tubes (except salicylate/nitroprusside) to reagents according to flow diagram (Figure 1). Do not connect the salicylate/nitroprusside reagent until the other reagents have pumped through the analytical cartridge. This reagent will precipitate in the analytical cartridge under acidic conditions. Reverse this procedure when disconnecting the reagent lines from the pump. If precipitate forms immediately shut down the pump. Using a syringe, carefully flush the analytical cartridge with buffer until lines/coils are clear of obstruction. Note: Refer to Manufacturer’s Operating Instructions for comprehensive operating protocol.

16 June 2008
Page 9 of 23
8. Prepare Reagents
8.1 Sampler Wash Solution (1 L):Deionized Water 1 L30% w/vBrij-35 1 mL
Add 1 mL. of Brij to 1 L of deionized water.
8.2 Stock Sodium Hydroxide Solution, 20% w/v (1 L):Sodium Hydroxide 200 gDeionized Water
Dissolve 200 g of sodium hydroxide in 600 mL of deionized water contained in a 1-L beaker. Quantitatively transfer to a 1-L volumetric flask, let cool to room temperature, and dilute to volume with deionized water. This reagent solution is commercially available and ready to use.
8.3 Stock Sodium Potassium Tartrate Solution, 20% w/v (1 L):Sodium Potassium Tartrate 200 gDeionized Water
Dissolve 200 g of sodium potassium tartrate in 800 mL of deionized water contained in a 1-L beaker. Quantitatively transfer to a 1-L volumetric flask and dilute to volume with deionized water.
8.4 Stock Buffer Solution (1 L):Sodium Phosphate, Dibasic 71 gSodium Hydroxide 20 gDeionized Water
Dissolve 71 g of sodium phosphate, dibasic in 800 mL of deionized water contained in a 1-L beaker. Add 20 g of sodium hydroxide and stir until dissolved. Quantitatively transfer to a 1-L volumetric flask and dilute to volume with deionized water.
8.5 Working Buffer Solution (1 L):Stock Buffer Solution 200 mLStock Sodium Potassium Tartrate Sol. 250 mLStock Sodium Hydroxide Solution 250 mL
Add 250 mL of stock sodium potassium tartrate solution to a 1-L beaker containing 200 mL of stock buffer solution and stir. While stirring, slowly add 250 mL of stock sodium hydroxide solution. Quantitatively transfer to a 1-L volumetric flask and allow to cool to room temperature. Dilute to volume with deionized water. Add several drops of Brij-35 surfactant to portion being used.
8.6 Sodium Chloride/Sulfuric Acid Solution (1 L):Sodium Chloride 100 gSulfuric Acid (conc.) 7.5 mLDeionized Water
Dissolve 100 g of sodium chloride in 600 mL of deionized water contained in a 1-L volumetric flask. Add 7.5 mL of concentrated sulfuric acid, mix and allow to cool to room temperature. Dilute to volume with deionized water. Add several drops of Brij-35 surfactant to portion being used.

16 June 2008
Page 10 of 23
8.7 Sodium Salicylate / Sodium Nitroprusside Solution (1 L):Sodium Salicylate 150 gSodium Nitroprusside 0.3 gDeionized Water
Dissolve 150 g of sodium salicylate and 0.3 g of sodium nitroprusside in 600 mL of deionized water contained in a 1-L beaker. Quantitatively transfer to a 1-L volumetric flask and dilute to volume with deionized water. Store in an amber container. Add 5 or 6 drops of Brij-35 surfactant to the portion being used for analysis.
8.8 Sodium Hypochlorite Solution (100 mL):CLOROX ( 5.25% hypochlorite) 6 mLDeionized Water
Add 6 mL of CLOROX to 50 mL of deionized water contained in a 100-mL volumetric flask. Dilute to volume with deionized water and mix. Add several drops of Brij-35 surfactant before use and mix. Prepare fresh daily.
9. Prepare Standards
9.1 Stock Standard Solution, 100 mg/L NH3, (1 L):Ammonium Sulfate 0.3898 g*Deionized Water
* 100 mg/L x 1 L x (NH4)2SO4 (132.53 gfw) x 1 = 0.3898 g2 x NH3 (17 gfw) 1000mg/g
where: (NH4)2SO4 2NH3 + 2H+
For the stock solution, accurately weigh 0.3898 g of dry ammonium sulfate (99%) and quantitatively transfer into a 1-L volumetric flask. Dilute to volume with deionized water. This solution contains 100 mg/L of ammonia (NH3).
9.2 Working StandardsFor the working standards, accurately pipette volumes (according to the table below) of the stock solution into 100-mL volumetric flasks. Dilute each working standard to volume with deionized water and mix well. These standard solutions are stable for at least three months under normal laboratory conditions.
Volume of NH3 Stock Solution Concentration of NH3 Instrument Calibrant Factor*
2.0 mL 2.0 mg/L 0.025.0 mL 5.0 mg/L 0.05
10.0 mL 10.0 mg/L 0.1020.0 mL 20.0 mg/L 0.2030.0 mL 30.0 mg/L 0.3040.0 mL 40.0 mg/L 0.40

16 June 2008
Page 11 of 23
*The factor (mg/L x 0.1L x 100/1000) is stored in the standards table in the FASPAC software to calculate weight percentage.
where: weight % = mg x 100 / sample wt. (gm) x 1000 mg/gm0.1 L = 100 mL sample extraction volume.
Record the weight, lot number, and date prepared for traceability of standards used with this method.
10. Analyze Standards and Filtrate
10.1 Load the prepared sample extracts on the sampler tray in the exact order of the sample table. A general completed sample table includes the following:
Sync cup (high standard)W (deionized water; baseline)Standards (C1 through C6)W (deionized water; baseline)LC (known check solution)Samples (including appropriate check samples)LC (known check solution)Wash (extraction solution)W (extraction solution)
10.2 Begin analysis of samples by starting the sampler and the computer data acquisition channel.
10.3 Acceptance Criteria for StandardsInstrument calibration is achieved by analyzing the working standards. A linear least square regression of peak height versus concentration (mg / 100 mL) is performed and updated automatically as each standard is completed. If the calibration statistics are not acceptable, determine the cause before repeating the analysis of samples. The calibration plot should be linear through all data points, a similar slope to previous runs, and a correlation coefficient above 0.998.
Results are expressed as a weight percentage, as follows:
% = [Sample Peak Height - Linear Regression Intercept] x Dilution FactorLinear Regression Slope x Sample Weight
10.4 Acceptance Criteria for Sample DataExamine peak heights to ensure that no sample peak height exceeds the response of the highest standard. If this condition exists, dilute the sample such that the response is within the range of standards. Analyze the diluted samples using the correct dilution factor. Review control sample data for acceptability.
Attachments:
Figures 1 and 2 - Ammonia Flow Diagram

16 June 2008
Page 12 of 23
Flow Diagram for Ammonia in Tobacco
Figure 1
Example of a continuous-flow analyzer, μL/min flowCalibration Range: 0.2 mg/100mL - 4.0 mg/100mL
HeatBath
40� C2 mL
Flowcell
Waste
Sampler Wash
AIM
PUMP
OO = 1 Ten Turn CoilOOO = 1 Fifteen Turn Coil
AIM = Air Induction Module
PHOTOMETER PARAMETERS
Filter: 660nmFlowcell: 10mmDamping: 2.0
SAMPLER PARAMETERS PUMP TUBE FLOW RATES
Analysis Rate: 90/hourSample Time: 20 sec.Wash Time: 20 sec.
ORN/YEL = 118uL/min.WHT/WHT = 385uL/min.RED/RED = 482uL/min.BLK/BLK = 226uL/min.ORN/WHT = 166uL/min.ORN/GRN = 74uL/min.GRY/GRY = 568uL/min.
.
Reagent Lines
AIM
Dialyzer6"
"C"
Membrane
Air
NaCl / H2SO4
Sample
Air
NaCl / H2SO4
Working Buffer
Salycilate/Nitroprusside
Hypochlorite
Deionized Water
ORN/YEL
WHT/WHT
ORN/YEL
ORN/YEL
RED/RED
BLK/BLK
ORN/WHT
ORN/GRN
GRY/GRY
OOOOOOOOO
O
(For variable speed pump, pump speed = 45)O = 1 Five Turn Coil

16 June 2008
Page 13 of 23
Flow Diagram for Ammonia in Tobacco
Figure 2
Example of a continuous-flow analyzer, mL/min flow
G Coilcoil
40� C
Flowcell
Waste
Sampler Wash
PUMP
OO = 1 Ten Turn CoilOOO = 1 Fifteen Turn Coil
COLORIMETER PARAMETERS
Filter: 660nmFlowcell: 10mm x 1.5mm ID
SAMPLER PARAMETERS PUMP TUBE FLOW RATES
Analysis Rate: 40/hour1:1
ORN/YEL = .16 ml/minORN/ORN = .42 ml/minRED/RED = .80 ml/minBLK/BLK = .32 ml/minYEL/YEL = 1.20 ml/minGRY/GRY = 1.0 ml/min
THIS DIAGRAM IS FOR INFORMATION ONLY.
Reagent Lines
Dialyzer6"
“C”
Membrane
Air
NaCl / H2SO4
Sample
Air
NaCl / H2SO4
Working Buffer
Salycilate/Nitroprusside
Hypochlorite
Wash Solution
BLK/BLK
RED/RED
BLK/BLK
BLK/BLK
RED/RED
ORN/ORN
BLK/BLK
ORN/YEL
GRY/GRY
OOOOOOOOO
OO
Use YEL/YEL pump tube from Flow Cell to WasteO = 1 Five Turn Coil

16 June 2008
Page 14 of 23
APPENDIX C
PROTOCOL FOR INTERLABORATORY AMMONIA NITROGEN IN TOBACCO CROSSCHECK - 2004.
1. INTRODUCTION
1.1 This procedure describes a method for conducting a study to determine the precision of the recommended Ammonia Nitrogen method as circulated in April 2004. Results are reported as % Ammonia, corrected to a dry weight basis using oven moisture.
1.2 The cross-check is designed as a balanced uniform level experiment, in which samples from 7 batches of materials, representing 7 different levels of the test are sent to participating laboratories. The laboratories have volunteered and are members of the CORESTA Routine Analytical Chemistry Sub-group.
The aim of the study is to assess the Repeatability and Reproducibility (see Section 5 for definitions) of all laboratories, and the Repeatability and Reproducibility of the Ammonia Nitrogen method with a view to recommending it for adoption by CORESTA as a Standard Method.
2. SCOPE
2.1 This document describes how the cross-check procedure shall be conducted by an individual participating laboratory. This document does not describe the actual recommended test method for Ammonia Nitrogen, which is to be found in the method. Laboratories will carry out the testing using method that reflects as close as possible the recommended method and note any deviations from the method when submitting their results.
2.2 Statistical analysis of the data is not discussed in this document, but details can be obtained from [email protected]
3. PROCEDURE
3.1 7 pouches of homogenised tobacco, at different ammonia nitrogen levels have been prepared by Southampton R&D, and distributed to the participating laboratories.
3.2 Each laboratory shall analyse exactly 3 test portions, from each of the 7 pouches, under repeatability conditions:
i.e. within a short interval of time by the same operator, without any intermediate recalibration of the apparatus, unless this is an integral part of performing the measurement.
This will result in 3 measurements for each of the 7 pouches being reported in the spreadsheet (i.e. 21 measurements in all)
3.3 If an operator becomes unavailable, another one can complete the measurements, provided the change does not occur within a group of 3 tests but only between two of the 7 levels. Any such change shall be reported with the results.

16 June 2008
Page 15 of 23
3.4 All measurements shall be completed within 2 months of receiving the sample pouches.
3.5 Where the measurement is carried out by a team of operators, each of whom performs some specific part of the procedure, the team shall be regarded as the "operator". Any change in the team shall be regarded as a different "operator".
3.6 In a precision experiment, the test results shall not be rounded, and ideally should be reported to at least one more digit than specified in the standard method used by the laboratory for the test.
4. REPORTING OF RESULTS
Using the spreadsheet provided by BAT Southampton,
The laboratory supervisor should report the following information:
4.1 The individual test results entered on the spreadsheet provided. The results shall not be rounded, and ideally, reported to at least one more digit than specified in the standard method used by the laboratory for the test.
4.2 The original observed moisture values from which the results were derived, entered on the spreadsheet provided.
4.3 Comments from the operators on any deviation from the documented analytical procedure should be reported in the comments column of the spreadsheet.
4.4 Information regarding any irregularities or disturbances during the measurement, including change of operator, together with a statement as to which measurements were performed by which operator, and the reasons for any missing results.
4.5 The date when the samples were received.
4.6 The date when the samples were measured.
4.7 Information regarding the equipment used.
4.8 Any other relevant information.
4.9 The completed spreadsheet shall be returned to Linda Drake at R&D Southampton, e-mail address [email protected]
telephone: +44 23 8079 3652fax: +44 23 8079 3962
4.10 Any questions or concerns regarding this protocol should also be addressed to Linda Drake.

16 June 2008
Page 16 of 23
5. DEFINITIONS
5.1 Repeatability: The variability between independent test results obtained within a single laboratory in the shortest practical period of time by a single operator on the same set of test apparatus using test specimens from a single quantity of homogeneous material.
5.2 Reproducibility:The variability between test results, obtained in different laboratories, using test specimens from a single quantity of homogeneous material.
5.3 Test result:A test result is the value obtained by carrying out the complete test method once.

16 June 2008
Page 17 of 23
APPENDIX D
STUDY 1 (2004)
LIST OF PARTICIPATING LABORATORIES
Altadis France
Altadis S.A.
Arista US
BAT Germany
BAT UK
China National Tobacco
ETI (now BAT Italy)
KT&G
LTR Industries
PM International
PT HM Sampoerna
Reemstma/Imperial
RJRT
Rothmans B&H
Swedish Match

16 June 2008
Page 18 of 23
APPENDIX E
STUDY 1 (2004)
RAW DATA (Outlying laboratory 6 removed – technical problem)
1 2 3 1 2 3 1 2 31 CFA 0.750 0.750 0.760 0.550 0.560 0.560 0.180 0.180 0.1802 CFA 0.798 0.788 0.799 0.612 0.628 0.624 0.213 0.207 0.2073 CFA 0.850 0.840 0.840 0.610 0.610 0.610 0.190 0.190 0.1904 CFA 0.833 0.825 0.824 0.585 0.584 0.579 0.190 0.189 0.1895 CFA 0.810 0.812 0.839 0.590 0.638 0.595 0.200 0.201 0.2027 CFA 0.917 0.924 0.896 0.632 0.635 0.629 0.200 0.202 0.2008 CFA 0.840 0.832 0.833 0.617 0.604 0.606 0.190 0.190 0.1869 CFA 0.810 0.820 0.820 0.590 0.590 0.590 0.180 0.190 0.19010 CFA 0.800 0.810 0.790 0.560 0.580 0.560 0.200 0.210 0.19011 CFA 0.893 0.883 0.871 0.602 0.602 0.590 0.186 0.186 0.19612 CFA 0.855 0.847 0.854 0.589 0.596 0.571 0.190 0.191 0.19113 CFA 0.834 0.841 0.878 0.584 0.608 0.623 0.202 0.202 0.20714 RAPID ANALYSIS 0.798 0.832 0.806 0.590 0.605 0.571 0.178 0.179 0.18315 IC 0.800 0.810 0.810 0.550 0.550 0.550 0.140 0.130 0.120
1 2 3 1 2 3 1 2 31 CFA 0.280 0.280 0.290 0.280 0.280 0.290 0.360 0.360 0.3602 CFA 0.320 0.326 0.336 0.347 0.360 0.373 0.400 0.402 0.4023 CFA 0.320 0.320 0.330 0.330 0.330 0.330 0.400 0.410 0.4104 CFA 0.306 0.307 0.306 0.303 0.302 0.303 0.403 0.397 0.3995 CFA 0.314 0.323 0.314 0.326 0.327 0.331 0.386 0.379 0.3777 CFA 0.333 0.331 0.331 0.347 0.346 0.345 0.440 0.436 0.4378 CFA 0.326 0.323 0.327 0.325 0.321 0.318 0.396 0.408 0.4069 CFA 0.310 0.310 0.310 0.310 0.310 0.310 0.400 0.400 0.40010 CFA 0.320 0.320 0.300 0.320 0.320 0.320 0.380 0.400 0.38011 CFA 0.317 0.312 0.315 0.321 0.306 0.304 0.408 0.397 0.39812 CFA 0.309 0.310 0.300 0.320 0.312 0.320 0.391 0.389 0.38913 CFA 0.306 0.313 0.325 0.316 0.311 0.320 0.421 0.423 0.42714 RAPID ANALYSIS 0.303 0.302 0.304 0.306 0.305 0.298 0.370 0.371 0.37415 IC 0.260 0.260 0.260 0.260 0.280 0.280 0.370 0.360 0.360
1 2 31 CFA 0.390 0.380 0.3802 CFA 0.381 0.397 0.3793 CFA 0.440 0.440 0.4404 CFA 0.402 0.406 0.4055 CFA 0.422 0.408 0.4147 CFA 0.438 0.437 0.4378 CFA 0.441 0.450 0.4479 CFA 0.390 0.390 0.39010 CFA 0.400 0.400 0.40011 CFA 0.455 0.459 0.46612 CFA 0.403 0.403 0.40113 CFA 0.434 0.430 0.44414 RAPID ANALYSIS 0.390 0.392 0.39915 IC 0.380 0.370 0.370
SAMPLE F
SAMPLE G
Technique
Technique
SAMPLE B SAMPLE CSAMPLE A
Lab No.
Lab No.
Lab No.
Technique
SAMPLE D SAMPLE E

16 June 2008
Page 19 of 23
APPENDIX F
STUDY 1 (2004)
SUMMARY OF THE CHEMISTRIES USED BY THE 12 CFA LABORATORIES
LAB ID METHOD FOLLOWED COMMENTS/DEVIATIONS
1 As protocol 1:100 dilution
2 CFA Different reagents used.630nm.
3 CFA 5% Acetic acid extraction
4 As protocol
5 Random Access Analyser Reagents (DIC). 5% Acetic Acid extraction.
7 CFA 5% Acetic Acid extraction.
8 CFA Reagents (DIC). Dil HCl extraction
9 CFA 1:100 dilution. Reagents (DIC). 2% Acetic Acid extraction.
10 As protocol
11 CFA Reagents (DIC).670 nm.
12 As protocol
13 As protocol Adjustment extraction volume

16 June 2008
Page 20 of 23
APPENDIX G
STUDY 2 (2006)
LIST OF PARTICIPATING LABORATORIES
Altadis France
Arista US
BAT Germany
BAT Italy
BAT UK
FTC
HVL
Labstat
Reemstma/Imperial
RJRT
Rothmans B&H

16 June 2008
Page 21 of 23
APPENDIX H
STUDY 2 (2006)
RAW DATA
SAMPLE A SAMPLE B SAMPLE CLab. No. Technique
1 2 3 1 2 3 1 2 3
3 CFA 0.88 0.86 0.86 0.60 0.60 0.58 0.30 0.30 0.30
4 CRM 0.810 0.814 0.819 0.587 0.585 0.587 0.304 0.304 0.304
5 CFA 0.8842 0.8952 0.7703 0.6343 0.6020 0.6391 0.3507 0.3548 0.3716
6 CRM 0.810 0.830 0.840 0.600 0.570 0.590 0.280 0.300 0.300
8 CRM 0.806 0.830 0.836 0.589 0.593 0.597 0.304 0.302 0.302
10 CFA 0.82 0.82 0.82 0.58 0.59 0.60 0.30 0.32 0.31
11 CFA 0.750 0.720 0.750 0.580 0.490 0.470 0.240 0.230 0.260
13 CFA 0.790 0.820 0.830 0.600 0.570 0.600 0.310 0.310 0.310
14 IC 0.797 0.800 0.776 0.542 0.554 0.549 0.297 0.296 0.291
15 IC 0.840 0.900 0.900 0.680 0.670 0.660 0.300 0.280 0.280
16 IC 0.800 0.800 0.800 0.600 0.600 0.600 0.340 0.340 0.320SAMPLE D SAMPLE ELab.
No. Technique1 2 3 1 2 3
3 CFA 0.29 0.30 0.29 0.38 0.38 0.38
4 CFA 0.297 0.301 0.295 0.388 0.383 0.387
5 CFA 0.3375 0.3853 0.3734 0.4546 0.4317 0.4291
6 CFA 0.300 0.290 0.290 0.380 0.380 0.390
8 CFA 0.307 0.296 0.293 0.394 0.396 0.396
10 CFA 0.30 0.30 0.30 0.39 0.38 0.40
11 CFA 0.240 0.260 0.220 0.350 0.340 0.360
13 CFA 0.290 0.290 0.290 0.410 0.410 0.410
14 IC 0.268 0.273 0.268 0.391 0.384 0.391
15 IC 0.390 0.380 0.380 0.350 0.330 0.350
16 IC 0.330 0.330 0.330 0.420 0.420 0.420
16 June 2008
Page 22 of 23
APPENDIX I
STUDY 2 (2006)
SUMMARY OF THE CHEMISTRIES USED BY THE 8 CFA LABORATORIES
LAB ID METHOD FOLLOWED COMMENTS/DEVIATIONS
3 CFA Extraction concentration and time. 5% acetic acid extract.
4 As protocol
5 Random Access Analyser Extraction concentration 5% acetic acid extract. Reagents. DCI.
6 As protocol
8 As protocol
10 As protocol Modified Hypochlorite concentration
11 CFA Buffer. Reagents. DCI.670 nm.
13 As protocol Longer coil.

16 June 2008
Page 23 of 23
APPENDIX J
STUDY 2 (2006)
SUMMARY OF THE IC METHODS USED
Lab 1 Lab 2 Lab 3
Sample preparationsample
sizeground sample
(40 mesh) Untreated ground sample (<1mm)
sample weight 100 mg 1000 mg 250 mg
extraction volume 10 mL 40 mL 50mL
extraction solution 0.025 N H2SO4
5 mM pyridine dicarboxylic acid + 20 mM tartaric
acid (=mobile phase)
demineralised water
extraction time 60 min 45 min
30 min@ 200 rpm
dilution 1:5 or as appropriate
1:10 or as appropriate
1:10 or as appropriate
filtration 0.45 µm 0.45 µm 0.45 µmIC analysis
columnDionex IonPac
CS12A (4 x 250 mm x 8.5 µm)
Metrosep Cation C2 250 (4 x 250
mm x 7 µm)
Dionex IonPac CS12A (4 x 250 mm x 8.5 µm)
pre-column IonPac CG12A Metrosep C2 250
guard IonPac CG12A
elution tertiary gradient isocratic isocratic
eluent
3 mM MSA (methanesulfonic
acid) in water,water + H2SO4 for
cleaning
5 mM pyridine dicarboxylic acid + 20 mM tartaric
acid
20 mM MSA (methanesulfonic
acid) in water
detectionautosuppression +
conductivity detection
autosuppression + conductivity
detection
autosuppression + conductivity
detectionT° control no no no