route 1 project study report overview. a report that describes the transportation problem and...
TRANSCRIPT

Route 1Project Study Report
Overview

A report that describes the transportation problem and identifies the project scope, schedule and estimated cost so that the project can be programmed for environmental studies.

Two PSRs Developed
(1) Widening with Interchange Modifications
(2) Auxiliary Lanes with Ramp Metering

Range of Alternatives
• Widening for High Occupancy Vehicles (HOV)
• Widening for Mixed Flow Vehicles
• Widening for High Occupancy Toll (HOT)
• Interchange/Ramp Improvements
• Auxiliary Lanes at Various Locations
• Ramp Metering (with all build alternatives)
• No Build

Project Purpose
•To facilitate more efficient and safe operations of Route 1 as measured by congestion, travel times, mobility and accidents.
• To discourage reliance on single-occupant vehicle travel by improving travel conditions and interconnectivity for transit and high occupancy vehicles.
• To maximize the utility of any additional capacity that is created.

Presentation Team
Rich Krumholz Transportation PlannerClaudia Espino Senior Design EngineerScott Eades Transportation EngineerLuis Duazo Project Manager

PROJECT LOCATION MAP

CROSS SECTIONS

CROSS SECTIONS

CROSS SECTION LOCATIONS

CROSS SECTIONS

CROSS SECTIONS

CROSS SECTIONS

CROSS SECTIONS

AUXILIARY LANE LOCATIONS

PEDESTRIAN OVERCROSSING LOCATIONS

On Route 1 Northbound at Morrissey On Ramp

On Route 1 Southbound
at Morrissey Off
Ramp

41st and Bay

On Route 1 Northbound at State Park On Ramp

On Route 1 Southbound at State Park On Ramp

Traffic Analysis
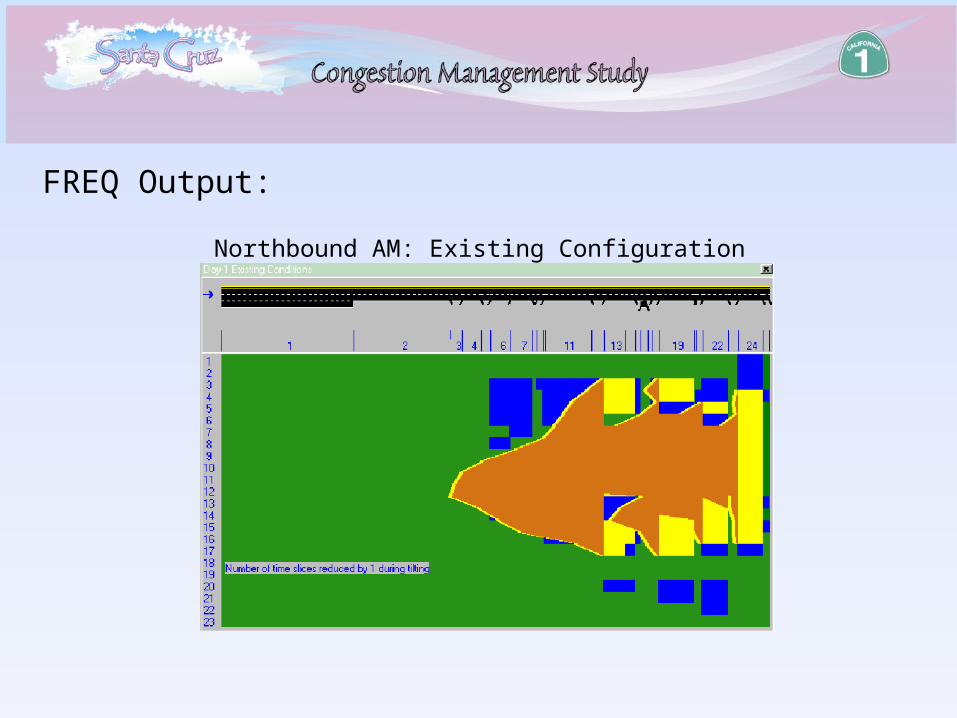
FREQ Output:
0
Northbound AM: Existing Configuration

6:00
7:00
8:00
9:00
11:00
10:00
Timeslices (each =15 minutes)
Subsections(Freeway segments)
Sample FREQ Output - Northbound
Direction of travel
Time Period = 5 hrs, 45 min.
Timeslice 1 ------> Timeslice 2 ------> Timeslice 3 ------>
.
.
.
Green = Uncongested flow (v/c < 0.9), 60+ MPH
Blue = Near Capacity (0.9 < v/c < 1.0), 50 + MPH
Yellow = At Capacity (v/c = 1), Represents bottleneck location
Orange = Congested Flow - Resulting from upstream bottleneck, typically 0-35 MPH
Legend
3 10 2 6 miles
Rte 17 off N
B
Morrissey B
lvd
41st Ave
Bay/Porter A
ve
Soquel Ave
Park Ave
State Park Dr
Rio D
el Mar
Freedom B
lvd
Mar M
onte
Larkin V
alley
Buena V
ista

No-Build
Green = Uncongested (v/c < 0.9) Blue = Near Capacity (0.9 < v/c < 1.0) Yellow = At Capacity (v/c = 1) Orange = Congested Flow
Ramp Meter (4-Lane)
Auxiliary Lane 6-Lane Mixed Flow
Northbound AM
Existing Conditions (2001)
HOV (Mixed Flow Lanes)
Alternatives Analysis(with 2020 Volumes)
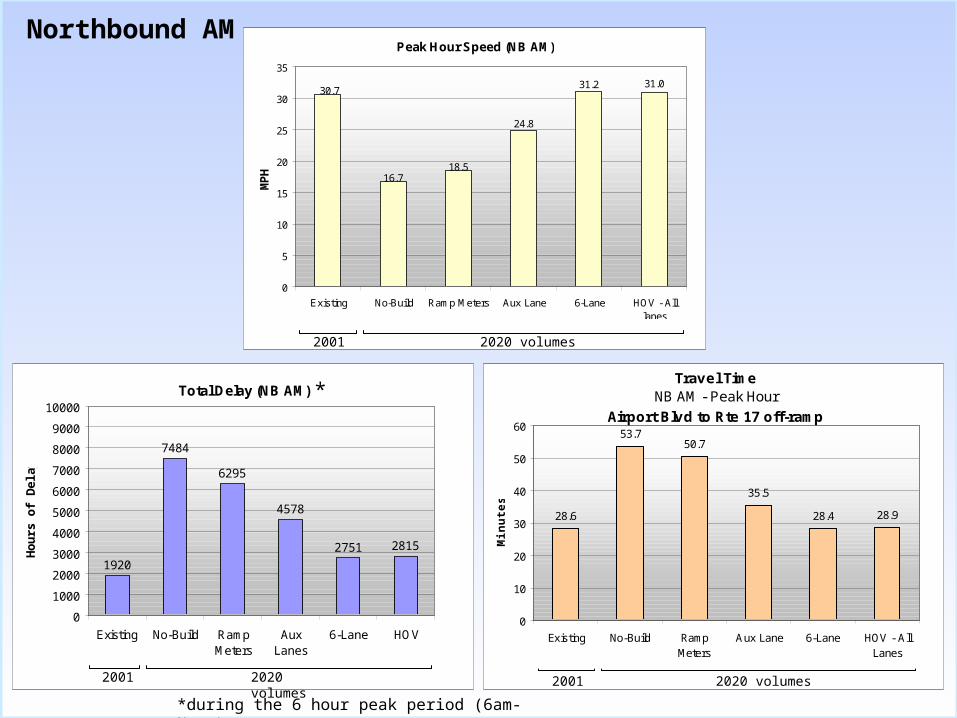
Total Delay (NB AM)
1920
7484
6295
4578
2751 2815
0
1000
2000
3000
4000
5000
6000
7000
8000
9000
10000
Existing No-Build RampMeters
AuxLanes
6-Lane HOV
Ho
urs
of
De
lay
Peak Hour Speed (NB AM)
31.031.2
24.8
18.516.7
30.7
0
5
10
15
20
25
30
35
Existing No-Build Ramp Meters Aux Lane 6-Lane HOV - Alllanes
MP
H
Northbound AM
2020 volumes2001
*during the 6 hour peak period (6am-Noon)
*
2020 volumes2001
Travel TimeNB AM - Peak Hour
Airport Blvd to Rte 17 off-ramp
28.6
53.750.7
35.5
28.4 28.9
0
10
20
30
40
50
60
Existing No-Build RampMeters
Aux Lane 6-Lane HOV - AllLanes
Min
ute
s
2020 volumes2001

2020 No-Build
Green = Uncongested (v/c < 0.9) Blue = Near Capacity (0.9 < v/c < 1.0) Yellow = At Capacity (v/c = 1) Orange = Congested Flow
Ramp Meter (4-Lane)
Auxiliary Lane 6-Lane Mixed Flow
Northbound PM
Existing Conditions (2001)
HOV (Mixed Flow Lanes)
Alternatives Analysis(with 2020 Volumes)

Total Delay (NB PM)
230
9751
8377
765 6191130
0
1000
2000
3000
4000
5000
6000
7000
8000
9000
10000
Existing No-Build RampMeters
AuxLanes
6-Lane HOV
Ho
urs
of
Del
ayPeak Hour Speed (NB PM)
60.2
13.2 14.7
53.1 54.5
48.3
0
10
20
30
40
50
60
70
Existing No-Build Ramp Meters Aux Lane 6-Lane HOV - Alllanes
MP
H
Northbound PM
2020 volumes2001 2020 volumes2001
*
*
*
2020 volumes2001
Travel TimeNB PM - Peak Hour
Airport Blvd to Rte 17 off-ramp
14.6
74.268.7
16.7 16.5 19.1
0
10
20
30
40
50
60
70
80
Existing No-Build RampMeters
Aux Lane 6-Lane HOV - AllLanes
Min
ute
s
2020 volumes2001
*during the 6 hour peak period (2pm-8pm)

Legend
Sample FREQ Output - Southbound
Yellow = At Capacity
Orange = Congested Flow
Green = Uncongested flow
Blue = Near Capacity
2:00
3:00
4:00
5:00
7:00
6:00
Rte 17 on SB
Morrissey B
lvd
41st Ave
Bay/Porter A
ve
Soquel Ave
Park Ave
State Park Dr
Rio D
el Mar
Freedom B
lvd
Larkin V
alley
Ocean St
Direction of travel
----- Timeslice 1 ------> ----- Timeslice 2 ------> ----- Timeslice 3 ------>
.
.
.
3 10 2 6 miles
Scale

No-Build
Green = Uncongested (v/c < 0.9) Blue = Near Capacity (0.9 < v/c < 1.0) Yellow = At Capacity (v/c = 1) Orange = Congested Flow
Ramp Meter (4-Lane)
Auxiliary Lane 6-Lane Mixed Flow*
Southbound PM - With widening to State Park Drive
Existing Conditions (2001)
HOV (Mixed Flow Lanes)*
Alternatives Analysis(with 2020 Volumes)
*Extended only to State Park Drive

Travel TimeSB PM - Peak Hour
Ocean Ave on-ramp to Larkin Valley Rd off-ramp
27.8
41.7 41.644.446.7 44.9
0.0
10.0
20.0
30.0
40.0
50.0
60.0
Existing No-Build RampMeters
Aux Lane 6-Lane toSP
HOV to SP -All Lanes
Min
ute
s
Peak Hour Speed (SB PM)
23.1
11.4 11.8
13.8
18.2 18.1
0
5
10
15
20
25
Existing No-Build Ramp Meters Aux Lane 6-Lane HOV - Alllanes
MP
H
Total Delay (SB PM)
3932
1225211697
9591
6503 6712
0
2000
4000
6000
8000
10000
12000
14000
Existing No-Build RampMeters
AuxLanes
6-Lane HOV
Ho
urs
of
Del
aySouthbound PM
2020 volumes2001
**during the 6 hour peak period (2pm-8pm)
2020 volumes2001
**
**
*Additional lane terminates at State Park Drive
**
**
**
2020 volumes2001

2020 No-Build
Green = Uncongested (v/c < 0.9) Blue = Near Capacity (0.9 < v/c < 1.0) Yellow = At Capacity (v/c = 1) Orange = Congested Flow
Ramp Meter (4-Lane)
Auxiliary Lane 6-Lane Mixed Flow*
Southbound PM - With widening to Larkin Valley/San Andreas
Existing Conditions (2001)
HOV (Mixed Flow Lanes)*
Alternatives Analysis(with 2020 Volumes)
*Extended to Larkin Valley Road

Travel TimeSB PM - Peak Hour
Ocean Ave on-ramp to Larkin Valley Rd off-ramp
27.8
41.7 41.643.8
11.513.7
0.0
5.0
10.0
15.0
20.0
25.0
30.0
35.0
40.0
45.0
50.0
Existing No-Build RampMeters
Aux Lane 6-Lane toLV
HOV to LV- All Lanes
Min
ute
s
Total Delay (SB PM)
3932
1225211697
9591
1073 1354
0
2000
4000
6000
8000
10000
12000
14000
Existing No-Build RampMeters
Aux Lanes 6-Lane HOV
Ho
urs
of
Del
ayPeak Hour Speed (SB PM)
46.7
51.3
13.811.811.4
23.1
0
10
20
30
40
50
60
Existing No-Build RampMeters
Aux Lane 6-Lane HOV - Alllanes
MP
H
Southbound PM
2020 volumes2001 2020 volumes2001
**
**
*Extended to Larkin Valley/San Andreas
****
**
2020 volumes2001
**during the 6 hour peak period (2pm-8pm)