room temperature synthesis and systematic …
TRANSCRIPT

University of Central Florida University of Central Florida
STARS STARS
Electronic Theses and Dissertations, 2004-2019
2009
Room Temperature Synthesis And Systematic Characterization Of Room Temperature Synthesis And Systematic Characterization Of
Ultra-small Ceria Nanoparticles Ultra-small Ceria Nanoparticles
Chetak Patel University of Central Florida
Part of the Chemistry Commons
Find similar works at: https://stars.library.ucf.edu/etd
University of Central Florida Libraries http://library.ucf.edu
This Masters Thesis (Open Access) is brought to you for free and open access by STARS. It has been accepted for
inclusion in Electronic Theses and Dissertations, 2004-2019 by an authorized administrator of STARS. For more
information, please contact [email protected].
STARS Citation STARS Citation Patel, Chetak, "Room Temperature Synthesis And Systematic Characterization Of Ultra-small Ceria Nanoparticles" (2009). Electronic Theses and Dissertations, 2004-2019. 4048. https://stars.library.ucf.edu/etd/4048

ROOM TEMPERATURE SYNTHESIS AND SYSTEMATIC
CHARACTERIZATION OF ULTRA-SMALL CERIA
NANOPARTICLES
by
CHETAK PATEL
Bachelor of Pharmaceutical Sciences, Nagpur University, 2005
A thesis submitted in partial fulfillment of the requirements for the degree of Master of Science
in the Department of Chemistry in the College of Sciences
at the University of Central Florida Orlando, Florida
Fall Term 2009

ii
© 2009 Chetak Sureshbhai Patel

iii
ABSTRACT
Cerium oxide (ceria, CeO2) is a rare earth oxide that has attracted wide-spread research interest
because of its unique properties such as high mechanical strength, oxygen ion conductivity,
oxygen storage capacity and autocatalytic property. In recent years, researchers have discovered
that ceria nanoparticles (NPs) are capable of protecting cells from free radical induced damage.
Interestingly, it was found that nanometer size (~ 5 nm) ceria can scavenge free radicals quite
efficiently, thus acting as an anti-oxidant. This phenomenon has been explained based on the
autocatalytic property of ceria NPs. Several methods have been developed for the synthesis of
ceria NPs that include flame combustion, hydroxide co-precipitation,
hydrothermal/solvothermal, microemulsion, sonochemical and microwave-assisted heating
methods and sol-gel method. Ceria NPs synthesized by these methods are often highly
aggregated. Furthermore, large scale synthesis of monodispersed CeO2 NPs is quite challenging.
Therefore it is desirable to synthesize ceria NPs in bulk quantity keeping its important properties
intact, specifically free-radical scavenging property. The main goal of this study is therefore to
synthesize ultra-small (< 5.0 nm), high quality monodispersed ceria NPs in large quantities.
In this thesis work, I present a couple of room temperature techniques, dilute sodium hydroxide
(NaOH) assisted and ethylenediamine (EN) assisted for the synthesis of nearly mono-dispersed,
ultra-small (< 5 nm) and water-dispersible ceria NPs. Morphology and particle size of the ceria
NPs were investigated through high resolution transmission electron microscopy (HRTEM). The
HRTEM analysis confirmed the formation of 3.0 ± 0.5 nm size and 2.5 ± 0.2 nm size highly-
crystalline ceria NPs when synthesized using dilute NaOH and EN as solvents, respectively. The
nanostructures were characterized by X-ray diffraction (XRD) studies to determine the crystal

iv
structure and phase purity of the products. The samples were also thoroughly characterized by X-
ray photoelectron spectroscopy (XPS) to determine the oxidation state of cerium ions. The
presence of the +3 and +4 oxidation states in the samples was also confirmed from the XPS
analysis. The co-existence of these two oxidation states is necessary for their applications as free
radical scavenger. The autocatalytic behaviors of the ceria NPs were investigated through a
hydrogen peroxide test and monitored by UV-visible transmission spectroscopy.

v
I would like to dedicate my thesis to my Father Mr. Sureshbhai Patel and my Mother Mrs.
Rasika S. Patel.

vi
ACKNOWLEDGMENTS
First of all I would like to acknowledge my advisor Dr. Swadeshmukul Santra for giving me the
opportunity to work in his research group at the NanoScience Technology Center (NSTC).
Without his motivation and constructive suggestions, this research would not have been possible.
I would also like to thank Dr. J. Manuel Perez and Dr. Diego J. Diaz for being on my dissertation
committee and evaluating my thesis.
I would like to also acknowledge The American Chemical Society for granting the copyright
permission (License Number 2274941491987) to reproduce some portion from the following
article “Direct Room Temperature Synthesis of Valence State Engineered Ultra-Small Ceria
Nanoparticles: Investigation on the Role of Ethylenediamine as a Capping Agent” Soumitra Kar,
Chetak Patel, Swadeshmukul Santra. The Journal of Physical Chemistry C, 2009, 113(12), pp
4862-4867.
I specially thank Dr. Soumitra Kar for teaching me all the basics related to material synthesis and
characterization. I also thank Dr. Padmavathy Tallury, Dr. Subhash Banerjee, Dr. Subhajit
Biswas, Jay Patel, Astha Malhotra and all my lab-mates for their help and support that made
working in lab more enjoyable.
I would also like to thank the Department of Chemistry at University of Central Florida for
giving me the financial support and Graduate Studies for the tuition support. I acknowledge the
NSTC and the Advanced Materials Processing and Analysis Center (AMPAC) for the
characterization facilities required for the research work.
I would like to acknowledge my family members Dr. Amit, Dr. Manisha, Ankita, Yagnik and
Jignesh Patel for all help and support. I also thank Neha Panara, Dr. Himanshu Saxena, Pansy D.

vii
Patel, Kaushal Singh, Saral Shah, Palak Patel, Sonal Patel and Balasubramanium Lingam, for all
their love and affection. They stood by me in both good and hard times and made life easier for
me at UCF.
Above all, I would like to thank my father Sureshbhai Patel and mother Rasikaben Patel, my
sister Jaimini and brother Dr. Vikas for their limitless sacrifices for my happiness. I would like to
give full credit to my family without whom this thesis would never have been realized.

viii
TABLE OF CONTENT
LIST OF FIGURES ....................................................................................................................... xi
LIST OF TABLES ....................................................................................................................... xiii
CHAPTER 1: INTRODUCTION ................................................................................................... 1
1.1 Nanotechnology: An Overview ........................................................................................... 1
1.2 Nanomaterial And Its Significance ....................................................................................... 2
1.3 Cerium Oxide (ceria) ............................................................................................................ 5
1.3.1 Introduction to Cerium Oxide ........................................................................................... 5
1.3.2 Applications of Cerium Oxide .......................................................................................... 6
1.3.3 Synthesis of Ceria NPs ...................................................................................................... 6
1.4 Research Objective ............................................................................................................... 7
CHAPTER 2: EXPERIMENTAL PROCEDURE .......................................................................... 8
2.1 Materials ............................................................................................................................... 8
2.2 Methods................................................................................................................................. 8
2.2.1 Sodium Hydroxide Assisted Synthesis of Ultra-Small Ceria NPs (S1) ............................ 9
2.2.2 Ethylenediamine (EN) Assisted Synthesis of Ultra-small Ceria NPs (S2) at RT ............. 9
2.2.3 Solvothermal Synthesis of Ceria NPs (S3) Using EN at 180 oC ....................................... 9

ix
2.2.4. Solvothermal Synthesis of Ceria NPs (S4) Using EN and water as solvent at 180 oC .. 10
2.3 Characterization Techniques ............................................................................................... 10
2.3.1 X-Ray Diffraction ............................................................................................................ 10
2.3.2 X-Ray Photoelectron Spectroscopy ................................................................................. 10
2.3.3 Transmission Electron Microscopy ................................................................................. 11
2.3.4 Dynamic Light Scattering (DLS) .................................................................................... 11
2.3.5 UV-Visible Spectroscopy ................................................................................................ 11
CHAPTER 3: RESULTS AND DISCUSSION ............................................................................ 12
3.1 Sodium Hydroxide Assisted Synthesis of Ultra-Small Ceria NPs ...................................... 12
3.1.1 XRD Analysis .................................................................................................................. 12
3.1.2 TEM and DLS Analysis .................................................................................................. 13
3.1.3 XPS Analysis ................................................................................................................... 17
3.1.4 Autocatalytic Study ......................................................................................................... 20
3.1.5 Growth Mechanism of the Ceria NPs .............................................................................. 22
3.2 EN Assisted Synthesis of Ultra-Small Ceria NPs: Investigation On The Role of EN As
capping agent ............................................................................................................................ 23
3.2.1 Role of EN as Capping Agent ......................................................................................... 37
CHAPTER 4: CONCLUSIONS ................................................................................................... 40

x
REFERENCES ............................................................................................................................. 41

xi
LIST OF FIGURES
Figure 1 XRD pattern of the ceria NPs ......................................................................................... 12
Figure 2 (a) TEM image shows the formation of mono-dispersed ceria NPs. The image in the
inset depicted the high resolution TEM image of an individual NP. (b) SAED pattern of the NPs
indicating the formation of crystalline ceria NPs ......................................................................... 14
Figure 3 TEM image of the ceria precipitate obtained with: (a) 2 g and (b) 10 g NaOH ............. 15
Figure 4 DLS Plot for the ceria NPs synthesized using low concentration of NaOH. It shows
formation of nearly mono-dispersed ceria NPs ............................................................................ 16
Figure 5 XPS spectra of the ceria NPs: (a) survey scan and (b) high-resolution scan showing the
valence states for Ce in the ceria NPs ........................................................................................... 18
Figure 6 (a) High resolution XPS spectra showing the oxygen 1s peak recorded on the ceria NPs.
The deconvoluted plot shows two peaks –one due to the oxygen in ceria and other attributed to
the OH bond in NPs. (b) high-resolution plot along with the corresponding Gaussian fitting plot
showing different valence states for Ce. In the figure, vo, v , uo, and u peaks are attributed to
Ce3+; while v, v , v , u, u , and u are the characteristic peaks of Ce4+. ...................................... 19
Figure 7 (a) UV-visible transmittance plots showing the autocatalytic behavior of the ceria NPs.
(b) Digital images of the aqueous solution of the ceria NPs in absence and presence of H2O2
reflecting the valence state change are depicted in the inset. ....................................................... 21
Figure 8 XRD patterns of the ceria NPs ....................................................................................... 24

xii
Figure 9 (a) HRTEM image shows the formation of mono-dispersed ceria ultra-small ceria NPs.
(b) SAED pattern of the NPs indicating the formation of crystalline ceria NPs .......................... 26
Figure 10 (a) HRTEM image of ~ 8 nm ceria NPs synthesized in EN at 180 ºC and (b) TEM
image of the poly-dispersed ceria NPs synthesized in EN-W at 180 ºC. The image in the inset of
part (b) shows the HRTEM of one ceria nano-cube. .................................................................... 27
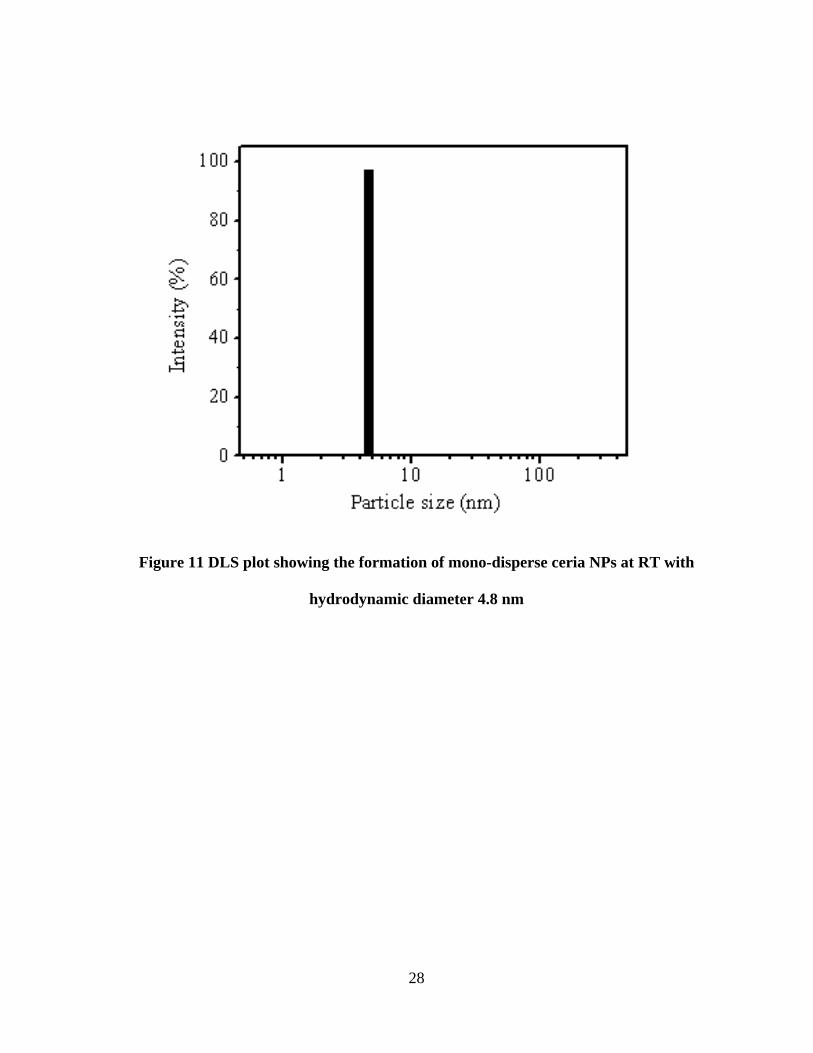
Figure 11 DLS plot showing the formation of mono-disperse ceria NPs at RT with hydrodynamic
diameter 4.8 nm ............................................................................................................................ 28
Figure 12 IR spectrum of the ceria NPs along with the IR spectrum of the pure ethylenediamine
for comparative study ................................................................................................................... 29
Figure 13 XPS spectra of the ceria NPs: (a) survey scan of the sample synthesized at room-
temperature, (b, c and d) high-resolution plot along with the corresponding Gaussian fitting plots
showing different valence states for Ce. (e) high resolution XPS spectrum in the region 520-540
cm-1 showing the details of O1s peak. .......................................................................................... 34
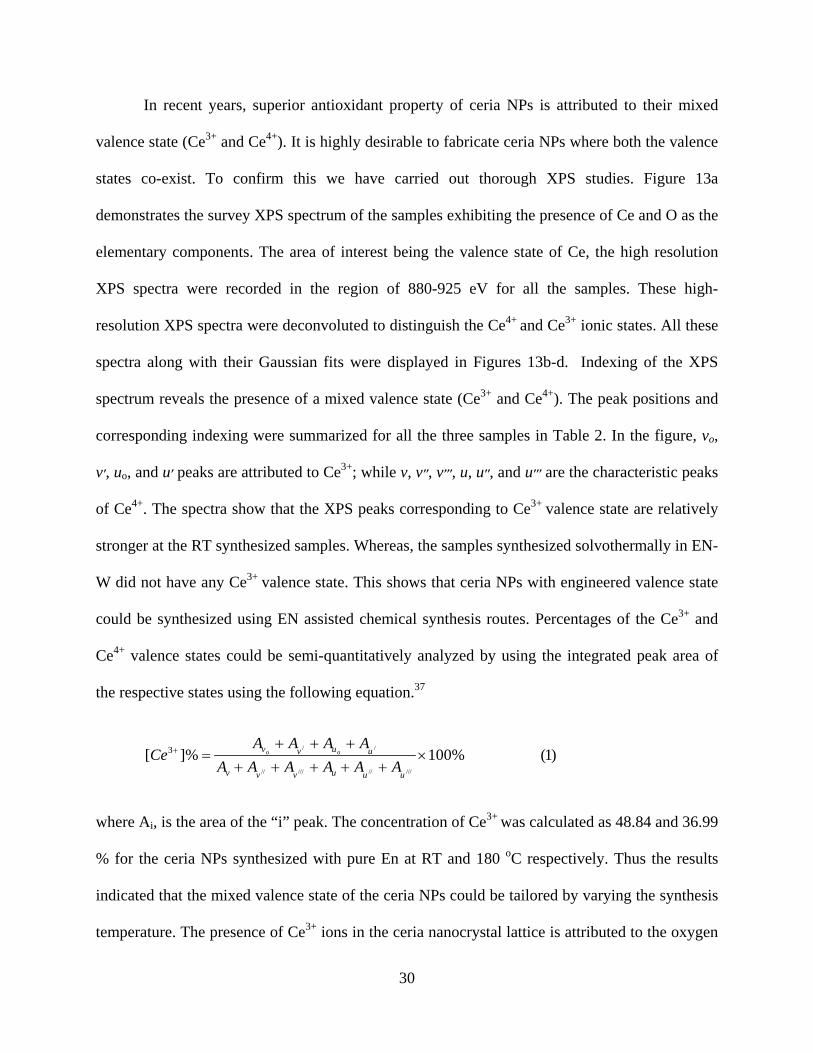
Figure 14 Schematic diagram of the fluorite (CaF2) crystal structure of ceria. Cartoon in the left
shows perfect coordination between Ce4+ and neighboring O2- . The right cartoon shows the
formation of Ce3+ due to the presence of oxygen vacancy. ......................................................... 36
Figure 15 (a) UV-visible transmittance plots showing the autocatalytic behavior of the ceria NPs.
(b) The digital image of the aqueous solution of the ceria NPs in absence and presence of
hydrogen peroxide reflecting the valence state ............................................................................. 39

xiii
LIST OF TABLES
Table 1.The sizes of nanoscale objects ........................................................................................... 3
Table 2 XPS binding energies of individual peaks of the Ce (3d) spectrum for different ceria NPs
....................................................................................................................................................... 35

1
CHAPTER 1: INTRODUCTION
1.1 Nanotechnology: An Overview
The future of nanotechnology was predicted on December 29, 1959 by Nobel laureate
physicist Richard Feynman in his classic lecture “There’s Plenty of Room at the Bottom”
delivered at the American Physical Society meeting at California Institute of Technology, USA.
In his lecture, he mainly focused on the field of miniaturization and suggested that devices and
materials could be fabricated at atomic specifications. Specifically, he said “The Principle of
physics, as far as I can see, do not speak against the possibility of maneuvering things atom by
atom.”1 In 1974 Norio Taniguchi, a professor of Tokyo Science University used the term
“nanotechnology” in his article on ion-sputtered machining to represent extra high precision and
ultra high dimensions. According to him “Nanotechnology mainly consists of the processing of
separation, consolidation, and deformation of materials by one atom or one molecule.”2
Later in 1977 K Eric Drexler who was greatly inspired by Feynman’s ideas originated
“molecular nanotechnology” concept which involves the self assembly of molecules into an
ordered and functional structure. In his book ‘Engines of Creation’ Drexler discussed the
creation of larger objects from their atomic and molecular components; known as ‘bottom-up
approach’.3
In 1981 Gerd Binning and Heinrich Rohrer invented the scanning tunneling microscope
(STM) at IBM laboratories in Zurich. This discovery led to the direct visualization of materials
in nanoscale. The STM provided a unique opportunity to manipulate materials at atomic level
and to record the resulting nanostructure. This was then followed by the invention of atomic
force microscopy (AFM) in 1986, which again allowed scientists to image structures at atomic

2
scale. Another major breakthrough took place in 1985 with the discovery of new form of carbon
called fullerenes 4 (buckyballs) by Harry Kroto, Robert Curl and Richard Smalley, who shared
Nobel Prize in 1996 for this discovery. A fullerene is a single molecule of 60 carbon atoms
arranged in shape of soccer ball, an example of bottom-up nanofabrication approach, all these
developments enabled scientist to term nanotechnology as one of the most promising field of
science of modern era.
1.2 Nanomaterial And Its Significance
Nanoscience deals with matter at nanoscale dimension, typically in the size range
between 1 nm and 100 nm. Unique phenomena/novel properties (e.g. physical, chemical and
biological) that are found in materials at the nanoscale enable nanotechnology and form a solid
basis towards technological breakthrough. Interestingly, such properties are not observed at the
atomic/molecular scale or at the bulk scale, thus making nanotechnology an emerging
technology of the 21st century. A few example of nanoscale objects are summarized in Table 1 3.
In order to enrich the nanoscience, it is extremely important to combine the experimental and
theoretical findings. To achieve this, it is important to synthesize various nanostructures with
control over their shape and size and subsequently characterize their physical and chemical
properties. Proper analyses of these data along with the theoretical explanations are essential to
understand the “nanoscale phenomena” of materials. This is essential for successful transfer of
scientific knowledge to technology.5

3
Table 1.The sizes of nanoscale objects
Object Diameter
Hydrogen atom 0.1 nm
Buckminsterfullerene (C60) 0.7 nm
6 Carbon atom aligned 1 nm
DNA 2 nm
Proteins 5-50 nm
Ribosome 25 nm
Virus 75-100 nm
Bacteria 1,000-10,000 nm
White blood cell 10,000 nm
Nanotechnology is based on interdisciplinary research in nanoscience that includes many
disciplines such as physics, chemistry, materials science, biology and engineering. Research in
this direction has been triggered by the availability of nanomaterial synthesis and fabrication
techniques as well as sophisticated characterization tools, such as STM, AFM, HRTEM that in
combination allow the investigation of nanomaterial size and nanoscale properties. The surface
to volume ratio is much higher in NPs compared to their respective bulk materials. Therefore,
surface atoms that are known to be in a different energetic state than the bulk atoms make
significant contribution to the total free energy. These results in changes in the thermodynamic
properties such as melting point 6 and solid-solid phase transition 7. As the size of the material
decreases, many physical phenomena solids are altered with great reductions in size. Changing

4
from macro to micro dimensions does not have larger impact on this effect, but it becomes a
dominanting factor at the nanoscale.
Nanomaterial and nanocoatings are being used for bodies of aircraft and in aerospace
components. Researchers have claimed that use of nanomaterial can increase the strength of
aerospace materials by as much as 300 percent 8. Nanocrystalline silicon nitride and silicon
carbide have been used in spring ball bearings, and other automotive components 9. For the
fabrication and processing of nanomaterials and nanostructures, the following challenges must be
met: (1) overcome the huge surface energy, a result of enormous surface area or large surface to
volume ratio, (2) ensure all nanomaterials with desired size, uniform size distribution,
morphology, crystallinity, chemical composition, and microstructure, that altogether result in
desired physical properties and (3) prevent nanomaterials and nanostructures from coarsening
through either Oswald ripening or agglomeration as time evolve. To combat these challenges,
researchers are continuously developing synthesis protocols for nanomaterials and improving
their surface coating technologies.
Since the past decade, a number of engineered NPs found wide applications in
nanobiotechnology and nanomedicine 10. In this direction, engineered NPs such as fluorescent
semiconductor quantum dots, dye loaded polymeric NPs, magnetic NPs and gold NPs found
various applications in nanobioimaging and sensing due to their unique optical and magnetic
properties 10. Another research direction that attracted a great deal of attention in recent years is
fabrication of therapeutic nanoparticles. One such material which has found great interest in the
past decade is the ceria NPs. Ceria NPs demonstrated strikingly different autocatalytic property
compared to its bulk counterpart (larger crystals). Such catalytic property has attracted lots of

5
attention among many researchers worldwide for potential application in nanomedicine as a free
radical scavenger 11-15.
1.3 Cerium Oxide (ceria)
1.3.1 Introduction to Cerium Oxide
Cerium is a rare earth element that belongs to the lanthanide group. Lanthanides are present
in the earth’s crust at 100 ppm, among all the lanthanides cerium is found in 24 ppm 16. Several
unique properties of cerium have been revealed by close examination of microcrystalline ceria
structure, all properties differ significantly when compared with other rare earth materials 17.
All the other rare earth elements exists in trivalent states, but cerium atom can exist in
fully oxidized (+4) state as well as fully reduced state (+3). In a redox reaction these two states
interchange 17, 18. As a result of alteration in the redox reaction, change in ceria crystal lattice
(fluorite lattice structure) and the bond length is observed. The redox capacity of ceria is
enhanced with loss of oxygen which creates oxygen vacancies or surface defects in the lattice
structure19.
Change in physical parameters like temperature, pH and oxygen partial pressure (pO2),
results in spontaneous change in the valence and defect structure of ceria 20. At nanoscale, the
characteristic properties of ceria are altered drastically compared to its bulk counterpart 21.
Presence of extremely high surface areas compared to bulk is important factor for the improved
catalytic activity of the ceria NPs. In addition, the synthesis and thermodynamic conditions used
to achieve ultra-small ceria NPs produce oxygen deficient ceria crystals. This type of oxygen
deficiency in the crystal generates Ce3+ species in the CeO2 lattice which causes the concurrent

6
presence of Ce3+ and Ce4+ valence state in the same crystallites introducing the anti-oxidant
property in the material.
1.3.2 Applications of Cerium Oxide
Ceria is a useful material with applications as polishing agents 22, as an electrolyte for
solid fuel cells 23, and also as a potential candidate for gate oxides in metal oxide semiconductor
devices 23, as oxygen ion conductivity and oxygen storage capacity, autocatalytic properties and
free radical scavenging property 14, 24-33. Researchers have used ceria NPs in wide variety of
applications. It has been used to coat metals which help to reduce oxidation 31 and also used as a
coating material for catalytic converters thatenhanced the oxidation of carbon monoxide and
hydrocarbons.
Recent studies have demonstrated that ceria NPs are capable of reducing free radical
induced damage to rat brain cells which consisted of neurons, glia and microglia 11, 15, 34. It is
believed that the anti-oxidant property of ceria NPs increased longevity of neuron cells by
reducing free radical damage commonly associated with aging and degenerative disorders of the
central nervous system. It has also been demonstrated that ceria NPs particles are capable of
protecting healthy cells from radiation damage in the treatment of cancer 15.
1.3.3 Synthesis of Ceria NPs
Several methods have been employed to synthesize ceria NPs including flame
combustion method 35, 36, hydroxide co-precipitation of a precursor solution composed of cerium
ammonium nitrate and zirconyl chloride followed by sonication 37, hydrothermal/solvothermal
process 38, 39, microemulsion process 31, 40, sonochemical and microwave-assisted heating

7
methods 41, sol-gel method 42, base-catalysed aqueous precipitation method 13 etc. However,
chemical synthesis of high-quality ceria NPs in large-scale remains a great challenge that
demands developments of robust synthesis technique.
To date, the ceria NPs synthesized by above-mentioned methods are often highly
aggregated and not useful even though there is almost 100% conversion of ceria chemical
precusor to ceria NPs. Once aggregated particles are removed by centrifugation or filtration
techniques, the yield of monodispersed ceria NP decreases that limits large scale synthesis. It is
therefore important to develop a robust synthesis method that will address the above-mentioned
limitations for producing water-dispersible, ultra-small (< 5 nm), crystalline ceria NPs that are
highly monodispersed.
1.4 Research Objective
The main objective of my MS research was to develop robust synthesis techniques for
producing ultra-small, water-dispersible, highly-monodispersed ceria NPs to meet the growing
demand of high-quality ceria NPs.

8
CHAPTER 2: EXPERIMENTAL PROCEDURE
2.1 Materials
All the reagents were used as received. De-ionized (DI) nanopure water was used for all
experiments. Reagent grade cerium nitrate (Ce (NO3)3.6H2O), ethylenediamine and NaOH was
purchased from Fisher Scientific. All the chemicals and solvents were of analytical grade and
used without further purification.
2.2 Methods
Synthesis of NPs with controlled size and shape is highly challenging. The bottom up
approach is highly accepted for the synthesis of ultra-small (<5 nm) NPs including ceria NPs.
To control nucleation and growth processes, a highly controlled reaction environment is
desirable. As discussed in Section 1.3.3, current ceria NP synthesis methods have certain
drawbacks such as multi-step labor-extensive synthesis process, limited reproducibility and low
yield of monodispersed ceria NPs. The choice of the technique is governed by factors such as
size and shape selectivity, reproducibility, simplicity, large scale production, cost effectiveness
etc. The purity and homogeneity of material are very important aspect from technological
applications and needs to be taken into consideration while designing any synthetic method.
The present study involves the synthesis of ceria NPs at RT. The synthesis routes described
herein are simple (one-pot synthesis), cost-effective and highly-reproducible. Products are free of
large aggregates and the yield of monodispersed particles is quite high.

9
2.2.1 Sodium Hydroxide Assisted Synthesis of Ultra-Small Ceria NPs (S1)
Ceria NPs were synthesized by adding 0.434 g Ce (NO3)3.6H2O to a different
concentration of basic solution (0.1 g, 2g,and 10g NaOH dissolved in 32 mL water) followed by
48 hrs magnetic stirring. The resulting white precipitate was collected and washed several times
in water. Ceria NPs remained well dispersed in DI water for several days studied herein.
2.2.2 Ethylenediamine (EN) Assisted Synthesis of Ultra-small Ceria NPs (S2) at RT
The ultra-small ceria NPs were synthesized at RT by dissolving 0.234 g of
Ce(NO3)3.6H2O in 32 mL EN with continuous stirring for 24 h upon which the solution turned
light yellow 12. The particles were recovered by centrifugation followed by washing in water.
The particles were re-dispersed in DI water to obtain a faint yellow solution.
2.2.3 Solvothermal Synthesis of Ceria NPs (S3) Using EN at 180 oC
A Teflon-lined stainless steel cylindrical closed chamber with 40 mL capacity was used for the
synthesis. Cerium nitrate salt was used as cerium precursor and EN as the base. The Teflon-lined
chamber was filled up to 80% of its volume with EN and 0.234 g of cerium nitrate was added to
the solution After 15 minutes of stirring, the closed steel chamber was placed inside a preheated
oven for 8 hrs at 180°C 12. The chamber was then allowed to cool down to RT. The resulting
precipitate was filtered and washed several times with water.

10
2.2.4. Solvothermal Synthesis of Ceria NPs (S4) Using EN and water as solvent at 180 oC
The Teflon-lined chamber was filled with 80 % of its volume with equal ratio of EN and water
(EN-W) and 0.234 g of cerium nitrate was added to the solution. After 15 minutes of stirring, the
closed chamber was placed inside a preheated oven for 8 hrs at 180°C. The chamber was then
allowed to cool down to RT. The resulting precipitate was filtered and washed several times with
water 12.
2.3 Characterization Techniques
The physical and chemical properties of the ceria NPs were investigated by using various
materials characterization techniques. XRD was used to determine the crystal structure and phase
of products. Morphology of the nanostructure was studied from transmission electron
microscopy (TEM). The high resolution transmission electron microscopy (HRTEM) was used
to study the crystal structure of individual nanostructures. Optical absorption spectroscopy was
used to study optical properties of the nanostructures. The chemical composition of the
nanostructure was determined with X-ray photoelectron spectroscopy.
2.3.1 X-Ray Diffraction
XRD patterns were recorded on Rikagu D/MAX instrument with CuKα1 radiation with a scan
rate of 0.25 degree min-1.
2.3.2 X-Ray Photoelectron Spectroscopy
XPS spectra were obtained using a Physical electronic 5400 ESCA spectrometer with a base
pressure of 109 Torr and MgKα X-ray radiation at a power of 200 W.

11
2.3.3 Transmission Electron Microscopy
TEM images were obtained using FEI TECNAI F-30 microscope operating at 300kV. The
samples were prepared by placing a drop of solution containing ceria NPs on a thin carbon film
coated copper 400 mesh grid.
2.3.4 Dynamic Light Scattering (DLS)
DLS experiments were performed on a PDDLS/Cool Batch 40T; PD2000 DDLS Measurements
were taken by analysis the solution of ceria NPs in distilled water.
2.3.5 UV-Visible Spectroscopy
UV-Visible studies were performed on Varian Cary 300 Bio UV/Vis spectrometer.

12
CHAPTER 3: RESULTS AND DISCUSSION
3.1 Sodium Hydroxide Assisted Synthesis of Ultra-Small Ceria NPs
3.1.1 XRD Analysis
XRD pattern of the dried sample shown in Figure 1 confirmed the formation of phase
pure CeO2 with cubic phase (fluorite structure, JCPDS 34-0394, space group Fm-3m) having
lattice constants of 5.414(3), 5.436(3), and 5.405(3) Å, respectively. The broadening of the
diffraction pattern could be ascribed to the formation of ceria NPs. Within the limit of the XRD
sensitivity, formation of any other phase such as hydroxide phase [Ce(OH)3] could not be
detected.
Figure 1 XRD pattern of the ceria NPs

13
3.1.2 TEM and DLS Analysis
The High Resolution TEM (HRTEM) study on ceria NPs was done to investigate the
morphology and particle size of the particles. HRTEM image shown in Figure 2a clearly shows
the formation of single crystalline ceria NPs at RT. It reveals the formation of nearly mono-
dispersed ceria NPs with particle size 3.0 ± 0.5 nm. Image in the inset of Figure 2a shows the
HRTEM image of a single ceria NP. Figure 2b represents the selected area electron diffraction
(SAED) pattern recorded on a bunch of ceria NPs. The various crystalline plane of ceria NPs
were indexed as the appearance of bright white ring on the SAED pattern. The results are in good
agreement with the XRD pattern.
It was observed that the use of high concentration of NaOH triggered rapid and
uncontrolled precipitation producing undefined aggregated ceria structures. Figure 3 reveals the
formation of aggregated ceria structure with high concentration of NaOH. The particle size
distribution and aqueous solubility was also characterized using DLS technique. The DLS data
(Fig.4) also indicated the formation of nearly monodispersed particles with particle size 6.3 ± 1.0
nm. The appearance of the higher particle size in DLS as compared to the TEM is expected as
the DLS provides the hydro-dynamic size of the particle in a solution.

14
Figure 2 (a) TEM image shows the formation of mono-dispersed ceria NPs. The image in
the inset depicted the high resolution TEM image of an individual NP. (b) SAED pattern of
the NPs indicating the formation of crystalline ceria NPs

15
Figure 3 TEM image of the ceria precipitate obtained with: (a) 2 g and (b) 10 g NaOH

16
Figure 4 DLS Plot for the ceria NPs synthesized using low concentration of NaOH. It shows
formation of nearly mono-dispersed ceria NPs

17
3.1.3 XPS Analysis
In order to determine the chemical composition and the valence state of the elementary
components in the products we have carried out the XPS studies. It could be mentioned here that
the XPS technology is not 100 % reliable technique to draw elementary compositions. But, a
comparative study of more than one sample could indicate the elementary composition and
environment of the constituent elements in the crystal lattice. Figure 5a shows the detailed XPS
spectrum of the samples demonstrating the presence of Ce and O as the elementary components.
It is well known that the valence state of the cerium is important in determining the properties
and applicability of the ceria NPs. The high resolution XPS spectral analysis therefore provides
details of the valence state of cerium in the region of 880-925 eV.
The XPS spectrum (Figure 5b) shows the presence of a mixed valence state (Ce3+ and Ce4+) for
the synthesized ceria NPs. The appearance of the Ce3+ valence state in the CeO2 crystal lattice
indicated the presence of oxygen vacancy centers in the ceria crystal lattice. Due to the oxygen
vacancy, the coordination number of Ce4+ to O2− reduces from eight to seven and introduces Ce3+
ions into the crystal lattice. Furthermore, the high resolution oxygen peak in the XPS spectra
(Fig. 6a) reveals the presence of a solder peak at ~ 532 eV, which corresponds to the OH groups.
Percentage of Ce3+ was calculated semi-quantitatively as 57.1 % using equation 1.
The presence of cerium hydroxide phase in the nanocrystals however, was not evident
from the cumulative data analysis from XRD, HRTEM and SAED patterns. The presence of
hydroxyl groups as evident from XPS must have originated from surface attached hydroxyl
groups. NaOH played a critical role as a catalyst for transforming cerium salt to ceria and
hydroxide ions served as a capping agent to prevent further grain growth.

18
Figure 5 XPS spectra of the ceria NPs: (a) survey scan and (b) high-resolution scan
showing the valence states for Ce in the ceria NPs
0 200 400 600 800 1000
Int
ensit
y (arb
. unit
)
Binding Energy (eV)
(a)
880 890 900 910 920
(b)
Inten
sity (
arb. u
nit)
Binding Energy (eV)
Ce 3d3/24f0
Ce 3d3/2
Ce3+Ce4+Ce3+ Ce4+Ce4+
Ce 3d5/2

19
880 890 900 910 920
u'''u''
uu'
u0
v'''v''
v'vvo
In
tensit
y (a
rb. u
nit)
Binding Energy (eV)
Figure 6 (a) High resolution XPS spectra showing the oxygen 1s peak recorded on the ceria
NPs. The deconvoluted plot shows two peaks –one due to the oxygen in ceria and other
attributed to the OH bond in NPs. (b) high-resolution plot along with the corresponding
Gaussian fitting plot showing different valence states for Ce. In the figure, vo, v , uo, and u
peaks are attributed to Ce3+; while v, v , v , u, u , and u are the characteristic peaks of
Ce4+.
(b)
(a)

20
3.1.4 Autocatalytic Study
To demonstrate the auto-catalytic property of the ceria NPs, we carried out a UV–visible
spectroscopic study in absence and presence of hydrogen peroxide (Figure 7a). The ceria NP
solution in DI water was transparent and colorless as depicted in the digital images in the Figure
7b. First, the transmittance spectra of the water-dispersed ceria NPs were recorded. In the next
step, 10 µl H2O2 was added to the above solution, stirred for 1 min and the transmission
spectrum was measured again.
The transmission spectrum exhibited a large red shift when compared to the spectrum of
ceria NP without H2O2. This is further substantiated by the drastic color change of the solution
from clear to dark reddish-brown upon addition of H2O2. This red-shift in the transmittance
spectrum is due to a change in the oxidation state from Ce3+ to Ce4+.
The experimental solution was then kept in the dark and UV–visible spectra were
recorded for the next 10 consecutive days. A gradual blue shift in the spectra was observed over
time. This gradual blue shift reflects the regeneration of the Ce3+ oxidation state in the ceria NPs.
At the end of the 10 days, the color of the solution faded away and became yellow. When an
additional hydrogen peroxide dose was administered to the solution on day 10, the UV–visible
spectrum again shifted to lower energy and subsequently the color of the solution again turned
reddish-brown. With time, a gradual blue shift to the lower wavelength was observed, as seen
previously.

21
Figure 7 (a) UV-visible transmittance plots showing the autocatalytic behavior of the ceria
NPs. (b) Digital images of the aqueous solution of the ceria NPs in absence and presence of
H2O2 reflecting the valence state change are depicted in the inset.
(b)
(a)

22
The antioxidant property of the ceria NPs is controlled by the oxygen vacancy
level in the nanocrystals. It has been proposed that the antioxidant property of ceria NPs
are due to the presence of mixed valence states (Ce3+ and Ce4+) on the NPs’ surface.
During the catalytic process, owing to oxidation Ce3+ ions are converted to Ce4+. The
system is regenerated via a series of surface chemical reactions between ions in solution
and the Ce4+ ions on the NPs surface, which on subsequent reduction are converted back
to Ce3+. The complete process is depicted in the following reactions.
3.1.5 Growth Mechanism of the Ceria NPs
Based on our experimental findings, we propose the formation mechanism of
ultra-small ceria NPs as follows. The controlled conversion of solvated cerium ions to
ceria NP is mediated by the mild basic environment. Basic reaction condition
instantaneously converts cerium hydroxide to ceria nuclei. The mild reaction condition is
crucial for promoting controlled nucleation. During the growth process, hydroxide ions
are populated to the surface bound cations, providing a unique capping environment.
Such environment restricts grain growth by preventing further diffusion of the constituent
)1(][222 ⋅→ OHOH
)2(2][2 2232 OHCeOOHOCe +→⋅+
)3(21)(2 2322 OOCeaqHCeO +→+ +

23
atoms. The present of large number of surface hydroxyl groups is responsible for superior
aqueous dispersibility of ceria NPs. For biomedical applications, it is highly desirable to
obtain water-dispersible high-quality ceria NPs in their native form. We have tested the
state of NP dispersibility in phosphate buffer saline at physiological pH (pH 7.4) and
found that particles remain well dispersed.
3.2 EN Assisted Synthesis of Ultra-Small Ceria NPs: Investigation On The
Role of EN As capping agent
Water-dispersed particles were used to investigate the UV-visible and auto-
catalytic activity of ceria NPs. The samples were characterized by suing XRD, XPS
techniques to investigate their structural and chemical properties. The precipitate was
recovered by centrifugation and it was washed several times with distilled water. The
particles recovered after washing was used for further characterization. Approximately
100 % conversion was obtained in all the three samples synthesized in EN at RT, in EN
at 180 oC and in EN-W at 180 oC. The crystalline phase of the products was identified by
analyzing the XRD patterns recorded on the powder samples. Proper indexing of the
XRD peaks (Figure 8) reveals the formation of cubic phase CeO2 (JCPDS card number #
34-0394). The possibility of any other crystalline impurity in the ceria NP sample could
be ruled out within the limit of sensitivity of XRD technique as no additional XRD peaks
were found. Broadening of the diffraction patterns indicated the formation of ceria
nanocrystals. Thus, XRD patterns indicated formation of smallest particle at RT and
largest particle at the solvothermal condition in EN-W solvent.

24
Figure 8 XRD patterns of the ceria NPs
Although the XRD studies reveal the formation of small ceria crystallites,
however it is hard to predict whether the product is a polycrystalline precipitate or ultra
fine individual nanocrystals. In order to elucidate the confusion about the morphology,
the sample was further characterized by using HRTEM. Figure 9a depicts one
representative HRTEM image revealing the formation of nearly mono-dispersed, ultra-
fine ceria nanocrystals. The image clearly shows the formation of single crystalline
particles with particle size 2.5 ± 0.2 nm. Formation of the cubic ceria nanocrystals is
further confirmed by the SAED pattern shown in Figure 9b. The bright white rings in the
SAED pattern are indexed to different crystalline planes of cubic ceria. The results are in
good agreement with the XRD pattern. Thus the XRD and HRTEM studies indicated that
20 30 40 50 60
EN-W-180 oC
EN-180 oC
Inten
sity
(arb
. uni
t)
2θ (degree)
(311
)
(111
)
(220
)
EN-RT
(200
)
(222
)

25
ultra-small ceria NPs could be synthesized using EN. Thus, it can be concluded that EN
serves as a capping agent during the growth of ceria crystals. To further study the role of
EN as a capping agent for the growth of ceria NPs, solvothermal syntheses were also
carried out. XRD pattern indicates the formation of relatively larger particles at 180 oC.
Figure 10a shows the HRTEM image of the ceria NPs formed in EN at 180 oC. The
particle size was measured as 8.0 ± 1.5 nm. Higher temperature caused diffusion of more
constituent elements inside the capping sphere, which is responsible for the particle size
growth.
With the use of EN-W as solvent at 180 oC, poly dispersed particles were seen
with size varying from 8-80 nm as shown in TEM image (Figure 10b). It could also be
observed from the TEM image that the particles possessed a well defined cubic shape
when water was introduced. The image in the inset of Figure 10b shows the HRTEM
image of one such ceria cube.
Introduction of water reduced the capping ability of the EN, producing poly-
dispersed particles. This proves that EN served as a capping agent during the growth of
ceria NPs. The ceria NPs produced with EN at different conditions were dispersed in
water under ultrasonic treatment. It was observed that only the particles obtained at RT
were water soluble. Thus, with a view to test the dispersibility of the ultra-small ceria
NPs in solution and determine the particle size in solution, DLS study was performed on
Ceria NPs synthesized at RT, which shows formation of mono-dispersed ceria NPs
(Figure 11) with hydrodynamic diameter 4.8 nm.

26
Figure 9 (a) HRTEM image shows the formation of mono-dispersed ceria ultra-
small ceria NPs. (b) SAED pattern of the NPs indicating the formation of crystalline
ceria NPs

27
Figure 10 (a) HRTEM image of ~ 8 nm ceria NPs synthesized in EN at 180 ºC and (b)
TEM image of the poly-dispersed ceria NPs synthesized in EN-W at 180 ºC. The image
in the inset of part (b) shows the HRTEM of one ceria nano-cube.
28
Figure 11 DLS plot showing the formation of mono-disperse ceria NPs at RT with
hydrodynamic diameter 4.8 nm

29
Since the particles were synthesized in organic EN at RT with no further post heat
treatment, there are possibilities that the EN could form a chelating complex with the cerium ions
or the organic amine molecule could have remained attached to the NPs as surface adsorbed
molecules. The XRD pattern shown in Figure 8 however, ruled out the possibility of any
chelating complex formation between EN and Ce ions. Therefore IR studies were performed to
test the presence of possible surface adsorbed EN molecules on the ceria NPs. Figure 12 shows
the IR spectrum of the powder sample which was compared to that of pure EN. Absence of the
sharp peaks in the 2700-3400 cm-1 region of the IR spectrum for ceria samples indicates the
absence of EN in the sample. The broad hump could be attributed to hydroxyl groups.
Figure 12 IR spectrum of the ceria NPs along with the IR spectrum of the pure
ethylenediamine for comparative study
4000 3000 2000 1000
Ceria nanoparticles
Inten
sity
(arb
. uni
t)
Wavenumber (cm-1 )
Ethylenediamine
30
In recent years, superior antioxidant property of ceria NPs is attributed to their mixed
valence state (Ce3+ and Ce4+). It is highly desirable to fabricate ceria NPs where both the valence
states co-exist. To confirm this we have carried out thorough XPS studies. Figure 13a
demonstrates the survey XPS spectrum of the samples exhibiting the presence of Ce and O as the
elementary components. The area of interest being the valence state of Ce, the high resolution
XPS spectra were recorded in the region of 880-925 eV for all the samples. These high-
resolution XPS spectra were deconvoluted to distinguish the Ce4+ and Ce3+ ionic states. All these
spectra along with their Gaussian fits were displayed in Figures 13b-d. Indexing of the XPS
spectrum reveals the presence of a mixed valence state (Ce3+ and Ce4+). The peak positions and
corresponding indexing were summarized for all the three samples in Table 2. In the figure, vo,
v , uo, and u peaks are attributed to Ce3+; while v, v , v , u, u , and u are the characteristic peaks
of Ce4+. The spectra show that the XPS peaks corresponding to Ce3+ valence state are relatively
stronger at the RT synthesized samples. Whereas, the samples synthesized solvothermally in EN-
W did not have any Ce3+ valence state. This shows that ceria NPs with engineered valence state
could be synthesized using EN assisted chemical synthesis routes. Percentages of the Ce3+ and
Ce4+ valence states could be semi-quantitatively analyzed by using the integrated peak area of
the respective states using the following equation.37
)1(%100]%[//////////
//3 ×+++++
+++=+
uuuvvv
uuvv
AAAAAAAAAA
Ce oo
where Ai, is the area of the “i” peak. The concentration of Ce3+ was calculated as 48.84 and 36.99
% for the ceria NPs synthesized with pure En at RT and 180 oC respectively. Thus the results
indicated that the mixed valence state of the ceria NPs could be tailored by varying the synthesis
temperature. The presence of Ce3+ ions in the ceria nanocrystal lattice is attributed to the oxygen

31
vacancies in the nanocrystals. The extent of the oxygen vacancy could be tailored in the
nanocrystals by manipulating the synthesis conditions. Therefore our studies indicated that the
present RT synthesis technique is robust and capable of producing valence state engineered ultra-
small ceria NPs. Since the IR spectrum of the ceria NPs indicated the presence of hydroxyl
groups, it is interesting to investigate the oxygen peak in the XPS. Figure 13e shows the high
resolution XPS spectrum in the region 520-540 cm-1 showing the details of O1s peak. The peak
clearly shows the presence of a shoulder peak corresponding to the hydroxyl groups. This result
is in agreement with the IR spectra, confirming the presence of surface hydroxyl groups. Stable
colloidal dispersion of these particles in water is perhaps due to these surface hydroxyl groups.

32

33

34
Figure 13 XPS spectra of the ceria NPs: (a) survey scan of the sample synthesized at room-
temperature, (b, c and d) high-resolution plot along with the corresponding Gaussian
fitting plots showing different valence states for Ce. (e) high resolution XPS spectrum in the
region 520-540 cm-1 showing the details of O1s peak.

35
Table 2 XPS binding energies of individual peaks of the Ce (3d) spectrum for different
ceria NPs
CeO2 crystallizes in the fluorite (CaF2) structure, in which Ce4+ cation is surrounded by
eight equivalent O2− ions forming the corner of a cube, with each O2− coordinated to four Ce4+ as
shown schematically in Figure 14. Binary oxide semiconductors are always prone to anion
vacancy. Our strong EN mediated synthesis helps to form oxygen deficit samples at RT where as
high temperature helps to subsidize some of these oxygen vacancies. Due to the oxygen vacancy,
the coordination number of Ce4+ to O2− reduces from eight to seven and introduces Ce3+ ions into
the crystal lattice, as shown in the scheme. Thus despite of having appreciable number of Ce3+
ions in the crystal, the NPs maintain their fluorite (CaF2) structure.
Ce 3d5/2 Ce 3d3/2
vo v v V v uo u u u U
S2 880.68 882.87 885.88 888.56 898.25 899.16 901.1 903.89 906.44 916.81
S3 880.78 882.58 885.14 888.11 898.63 898.97 900.91 903.47 906.65 916.65
S4 - 882.45 - 887.75 898.1 - 900.88 - 906.67 916.67
36
Figure 14 Schematic diagram of the fluorite (CaF2) crystal structure of ceria. Cartoon in
the left shows perfect coordination between Ce4+ and neighboring O2- . The right cartoon
shows the formation of Ce3+ due to the presence of oxygen vacancy.

37
3.2.1 Role of EN as Capping Agent
EN might have played a dual role in the formation of ultra fine ceria NPs. First, being a basic
solution, it triggers controlled oxidation of the cerium nitrate salt to ceria. In addition it acts as a
capping material providing mono-dispersed ultra-fine NPs at RT. The first role of EN acting as a
basic catalyst to produce ceria from the cerium nitrate salt is demonstrated by the following
reaction.
)1()(6)( 23min
233 CeOOHCeOHNOCe eaethylenedi → →⋅
As the nascent ceria nucleation and growth starts, the EN molecules might attach on the cationic
part of the surface atoms through its lone pair of electrons. Being a bi-dentate ligand (a pair of
lone pair electrons associated with each molecule) EN could easily form complex with bivalent
(group II) metal ions 43-49. Since the ionic state of Cerium ion in the starting material is +3, this
might prevent EN molecules to form a chelating complex (XRD, IR and SAED studies proved
that the product was not a complex material but pure ceria), instead it behaved as a capping agent
covering the surface of the nanocrystals. The EN layer surrounding the nanocrystals surface
might prevent further inward diffusion of the constituent elements preventing the grain growth.
These loosely bound EN molecules might have been exchanged by the hydroxyl ions during the
process. As it can be seen that the Ce3+ oxidation state was converted to the Ce4+ at RT without
any additional oxygen re-enforcement, the ceria NPs are expected to be rich in oxygen vacancy.
This is already proved by the appearance of the Ce3+ oxidation state in the XPS spectrum of the
CeO2 crystals.

38
The presence of the mixed valence state indicated that these ultra fine nanocrystals might
have antioxidant property and could used multiple times if it express auto generative recycle
process. To demonstrate the auto-catalytic property of the ceria NPs, we carried out a UV–visible
transmission spectroscopic study in absence and presence of hydrogen peroxide. The
transmittance spectrum of the ceria NPs was recorded by dispersing the ceria NPs in de-ionized
water (Figure 15a). In the next step, 10 µl H2O2 was added to the above solution, stirred for 1
min and the transmission spectrum was recorded again showing a large red shift compared to the
previous spectra of the un-treated ceria NPs. This red-shift in the transmittance spectrum is
attributed to the change in the oxidation state from Ce3+ to Ce4+. The experimental solution
treated with H2O2 was then preserved in the dark for further UV–visible measurements for the
next 10 consecutive days. A gradual blue shift in the spectra was observed over time. This
gradual blue shift (higher energy) reflects the regeneration (Ce4+-Ce3+) of the ceria NPs.
At the end of the 10 days, an additional H2O2 dose was administered to the solution and the
corresponding UV–visible spectrum again exhibited red shift. The red shift of the UV visible
spectrum (towards lower energy state) on exposure to H2O2 followed by a time dependent
recovery toward a higher energy state (subsequent blue shift) indicated towards an auto-
generated catalytic oxidative recovery (Ce3+-Ce4+-Ce3+) cycle. These spectral changes were also
associated with visible color change of the ceria NP solution (Figure 15b). Administration of the
H2O2 induced a change in color from light yellow to dark-reddish brown which faded away with
time. The color again turned dark after the second dose of H2O2 introduced at the 10th day of the
experiment. These color changes are also characteristic of the valence state change of ceria NPs.

39
Figure 15 (a) UV-visible transmittance plots showing the autocatalytic behavior of the ceria
NPs. (b) The digital image of the aqueous solution of the ceria NPs in absence and presence
of hydrogen peroxide reflecting the valence state
40
CHAPTER 4: CONCLUSIONS
In this thesis work, two room temperature synthesis methods, dilute NaOH assisted and EN
assisted, for producing high quality (ultra-small, monodispersed, crystalline and mixed Ce3+ and
Ce4+ valence state), water-dispersible ceria NPs have been described. These methods are simple
(one-pot synthesis), reproducible, cost-effective and can be optimized for large scale production.
Ceria NPs were systematically characterized using different microscopic and spectroscopic
material characterization techniques such as HRTEM, SAED, XPS, XRD, FT-IR, DLS and UV-
Vis. TEM analysis confirmed the particle size of (3±0.5 nm) for NaOH assisted RT synthesis and
(2.5 ± 0.2 nm) for EN assisted chemical route at RT. Studies reveal the formation of single
crystalline ceria NPs with mixed valence state of Ce ions (Ce3+ and Ce4+). The NPs exhibited
autocatalytic behavior as investigated through a H2O2 test coupled with UV-visible transmission
measurements. The role of EN as capping agent for the synthesis of ceria NPs was established by
supporting solvothermal experiments. These studies indicated that the present ceria NPs could be
directly used as an anti-oxidant in various biomedical applications.

41
REFERENCES
1. Feynman, R., “There’s Plenty of room at the bottom,” Engineering and Science
1960, 23, 22-36.
2. Taniguchi, N. In On the Basic Concepts of ‘Nanotechnology’, Proc. Intl Conf.
Prod .Eng. Tokyo, Part II ,Japan Society of Precision Engineering, 1974; 1974.
3. Drexler, K. E., Engines of Creation. Anchor Press: New York, 1986.
4. Kratschmer, W., Lamb, L. D., Fostiropoulos, K., Huffman, D. R., Solid C-60 - A
New Form of Carbon. Nature 1990, 347, (6291), 354-358.
5. Edwards, S., The nanotech pioneers : where are they taking us? . Weinheim :
Wiley-VCH: 2006.
6. Wautelet, M., Phase stability of electronically excited Si nanoparticles. Journal of
Physics-Condensed Matter 2004, 16, (12), L163-L166.
7. Wu, Z. Y.; Bao, Z. X.; Cao, L.; Liu, C. X.; Li, Q. S.; Xie, S. S.; Zou, B. S.,
Electrical properties and phase transition of CoFe2O4 nanocrystals under pressure.
Journal of Applied Physics 2003, 93, (12), 9983-9987.
8. Wilson, M., Kannangara, K., Smith, G., Simmons, M., Raguse, B. ,
Nanotechnology : basic science and emerging technologies. Chapman & Hall/CRC: Boca
Raton, 2002.
9. Gasman, L., Nanotechnology applications and markets Artech House: Boston,
2006.
42
10. Tallury, P.; Payton, K.; Santra, S., Silica-based multimodal/multifunctional
nanoparticles for bioimaging and biosensing applications. Nanomedicine 2008, 3, (4),
579-592.
11. Das, M.; Patil, S.; Bhargava, N.; Kang, J. F.; Riedel, L. M.; Seal, S.; Hickman, J.
J., Auto-catalytic ceria nanoparticles offer neuroprotection to adult rat spinal cord
neurons. Biomaterials 2007, 28, (10), 1918-1925.
12. Kar, S.; Patel, C.; Santra, S., Direct Room Temperature Synthesis of Valence
State Engineered Ultra-Small Ceria Nanoparticles: Investigation on the Role of
Ethylenediamine as a Capping Agent. Journal of Physical Chemistry C 2009, 113, (12),
4862-4867.
13. Perez, J. M.; Asati, A.; Nath, S.; Kaittanis, C., Synthesis of biocompatible
dextran-coated nanoceria with pH-dependent antioxidant properties. Small 2008, 4, (5),
552-556.
14. Silva, G. A., Nanomedicine - Seeing the benefits of ceria. Nature Nanotechnology
2006, 1, (2), 92-94.
15. Tarnuzzer, R. W.; Colon, J.; Patil, S.; Seal, S., Vacancy engineered ceria
nanostructures for protection from radiation-induced cellular damage. Nano Letters 2005,
5, (12), 2573-2577.
16. Evans, C. H., Biochemistry of Lanthanides. Plenum Press: New York 1990.
17. Land, P. L., Defect Equilibra For Extended Point-Defects, With Application to
Nonstoichiometric Ceria. Journal of Physics and Chemistry of Solids 1973, 34, (11),
1839-1845.

43
18. Suzuki, K. T., Electrical conductivity and lattice defects in nanocrystalline
Cerium oxide Thin films. Journal of American Ceramic Society 2001, 84, 2007-2014.
19. Davis, V. T.; Thompson, J. S., Measurement of the electron affinity of cerium.
Physical Review Letters 2002, 88, (7).
20. Herman, G. S., Characterization of surface defects on epitaxial CeO2(001) films.
Surface Science 1999, 437, (1-2), 207-214.
21. Conesa, J. C., Computer Modeling of Surfaces and Defects in Cerium Dioxide.
Surface Science 1995, 339, (3), 337-352.
22. Babu, S.; Velez, A.; Wozniak, K.; Szydlowska, J.; Seal, S., Electron paramagnetic
study on radical scavenging properties of ceria nanoparticles. Chemical Physics Letters
2007, 442, (4-6), 405-408.
23. Dutta, P.; Pal, S.; Seehra, M. S.; Shi, Y.; Eyring, E. M.; Ernst, R. D.,
Concentration of Ce3+ and oxygen vacancies in cerium oxide nanoparticles. Chemistry of
Materials 2006, 18, (21), 5144-5146.
24. Eguchi, K.; Setoguchi, T.; Inoue, T.; Arai, H., Electrical-Properties of Ceria-
Based Oxides and Their Application To Solid Oxide Fuel-Cells. Solid State Ionics 1992,
52, (1-3), 165-172.
25. Feng, X. D.; Sayle, D. C.; Wang, Z. L.; Paras, M. S.; Santora, B.; Sutorik, A. C.;
Sayle, T. X. T.; Yang, Y.; Ding, Y.; Wang, X. D.; Her, Y. S., Converting ceria polyhedral
nanoparticles into single-crystal nanospheres. Science 2006, 312, (5779), 1504-1508.
26. Fu, Q.; Saltsburg, H.; Flytzani-Stephanopoulos, M., Active nonmetallic Au and Pt
species on ceria-based water-gas shift catalysts. Science 2003, 301, (5635), 935-938.
44
27. Hibino, T.; Hashimoto, A.; Inoue, T.; Tokuno, J.; Yoshida, S.; Sano, M., A low-
operating-temperature solid oxide fuel cell in hydrocarbon-air mixtures. Science 2000,
288, (5473), 2031-2033.
28. Izu, N.; Shin, W.; Murayama, N., Fast response of resistive-type oxygen gas
sensors based on nano-sized ceria powder. Sensors and Actuators B-Chemical 2003, 93,
(1-3), 449-453.
29. Kaspar, J.; Fornasiero, P., Nanostructured materials for advanced automotive de-
pollution catalysts. Journal of Solid State Chemistry 2003, 171, (1-2), 19-29.
30. Laberty-Robert, C.; Long, J. W.; Lucas, E. M.; Pettigrew, K. A.; Stroud, R. M.;
Doescher, M. S.; Rolison, D. R., Sol-gel-derived ceria nanoarchitectures: Synthesis,
characterization, and electrical properties. Chemistry of Materials 2006, 18, (1), 50-58.
31. Patil, S.; Kuiry, S. C.; Seal, S.; Vanfleet, R., Synthesis of nanocrystalline ceria
particles for high temperature oxidation resistant coating. Journal of Nanoparticle
Research 2002, 4, (5), 433-438.
32. Wang, Z. L.; Feng, X. D., Polyhedral shapes of CeO2 nanoparticies. Journal of
Physical Chemistry B 2003, 107, (49), 13563-13566.
33. Zhang, F.; Wang, P.; Koberstein, J.; Khalid, S.; Chan, S. W., Cerium oxidation
state in ceria nanoparticles studied with X-ray photoelectron spectroscopy and absorption
near edge spectroscopy. Surface Science 2004, 563, (1-3), 74-82.
34. Chen, J. P.; Patil, S.; Seal, S.; McGinnis, J. F., Rare earth nanoparticles prevent
retinal degeneration induced by intracellular peroxides. Nature Nanotechnology 2006, 1,
(2), 142-150.

45
35. Madler, L.; Stark, W. J.; Pratsinis, S. E., Flame-made ceria nanoparticles. Journal
of Materials Research 2002, 17, (6), 1356-1362.
36. Oh, H.; Kim, S., Synthesis of ceria nanoparticles by flame electrospray pyrolysis.
Journal of Aerosol Science 2007, 38, (12), 1185-1196.
37. Deshpande, S.; Patil, S.; Kuchibhatla, S.; Seal, S., Size dependency variation in
lattice parameter and valency states in nanocrystalline cerium oxide. Applied Physics
Letters 2005, 87, (13).
38. Adschiri, T., Supercritical hydrothermal synthesis of organic-inorganic hybrid
nanoparticles. Chemistry Letters 2007, 36, 1188-1193.
39. Inoue, M.; Kimura, M.; Inui, T., Transparent colloidal solution of 2 nm ceria
particles. Chemical Communications 1999, (11), 957-958.
40. Masui, T.; Fujiwara, K.; Machida, K.; Adachi, G.; Sakata, T.; Mori, H.,
Characterization of Cerium(IV) oxide ultrafine particles prepared using reversed
micelles. Chemistry of Materials 1997, 9, (10), 2197-2204.
41. Wang, H.; Zhu, J. J.; Zhu, J. M.; Liao, X. H.; Xu, S.; Ding, T.; Chen, H. Y.,
Preparation of nanocrystalline ceria particles by sonochemical and microwave assisted
heating methods. Physical Chemistry Chemical Physics 2002, 4, (15), 3794-3799.
42. Yu, T. Y.; Joo, J.; Park, Y. I.; Hyeon, T., Large-scale nonhydrolytic sol-gel
synthesis of uniform-sized ceria nanocrystals with spherical, wire, and tadpole shapes.
Angewandte Chemie-International Edition 2005, 44, (45), 7411-7414.
43. Biswas, S.; Kar, S., Fabrication of ZnS nanoparticles and nanorods with cubic and
hexagonal crystal structures: a simple solvothermal approach. Nanotechnology 2008, 19,
(4).

46
44. Datta, A.; Kar, S.; Ghatak, J.; Chaudhuri, S., Solvothermal synthesis of CdS
nanorods: Role of basic experimental parameters. Journal of Nanoscience and
Nanotechnology 2007, 7, (2), 677-688.
45. Dev, A.; Kar, S.; Chakrabarti, S.; Chaudhuri, S., Optical and field emission
properties of ZnO nanorod arrays synthesized on zinc foils by the solvothermal route.
Nanotechnology 2006, 17, (5), 1533-1540.
46. Kar, S.; Biswas, S., White light emission from surface-oxidized manganese-doped
ZnS nanorods. Journal of Physical Chemistry C 2008, 112, (30), 11144-11149.
47. Kar, S.; Biswas, S.; Chaudhuri, S., Optical and magnetic properties of Mn-
incorporated ZnS nanorods. Synthesis and Reactivity in Inorganic Metal-Organic and
Nano-Metal Chemistry 2006, 36, (2), 193-196.
48. Kar, S.; Chaudhuri, S., Cadmium sulfide one-dimensional nanostructures:
Synthesis, characterization and application. Synthesis and Reactivity in Inorganic Metal-
Organic and Nano-Metal Chemistry 2006, 36, (3), 289-312.
49. Kar, S.; Santra, S.; Heinrich, H., Fabrication of high aspect ratio core-shell CdS-
Mn/ZnS nanowires by a two step solvothermal process. Journal of Physical Chemistry C
2008, 112, (11), 4036-4041.