role of molecular orientations in structural evolution of
TRANSCRIPT

Acknowledgements
i
Role of Molecular Orientations in Structural Evolution of
Organic Molecular Solids – Spectroscopic Studies under
Extreme Conditions
By
NAINI BAJAJ
PHYS01201504010
BHABHA ATOMIC RESEARCH CENTRE, MUMBAI
A thesis submitted to the
Board of Studies in Physical Sciences
In partial fulfilment of requirements
for the Degree of
DOCTOR OF PHILOSOPHY
of
HOMI BHABHA NATIONAL INSTITUTE
February 2019

Acknowledgements
ii

List of Publications arising from the thesis
iii

List of Publications arising from the thesis
iv

List of Publications arising from the thesis
v
STATEMENT BY AUTHOR
This dissertation has been submitted in partial fulfilment of requirements for an advanced
degree at Homi Bhabha National Institute (HBNI) and is deposited in the Library to be made
available to borrowers under rules of the HBNI.
Brief quotations from this dissertation are allowable without special permission, provided that
accurate acknowledgement of source is made. Requests for permission for extended quotation
from or reproduction of this manuscript in whole or in part may be granted by the Competent
Authority of HBNI when in his or her judgment the proposed use of the material is in the
interests of scholarship. In all other instances, however, permission must be obtained from the
author.
NAINI BAJAJ

List of Publications arising from the thesis
vi

List of Publications arising from the thesis
vii
DECLARATION
I, hereby declare that the investigation presented in the thesis has been carried out by me. The
work is original and has not been submitted earlier as a whole or in part for a degree /
diploma at this or any other Institution / University.
NAINI BAJAJ

List of Publications arising from the thesis
viii

List of Publications arising from the thesis
ix
List of Publications arising from the thesis
Journals:
1. “Orientational Adaptations Leading to Plausible Phase transitions in L-Leucine at
Low Temperatures : revealed by Infrared Spectroscopy”, Naini Bajaj, Himal Bhatt,
S.R. Vishwakarma, and M.N. Deo, The Journal of Physical Chemistry B, 2019, 123,
3, 561-570.
2. “Phase transition in metal–organic complex trans-PtCl2(PEt3)2 under pressure:
insights into the molecular and crystal structure”, Naini Bajaj, Himal Bhatt, K. K.
Pandey, H. K. Poswal, A. Arya, P. S. Ghosh, N. Garg, and M. N. Deo,
CrystEngComm, 2018, 20, 3728-3740.
3. “Perceptible isotopic effect in 3D-framework of α-glycine at low temperatures”,
Naini Bajaj, Himal Bhatt, Chitra Murli, S.R. Vishwakarma, R. Chitra, T.R.
Ravindran, and M.N. Deo, Spectrochimica Acta Part A: Molecular and Biomolecular
Spectroscopy,2018, 204, 495–507.
4. “Spectroscopic Studies of Temperature Induced Phase Transitions in Metal-Organic
Complex trans-PtCl2(PEt3)2”, Naini Bajaj, Himal Bhatt, H.K. Poswal, and M.N. Deo
– Under Review.
Conferences:
1. “Phase transition in L-Asparagine Monohydrate at Low Temperatures”, Naini
Bajaj, Himal Bhatt, S.R. Vishwakarma, R. Chitra, and M.N. Deo, 7th International

List of Publications arising from the thesis
x
Conference on Perspective in Vibrational Spectroscopy, November 25-29, 2018,
Mumbai, India.
2. “Distinct High Pressure Behavior of Metal-Organic Platinum(II) Isomers in
PtCl2(PEt3)2”, Naini Bajaj, Himal Bhatt, H.K. Poswal, Nandini Garg, and M.N.
Deo, 7th International Conference on Perspective in Vibrational Spectroscopy,
November 25-29, 2018, Mumbai.
3. “Low temperature IR spectroscopic study of torsional vibrations of taurine”, Naini
Bajaj, Himal Bhatt, S. R. Vishwakarma, Susy Thomas, C. Murli, and M. N. Deo,
AIP Conference Proceedings 1942, 030017 (2018).
4. “High pressure infrared spectroscopy of Pt(II) complex cis-PtCl2(PEt3)2”, Naini
Bajaj, Himal Bhatt, Nandini Garg, and M. N. Deo, AIP Conference Proceedings
1832, 030012 (2017).
5. “Deuterated α-glycine up to 4.2 K – a far IR absorption study”, Naini Bajaj, Himal
Bhatt, S.R. Vishwakarma, R.Chitra, C.Murli, and M.N. Deo, 6th International
Conference on Perspective in Vibrational Spectroscopy, November 5-8, 2016,
Lucknow.
6. “High pressure Raman spectroscopic studies of Pt(II) complex trans- PtCl2(PEt3)2”,
Naini Bajaj, H. K. Poswal, Himal Bhatt, M. N. Deo, and Surinder M. Sharma, AIP
Conference Proceedings 1731, 090031 (2016).
7. “FT-Raman spectroscopy of structural isomers of Pt(II) complex PtCl2(PEt3)2”,
Himal Bhatt, M. N. Deo, S. R. Vishwakarma, Naini Bajaj, and Surinder M.
Sharma, AIP Conference Proceedings 1665, 090045 (2015).
NAINI BAJAJ

List of Publications arising from the thesis
xi
Dedicated to my family

Acknowledgements
xii
Acknowledgements
xiii
ACKNOWLEDGEMENTS
Firstly, I would like to express my sincere gratitude to my supervisor Prof. M.N. Deo for the
continuous support of my Ph.D. study and related research, for his patience, motivation, and
immense knowledge. His guidance helped me in all the time of research and writing of this
thesis. I could not have imagined having a better advisor and mentor for my Ph.D. study. I am
very grateful to my mentor, Dr. Himal Bhatt for enlightening me the first glance of research.
This feat was possible because of the unconditional supported provided by him. Despite his
busy schedules, with positive disposition, he has always made himself available to
discussions and useful suggestions, which provided me an opportunity to learn from his
research expertise. His constant support, guidance, inspiration, motivation has always kept
me going ahead. I owe a lot to him and feel privileged to be associated with a person like him
during my life. I would like to thank the doctoral committee members: Dr. S.M. Sharma, Dr.
N.K. Sahoo, Prof. S. Wategaonkar, Dr. A.K. Arya, Dr. D.K. Aswal, and Dr. Nandini Garg,
for their insightful comments and encouragement, but also for the hard question which
incented me to widen my research from various perspectives. My sincere thanks to Dr. H.K.
Poswal, who introduced me to the field of high pressure Raman spectroscopy and Dr. K.K.
Pandey who introduced me to the high pressure x-ray diffraction technique and its analysis. I
would like to thanks Dr. K.K. Pandey and Dr. V. Shrihari, for collection of the high pressure
x-ray diffraction data at INDUS-2, BL-11, RRCAT, Indore. I would also like to thank Mr.
S.R. Vishwakarma for helping in low temperature IR spectroscopic measurements and
cryogenic section of RRACT, Indore, for providing the cryogens for the low temperature
experiments. I would like to thank Dr. R. Chitra for the amino acids sample and Dr. V.K. Jain
for the platinum complexes. I acknowledge Dr. H.K. Poswal and Dr. C. Murli for helping

Acknowledgements
xiv
with the low temperature Raman data collection. Thanks to Dr. R. Rajul for the useful
discussions on the single crystal x-ray diffraction data analysis.
Special thanks to Dr. Susy Thomas, Dr. D. Lahari, Dr. Sunanda Mam, and Mr.
Naveen Sir for helping me in numerous ways during various stages of my PhD. And a big
thank to Rahul Kumar and Anuj Sharma for the task of doing final formatting of this thesis. I
thank my friend as well as my Roommates, Preeta Kumari and Shruti Pandey, for constant
source of positive energy, providing moral and emotional support and always standing by my
side supporting me during the hardships of life. I will always cherish the warmth shared by
us. Thanks to Debashish Sarkar, for always listening and suggesting me the solutions during
the tough times in Ph.D. I also acknowledge my old pals, Vivek Sharma, Sunita Kalita, Kirti
Bara and Mansi for their well wishes and support. Last but not the least, I would like to thank
my family: my Father, Rajesh Kumar Bajaj, mother, Amita Bajaj and my brother, Abhishek
Bajaj for eternal support and understanding my goals and aspirations.
NAINI BAJAJ

S
xv
SUMMARY
Studies of molecular conformations, distortions in the inter/intra-molecular bonds and
transitions in the crystal structures of organic molecular solids under varying thermodynamic
conditions of temperature and pressure are of current research interest due to their
applications in the fields of biology, pharmaceutical industry, molecular electronics, non-
linear optical materials, ferroelectricity, and crystal engineering. Each molecular moiety can
have a diverse response to the change of thermodynamic parameters which have a profound
effect on its physical, structural, and bonding properties. Further, weakly interacting forces
like hydrogen bonds, which are ubiquitous and are among fundamental non-covalent
interactions, can easily undergo a change under such conditions, thereby influencing the
properties of the material under consideration. The changes in inter-atomic distances, intra-
molecular interactions, non-covalent bond lengths and molecular conformations may result in
new structural assemblies with novel properties. Therefore, one can invoke the “structure-
property” correlations to evaluate the mechanism of structural transformations.
This thesis reports the study of organic and metal-organic complexes under varying
thermodynamic conditions of temperature and pressure. Both the techniques produce
compression of the materials, but the origin of resulting changes may be different, thus
leading to varying effects. Vibrational spectroscopy (IR and Raman) along with
complementary x-ray diffraction technique have been used to probe these systems. While
spectroscopic techniques probe the information on molecular motions, x-ray diffraction has
been used to characterize the crystal structure and associated transitions. Thus, the work
presented in this thesis describes the properties of hydrogen bonds in the simplest as well as
in complex organic molecular solids under varying thermodynamic conditions, where

S
xvi
molecular orientations and conformations play a substantial role to trigger the structural
phase transitions.
The results of the present thesis can be utilized to understand the signatures and
microscopic mechanism of the possible phase transitions upon varying the thermodynamic
conditions and thus the realization of new useful structural motifs and paves the way towards
better understanding of fundamental systems like glycine, framing a general trend of
hydrogen bonding networks in amino acids under varying conditions to harness the properties
of technologically important organic systems, other macro-molecular systems such as
proteins and for their molecular modelling.

Table of contents
xvii
Table of Contents
SUMMARY ............................................................................................................................xv
List of Figures ........................................................................................................................ xxi
List of Tables ...................................................................................................................... xxvii
Chapter 1: Introduction ............................................................................................................ 1
1.1. Introduction to Organic Molecular Solids .................................................................... 1
1.2. Thermodynamics of Phase transitions .......................................................................... 2
1.3. Behavior of Organic Molecular Solids under varying thermodynamic conditions ...... 4
1.4. Motivation and Choice of Systems ............................................................................. 10
1.4.1. Amino Acids................................................................................................ 10
1.4.2. Metal-Organic complex trans-PtCl2(PEt3)2................................................. 13
1.5. Layout of thesis ........................................................................................................... 14
Chapter 2: Experimental Methodologies ............................................................................... 16
2.1. Low temperature ......................................................................................................... 16
2.1.1. Measurement techniques ............................................................................. 16
2.2. High Pressure generation and measurements ............................................................. 23
2.3. Spectroscopic and structural characterization............................................................. 27
2.3.1. Infrared Spectroscopy.................................................................................. 27
2.3.2. Raman Spectroscopy ................................................................................... 34
2.3.3. X-ray diffraction .......................................................................................... 38

Table of contents
xviii
2.4. Upgradation of infrared beamline ............................................................................... 41
Chapter 3: Low Temperature Isotopic Effect in α-glycine ................................................... 43
3.1. Introduction ................................................................................................................. 43
3.2. Literature Survey......................................................................................................... 44
3.3. Experimental methods................................................................................................. 45
3.4. Results and discussion ................................................................................................ 46
3.4.1. Low temperature behavior of gly-h ............................................................. 46
3.4.2. Hydrogen bonding network of gly-h ........................................................... 50
3.4.3. Low temperature behavior of gly-d ............................................................. 54
3.4.4. Isotopic effect on the Hydrogen bonding network ...................................... 57
3.5. Orientational changes in N(H/D)3 torsional modes: ................................................... 60
3.6. Summary ..................................................................................................................... 65
Chapter 4: Low Temperature Phase Transitions in L-Leucine .............................................. 67
4.1. Introduction ................................................................................................................. 67
4.2. Experimental methods................................................................................................. 68
4.3. Results and discussion ................................................................................................ 69
4.3.1. Signatures of possible Phase transitions across 240 K ................................ 72
4.3.2. Hydrogen bonding network in L-Leucine below 240 K ............................. 74
4.3.3. Reorientational changes across 150 K ......................................................... 80
4.4. Summary ..................................................................................................................... 87
Chapter 5: Variable Temperature Studies on Metal-Organic Complex trans-PtCl2(PEt3)2 .. 88

Table of contents
xix
5.1. Introduction ................................................................................................................. 88
5.2. Experimental details.................................................................................................... 90
5.3. Molecular structure of trans-PtCl2(PEt3)2:.................................................................. 91
5.4. Results and discussion ................................................................................................ 93
5.4.1. Spectroscopic characterization at ambient conditions................................. 93
5.4.2. Low temperature Spectroscopic Studies ..................................................... 94
5.4.3. Probing Hydrogen bonds through stretching vibrational modes ............... 102
5.5. Summary ................................................................................................................... 104
Chapter 6: High Pressure Phase Transitions in trans-PtCl2(PEt3)2...................................... 105
6.1. Introduction ............................................................................................................... 105
6.1.1. Importance of high pressure studies in metal-organic coordination
compounds........................................................................................................... 105
6.2. Experimental methods............................................................................................... 107
6.2.1. Single Crystal and Powder X-ray Diffraction studies ............................... 107
6.2.2. Infrared spectroscopic studies ................................................................... 108
6.2.3. Raman spectroscopic studies ..................................................................... 108
6.2.4. First-principles calculations....................................................................... 108
6.3. Results and Discussion ............................................................................................. 109
6.3.1. Structural study at ambient conditions ...................................................... 109
6.3.2. Pressure induced phase transition.............................................................. 113
6.3.3. Molecular arrangement at high pressures .................................................. 125

Table of contents
xx
6.3.4. High pressure behavior of metal-organic complexes ................................ 129
6.4. Summary ................................................................................................................... 130
Chapter 7: Summary and Conclusions................................................................................. 131
7.1. Summary ................................................................................................................... 131
7.2. Conclusions ............................................................................................................... 131
References ............................................................................................................................ 134

List of Figures
xxi
List of Figures
Figure 1.1: Fragments of the crystal structure of the monoclinic (Upper Left) and orthorhombic (Upper Right)
polymorphs of paracetamol. Relative volume changes in the monoclinic (red) and orthorhombic (blue)
polymorphs of paracetamol upon cooling (Lower Left) and with increasing pressure (Lower Right) [5, 6].
(reproduced with permission) ................................................................................................................................................5
Figure 1.2: Linear strain in the low pressure polymorph of sodium oxalate upon cooling (fi l led symbols) and
with increasing pressure (open symbols). The plots a re scaled in such a way that volume changes on cooling
and under pressure are the same [52]. (reproduced with permission)..........................................................................6
Figure 1.3: Comparision of changes in the cell parameter in [Co(NH3)5NO2]Cl2 with increasing pressure (fi l led
symbol) and upon cooling (open symbol). The plot is scaled in such a way that the volume changes under
pressure and on cooling are equal [57]. (reproduced with permission) ........................................................................6
Figure 1.4: Phase diagram of the ice-water system on the logarithmic scale of pressure [56]..................................7
Figure 1.5: Structures of polymorphs of glycine (α, β, γ) upon cooling and on increasing pressures [2, 13, 68, 69,
71-73]. (reproduced with permission) ..................................................................................................................................9
Figure 2.1: Schematic of the continuous flow cryostat set up. Sample is mounted in vacuum on a heat
exchanger in the cryostat, Optical access is through windows. Vapours cool the sample, then travel back from
the concentric ring of the transfer l ine to the flow controller to the gas flow pump, from the gas flow pump to
the flow meter, to the Recovery l ine. ................................................................................................................................ 18
Figure 2.2: Variation of thermal conductivity at low temperatures for commonly used materials [167]. ........... 20
Figure 2.3: Schematic of the Diamond Anvil Cell (DAC). ................................................................................................. 24
Figure 2.4: Schematic of Fourier transform infrared Spectroscopy. ............................................................................ 29
Figure 2.5: Optical Layout of Fourier transform infrared spectrometer (BRUKER VERTEX 80V). ........................... 31
Figure 2.6: (Left) MIR spectra of normal diamond (red spectrum) and Type IIa diamond (blue spectrum)
recorded using Bruker IFS125 instrument. [187] (Right) Schematic diagram of infrared microspectroscopy for
high pressure measurements. ............................................................................................................................................. 33
Figure 2.7: Experimental station of the low temperature set-up coupled to Fourier transform infrared
spectrometer at BL-06, IR beamline, INDUS-1, RRCAT, Indore, India. ......................................................................... 34
Figure 2.8: Schematic diagram of Raman scattering (Left – Stoke Raman inelastic scattering, Middle – Rayleigh
elastic scattering, and Right – Anti-Stokes Raman inelastic scattering). ..................................................................... 35
Figure 2.9: Optical layout of the Triple stage Raman spectrometer. ........................................................................... 37
Figure 2.10: Subtractive mode configuration used in the triple stage Raman spectrometer. ................................. 37

List of Figures
xxii
Figure 2.11: Schematic of low temperature sample stage set-up used with the triple stage Raman
spectrometer. ......................................................................................................................................................................... 38
Figure 2.12: Schematic of IR Beamline, BL-06, at INDUS-1, RRCAT, India. [187]........................................................ 41
Figure 2.13: 100% transmission spectra of the previous ZnSe window (red) and new ZnSe window (blue)........ 42
Figure 3.1: (a) Low temperature spectra of α-glycine in the spectral range 150 – 650 cm-1. Red color plots are at
4 cm-1 resolution using Liquid nitrogen (LN2) and voilet color plots are from the repeat measurements at 2 cm-1
resolution using Liquid Helium (LHe). (b) Frequency versus temperature plot in 150 – 650 cm-1 spectral range.
Red squares represent data at 4 cm-1 resolution and black squares represent repeat measurement data points
at 2 cm-1 resolution. Symbols: τ-torsional, δ-bending, γ-rocking, ω-wagging. ........................................................... 47
Figure 3.2: Low temperature IR spectra of α-glycine from 700 – 3250 cm-1 spectral range at 1 cm-1 resolution
using LHe cryostat. Inset shows splitting of γNH3 and t-CH2 modes marked with asterisk (*). Symbols: δ-
bending, ν- stretching, t- twist, ω- wagging, ds- symmetric deformation, das- asymmetric deformation, γ-
rocking. .................................................................................................................................................................................... 49
Figure 3.3: Frequency versus temperature plots in (a) 690 – 1145 cm-1 (b) 1310 – 1630 cm-1 (c) 2600 – 3175 cm-
1 spectral range for α-glycine, obtained from two different experiments at 1 cm-1 (black fi l led squares) and 2
cm-1 (red open squares) resolutions respectively. * denotes the appearance of new modes. Symbols: δ -
bending, ν- stretching, t- twist, ω- wagging, ds- symmetric deformation, das- asymmetric deformation. ............ 51
Figure 3.4: (Left) gly-h molecules in ac-planes, showing H3---O2, H4---O1 and H5---O1 bonds approximately
along c-, a- and b- axes respectively. The netowrk along b- axes has been elaborately presented in Figure 5.
(Right) Variation of these hydrogen bond distances with temperature. Open and fi l led circles represent data
estimated from two independent measurements. Also shown are the reported H---O distances in l iterature,
with symbols: Black fi l led triangle – ref. [196], indigo cross mark – ref. [69], violet plus mark – ref. [197], olive
star – ref. [129]....................................................................................................................................................................... 53
Figure 3.5: A wire-frame representation of the hydrogen bonded structure of α-glycine. The stronger hydrogen
bonds lie in the ac-plane forming layers. These layers are connected through a weaker N1-H5---O1 hydrogen
bond (dotted lines marked with H5---O1) along the b-axis, in a head to tail configuration forming bilayers. The
adjacent bilayers are held together by the weakest C-H---O hydrogen bonds. At low temperatures, N1-H5---O1
hydrogen bonds depict the maximum strengthening. Refer Figure 4(left) for description of hydrogen bonds in
the ac-plane (shaded sheets) which is normal to the N1-H5---O1 hydrogen bonds. ................................................ 54
Figure 3.6:(a) Low temperature IR spectra of deuterated α-glycine (gly-d) in the spectral range 140 – 675 cm-1.
(b) Frequency versus temperature plots for the corresponding modes. Symbols: τ-torsional, δ-bending, γ-
rocking, ω-wagging................................................................................................................................................................ 55
Figure 3.7: (a) Low temperature IR spectra of gly-d in the 700 – 1750 cm-1 range at 1 cm-1 resolution. * denotes
splitting in t-CD2 mode. (b) Low temperature Raman spectra of gly-d in 200 – 1650 cm-1 spectral range. Inset
(left): variation of low frequency Raman modes (δCCN, τND3, γCOO-) with temperature, and (right): splitting of
t(CD2) below 180 K. (c) Variation of the IR and Raman peak positions of gly-d in the region 700 – 1600 cm-1 with
temperature. .......................................................................................................................................................................... 56
Figure 3.8: (a) Raman and (b) IR spectra of gly-d in the ND and CD stretching regions at a few representative
temperatures. In addition to the stretching modes, combination, overtone and self trapped modes may be

List of Figures
xxiii
expected in this region. Grey highlighted peaks represent ND stretching modes. (c) Frequency versus
temperature plots of ND and CD stretching modes, symbols: filled – IR and open – Raman modes. ................... 59
Figure 3.9: Variation of D3---O2, D4---O1 and D5---O1 bond distances with temperature in gly-d. ...................... 60
Figure 3.10: Structure of gly-d in bc-plane [210, 216]. Highlighted sheets are drawn to show the ac-planes.
Upon lowering the temperature, the two strong N-H---O hydrogen bonds which form a closed ring (inset) of
four molecules in the ac-plane get further stronger to form more compact and tightly held layers. ................... 60
Figure 3.11:Comparison of NH3/ ND3 torsional mode in the IR spectra of (a) gly-h and (b) gly-d at 300 K and 4.2
K. ............................................................................................................................................................................................... 62
Figure 3.12: Temperature variation of the "indicator" band in gly-h (top) and gly-d (bottom). ............................. 64
Figure 4.1:Ambient infrared Spectrum of powder L-Leucine in 30 – 3500 cm-1 spectral range measured using
three different experimental/ instrumental parameters to cover the complete frequency range: Blue - 30-275
cm-1, Red - 120-600 cm-1, Black - 500-3500 cm-1.............................................................................................................. 69
Figure 4.2: Two L-Leucine molecules (Leu-A and Leu-B) in the asymmetric unit along with the notation of
different atoms. ..................................................................................................................................................................... 72
Figure 4.3: (a) Temperature dependent variation of IR peaks in the 115 -600 cm-1 spectral range. The dashed
line shows the evolution of new peaks at low temperature. (b) Frequency versus temperature plot of peak
positions in the 160-550 cm-1 region. The error bars are within the size of the symbols. ....................................... 73
Figure 4.4: (a) Temperature dependent variation of IR spectra in the 650 -1300 cm-1 spectral range. Dashed
lines show the evolution of new peaks at low temperature. (b) Frequency versus temperature plot of peak
positions in the 650-1300 cm-1 region. .............................................................................................................................. 73
Figure 4.5: (a) Temperature dependent variation of IR spectra in the 1280 -1675 cm-1 spectral range. The
dashed line shows the evolution of new peaks at low temperature. (b) Frequency versus temperature plot of
peak positions in the 1300-1630 cm-1 region. .................................................................................................................. 74
Figure 4.6: (a) Temperature dependent variation of IR spectra of L-leucine in the NH and CH stretching region
in the 2000-3300 cm-1 spectral range. The dashed l ine shows the evolution of N-H stretching peaks at low
temperatures. (b) Frequency versus temperature plot of the IR peak positions in the 2565 -3080 cm-1 spectral
range. ....................................................................................................................................................................................... 75
Figure 4.7: Hydrogen bonding in the two L-Leucine molecules (hydrophobic chains have been omitted for
clarity) (a) in the ac-plane: Leu-A molecule having amino group (N1-H2/ H3/ H4) with two hydrogen bonds in
the ac-plane (N1-H4---O3 and N1-H3---O3) along c- and a- axes respectively. Leu-B molecule having amino
group (N2-H15/ H16/ H17) with three hydrogen bonds in the ac-plane (N2-H16---O1, N2-H17---O1 and N2-
H17---O2). (b) Along b-direction: Leu-A and Leu-B molecules with hydrogen bonds N1-H2---O2 and N2-H15---
O4 respectively. (c) Bonding details of the bifurcated hydrogen bond. ...................................................................... 77
Figure 4.8:(a) Temperature dependent variation of IR peak positions in 30-90 cm-1 spectral range. (b)
Frequency versus temperature plot of IR peak at 70 cm-1 wavenumber. ................................................................... 81

List of Figures
xxiv
Figure 4.9: Full width at half maximum (FWHM) of (C3C4) torsion mode, i.e.,τ(C3C4) at 107 cm-1, in the
temperature range 300 – 4.3 K. Inset: Fitted IR spectrum of L-Leucine at 300 K in 80 – 160 cm-1 spectral range.
................................................................................................................................................................................................... 83
Figure 5.1: trans-PtCl2(PEt3)2 molecule with central Platinum atom (Silver), Chlorine atom (green), Carbon atom
(Grey) and Hydrogen atom (white). ................................................................................................................................... 92
Figure 5.2: Schematic of the bonding arrangements in the molecular units of trans-PtCl2(PEt3)2 (distances and
angles not to scale). The white orbitals along x&y axes correspond to dx2
-y2 (empty) and green corresponds to
dxy (fi l led) orbital of Pt. The lone pair of electron from P atom goes to empty dx2
-y2 orbital of Pt (straight arrows)
and the electron from dxy orbital of Pt goes to empty antibonding σ* orbital of P-C (curved arrows). ................ 92
Figure 5.3: (a) FT-Raman and (b)FT-IR spectra of trans-PtCl2(PEt3)2 at ambient conditions. γ – out of plane bend,
δ – in-plane bend, νs– symmetric stretch, νas – asymmetric stretch, ω – wagging, das – asymmetric deformation,
ds – symmetric deformation. ............................................................................................................................................... 94
Figure 5.4: (Left to Right) FT-Raman spectra of trans-PtCl2(PEt3)2 in the region 50-460 cm-1. New peaks emerged
at low temperature have been marked as asterisk (*). .................................................................................................. 95
Figure 5.5: Low temperature spectra of trans-PtCl2(PEt3)2 (a) Raman (spectral range : 5-220 cm-1) and (b) IR
(spectral range : 140-220 cm-1) spectra. ............................................................................................................................ 96
Figure 5.6: (a) Low temperature Raman spectra of trans-PtCl2(PEt3)2 in the 210 – 650 cm-1 region. (b) Variation
of Raman active modes at low temperatures in the 10 – 650 cm-1 spectral range. Dotted vertical l ines are
drawn at 130 and 180 K. Open circles represent new mode emerging at low temperatures. Symbols: δ = in -
plane bending, γ = out-of-plane bending, and ν = stretching vibration....................................................................... 97
Figure 5.7: (a) Low temperature IR spectra of trans-PtCl2(PEt3)2 in the 220 – 650 cm-1 spectral region. Dashed
lines indicate new peaks emerging at low temperatures. (b) Variation of IR peak positions at low temperatures
in the 160 – 640 cm-1 spectral range. Dotted vertical l ines are drawn at 130 and 180 K. Open circles represent
new modes appearing upon cooling. ................................................................................................................................. 98
Figure 5.8:(a) Low temperature IR spectra of trans-PtCl2(PEt3)2 in the 700 – 1070 cm-1 spectral range. Dashed
lines indicate new peaks evolving at low temperatures, Inset: Low temperature Raman spectra in the 1030 –
1070 cm-1 spectral range. (b) Variation of IR peak positions at low temperature in the 670 – 1050 cm-1 spectral
region. Dotted vertical l ines are drawn at 130 and 180 K. Open circles represent new modes emerging at low
temperatures........................................................................................................................................................................ 100
Figure 5.9: (a) Low temperature IR spectra of trans-PtCl2(PEt3)2 in the 1220 – 1480 cm-1 spectral range. Dashed
lines indicate new peaks evolving at low temperatures. Inset: Low temperature Raman spectra of trans-
PtCl2(PEt3)2 in the 1400 – 1500 cm-1 spectral range. (b) Variation of IR peak positions at low temperatures in
the 1250 – 1475 cm-1. Open circles represent new modes evolving at low temperatures. Symbols: ⍵ = wagging,
ds = symmetric deformation, das = asymmetric deformation vibration. .................................................................... 101
Figure 5.10: (a) Low temperature IR spectra of trans-PtCl2(PEt3)2 in the 2850 – 3050 cm-1 spectral range. (b)
Variation of IR modes at low temperature in the 2860 – 2970 cm-1 spectral range. Open circle symbol represent
new mode emerging at low temperatures. Symbols: νs = symmetric stretch, νas = asymmetric stretch. ........... 102

List of Figures
xxv
Figure 5.11: (a) Low temperature Raman spectra of trans-PtCl2(PEt3)2 in the 2850 – 3000 cm-1 spectral region.
(b) Variation of Raman modes in the 2860 – 2990 cm-1 spectral region at low temperature. Open circle symbol
represents new mode emerging upon cooling............................................................................................................... 103
Figure 6.1: Unit cell of trans-PtCl2(PEt3)2, where Et = C2H5. Color: Grey – Pt, Green – Cl, Violet – P, Brown– C,
Pink – H atoms...................................................................................................................................................................... 110
Figure 6.2: Ambient powder XRD pattern of trans-PtCl2(PEt3)2 inside the DAC. Inset shows the picture of 2D
diffraction rings .................................................................................................................................................................... 111
Figure 6.3: High pressure Raman spectra of trans-PtCl2(PEt3)2 in the spectral region 20 – 300 cm-1. On the right
is 100 – 275 cm-1 region shown with 3X magnification and inset shows the FWHM of γ(P -Pt-Cl) mode. *
denotes new peak in the lattice region and denotes new shoulder peak adjacent to δPtCl 2 mode, which
emerge after the phase transition.................................................................................................................................... 115
Figure 6.4: High pressure Raman spectra (y-offset) of trans-PtCl2(PEt3)2 in the spectral range a) 320-470 cm-1;
b) 600-780 cm-1. The new peaks emerged with pressure have been highlighted as guide to the eye. c) Variation
of Raman modes in the spectral range 20-700 cm-1, with pressure........................................................................... 116
Figure 6.5: High pressure IR spectra (y-offset for clarity) of trans-PtCl2(PEt3)2 in the spectral region a) 610-700
cm-1 and b) 700-1100 cm-1. The new peaks emerged with pressure have been marked with asterisk and
highlighted as guide to the eye. ........................................................................................................................................ 117
Figure 6.6: High pressure (a) Raman and (b) infrared spectra of trans-PtCl2(PEt3)2 in mid-IR region. Inset in (b)
shows the peak position of νsCH3 and νsCH2 modes with pressure. The new peaks emerged at high pressure
have been marked with *. Down arrow (↓) denotes C-CH3 rocking mode, which weakens with pressure.
Numbers are pressure values in GPa, rel – pressure release. Spectra have been offset for clarity. .................... 117
Figure 6.7: (a) Variation of IR peak positions with pressure in trans-PtCl2(PEt3)2 in the region (a) 630-1100 cm-1
and (b) 1250-3050 cm-1. Blue open circles represent new peaks emerged across 0.8 GPa................................... 118
Figure 6.8: Variation of Raman mode positions with pressure in trans-PtCl2(PEt3)2 in the spectral range (a) 630-
1120 cm-1 (b) 1410-3100 cm-1. The new peaks emerged during high pressure are shown with blue empty
circles. .................................................................................................................................................................................... 118
Figure 6.9: High pressure powder XRD patterns of trans-PtCl2(PEt3)2. * denotes new peaks emerged in the high
pressure phases. The enlarged views in the inset show (I) the new peak at 0.8 GPa (Phase 2); (II) peaks
belonging to Phase 2 (around 6°) and Phase 3 (around 5°) at 4.7 GPa...................................................................... 120
Figure 6.10: Variation of lattice parameters and with pressure in trans-PtCl2(PEt3)2. The lattice parameters are
fitted with Murnaghan and 3rd order Birch-Murnaghan equation of state in Phase 1 and Phase 2 respectively
using EOS-Fit7 software,[305] the error bars are within the symbols. Inset shows the variation of beta angle
with pressure. ....................................................................................................................................................................... 120
Figure 6.11: Variation of unit cell volume with pressure in trans-PtCl2(PEt3)2 fitted with Murnaghan and 3rd
order Birch-Murnaghan equation of state in Phase 1 and Phase 2 respectively using EOS-Fit7 software[305],
the error bars are within the symbols at all the pressures. ......................................................................................... 121

List of Figures
xxvi
Figure 6.12: Rietveld. refinement of trans-PtCl2(PEt3)2 at 0.8 GPa inside DAC using GSAS-II. Inset: (Left) Enlarged
view of the Rietveld refinement of XRD pattern in the region of appearance of the new peak in Phase 2, (Right)
Typical 2D pattern obtained in the new phase above 0.8 GPa. .................................................................................. 123
Figure 6.13: Principle axes evolution with pressure in trans-PtCl2(PEt3)2 as obtained using the software PASCal
[306]. The axis X3 coincides with the crystallographic b-axis, which shows the least compressibil ity with
pressure ................................................................................................................................................................................. 123
Figure 6.14: Unit cells of Phase 1 (ambient) and Phase 2 (0.8 GPa) in trans-PtCl2(PEt3)2....................................... 124
Figure 6.15: Le Bail refinement of Phase 3 of trans-PtCl2(PEt3)2 at 6.5 GPa. Inset shows the corresponding 2D
pattern. .................................................................................................................................................................................. 125
Figure 6.16: Molecular structure of trans-PtCl2(PEt3)2 (left) ambient Phase 1: P-Pt-P=180° and Cl-Pt-Cl =
180°. (right) at 0.8 GPa in Phase 2. Molecular reorientations result in P-Pt-P=170.58° and Cl-Pt-Cl=176.82°
in Phase 2. (Color, Pt-Silver, Cl-green, Orange–P, Dark grey-C, Light grey-H). ......................................................... 126
Figure 6.17: (left) Hydrogen bonds in the structure of trans-PtCl2(PEt3)2 at high pressures. Atom colours: Grey-
Pt, Green – Cl, Purple – P, Brown – C, Pink – H. H-bonds are shown by green-pink bicolour l ines. The three H-
bonds are: i) intramolecular – Cl1---H-C3, nearly along the b-axis, i i) intermolecular – Cl2---H-C2 nearly in the
bc-plane and ii i) intermolecular – Cl1---H-C5’ which connects two molecules lying in two adjacent bc-planes
forming the three- dimensional network. Numbers are Cl ---H distances in Å. (right) the extended three
dimensional wire-frame structure plotted through slightly ti lted a-axis showing the hydrogen bonded network,
mimicking a possible stair-case type supramolecular assembly. ................................................................................ 128

List of Figures
xxvii
List of Tables
Table 2.1: Boiling temperatures of commonly used cryogenic l iquids at ambient pressure (1 Atm) alongwith
referenc es. .............................................................................................................................................................................. 17
Table 2.2: Emissivity of different materials....................................................................................................................... 23
Table 2.3: Commonly used pressure transmitting media with their hydrostatic and quasi -hydrostatic pressure
values alongwith references. ............................................................................................................................................... 25
Table 3.1: Slope (-d𝛎/dT) of frequency versus temperature plots of IR modes of gly-h. The modes with
maximum or negative values have been highlighted...................................................................................................... 48
Table 3.2: Observed IR and Raman modes of gly-d alongwith the rate of variation of IR modes as a function of
temperature. .......................................................................................................................................................................... 57
Table 3.3: FWHM (in cm-1) of various modes in gly-h and gly-d at 300 K and at 4.2 K.............................................. 62
Table 4.1: IR band positions of L-leucine observed at 300 K and 77 K and the reported vibrationa l assignments
[118, 122, 147, 253-255]. Symbols: τ – torsion, r – rocking, ⍵ – wagging, ν – stretching, δ – deformation, t –
twist, as – asymmetric, s – symmetric. .............................................................................................................................. 70
Table 4.2:Hydrogen bond parameters of Leu-A and Leu-B molecules as obtained from reference [87], along
with the low temperature behavior of N-H stretching modes of both Leucine molecules. .................................... 75
Table 4.3:The fitted parameters a, b, C and Ea from equation (4.2), for the temperature dependence of FWHM
of τ(C3C4) mode in the temperature ranges 300 – 150 K and 150 – 4.3 K. .................................................................. 83
Table 6.1: Crystal structure data and refinement details of single crystal x -ray diffraction of trans-PtCl2(PEt3)2
at ambient conditions. ........................................................................................................................................................ 111
Table 6.2: Experimental (ambient pressure – reported (column 2) and this study (column 3)) atomic
coordinates and lattice parameters of trans-PtCl2(PEt3)2 [P21/n (14) – space group]. The experimentally
obtained structure has been submitted to CCDC (1829359) by including H-atoms refined using the riding
model. To further improve structure with H-atom positions, DFT-GGA calculated (at ambient pressure)
equilibrium atomic positions have also been provided in the last column, obtained by including hydrogen
atoms and optimizing single crystal XRD deduced experimental coordinates, the uncertainty in unit cell volume
is found to be ~ 5%. *Note: In this table, axes transformation of the single crystal structure, which has been
deposited at CCDC after including H-atoms, have been carried out using PCW software for consistency in
lattice parameter convention (a and c) with the reported values [264]. .................................................................. 112
Table 6.3: Projection of the three Principle axes (X1, X2, X3) on crystallographic axes (a, b, c) in trans-
PtCl2(PEt3)2 derived using PASCal software[306] with critical point at 0.85 GPa. .................................................... 121
Table 6.4: Variation of dihedral angles of the ethyl group attached to phosphorous atoms on the two
symmetrically opposite sides of Pt atom in trans-PtCl2(PEt3)2 molecule with pressure. ........................................ 126

List of Figures
xxviii

Introduction
1
Chapter 1: Introduction
1.1. Introduction to Organic Molecular Solids
Organic Molecular Solids are defined as solids which consist of molecules having carbon
atom as an essential elemental species in them. The molecules in organic molecular solids are
held together by multiple weak interaction forces such as Van der Waals interactions,
hydrogen bonding, halogen bonding, dipole-dipole interactions etc. with conformationally
flexible molecular moieties forming the 3-dimensional structure. These solids have several
applications ranging from technology to bio-chemical processes, which make them an
important part of science and technology. Owing to weak interactions and flexible molecular
units of organic molecular solids, their structure is very sensitive to the change in
thermodynamic parameters such as temperature and pressure. These parameters can be used
to tune their molecular units, various interaction forces and crystal structures which can have
a significant effect on its applications. For example, in the biological and biochemical
processes such studies are useful in estimating force-fields and potentials which can be used
to simulate different structures [1, 2]. They are also helpful in understanding the role of
individual molecular orientations/conformations, distortions in the non-covalent interactions
and intermolecular bonds, redistribution of electron density, and to correlate the "structure-
property" relations in the formation of crystal structures. The force field calculations on small
molecular organic systems can be useful in understanding of the macro-molecules such as
biopolymers and proteins [1]. Thus, the understanding of individual molecular entities and
their interactions provide an epitome in exploiting organic molecular crystals with huge
impact on their applications in various fields such as pharmaceutical industry [3-8],
molecular electronics [9-12], molecular recognition, bio-macromolecules [13-15], non-linear
optical materials [16-18], crystal engineering [19], geochemistry [20], cryobiology [5, 21]

Introduction
2
and bio-mimetic systems. The present thesis investigates two classes of organic molecular
solids, viz., amino acids and metal-organic systems.
Conformational flexibility of the molecular units and a network of various kinds of hydrogen
bonds in the complex structures of amino acids make them an interesting as well as
challenging class of organic molecular solids to study under varying thermodynamic
conditions. In these systems, different molecular conformational motions are activated at
different pressure/ temperature ranges and different timescales from seconds to micro-
seconds [22, 23]. The study of such a molecular flexibility can be helpful in understanding
the processes linked to phase transitions, polymerization and protein functionality. Another
category of organic molecular solids include metal-organic complexes, where metals are held
together by organic ligands which act as linkers and form 3-dimensional frameworks with
applications in catalytic processes, crystal engineering, new material synthesis, gas storage
and gas separation due to their porous structures [24-35]. The study of these compounds
under extreme thermodynamic conditions have attained much attention due to the
possibilities of realizing novel phases like supramolecular assembly, polymerization, and
amorphization, which are related to their vibrational, optical and structural properties [36-40].
1.2. Thermodynamics of Phase transitions
Phase transformation is the change of the thermodynamic system from one form to another
by changing any of the thermodynamic parameters such as pressure, temperature etc. They
have been classified into different types depending upon the derivative state of the
thermodynamic parameters, given by Ehrenfest in 1933 [41] and upon the mechanism
followed during the transformation, given by Buerger in 1951 [42]. Depending upon the state
of thermodynamic parameters, it is classified as the first order or second order phase
transition. In the first order phase transitions, the first derivative of Gibb's free energy (G),

Introduction
3
volume, and entropy show discontinuity at the transition point and the complete system
shows a hysteresis loop. In the second order phase transition, the first derivative of Gibb's
free energy, volume and entropy are continuous but the second derivative of Gibb's free
energy shows discontinuous change at the transition point. These are smooth transitions as
there is no time gap and no heat is absorbed or released during this transition. The Gibb's free
energy is given as:
𝐺 = 𝑈 + 𝑃𝑉 − 𝑇𝑆 (1.1)
where, U is the internal energy, P is the pressure, V is the volume, T is the temperature and S
is the entropy of the system. However, the availability of information on the change of
entropy is limited by experimental techniques, therefore approach based on structural
transformations (or mechanism followed during phase transformations) which in turn is based
on the change in symmetry of the structure is considered. Depending upon the mechanism
followed, phase transitions are classified into three categories: reconstructive, displacive, and
order-disorder transitions. In the reconstructive phase transition, breaking and making of
bonds occurs at the transition point which causes a new structure to be formed. This type of
phase transition usually takes place deep inside the earth which causes drastic changes in the
seismic properties of the earth mantle. In displacive transition, no bond breaking is required,
but it involves the distortion in the bonds. The order-disorder phase transitions are further
divided into two types as rotational and substitutional phase transitions. When one molecular
unit rotates with respect to the rest of the molecules to causes phase transition, the process is
called rotational order-disorder transition. When interchanging the positions of the atoms in a
random fashion causes phase transition, it is called substitutional order-disorder phase
transition.

Introduction
4
1.3. Behavior of Organic Molecular Solids under varying thermodynamic conditions
Temperature and pressure are the two thermodynamic variables which cause isotropic and
anisotropic deformation in the structure thereby causing deformation in the volume of the
system and consequently change the properties of materials. Thus, variable temperature and
pressure studies are helpful in understanding the structure, polymorphism, relative energies of
different interactions and the behavior of hydrogen bonding network [1]. While, the main
effect of pressure is to cause deformation in the electron cloud of the atoms and alter the
equilibrium distance between the nuclei of the two atoms in a molecule, temperature
primarily causes change in the population of energy levels for each normal mode of vibration.
Therefore, the origin of deformation by both the variables may be different [43-45]. The
deformation in the volume due to these variables is attributed to the anharmonic character of
the potential [1]. The effect of high pressure and low temperature are generally found to be
isotropic in the case of high symmetry systems such as cubic, whereas in the low symmetry
systems such as monoclinic, triclinic etc., the effect may be anisotropic [46-49]. Generally,
maximum and minimum compressions are observed normal and along the molecular layers
respectively, which can be correlated with the anisotropy of structural distortion under
varying thermodynamic conditions of temperature/ pressure [1, 50]. Thus, the emphasis of
research in molecular solids is towards understanding the structural and geometrical response
under different thermodynamic conditions. Also, the structural distortions in such systems
under high pressure and low temperature may be same or different. For example, among the
well-studied organic and metal-organic systems, the polymorphs of paracetamol [5, 51],
sodium oxalate [52] etc. show similar (as shown in Figure 1.1 and Figure 1.2) and Cobalt
(III) nitropentaamminnes [53-55], ice [56] etc. show different (as shown in Figure 1.3 and
Figure 1.4) response under high pressure and low temperature conditions [15, 50, 57].
Paracetamol exists in two polymorphs as paracetamol I (monoclinic) and paracetamol II

Introduction
5
(orthorhombic) as shown in Figure 1.1. The relative change in volume upon cooling and
increasing pressure was found to be similar in both the polymorphs of paracetamol as shown
in Figure 1.1.
Figure 1.1: Fragments of the crystal structure of the monoclinic (Upper Left) and orthorhombic (Upper
Right) polymorphs of paracetamol. Relative volume changes in the monoclinic (red) and orthorhombic
(blue) polymorphs of paracetamol upon cooling (Lower Left) and with increasing pressure (Lower Right)
[5, 6]. (reproduced with permission)
Similarly, the linear strain in low pressure polymorph of sodium oxalate have been found to
be similar upon cooling and compression as shown in Figure 1.2. Cobalt (III)
nitropentaamminnes depicts an example, where pressure and temperature behavior of lattice
parameters are different, as shown in Figure 1.3. Thus, varied high pressure and low
temperature effects are indeed a subject of extensive research for many compounds, even for
the most common molecular system, i.e., water ice, which posseses a range of different

Introduction
6
Figure 1.2: Linear strain in the low pressure polymorph of sodium oxalate upon cooling (filled symbols)
and with increasing pressure (open symbols). The plots are scaled in such a way that volume changes on
cooling and under pressure are the same [52]. (reproduced with permission)
Figure 1.3: Comparision of changes in the cell parameter in [Co(NH3)5NO2]Cl2 with increasing pressure
(filled symbol) and upon cooling (open symbol). The plot is scaled in such a way that the volume changes
under pressure and on cooling are equal [57]. (reproduced with permission)

Introduction
7
phases in the phase diagram (Figure 1.4). While, systematic cooling transforms it to ice Ih
hexagonal phase, depositing vapours at very low temperatures results in cubic ice Ic phase,
whereas high pressure- room temperature phase is cubic ice VII. All the phases are
characterized by peculiar hydrogen bonding arrangements. Thus, the structural distortions,
under varying thermodynamic conditions, can lead to phase transitions in molecular solids,
which may result from drastic or sluggish modifications. In other words, the microscopic
structure and properties of organic and metal-organic complexes can be tuned by varying the
thermodynamic conditions which will have direct implications on their applications.
Figure 1.4: Phase diagram of the ice-water system on the logarithmic scale of pressure [56].
Further, in the hydrogen bonded organic molecular solids, the anisotropy of structural
distortion can also be correlated with the directions of hydrogen bonds [15]. Hydrogen bonds,
in general, are classified into three categories as strong, medium, and weak, depending on the
geometry of the hydrogen bonding network, angle (A-H---B, where A is the donor, B is the
acceptor and H is the hydrogen atom) and enthalpy associated with it. The geometry of
hydrogen bond can be varied by changing the thermodynamic parameters or by changing the

Introduction
8
chemical environment. However, the energy required to manipulate a hydrogen bond is very
small as compared to covalent bonds [58]. The compressibility of hydrogen bonds depends
on several factors such as strength of bonds, packing of molecules and other interactions in
the crystal structure. These studies help us to understand various properties of hydrogen
bonds and estimate its various interaction potentials. Under compression, in addition to
change in inter-atomic separations, a change in the rotation of the molecular units can also
occur, thereby having a complex effect on the hydrogen bonding network, which may also
result in reversible or irreversible phase transitions. The effect of change in hydrogen bonding
arrangement can be studied by probing various bond lengths, dihedral and torsional angles
and also by studying the spectroscopic signatures of the material under respective
thermodynamic conditions. Infact, various correlation plots and equations have been reported
that correlate the pressure/ temperature induced change of the hydrogen bonds with the shift
in the corresponding covalent bond vibrational stretching frequency [59-64]. Many amino
acids have been studied at elevated pressures which result in subtle changes or drastic phase
transitions [65-67]. For example, the simplest amino acid, glycine, crystallizes in three
polymorphs α, β and γ depending on the ability to crystallize in different crystal lattices. The
transformations among the polymorphs of glycine upon cooling and compression have been
summarised in Figure 1.5. Under pressure, in crystalline α-glycine with space group P21/n, no
phase transition has been observed upto 23 GPa with maximum compression is along the
longest N-H---O hydrogen bond and expansion in the direction of shortest N-H---O hydrogen
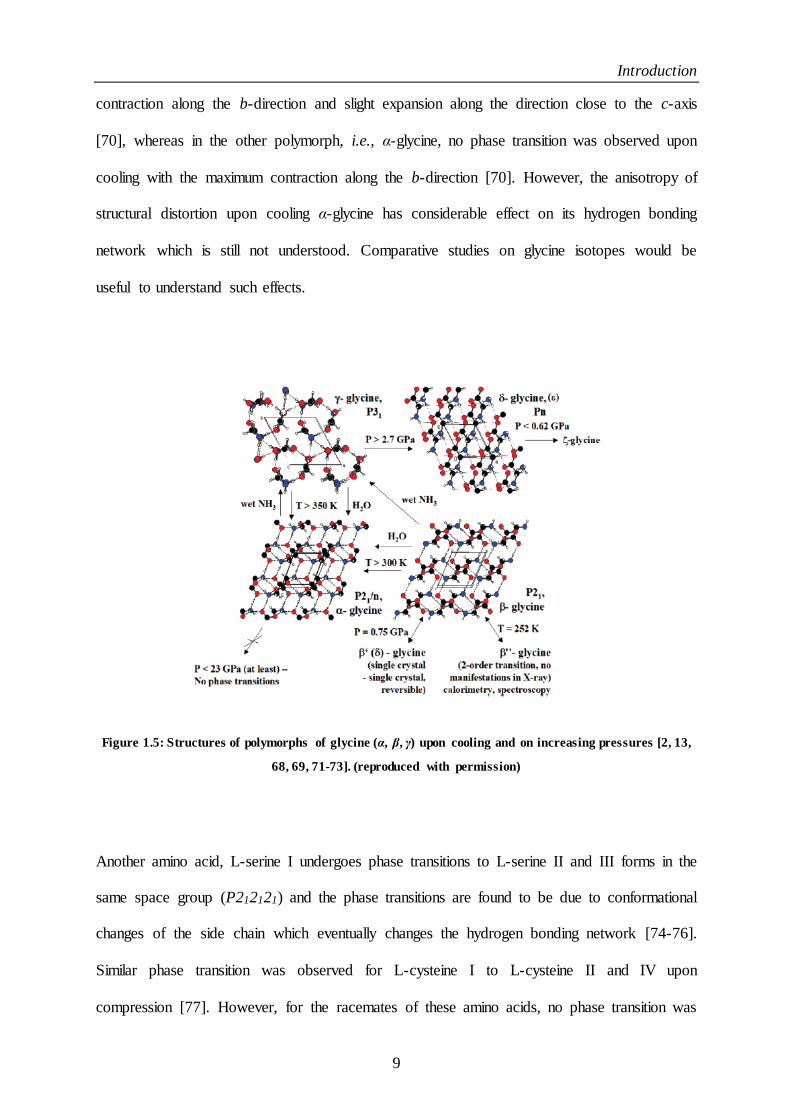
bond [13, 68]. β-glycine with space group P21/a, undergoes phase transition to a new phase
called β’(δ)-phase at only 0.76 GPa [69], whereas γ-glycine with space group P31 undergoes
a phase transition to new ξ-phase with space group Pn above 0.62 GPa [69] and the minimum
compression is along the shortest hydrogen bond [13]. At low temperatures, β-glycine
undergoes second order phase transition upon cooling to 252 K to β” phase, with maximum
Introduction
9
contraction along the b-direction and slight expansion along the direction close to the c-axis
[70], whereas in the other polymorph, i.e., α-glycine, no phase transition was observed upon
cooling with the maximum contraction along the b-direction [70]. However, the anisotropy of
structural distortion upon cooling α-glycine has considerable effect on its hydrogen bonding
network which is still not understood. Comparative studies on glycine isotopes would be
useful to understand such effects.
Figure 1.5: Structures of polymorphs of glycine (α, β, γ) upon cooling and on increasing pressures [2, 13,
68, 69, 71-73]. (reproduced with permission)
Another amino acid, L-serine I undergoes phase transitions to L-serine II and III forms in the
same space group (P212121) and the phase transitions are found to be due to conformational
changes of the side chain which eventually changes the hydrogen bonding network [74-76].
Similar phase transition was observed for L-cysteine I to L-cysteine II and IV upon
compression [77]. However, for the racemates of these amino acids, no phase transition was

Introduction
10
observed for DL-serine under compression even upto 8.6 GPa [74], whereas for DL-cysteine
I, phase transition was observed at very low pressures of 0.1 GPa to DL-cysteine II [78]. The
difference in the behavior of different amino acid polymorphs under compression is due to
varying response of constituent molecular orientations before and after phase transitions.
Among the variable temperature studies, temperature induced phase transitions have been
observed for L-cysteine and DL-cysteine, keeping the symmetry of space group intact [78-
80]. The phase transition in L-cysteine has been depicted by subtle changes in the lattice
parameters around 240 K [81]. Upon further lowering the temperature to 70 K, it showed
ordering of the thiol groups and the changes in the confirmations of the side chains [82, 83].
However, in DL-Cysteine, a phase transition has been observed around 206 K which is
accompanied by the change in the torsional angles and re-arrangement of the hydrogen
bonding network [80]. Similarly, in L-serine and DL-serine, the phase transitions were
observed due to re-orientational changes in the side chain accompanied by the change in the
hydrogen bonding network upon cooling [84, 85]. In yet another amino acid, L-Leucine, the
temperature induced phase transitions are highly debated [86, 87] and contradictory reports
exist on phase transition.
1.4. Motivation and Choice of Systems
In the present thesis, some representative amino acid and metal-organic systems have been
studied, which are described below.
1.4.1. Amino Acids
Amino acids are the basic building blocks of proteins and are responsible for the existence of
life on earth [88-91]. Alterations in vibrational and structural properties of amino acids by
changing thermodynamic conditions is a fascinating field due to its several advantages in
piezoelectricity [92-94], non-linear optics [95, 96], pharmaceuticals [97, 98] etc. The amino

Introduction
11
acids are broadly classified into two types as “essential” and “non-essential”. Non-essential
amino acids are created in the body few examples are glycine, cystiene, serine etc., whereas,
essential amino acids are not created by the body for example Leucine etc. They play an
important role in protein flexibility and bio-macromolecules. The detection of amino acids in
interstellar regions has also generated much interest to understand their properties under
varying conditions so as to obtain crucial information on the origin of life [99-106]. The
crystal structures of amino acids are formed by connecting zwitterions of its molecules in the
head to tail form via hydrogen bonds forming chains, helical or 3-dimensional structures
[107]. The conformational changes of molecular fragments in amino acids can be correlated
with the structural phase transitions [76, 78]. All the amino acids exist as a neutral molecule
in the gaseous state and in the zwitterionic form in the solid and liquid state. In the present
thesis, the isotopes of the simplest amino acid glycine in the solid phase at various low
temperatures down to 4.2 K have been investigated. Another complex amino acid L-Leucine
has also been studied under low temperature in order to understand the role of alterations of
different molecular moieties in stabilizing such systems and also to probe the possible phase
transitions.
a) α-glycine and deuterated α-glycine
Glycine is the simplest and the only achiral amino acid. It is a major component in
macromolecular complexes of living organisms and has important applications in bio-
materials. The search and study of glycine and H2O/ CO2 ices [99, 100, 108-110], is therefore
a prime research area to probe molecular assemblies and trace life in extra-terrestrial regions
where thermodynamic conditions are drastically varied [99-106]. It can serve as an archetype
system where weak interactions play a decisive role for the structure stabilization. The crystal
structure of glycine was first suggested in 1931 in the pioneering works of J. D. Bernal as

Introduction
12
monoclinic with lattice parameters a = 5.04 Å, b = 12.1 Å, c = 5.41 Å and β =111º38’
containing four molecules in a unit cell with P21/n space group [111]. In α-glycine,
zwitterions are linked via hydrogen bonds N-H…O in double anti-parallel layers with Van
der Waal interactions [107]. In the following decades, several studies have been carried out
on glycine polymorphs using theory [112-116], infrared [115, 117-122], Raman [123-126],
nuclear magnetic resonance (NMR) [113, 127, 128] spectroscopy, and powder/single crystal
x-ray/neutron diffraction [13, 69, 107, 129, 130] with improvements in the computational and
experiemental techniques in order to provide finer details on the microscopic properties of its
various ionic forms. Though, it has been studied by various methods for nearly a century
now, systematic variable temperature/ pressure studies have been carried out in the last two
decades only. Further, glycine complexes have been used for ferroelectric and non-linear
applications [43, 131, 132]. The substitution of deuterium in place of hydrogen has vastly
improved the properties of glycine complexes in the field of pyroelectric detectors [133-135],
pharmaceutical industry [136-139] and drug metabolic processes. Due to various
consequences of deuteration, several studies have been carried out to understand the isotopic
effect under varying thermodynamic conditions which help to understand its physico-
chemical behavior for its various applications. Thus, in order to have explicit understanding
of the properties of glycine and its deuterated analogue and the behavior of hydrogen bonding
network, low temperature spectroscopic studies on α-glycine and deuterated α-glycine in a
wide temperature and spectral range have been carried out.
b) L-Leucine
L-Leucine (C6H13NO2) is an “essential” aliphatic amino acid with wide applications in
organic non-linear optical (NLO) materials due to its ultra-fast response time and high optical
damage threshold to laser radiation owing to large electronic delocalization in π–π* orbitals

Introduction
13
[95, 140]. At ambient conditions, it crystallizes in monoclinic structure with P21 space group
having lattice parameters a = 9.61(8) Å, b = 5.31(8) Å, c = 14.72(8) Å and β = 86.2° with
four molecules per unit cell having two different molecules in the asymmetric unit, as
determined by Harding et al. [141], and re-determined with improved precision by Coll et al.
[142] using powder diffraction experiments. This compound has been studied at ambient
conditions by many techniques such as IR/Raman spectroscopy [118, 122, 143-149], x-ray
diffraction [141, 150], neutron diffraction [87], NMR [151, 152], proton magnetic resonance
[153], and matrix isolation infrared spectroscopy [154]. It exists in zwitterionic form in the
solid state. Low temperature studies have also been carried out by different techniques in
order to understand the behavior of temperature induced phase transitions. However, the
previously reported temperature induced phase transitions in Leucine have not been verified
in the later studies. Low temperature spectroscopic studies have been carried out in order to
understand the microscopic details of possible temperature induced transitions by observing
the signatures of conformational flexibility of the molecular moieties and analysing the
anharmonicity associated with the vibrational modes.
1.4.2. Metal-Organic complex trans-PtCl2(PEt3)2
Among the metal-organic complexes, trans-dichloro bis(triethylphosphine) platinum(II)
(formula: trans-PtCl2(PEt3)2) has been investigated at low temperatures as well as under high
pressure to understand and compare the origin of phase transitions. Platinum(II)-organic
complexes have applications in the field of catalysis, organic light emitting diodes (OLEDs),
material synthesis, pharmaceutical industry, crystal engineering and supra-molecular
assemblies [155-163]. These applications have direct correlation with their properties such as
molecular geometry, metal-ligand bonding and stereochemistry. trans-PtCl2(PEt3)2 is a metal-
organic complex with the centre of inversion symmetry at the platinum atom. It exhibits a
square planar structure with bulkier groups (PEt3) placed diagonally opposite to the central Pt

Introduction
14
atom. The studies focussed on the metal – ligand bond, π-back bonding, molecular
reorientations and conditions for structural transitions have drawn interest for exploiting their
technological applications. Thus, detailed investigations have been carried out under variable
pressure/ temperature conditions in this representative Pt(II) based metal organic complex to
study the orientational modifications of molecular moieties and weak interactions like
hydrogen bonds using infrared and Raman spectroscopy well corroborated with x-ray
diffraction studies.
1.5. Layout of thesis
The organization of the thesis is as follows:
Chapter 2 describes the details of the methods, experimental tools and techniques. This
chapter also includes the upgradation of the IR beamline facility at INDUS-1, RRCAT,
Indore, India. The tools used for compression of the materials under consideration include
high pressure and low temperature. The experimental techniques include Fourier transform
infrared (FTIR) spectroscopy, Raman Scattering, and x-ray diffraction. Chapter 3 reports the
observation of a perceptible isotopic effect on the 3-D framework of simplest amino acid, i.e.,
α-glycine at low temperatures down to 4.2 K which have been examined using FTIR
spectroscopy and Raman Scattering [164]. Chapter 4 presents the effect of lowering the
temperature on the complex amino acid, i.e., L-Leucine which has been studied using FTIR
spectroscopy [165]. Here, the understanding of the role of molecular orientations to trigger
the phase transitions has been investigated in L-Leucine. Chapter 5 presents the systematic
temperature dependent study on metal-organic complex, i.e., trans-dichloro
bis(triethylphosphine) platinum(II) (formula: trans-PtCl2(PEt3)2) which has been examined
using infrared and Raman spectroscopic studies. Chapter 6 includes the detailed high
pressure study on trans-dichloro bis(triethylphosphine) platinum(II) using infrared/ Raman

Introduction
15
spectroscopy, x-ray diffraction and density functional theory (DFT) techniques [166]. Finally,
Chapter 7 presents the summary of the thesis.

Experimental Methodologies
16
Chapter 2: Experimental Methodologies
2.1. Low temperature
Low temperature is an important thermodynamic parameter, which generally causes decrease
in the overall volume of the unit cell by reducing the thermal agitations. Cooling of the
sample can be carried out by two methods, i.e., by cooling down the sample to a few Kelvin
of temperature using mechanical refrigerators or by liquefying the gases and use them as a
coolant. The most commonly used cryogenic fluids are Liquid Nitrogen (LN2) and Liquid
Helium (LHe) which can reach temperature of 77 K and 4.2 K respectively. Other rarely used
cryogenic liquids are Liquid Hydrogen (LH), Liquid Neon (LNe), Liquid Oxygen and
Helium-3 (3He). The Liquid Hydrogen can reach temperature of 20.2 K. However, there is a
disadvantage of using it as cryogen as it becomes explosive when mixed with air. Therefore,
special arrangements and precautions are required for its venting system. As Liquid Helium
has lower boiling point than that of Hydrogen, it can be used in the low temperature range.
Helium-3 and Liquid Neon are very expensive, therefore, they are rarely used as cryogens.
Liquid Oxygen is also rarely used as it is an oxidising agent which can cause combustion.
Different gases which are used as cryogens with different boiling temperatures when
liquefied are summarized in Table 2.1. The temperature of any boiling liquid can be changed
by varying the applied pressure. It can be lowered by decreasing the pressure and after a
particular pressure/temperature conditions, freezing point is obtained where the
corresponding gas solidify [167].
2.1.1. Measurement techniques
Cryostat (cryo means ‘cold’ and stat means ‘stable’) is an apparatus which is used to cool the
sample mounted within it. There are different kinds of cryostats being used so far to cool the

Experimental Methodologies
17
Table 2.1: Boiling temperatures of commonly used cryogenic liquids at ambient pressure (1 Atm)
alongwith references.
Cryogenic Liquids Boiling Temperature at Ambient Pressure (1 Atm)
3He 3.195 [168]
4He 4.230 [169]
Hydrogen 20.268 [170]
Nitrogen 77.355 [170, 171]
Neon 27.100 [172]
Oxygen 90.196 [170, 173]
Argon 87.302 [170, 174]
sample. First is the Bath Cryostat, where the sample is directly immersed in the cryogenic
liquid bath and the temperature of the dewar is changed by the pump/pressure technique. By
decreasing the pressure of the dewar, low temperature is obtained at which the liquid boils.
The drawback of this type of cryostat is that there is stratification of temperature in the dewar
with the warmer liquid at the top and colder one at the bottom and we have temperature
control only at the surface. This drawback can be overcome by using resistive heaters at
different vertical positions of the dewar. Another drawback of Bath Cryostat is the use of
glass dewars which could be fragile, therefore, one has to replace it with metal dewars.
Second type of cryostat is the Continuous Flow Cryostat as shown in Figure 2.1. Here, the
sample is cooled by attaching it to the cold finger of the cryostat which is placed in a vacuum
chamber and this technique uses metal dewars. The cryogenic liquid is sucked by the pump
and transferred to the cryostat through transfer line which gets evaporated by the heat
exchanger, and these vapours are used to cool the sample. This type of cryostat is useful in
carrying out precise variable temperature studies.
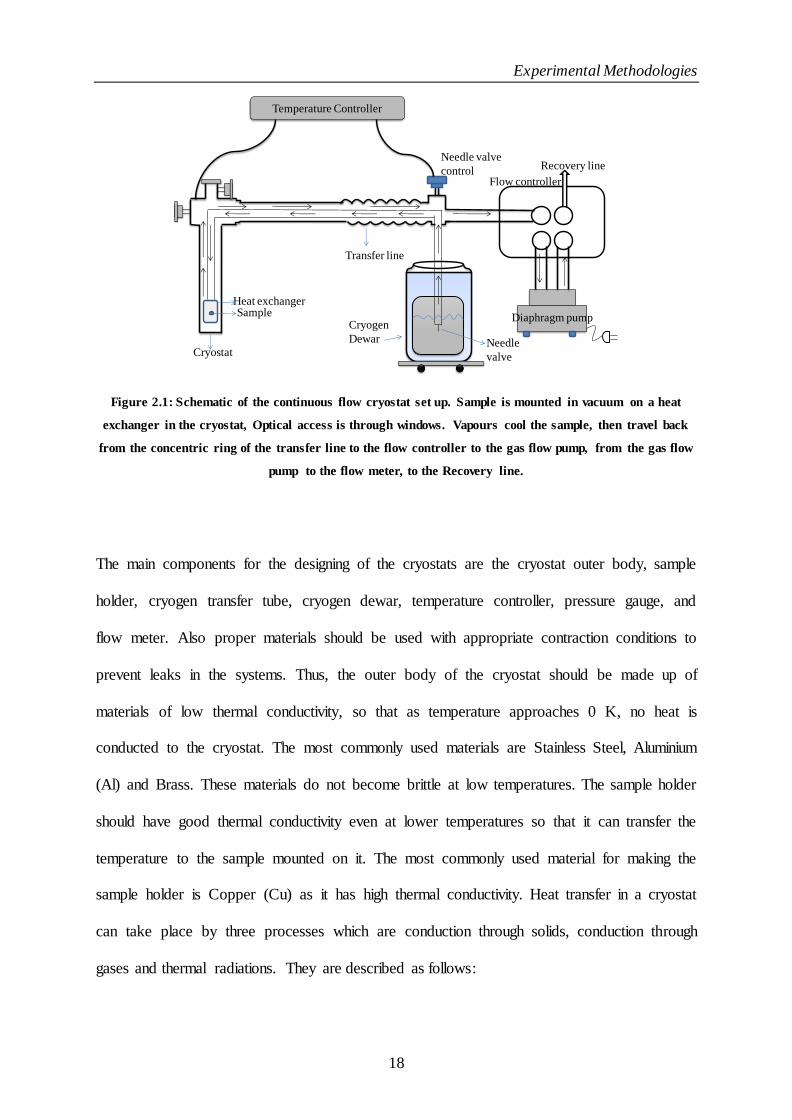
Experimental Methodologies
18
Figure 2.1: Schematic of the continuous flow cryostat set up. Sample is mounted in vacuum on a heat
exchanger in the cryostat, Optical access is through windows. Vapours cool the sample, then travel back
from the concentric ring of the transfer line to the flow controller to the gas flow pump, from the gas flow
pump to the flow meter, to the Recovery line.
The main components for the designing of the cryostats are the cryostat outer body, sample
holder, cryogen transfer tube, cryogen dewar, temperature controller, pressure gauge, and
flow meter. Also proper materials should be used with appropriate contraction conditions to
prevent leaks in the systems. Thus, the outer body of the cryostat should be made up of
materials of low thermal conductivity, so that as temperature approaches 0 K, no heat is
conducted to the cryostat. The most commonly used materials are Stainless Steel, Aluminium
(Al) and Brass. These materials do not become brittle at low temperatures. The sample holder
should have good thermal conductivity even at lower temperatures so that it can transfer the
temperature to the sample mounted on it. The most commonly used material for making the
sample holder is Copper (Cu) as it has high thermal conductivity. Heat transfer in a cryostat
can take place by three processes which are conduction through solids, conduction through
gases and thermal radiations. They are described as follows:
Cryogen
Dewar
Temperature Controller
Cryostat
Transfer line
SampleHeat exchanger
Needle
valve
Diaphragm pump
Recovery lineNeedle valve
controlFlow controller

Experimental Methodologies
19
a. Heat Conduction through Solids:
Heat conduction through solids can be defined in terms of thermal conductivity. The
relationship between heat flux and the temperature gradient is given by the Fourier’s law
[175] as:
𝑞 = − 𝑘(𝑇) ∗ 𝛻𝑇 (2.1)
where, q is the heat flux density, k is the thermal conductivity which is temperature
dependent and 𝛻T is the temperature gradient. In 1-Dimension, equation (2.1) can be written
as:
𝑞 = − 𝑘(𝑇)𝑑𝑇
𝑑𝑥
(2.2)
The cryostat part has uniform cross-sectional area, and then we can integrate equation (2.2)
as:
𝑞 ∫𝑑𝑥
𝐴
𝐿
0
= ∫ 𝑘(𝑇)𝑑𝑇𝑇 ℎ𝑜𝑡
𝑇 𝑐𝑜𝑙𝑑
(2.3)
where, A is the cross-sectional area and ‘T cold’ and ‘T hot’ are the temperatures at
the ends of the element. When the area is constant, equation (2.3) becomes:
𝑞
𝐴=
1
𝐿∫ 𝑘(𝑇)𝑑𝑇
𝑇 ℎ𝑜𝑡
𝑇 𝑐𝑜𝑙𝑑
(2.4)
where, ∫ 𝑘(𝑇)𝑑𝑇𝑇 ℎ𝑜𝑡
𝑇 𝑐𝑜𝑙𝑑 term is defined as thermal conductivity integral, which is an
important property of the solid materials for designing at low temperatures as the response of
the solids at low temperature is different from the room temperature and L is the length of the

Experimental Methodologies
20
element. The variation of thermal conductivity with temperature for different materials is
shown in Figure 2.2. In case of pure metals, the thermal conductivity varies over the entire
temperature range as shown in Figure 2.2. So, in order to determine the exact value of low
temperature thermal conductivity (k) of metals, we can measure low temperature electrical
resistivity (𝜌) from the Wiedemann-Franz law which is given as:
𝑘𝜌 ∝ T and 𝑘𝜌 = LT (2.5)
Where, L is the Lorenz number = 2.44 X 10⁻⁸ WΩK-2. The equation (2.5) also explains the
peak in the case of high purity metals, as the electrical conductivity decrease electron heat
conduction at high temperatures.
Figure 2.2: Variation of thermal conductivity at low temperatures for commonly used materials [167].

Experimental Methodologies
21
b. Heat Conduction through gases:
The heat transfer can take place by the residual gases which depend on the pressure of the
gas. In the high pressure regime, the mean free path is limited by the collision of the gas
molecules with each other and is inversely proportional to the pressure of the gas. The
thermal conduction is, therefore, independent of pressure in this regime. The mean free path
(l) is then given as [167]:
𝑙 = 2.87 𝑋 10−3𝑇 𝑗+1
𝑃
(2.6)
where, l is the mean free path measured in cm, T is the temperature in Kelvin and P is the
pressure in Pascal. The exponent j+1 varies for different cryogens; for helium (the most
commonly used exchange gas), it is 1.147. At very low pressure, the gas moves from hotter
region to colder region without colliding with other molecules. Therefore, thermal conduction
is proportional to the number of molecules present in the system and it varies linearly with
the pressure of the gas. In the normal pressure regime, the heat conduction (Q) between two
plates is given as:
𝑄 = 𝑘𝐴∆𝑇
𝐷
(2.7)
where, 𝑘 is the mean value of the temperature dependent thermal conductivity of the gas
between two boundary temperatures, A is the surface area, D is the separation and ∆𝑇 is the
temperature difference. At low pressure, the heat conduction (Q) between two concentric
cylindrical rings is given as:
𝑄 = 𝑟 𝑎𝑜𝑃𝐴 ∆𝑇 (2.8)

Experimental Methodologies
22
where, 𝑟 is a constant which is different for different gases, P is the pressure of the gas
between two concentric rings, A is the surface area, ∆𝑇 is the temperature difference and 𝑎𝑜
is a dimensionless number given as:
𝑎𝑜 =𝑎1𝑎2
[𝑎2 + (𝐴1
𝐴2) (1 − 𝑎2)𝑎1]
(2.9)
where, 𝑎1, 𝑎2the accommodation coefficients of the inner and outer are surfaces respectively
and 𝐴1, 𝐴2 are the areas of inner and outer surfaces respectively.
c. Radiative Heat transfer:
The Radiative heat transfer (E) from a surface is given by the Stefan-Boltzmann equation as:
𝐸 = 𝜎𝜖𝐴𝑇4 (2.10)
where, σ is the Stephan’s constant (5.67 X 10⁻⁸ Wm-2 K-4), 𝜖 is emissivity, A is the cross-
sectional area, and T is the temperature. Emissivity is a dimensionless number which varies
between 0 and 1 and for a black body 𝜖 is 1. The net heat exchange (ΔE) between the two
surfaces is given as:
∆𝐸 = 𝜎𝜖𝐴(𝑇24 − 𝑇1
4) (2.11)
where, 1 and 2 are the cold and hot surfaces respectively. The emissivity is temperature
and wavelength dependent. The Radiative heat transfer in a cryostat is due to the temperature
difference between various components of the cryostat and the unwanted radiations entering
into it from the surrounding which may cause heating of the sample. This can be reduced by
decreasing the surrounding temperature or by decreasing the surface emissivity. Therefore,
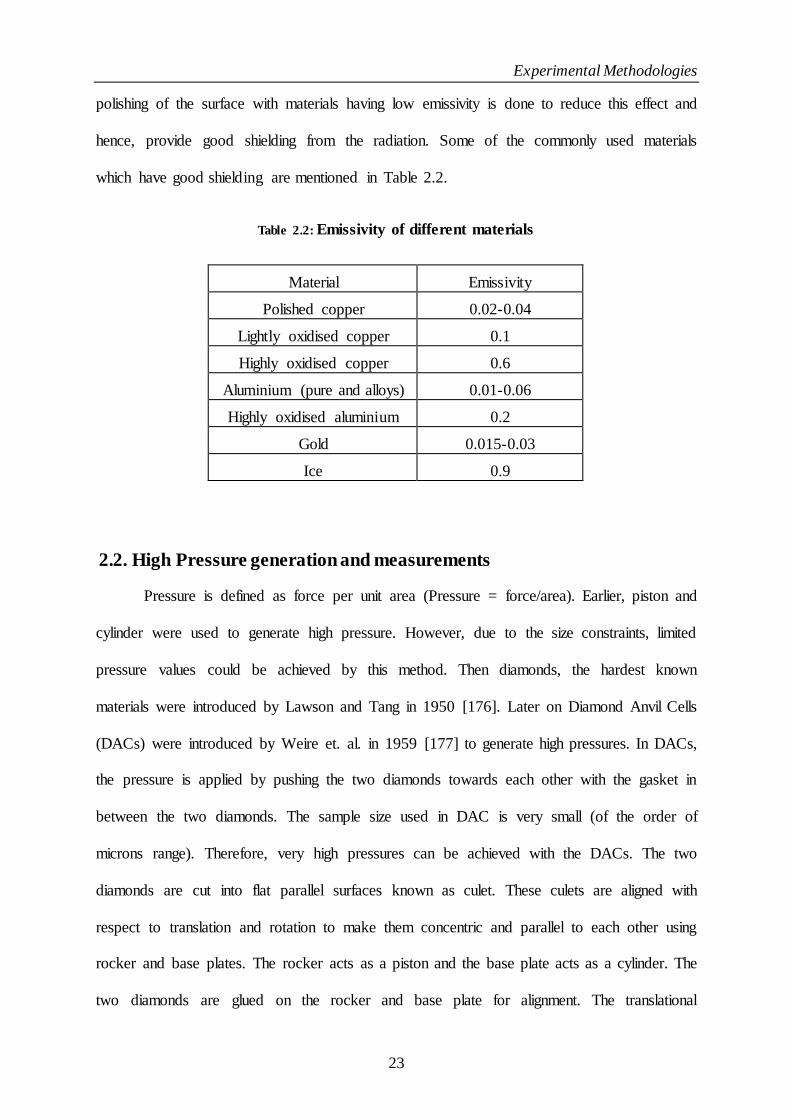
Experimental Methodologies
23
polishing of the surface with materials having low emissivity is done to reduce this effect and
hence, provide good shielding from the radiation. Some of the commonly used materials
which have good shielding are mentioned in Table 2.2.
Table 2.2: Emissivity of different materials
Material Emissivity
Polished copper 0.02-0.04
Lightly oxidised copper 0.1
Highly oxidised copper 0.6
Aluminium (pure and alloys) 0.01-0.06
Highly oxidised aluminium 0.2
Gold 0.015-0.03
Ice 0.9
2.2. High Pressure generation and measurements
Pressure is defined as force per unit area (Pressure = force/area). Earlier, piston and
cylinder were used to generate high pressure. However, due to the size constraints, limited
pressure values could be achieved by this method. Then diamonds, the hardest known
materials were introduced by Lawson and Tang in 1950 [176]. Later on Diamond Anvil Cells
(DACs) were introduced by Weire et. al. in 1959 [177] to generate high pressures. In DACs,
the pressure is applied by pushing the two diamonds towards each other with the gasket in
between the two diamonds. The sample size used in DAC is very small (of the order of
microns range). Therefore, very high pressures can be achieved with the DACs. The two
diamonds are cut into flat parallel surfaces known as culet. These culets are aligned with
respect to translation and rotation to make them concentric and parallel to each other using
rocker and base plates. The rocker acts as a piston and the base plate acts as a cylinder. The
two diamonds are glued on the rocker and base plate for alignment. The translational

Experimental Methodologies
24
alignment is done by matching both the diamond culets laterally by translation along the X-Y
direction. The rotational alignment is done by adjusting the tilt between the two culet faces
and observing the interference fringes between the two non-parallel culet faces. When the
two diamonds become parallel to each other, the interference fringes disappear. The
schematic of the Diamond Anvil Cell along with the gasket is shown in Figure 2.3.
Figure 2.3: Schematic of the Diamond Anvil Cell (DAC).
The choice of the gasket material used and the hole dimensions in the gasket are one of the
important deciding parameters for the highest pressure a DAC can attain. Different materials
which are used as gasket are stainless steel, tungsten, rhenium, and boron epoxy. The initial
thickness of the gasket is chosen nearly ~ 200-300 μm. Then the gasket is pre-indented by
placing it between the two diamonds in the DAC. The thickness of the pre-indented portion is
approximately ~ 100 μm. Then a hole is drilled either by mechanical drilling or by using
spark erosion method. This hole in the gasket is known as sample chamber where a sample
along with pressure marker (to estimate the pressure value) is loaded.
Gasket
Diamond
Sample
RubyPressure Transmitting medium
CuletDiamond Anvil Cell

Experimental Methodologies
25
For high pressure experiments, uniform pressure in the sample chamber is very
crucial. This is done by loading pressure transmitting medium (PTM) (for uniform or
hydrostatic pressure conditions) along with the sample, which do not react or dissolve with
the sample. Most commonly used PTM for high pressure experiments are 4:1
methanol:ethanol mixture and 16:3:1 methanol:ethanol:water mixture. These pressure
transmitting media are hydrostatic upto a certain pressure value known as glass transition
temperature. Beyond this, they become quasi-hydrostatic. Even gases can also be used as
PTM which remain hydrostatic upto very high pressures (~ Mbar range). Special gas loading
systems are required for loading gas in the sample chamber of the DAC. Commonly used
gases are hydrogen, argon, neon and liquid helium. Table 2.3 summarizes different pressure
transmitting media used with their hydrostatic and quasi-hydrostatic pressure values at
ambient temperature.
Table 2.3: Commonly used pressure transmitting media with their hydrostatic and quasi-hydrostatic
pressure values alongwith references.
Medium Freezing
pressure at RT (GPa)
Quasi-hydrostatic
pressure range at RT (GPa)
References
4:1 Methanol:Ethanol 10.4 ~20 [178, 179]
16:3:1
Methanol:Ethanol:Water
14.5 ~20 [180]
Silicone oil 7 ~15 [181, 182]
Hydrogen 5.7 ~60 [183]
Helium 11.8 ~80 [178]
Neon 4.7 ~16 [178]
Nitrogen 2.4 ~30 [184]
For accurate measurement of pressure value, a pressure marker is loaded in the
sample chamber. Commonly used pressure markers are Gold (Au), Silver (Ag), Tungsten

Experimental Methodologies
26
(W), Platinum (Pt) and Copper (Cu), as their unit cell parameters can be obtained with static
pressure conditions. Another commonly used pressure marker is Ruby (Al2O3:Cr3+) which is
based on the laser fluorescence method. When a laser light strikes the ruby crystal, it gets
excited and undergoes a transition to Y and U bands and then they de-excite to the metastable
states (E1/2 and E3/2) through non-radiative process. From the metastable state, they further
de-excite to the ground state which gives two strong luminescence lines as R1 and R2
respectively.
E1/2 →4A2 (R1 line at 6942 Å which is equal to 14402 cm-1)
E3/2 →4A2 (R1 line at 6928.2 Å which is equal to 14432 cm-1)
The shift of these ruby lines with the applied pressure is used to estimate the pressure
value. Even the hydrostaticity of the sample chamber can also be checked by observing the
widths of these ruby lines. For hydrostatic conditions, the (R1-R2) line separation remains
constant. For non-hydrostatic conditions, this distance changes as R1 line shows a prominent
red shift, hence changing the distance between R1 and R2 lines. Also the peaks found to
broaden up in non-hydrostatic conditions. From the pressure induced variation of volume, we
can also calculate Bulk modulus (B) of the material as 𝐵 = −𝑉(𝜕𝑃 𝜕𝑉⁄ ), and its first
derivative is given as 𝐵′ = (𝜕𝐵 𝜕𝑃⁄ ). These zero pressure values (or almost room pressure)
are denoted by 𝐵𝑜 = −𝑉𝑜 (𝜕𝑃 𝜕𝑉⁄ )𝑃=0 and its first derivative is given as𝐵𝑜′ = (𝜕𝐵 𝜕𝑃⁄ )𝑃=0.
The variation of volume with pressure is fitted with Murnaghan equation of state (EOS) [185]
which is given as:
𝑃(𝑉) = 𝐵𝑜
𝐵′[(
𝑉
𝑉𝑜
)−𝐵′
− 1] (2.12)

Experimental Methodologies
27
This equation is used if the compression of the volume under pressure is low. For
higher compression of the material, Birch-Murnaghan EOS is used which introduces a finite
strain which is expanded using Taylor's series. The Birch-Murnaghan EOS of third order
[186] is given as:
𝑃(𝑉) = 3𝐵𝑜
2[(
𝑉𝑜
𝑉)
7
3
− (𝑉𝑜
𝑉)
5
3
]{1 + 3
4(𝐵𝑜
′ − 4) [(𝑉𝑜
𝑉)
2
3
− 1 ]} (2.13)
where, P is the pressure, Vo is the reference volume, V is the deformed volume, Bo is the bulk
modulus, and 𝐵𝑜′ is the first derivative of the bulk modulus with respect to pressure.
2.3. Spectroscopic and structural characterization
2.3.1. Infrared Spectroscopy
For a molecule with ‘N’ number of atoms, a total of ‘3N’ degrees of freedom are
possible. Out of these ‘3N’ vibrations, three correspond to translational motion and three
corresponds to rotational motion. The molecule is then left with ‘(3N-6)’ degrees of freedom
which are known as normal modes of vibration of the molecule. For a linear molecule, there
is no rotation about the bond axis, therefore, the molecule will have ‘(3N-5)’ degrees of
freedom. Under the classical treatment, when electromagnetic radiations interact with the
molecule, then the frequency (ν, in wavenumber, cm-1) of the bond vibration is given by:
ν = 1
2𝜋𝑐 √
𝑘
𝜇(cm−1)
(2.14)
where, k is the spring constant and μ is the reduced mass of the A-B bond system and c is the
velocity of light (3 X 1010 cm/sec). As the vibrational energies are quantised, the energy of a
vibrational state is given as:

Experimental Methodologies
28
𝐸 = (v +1
2) hcν
(2.15)
where, h = 1.054 X 10⁻³⁴ Js, c is the velocity of light, and ν is the wavenumber in cm-1, v is
the vibrational quantum number and under harmonic approximation ∆v = ±1 which is known
as fundamental vibration. For the real systems, harmonic approximation is not applicable
because there are anharmonic contributions to the potential for each vibration. Also, each
vibration is not independent but coupled to other vibrations. Therefore, the selection rule
under anharmonic approximation becomes ∆v = ±1, ±2, ±3.... which also contains overtone
and combination modes of vibrations and the intensities also fall off rapidly.
Infrared (IR) spectroscopy is an absorption technique where infrared radiations
interact with the sample. This technique provides information of the molecular vibrations
associated with the molecule (bending and stretching vibrations). For a molecule to be
infrared active, the necessary condition is the change of dipole moment of the molecule. The
intensity (IIR) of the infrared active mode is then given as:
𝐼𝐼𝑅 ∝ (𝜕𝜇
𝜕𝑅)
2
(2.16)
where, μ is the dipole moment and R is the normal coordinate.
In this thesis, Fourier transform infrared (FTIR) spectroscopy has been used for the
infrared measurements of the sample. The basic principle of FTIR spectroscopy is explained
as follows. The infrared radiation is emitted from a source (Globar) and collimated beam of
this radiation falls on the beamsplitter. It splits the beam into two parts. One is transmitted to
the fixed mirror (M1) and other is reflected to the moving mirror (M2). After getting reflected
back from the respective mirrors (M1 and M2) as shown in Figure 2.4, both the beams

Experimental Methodologies
29
Figure 2.4: Schematic of Fourier transform infrared Spectroscopy.
recombine at the beamsplitter and interfere with each other. Depending upon the path
difference (δ) between the two mirrors from the beamsplitter, constructive or destructive
interference occurs. When M1 and M2 are at equal distance from the beamsplitter or the path
difference is equal to the integral multiple of the wavelength, constructive interference takes
place. If the path difference is half integral multiple of wavelength, destructive interference
takes place. Before reaching the detector, it passes through the sample which absorbs the
radiation. The interferogram, i.e., intensity versus optical path difference is further Fourier
transformed using algorithms to obtain the spectrum, i.e., intensity versus wavenumber. The
equations used for Fourier transformations of the interferogram to spectrum are as follows:
𝐼(𝛿) = ∫ 𝐵(ν)𝑒2𝜋𝑖ν𝛿𝑑ν
+∞
−∞
(2.17)
And its Fourier transform as:
Inte
nsi
ty
Optical Path diff.
Inte
nsi
ty
Wavenumber(cm-1)
Interferogram
Spectrum
Fourier
Transform
Moving Mirror (M2)
Source
Detector
Fixed Mirror (M1)
BeamsplitterSample

Experimental Methodologies
30
𝐵(ν) = ∫ 𝐼(𝛿)𝑒−2𝜋𝑖ν𝛿𝑑𝛿
+∞
−∞
(2.18)
where, 𝐼(𝛿) is the interferogram and 𝐵(ν) is the spectrum.
The main advantages of Fourier transform based infrared spectroscopy compared to grating
based infrared spectroscopy are superior signal to noise ratio, lower acquisition time etc.,
which result from the following advantages:
1. Throughput (also known as Jacquinot Advantage) – all the IR radiation passes through the
sample and falls on the detector.
2. Multiplex (also known as Fellgett Advantage) – all the wavenumbers of the radiation are
detected at once.
3. Conne’s Advantage – wavelength scale is internally calibrated by a He-Ne laser which
provides accurate wavenumber information.
The infrared measurements presented in this thesis have been carried out using Bruker Vertex
80V Fourier transform based infrared (FTIR) spectrometer. The optical layout of the FTIR is
shown in Figure 2.5. The infrared spectrum is divided into three regions, Far-IR (FIR), Mid-
IR (MIR), and Near-IR (NIR). The FIR region spans the spectral range 10-400 cm-1 and is
also known as lattice region which contains molecular information, lattice modes and
hydrogen bond stretching vibrations. The second region is MIR region spanning spectral
range 400-4000 cm-1. The region 400-2000 cm-1 is the fingerprint region which contains
information of various deformation modes of the molecule such as wagging, scissoring,
twisting, torsional, bending and rocking vibrations. The region 2000-4000 cm-1 is a complex
region as it consists of various stretching vibrations along with some overtone and
combination bands. The third region, 4000-14000 cm-1, is NIR. This region consists of

Experimental Methodologies
31
overtone as well as combination modes. The various components of FTIR used are briefly
described below:
1. Source: It is a filament which produces radiation in the infrared region. Different sources
are used in the three IR regions, defined above. Commonly used sources are mercury
(Hg) lamp and globar in the FIR and MIR regions respectively. In the NIR region,
tungsten lamp is used. Synchrotron radiation is another source which spans the wide
spectral region from microwaves to hard x-rays. It is used for infrared measurements
when high Brilliance is required.
2. Beamsplitter: Function of the beamsplitter is to split the beam into two parts, where one
part of the beam is transmitted to the fixed mirror and other part is reflected to the
moving mirror. Again, different regions have different beamsplitters. Commonly used
beamsplitter in the FIR region is Mylar beamsplitter and in the MIR region is KBr
beamsplitter. For the NIR region, CaF2 beamsplitter is used.
Figure 2.5: Optical Layout of Fourier transform infrared spectrometer (BRUKER VERTEX 80V).

Experimental Methodologies
32
3. Detectors: For the FIR region we have two detectors. One is known as Deuterated Tri-
Glycine Sulfate detector (DTGS), which is a room temperature detector and easy to
handle with sensitivity (D* in cm.Hz1/2/W) of the order of ~ 2.7 X 10⁸. Second detector
is the bolometer detector which is liquid helium based and has more sensitivity (of the
order of ~ 1012) to low energy FIR radiation compared to the room temperature DTGS
detector. In the MIR region, we have Mercury Cadmium Telluride (MCT) detector which
is liquid nitrogen cooled with sensitivity of the order of ~ 6.4 X 10¹⁰. In the NIR region,
InSb and Si diode detectors are used.
High Pressure infrared Spectroscopy:
Normal diamonds cannot be used for high pressure infrared measurements as these diamonds
have large absorption in the MIR range. Therefore, special diamonds known as Type IIa
(with no nitrogen impurities) were used for the high pressure infrared studies as they have
clearer spectrum in the MIR region as shown in Figure 2.6 (Left). Infrared microscope uses
special Cassegrain type of reflecting optics to minimize optical aberrations. The microscope
is coupled to the FTIR instrument. The beam from FTIR instrument is focussed onto the
sample through the microscope and then the transmitted beam from the sample is collected by
the condenser and finally sent to the detector. The schematic diagram of infrared
Microspectroscopy is shown in Figure 2.6 (Right). The spatial resolution (R) of the
microscope depends upon two factors. First the incident radiation wavelength and second is
the numerical aperture of the objective and condenser used and is given as:
𝑅 =1.22 𝜆
(𝑁𝐴𝑜𝑏𝑗. + 𝑁𝐴𝑐𝑜𝑛𝑑.) (2.19)

Experimental Methodologies
33
where, NAobj.andNAcond. are the numerical apertures of objective and condenser respectively.
For carrying out high pressure studies in this thesis, 15X objective has been used with 0.4
numerical aperture and working distance of 24 mm between sample and objective.
Figure 2.6: (Left) MIR spectra of normal diamond (red spectrum) and Type IIa diamond (blue spectrum)
recorded using Bruker IFS125 instrument. [187] (Right) Schematic diagram of infrared
microspectroscopy for high pressure measurements.
Low Temperature infrared Spectroscopy:
A continuous flow helium cryostat, Oxford Optistat CF-V was used for in-situ low
temperature investigations. Figure 2.7 shows the low temperature experimental set-up
installed and coupled to FTIR at BL-06, IR beamline, INDUS-1 synchrotron radiation source
at RRCAT, Indore, India. The sample is mounted on the cold finger of the cryostat. The
liquid cryogen is transferred from the cryogen dewar to the cryostat through the transfer line
using oil free diaphragm pump. Temperature is controlled using a PID controller and helium
flow is monitored using a gas flow meter calibrated for helium gas. The cryostat was
mounted in the sample compartment of Bruker Vertex 80V Fourier transform infrared
Adjustable
aperture
Sample visualisation
Schwarzschild
Objectives
X-Y microstages
Adjustable aperture
White light
IR Detector
Synchrotron
Beam
Interferometer

Experimental Methodologies
34
spectrometer. The windows provide the optical access for the sample transmission
measurement. He/N2 vapours travel back from the concentric ring of the transfer line to the
Recovery line via flow controller and gas flow pump. The temperature in this cryostat can be
varied from 4.2 K to 500 K.
Figure 2.7: Experimental station of the low temperature set-up coupled to Fourier transform infrared
spectrometer at BL-06, IR beamline, INDUS-1, RRCAT, Indore, India.
2.3.2. Raman Spectroscopy
When a monochromatic light of frequency ‘ν’ is incident on the sample, it is elastically
scattered by the sample. This is known as Rayleigh scattering. A very small fraction of
photons (1 out of 106) is scattered inelastically which is referred to as Raman scattering.
Therefore, it is a very weak signal. The inelastically scattered photon can have frequency
higher or lower than the incident photon frequency. When the frequency is shifted lower than
the incident frequency, it is known as Stokes shift (downward shift) and when the resulted
FTIR
Liq. He Dewar
Cryostat
Transfer line
Temp. Controller
Flow Controller

Experimental Methodologies
35
frequency is shifted to the high frequency side than the incident frequency, it is known as
anti-stoke shift (upward shift). This shift is shown in Figure 2.8.
Figure 2.8: Schematic diagram of Raman scattering (Left – Stoke Raman inelastic scattering, Middle –
Rayleigh elastic scattering, and Right – Anti-Stokes Raman inelastic scattering).
According to the classical theory of Raman Effect, it occurs when there is a change in
the polarizability of the molecule. When the molecule is placed in the path of the static
electric field, the positive charges move toward the negative pole and the negative charges
move towards the positive pole of the applied electric field. This separation of positive and
negative charges causes induced dipole moment and hence, the molecule becomes polarised.
The induced dipole moment (μ) is given by:
𝜇 = 𝛼𝐸 (2.20)
Vibrational
energy states
Anti-Stokes
Raman inelastic
Scattering
Virtual
energy
states
Rayleigh
elastic
Scattering
Stokes Raman
inelastic
Scattering
v=1
v=0
v=3
v=2
En
erg
y

Experimental Methodologies
36
where, α is the polarizability and E is the applied electric field. The intensity (IRaman) of the
Raman scattered light is proportional to the square of change in the polarizability and to the
fourth power of the frequency of the laser light used, which is given as:
𝐼𝑅𝑎𝑚𝑎𝑛 ∝ (𝜕𝛼
𝜕𝑅)
2
ν4 (2.21)
where, α is the polarizability, R is the normal coordinate and ν is the frequency.
High pressure Raman spectroscopy:
For recording Raman spectra at high pressure, triple stage Raman spectrometer (HORIBA
Jobin Yvon’s T64000) has been used in this thesis. The Raman signal is excited using 532
nm diode pump solid state laser which passes through the confocal microscope and focuses
on the sample loaded in the diamond anvil cell. The optical layout of the Triple stage Raman
spectrometer is shown in Figure 2.9. The inelastic scattered radiations from the sample pass
to the double pre-monochromator stage which acts as a tunable filter. The first
monochromator disperses the radiation. The second monochromator which is kept opposite to
that of the first one, i.e., the incidence angle for the second monochromator is identical to the
scattered angle of the first monochromator. Therefore, the second monochromator converge
the radiation and then the converged radiation passes through the third monochromator and is
dispersed again. This mode of collecting the radiation is known as subtractive mode
configuration and is shown in Figure 2.10. The advantage of this configuration is that it can
measure very low frequencies close to the laser wavelength (< 5 cm-1) regardless of which
wavelength of the laser used. The dispersed radiation from the third monochromator is
collected by the liquid nitrogen cooled charge coupled device (CCD) detector.

Experimental Methodologies
37
Figure 2.9: Optical layout of the Triple stage Raman spectrometer.
Figure 2.10: Subtractive mode configuration used in the triple stage Raman spectrometer.
First stage
Lateral entrance
Third stage
Axial exit
Grating 1
Grating 2
Grating 3
λ1λ2
λ2
λ2
λ1
λ1
Entrance slit
Intermediate slit
Intermediate slit
CCD detector

Experimental Methodologies
38
Low temperature Raman spectroscopy:
The Triple stage Raman spectrometer (HORIBA Jobin Yvon’s T64000) fitted with Linkam
stage THMS600 was used for the low temperature Raman measurements. The schematic of
the low temperature sample stage set-up used is shown in Figure 2.11. The Linkam stage is
mounted at the focus point of the confocal microscope of the Raman system. The stage is
connected to the temperature controller which controls the flow rate of the cryogenic liquid
(liquid nitrogen) and measures the temperature at the sample. The sample stage and the top
window of the Linkam stage are purged with the nitrogen gas so as to avoid condensation at
the sample. The nitrogen gas is recycled through the pump and warmed for purging purpose.
Figure 2.11: Schematic of low temperature sample stage set-up used with the triple stage Raman
spectrometer.
2.3.3. X-ray diffraction
X-ray diffraction is a non-destructive technique where the x-ray radiation interacts with the
electron cloud of the atoms. When x-rays hit the crystal, each atom acts as a diffraction

Experimental Methodologies
39
centre. As the x-rays have shorter wavelengths, they are scattered by adjacent atoms and the
scattered x-rays interfere constructively or destructively with each other. When the path
difference between the scatted rays is an integral multiple of wavelength (λ), then diffraction
takes place. The diffraction condition is given by Bragg’s law as:
2𝑑 𝑠𝑖𝑛𝜃 = 𝑛𝜆 (2.22)
where, d is the interplanar distance between the two consecutive planes, θ is the angle of
incidence made with respect to plane and λ is the wavelength of the x-rays used and n is the
order of diffraction. X-ray diffraction from crystalline solids was discovered by Max von
Laue in 1912. A crystal is made up of lattice plus basis, i.e., there is a periodic arrangement
of atoms in the planes and the distance between consecutive planes is defined by parameter d.
The Bragg’s condition given by equation (2.22) can be easily applied to the systems with
high symmetry such as cubic, tetragonal etc. However, this equation becomes complex when
applied to low symmetry systems and does not provide exact information of the intensity
from the electrons in a unit cell. Therefore, we consider reciprocal space which provides
complete information on the orientation of the planes with respect to the axes as well as
interplanar spacing. The diffraction condition in the reciprocal space is given as:
𝐾. 𝐺 = 1
2 G (2.23)
Where, G is the vector in the reciprocal space, 𝐺 is the unit vector, and K is the radius of the
sphere which intersects with the point in the reciprocal lattice for diffraction condition to be
satisfied. This sphere is known as Ewald sphere. The diffraction equation (2.22) can be used
under two different variant forms. First is the Angle Dispersive X-Ray Diffraction (ADXRD).
Here, the wavelength (λ) is fixed using a monochromator, d is unknown and angle (θ) is

Experimental Methodologies
40
scanned. So, for a particular angle, as λ is known, d can be calculated. Second variant is the
Energy Dispersive X-Ray Diffraction (EDXRD). Here, we have variable λ, d is unknown and
angle (θ) is fixed. The structural characterization of the samples in this thesis has been carried
out using the ADXRD mode.
High pressure x-ray diffract ion:
Laboratory x-ray sources have two major limitations. Firstly, they have x-ray radiation
dominated by the characteristics of the anode being used. Secondly, the flux is limited which
further reduces when needed to focus on the small same size in DAC (in microns range). The
synchrotron radiation source overcomes these limitations and provides additional advantages
such as naturally collimated beam.
When the charged particles are relativistically accelerated in a radial direction
(acceleration is perpendicular to velocity), the electromagnetic radiation emitted in the
tangential direction is known as Synchrotron Radiation. The properties of synchrotron
radiation which are useful in the high pressure experiments are as follows:
1. Broad spectrum – any wavelength can be used for the experiments by the user.
2. High flux – atoms with weak scattering such as organic materials can also be
measured.
3. Highly collimated beam – it can be easily focused on the small sample size for
example the sample chamber of DAC which is in microns range.
The high pressure x-ray diffraction measurements in this thesis were carried out at the Indus-
2 Synchrotron radiation source at BL-11, ECXRD beamline, RRCAT, Indore, India.

Experimental Methodologies
41
2.4. Upgradation of infrared beamline
In addition to the research works, I was also involved in the development works
related to the upgradation of the infrared beamline at the Indus-1 synchrotron radiation source
in India. The infrared radiation from the synchrotron source can be used to carry out
spectroscopic studies. The advantage of using synchrotron source over laboratory source is
high brilliance and naturally collimated beam. The schematic of the IR Beamline, BL-06, at
INDUS-1 is shown in Figure 2.12.
The infrared radiation is reflected to mirror M1 (Gold coated) after which the beam
collimation is carried out in the vertical direction. After mirror M1, a pair of ZnSe windows
are used to separate the storage ring UHV with the high vacuum in the beamline.
Figure 2.12: Schematic of IR Beamline, BL-06, at INDUS-1, RRCAT, India. [187]

Experimental Methodologies
42
In order to enhance the optical transmittance, laser grade ZnSe windows had been
installed in the beamline. However, such windows are generally optimized for a single
wavelength, which was 10 micron in the present case, and thus result in a drop in signal
transmittance at some other wavelengths. I was involved in the installation of new broad band
coated ZnSe windows, which provide more than 90% transmission in the complete mid-IR
range, i.e., 600-5000 cm-1. The 100% transmission lines obtained from previous ZnSe
windows has been shown in Figure 2.13 (red spectrum) which have good signal to noise ratio
only in some intermediate regions. With the new windows, the signal to noise ratio shows an
increase in the complete mid-IR region, as shown by the blue plot in Figure 2.13.
Figure 2.13: 100% transmission spectra of the previous ZnSe window (red) and new ZnSe window (blue).

Low Temperature Isotopic Effect in α-glycine
43
Chapter 3: Low Temperature Isotopic Effect in α-glycine
3.1. Introduction
Glycine, the simplest and the only achiral amino acid, crystallizes in three polymorphic forms
in the solid state [13, 107, 129]. With important applications in bio-materials and being the
major constituent of macromolecular complexes, it can serves as an archetype system where
weak interactions play a decisive role in structural stability. The substitution of deuterium for
hydrogen has helped in improving the properties of glycine complexes in the applied fields of
pyroelectric detectors [133-135], and drug metabolism in pharmacology [138, 139, 188, 189]
and in basic understanding of molecular structure and vibrational frequencies [123, 124, 190-
194]. However, considering the varied consequences of deuteration, comparative studies on
isotopic effect under varying thermodynamic conditions require attention. An understanding
of the molecular structure and structural response under such conditions would be helpful in
predicting the physico-chemical behavior of such compounds for various applications, for
example crystal engineering, lyophilisation or freeze drying of biological drugs, and
pyroelectric/ non-linear properties.
At ambient conditions, the α-glycine zwitterions form head to tail linked double layers
lying perpendicular to the b-axis with a weak N-H---O intra- double layer and very weak C-
H---O inter- double layer hydrogen bonds with strong hydrogen bonded rings of glycine
molecules in the ac-plane with monoclinic structure and P21/n space group [107]. For
external tuning of this network, high pressure provides an effective method for significant
alterations of interatomic distances, whereas low temperature studies probe subtle details
under homogeneous contraction (far less than the compression technique), by reducing
thermal agitations, therefore providing valuable information on structural stability and the

Low Temperature Isotopic Effect in α-glycine
44
possible reaction pathways. Though both techniques are expected to reduce the volume, the
resulting molecular reorientations may sometimes lead to varying effects [43, 44].
3.2. Literature Survey
In the condensed phase, α-glycine exists in zwitterionic form (NH3+CH2COO-) in
contrast to the neutral (NH2CH2COOH) gas form [195]. In 1980 and 2000, electron density
studies were reported on α-glycine (zwitterionic) at 120 K [196] and at 23 K [197]
respectively, which provided the N---O distances of hydrogen bonds. Subsequently, in 2003,
low temperature single crystal x-ray diffraction studies of all the polymorphs ascertained the
absence of polymorphic transformations and provided evidences of N---O distance shortening
implying strengthening of N-H---O hydrogen bonds [70]. The values of H---O distances are
however at variance in various papers at ambient conditions, which were also provided at 120
K by Legros et al. [196]. It is worth noting that, spectroscopy has emerged as a powerful tool
to understand the protonic motions in organic molecular solids and can provide
complimentary information to the structural studies at varying thermodynamic conditions
[106, 198-201]. Several correlation plots between covalent bond stretching frequencies and
the corresponding hydrogen bonded lengths deduced from several compounds for various
kinds of hydrogen bonds have been provide in the literature [59-64].
The first systematic variable temperature Raman study of α-glycine in the temperature
range 83 – 360 K were reported in 2005, which showed splitting of NH3 torsional and CO2
rocking modes [202]. The IR measurements in the range 600 – 7800 cm-1 were reported for
all glycine polymorphs in the temperature range 93 – 433 K by Chernobai et al. in 2007
highlighting different polymorphic behavior [203]. Raman spectroscopy in the low frequency
spectral range (< 200 cm-1) suggested that the changes in the vibrational modes of glycine
polymorphs with the “dynamical transition” and conformational changes observed in

Low Temperature Isotopic Effect in α-glycine
45
biomolecules around 200 – 250 K by monitoring the deviations in anharmonicity [204]. The
dynamical transition phenomenon has also been explored by Bordallo et al. using inelastic
neutron scattering in the temperature range 5 – 300 K focussing on the NH3 reorientational
transitions upon cooling [205]. These authors, in corroboration with NMR reports [127, 128],
described the freezing of NH3 reorientations below 150 K. Such changes may be reflected in
NH3 torsional vibrations, but the only systematic IR study (up to 93 K) carried out so far did
not cover the corresponding spectral range [203], though prior works had noted the
emergence of a shoulder mode upon cooling [206].
Interestingly, in contrast to the hydrogenated glycine (henceforth gly-h), the behavior
of ND3 reorientations in deuterated glycine (gly-d) was found to be different in deuteron
magnetic resonance studies at low temperatures [207]. Unfortunately, low temperature
studies are very limited for gly-d. The reports available in literature describe the low
frequency vibrational mode assignments at 85 K for fully deuterated [208] and in the mid-IR
regions at 18 K for N-deuterated compound [209]. The most recent works on glycine deal
with the high pressure structural properties of gly-d [210], for which no systematic low
temperature study could be found. Thus, to unambiguously establish the differences, if any,
in the properties of glycine and its deuterated analogue, [106, 205, 211-214], detailed low
temperature spectroscopic studies on gly-h and gly-d have been carried out in the widest
temperature (4.2 – 300 K at close steps of ~10 K) and spectral range (140 – 4000 cm-1)
reported so far.
3.3. Experimental methods
Gly-h (with 99.5% purity) and deuterated α-glycine (-d5, i.e., all hydrogen atoms replaced
with deuterium) of aldrich with 98 atom % D (D isotopic purity) were used for the low
temperature IR and Raman studies. All the IR measurements were carried out in the

Low Temperature Isotopic Effect in α-glycine
46
experimental station of the IR beamline installed at Indus-1 in India using continous flow
liquid Helium (LHe) cryostat, Oxford Optistat CF-V in the transmission mode from 300 K to
4.2 K. Temperature was controlled using PID controller and helium flow was controlled
using a gas flow meter calibrated for helium gas. The cryostat was mounted in the sample
compartment of Bruker Vertex 80V FTIR spectrometer. For the MIR-region (400– 4000 cm-
1), the spectra were recorded at a resolution of 2 cm-1 using LHe and the repeat measurements
were carried out on freshly prepared pellets at 1 cm-1 spectral resolution using Globar source.
For the FIR region (140 – 700 cm-1) with Mercury (Hg) lamp as a source, spectra were
recorded at 4 cm-1 resolution using LN2 and the repeat measurements were carried out using
LHe at 2 cm-1 resolution. A total of 100 scans were coadded in all the sample as well as
background measurements. Low temperature Raman measurements were carried out using
micro Raman spectrometer (Renishaw, UK, Model Invia). The spectra were recorded using
514 nm laser excitation. Temperature dependent measurements from 300 K to 80 K were
carried out using a heating and cooling microscope stage (Linkam THMS 600).
3.4. Results and discussion
3.4.1. Low temperature behavior of gly-h
As α-glycine is an extensively studied compound, its vibrational modes as well as ambient
structural parameters are well known, as reported by many techniques such as IR/ Raman
spectroscopy [64, 115, 121-126, 206, 209, 215] and x-ray/ neutron diffraction [107, 111, 129,
130, 216-218] studies respectively. In the present study, we have taken the mode assignments
and hydrogen bond parameters [196] from the published reports, which have also been
verified by the examination of high pressure [15, 21, 68] as well as low temperature [21, 202,
206, 209] [and present work] behaviors of vibrational modes of glycine and its deuterated
analogue in the Raman and infrared spectra.

Low Temperature Isotopic Effect in α-glycine
47
Figure 3.1: (a) Low temperature spectra of α-glycine in the spectral range 150 – 650 cm-1. Red color plots
are at 4 cm-1 resolution using Liquid nitrogen (LN2) and voilet color plots are from the repeat
measurements at 2 cm-1 resolution using Liquid Helium (LHe). (b) Frequency versus temperature plot in
150 – 650 cm-1 spectral range. Red squares represent data at 4 cm-1 resolution and black squares
represent repeat measurement data points at 2 cm-1 resolution. Symbols: τ-torsional, δ-bending, γ-
rocking, ω-wagging.
Figure 3.1(a) shows the far infrared spectra of α-glycine at various temperatures from room
temperature to 4.2 K. Figure 3.1(b) and Table 3.1 describe the low temperature behavior of
the corrosponding modes. All the modes show a reduction in peak width and stiffening upon
lowering the temperature due to thermal contraction. The distinctly visible feature in this
frequency range is the marked evolution of τ-NH3 (torsional) mode (~523 cm-1) upon cooling,
which is buried inside the broad and stronger γCO2 (rocking) mode (502 cm-1) at room
temperatures, with a consistent rise in relative intensity up to the lowest temperature
measured. The emergence of τ-NH3 mode on cooling accompanied with a remarkably large
rate of stiffening (~ 30 cm-1 shift up to 4.2 K) is a definitive signature of reorientation of
glycine NH3 groups leading to stronger N-H---O hydrogen bonds [70]. A reasonably large
rate of stiffening has also been observed for τ-CO2 (224 cm-1) mode as compared to the other
(a) (b)

Low Temperature Isotopic Effect in α-glycine
48
Table 3.1: Slope (-d��/dT) of frequency versus temperature plots of IR modes of gly-h. The modes with
maximum or negative values have been highlighted.
Modes Assignment(cm-1) (-(d��/dT)) (cm-1/K) of IR modes
Infrared 300 – 210 K 210 – 80 K 80 – 4.2 K
Lattice Mode 167 0.043 0.047 0.024
Lattice mode 189 0.042 0.035 0.017
Lattice Mode 204 0.054 0.061 0.011
τ(COO-) 224 0.083 0.063 0.021
δ(CCN) 359 0.046 0.030 0.015
γ(COO-) 502 0.010 0.024 0.036
τ(𝑁𝐻3+) 523 0.169 0.065 0.047
ω(COO-) 609 0.022 0.023 0
δ (COO-) 697 0.025 0.017 0.008
ν(CC) 893 0.021 0.015 0.005
γ(CH2) 912 0.034 0.032 0.017
νas(CN) 1032 0.007 0.016 0.010
γ(𝑁𝐻3+) 1111 0.033 0.023 0.061
γ(𝑁𝐻3+) 1129 0.034 0.031 0.010
t(CH2) 1310 0.026 0.003 0.008
ω(CH2) 1333 0.011 0.004 0.010
νs(COO-) 1411 0.019 0.017 0.007
δ(CH2) 1444 0.013 0.008 0.004
ds(𝑁𝐻3+) 1504 0.026 0.008 0
ds(𝑁𝐻3+) 1523 0.013 0.019 0
νas(COO-) 1592 0 0 0
das(𝑁𝐻3+) 1610 0.031 0.018 0.005
ν(NH) 2618 -0.025 -0.036 0.004
ν(NH) 2904 -0.021 -0.028 -0.030
νs(CH) 2978 0.002 0 0
νas(CH) 3007 0 0 0
ν(NH) 3168 -0.050 -0.080 -0.022
modes, viz., δCCN (bending, 359 cm-1), γCO2 and ωCO2 (wagging, 609 cm-1). It is
noteworthy that the signatures of dynamical transition, a phenomenon related to sudden
increase in mean square displacement in proteins and amino acids, have been observed at ~
200 – 250 K in glycine using inelastic neutron scattering, which could not be observed using
IR spectroscopy [205]. A finer inspection using the present infrared data obtained at close
temperature steps and broad spectral range is suggestive of a change in the slopes of

Low Temperature Isotopic Effect in α-glycine
49
frequency versus temperature plots across 210 K (Table 3.1). A sudden enhancement in the
relative intensity of τ-NH3 and νNH modes is also found below 210 K. At further lower
temperatures, another change in the slopes of frequency versus temperature plots has been
observed across 80 K. In the mid-infrared region, we observe systematic evolution of a weak
shoulder in the γNH3 (rocking) mode at ~ 1130 cm-1, as shown in Figure 3.2(inset). A very
weak shoulder has also been observed to develop on the high frequency side of the weak t-
CH2 (twist) mode (~ 1313 cm-1) which may be due to inter-molecular couplings resulting in
slight modifications of the weakest C-H---O linkages between glycine bilayers (explained
later). It is to be noted that, we could monitor these fine changes only on increasing the
spectral resolution in order to account for the expected sharpening of the peaks at low
temperatures.
Figure 3.2: Low temperature IR spectra of α-glycine from 700 – 3250 cm-1 spectral range at 1 cm-1
resolution using LHe cryostat. Inset shows splitting of γNH3 and t-CH2 modes marked with asterisk (*).
Symbols: δ- bending, ν- stretching, t- twist, ω- wagging, ds- symmetric deformation, das- asymmetric
deformation, γ-rocking.

Low Temperature Isotopic Effect in α-glycine
50
3.4.2. Hydrogen bonding network of gly-h
The modifications in NH3 reorientations leading to change in hydrogen bonding interactions
at low temperatures are further confirmed from the behavior of N-H stretching vibrational
modes lying in the region 2600 – 3200 cm-1 (Figure 3.2). This region contains the stretching
modes due to NH and CH stretching vibrations, however, the complexity enhances due to the
presence of combination/ overtone modes and the self-trapped solitonic modes [219] which
get stronger at lower temperatures. The three N-H stretching modes at ~ 2618, 2904 and 3168
cm-1 correspond to the three N-H---O hydrogen bonds [59]. The strongest of these hydrogen
bonds (N1-H3---O2 with N---O = 2.770 Å, H---O = 1.788 Å and angle N-H---O = 167.2ᵒ) lies
along the c-axis. The second most strongest hydrogen bond (N1-H4---O1 with N---O = 2.850
Å, H---O = 1.899 Å and angle N-H---O = 170ᵒ) lies in the ac-plane [69]. Together, these two
hydrogen bonds bind glycine molecules in a two dimensional layered structure in the ac-
plane. Two adjacent layers are connected by the third hydrogen bond (N1-H5---O1 ~ along b-
axis with N---O = 3.074 Å, H---O = 2.183 Å and angle N-H---O = 156.4ᵒ) to form bilayers
stacked normal to the b-axis. The bilayers are further held together by the weakest C-H---O
hydrogen bonds [69]. Figure 3.3 shows the variation of N-H and C-H stretching vibrational
modes as a function of temperature. Interestingly, all the three N-H stretching modes show
softening upon cooling, which is an unusual observation during contraction/ compression,
whereas the C-H stretching modes show a small and monotonous stiffening. This clearly
implies the strengthening of all the N-H---O hydrogen bonds at low temperatures, which is
consistent with the previous studies on α- glycine carried out at a few temperatures [203].
The present data also shows that subtle structural reorientations take place across 210 K and
80 K, which result in a stronger hydrogen bonded low temperature structure, as indicated
from the change in the rate of variation of vibrational modes across these temperatures (Table
3.1). Such a red shift in stretching frequencies due to the formation or strengthening of

Low Temperature Isotopic Effect in α-glycine
51
Figure 3.3: Frequency versus temperature plots in (a) 690 – 1145 cm-1 (b) 1310 – 1630 cm-1 (c) 2600 – 3175
cm-1 spectral range for α-glycine, obtained from two different experiments at 1 cm-1 (black filled squares)
and 2 cm-1 (red open squares) resolutions respectively. * denotes the appearance of new modes. Symbols:
δ- bending, ν- stretching, t- twist, ω- wagging, ds- symmetric deformation, das- asymmetric deformation.
hydrogen bonds is an established fact [106, 199]. Change in H---O bond distance can also be
estimated from the measured covalent bond stretching frequency using the well documented
correlation plots and empirical relations, for a range of compounds as well as hydrogen bonds
[59, 61, 63, 64, 220-224]. Though various correlation curves have been reported in the last 80
years, for different donor/ acceptor systems or ionic states, all of them show a similar
qualitative trend upon the change in bond distance. A recently reported empirical relationship
for various molecular systems including glycine by Rozenberg et al. [60, 225, 226], has also
been used here in an attempt to estimate the change in hydrogen bond strength in gly-h:
log(Δν) = – 1.97 – 6.1 log(𝑟) (3.1)
(a) (b) (c)

Low Temperature Isotopic Effect in α-glycine
52
where, Δν is the change in stretching frequency relative to the free molecule (in cm-1) and r is
the H---O distance measured in nm. Figure 3.4(right) shows the estimated H---O bond
distances the three N-H---O hydrogen bonds in glycine. While the absolute values can only
be confirmed using structural techniques, the trend of their variation from room temperature
to 4.2 K reveals that the two strong hydrogen bonds depict small (N1-H3---O2) and almost
negligible (N1-H4---O1) reduction in H---O distances at low temperatures. In comparison,
the moderately strong N1-H5---O1 hydrogen bond shows a drastic reduction in H---O
distance, at a remarkable rate of decrease from ambient to ~ 80 K (0.02Х10 -3 nm/K) followed
by a slightly lesser rate up to 4.2 K and therefore significant strengthening. This also
corroborates with the structural report at room temperature and 23 K (see Figure 3.4right),
predicting a larger reduction of this bridging distance (N1-H5---O1 nearly along the b-axis)
in the weakest of the three N-H---O hydrogen bonds than the strong ones which form closed
rings in the ac-plane [70, 197]. Such a strengthening of the hydrogen bond which acts as a
bridge to form the bilayers, shows a similar qualitative behavior as often observed for
hydrogen bonds (e.g., in ice) under compression. Recently, it has been shown that the hidden
force responsible for the hydrogen bond dynamics under such extreme conditions is the
electrostatic interaction between the lone pair of acceptor atom and the covalently bonded
electronic cloud [109, 110, 227-229].
While the strengthening of hydrogen bond, in general, upon cooling can also be explained
using this model, the isotopic effect (i.e., replacing H by D) may also alter the dynamics,
which has been discussed in the next section. These observations indicate that the difference
between the hydrogen bond strengths, i.e., within the layers in the ac-plane and those
connecting the layers along the b-axis, reduces on cooling. This implies that the bilayers are
more compact/ strongly bound and isolated from one another at low temperatures. The
variation of C-H stretching frequency also indicates that the weak inter-bilayer C-H---O

Low Temperature Isotopic Effect in α-glycine
53
Figure 3.4: (Left) gly-h molecules in ac-planes, showing H3---O2, H4---O1 and H5---O1 bonds
approximately along c-, a- and b- axes respectively. The netowrk along b- axes has been elaborately
presented in Figure 5. (Right) Variation of these hydrogen bond distances with temperature. Open and
filled circles represent data estimated from two independent measurements. Also shown are the reported
H---O distances in literature, with symbols: Black filled triangle – ref. [196], indigo cross mark – ref. [69],
violet plus mark – ref. [197], olive star – ref. [129].
hydrogen bonds may not get much strengthened, even at low temperatures. These changes
depict this compound as a supramolecular assembly of head to tail linked glycine molecules
(through N1-H5---O1 nearly along the b-axis), which are connected to other adjacent
molecules in the ac-plane through N1-H4---O1 and N1-H3---O2 as shown in Figure 3.4(left)
and Figure 3.5. Such an assembly of glycine molecules with infinite spread in the ac-plane
and a finite depth of two molecules are stacked along the b-axis.

Low Temperature Isotopic Effect in α-glycine
54
Figure 3.5: A wire-frame representation of the hydrogen bonded structure of α-glycine. The stronger
hydrogen bonds lie in the ac-plane forming layers. These layers are connected through a weaker N1-H5---
O1 hydrogen bond (dotted lines marked with H5---O1) along the b-axis, in a head to tail configuration
forming bilayers. The adjacent bilayers are held together by the weakest C-H---O hydrogen bonds. At low
temperatures, N1-H5---O1 hydrogen bonds depict the maximum strengthening. Refer Figure 4(left) for
description of hydrogen bonds in the ac-plane (shaded sheets) which is normal to the N1-H5---O1
hydrogen bonds.
3.4.3. Low temperature behavior of gly-d
Figure 3.6(a) and (b) show the far infrared spectra (150 – 675 cm-1) and the temperature
dependence of IR active modes for deuterated α-glycine (gly-d), which clearly demonstrate a
distinct isotopic behavior for this simplest amino acid. Unlike in gly-h where τ-NH3 mode
depicts the maximum shift in frequency as well as increase in intensity, the weak τ-ND3 mode
(expected near 348 cm-1) [217], merged with δCCN mode (331 cm-1) at ambient conditions,
does not show any signs of strengthening at low temperatures. Infact, τ-ND3 is among the
least affected modes and even at 4.2 K, the two peaks are not well resolved making it difficult
to distinguish between them. These two peaks were analysed using Gaussian as well as
Gaussian plus Lorentzian fits. While all the modes, including the lattice modes, show a small,

Low Temperature Isotopic Effect in α-glycine
55
Figure 3.6:(a) Low temperature IR spectra of deuterated α-glycine (gly-d) in the spectral range 140 – 675
cm-1. (b) Frequency versus temperature plots for the corresponding modes. Symbols: τ-torsional, δ-
bending, γ-rocking, ω-wagging.
general stiffening and peak sharpening at low temperatures, a closer inspection reveals slope
change in the frequency versus temperature plots across 180 K, which have been presented in
Table 3.2. The modes observed in the mid infrared spectra show similar changes (Figure
3.7a). We also observe the emergence of a weak shoulder on the higher frequency side of t-
CD2 mode (1015 cm-1) upon cooling (Figure 3.7a), as in gly-h.
In order to verify these observations on τ-ND3 and other modes, we carried out the
complementary Raman spectroscopic studies, which showed similar changes for the Raman
active modes at low temperatures, (as shown in Figure 3.7(b) and Figure 3.7(c)). The
broadening observed in the t-CD2 Raman mode (~ 1020 cm-1) at lower temperatures may be
due to a new mode emerging at this frequency, as also in the IR spectra and in gly-h,
consistent with some inter-molecular couplings due to slight modifications in the C-D---O
(a) (b)

Low Temperature Isotopic Effect in α-glycine
56
Figure 3.7: (a) Low temperature IR spectra of gly-d in the 700 – 1750 cm-1 range at 1 cm-1 resolution. *
denotes splitting in t-CD2 mode. (b) Low temperature Raman spectra of gly-d in 200 – 1650 cm-1 spectral
range. Inset (left): variation of low frequency Raman modes (δCCN, τND3, γCOO-) with temperature, and
(right): splitting of t(CD2) below 180 K. (c) Variation of the IR and Raman peak positions of gly-d in the
region 700 – 1600 cm-1 with temperature.
(c)
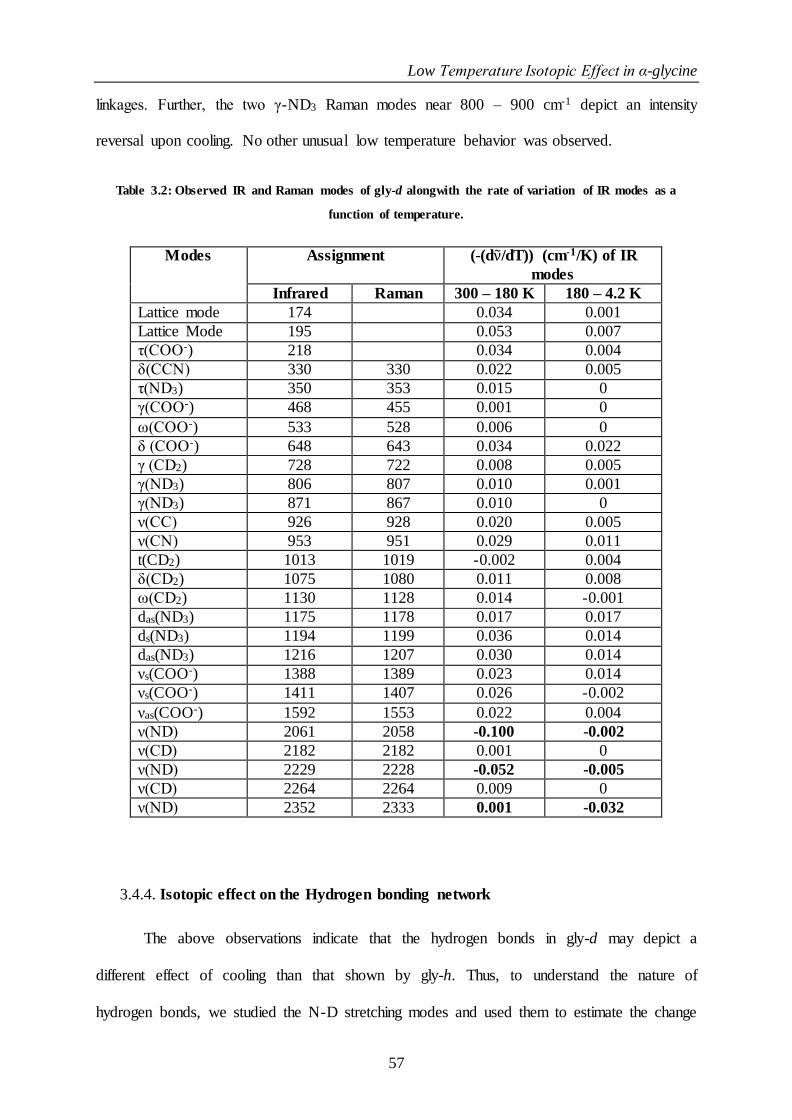
Low Temperature Isotopic Effect in α-glycine
57
linkages. Further, the two γ-ND3 Raman modes near 800 – 900 cm-1 depict an intensity
reversal upon cooling. No other unusual low temperature behavior was observed.
Table 3.2: Observed IR and Raman modes of gly-d alongwith the rate of variation of IR modes as a
function of temperature.
Modes Assignment (-(dν/dT)) (cm-1/K) of IR
modes
Infrared Raman 300 – 180 K 180 – 4.2 K
Lattice mode 174 0.034 0.001
Lattice Mode 195 0.053 0.007
τ(COO-) 218 0.034 0.004
δ(CCN) 330 330 0.022 0.005
τ(ND3) 350 353 0.015 0
γ(COO-) 468 455 0.001 0
ω(COO-) 533 528 0.006 0
δ (COO-) 648 643 0.034 0.022
γ (CD2) 728 722 0.008 0.005
γ(ND3) 806 807 0.010 0.001
γ(ND3) 871 867 0.010 0
ν(CC) 926 928 0.020 0.005
ν(CN) 953 951 0.029 0.011
t(CD2) 1013 1019 -0.002 0.004
δ(CD2) 1075 1080 0.011 0.008
ω(CD2) 1130 1128 0.014 -0.001
das(ND3) 1175 1178 0.017 0.017
ds(ND3) 1194 1199 0.036 0.014
das(ND3) 1216 1207 0.030 0.014
νs(COO-) 1388 1389 0.023 0.014
νs(COO-) 1411 1407 0.026 -0.002
νas(COO-) 1592 1553 0.022 0.004
ν(ND) 2061 2058 -0.100 -0.002
ν(CD) 2182 2182 0.001 0
ν(ND) 2229 2228 -0.052 -0.005
ν(CD) 2264 2264 0.009 0
ν(ND) 2352 2333 0.001 -0.032
3.4.4. Isotopic effect on the Hydrogen bonding network
The above observations indicate that the hydrogen bonds in gly-d may depict a
different effect of cooling than that shown by gly-h. Thus, to understand the nature of
hydrogen bonds, we studied the N-D stretching modes and used them to estimate the change

Low Temperature Isotopic Effect in α-glycine
58
in the strengths of hydrogen bonds at low temperatures. Interestingly, in gly-d, the stretching
mode corresponding to the strongest N1-D3---O2 hydrogen bond (along c-axis) shows a
significant softening on cooling up to 180 K, whereas the stretching mode corresponding to
the second strongest N1-D4---O1 hydrogen bond (in the ac-plane) depicts a discontinuous
shift to lower frequency across 180 K in addition to small softening (Figure 3.8(c)). Both
these modes show relatively negligible reduction at further lower temperatures. In complete
contrast, the N-D stretching mode at 2352 cm-1 corresponding to the N1-D5---O1 hydrogen
bond along the b-axis, shows nearly no change up to 180 K, followed by softening upon
further lowering the temperature.
It is known that the substitution of hydrogen (H) by deuterium (D) depicts a noticeable
change along the longest hydrogen bond in α-glycine (approximately along b-axis) [69, 210]
and the prominent N-D---O hydrogen bond distances have been shown as D3---02 ~ 1.740 Å,
D4---O1 ~ 1.821 Å and D5---O1 ~ 2.131 Å [210] at 0.2 GPa. The temperature induced
variation in these D---O distances as obtained from the empirical correlation given by
equation (3.1) have been plotted in Figure 3.9.
Figure 3.9 shows that the distance D5---O1 remains nearly constant (in fact a slight
increase is noticed on close inspection) on lowering the temperature up to 180 K, implying
weakening (or no prominent change) of the hydrogen bond which binds the bilayers, below
which it starts strengthening. Such a difference in gly-d than that observed in gly-h may be
due to the difference in energies of the two hydrogen bonds, viz., the increase of barrier
height and potential well separations upon deuteration due to increased reduced mass [230].
This may be the reason that the two isotopes initially depict different behavior upon cooling.
However as the temperature is lowered down to 180 K, the D5---O1 hydrogen bond starts
strengthening and follows a similar trend, which can be explained using the electrostatic

Low Temperature Isotopic Effect in α-glycine
59
Figure 3.8: (a) Raman and (b) IR spectra of gly-d in the ND and CD stretching regions at a few
representative temperatures. In addition to the stretching modes, combination, overtone and self trapped
modes may be expected in this region. Grey highlighted peaks represent ND stretching modes. (c)
Frequency versus temperature plots of ND and CD stretching modes, symbols: filled – IR and open –
Raman modes.
model, as discussed earlier [109, 110, 227-229]. On the other hand, the stronger hydrogen
bonds forming the layers in the ac-plane are strengthened on cooling down to 180 K, below
which the structure is almost stable. Further, the discontinuous shift in D4---O1 and a
noticeable change in the slope of D3---O2 suggest molecular reorientations within the layers
leading to different temperature effects below 180 K. These observations imply that the
temperature induced variations in gly-d are opposite to those in gly-h on cooling from room
temperature to 180 K. Below 180 K, both the isotopes show similar behavioral change at
lower temperatures. Hence, in the case of gly-d, the low temperature structure can be
described as denser infinite layers in the ac-plane stacked along the b-axis, i.e., a relatively
simple layered structure as shown in Figure 3.10.
(a) (b) (c)

Low Temperature Isotopic Effect in α-glycine
60
Figure 3.9: Variation of D3---O2, D4---O1 and D5---O1 bond distances with temperature in gly-d.
Figure 3.10: Structure of gly-d in bc-plane [210, 216]. Highlighted sheets are drawn to show the ac-planes.
Upon lowering the temperature, the two strong N-H---O hydrogen bonds which form a closed ring (inset)
of four molecules in the ac-plane get further stronger to form more compact and tightly held layers.
3.5. Orientational changes in N(H/D)3 torsional modes:
A possible explanation of this varying structural behavior in the two isotopes at low
temperatures can be drawn from the corroboration of these results with the nuclear magnetic
resonance studies. The hydrogen bonding network in gly-h is governed by the motion of the

Low Temperature Isotopic Effect in α-glycine
61
amino group of the molecules, in particular the rotation of the NH3 entity with respect to the
skeletal chain. EPR experiments have confirmed that the NH3 group freely rotates at room
temperature and all the three protonic positions are equivalent [231-234]. The corresponding
torsional vibrational mode shows extremely weak IR activity. However, at low temperatures
the protons are somewhat locked at their positions and merely rotate about their average
positions [205, 231]. Thus, NH3 group vibrates only moderately about the C-N axis at low
temperatures. The systematic restriction of the free rotation of NH3 group would result in the
strengthening of hydrogen bonds, which is consistent with our observations on the stretching
modes as well as a clear and pronounced evolution of the torsional mode as the temperature is
lowered. This also highlights the importance of the intra-bilayer N1-H5---O1 hydrogen bonds
in stabilizing the structural framework at varying thermodynamic conditions. However,
unlike in gly-h, the N1-D5---O1 hydrogen bonds are not strengthened in gly-d upon cooling
down to 180 K. This is again consistent with the fact from deuteron NMR that, although the
protonic motion would also be slowed down in gly-d, they may not get locked upon cooling
[235]. Infact, even at room temperature, the rate of reorientation of ND3 group (in gly-d) is
different from the NH3 group (in gly-h) [113, 207, 235]. The earlier neutron scattering (NS)
studies on gly-h have indicated that NH3 torsional potential is anharmonic [217, 218].
Subsequently in 2008, Bordallo et al. reported an increase in the harmonic character below
150 K using inelastic NS studies [205]. These results remained the only information on the
anharmonicity of the torsional vibrations, as the signature of the torsional mode is very weak
in IR and Raman spectra at ambient conditions [205]. As the effects of change in
anharmonicity may also be reflected in the peak widths of the vibrational modes, we have
shown here a comparison of vibrational peaks lying in the region of the torsional mode in
Figure 3.11 and Table 3.3.
The FWHM of τNH3 mode decreases very rapidly upon cooling upto 150 K, below which the

Low Temperature Isotopic Effect in α-glycine
62
Figure 3.11:Comparison of NH3/ ND3 torsional mode in the IR spectra of (a) gly-h and (b) gly-d at 300 K
and 4.2 K.
rate of decrease reduces. The FWHM could be fitted using a combination of exponential and
linear functions, which indicates a change in anharmonicity accompanied with subtle
reorientational changes [236-238]. Thus, the changes observed in gly-h, like freezing of
protonic position and distinct change in anharmonicity could not be inferred in the case of
gly-d. The other vibrations lying in this region, viz., δCCN and γCO2 showed nearly the same
behavioral changes for gly-h and gly-d. It has also been reported that the greater
anharmonicity in glycine (gly-h) at room temperature as compared to other compounds like
alanine is due to unequal strengths of the three hydrogen bonds [239]. The reduction in the
difference of hydrogen bond strengths at low temperatures is therefore consistent with an
increase in the harmonic character.
Table 3.3: FWHM (in cm-1) of various modes in gly-h and gly-d at 300 K and at 4.2 K.
Modes FWHM (cm-1) - gly-h FWHM (cm-1) - gly-d
300 K 4.2 K 300 K 4.2 K
δCCN 25.67 17.12 25.95 20.61
τ NH3/ND3 50.22 4.87 12.31 10.70
γCOO- 15.35 9.36 17.63 15.14

Low Temperature Isotopic Effect in α-glycine
63
Lastly, it is worth presenting the low temperature behavior of a characteristic band of
medium intensity around 2100 cm-1, found in amino acids, which was earlier assigned as NH
stretching vibration by Koegel et al. [240] and later a bending vibration by Leifer et al. [241]
However, since 1964, when Krishnan et al. noted that this is a combination of NH3
deformation and NH3 torsional modes and is present only in the zwitterionic forms, it has
been used as an "indicator band" for the identification of the zwitterionic form [125]. This
band, i.e., the δNH3 + τNH3 combination band has been observed at 2130 cm-1 in the
spectrum of gly-h (Figure 3.2) and the corresponding band in gly-d is observed at 1522 cm-1
(Figure 3.7(a)). The temperature variation of these bands has been shown in Figure 3.12.
While in gly-h this band shows a stiffening of nearly 60 cm-1 up to 4.2 K, in gly-d a relatively
smaller shift of ~ 20 cm-1 has been observed.
Thus, we observe that the amino group vibrational modes associated with hydrogen
bonding, viz., stretching, torsional and combinations show a lower shift in gly-d as compared
to that in gly-h upon cooling. However, upon compression, the high pressure Raman spectra,
reported for these isotopes under quasi- as well as non-hydrostatic conditions up to 23 GPa
and 20 GPa for gly-h [68] and gly-d [242] respectively, have shown a general stiffening of
the torsional modes and nearly similar shifts in the stretching modes. While subtle structural
rearrangements have been reported at ~ 3 GPa, no structural phase transition was observed
[68, 242]. The high pressure single crystal x-ray diffraction studies on gly-h up to 6.2 GPa
have shown the least compressibility along the c-axis, whereas b-axis showed the maximum
compressibility [69]. For gly-d, x-ray diffraction studies have been reported upto ~8.7 GPa
and no phase transition was observed in this case too [210]. Noticeably, at high pressures, the
strongest hydrogen bond (H3/D3---O2) weakens in both gly-h and gly-d (deduced from O---
H/D distances) [69, 210]. The weakest of the three, i.e., N1-H5/D5---O1 approximately along
the b-axis, remains almost unaffected in gly-h, whereas it strengthens in gly-d [69, 210] upon

Low Temperature Isotopic Effect in α-glycine
64
Figure 3.12: Temperature variation of the "indicator" band in gly-h (top) and gly-d (bottom).
compression. The most prominent effect was however shown by the intermediate H4/D4---
O1 hydrogen bond which strengthens in both the isotopes under pressure [69, 210]. Thus, it is
clear that the high pressure and low temperature behavior of the three dimensional hydrogen
bonded framework is not identical for both gly-h and gly-d. Thus, it would be interesting to
explore the phase diagram of this simplest, hydrogen bond stabilized, amino acid system, in
lines similar to the simplest hydrogen bonded system, ice [228].
Among the simple amino acids, the low temperature studies on L-alanine, the smallest
chiral amino acid shows lattice instability at 220 K due to a strong dynamic Jahn-Teller
effect, whereas its deuterated analogue depicts a structural transition at 170 K due to
geometrical changes, presumably because of the Ubbelohde effect [211]. In general, it is
presumed that deuteration leads to profound effects primarily on vibrational frequencies (due
to mass effect) and some scaling in hydrogen bonding interactions (e.g. due to Ubbelohde
effect) [243], whereas the crystal structure and the relative strengths within the three

Low Temperature Isotopic Effect in α-glycine
65
dimensional network of hydrogen bonds can be affected and the isotopes are believed to
follow similar [244] or different [44, 192] behavior under varying conditions depending on
the local environment. It is also known that deuteration may result in increase in transition
temperature in the case of a temperature induced phase transition [192, 245].
The present results point out the varying behavior of gly-h and gly-d at low
temperatures. The hydrogen bond lengths in gly-h show nearly monotonous changes upon
cooling as compared to gly-d where the changes are relatively discontinuous at 180 K. These
changes in the hydrogen bonding network of gly-d may also lead to some structural changes
at lower temperatures as observed for some other hydrogen bonded compounds upon
deuteration [246-250]. This evokes a need for systematic and comparative low temperature
structural studies on the various isotopic analogues of amino acids, considering the vast range
of isotopic applications in structure determination, pharmacy and biophysics.
3.6. Summary
Our variable temperature studies indicate that isotope effects may play a significant role in
the properties of glycine, the simplest amino acid. Among the three N-H---O hydrogen bonds
in gly-h, the strongest one, nearly along the c-axis, shows the least compression upon cooling,
whereas the weakest one, nearly along the b-axis shows a drastic reduction. An opposite
behavior has been observed for the deuterated isotope when cooled down to 180 K. The
behavior of NH3 torsional mode supports these observations which shows pronounced
sharpening accompanied with a large rate of stiffening upon cooling in gly-h, which
corroborate well with the reports of reduction in its anharmonic character. In contrast, the
torsional mode in gly-d does not show noticeable changes on cooling. These observations
imply a relatively compact and isolated three dimensional bilayered structure of gly-h at low

Low Temperature Isotopic Effect in α-glycine
66
temperatures in comparison to a much strongly held two dimensional layered structure of gly-
d stacked along the b-axis.

Low Temperature Phase Transitions in L-Leucine
67
Chapter 4: Low Temperature Phase Transitions in L-Leucine
4.1. Introduction
The motions of constituent molecular moieties in amino acids are responsible for major
alterations in vibrational, structural and physical properties. Such motions take place at
different time scales [23] and can be activated under specific temperature/pressure conditions,
which may vary for different compounds [22, 23]. The studies on these aspects, viz.,
activation of particular motions is important for understanding the protein flexibility which
can cause change in the protein functionality and peptide linkages.
L-Leucine (C6H13NO2) is an “essential” aliphatic amino acid with wide applications
in organic non-linear optical (NLO) materials [95, 140]. However, the structural behavior of
L-Leucine at low temperatures is not well understood. Thus, the monitoring of various
molecular group movements can be exploited to throw light on its possible structural
response upon cooling. In this regard, spectroscopic studies would be ideal to probe such
changes occurring in the lattice scale in the complex L-Leucine molecular structure.
Among the reported structural studies, the low temperature single crystal XRD data
recorded by Gorbitz & Dalhus in 1996 at 120 K showed no phase transition in L-Leucine
[150]. However, in 2011, Filho et al. reported two phase transitions at around 150 K and 275
K using calorimetry and Raman spectroscopic studies [86]. Their neutron scattering results
pointed out the changes associated with the backbone hydrophobic chain. But, the powder
XRD data were not suitable for atomic refinement in order to confirm structural phase
transitions, though Le-bail refinement indeed showed the anomalous behavior of monoclinic
beta (β) angle between these two temperatures [86].In 2016, Binns et al. carried out a single
crystal neutron diffraction study, extracting detailed parameters at two temperatures of 300 K

Low Temperature Phase Transitions in L-Leucine
68
and 120 K [87]. Surprisingly, this study again indicated the absence of any low temperature
phase transition and highlighted the urgent need for further studies on this compound in view
of the importance of this essential amino acid. This necessitated a closer inspection of
changes in the constituent molecular conformations and fine monitoring of the trend of
hydrogen bonding motifs, which stabilize the structural framework, at varying temperatures.
Infrared spectroscopy is a powerful technique which can provide clear and
complementary information on the reorientation dynamics of various molecular units [15,
106, 199, 201, 251, 252]. In addition, it can also provide significant details of the N-H
stretching modes, thereby giving vital insights into the stability of hydrogen bonding network
[252]. Thus, to find the signatures and microscopic mechanism of the possible phase
transitions upon cooling, along with the analysis of anharmonicity and orientational changes,
systematic LT-FTIR spectroscopy on powder L-Leucine has been carried out in a wide
spectral range of 30 – 3500 cm-1.
4.2. Experimental methods
Powder L-Leucine was purchased from SRL (Sisco Research Laboratories Pvt. Ltd.) with
99% extra pure CHR. The low temperature IR measurements were carried out at the
experimental station of IR beamline facility at Indus-1 in India using continous flow cyrostat,
Oxford Optistat CF-V in the transmission mode with temperature varying from 300 K to 4.2
K using liquid nitrogen (LN2) and liquid helium (LHe) as the cryogens. In the MIR range
(500 – 4000 cm-1), sample was dispersed in the CsI and spectra were recorded using KBr
beamsplitter and LN2 cooled MCT detector at 4 cm-1 resolution with temperature varied from
300 to 66 K using LN2 as cryogen. For the FIR region (from 30 – 300 cm-1), sample was
dispersed in the polyethylene matrix and the spectra were recorded using Mylar beamsplitter,
Hg source and FIR-DTGS detector at 2 cm-1 with temperature varied from 300 K to 4.3 K
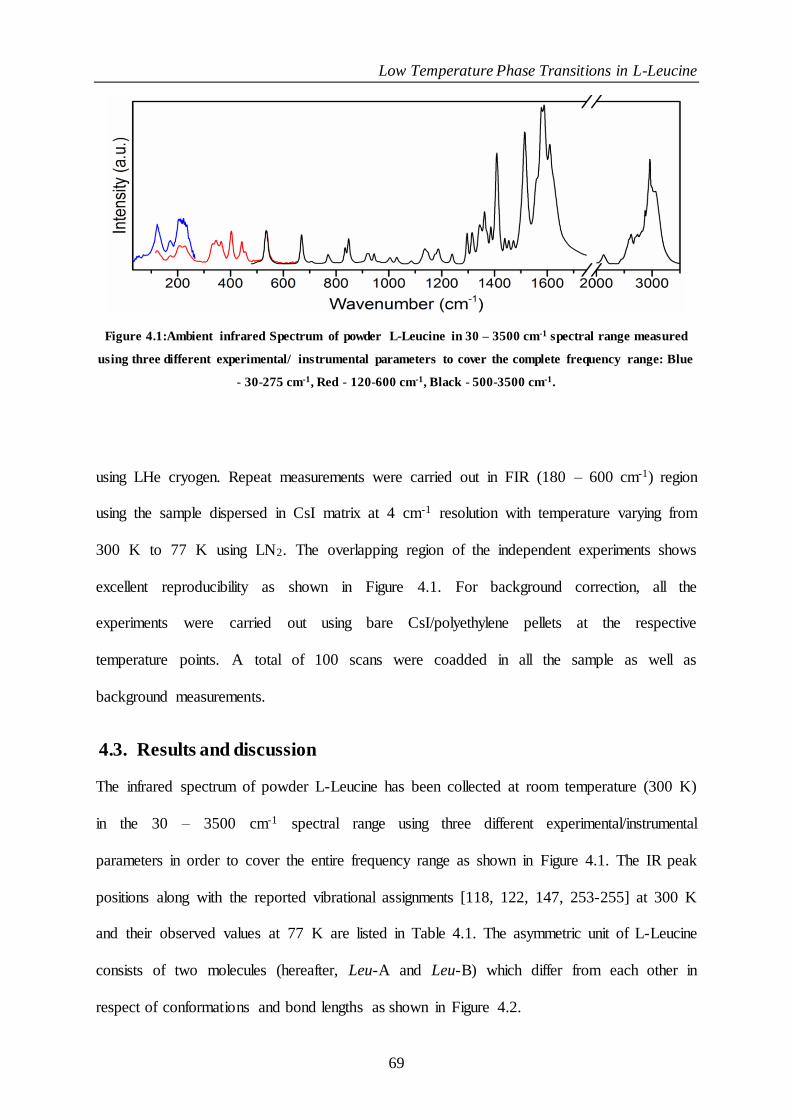
Low Temperature Phase Transitions in L-Leucine
69
Figure 4.1:Ambient infrared Spectrum of powder L-Leucine in 30 – 3500 cm-1 spectral range measured
using three different experimental/ instrumental parameters to cover the complete frequency range: Blue
- 30-275 cm-1, Red - 120-600 cm-1, Black - 500-3500 cm-1.
using LHe cryogen. Repeat measurements were carried out in FIR (180 – 600 cm-1) region
using the sample dispersed in CsI matrix at 4 cm-1 resolution with temperature varying from
300 K to 77 K using LN2. The overlapping region of the independent experiments shows
excellent reproducibility as shown in Figure 4.1. For background correction, all the
experiments were carried out using bare CsI/polyethylene pellets at the respective
temperature points. A total of 100 scans were coadded in all the sample as well as
background measurements.
4.3. Results and discussion
The infrared spectrum of powder L-Leucine has been collected at room temperature (300 K)
in the 30 – 3500 cm-1 spectral range using three different experimental/instrumental
parameters in order to cover the entire frequency range as shown in Figure 4.1. The IR peak
positions along with the reported vibrational assignments [118, 122, 147, 253-255] at 300 K
and their observed values at 77 K are listed in Table 4.1. The asymmetric unit of L-Leucine
consists of two molecules (hereafter, Leu-A and Leu-B) which differ from each other in
respect of conformations and bond lengths as shown in Figure 4.2.
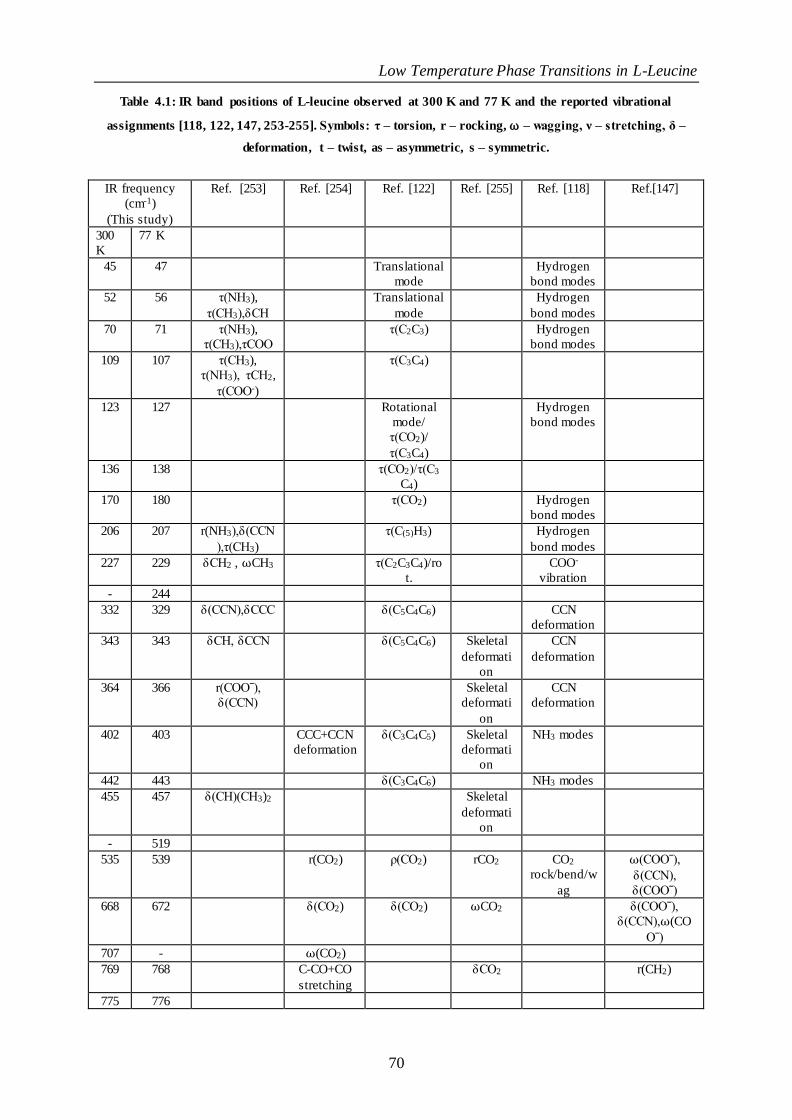
Low Temperature Phase Transitions in L-Leucine
70
Table 4.1: IR band positions of L-leucine observed at 300 K and 77 K and the reported vibrational
assignments [118, 122, 147, 253-255]. Symbols: τ – torsion, r – rocking, ⍵ – wagging, ν – stretching, δ –
deformation, t – twist, as – asymmetric, s – symmetric.
IR frequency
(cm-1)
(This study)
Ref. [253] Ref. [254] Ref. [122] Ref. [255] Ref. [118] Ref.[147]
300
K
77 K
45 47 Translational
mode
Hydrogen
bond modes
52 56 τ(NH3),
τ(CH3),δCH
Translational
mode
Hydrogen
bond modes
70 71 τ(NH3),
τ(CH3),τCOO
τ(C2C3) Hydrogen
bond modes
109 107 τ(CH3),
τ(NH3), τCH2,
τ(COO-)
τ(C3C4)
123 127 Rotational
mode/
τ(CO2)/
τ(C3C4)
Hydrogen
bond modes
136 138 τ(CO2)/τ(C3
C4)
170 180 τ(CO2) Hydrogen
bond modes
206 207 r(NH3),δ(CCN
),τ(CH3)
τ(C(5)H3) Hydrogen
bond modes
227 229 δCH2 , ⍵CH3 τ(C2C3C4)/ro
t.
COO-
vibration
- 244
332 329 δ(CCN),δCCC δ(C5C4C6) CCN
deformation
343 343 δCH, δCCN δ(C5C4C6) Skeletal
deformati
on
CCN
deformation
364 366 r(COOˉ),
δ(CCN)
Skeletal
deformati
on
CCN
deformation
402 403 CCC+CCN
deformation
δ(C3C4C5) Skeletal
deformati
on
NH3 modes
442 443 δ(C3C4C6) NH3 modes
455 457 δ(CH)(CH3)2 Skeletal
deformati
on
- 519
535 539 r(CO2) ρ(CO2) rCO2 CO2
rock/bend/w
ag
⍵(COOˉ),
δ(CCN),
δ(COOˉ)
668 672 δ(CO2) δ(CO2) ⍵CO2 δ(COOˉ),
δ(CCN),⍵(CO
Oˉ)
707 - ⍵(CO2)
769 768 C-CO+CO
stretching
δCO2 r(CH2)
775 776

Low Temperature Phase Transitions in L-Leucine
71
834 834 ν(CC) r(CH2)
847 849 δ(COOˉ),ν(C
C),ν(CN)
r(CH2) δCOO-,
νCC,νCN
917 920 r(CH3)+ν(C
C)
924 928 r CH3, ν CC
944 943
962 961 νCCN, νCC r(CH3) νCCN, νCC
1004 1002
1009
rNH3, rCH3,
νCC
r(NH3) , ν(CC),
r(CH3)
1030 1035 νCN ν(CN) ν(CN)
1084 1086 r(CH3)
- 1133
1135 1143 rCH3, νCC,
δCCN
r(NH3) r(CH3), ν(CC),
δ(CCN)
1146 1158
1175 1178 ν(CC) r(NH3), δ(CH)
1186 1191 r(NH3), δCH
1239 1240 r(NH3), tCH2,
rCH3, νC-
COO-
r(NH3)
1296 1294 t(CH2)
1315 1313
1223
CH+NH
bending
δ(CH)
1343 1345 ⍵(CH2)
1362 1363 δs(CH3)
1371 1372 νs(COO ˉ),
δs(CH3)
δs(CH3)
1386 1386 t(CH2)
1408 1413
1419
νs(CO2) δs(CH3)
1439 1438 δs(CH3 ) δ(CH2)
1447 New
1454 1455 δas(CH3)
1471 1473 δCH2 δas(CH3)
1514 1511
1514
δCH2, δs(CH3) δsNH3
1558 1557
1562
νasCO2
1577 1580
1588 1584 νas(COOˉ) νasCO2
1608 1615 δas NH3
1624 1625 δas NH3
1634 1638 δas(NH3)
2132 2133 Combination
band
2580 2570
2621 2615
2738 2739 Combination
band
2871 2872 νs(CH2)
2959 2960 νas(CH2)
3061 3063 νas(NH3)
- 3108

Low Temperature Phase Transitions in L-Leucine
72
Figure 4.2: Two L-Leucine molecules (Leu-A and Leu-B) in the asymmetric unit along with the notation of
different atoms.
4.3.1. Signatures of possible Phase transitions across 240 K
Upon systemic cooling of L-Leucine from room temperature, we observe significant
modifications across 240 K specifically in the modes related to NH3+ and COO- groups. In
Figure 4.3, a new IR mode appears below 240 K at 507 cm-1, which can be the out-of-plane
γ(N-H---O) intermolecular hydrogen bond bending mode as suggested in the INS reports
[255]. This mode shows a large rate of stiffening (0.055 cm-1/K) relative to other modes upon
further cooling as shown in Figure 4.3. The modes at 1135, 1144 cm-1and 918, 922 cm-1show
intensity reversal below 240 K as shown in Figure 4.4. The strong symmetric deformation,
δs(NH3) mode at ~ 1514 cm-1 shows very small softening and splits below 240 K with both
the components showing similar IR intensity (Figure 4.5). In contrast, the corresponding
asymmetric deformation δas(NH3) mode at ~ 1608 cm-1 shows a noticeably large rate of
stiffening (0.031 cm-1/K) below 240 K (Figure 4.5). The symmetric stretching νs(COOˉ)
mode at 1408 cm-1 splits and the corresponding asymmetric stretching νas(COO-) mode at
1587 cm-1 shows softening behavior below 240 K (Figure 4.5). All the above observations
imply a phase transition at 240 K which may be caused due to a change in the hydrogen
bonding interactions between NH3+ and COO- groups in L-Leucine. The definitive signatures
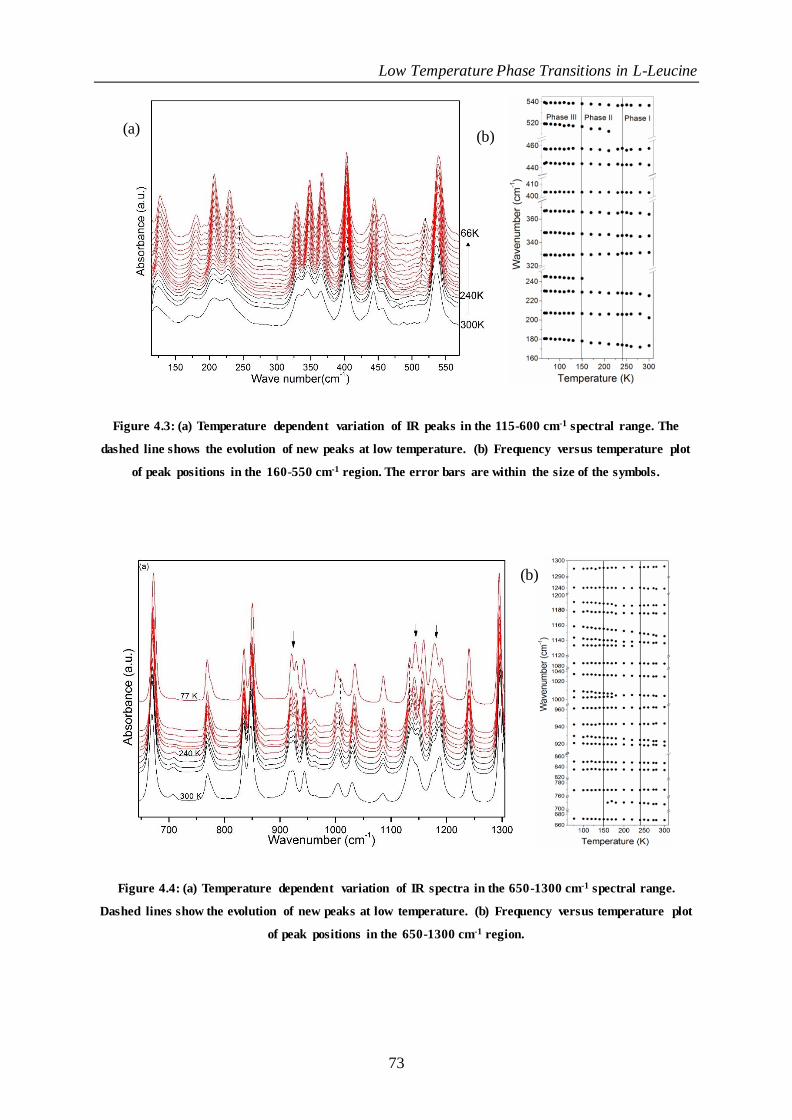
Low Temperature Phase Transitions in L-Leucine
73
Figure 4.3: (a) Temperature dependent variation of IR peaks in the 115-600 cm-1 spectral range. The
dashed line shows the evolution of new peaks at low temperature. (b) Frequency versus temperature plot
of peak positions in the 160-550 cm-1 region. The error bars are within the size of the symbols.
Figure 4.4: (a) Temperature dependent variation of IR spectra in the 650-1300 cm-1 spectral range.
Dashed lines show the evolution of new peaks at low temperature. (b) Frequency versus temperature plot
of peak positions in the 650-1300 cm-1 region.
(a)
(b)
(b)

Low Temperature Phase Transitions in L-Leucine
74
of such a transition and further insights into the hydrogen bonding network can be extracted
by studying the N-H stretching vibrational modes, which confirm these observations as
described below.
Figure 4.5: (a) Temperature dependent variation of IR spectra in the 1280-1675 cm-1 spectral range. The
dashed line shows the evolution of new peaks at low temperature. (b) Frequency versus temperature plot
of peak positions in the 1300-1630 cm-1 region.
4.3.2. Hydrogen bonding network in L-Leucine below 240 K
The asymmetric unit of L-Leucine consists of two types of molecules named as Leu-A and
Leu-B (Figure 4.2). There are a total of seven N-H---O hydrogen bonds including one
bifurcated hydrogen bond [87]. Out of these, 5 are in the ac-plane and two hydrogen bonds
are approximately along the b-axis. In addition, there is a C-H---O hydrogen bond [87]. The
bond parameters of these hydrogen bonds as reported in the recent single crystal neutron
diffraction study [87] at 300 K and 120 K have been tabulated in Table 4.2. However, their
(a) (b)

Low Temperature Phase Transitions in L-Leucine
75
Figure 4.6: (a) Temperature dependent variation of IR spectra of L-leucine in the NH and CH stretching
region in the 2000-3300 cm-1 spectral range. The dashed line shows the evolution of N-H stretching peaks
at low temperatures. (b) Frequency versus temperature plot of the IR peak positions in the 2565-3080 cm-
1 spectral range.
Table 4.2:Hydrogen bond parameters of Leu-A and Leu-B molecules as obtained from reference [87],
along with the low temperature behavior of N-H stretching modes of both Leucine molecules.
Hydrogen
bonds
Temp.
(K)
H---
O(Å)[87]
N---
O(Å)[87]
Angle
(°)[87]
Exp. freq.,
N-H (cm-1) (This
study)
Behavior at LT
(This Study)
N1-H2---O2 300 1.881 2.887 168.4 3000 Stiffen
120 1.886 2.897 170.0
N1-H3---O3 300 1.716 2.775 176.1 2623 Soften
120 1.673 2.745 178.2
N1-H4---O3 300 1.835 2.817 155.0 2815 Stiffen
120 1.852 2.812 151.0
N2-H16---O1 300 1.715 2.756 174.5 2580 Soften
120 1.690 2.751 173.3
N2-H15---O4 300 1.835 2.855 169.6 - Stiffen
120 1.836 2.860 166.8
N2-H17---O1 300 2.071 2.952 141.8 3060 Reorientational change 120 2.208 2.999 132.1
N2-H17---O2 300 2.110 3.068 153.3
120 1.970 2.970 162.2
(a)
(b)

Low Temperature Phase Transitions in L-Leucine
76
behaviors in the intermediate temperature range are unclear which could give information on
possible phase transitions. The spectroscopic signatures of the corresponding stretching
vibrational modes can thus be exploited to understand the changes at the molecular level. The
IR spectral region 2500-3000 cm-1 consists of the stretching vibrational modes and is shown
in Figure 4.6(a). But, this region is very complex due to various overtone and combination
modes apart from N-H and C-H stretching modes and the precise vibrational frequencies of
N-H stretching modes are not available in the reported experimental data. Hence, in order to
mark the possible assignments, we have taken help from various empirical correlation plots
between N-H stretching frequencies and the corresponding N---O distances and the
theoretical predictions [59, 62].
Among the three hydrogen atoms (H2, H3, H4) of the amino group of Leu-A
molecule, two are hydrogen bonded to nearby Leu-B molecules nearly along the a- and c-
axes respectively via their carboxyl groups, as N1-H3---O3 and N1-H4---O3, as shown in
Figure 4.7(a). The bond parameters reported in the single crystal neutron diffraction studies
are: (a) N1-H3---O3: N---O = 2.775(5) Å, H---O = 1.716(9) Å, N-H---O = 176.1(8)°, and
(b) N1-H4---O3: N---O = 2.817(5) Å, H---O = 1.835(10) Å, N-H---O = 155.0(8)° [87].
These correspond to inter-molecular hydrogen bonding between NH3+ and COO- units. The
correlation plots suggest that the N-H stretching frequencies corresponding to these hydrogen
bonds are expected at around 2640 cm-1 and 2790 cm-1 respectively. We indeed observed
peaks near these frequencies at 2625 cm-1 and 2815 cm-1 respectively, the features of which
resemble the N-H stretching modes generally observed in the IR spectra of amino acids.
Hence, the modes at 2625 cm-1 and 2815 cm-1 can be assigned to the N1-H3 and N1-H4
stretching modes respectively.
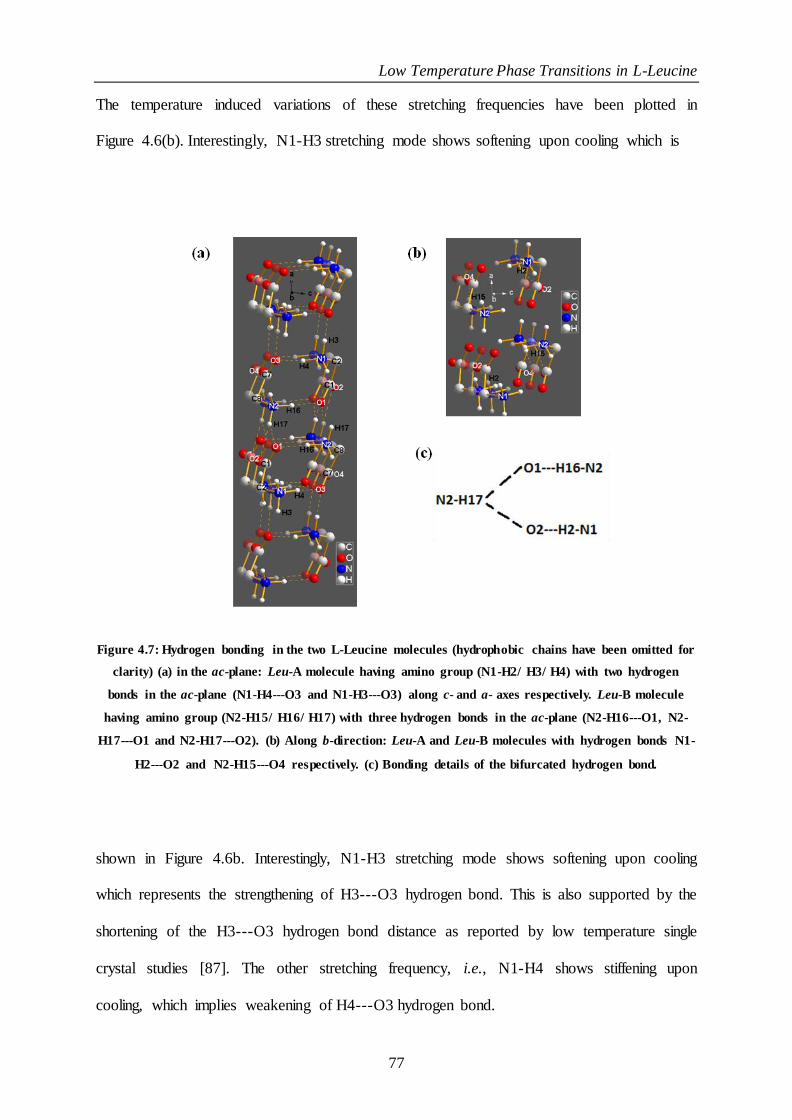
Low Temperature Phase Transitions in L-Leucine
77
The temperature induced variations of these stretching frequencies have been plotted in
Figure 4.6(b). Interestingly, N1-H3 stretching mode shows softening upon cooling which is
Figure 4.7: Hydrogen bonding in the two L-Leucine molecules (hydrophobic chains have been omitted for
clarity) (a) in the ac-plane: Leu-A molecule having amino group (N1-H2/ H3/ H4) with two hydrogen
bonds in the ac-plane (N1-H4---O3 and N1-H3---O3) along c- and a- axes respectively. Leu-B molecule
having amino group (N2-H15/ H16/ H17) with three hydrogen bonds in the ac-plane (N2-H16---O1, N2-
H17---O1 and N2-H17---O2). (b) Along b-direction: Leu-A and Leu-B molecules with hydrogen bonds N1-
H2---O2 and N2-H15---O4 respectively. (c) Bonding details of the bifurcated hydrogen bond.
shown in Figure 4.6b. Interestingly, N1-H3 stretching mode shows softening upon cooling
which represents the strengthening of H3---O3 hydrogen bond. This is also supported by the
shortening of the H3---O3 hydrogen bond distance as reported by low temperature single
crystal studies [87]. The other stretching frequency, i.e., N1-H4 shows stiffening upon
cooling, which implies weakening of H4---O3 hydrogen bond.
(a)

Low Temperature Phase Transitions in L-Leucine
78
In the Leu-B molecule, the hydrogen atoms covalently bonded to nitrogen (N2) have
been marked as H15, H16 and H17. The H16 hydrogen atom is connected to O1 atom of Leu-
A molecule through N2-H16---O1 hydrogen bond along the c-axis, as shown in Figure 4.7(a).
The second hydrogen atom (H15) forms hydrogen bond with the other Leu-B molecule, via,
N2-H15---O4 approximately along the b-axis. The temperature effects on these two hydrogen
bonds have been described later. Finally, the Leu-B molecule also forms a bifurcated
hydrogen bond with carboxyl group of Leu-A as N2-H17---O1 and N2-H17---O2 nearly
along the a-axis as shown in Figure 4.7(a) and Figure 4.7(c). The hydrogen bond parameters
of the bifurcated bond are (a) N---O = 2.952(5) Å, H---O = 2.071(15) Å, N-H---O =
141.8(11)° for N2-H17---O1, and (b) N---O = 3.068(6) Å, H---O = 2.110(10) Å, N-H---O
= 153.3(13)° for N2-H17---O2 [87]. In order to estimate the approximate position of the
corresponding covalent N-H stretching frequency using the correlation plots, we marked the
frequency value for the average of the corresponding N---O distances. This value was found
to be around 3100 cm-1. At close to this value, a clear peak can be found at ~ 3065 cm-1 in the
IR spectrum as shown in Figure 4.6(a). The assignment of this peak to the N-H stretching
mode has also been confirmed from the reported Raman spectrum [86]. Interestingly, this
mode stiffens upon cooling down to 240 K, after which a softening behavior has been
observed. As this mode corresponds to a bifurcated hydrogen bond, this behavior may be an
indication of orientational changes in the amino group of Leu-B molecule across 240 K. To
explain this peculiar behavior, we have to study the other hydrogen bonds connected to the
acceptor O1 and O2 oxygen atoms. The hydrogen bonds connected to O1 and O2 are: N2-
H17---O1---H16-N2 (see Figure 4.7a) and N2-H17---O2---H2-N1 (see Figure 4.7a and
Figure 4.7b) of next Leu-B and Leu-A amino groups along c- and b-axes respectively (also
shown in Figure 4.7c). The N2-H16---O1 and N1-H2---O2 hydrogen bonds indeed show
opposite low temperature behavior as shown in Figure 4.6. The N-H stretching frequency

Low Temperature Phase Transitions in L-Leucine
79
corresponding to N2-H16---O1 hydrogen bond obtained from empirical correlations is around
~ 2590 cm-1. We observed the frequency in the IR spectrum at ~ 2580 cm-1. This frequency
softens upon cooling as shown in Figure 4.6(b). Similarly, for the other hydrogen bond, i.e.,
N1-H2---O2, the expected and observed N-H stretching frequencies are 2990 cm-1 and 2997
cm-1 respectively, which stiffens upon lowering the temperature as shown in Figure 4.6(b).
The relative rate of strengthening of N2-H16---O1 hydrogen bond (dν/dT (N2-H16) = 0.040
cm-1/K) is higher than the rate of weakening of N1-H2---O2 hydrogen bond (dν/dT (N1-H2)
= 0.025 cm-1/K) on cooling up to 240 K, whereas the rate of variations are almost similar at
further lower temperatures. This is well reflected by the stiffening of the N2-H17 stretching
frequency up to 240 K. However, an opposite effect is observed below 240 K, which implies
that if one compares the room temperature and low temperature structures (nearly 100 K or
lower), no appreciable change would be noticed in the N2-H17 bond distance. These
observations provide the explanation to the reported variations in bond distances and angles
at 300 and 120 K using single crystal diffraction studies [87] (also included in Table 4.2) and
also explain why no change in N2-H17 bond length (~1.033 Å) was found. In addition, the
present studies also bring into light the significant variations due to temperature effects in the
intermediate temperature range. The third hydrogen bonding of Leu-B molecule is via, N2-
H15---O4 as shown in Figure 4.7(b). The corresponding N-H stretching frequency obtained
from empirical relations is at 2938 cm-1. In the IR spectra, shown in Figure 4.6, the region
around 2900-2950 cm-1 consists of several modes in addition to some shoulder peaks, which
makes the unambiguous assignment of N2-H15 stretching mode difficult. However, all the
modes lying in this region show stiffening behavior as the temperature is reduced. Thus, we
may conclude that the N2-H15---O4 hydrogen bond weakens at low temperatures. This is in
good agreement with the low temperature single crystal studies which reported elongation in
the H15---O4 bond at 120 K [87].

Low Temperature Phase Transitions in L-Leucine
80
To summarize, the stiffening behavior of N-H stretching frequencies corresponding to
hydrogen bonds lying approximately along the b-axis (N1-H2---O2 and N2-H15---O4) upon
cooling indicates an overall elongation of hydrogen bonds in this direction. The hydrogen
bonds along c-axis show compression (N2-H16---O1) as well as elongation (N1-H4---O3) on
lowering the temperature. However, the rate of elongation in the N2-H16 stretching
frequency is about 0.045%, whereas the rate of reduction in the N1-H4 stretching frequency
is about 0.040% upon cooling. Hence, the effect of compression may be larger than the effect
of elongation along c-axis on lowering the temperature. Along the a-axis, the N1-H3
stretching mode softens upon cooling and the N2-H17 stretching mode though initially
stiffens upto 240 K, also shows a softening behavior below 240 K. Therefore, there is an
overall compression of hydrogen bonds along a-direction below 240 K. As a result, the 2-D
layers in the ac-planes are more compact below 240 K and well separated from each other
along b-direction (see Figure 4.7 a).
Further, the τ(NH3) (torsional) mode (~ 512 cm-1), which also provides information on
hydrogen bonding, is very weak to be observed at ambient conditions (Figure 4.3). Upon
cooling down to 210 K, we could clearly observe the increase in intensity of this mode and
the peak position shows a large stiffening behavior (Figure 4.3a) similar to the case of α-
glycine [251]. Another band linked to this mode, i.e., the characteristic zwitterionic mode
around 2130 cm-1 (indicator band): a combination of NH3 deformation (~ 1608 cm-1) and NH3
torsional (~ 512 cm-1) modes shows monotonous stiffening upon cooling.
4.3.3. Reorientational changes across 150 K
The spectral range 30-80 cm-1 consists of three lattice modes at 45, 52, and 70 cm-1 which are
very weak at ambient conditions (Figure 4.8a). Consistent with the reported LT- Raman
studies[86], the mode at ~ 70 cm-1 shows a small discontinuity at around 240 K as shown in

Low Temperature Phase Transitions in L-Leucine
81
Figure 4.8b, in addition to the emergence of a new shoulder mode across 150 K on the low
frequency side, which shows softening behavior below 150 K.
Figure 4.8:(a) Temperature dependent variation of IR peak positions in 30-90 cm-1 spectral range. (b)
Frequency versus temperature plot of IR peak at 70 cm-1 wavenumber.
The region 90-150 cm-1 consists of three modes at 107, 122 and 138 cm-1 as shown in Figure
4.9 inset. The peak at 107 cm-1 corresponds to torsional vibrations of τ(C3C4) [For notation
see Figure 4.2]. We have analysed full width half maximum (FWHM) of these modes in
order to understand the possibility of orientational changes associated with the hydrocarbon
chain, by carrying out the Carabatos-Nedelec and Becker approach[256]. According to this
approach, the displacement of an atom or molecule with the orientational disorder can be
correlated with the self-diffusion process. This has been further characterized by jumping
from one orientation form to another or from one potential well to another. The mean
orientational correlation time (τR) for this jump is given as:

Low Temperature Phase Transitions in L-Leucine
82
𝜏𝑅 = τ∞. 𝑒𝑥𝑝 (−𝐸𝑎/��𝑇) (4.1)
where, τ∞ is the relaxation time at infinite temperature, Ea is the height of the potential
barrier for reorientation; �� is the Gas Constant (8.3144 Х 10-3 KJ K-1mol-1) at temperature T.
When 4π2ν2τR2>>1, where, ν is the frequency of a particular phonon mode, then the
expression for the temperature dependence of the FWHM (Г) can be described as
follows[256]:
Г(𝑇) = (𝑎 + 𝑏𝑇) + 𝐶 𝑒𝑥𝑝 (−𝐸𝑎/��𝑇) (4.2)
where, a, b, C and Ea are fitted parameters. The first term “(a+ bT)” (linear)in
equation (4.2) describes the vibrational relaxation or anharmonicity and the second term
(exponential) describes thermal reorientation mechanism of the diffuse nature of the
associated modes [256]. Upon analysing the FWHM for the torsional modes, the mode at 107
cm-1 (τ(C3C4)) as fitted with Gaussian function and plotted in the temperature range 300 - 4.3
K in Figure 4.9, showed an interesting behavior. Its FWHM decreases upon lowering the
temperature down to 150 K as shown in Figure 4.9. The obtained parameters upon fitting the
FWHM with equation (4.2) have been tabulated in Table 4.3. The activation energy, Ea, is
found to be 16.3 KJ/mol, which is in good agreement with the reported NMR results[151].
Upon further cooling below 150 K, the FWHM, surprisingly, starts increasing linearly,
indicating another phase transition.

Low Temperature Phase Transitions in L-Leucine
83
Figure 4.9: Full width at half maximum (FWHM) of (C3C4) torsion mode, i.e.,τ(C3C4) at 107 cm-1, in the
temperature range 300 – 4.3 K. Inset: Fitted IR spectrum of L-Leucine at 300 K in 80 – 160 cm-1 spectral
range.
Table 4.3:The fitted parameters a, b, C and Ea from equation (4.2), for the temperature dependence of
FWHM of τ(C3C4) mode in the temperature ranges 300 – 150 K and 150 – 4.3 K.
Fitting
Parameters
T = 300 - 150 K Error T = 150 - 4.3 K Error
a (cm-1) 9.999 1.389 14.744 0.172
b (cm-1K-1) -0.002 0.009 -0.034 0.002
C (cm-1) 4503.956 6457.101 - -
Ea (KJ mol-1) 16.365 4.030 - -
The mechanism of phase transition can be explained as follows. The high activation energy
indicates a high disorder in the orientation of the branched hydrophobic chain. Below 150 K,
the dominant linear dependence of FWHM of τ(C3C4) mode suggests a vibrational relaxation
process. In other words, the negligible contribution of the exponential term implies large
reduction in the activation energy. Hence, the torsional motion of τ(C3C4) tends to freeze and
a relatively ordered configuration is obtained. It is noteworthy that the changes in the
branched chains around 150 K are also supported by the reported proton magnetic studies
Low Temperature Phase Transitions in L-Leucine
84
[153]. The decrease of activation energy at low temperatures is well supported by the
exothermic peak at 150 K in the reported DSC measurements [86]. Hence, based on the
results from our IR study and the reported NMR and DSC studies [86, 151], it can be
concluded that the changes around 150 K are due to the hydrophobic chain in L-Leucine.
Thus, we see that there are definitive signatures of orientational changes at the
molecular level related to hydrogen bonding network and the hydrophobic chains of L-
Leucine which can cause preferred molecular re-arrangements and hydrogen bond
reorientations upon cooling. These molecular re-arrangements may further trigger the
structural phase transitions at low temperatures. However, similar molecular changes have
also been observed in other amino acids which may be the necessary but not sufficient
condition for the structural phase transitions to occur at low temperatures as the stability of
amino acids with respect to transitions depend upon several factors such as thermal pre-
history of the sample [83], size effect (sample particle size) [257], heating/cooling rates [80]
etc. For example, in L-Cysteine [(NH3)+CH(CH2SH)(COO)-] (orthorhombic, P212121 space
group), while DSC data did not provide signatures of phase transition, the lattice parameters
depicted subtle changes around 240 K, as shown by powder XRD studies [81]. Finally, the
neutron scattering technique suggested a dynamical transition around 150 K (in picosecond to
nanosecond time scale range), whereas Raman scattering provided information on weak S-H-
--S/ S-H---O hydrogen bonds [81, 83]. Adiabatic calorimetric studies were used to show
ordering of thiol groups at 70 K [82, 83] to be corroborated with signatures of transition at 30
K using single crystal XRD study[258].
However, in DL-cysteine single crystals (monoclinic, P21/a space group), a phase
transition was shown by DSC, XRD and Raman spectroscopy upon cooling down to 206 K
accompanied by the change in torsion angles (rotation of the side chain) and re-arrangement

Low Temperature Phase Transitions in L-Leucine
85
of the hydrogen bonds network [80]. The sample has been observed to show fragmentation
upon cooling in phase II. On slow heating in phase II, it shows reverse transition to ambient
phase at 305 K. When subjected to a second temperature cycle, the sample showed transition
at ~ 245-230 K temperature range upon fast cooling and in the 288-300 K range on reverse
heating to the ambient phase. Interestingly, the powder sample obtained by grinding the
single crystal of DL-Cysteine with size ~ 1 μm showed no phase transition upon cooling
down to 100 K, as suggested by spectroscopic, DSC and diffraction studies [257]. Similarly,
different dynamics were observed for L-serine and DL-serine [(NH3)+CH(CH2OH)(COO)-]
due to diverse hydrogen bonding response to cooling as inferred from inelastic neutron and
Raman scattering studies [84]. For L-serine, a transition was observed at ~ 140 K due to the
reorientational change in the –CH2OH side chain of the zwitterions and no transition was
observed for DL-serine [85].
Further, deuteration of sample although does not generally affect the nature of phase
transition, but it has also been shown to cause the changes in the phase transition
temperatures and also a different hydrogen bonding arrangement at varying thermodynamic
conditions. For example, in the simplest amino acid, α-glycine [NH3+CH2COO-], subtle
reorientational changes in the carboxyl moieties upon cooling, lead to change in the
hydrogen-bonding network at around 210 K and 180 K, with no structural phase transition at
low temperatures [251]. In deuterated α-glycine, opposite behavior of hydrogen bonds were
observed when cooled down to 180 K, below which similar strength of hydrogen bonds were
observed as that for the hydrogenated α-glycine [251]. In another simplest chiral amino acid,
L-alanine, low temperature studies showed changes around 220 K which has been attributed
to the Jahn-Teller effect [259]. This was observed due to the coupling of NH3 group with the
lattice modes which lead to lattice instability around 220 K, but no structural phase transition
was observed upon cooling. However, significant effects were observed on the strength of
Low Temperature Phase Transitions in L-Leucine
86
hydrogen bonds upon deuteration of L-alanine upon cooling [211]. The N-D covalent bond
lengths were elongated compared to N-H bond lengths, which causes notable increase in one
of the hydrogen bond lengths (D3---O2) that link the alanine molecules into columns.
Simultaneously, a new mode in the lattice region of the low temperature Raman spectra
around 170 K pointed towards a structural phase transition [211]. In the D-enantiomer of
alanine, i.e., D-alanine, a structural phase transition was observed upon cooling [260]. Low
temperature spectroscopic studies suggested change in the intensities of lattice modes and
appearance of new modes below 220 K [260]. The LT neutron powder diffraction (NPD)
study suggested diverse response of all the three different N-D covalent bonds for the D-
alanine, whereas in L-alanine, two of the three N-D stretching modes show similar behavior
[260]. This study also suggested different dynamics of hydrogen bonding network for L-
alanine and D-alanine due to different crystal packing at low temperatures.
Thus we see that different molecular units are activated at different temperature and
energy (time) scales which can be recorded using different techniques. This shows that
detection of phase transition parameters may also be a technique dependent observation. In
the case of L-Leucine, LT-FTIR spectroscopic studies have suggested changes around 240 K
due to rearrangement in the hydrogen bonding network, which is well supported by the
previous PMR, DSC and Raman studies [86, 153]. The change around 150 K are due to the
conformational and orientational changes in the hydrophobic chains and can be corroborated
with the PMR, DSC and neutron scattering results [86, 153]. Thus, in light of the conflicting
reports from powder and single crystal diffraction studies, we speculate that the case of L-
Leucine may be similar to that of α-glycine. In L-Leucine, preferred molecular reorientations
and strengthening of 2-D layered hydrogen bonds take place across 150 K and 240 K
respectively, which might result in subtle adjustment of the monoclinic angle observed in
powder diffraction studies. It is imperative that a concerted analysis of spectroscopic and
Low Temperature Phase Transitions in L-Leucine
87
high-resolution diffraction data on powder as well as single crystals of L-Leucine and other
amino acids as well as their deuterated analogues would be vital to understand the trend of
molecular motions and reaction pathways in such systems under varying conditions.
4.4. Summary
To summarize, the first systematic low temperature infrared spectroscopic study has been
reported on L-Leucine. Notable spectral changes observed at two temperatures of ~150 K and
~240 K provide evidences of phase transitions. The transition at 150 K is governed by the
hydrophobic chain where drastic changes in the FWHM of the torsional τ(C3C4) mode were
observed. The second transition at 240 K is associated with the hydrogen bond network
(between NH3+ and COO- entities). The weakening of hydrogen bonds along b-axis upon
lowering of temperature causes elongation along this direction, whereas a net compression,
and therefore strengthening of hydrogen bonds takes place along the approximate ~ a- and c-
directions. Hence, owing to stronger hydrogen bonds in the ac-plane below 240 K, compact
2-D layers are formed, which are well separated from each other in the b-direction. Thus, we
have observed definitive signatures of low temperature transitions at the molecular level in L-
Leucine, the mechanisms of which would be helpful in understanding the physico-chemical
properties of this important amino acid and harnessing its non-linear and pharmaceutical
applications.

Variable Temperature Studies on Metal-Organic Complex trans-PtCl2(PEt3)2
88
Chapter 5: Variable Temperature Studies on Metal-Organic
Complex trans-PtCl2(PEt3)2
5.1. Introduction
Metal-organic complexes have applications in the fields of catalysis [24], drug delivery [25-
30], gas storage [31, 32], and pharmacy [25, 32-35] due to their porous structure formed by
organic linkers, thus attracting researchers in the fields of materials science and crystal
engineering. The molecular geometry, metal-ligand bonding and directional supramolecular
architecture are among the most vital physical properties of metal-organic complexes, which
govern their applications and have direct correlation with their stereochemistry and lattice-
scale interactions. Since their discovery, there have been several efforts to tune their
structural properties by various methods in order to further improve/ optimize their
capabilities which have profound effect on their applications. This tuning can be performed
by modifying the size of the linking group, changing the metal salt to which linking (organic)
group is attached and by altering the experimental conditions like thermodynamic parameters.
Such changes cause modifications in the inter-atomic separations, which may sometimes lead
to phase transitions. In this regard, the platinum (II) coordination compounds with square
planar structure, which have wide range of applications, are ideal candidates to study the
effects of change in thermodynamic environment.
Among the structural isomers with different ligands [261], metal complexes
containing Phosphine (PR3) ligands have attracted considerable attention due to their
potential applications as catalysts and precursors in the synthesis of organic compounds in
pharmaceutical industry [161]. However, a thorough understanding of the microscopic
structure is essential to exploit their bonding and geometrical properties to realize useful
structural frameworks. The Pt(II) complex with phosphine ligand, i.e., PtCl2(PEt3)2, where Et

Variable Temperature Studies on Metal-Organic Complex trans-PtCl2(PEt3)2
89
is ethyl group (C2H5), exists in two isomeric structures, cis- and trans-. With bulkier groups
(PEt3) placed diagonally opposite to the central Pt atom, trans-isomeric structure is expected
to have less steric repulsion as compared to the cis-isomer where PEt3 groups lie on the same
side of the central atom. The studies carried out on thermodynamic equilibrium have
indicated more stability of cis-isomer compared to that of trans-PtCl2(PEt3)2[262]. The
interpretation of this remained ambiguous for several years, as the arguments, given for
higher stability of cis-isomer, based on higher degree of partial double bond character of
metal-ligand bonds [262, 263] were put to rest by the structural studies which showed
dominant single bond character of Pt-Cl, P-C and C-C bonds [264]. Nonetheless, it is
established that the strength of Pt-P bond is crucial to determine the structural stability of
these compounds, which depends on various factors like the substituent in the cis-position to
P, π-bonding etc. [264, 265]. Later, while Huheey et al. attributed the strength of Pt-P bond
(in M-PR3) to the back donation of charges from metal d orbitals to the 3d orbitals of P atom
[266], subsequent studies by Xiao et al. showed that the σ* antibonding orbitals of P-C
accommodate the back donation charges from the metal atom, owing to their lower energy
[267]. Since then, there have been lots of efforts to tune the π-back bonding properties for
synthetic transformation [268], change in the redox potential [269], and metal reactivity [270]
using chemical methods. Interestingly, a change in thermodynamic parameters provides the
cleanest way to understand the effects of change in inter-atomic distances and consequently
study the structural and bonding properties.
The structural tuning of trans- and cis-isomers of platinum II complexes is also of
interest in the pharmacological industry, as one of the oldest drugs showing anticancer
activity is cisplatin (PtCl2(NH3)2) with square planar structure, but has toxic effects. The
transplatin geometry, found unfavourable to interact with the DNA, primarily due to the
stereochemistry [163], is relatively less toxic; which led to the use of cis- and trans- isomeric

Variable Temperature Studies on Metal-Organic Complex trans-PtCl2(PEt3)2
90
combinations (cisplatin, oxaliplatin etc.) in chemotherapy [162]. The molecular structure and
symmetry of Pt(II)-complexes, which depend upon the ligands present, are also important to
determine the properties like photoluminescence quantum yield, and electroluminescence
efficacy in organic LED applications [158-160].
The present thesis presents detailed investigations on square planar Pt(II) complex
trans-PtCl2(PEt3)2 under varying thermodynamic environments, i.e., at low temperatures as
well as high pressure conditions. We first report the low temperature studies on this
compound in this chapter, which will be followed by high pressure investigations in the next
chapter. Owing to the presence of organic and halide groups at a short non-bonded distance
of ~ 2.7 Å at ambient conditions, it is also an interesting candidate to explore the possibility
of hydrogen bond assisted supramolecular architecture in dense phases. In addition, given the
importance of organic ligands in the structural stability, low temperature studies of metal
organic complexes are important in light of the reports that freezing of methyl groups is
associated with a dynamical phase transition [271].
In this chapter, low temperture studies on trans-PtCl2(PEt3)2 have been reported using
combined Fourier transform infrared (FTIR) and Raman spectroscopy in a wide spectral
range to understand the molecular structure. The results have also been compared with the
low temperature behavior of cis-PtCl2(PEt3)2, structural isomer of this compound.
5.2. Experimental details
For the comparative studies of these isomers (cis and trans), the low frequency region of the
Raman spectra of these isomers were recorded using Bruker MultiRAM FT-Raman
spectrometer. The sample was excited using 1064 nm Nd:YAG laser with 100 mW power.
LN2 cooled Ge detector was used to collect the radiation scattered from the sample. A total of
100 scans were recorded at a 1 cm-1 resolution in the 50-3600 cm-1 spectral range. The sample

Variable Temperature Studies on Metal-Organic Complex trans-PtCl2(PEt3)2
91
was mounted on the sample holder and was continously cooled using liquid nitrogen for low
temperature measurements. Variable infrared spectroscopic studies have been carried out on
the powder sample of trans-PtCl2(PEt3)2 from room temperature down to 4.2 K in the 140 –
3200 cm-1 spectral range. The in-situ LT-IR spectra were recorded using Bruker Vertex 80V
Fourier transform infrared spectrometer coupled with continous flow cryostat. FIR spectra
(140–650 cm-1) were measuredusing Hg source, Mylar beamsplitter and FIR-DTGS detector
at a resolution of 2 cm-1.The MIR spectra (500–3500 cm-1) measurements were carried out
using thermal source with KBr beamsplitter and LN2 cooled MCT detector at a resolution of
1 cm-1. The variable LT-Raman measurements were carried out using triple stage Raman
spectrograph (HORIBA JobinYvon’s T64000) equipped with LN2cooled CCD detector. The
data were recorded in the subtractive mode in the 10 – 3000 cm-1 spectral range at a
resolution of 4 cm-1. The temperature was varied using LINK control software in the system
controller from 300 K down to 77 K (THMS600 Linkam stage).
5.3. Molecular structure of trans-PtCl2(PEt3)2:
trans-PtCl2(PEt3)2 crystallize in a monoclinic structure with P21/n space group (No. 14)
[264]. The molecule has square planar geometry with centre of symmetry at the platinum
atom, which implies that the two chlorine atoms as well as two other PEt3 ligands are placed
diagonally opposite as shown in Figure 5.1.
The electronic configuration of Pt atom is [Xe] 4f14 5d9 6s1. In the square planar
structure, withPt2+ configuration, the outermost d8 orbitals become non-degenerate due to the
electrostatic field of ligands leaving the dx2
-y2 orbital empty, while other four d orbitals are
fully filled. In the coordinate bond between Pt and P atom, the lone pair from P is donated to
this empty orbital. In the ligand PEt3, 3p orbitals of phosphorous and p orbitals of all carbon
atoms attached to the P atom form bonding (σ) and antibonding (σ*) molecular orbitals.

Variable Temperature Studies on Metal-Organic Complex trans-PtCl2(PEt3)2
92
Figure 5.1: trans-PtCl2(PEt3)2 molecule with central Platinum atom (Silver), Chlorine atom (green),
Carbon atom (Grey) and Hydrogen atom (white).
While all bonding σ orbitals are completely filled, the antibonding σ* orbitals (possessing π
symmetry) are unoccupied. It is due to the relatively lower energy of σ* molecular orbitals of
P-C than the empty 3d orbitals of P atom that the electron density from the dxy orbital of the
platinum atom are back donated to σ*, which is known as π-back bonding (Figure 5.2).
Figure 5.2: Schematic of the bonding arrangements in the molecular units of trans-PtCl2(PEt3)2 (distances
and angles not to scale). The white orbitals along x&y axes correspond to dx2
-y2 (empty) and green
corresponds to dxy (filled) orbital of Pt. The lone pair of electron from P atom goes to empty dx2
-y2 orbital
of Pt (straight arrows) and the electron from dxy orbital of Pt goes to empty antibonding σ* orbital of P-C
(curved arrows).
(X)
(Y)

Variable Temperature Studies on Metal-Organic Complex trans-PtCl2(PEt3)2
93
Thus, the bonding of phosphine ligands to metal center consists of two important
components [272]. First is sigma donation from phosphorous to metal atom – forming the
coordinate bond and second is the π-back bonding – which also has an influence on the
strength of Pt-P bond [264, 272].
5.4. Results and discussion
5.4.1. Spectroscopic characterization at ambient conditions
The vibrational spectra (Raman and IR) of trans-PtCl2(PEt3)2 can broadly be divided in four
regions. In Figure 5.3a, the first region below 150 cm-1 contains lattice vibrations. The second
region 150 – 600 cm-1 consists of skeletal vibrations, i.e., stretching (Pt-Cl – 334 cm-1 and Pt-
P – 433 cm-1 ) and deformation modes δ(P-Pt-Cl) (155 cm-1), γ(P-Pt-Cl) (233 cm-1), δ(Pt-Cl2)
(167 cm-1) (γ - out of plane, δ - in plane bending) [273]. Third is the fingerprint region (600 –
1800 cm-1) of the ligands (triethylphosphine), i.e., their skeletal and deformation modes. The
assignments were carried out using reported vibrational mode assignments of
triethylphosphine, ethyl alcohol, metal (Pd, Ni, Pt etc.) complexes with trimethylphospine
and triethylphosphine ligands etc. [274-278]. In this region, the P-C stretching IR and Raman
modes are distinctly observed at 632 cm-1 and 643 cm-1 respectively, whereas the C-C
stretching region (~1000 cm-1) is relatively complex (Figure 5.3a and Figure 5.3b). The
modes observed between 700 and 800 cm-1 correspond to skeletal modes of PEt3 and CH2
rock, whereas C-CH3 rocking IR and Raman modes are observed at 1030 cm-1 and 1047 cm-
1respectively [276, 279]. Spectral range 1250 - 1500 cm-1 consists of CH2 wagging (IR –
1257 cm-1, Raman – 1243 cm-1), CH3 scissoring (IR – 1412 cm-1, Raman – 1421 cm-1) and
symmetric and asymmetric deformation modes of CH2 and CH3. The fourth spectral region
2800 – 3200 cm-1 shows the corresponding stretching modes. The symmetric stretching (νs)
modes lie at lower frequencies compared to the asymmetric (νas) ones. Thus, these modes are
observed at: νsCH3 – 2876 cm-1 (Raman), 2874 cm-1 (IR); νasCH3 – 2966 cm-1 (Raman), 2964

Variable Temperature Studies on Metal-Organic Complex trans-PtCl2(PEt3)2
94
cm-1 (IR); νsCH2 – 2913 cm-1 (Raman), 2914 cm-1 (IR); νasCH2 – 2941 cm-1 (Raman), 2930
cm-1 (IR), as shown in Figure 5.3a and Figure 5.3b [276].
Figure 5.3: (a) FT-Raman and (b)FT-IR spectra of trans-PtCl2(PEt3)2 at ambient conditions. γ – out of
plane bend, δ – in-plane bend, νs– symmetric stretch, νas – asymmetric stretch, ω – wagging, das –
asymmetric deformation, ds – symmetric deformation.
5.4.2. Low temperature Spectroscopic Studies
The changes associated with the metal – ligand bonds and hence the crystal symmetry can be
probed by studying the lattice and skeletal vibrational modes which are generally observed in
the low frequency regions of the infrared (IR)/ Raman spectrum. Our preliminary Low
temperature-FT Raman study on the structural isomers of this compound (cis- and trans-) at
two temperatures of 300 K and 77 K in the spectral range 60 – 600 cm-1 showed drastic
alterations in the skeletal Raman modes of trans-isomer upon cooling as shown in Figure
5.4(Right), whereas relatively no change was detected in the spectrum of cis-isomer as shown
in Figure 5.4. In the Raman spectra of cis-isomer, blue shifting and increased sharpness of the
vibrational modes are the only features which are clearly visible in the spectrum upon

Variable Temperature Studies on Metal-Organic Complex trans-PtCl2(PEt3)2
95
cooling. Except these features, there are no major changes in the two spectra and the lattice
region also remains intact. However, in the trans-isomer, the low temperature spectra show
significant changes, which have been systematically studied and presented in the following
sections.
Figure 5.4: (Left to Right) FT-Raman spectra of trans-PtCl2(PEt3)2 in the region 50-460 cm-1. New peaks
emerged at low temperature have been marked as asterisk (*).
a) Temperature dependent IR and Raman studies of Lattice and Skeletal
vibrationa l modes:
Figure 5.5 represents Raman and IR spectra of trans-PtCl2(PEt3)2 in the frequency regions
below 200 cm-1. Figure 5.6a represents low temperature Raman spectra in the 200 – 640 cm-1
spectral range and Figure 5.6b represents the Raman peak positions versus temperature plots
in the 10 – 650 cm-1 spectral range. Figure 5.7a represents low temperature IR spectra in the
200 – 650 cm-1 spectral range and Figure 5.7b represents the IR peak positions versus
temperature plots in the 160 – 640 cm-1 spectral region for trans-PtCl2(PEt3)2. In the Raman
spectra, the lattice modes at 20 and 23 cm-1 show initial softening upto 173 K, followed by

Variable Temperature Studies on Metal-Organic Complex trans-PtCl2(PEt3)2
96
Figure 5.5: Low temperature spectra of trans-PtCl2(PEt3)2 (a) Raman (spectral range : 5-220 cm-1) and (b)
IR (spectral range : 140-220 cm-1) spectra.
stiffening up to 133 K as shown in Figure 5.5a and Figure 5.5b. Also, at temperatures close to
130 K, a sudden increase in intensity of lattice modes is observed as shown in Figure 5.5a.
Below this temperature, the peak positions as well as intensities do not show any appreciable
changes (Figure 5.5a and Figure 5.6b). New modes also appear in the Raman spectra at ~ 71
and 147 cm-1 across 180 K and 130 K respectively, which stiffen upon cooling (marked with
* in Figure 5.5a). Similarly, in the IR spectra, a weak feature is also observed to be emerging
at ~ 147 cm-1 across 130 K (Figure 5.5b). Among the skeletal modes, the δ(Pt-Cl2) Raman as
well as IR modes at 165 and 167 cm-1 respectively remain almost unaltered with temperature
(Figure 5.5,Figure 5.6b,Figure 5.7b). The broad band in the IR spectra which spans the region
150 – 200 cm-1 is completely resolved upon cooling down to 180 K and transforms to four
clear peaks at further lower temperatures (Figure 5.5b). The deformation mode γ(P-Pt-Cl),
which is observed at 233 and 228 cm-1 in the Raman and IR spectra respectively initially
shows systematic stiffening upon cooling down to 130 K (Figure 5.6b and Figure 5.7b

Variable Temperature Studies on Metal-Organic Complex trans-PtCl2(PEt3)2
97
respectively). These peak positions reach a plateau at nearly 130 K, beyond which they do
not show any shift. However, a new mode is clearly seen to appear around 250 cm-1 in the IR
spectra below 130 K (marked with * in Figure 5.7a), which strengthens at lower
temperatures. The IR and Raman modes corresponding to ν(Pt-Cl) (341 and 329 cm-1
respectively) and ν(Pt-P) (417 and 429 cm-1 respectively) stretching vibrations show small
but monotonous stiffening upon cooling, with a small change in the rate of variations across
130 K, up to the lowest temperature measured, implying systematic strengthening of the
skeletal bonds (Figure 5.7b and Figure 5.6b respectively).
Figure 5.6: (a) Low temperature Raman spectra of trans-PtCl2(PEt3)2 in the 210 – 650 cm-1 region. (b)
Variation of Raman active modes at low temperatures in the 10 – 650 cm-1 spectral range. Dotted vertical
lines are drawn at 130 and 180 K. Open circles represent new mode emerging at low temperatures.
Symbols: δ = in-plane bending, γ = out-of-plane bending, and ν = stretching vibration.

Variable Temperature Studies on Metal-Organic Complex trans-PtCl2(PEt3)2
98
The shoulder (333 cm-1) developing on the lower frequency side of the νas(Pt-Cl) (asymmetric
stretching) IR mode transforms to a clear peak below 180 K and it softens upon further
cooling (Figure 5.7a).
Figure 5.7: (a) Low temperature IR spectra of trans-PtCl2(PEt3)2 in the 220 – 650 cm-1 spectral region.
Dashed lines indicate new peaks emerging at low temperatures. (b) Variation of IR peak positions at low
temperatures in the 160 – 640 cm-1 spectral range. Dotted vertical lines are drawn at 130 and 180 K. Open
circles represent new modes appearing upon cooling.
In the phosphine ligand, the ν(P-C) IR mode at 634 cm-1 shows an increase in the rate
of stiffening (~ 0.028 cm-1/K below 180 K) upon cooling below 180 K with a new shoulder
appearing on the low frequency side (~ 633 cm-1 at 180 K), which shows small softening
upon cooling, as shown in Figure 5.7a. The ν(P-C) Raman mode at 632 cm-1 shows stiffening
behavior upon cooling in the 173-133 K temperature range (Figure 5.6b). Across 130 K, it
shows discontinuous shift to a higher value. Further, most of the vibrational modes in the
region 10 – 650 cm-1 show slope change in the frequency versus temperature plots across 180

Variable Temperature Studies on Metal-Organic Complex trans-PtCl2(PEt3)2
99
K and 130 K. In summary, the features like appearance of new modes in the lattice and
skeletal regions, abrupt changes in the rate of variation of frequencies and change in the
relative intensity of some vibrational modes in the low frequency regions of infrared and
Raman spectra are clear indications of phase transition in trans-PtCl2(PEt3)2 across 180 K and
130 K. The changes occurring in the organic ligands groups can provide further insights into
the nature of these transitions.
b) Changes associated with organic ligands – IR and Raman deformation modes:
The internal vibrational modes of the organic ligands are also expected to show similar
changes under temperature induced contraction [280]. Indeed, the systematic IR spectra at
various temperatures in the range 4.2 – 300 K, shown in Figure 5.8 and Figure 5.9 reveal that
the orientational changes associated with the organic ligand groups take place at temperatures
of 180 and 130 K. The IR spectral region 700 – 800 cm-1 (skeletal modes of PEt3 and CH2
rock), becomes complex upon cooling due to splitting and appearance of new modes across
180 K and 130 K as shown in Figure 5.8a. A new mode also appears around 1003 cm-1 (near
ν(C-C) IR mode) below 180 K which softens and shows a large increase in the relative
intensity upon cooling, as shown in Figure 5.8a. The C-CH3 rocking IR mode at 1032 cm-1
stiffens in the 180 – 130 K temperature range, with the appearance of new shoulder (~1030
cm-1) on its lower frequency side below 180 K. This new mode softens with an increase in the
relative intensity upon cooling upto 4.2 K as shown in Figure 5.8a and Figure 5.8b. Below
130 K, these modes show no change upon lowering the temperature. In addition to the similar
changes as in IR spectra, the distinctive feature in the Raman spectra in this region is the
sudden increase in the relative intensity of C-CH3 rocking mode at 1055 cm-1 across 173 K,
shown in Figure 5.8a inset.

Variable Temperature Studies on Metal-Organic Complex trans-PtCl2(PEt3)2
100
Figure 5.8:(a) Low temperature IR spectra of trans-PtCl2(PEt3)2 in the 700 – 1070 cm-1 spectral range.
Dashed lines indicate new peaks evolving at low temperatures, Inset: Low temperature Raman spectra in
the 1030 – 1070 cm-1 spectral range. (b) Variation of IR peak positions at low temperature in the 670 –
1050 cm-1 spectral region. Dotted vertical lines are drawn at 130 and 180 K. Open circles represent new
modes emerging at low temperatures.
In the 1250 – 1500 cm-1 spectral range, the band lying in the region of asymmetric
deformation vibrations of CH3 unit (1450 – 1500 cm-1) shows splitting below 180 K in both
IR and Raman spectra (Figure 5.9a). The wagging IR mode ω(CH2) at 1260 cm-1 stiffens
upon cooling upto 130 K as shown in Figure 5.9. The symmetric deformation ds(CH3) (~1260
cm-1) and asymmetric deformation das(CH3) (~1450 cm-1) IR modes soften upon cooling upto
130 K, with the appearance of a new mode on the lower wavenumber side of ds(CH3) below
180 K as shown in Figure 5.9a and Figure 5.9b. Upon further lowering the temperature below
130 K, these modes show no variation. The CH2 scissoring mode (~ 1413 cm-1) shows a
relatively large rate of stiffening (~ 0.020 cm-1/K) compared to other modes upto 130 K and
below this temperature it shows no variation as shown in Figure 5.9b. This spectral region

Variable Temperature Studies on Metal-Organic Complex trans-PtCl2(PEt3)2
101
becomes complex upon cooling due to splitting of several modes. A drastic increase in the
intensity of modes, which otherwise are weak at ambient conditions, has been observed at
Figure 5.9: (a) Low temperature IR spectra of trans-PtCl2(PEt3)2 in the 1220 – 1480 cm-1 spectral range.
Dashed lines indicate new peaks evolving at low temperatures. Inset: Low temperature Raman spectra of
trans-PtCl2(PEt3)2 in the 1400 – 1500 cm-1 spectral range. (b) Variation of IR peak positions at low
temperatures in the 1250 – 1475 cm-1. Open circles represent new modes evolving at low temperatures.
Symbols: ⍵ = wagging, ds = symmetric deformation, das = asymmetric deformation vibration.
low temperatures. Hence, both the IR and Raman spectra in lattice/ skeletal as well as ligand
deformation regions show marked changes across 180 K and 130 K, which can be related to
temperature induced phase transitions in trans-PtCl2(PEt3)2. The stretching vibrational modes
may further provide important information on the hydrogen bonding network in the structure
in the low temperature phase.

Variable Temperature Studies on Metal-Organic Complex trans-PtCl2(PEt3)2
102
5.4.3. Probing Hydrogen bonds through stretching vibrational modes
The ligand stretching region 2850 – 3050 cm-1 is particularly important, as it provides
information on weak non-covalent interactions like hydrogen bonds formed, via, C-H groups.
At ambient conditions, trans-PtCl2(PEt3)2 forms two short H---Cl hydrogen bonds. One is
intramolecular hydrogen bond with H---Cl = 2.719 Å, C---Cl = 3.328 Å and
CHCl=114.37and the other is intermolecular hydrogen bond with H---Cl = 2.657 Å, C---
Cl = 3.684 Å and CHCl = 155.66 [166]. At low temperatures, the symmetric and
asymmetric IR stretching vibrational peaks of CH3 group (2874 cm-1 and 2963 cm-1
respectively) show small softening in the 300 – 4.2 K temperature range, with a noticeable
increase in the rate of softening in 180 – 130 K temperature range, as shown in Figure 5.10b.
Figure 5.10: (a) Low temperature IR spectra of trans-PtCl2(PEt3)2 in the 2850 – 3050 cm-1 spectral range.
(b) Variation of IR modes at low temperature in the 2860 – 2970 cm-1 spectral range. Open circle symbol
represent new mode emerging at low temperatures. Symbols: νs = symmetric stretch, νas = asymmetric
stretch.

Variable Temperature Studies on Metal-Organic Complex trans-PtCl2(PEt3)2
103
A new shoulder peak emerges close to the asymmetric stretching mode, showing a similar
behavior (softening at ~ -0.100 cm-1/K) and intensification relative to other modes in the 180-
130 K temperature range as shown in Figure 5.10a and b. The softening behavior of CH3
symmetric and asymmetric stretching modes in the 180 – 130 K temperature range are also
verified from the Raman spectra (2875 cm-1 and 2962 cm-1 respectively) shown in Figure 8b.
The CH2 symmetric and asymmetric IR (2914 cm-1 and 2931 cm-1 respectively) and Raman
(2913 cm-1 and 2941 cm-1 respectively)stretching modes show comparatively less changes in
the complete range, except for small discontinuous shifts across 130 K (Figure 5.10b and
Figure 5.11b). These observations imply preferred strengthening of the C-H---Cl hydrogen
bonds through CH3 groups in trans-PtCl2(PEt3)2 in the low temperature phase between 180 –
130 K temperature range.
Figure 5.11: (a) Low temperature Raman spectra of trans-PtCl2(PEt3)2 in the 2850 – 3000 cm-1 spectral
region. (b) Variation of Raman modes in the 2860 – 2990 cm-1 spectral region at low temperature. Open
circle symbol represents new mode emerging upon cooling.

Variable Temperature Studies on Metal-Organic Complex trans-PtCl2(PEt3)2
104
Thus, based on the spectroscopic observations in the complete frequency range, upon
cooling trans-PtCl2(PEt3)2, most of the vibrational modes show change in slope around two
temperatures at 180 K and 130 K. The changes around 180 K are associated with the
orientational dynamics of organic ligands (phosphine triethyl), which initiate strengthening of
C-H---Cl hydrogen bonds through CH3 groups upto 130 K. Across 130 K, appearance of new
modes as well as drastic increase in the intensity of some modes is observed. Finally, at
further low temperatures down to 4.2 K, no new features or intensity/ peak position variations
are noticed. In the skeletal modes, small changes are observed in the frequency variations of
Pt-Cl deformation modes, whereas no significant effect is noticed in the stretching modes.
5.5. Summary
In summary, low temperature infrared and Raman spectroscopic studies have been carried out
on cis- and trans- isomers of Pt(II) complex PtCl₂(PEt₃)₂. The cis-isomer is not much
affected due to the temperature change, whereas the trans-isomer indicates lowering of
structural symmetry upon cooling. Therefore, systematic low temperature studies have been
carried on trans-PtCl2(PEt3)2 using complementary FTIR and Raman spectroscopic
techniques, which show significant variations in the vibrational modes associated with
organic ligand moieties across 180 K and 130 K. An increase in the C-H---Cl hydrogen
bonding strengths, associated with CH3 groups, is noticed in the intermediate temperature
range of 180 – 130 K. Softening of the lattice modes and appearance of new Raman modes in
the lattice region across 180 K and 130 K provide a clear indication of phase transitions in
this compound.

High Pressure Phase Transitions in trans-PtCl2(PEt3)2
105
Chapter 6: High Pressure Phase Transitions in trans-PtCl2(PEt3)2
6.1. Introduction
Similar to the low temperature behavior, the metal organic complex trans-PtCl2(PEt3)2 shows
a range of structural re-arrangments under high pressure, which have been presented in this
chapter. However, interestingly, the high pressure structure is different from the low
temperature structure.
6.1.1. Importance of high pressure studies in metal-organic coordination compounds
Tuning of molecular and electronic properties of Pt(II)-organic complexes have a profound
effect on their applications. Such alterations can be achieved externally by varying the
thermodynamic parameters such as pressure/temperature etc. which may also bring about
phase transitions. Interestingly, a change in thermodynamic parameters provides the cleanest
way to understand the effects of change in inter-atomic distances and consequently the
structural and bonding properties, of which pressure is the most effective tool. Further, a
change in inter-atomic distances is also closely associated with the tuning of non-covalent
interactions, which might result in novel structural assemblies, like lamellar, stitched stair-
case, helical etc. as observed for some other square planar coordination complexes [281].
Though both high pressure and low temperature result in compression/ contraction of
the system, the mechanism of possible phase transitions or structural relaxations in the square
planar metal-organic complexes may be similar or different [43-45]. For example, in the
complex [(CH2)3NH2][Zn(HCOO)3], phase transitions have been observed at low temperature
as well as high pressure due to the ring-puckering motion of the cationic groups and the
framework rearrangement resulting from rotations of the HCOO - ions respectively [282]. In
contrast, the compound trans-Pt(II) dithiocarbamate, which shows small variations in metal-

High Pressure Phase Transitions in trans-PtCl2(PEt3)2
106
ligand stretching Raman modes and no variations in deformation modes at low temperatures,
depicts drastic and different pressure induced changes, where a large variation of the
deformation Raman modes was noted as compared to the stretching modes [283, 284].
Tidey et al. have recently reported a useful review on the high pressure properties of
several coordination compounds, in particular geometrical changes occurring up to 10 GPa,
which in turn can be associated with properties like negative linear compressibility, spin
cross-over, magnetism, and molecular conduction [285]. Among the Pt(II) compounds, high
pressure studies on the molecular wires [Pt(dmg)2] and [Pt(dpg)2] (where, dmg =
dimethylglyoximate, and dpg = diphenylglyoximate) showed that the electrical and optical
properties can be tuned by changing the Pt---Pt distance [286-288]. However, the simple
square planar compound trans-PtCl2(dimethylsulfide)2, shows no phase transition up to 8
GPa with monotonous increase in the monoclinic β angle [289]. It is noteworthy that the
compound under study, i.e., trans-PtCl2(PEt3)2 has shown significant changes in the Raman
spectra upon cooling up to 77 K in contrast to no drastic spectral changes in cis-PtCl2(PEt3)2
as described in the previous chapter of this thesis. Also, the presence of organic and halide
groups at a short non-bonded distance of ~ 2.7 Å at ambient conditions, makes it an
interesting candidate to explore the possibility of hydrogen bond assisted supramolecular
architecture. Prompted with these two ideas, detailed high pressure studies have been carried
out on the square planar compound trans-PtCl2(PEt3)2 using combined infrared (up to 11.3
GPa), Raman (up to 15.4 GPa), x-ray diffraction (up to 16.9 GPa) and density functional
theory (DFT) techniques to probe the molecular as well as structural modifications. The
results obtained have provided unambiguous evidences of pressure induced phase transition
to a non-centrosymmetric structure which is stabilized by a three dimensional network of C-
H---Cl hydrogen bonds, thus laying out the possibilities of tuning the local metal coordination

High Pressure Phase Transitions in trans-PtCl2(PEt3)2
107
environment as well as non-covalent interactions in square planar metal-organic coordination
compounds.
6.2. Experimental methods
6.2.1. Single Crystal and Powder X-ray Diffraction studies
Single crystal x-ray diffraction pattern of trans-PtCl2(PEt3)2 was recorded at ambient
conditions at BL21 (PX) beamline at Indus-2 Synchrotron, India [290]. The data were
recorded on the MARdtb with automated sample changer, having a single-axis rotation
goniometer and CCD detector (Rayonix MX-225) using monochromatic x-rays of
wavelength 0.9794 Å. The structure file of the above measurement is available at Cambridge
Crystal Data Centre (CCDC number 1829359). Powder x-ray diffraction data at high
pressures were collected at Indus-2, BL-11, Indore, India, using monochromatic x-rays of
wavelength 0.7265Å [291]. High pressures were generated using Mao-Bell type of diamond
anvil cell [292] using diamond anvils of culet size ~ 400 µm. Sample chamber was prepared
by drilling hole of diameter ~ 250 µm in a steel gasket of thickness 250 μm pre-indented to a
thickness of 90 μm. Finely ground sample of trans-PtCl2(PEt3)2 was loaded in this hole along
with 4:1 methanol:ethanol solution as pressure transmitting medium (PTM) and Cu as
internal pressure marker. The well-known equation of state of Cu under static compression
was used to determine pressure at the sample [293]. Monochromatic x-rays were focused
down to 0.1 X 0.1 mm2 at sample position. 2D diffraction images at different pressures were
collected using MAR345 imaging plate detector and converted to 1D diffraction patterns
using Fit2D software [294] which were subsequently analysed through Rietveld refinement
incorporated in GSAS II software [295].

High Pressure Phase Transitions in trans-PtCl2(PEt3)2
108
6.2.2. Infrared spectroscopic studies
The high pressure infrared studies on trans-PtCl2(PEt3)2 were carried out using indigenously
designed Diamond anvil cell (DAC) mounted on Hyperion 2000 IR microscope coupled to
Bruker Vertex 80V Fourier transform infrared spectrometer. These constitute parts of infrared
beamline (BL-6) facility at Indus-1, India. Powder sample dispersed in CsI, along with tiny
ruby chips, was loaded into a 150 µm hole of a tungsten gasket pre-indented to a thickness of
60 µm. The IR transparent matrix of CsI also served as the pressure transmitting medium. A
total of 100 scans were co-added at a resolution of 2 cm-1 and the repeat measurements were
carried out at 4 cm-1 at each pressure in the spectral range 600 to 3600 cm-1. Ruby
fluorescence was measured at each pressure for pressure calibration [296]. Gaussian fit of the
peaks were carried out for spectral deconvolution.
6.2.3. Raman spectroscopic studies
The high pressure Raman spectra were recorded on triple stage Raman spectrograph
(HORIBA Jobin Yvon’s T64000) equipped with LN2 cooled CCD detector. The Raman
signal was excited by 532 nm diode pumped solid state laser. The spectra were recorded in
the range of 15 – 3200 cm-1 in the subtractive mode, at a resolution of 4 cm-1. Finely ground
sample of trans-PtCl2(PEt3)2 crystal along with tiny chips of ruby was loaded into a tungsten
gasket in a hole of ~ 120 µm diameter drilled in pre-indented gasket (60 µm) without PTM
[68, 199, 297, 298].
6.2.4. First-principles calculations
The electronic structure calculations on trans-PtCl2(PEt3)2 were performed using spin-
polarized plane wave based density functional theory (DFT) at 0 K as implemented in Vienna
Ab-intio Simulation Package (VASP) [299, 300]. The electron ion interactions were
described by Projector Augmented Wave (PAW) [301] formalism which includes Pt (s1d9),

High Pressure Phase Transitions in trans-PtCl2(PEt3)2
109
Cl (s2p5), P (s2p3), C (s2p2) and H (s1) valence states. The exchange-correlation potential as
parameterized using Perdew-Burke-Ernzerhof (PBE) [302] form within the generalized
gradient approximation (GGA) was used. The unit cell of trans-PtCl2(PEt3)2 structure
contains 94 atoms and the integration over the Brillouin zone was carried out on a 7×3×3 k-
point mesh (22 k-points in the irreducible Brillouin zone) generated using the Monkhorst–
Pack scheme [303]. A cutoff energy (Ecutoff) of 400 eV for the plane wave basis set was used
and the above choice of Ecutoff and k-point mesh was sufficient for energy convergence to less
than 0.1 meV/atom. The initial atomic coordinates for optimization of the ambient structure
were taken from our single crystal x-ray diffraction experiment at ambient conditions. The
total energy of trans-PtCl2(PEt3)2 unit cell was optimized with respect to volume, shape and
atomic positions as permitted by the space group symmetry of the crystal structure. The
structural relaxation was performed using the conjugate gradient algorithm until the residual
forces and stresses in the equilibrium geometry were of the order of 0.01 eV/Å and 0.01 GPa,
respectively. The final calculation of total electronic energy were performed using the
tetrahedron method with Blöchl corrections [301].
6.3. Results and Discussion
6.3.1. Structural study at ambient conditions
As the ambient structural parameters of trans-PtCl2(PEt3)2, reported in 1966 [264], show
some ambiguity in the ligand structures, synchrotron based x-ray diffraction studies have
been carried out on the single crystal of this compound. trans-PtCl2(PEt3)2 has been reported
to crystallize in a monoclinic structure with P21/n (Space Group No. 14) space group [264] (a
setting of the space group P21/c) as shown in Figure 6.1. The refinement details are presented
in Table 6.1.The refined lattice parameters at ambient conditions are found to be a =
10.9937(7) Å, b = 11.5227(10) Å, c = 7.4499(5) Å, β = 93.302(6)°, which are in close
agreement with the earlier reported values [264].

High Pressure Phase Transitions in trans-PtCl2(PEt3)2
110
Figure 6.1: Unit cell of trans-PtCl2(PEt3)2, where Et = C2H5. Color: Grey – Pt, Green – Cl, Violet – P,
Brown– C, Pink – H atoms.
The non-bonded Pt-Pt distance at ambient conditions is ~ 7 Å. In addition, the present study
also provides precise atomic coordinates and structural parameters for this compound at
ambient conditions as shown in Table 6.2. However, the positional refinement of hydrogen
atoms (not available in literature as well) was not good using the experimental data. As these
may enable finer investigations of inter-atomic interactions like hydrogen bonding, the
hydrogen atoms were initially generated using ‘Avogadro’ software package
(https://avogadro.cc/) and the structure was optimized using DFT with the initial structure
obtained from our single crystal studies. The theoretically optimized equilibrium atomic
positions at ambient pressure, including the Wyckoff positions of hydrogen atoms, have also
been presented in Table 6.2. The ambient lattice parameters obtained using powder x-ray
diffraction of trans-PtCl2(PEt3)2 measured inside the diamond anvil cell, as shown in Figure
6.2, are also consistent with the single crystal studies. From Rietveld refinement using GSAS-
II software, the values are found to be a = 11.0048(15) Å, b = 11.5167(11) Å, c = 7.4802(07)
Å, β = 93.483(9)°. These studies were then extended to find the structural details at higher
pressures.

High Pressure Phase Transitions in trans-PtCl2(PEt3)2
111
Figure 6.2: Ambient powder XRD pattern of trans-PtCl2(PEt3)2 inside the DAC. Inset shows the picture of
2D diffraction rings
Table 6.1: Crystal structure data and refinement details of single crystal x-ray diffraction of trans-
PtCl2(PEt3)2 at ambient conditions.
Empirical formula C12H30P2Cl2Pt
Formula weight 472.06
Temperature (K) 300
Crystal system, Space group Monoclinic, P21/n
a, b, c (Å) 7.4499(5), 11.5227(10), 10.9937(7)
α,β,γ (°) 90, 93.302(6), 90
Volume(Å3) 942.17(12)
Z 2
ρcalc (g/cm3) 1.7705
μ/mm-1 12.061
F(000) 475.3
Crystal size (mm3) 0.1 × 0.2 × 0.2
Radiation synchrotron (λ = 0.9794 Å)
2Θ range for data collection (°) 10.14 to 65.18
Index ranges -7 ≤ h ≤ 7, -10 ≤ k ≤ 10, -11 ≤ l ≤ 11
Reflections collected 6786
Independent reflections 1091 [Rint = 0.1368, Rsigma = 0.0562]
Goodness-of-fit on F2 1.032
Final R indexes [I>=2σ (I)] R1 = 0.0484, wR2 = 0.1702
Final R indexes [all data] R1 = 0.0505, wR2 = 0.1601
Largest diff. peak/hole / e (Å-3) 1.26/-1.61

High Pressure Phase Transitions in trans-PtCl2(PEt3)2
112
Table 6.2: Experimental (ambient pressure – reported (column 2) and this study (column 3)) atomic
coordinates and lattice parameters of trans-PtCl2(PEt3)2 [P21/n (14) – space group]. The experimentally
obtained structure has been submitted to CCDC (1829359) by including H-atoms refined using the riding
model. To further improve structure with H-atom positions, DFT-GGA calculated (at ambient pressure)
equilibrium atomic positions have also been provided in the last column, obtained by including hydrogen
atoms and optimizing single crystal XRD deduced experimental coordinates, the uncertainty in unit cell
volume is found to be ~ 5% . *Note: In this table, axes transformation of the single crystal structure,
which has been deposited at CCDC after including H-atoms, have been carried out using PCW software
for consistency in lattice parameter convention (a and c) with the reported values [264].
Atom
(wyckoff positions)
Experimental positions [264] Experimental position (this
study) (single crystal X-ray diffraction) (without H
atoms)
Equilibrium atomic
positions optimized using DFT-GGA calculations (this
study) Pt (2a)
Cl (4e) P (4e) C 1 (4e)
C 2 (4e) C 3 (4e)
C 4 (4e) C 5 (4e) C 6 (4e)
H 1 (4e) H 2 (4e)
H 3 (4e) H 4 (4e) H 5 (4e)
H 6 (4e) H 7 (4e)
H 8 (4e) H 9 (4e) H 10(4e)
H 11(4e) H 12(4e)
H 13(4e) H 14(4e) H 15(4e)
0.5000 0.5000 0.5000
0.6980 0.4549 0.4604 0.4295 0.3314 0.3676 0.3024 0.3623 0.1814
0.3581 0.4299 0.0675 0.3848 0.2393 0.6155
0.4460 0.1930 0.5425 0.5391 0.2797 0.2040 0.5076 0.1158 0.1829
0.0000 0.0000 0.0000
0.7001 0.4539 0.4593 0.5705 0.6687 0.6373 0.4556 0.7547 0.7441
0.4970 0.8763 0.8120 0.8578 0.2628 0.0251
0.3054 0.3508 0.1870 0.5424 0.8050 0.3250 0.3330 0.4338 0.0460
0.0000 0.0000 0.0000
0.7054 0.4531 0.4666 0.5703 0.6709 0.6399 0.4530 0.7596 0.7483
0.4926 0.8819 0.8047 0.8607 0.2656 0.0323
0.3055 0.3479 0.1792 0.5459 0.8087 0.3168 0.3351 0.4350 0.0268
0.4174 0.9267 0.8730 0.5740 0.8828 0.9019
0.5154 0.9339 0.6820 0.3727 0.7605 0.6482 0.4230 0.7096 0.8695
0.2823 0.2618 0.1202 0.2256 0.3773 0.2555
0.3527 0.5211 0.0881 0.4167 0.4102 0.9508 0.2585 0.4430 0.9211
0.4752 0.8639 0.3765 0.5922 0.8600 0.2117
0.4979 0.7358 0.2457 0.8143 0.3384 0.9581 0.7887 0.2132 0.0950
Lattice parameters
a (Å) b (Å)
c (Å) β (°) Volume (Å3)
11.00±0.02 11.52±0.02
7.49±0.01 93°0’±15’ 947.832
10.9937(7)* 11.5227(10)
7.4499(5)* 93.302(6) 942.17(12)
10.861 11.541
7.134 92.796 893.158

High Pressure Phase Transitions in trans-PtCl2(PEt3)2
113
6.3.2. Pressure induced phase transition
6.3.2.1. Spectroscopic studies:
Figure 6.3 and Figure 6.4 show the high pressure Raman spectra of trans-PtCl2(PEt3)2 in 20 –
300 cm-1 and 320 – 780 cm-1 regions, respectively. The high pressures IR spectra in the
region 600 – 1100 cm-1 and 1100 – 3200 cm-1 have been shown in Figure 6.5 and Figure 6.6b
respectively, whereas the Raman spectra in the region 720 – 3200 cm-1 at various pressures
are plotted in Figure 6.6a. The pressure induced variations in the peak positions of IR and
Raman active modes have been shown in Figure 6.7, Figure 6.8 and Figure 6.4c. The
spectroscopic studies, depicting various changes in spectral features, viz., emergence of new
modes, and change in the rate of variation of vibrational modes are suggestive of structural
modifications taking place at pressures up to ~ 0.9 GPa and ~ 4.9 GPa, as explained below.
We observe discontinuous shift in the peak positions of lattice modes (Figure 6.4c)
across ~ 0.9 GPa and ~ 4.9 GPa, accompanied with emergence of new modes, for example at
~ 32 cm-1 as shown by an asterisk (*) in Figure 6.3. In fact, the mode lying at higher
frequency side of this mode (at ~ 30 cm-1) also seems to emerge only above 0.6 GPa,
however, the spectral data at still lower frequencies could not be obtained to trace its origins.
These features are a clear indication of change in the crystalline structure upon
compression. The evolution of molecular skeletal region under high pressure supports this
possibility. In the skeletal region of such centro-symmetric compounds, the symmetric
stretching (νs) Raman mode appears with significantly higher intensity compared to the
asymmetric stretching mode (νas) and vice versa in the IR spectrum [278]. Therefore, in
trans-PtCl2(PEt3)2, the single intense Raman band at 334 cm-1 at ambient pressure
corresponds to the νs(Pt-Cl) mode (Figure 5.3a of chapter 5). The corresponding νas(Pt-Cl)
mode is observed at ~ 339 cm-1 in the IR spectrum, i.e., at ~ 5 cm-1 higher value [273]. As
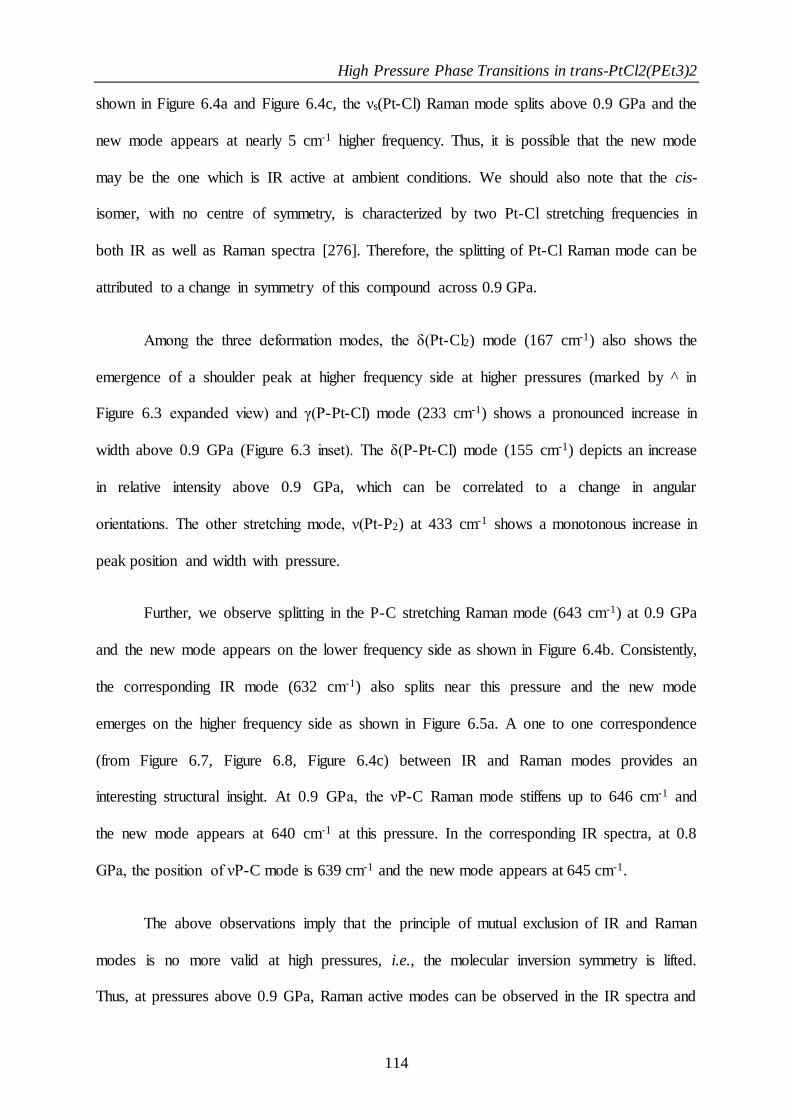
High Pressure Phase Transitions in trans-PtCl2(PEt3)2
114
shown in Figure 6.4a and Figure 6.4c, the νs(Pt-Cl) Raman mode splits above 0.9 GPa and the
new mode appears at nearly 5 cm-1 higher frequency. Thus, it is possible that the new mode
may be the one which is IR active at ambient conditions. We should also note that the cis-
isomer, with no centre of symmetry, is characterized by two Pt-Cl stretching frequencies in
both IR as well as Raman spectra [276]. Therefore, the splitting of Pt-Cl Raman mode can be
attributed to a change in symmetry of this compound across 0.9 GPa.
Among the three deformation modes, the δ(Pt-Cl2) mode (167 cm-1) also shows the
emergence of a shoulder peak at higher frequency side at higher pressures (marked by ^ in
Figure 6.3 expanded view) and γ(P-Pt-Cl) mode (233 cm-1) shows a pronounced increase in
width above 0.9 GPa (Figure 6.3 inset). The δ(P-Pt-Cl) mode (155 cm-1) depicts an increase
in relative intensity above 0.9 GPa, which can be correlated to a change in angular
orientations. The other stretching mode, ν(Pt-P2) at 433 cm-1 shows a monotonous increase in
peak position and width with pressure.
Further, we observe splitting in the P-C stretching Raman mode (643 cm-1) at 0.9 GPa
and the new mode appears on the lower frequency side as shown in Figure 6.4b. Consistently,
the corresponding IR mode (632 cm-1) also splits near this pressure and the new mode
emerges on the higher frequency side as shown in Figure 6.5a. A one to one correspondence
(from Figure 6.7, Figure 6.8, Figure 6.4c) between IR and Raman modes provides an
interesting structural insight. At 0.9 GPa, the νP-C Raman mode stiffens up to 646 cm-1 and
the new mode appears at 640 cm-1 at this pressure. In the corresponding IR spectra, at 0.8
GPa, the position of νP-C mode is 639 cm-1 and the new mode appears at 645 cm-1.
The above observations imply that the principle of mutual exclusion of IR and Raman
modes is no more valid at high pressures, i.e., the molecular inversion symmetry is lifted.
Thus, at pressures above 0.9 GPa, Raman active modes can be observed in the IR spectra and

High Pressure Phase Transitions in trans-PtCl2(PEt3)2
115
vice versa. These modifications/ reorientations in the molecular units may further lead to
structural phase transition, which is discussed in the next section.
Figure 6.3: High pressure Raman spectra of trans-PtCl2(PEt3)2 in the spectral region 20 – 300 cm-1. On the
right is 100 – 275 cm-1 region shown with 3X magnification and inset shows the FWHM of γ(P-Pt-Cl)
mode. * denotes new peak in the lattice region and ^ denotes new shoulder peak adjacent to δPtCl 2 mode,
which emerge after the phase transition.
The signatures of these molecular reorientations, resulting in the non-equivalence of the two
phosphine (P-(CH2CH3)3) ligands on either side of Pt-atom, are clearly visible in the spectral
features of organic groups, thus verifying the above inferences. As shown in Figure 6.5 and
Figure 6.6b, new modes are found to emerge and the slope of frequency versus pressure plots
(Figure 6.7 and Figure 6.8) changes for most of the modes across 0.9 GPa. These changes,
observed in the deformation (700 – 1600 cm-1) and stretching (2800 – 3200 cm-1) regions of
the organic groups, are listed sequentially in the following two paragraphs.
Among some prominent changes, peak broadening/ appearance of new shoulder peaks

High Pressure Phase Transitions in trans-PtCl2(PEt3)2
116
Figure 6.4: High pressure Raman spectra (y-offset) of trans-PtCl2(PEt3)2 in the spectral range a) 320-470
cm-1; b) 600-780 cm-1. The new peaks emerged with pressure have been highlighted as guide to the eye. c)
Variation of Raman modes in the spectral range 20-700 cm-1, with pressure.
has been noticed in the ν(C-C), i.e., 1000 cm-1 region above 0.8 GPa. The intensity of C-CH3
rocking Raman mode at 1047 cm-1 reduces above 0.9 GPa and the mode becomes very weak
after 5 GPa (Figure 6.6a). The high pressure trends of Raman active modes in the region 1300
– 1400 cm-1 could not be probed as they are swamped by the strong diamond mode, but the
corresponding infrared behavior could be studied. The CH2 wagging, CH3 deformation and
CH2 scissoring IR modes at 1257 cm-1, 1375 cm-1 and 1413 cm-1, respectively show stiffening
with pressure. This is accompanied with the emergence of new modes adjacent to these
modes at 1268 cm-1, 1286 cm-1 and 1404 cm-1 above 0.8 GPa. In fact, nearly all the modes in
the fingerprint region are blue shifted upon compression and most of these depict a slope
change across 0.8 GPa and ~ 4.9 GPa (Figure 6.7, Figure 6.8 and Figure 6.4c). In 2800 –
3200 cm-1 range, the IR and Raman νsCH3 modes, depicting a weak shoulder at ambient

High Pressure Phase Transitions in trans-PtCl2(PEt3)2
117
Figure 6.5: High pressure IR spectra (y-offset for clarity) of trans-PtCl2(PEt3)2 in the spectral region a)
610-700 cm-1 and b) 700-1100 cm-1. The new peaks emerged with pressure have been marked with asterisk
and highlighted as guide to the eye.
Figure 6.6: High pressure (a) Raman and (b) infrared spectra of trans-PtCl2(PEt3)2 in mid-IR region. Inset
in (b) shows the peak position of νsCH3 and νsCH2 modes with pressure. The new peaks emerged at high
pressure have been marked with *. Down arrow (↓) denotes C-CH3 rocking mode, which weakens with
pressure. Numbers are pressure values in GPa, rel – pressure release. Spectra have been offset for clarity.
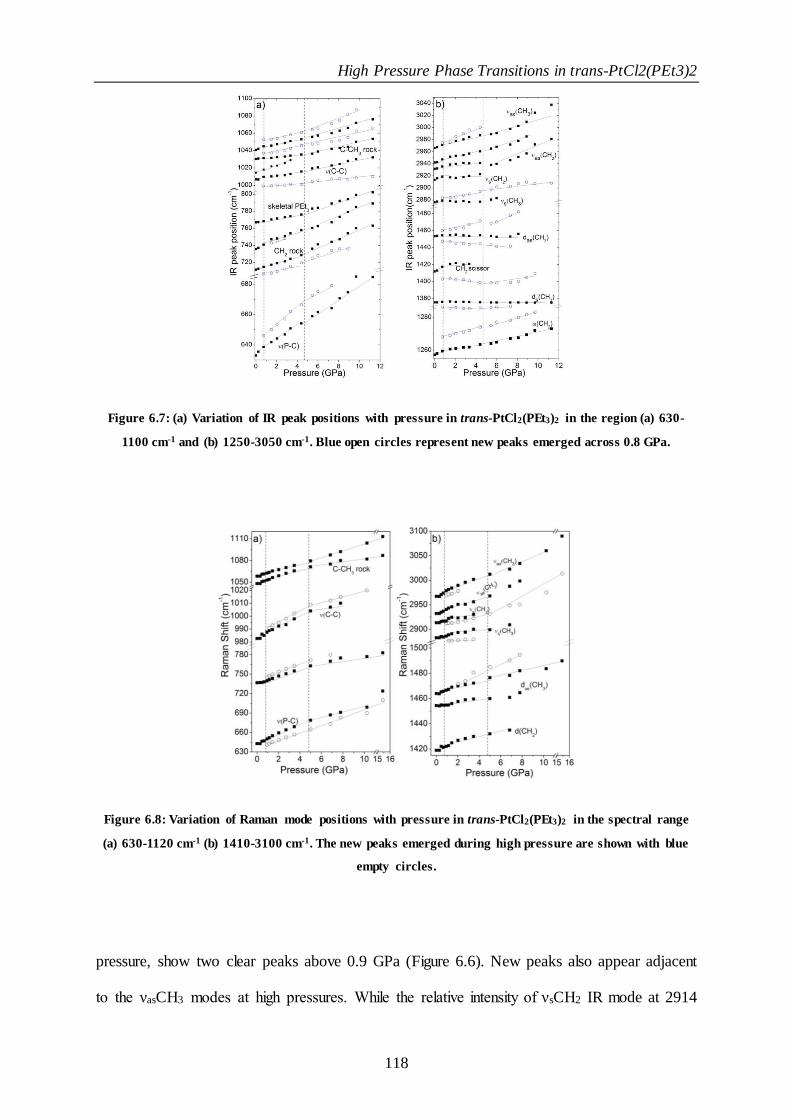
High Pressure Phase Transitions in trans-PtCl2(PEt3)2
118
Figure 6.7: (a) Variation of IR peak positions with pressure in trans-PtCl2(PEt3)2 in the region (a) 630-
1100 cm-1 and (b) 1250-3050 cm-1. Blue open circles represent new peaks emerged across 0.8 GPa.
Figure 6.8: Variation of Raman mode positions with pressure in trans-PtCl2(PEt3)2 in the spectral range
(a) 630-1120 cm-1 (b) 1410-3100 cm-1. The new peaks emerged during high pressure are shown with blue
empty circles.
pressure, show two clear peaks above 0.9 GPa (Figure 6.6). New peaks also appear adjacent
to the νasCH3 modes at high pressures. While the relative intensity of νsCH2 IR mode at 2914

High Pressure Phase Transitions in trans-PtCl2(PEt3)2
119
cm-1 decreases with pressure (Figure 6.6b), the intensity of νasCH2 mode at 2930 cm-1 remains
unaffected. Similar changes in intensity are noted for the CH3 group stretching modes. Such
an effect of pressure on the intensity of stretching vibrations in the IR spectra have also been
observed in some other square planar coordination complexes like PdCl2[S(CH3)2]2,
PtCl2[S(CH3)2]2, PtBr2(NH3)2, PtBr2(TeEt2)2 etc., and therefore this can well be a
characteristic feature of this class of compounds [304].
6.3.2.2. X-ray diffract ion studies:
High pressure x-ray diffraction patterns of trans-PtCl2(PEt3)2 have been shown in Figure 6.9
at various representative pressures. The XRD patterns show no qualitative change up to a
pressure of 0.8 GPa and therefore these were Rietveld refined up to this pressure using the
ambient monoclinic phase (Phase 1) with P21/n space group (No. 14) having two formula
units per unit cell (Z=2). The variations of lattice parameters a, b, c, β and unit cell volume,
thus obtained, have been shown in Figure 6.10 and Figure 6.11respectively, which show that
the crystal b-axis (the approximate direction of Pt-P bonds) depicts the least compressibility.
The pressure induced variations of lattice parameters have been fitted using Murnaghan
equation of state using EOS-Fit7 software. The bulk modulus and first pressure derivative of
Phase 1 of trans-PtCl2(PEt3)2 have been found to be 5.8(2) GPa and 6.2(1) respectively. As
the pressure is increased to 0.8 GPa, a new diffraction peak has been found to emerge at 2θ ~
5.9°, which signifies structural transition at this pressure (Figure 6.9). For P ≥ 0.8 GPa and up
to 4.7 GPa (Phase 2), the diffraction patterns could be better indexed using monoclinic phase
with P21 space group (non – centrosymmetric). The starting model for the refinement of
Phase 2 was taken from Phase 1(space group – P21/n) by transforming the axes and atomic
coordinates of Phase 1 using PCW software. Pawley refinement was carried out on the
diffraction pattern at 0.8 GPa where diffraction peaks were indexed with monoclinic P21

High Pressure Phase Transitions in trans-PtCl2(PEt3)2
120
Figure 6.9: High pressure powder XRD patterns of trans-PtCl2(PEt3)2. * denotes new peaks emerged in
the high pressure phases. The enlarged views in the inset show (I) the new peak at 0.8 GPa (Phase 2); (II)
peaks belonging to Phase 2 (around 6°) and Phase 3 (around 5°) at 4.7 GPa.
Figure 6.10: Variation of lattice parameters and with pressure in trans-PtCl2(PEt3)2. The lattice
parameters are fitted with Murnaghan and 3rd order Birch-Murnaghan equation of state in Phase 1 and
Phase 2 respectively using EOS-Fit7 software,[305] the error bars are within the symbols. Inset shows the
variation of beta angle with pressure.

High Pressure Phase Transitions in trans-PtCl2(PEt3)2
121
space group, a subgroup of P21/c, another setting of initial space group P21/n. This indicates
the occurrence of a group-subgroup type of phase transition across 0.8 GPa.
Figure 6.11: Variation of unit cell volume with pressure in trans-PtCl2(PEt3)2 fitted with Murnaghan and
3rd order Birch-Murnaghan equation of state in Phase 1 and Phase 2 respectively using EOS-Fit7
software[305], the error bars are within the symbols at all the pressures.
Table 6.3: Projection of the three Principle axes (X1, X2, X3) on crystallographic axes (a, b, c) in trans-
PtCl2(PEt3)2 derived using PASCal software[306] with critical point at 0.85 GPa.
Principle axes (Xn)
Compressibility K (TPa-1)
Error in Compressibility
σK (TPa-1)
Projection of Xn on the unit cell axes
a b c
Phase 1
X1 48.8612 4.8884 -0.1425 -0.0000 0.9898
X2 25.9522 2.4928 0.9298 0.0000 0.3681
X3 11.4934 1.0713 0.0000 -1.0000 0.0000
Phase 2
X1 17.3035 0.4974 0.9919 -0.0000 0.1268
X2 10.6181 0.3504 -0.5115 0.0000 -0.8593
X3 7.3500 0.1454 0.0000 -1.0000 0.0000

High Pressure Phase Transitions in trans-PtCl2(PEt3)2
122
Subsequently, structure was solved with rigid body method using Monte Carlo/Simulated
Annealing (MC/SA) as implemented in GSAS-II software [295]. Finally, Rietveld refinement
was performed on thus obtained structure with restraints on bond lengths and bond angles
using GSAS-II, as shown in Figure 6.12.
In order to obtain precise information on fractional coordinates of the lighter atoms
such as carbon and hydrogen in Phase 2, the refined structure at 0.8 GPa, obtained from
XRD, was used to carry out DFT calculations at the same pressure. Atomic positional
relaxations were performed using the conjugate gradient algorithm until the residual forces
were of the order of 0.01 eV/Å. Rietveld refinement was again carried out using the relaxed
structure obtained from the calculations, which matches with Figure 6.12. The structure of
Phase 2, thus obtained has been also been deposited in the Cambridge Crystal Data Centre
(CCDC number 1829688). The principle axes evolution with pressure as obtained using
PASCal software [306] have also been plotted in Figure 6.13, where X3 principle axis
coincides with the crystallographic b-axis, which also shows the least compressibility with
pressure as shown in Table 6.3. The obtained lattice parameters imply transformation relation
between Phase 1 and Phase 2 as a → c, b → b and c → (-a-c) (Figure 6.14). Thus, the lattice
parameters at 0.8 GPa are found to be a = 7.0671(41) Å, b = 11.4004(10) Å, c = 12.585(12)
Å, β = 121.476(12)° and V = 864.75(23) Å3 and their pressure induced variations in this high
pressure phase (Figure 6.10 and Figure 6.11) have been fitted using 3rd order Birch-
Murnaghan EOS. The values of B0 and B’ in Phase 2 have been obtained as 11.6(9) GPa and
5.3(4) respectively.
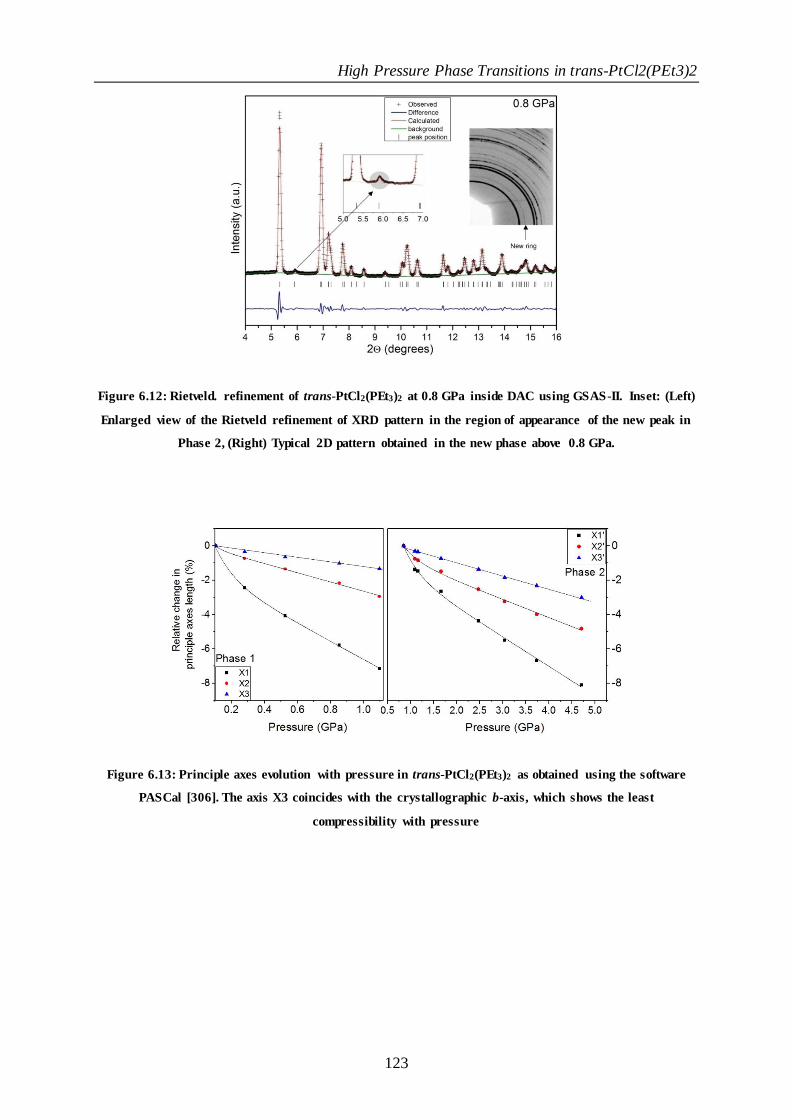
High Pressure Phase Transitions in trans-PtCl2(PEt3)2
123
Figure 6.12: Rietveld. refinement of trans-PtCl2(PEt3)2 at 0.8 GPa inside DAC using GSAS-II. Inset: (Left)
Enlarged view of the Rietveld refinement of XRD pattern in the region of appearance of the new peak in
Phase 2, (Right) Typical 2D pattern obtained in the new phase above 0.8 GPa.
Figure 6.13: Principle axes evolution with pressure in trans-PtCl2(PEt3)2 as obtained using the software
PASCal [306]. The axis X3 coincides with the crystallographic b-axis, which shows the least
compressibility with pressure

High Pressure Phase Transitions in trans-PtCl2(PEt3)2
124
Figure 6.14: Unit cells of Phase 1 (ambient) and Phase 2 (0.8 GPa) in trans-PtCl2(PEt3)2.
The features emerged in the second phase vanish at 4.7 GPa and newer peaks (for
example at 2θ ~ 5°) were found to emerge at this pressure, which suggests another phase
transition. This new phase (Phase 3) could be indexed in the same space group, however with
a supercell having lattice parameters a and c transformed to thrice and twice of those in Phase
2 respectively. Due to the overlapping of the peaks in the Phase 3, only Le Bail refinement
could be carried out (Figure 6.15). Thus, we find a = 20.1216(8) Å, b = 10.8357(7) Å, c =
24.1393(5) Å and β = 122.46° (volume, V = 4440.89 Å3) at 6.5 GPa with this methodology.
Based on density considerations, Phase 3 should have at least six formula units in a unit cell.
At still higher pressures in Phase 3, the diffraction patterns tend to become complex due to
peak broadening, appearance of several new peaks, especially at low 2θ values and splitting
in some of the peaks (see Figure 6.9). The profiles of XRD patterns above 9 GPa are
predominantly broad and tend to be nearly flat as compared to those at lower pressures. The
ambient structure could be retrieved upon the release of pressure.
Phase 2 Phase 1

High Pressure Phase Transitions in trans-PtCl2(PEt3)2
125
Figure 6.15: Le Bail refinement of Phase 3 of trans-PtCl2(PEt3)2 at 6.5 GPa. Inset shows the corresponding
2D pattern.
6.3.3. Molecular arrangement at high pressures
The x-ray diffraction results corroborate well with the observations from spectroscopic
studies, i.e., trans-PtCl2(PEt3)2 depicts a structural phase transition to a non-centrosymmetric
phase above 0.8 GPa. Figure 6.16 show the basic molecular units of PtCl2L2 (L = PEt3 ligand)
present in the structures of Phase 1 and Phase 2 respectively, deduced from x-ray diffraction
results. Due to the presence of molecular inversion symmetry, at ambient pressure, the Cl
atoms are placed diagonally opposite to each other with Cl-Pt-Cl = 180° and similarly the P
atoms. However, subsequent to phase transition, we find P-Pt-P = 170.58° and Cl-Pt-Cl =
176.82° in Phase 2. In the PEt3 ligands, two of the three ethyl groups (connected to a P-atom
on one side of Pt) show subtle reorientations to show small dissimilarities in bond lengths and
angles with those connected to the other P atom on the symmetrically opposite side of Pt.
Noticeably, the reorientational changes observed in the third ethyl group are significantly
different on the two sides of the Pt atom. In other words, the C-C entity of this third ethyl
group shows significant reorientations preferentially on one side of the central Pt- atom. This

High Pressure Phase Transitions in trans-PtCl2(PEt3)2
126
0.8 GPa
could be verified by monitoring the change in various Pt-P-C-C dihedral angles (Table 6.4).
Thus, the changes observed in these ligand orientations are drastic as compared to no
appreciable changes in the metal-ligand bond lengths which may lie within the error bars.
Figure 6.16: Molecular structure of trans-PtCl2(PEt3)2 (left) ambient Phase 1: P-Pt-P=180° and Cl-Pt-
Cl = 180°. (right) at 0.8 GPa in Phase 2. Molecular reorientations result in P-Pt-P=170.58° and Cl-Pt-
Cl=176.82° in Phase 2. (Color, Pt-Silver, Cl-green, Orange–P, Dark grey-C, Light grey-H).
These observations imply the lifting of molecular inversion symmetry, the signatures of
which are precisely reflected in the observed changes in IR and Raman vibrational modes, as
discussed in previous sections. Note that the two PEt3 ligands in the trans-positions to Pt
compete for the same d-orbital of Pt atom, which results in lower stability of trans- compared
to the cis- isomer.
Table 6.4: Variation of dihedral angles of the ethyl group attached to phosphorous atoms on the two
symmetrically opposite sides of Pt atom in trans-PtCl2(PEt3)2 molecule with pressure.
Dihedral Angles of ethyl groups (o)
Ambient pressure 0.8 GPa
One side Other side One side Other side
Pt-P-C1-C4 52.67° 52.67° 62.42° 56.23°
Pt-P-C2-C5 63.81° 63.81° 62.89° 81.90°
Pt-P-C3-C6 170.95° 170.95° 160.59° 57.64°
Thus, the molecular reorientations leading to non-equivalent PEt3 entities would imply

High Pressure Phase Transitions in trans-PtCl2(PEt3)2
127
different π-back bonding on the two opposite sides of Pt-atom. This implies that pressure can
be a useful tool for tuning π-back bonding properties, which is a subject of interest for
catalysis and phase transformation applications.
Another interesting effect of pressure is the strengthening of weakly interacting
forces, which arise due to shortening of non-bonded atomic distances as a result of molecular
reorientations. At ambient conditions, the shortest Cl---H distances are: i) intramolecular –
C3-H---Cl with Cl---H = 2.719 Å, C---Cl = 3.328 Å and CHCl=114.37; ii) intermolecular
– C6-H---Cl with Cl---H = 2.657 Å, C---Cl = 3.684 Å and CHCl = 155.66. Subsequent to
phase transition, because of reorientations in molecular geometries, viz., chlorine and
phosphine ligands, the shortest distances between non-bonded atoms are also modified. In
Phase 2, there are as many as three hydrogen bonds for which the Cl---H distances become
less than 2.6 Å, thus forming moderate and strong hydrogen bonds as shown in Figure
6.17(left). These C-H---Cl hydrogen bonds are (at 0.8 GPa): i) intermolecular with Cl---H =
2.465 Å, C---Cl = 3.339 Å and CHCl = 135.73, ii) intermolecular with Cl---H = 2.568 Å,
C---Cl = 3.64311 Å and CHCl = 164.47 and iii) intramolecular with Cl---H = 2.531 Å, C--
-Cl = 3.287 Å and CHCl = 125.06. Note that the sum of van der Waals radii for hydrogen
and chlorine atoms equals 2.95 Å and the criterion adopted to characterize long, intermediate
and short hydrogen bonds is reported as H---Cl ≥ 2.95, 2.52 – 2.95 and ≤ 2.52 Å respectively
[307-309].
The spectroscopic signatures of ethyl groups indeed support the formation of stronger
hydrogen bonds in Phase 2. As shown in the inset of Figure 6.6b, the CH3 (2876 cm-1) and
CH2 (2913 cm-1) stretching vibrational modes cease to stiffen (even depicting a small
softening) in the high pressure phase. The formation of such a hydrogen bonded structure in
trans-PtCl2(PEt3)2 has been shown in Figure 6.17(right), which is similar to the stitched stair-

High Pressure Phase Transitions in trans-PtCl2(PEt3)2
128
Figure 6.17: (left) Hydrogen bonds in the structure of trans-PtCl2(PEt3)2 at high pressures. Atom colours:
Grey- Pt, Green – Cl, Purple – P, Brown – C, Pink – H. H-bonds are shown by green-pink bicolour lines.
The three H-bonds are: i) intramolecular – Cl1---H-C3, nearly along the b-axis, ii) intermolecular – Cl2---
H-C2 nearly in the bc-plane and iii) intermolecular – Cl1---H-C5’ which connects two molecules lying in
two adjacent bc-planes forming the three- dimensional network. Numbers are Cl---H distances in Å.
(right) the extended three dimensional wire-frame structure plotted through slightly tilted a-axis showing
the hydrogen bonded network, mimicking a possible stair-case type supramolecular assembly.
case structure observed for the supramolecular synthon trans-octahedral [(L1)2CoCl2].4H2O,
where the H---Cl distance corresponding to the C-H---Cl hydrogen bond lies in the range 2.4-
2.8 Å [281]. These inferences are also supported by pronounced broadening in the C-H
stretching regions of IR and Raman spectra (Figure 6.6). In addition, the broad signatures in
the XRD patterns at higher pressures may also be the result of these structural changes. It is
noteworthy that the C-H---Cl hydrogen bonds play important role in the applications
concerning molecular recognition processes [310] and crystal engineering [155] as these
directional forces control the size of molecular assemblies [157, 311]. Such studies on weak
interactions between organic and non-organic systems may also be helpful in predicting the
complexation behavior of simple organic moieties under extreme geophysical conditions
[106, 199, 312, 313].

High Pressure Phase Transitions in trans-PtCl2(PEt3)2
129
6.3.4. High pressure behavior of metal-organic complexes
As far as high pressure studies on Pt(II) complexes is concerned, a strong pressure
dependence of luminescence properties have been observed which are linked to change in
closely lying Pt-Pt distances leading to destabilization of molecular orbitals and even an
insulator to metallic transition [36-40]. However, compounds with large Pt-Pt distances have
also shown a change in such properties, which is predicted to be due to the interactions with
organic ligands [39, 288, 314]. The studies on trigonal pyramidal (MX3), square
planar/tetrahedral (MX2Y2), and trigonal bipyramidal (MX2Y3) etc. complexes, where M=Pt,
Pd, Co, Zn; X=halogen and Y=ligand like S(CH3)2, (C7H8), (C6H7N)2 etc. (other than
halogen), have primarily concentrated on the change in relative intensity of symmetric and
asymmetric metal-halogen vibrational modes [315, 316]. In yet another Pt-complex,
PtCl2([9]aneS3), a phase transition to a polymer chain was observed at 4.2 GPa [317]. Thus,
the present studies provide evidences of molecular structure, i.e., metal-ligand bonding and
ligand orientations, playing a crucial role in local as well as overall structure determination
which can be probed by a concerted treatment of spectroscopic and diffraction studies.
The studies carried out on other metal-coordination complexes (metal – Cu, Ni, Fe, Pd
etc.) have revealed that pressure tuning may offer significant modifications in some favoured
interactions [289, 318-322]. For example, the Pd(II) compound PdCl2(1,4,7-
trithiacyclononane) shows a phase transition at 4.6 GPa to form a one-dimensional chain
[323], whereas the Co(II) compound [Co(NH3)5NO2]Cl shows anisotropic distortion under
pressure leading to selective rotation of one NH3 unit to form N-H---Cl and N-H---O
hydrogen bonds [15, 53, 324, 325]. Among some other compounds, Ru3(CO)12 exhibits the
properties of soft solids with a bulk modulus of only 6.6 GPa [297], whereas the organic salt
of [[SbCl5]n]2n- shows significant contraction in an intermolecular Sb---Cl hydrogen bond at
pressures as low as 0.55 GPa and the doubling of crystal a-axis at 1 GPa [326-330].

High Pressure Phase Transitions in trans-PtCl2(PEt3)2
130
Thus, the extreme sensitivity of the molecular structure triggering various changes in
trans-PtCl2(PEt3)2 under pressure demonstrates the use of thermodynamic parameters to tune
the Pt-ligand interactions and the hydrogen bonding motifs between different molecular units,
without the introduction of a foreign element into the structure. Such studies can be exploited
to study other technologically and biologically important compounds in this class, where
stereo-isomerism plays important role in the physical and chemical properties.
6.4. Summary
To summarize, trans-PtCl2(PEt3)2 has been studied under high pressure using infrared and
Raman spectroscopic techniques combined with x-ray diffraction studies, which have also
been corroborated with first principles DFT calculations. The XRD studies provide evidences
of pressure induced phase transition in trans-PtCl2(PEt3)2 at 0.8 GPa, where the space group
changes from P21/n to P21, implying a non-centrosymmetric high pressure phase. Splitting of
various skeletal and ligand stretching modes and the emergence of IR active modes in the
Raman spectra and vice versa also point to the loss of molecular inversion symmetry at ~ 0.8
GPa. This may result in diverse interactions between metal atom and P-C ligands on either
side of Pt. The pressure induced reorientation of ethyl groups of the ligand brings them in
close proximity with the nearby chlorine atoms, thus forming inter- and intra-molecular C-H-
--Cl hydrogen bonded supramolecular network. Upon further compression, another phase
transition has been indicated at pressures above 4.7 GPa. All the changes are found to be
reversible upon the release of pressure. These results show that any changes in molecular
orientation/ π-back bonding and weak inter-molecular interactions affect the three
dimensional network and stereo-electronic properties, which consequently would influence
the vast range of applications of Pt(II) complexes.

Summary and Conclusions
131
Chapter 7: Summary and Conclusions
7.1. Summary
The organic molecular solids have several applications ranging from technology to bio-
chemical processes. These applications are governed by the microscopic properties like inter-
atomic distances, electronic cloud distributions, intermolecular interactions, and molecular
conformational flexibility of different molecular units within a structure, which makes them
an interesting subject of study. Their applications can be enhanced/ optimized by varying the
thermodynamic parameters such as pressure, temperature etc.
In this thesis, the role of re-orientations of different molecular moieties for structural
stabilization and tuning of weak interactions like hydrogen bonding in controlling the phase
behavior of organic molecular solids under varying thermodynamic conditions of high
pressure/ low temperature has been investigated. The materials under investigation have been
classified into two classes. First category of systems is amino acids, viz., α-glycine, deuterated
α-glycine and L-Leucine in the solid form. In the second category, the metal-organic
coordination complex trans-dichloro bis(triethylphosphine) platinum(II) (trans-PtCl2(PEt3)2)
has been studied.
7.2. Conclusions
Systematic studies on the simplest and the most fundamental amino acid, glycine and
its deuterated analogue under low temperature conditions using vibrational spectroscopic
techniques have been carried out. A perceptible isotopic effect has been observed in the 3D-
hydrogen bonded framework of α-glycine upon cooling. The primary effect responsible for
this effect is the varied response of NH3 and ND3 torsional modes, resulting in diverse effect
on their respective hydrogen bonding networks upto 180 K. Below this temperature, similar
qualitative trends have been noticed on the effect of temperature on hydrogen bonds for the

Summary and Conclusions
132
two isotopes. This causes the formation of a stronger 3-dimensional bilayered assembly of
glycine molecules in the hydrogenated α-glycine, whereas relatively stable 2-dimensional
layered structure forming strong hydrogen bonded sheets in the ac-plane have been observed
in the deuterated α-glycine.
Upon increasing the chain of the hydrocarbons in amino acids, flexibility of molecular
moieties/ fragments plays a crucial role in depicting structural response to varying
environments. In this regard, a complex amino acid, L-Leucine having a hydrophobic
branched chain has been studied at variable temperatures using infrared spectroscopy. This
study throws light on the importance of re-orientations in different molecular fragments,
which may even result in phase transitions. The changes around 240 K have been associated
with the orientational changes in the amino groups (NH3 moieties). This transition causes
strengthening of the hydrogen bonds in the ac-plane forming 2-D sheets, well separated from
each other in the b-direction. The second transition around 150 K was found to be associated
with the orientational changes in the hydrophobic chain which were depicted by a drastic
change in the FWHM of torsional vibrations of (C3C4) group. The studies will be helpful in
settling the long standing debates on the possibility of temperature induced phase transitions
in L-Leucine.
Another class of molecular organic solids include metal-organic complexes. The compound
trans-dichloro bis(triethylphosphine) platinum (II) [formula:trans-PtCl2(PEt3)2] has been
studied in this class under varying thermodynamic conditions of low temperature and high
pressure. This complex has phosphine triethyl groups attached to the metal centre. The re-
orientation of these triethyl chains play an important role in triggering the phase transitions in
this complex upon changing the thermodynamic parameters. Upon cooling trans-PtCl2(PEt3)2,
the orientational changes of the phosphine triethyl ligands causes preferred strengthening of
the C-H---Cl hydrogen bonds through CH3 units, in the temperature range 180-130 K. The
drastic change in the intensity, appearance of new modes in the lattice region, and slope

Summary and Conclusions
133
change of many vibrational modes across 180 K and 130 K are the signatures of phase
transition.
Temperature and pressure are the thermodynamic variables which cause reduction in the
volume of the material under consideration, but the origin of phase transitions under such
conditions may be different or similar. Our detailed high pressure studies on the same metal-
organic complex, trans-dichloro bis(triethylphosphine) platinum (II), showed phase transition
from centrosymmetric to non-centrosymmetric structure (space group changes from P21/n to
P21) at a pressure of about 0.8 GPa. Combined investigations using vibrational spectroscopy
[IR and Raman] and XRD studies well corroborated with DFT calculations confirmed this
phase transition. Importantly, the study highlighted that the orientational changes of a specific
phosphine-organic ligand group lead to the structural phase transition in this compound.
Another phase transition was observed upon further compression upto ~ 4.7 GPa, forming a
supercell above this pressure. These orientational changes bring phosphine ligands in close
proximity of Cl atoms of the adjacent molecules, which cause overall strengthening of inter-
and intra-molecular C-H---Cl hydrogen bonds, resulting in a stitched staircase hydrogen bond
assisted supramolecular assembly in the high pressure phase. It is noteworthy that the nature
of pressure and temperature induced phase transitions in trans-PtCl2(PEt3)2 is different, since
no signatures of loss of inversion symmetry were noticed at low temperatures.
We hope that the case studies presented in this thesis pave the way towards better
understanding of fundamental systems like glycine, framing a general trend of hydrogen
bonding networks in amino acids under varying conditions and utilization of thermodynamic
parameters as well as molecular motions to harness the properties of technologically
important organic systems, other macro-molecular systems such as proteins and for their
molecular modelling.

References
134
References
(1).Boldyreva, E. V., High-pressure studies of the hydrogen bond networks in molecular crystals. Journal of molecular structure 2004, 700, 151-155.
(2).Boldyreva, E. V.; Ivashevskaya, S. N.; Sowa, H.; Ahsbahs, H.; Weber, H.-P., Effect of hydrostatic pressure on the γ-polymorph of glycine. 1. A polymorphic transition into a new δ-
form. Zeitschrift für Kristallographie-Crystalline Materials 2005, 220, 50-57.
(3).Shakhtshneider, T.; Boldyreva, E.; Vasilchenko, M.; Ahsbahs, H.; Uchtmann, H., Anisotropy of crystal structure distortion in organic molecular crystals of drugs induced by
hydrostatic compression. Journal of Structural Chemistry 1999, 40, 892-898.
(4).Boldyreva, E.; Boldyrev, V., Reactivity of molecular solids. Wiley: 1999; Vol. 3.
(5).Wilson, C., Variable temperature study of the crystal structure of paracetamol (p-hydroxyacetanilide), by single crystal neutron diffraction. Zeitschrift für Kristallographie-Crystalline Materials 2000, 215, 693-701.
(6).Boldyreva, E.; Shakhtshneider, T.; Ahsbahs, H.; Sowa, H.; Uchtmann, H., Effect of high pressure on the polymorphs of paracetamol. Journal of thermal analysis and calorimetry
2002, 68, 437-452.
(7).Rodrıguez-Spong, B.; Price, C. P.; Jayasankar, A.; Matzger, A. J.; Rodrıguez-Hornedo, N. r., General principles of pharmaceutical solid polymorphism: A supramolecular perspective.
Advanced drug delivery reviews 2004, 56, 241-274.
(8).Schultheiss, N.; Newman, A., Pharmaceutical cocrystals and their physicochemical
properties. Crystal growth and design 2009, 9, 2950-2967.
(9).Walz, J.; Ulrich, K.; Port, H.; Wolf, H. C.; Wonner, J.; Effenberger, F., Fulgides as switches for intramolecular energy transfer. Chemical physics letters 1993, 213, 321-324.
(10).Gilat, S. L.; Kawai, S. H.; Lehn, J. M., Light‐triggered molecular devices:
Photochemical switching of optical and electrochemical properties in molecular wire type diarylethene species. Chemistry–A European Journal 1995, 1, 275-284.
(11).Kawai, S. H.; Gilat, S. L.; Ponsinet, R.; Lehn, J. M., A dual‐mode molecular switching
device: Bisphenolic diarylethenes with integrated photochromic and electrochromic
properties. Chemistry–A European Journal 1995, 1, 285-293.
(12).Irie, M., Diarylethenes for memories and switches. Chemical Reviews 2000, 100, 1685-1716.
(13).Boldyreva, E.; Ahsbahs, H.; Weber, H.-P., A comparative study of pressure-induced lattice strain of α-and γ-polymorphs of glycine. Zeitschrift für Kristallographie-Crystalline
Materials 2003, 218, 231-236.
References
135
(14).Boldyreva, E., Molecules in strained environment. In High-pressure crystallography, Springer: 2004; pp 495-512.
(15).Boldyreva, E. V., High-pressure-induced structural changes in molecular crystals preserving the space group symmetry: Anisotropic distortion/isosymmetric polymorphism.
Crystal engineering 2003, 6, 235-254.
(16).Aravindan, A.; Srinivasan, P.; Vijayan, N.; Gopalakrishnan, R.; Ramasamy, P., A comparative study on the growth and characterization of nonlinear optical amino acid
crystals: L-alanine (la) and l-alanine alaninium nitrate (laan). Spectrochimica Acta Part A: Molecular and Biomolecular Spectroscopy 2008, 71, 297-304.
(17).Ramasamy, G.; Meenakshisundaram, S., Studies on amino acid picrates: Crystal growth, structure and characterization of a new nonlinear optical material l-isoleucinium picrate. Optik-International Journal for Light and Electron Optics 2014, 125, 4422-4426.
(18).Vijayan, N.; Rajasekaran, S.; Bhagavannarayana, G.; Ramesh Babu, R.; Gopalakrishnan, R.; Palanichamy, M.; Ramasamy, P., Growth and characterization of nonlinear optical amino
acid single crystal: L-alanine. Crystal growth & design 2006, 6, 2441-2445.
(19).Boldyreva, E., High pressure and supramolecular systems. Russian chemical bulletin 2004, 53, 1369-1378.
(20).Peterson, E.; Horz, F.; Chang, S., Modification of amino acids at shock pressures of 3.5 to 32 gpa. Geochimica et cosmochimica acta 1997, 61, 3937-3950.
(21).Boldyreva, E., Combined x-ray diffraction and raman spectroscopy studies of phase transitions in crystalline amino acids at low temperatures and high pressures: Selected examples. Phase Transitions 2009, 82, 303-321.
(22).Ringe, D.; Petsko, G. A., The ‘glass transition’ in protein dynamics: What it is, why it occurs, and how to exploit it. Biophysical Chemistry 2003, 105, 667-680.
(23).ZAvodszky, P.; Kardos, J.; Svingor, Á.; Petsko, G. A., Adjustment of conformational flexibility is a key event in the thermal adaptation of proteins. Proceedings of the National Academy of Sciences 1998, 95, 7406-7411.
(24).Ruano, D.; Díaz‐García, M.; Alfayate, A.; Sánchez‐Sánchez, M., Nanocrystalline m–
mof‐74 as heterogeneous catalysts in the oxidation of cyclohexene: Correlation of the activity and redox potential. ChemCatChem 2015, 7, 674-681.
(25).Allan, P. K.; Wheatley, P. S.; Aldous, D.; Mohideen, M. I.; Tang, C.; Hriljac, J. A.; Megson, I. L.; Chapman, K. W.; De Weireld, G.; Vaesen, S., Metal–organic frameworks for the storage and delivery of biologically active hydrogen sulfide. Dalton Transactions 2012,
41, 4060-4066.
(26).Cattaneo, D.; Warrender, S. J.; Duncan, M. J.; Castledine, R.; Parkinson, N.; Haley, I.;
Morris, R. E., Water based scale-up of cpo-27 synthesis for nitric oxide delivery. Dalton Transactions 2016, 45, 618-629.

References
136
(27).Chavan, S.; Bonino, F.; Valenzano, L.; Civalleri, B.; Lamberti, C.; Acerbi, N.; Cavka, J. H.; Leistner, M.; Bordiga, S., Fundamental aspects of h2s adsorption on cpo-27-ni. The
Journal of Physical Chemistry C 2013, 117, 15615-15622.
(28).Chavan, S.; Vitillo, J. G.; Groppo, E.; Bonino, F.; Lamberti, C.; Dietzel, P. D.; Bordiga,
S., Co adsorption on cpo-27-ni coordination polymer: Spectroscopic features and interaction energy. The Journal of Physical Chemistry C 2009, 113, 3292-3299.
(29).Dietzel, P. D.; Panella, B.; Hirscher, M.; Blom, R.; Fjellvåg, H., Hydrogen adsorption in
a nickel based coordination polymer with open metal sites in the cylindrical cavities of the desolvated framework. Chemical Communications 2006, 959-961.
(30).Glover, T. G.; Peterson, G. W.; Schindler, B. J.; Britt, D.; Yaghi, O., Mof-74 building unit has a direct impact on toxic gas adsorption. Chemical Engineering Science 2011, 66, 163-170.
(31).McKinlay, A.; Eubank, J.; Wuttke, S.; Xiao, B.; Wheatley, P.; Bazin, P.; Lavalley, J.-C.; Daturi, M.; Vimont, A.; De Weireld, G., Nitric oxide adsorption and delivery in flexible mil-
88 (fe) metal–organic frameworks. Chemistry of Materials 2013, 25, 1592-1599.
(32).McKinlay, A. C.; Allan, P. K.; Renouf, C. L.; Duncan, M. J.; Wheatley, P. S.; Warrender, S. J.; Dawson, D.; Ashbrook, S. E.; Gil, B.; Marszalek, B., Multirate delivery of
multiple therapeutic agents from metal-organic frameworks. APL Materials 2014, 2, 124108.
(33).Hinks, N. J.; McKinlay, A. C.; Xiao, B.; Wheatley, P. S.; Morris, R. E., Metal organic
frameworks as no delivery materials for biological applications. Microporous and Mesoporous Materials 2010, 129, 330-334.
(34).Miller, S. R.; Alvarez, E.; Fradcourt, L.; Devic, T.; Wuttke, S.; Wheatley, P. S.; Steunou,
N.; Bonhomme, C.; Gervais, C.; Laurencin, D., A rare example of a porous ca-mof for the controlled release of biologically active no. Chemical Communications 2013, 49, 7773-7775.
(35).Rojas, S.; Wheatley, P. S.; Quartapelle-Procopio, E.; Gil, B.; Marszalek, B.; Morris, R. E.; Barea, E., Metal–organic frameworks as potential multi-carriers of drugs. CrystEngComm 2013, 15, 9364-9367.
(36).Wenger, O. S.; Garcıa-Revilla, S.; Güdel, H. U.; Gray, H. B.; Valiente, R., Pressure dependence of pt (2, 2′-bipyridine) cl2 luminescence. The red complex converts to a yellow
form at 17.5 kbar. Chemical physics letters 2004, 384, 190-192.
(37).Takeda, K.; Shirotani, I.; Yakushi, K., Pressure-induced insulator-to-metal-to-insulator transitions in one-dimensional bis (dimethylglyoximato) platinum (ii), pt (dmg) 2. Chemistry
of materials 2000, 12, 912-916.
(38).Shirotani, I.; Inagaki, Y.; Utsumi, W.; Yagi, T., Pressure-sensitive absorption spectra of
thin films of bis (diphenylglyoximato) platinum (ii), pt (dpg) 2: Potential application as an indicator of pressure. Journal of Materials Chemistry 1991, 1, 1041-1043.
(39).Yersin, H.; Riedl, U., Extreme pressure-induced shifts of emission energies in
m[au(cn)2] and m2[pt(cn)4]... Nh2o. Compounds with low-dimensional and metal-metal interactions. Inorganic Chemistry 1995, 34, 1642-1645.

References
137
(40).Pelletier, Y.; Reber, C., Luminescence spectroscopy and emitting-state properties of pd (scn) 42-in crystals. Inorganic Chemistry 2000, 39, 4535-4541.
(41).Ehrenfest, P., Leiden comm. Suppl. No. 75b: 1933.
(42).Buerger, M., A new approach to crystal‐structure analysis. Acta Crystallographica 1951,
4, 531-544.
(43).Choudhury, R. R.; Poswal, H.; Chitra, R.; Sharma, S. M., Pressure induced structural
phase transition in triglycine sulfate and triglycine selenate. The Journal of chemical physics 2007, 127, 154712.
(44).Boldyreva, E. V.; Kolesnik, E. N.; Drebushchak, T. N.; Ahsbahs, H.; Beukes, J. A.; Weber, H.-P., A comparative study of the anisotropy of lattice strain induced in the crystals of l-serine by cooling down to 100 k or by increasing pressure up to 4.4 gpa. Zeitschrift für
Kristallographie-Crystalline Materials 2005, 220, 58-65.
(45).Boldyreva, E. V.; Kolesnik, E. N.; Drebushchak, T. N.; Sowa, H.; Ahsbahs, H.;
Seryotkin, Y. V., A comparative study of the anisotropy of lattice strain induced in the crystals of dl-serine by cooling down to 100 k, or by increasing pressure up to 8.6 gpa. A comparison with l-serine. Zeitschrift für Kristallographie-Crystalline Materials 2006, 221,
150-161.
(46).Krishnan, R.; Srinivasan, R.; Devanarayanan, S., Thermal expansion of crystals. Oxford:
1979.
(47).Hazen, R. M.; Finger, L. W., Comparative crystal chemistry: Temperature, pressure, composition andthe variation of crystal structure. J. Wiley: 1982.
(48).Batsanov, S., Fizicheskie metody [ssledovaniya neorganicheskih materialov (physical methods in inorganic material science). Moscow: Nauka: 1981.
(49).Ledbetter, H., Thermal expansion and elastic constants. International Journal of Thermophysics 1991, 12, 637-642.
(50).Boldyreva, E. V., High-pressure studies of the anisotropy of structural distortion of
molecular crystals. Journal of Molecular Structure 2003, 647, 159-179.
(51).Boldyreva, E.; Shakhtshneider, T.; Vasilchenko, M.; Ahsbahs, H.; Uchtmann, H.,
Anisotropic crystal structure distortion of the monoclinic polymorph of acetaminophen at high hydrostatic pressures. Acta Crystallographica Section B: Structural Science 2000, 56, 299-309.
(52).Boldyreva, E.; Shakhtshneider, T.; Ahsbahs, H.; Sowa, H.; Uchtmann, H., Effect of pressure on the crystals of sodium oxalate: Anisotropic structural distortion and a
polymorphic transition. Russian J. Struct. Chem 2002, 43, 107-113.
(53).Boldyreva, E. V.; Ahsbahs, H.; Naumov, D. Y.; Kutoglu, A., Pentaamminenitrocobalt (iii) dichloride at pressures of 0.24, 0.52, 1.25, 1.91 and 3.38 gpa. Acta Crystallographica
Section C: Crystal Structure Communications 1998, 54, 1378-1383.

References
138
(54).Boldyreva, E. V.; Ahsbahs, H.; Uchtmann, H.; Kashcheeva, N., Effects of pressure on the two polymorphs of [co (nh3) 5no2] i2: The anisotropy of lattice distortion and a phase
transition. International Journal of High Pressure Research 2000, 17, 79-99.
(55).Boldyreva, E.; Kivikoski, J.; Howard, J. A., Distortion of crystal structures of some coiii
ammine complexes. Ii. Distortion of crystal structures of [co (nh3) 5no2] x2 (x= cl, br) on cooling. Acta Crystallographica Section B 1997, 53, 405-414.
(56).Petrenko, V. F.; Whitworth, R. W., Physics of ice. OUP Oxford: 1999.
(57).Boldyreva, E. V.; Naumov, D. Y.; Ahsbahs, H., Distortion of crystal structures of some coiii ammine complexes. Iii. Distortion of crystal structure of [co (nh3) 5no2] cl2 at
hydrostatic pressures up to 3.5 gpa. Acta Crystallographica Section B 1998, 54, 798-808.
(58).Dunitz, J. D., Weak intermolecular interactions in solids and liquids. Molecular Crystals and Liquid Crystals Science and Technology. Section A. Molecular Crystals and Liquid
Crystals 1996, 279, 209-218.
(59).Krishnan, R.; Krishnan, K. In Influence of the hydrogen bond on the nh stretching
frequencies in amino-acids, Proceedings of the Indian Academy of Sciences-Section A, Springer: 1964; pp 11-19.
(60).Rozenberg, M.; Loewenschuss, A.; Marcus, Y., An empirical correlation between
stretching vibration redshift and hydrogen bond length. Physical Chemistry Chemical Physics 2000, 2, 2699-2702.
(61).Nakamoto, K.; Margoshes, M.; Rundle, R., Stretching frequencies as a function of distances in hydrogen bonds. Journal of the American Chemical Society 1955, 77, 6480-6486.
(62).Pimentel, G. C.; Sederholm, C. H., Correlation of infrared stretching frequencies and hydrogen bond distances in crystals. The Journal of Chemical Physics 1956, 24, 639-641.
(63).Fuller, W., Hydrogen bond lengths and angles observed in crystals. The Journal of Physical Chemistry 1959, 63, 1705-1717.
(64).Edsall, J. T.; Scheinberg, H., Raman spectra of amino acids and related compounds v.
Deuterium substitution in the amino group. The Journal of Chemical Physics 1940, 8, 520-525.
(65).Boldyreva, E. V., High-pressure studies of crystalline amino acids and simple peptides. High Pressure Bioscience and Biotechnology 2007, 1, 28-46.
(66).Katrusiak, A., High-pressure x-ray diffraction studies of organic crystals. High Pressure
Science and Technology 1990, 4, 496-498.
(67).Katrusiak, A., High‐pressure x‐ray diffraction studies on organic crystals. Crystal
Research and technology 1991, 26, 523-531.
(68).Murli, C.; Sharma, S. M.; Karmakar, S.; Sikka, S., Α-glycine under high pressures: A
raman scattering study. Physica B: Condensed Matter 2003, 339, 23-30.

References
139
(69).Dawson, A.; Allan, D. R.; Belmonte, S. A.; Clark, S. J.; David, W. I.; McGregor, P. A.; Parsons, S.; Pulham, C. R.; Sawyer, L., Effect of high pressure on the crystal structures of
polymorphs of glycine. Crystal growth & design 2005, 5, 1415-1427.
(70).BOLDYREVA, E.; DREBUSHCHAK, T.; SHUTOVA, E., Structural distortion of the α,
β, and γ polymorphs of glycine on cooling. Zeitschrift für Kristallographie 2003, 218, 366-376.
(71).Goryainov, S.; Kolesnik, E.; Boldyreva, E., A reversible pressure-induced phase
transition in β-glycine at 0.76 gpa. Physica B: Condensed Matter 2005, 357, 340-347.
(72).Boldyreva, E.; Ivashevskaya, S.; Sowa, H.; Ahsbahs, H.; Weber, H. In Effect of high
pressure on the crystalline glycine: A new high-pressure polymorphic modification formation, Doklady Akademii Nauk, 2004; pp 358-361.
(73).Goryainov, S.; Boldyreva, E.; Kolesnik, E., Raman observation of a new (ζ) polymorph
of glycine? Chemical Physics Letters 2006, 419, 496-500.
(74).Kolesnik, E.; Goryainov, S.; Boldyreva, E. In Different behavior of l-and dl-serine
crystals at high pressures: Phase transitions in l-serine and stability of the dl-serine structure, Doklady Physical Chemistry, Springer: 2005; pp 169-172.
(75).Moggach, S. A.; Allan, D. R.; Morrison, C. A.; Parsons, S.; Sawyer, L., Effect of
pressure on the crystal structure of l-serine-i and the crystal structure of l-serine-ii at 5.4 gpa. Acta Crystallographica Section B: Structural Science 2005, 61, 58-68.
(76).Boldyreva, E.; Sowa, H.; Seryotkin, Y. V.; Drebushchak, T.; Ahsbahs, H.; Chernyshev, V.; Dmitriev, V., Pressure-induced phase transitions in crystalline l-serine studied by single-crystal and high-resolution powder x-ray diffraction. Chemical physics letters 2006, 429,
474-478.
(77).Moggach, S.; Parsons, S.; Allan, D., High-pressure crystallographic study of l-cysteine,
the route to a new polymorph. Acta Crystallographica Section A: Foundations of Crystallography 2004, 60, s251-s251.
(78).Minkov, V. S.; Krylov, A. S.; Boldyreva, E. V.; Goryainov, S. V.; Bizyaev, S. N.;
Vtyurin, A. N., Pressure-induced phase transitions in crystalline l-and dl-cysteine. The Journal of Physical Chemistry B 2008, 112, 8851-8854.
(79).Paukov, I.; Kovalevskaya, Y.; Boldyreva, E., Low-temperature thermodynamic properties of dl-cysteine. Journal of thermal analysis and calorimetry 2009, 100, 295-301.
(80).Minkov, V. S.; Tumanov, N. A.; Kolesov, B. A.; Boldyreva, E. V.; Bizyaev, S. N., Phase
transitions in the crystals of l-and dl-cysteine on cooling: The role of the hydrogen-bond distortions and the side-chain motions. 2. Dl-cysteine. The Journal of Physical Chemistry B
2009, 113, 5262-5272.
(81).Bordallo, H. N.; Boldyreva, E. V.; Fischer, J.; Koza, M. M.; Seydel, T.; Minkov, V. S.; Drebushchak, V. A.; Kyriakopoulos, A., Observation of subtle dynamic transitions by a
combination of neutron scattering, x-ray diffraction and dsc: A case study of the monoclinic l-cysteine. Biophysical chemistry 2010, 148, 34-41.
References
140
(82).Paukov, I. E.; Kovalevskaya, Y. A.; Drebushchak, V. A.; Drebushchak, T. N.; Boldyreva, E. V., An extended phase transition in crystalline l-cysteine near 70 k. The
Journal of Physical Chemistry B 2007, 111, 9186-9188.
(83).Paukov, I.; Kovalevskaya, Y.; Boldyreva, E., Low-temperature thermodynamic
properties of l-cysteine. Journal of Thermal Analysis and Calorimetry 2008, 93, 423-428.
(84).Bordallo, H. N.; Kolesov, B. A.; Boldyreva, E. V.; Juranyi, F., Different dynamics of chiral and racemic (l-and dl-) serine crystals: Evidenced by incoherent inelastic neutron and
raman scattering. Journal of the American Chemical Society 2007, 129, 10984-10985.
(85).Kolesov, B.; Boldyreva, E., Difference in the dynamic properties of chiral and racemic
crystals of serine studied by raman spectroscopy at 3− 295 k. The Journal of Physical Chemistry B 2007, 111, 14387-14397.
(86).Facanha Filho, P. F.; Jiao, X.; Freire, P. T.; Lima Jr, J. A.; Dos Santos, A. O.; Henry, P.
F.; Yokaichiya, F.; Kremner, E.; Bordallo, H. N., Structure–property relations in crystalline l-leucine obtained from calorimetry, x-rays, neutron and raman scattering. Physical chemistry
chemical physics 2011, 13, 6576-6583.
(87).Binns, J.; Parsons, S.; McIntyre, G. J., Accurate hydrogen parameters for the amino acid l-leucine. Acta Crystallographica Section B: Structural Science, Crystal Engineering and
Materials 2016, 72, 885-892.
(88).Aubrey, A.; Cleaves, H. J.; Chalmers, J. H.; Skelley, A. M.; Mathies, R. A.; Grunthaner,
F. J.; Ehrenfreund, P.; Bada, J. L., Sulfate minerals and organic compounds on mars. Geology 2006, 34, 357-360.
(89).Bernstein, M. P.; Dworkin, J. P.; Sandford, S. A.; Cooper, G. W.; Allamandola, L. J.,
Racemic amino acids from the ultraviolet photolysis of interstellar ice analogues. Nature 2002, 416, 401.
(90).Caro, G. M.; Meierhenrich, U.; Schutte, W.; Barbier, B.; Segovia, A. A.; Rosenbauer, H.; Thiemann, W.-P.; Brack, A.; Greenberg, J., Amino acids from ultraviolet irradiation of interstellar ice analogues. Nature 2002, 416, 403.
(91).Gerakines, P. A.; Hudson, R. L., Glycine's radiolytic destruction in ices: First in situ laboratory measurements for mars. Astrobiology 2013, 13, 647-655.
(92).Iitaka, Y., The crystal structure of γ‐glycine. Acta Crystallographica 1961, 14, 1-10.
(93).Iitaka, Y., The crystal structure of β‐glycine. Acta Crystallographica 1960, 13, 35-45.
(94).Lemanov, V.; Popov, S.; Pankova, G., Piezoelectric properties of some crystalline amino acids and their complexes. Solid State Physics (Fiz. Tv. Tela) 2002, 44, 1840-1846.
(95).Adhikari, S.; Kar, T., Bulk single crystal growth and characterization of l-leucine–a nonlinear optical material. Materials Chemistry and Physics 2012, 133, 1055-1059.
(96).Rieckhoff, K. E.; Peticolas, W. L., Optical second-harmonic generation in crystalline amino acids. Science 1965, 147, 610-611.

References
141
(97).Han, Q.; Yang, R.; Li, J.; Zhang, Y.; Wang, C., Synthesis of leucine micro/nanocrystals for pharmaceutical applications. CrystEngComm 2011, 13, 6157-6162.
(98).Boldyreva, E., Cristalline amino acids: A link between chemistry. Materials Science and Biology, In: Boyens JCA, Ogilvie JF, editors. Models, Mysteries, and Magic of Molecules.
Netherlands: Springer 2007, 167-192.
(99).Bell, J. F.; Calvin, W. M.; Ockert‐Bell, M. E.; Crisp, D.; Pollack, J. B.; Spencer, J.,
Detection and monitoring of h2o and co2 ice clouds on mars. Journal of Geophysical Research: Planets 1996, 101, 9227-9237.
(100).Knacke, R.; McCorkle, S.; Puetter, R.; Erickson, E.; Krätschmer, W., Observation of interstellar ammonia ice. The Astrophysical Journal 1982, 260, 141-146.
(101).Sharma, A.; Scott, J. H.; Cody, G. D.; Fogel, M. L.; Hazen, R. M.; Hemley, R. J.;
Huntress, W. T., Microbial activity at gigapascal pressures. Science 2002, 295, 1514-1516.
(102).Witze, A., Vibrant pluto seen in historic fly-by. Nature 2015, 523, 389.
(103).Brack, A.; Pillinger, C. T., Life on mars: Chemical arguments and clues from martian meteorites. Extremophiles 1998, 2, 313-319.
(104).Otake, T.; Taniguchi, T.; Furukawa, Y.; Kawamura, F.; Nakazawa, H.; Kakegawa, T.,
Stability of amino acids and their oligomerization under high-pressure conditions: Implications for prebiotic chemistry. Astrobiology 2011, 11, 799-813.
(105).Maté, B.; Rodriguez-Lazcano, Y.; Gálvez, Ó.; Tanarro, I.; Escribano, R., An infrared study of solid glycine in environments of astrophysical relevance. Physical Chemistry Chemical Physics 2011, 13, 12268-12276.
(106).Bhatt, H.; Mishra, A.; Murli, C.; Verma, A. K.; Garg, N.; Deo, M.; Sharma, S. M., Proton transfer aiding phase transitions in oxalic acid dihydrate under pressure. Physical
Chemistry Chemical Physics 2016, 18, 8065-8074.
(107).Albrecht, G.; Corey, R. B., The crystal structure of glycine. Journal of the American Chemical Society 1939, 61, 1087-1103.
(108).Ioppolo, S.; Van Boheemen, Y.; Cuppen, H.; Van Dishoeck, E.; Linnartz, H., Surface formation of co2 ice at low temperatures. Monthly Notices of the Royal Astronomical Society
2011, 413, 2281-2287.
(109).Sun, C. Q.; Zhang, X.; Zheng, W., The hidden force opposing ice compression. Chemical Science 2012, 3, 1455-1460.
(110).Zhang, X.; Chen, S.; Li, J., Hydrogen-bond potential for ice viii-x phase transition. Scientific Reports 2016, 6, 37161.
(111).Bernal, J., The crystal structure of the natural amino acids and belated compounds. Zeitschrift für Kristallographie-Crystalline Materials 1931, 78, 363-369.
(112).Chaudhuri, P.; Canuto, S.; Provasi, P. F., Nmr spin–spin coupling constants in
hydrogen-bonded glycine clusters. International Journal of Quantum Chemistry, e25608-n/a.

References
142
(113).Aliev, A. E.; Mann, S. E.; Rahman, A. S.; McMillan, P. F.; Corà, F.; Iuga, D.; Hughes, C. E.; Harris, K. D., High-resolution solid-state 2h nmr spectroscopy of polymorphs of
glycine. The Journal of Physical Chemistry A 2011, 115, 12201-12211.
(114).Lund, A. M.; Pagola, G. I.; Orendt, A. M.; Ferraro, M. B.; Facelli, J. C., Crystal
structure prediction from first principles: The crystal structures of glycine. Chemical physics letters 2015, 626, 20-24.
(115).Gupta, V. D.; Singh, R. D., Low frequency spectra of glycine. Chemical Physics
Letters 1970, 5, 218-220.
(116).Stepanian, S.; Reva, I.; Radchenko, E.; Rosado, M.; Duarte, M.; Fausto, R.;
Adamowicz, L., Matrix-isolation infrared and theoretical studies of the glycine conformers. The Journal of Physical Chemistry A 1998, 102, 1041-1054.
(117).Grenie, Y.; Lassegues, J. C.; Garrigou‐Lagrange, C., Infrared spectrum of
matrix‐isolated glycine. The Journal of Chemical Physics 1970, 53, 2980-2982.
(118).Matei, A.; Drichko, N.; Gompf, B.; Dressel, M., Far-infrared spectra of amino acids. Chemical Physics 2005, 316, 61-71.
(119).Barth, A., The infrared absorption of amino acid side chains. Progress in biophysics and molecular biology 2000, 74, 141-173.
(120).Husain, S. K.; Hasted, J. B.; Rosen, D.; Nicol, E.; Birch, J. R., Fir spectra of amino
acids and related molecules. Infrared Physics 1984, 24, 201-208.
(121).Ramnarine, R.; Sherman, W. F.; Chunnilall, C. J., Ir-active lattice modes of α-glycine
and deutero-α-glycine. Microchimica Acta 1988, 95, 353-355.
(122).Trivella, A.; Gaillard, T.; Stote, R. H.; Hellwig, P., Far infrared spectra of solid state aliphatic amino acids in different protonation states. The Journal of chemical physics 2010,
132, 03B609.
(123).Takeda, M.; Iavazzo, R. E. S.; Garfinkel, D.; Scheinberg, I. H.; Edsall, J. T., Raman
spectra of amino acids and related compounds. Ix. Ionization and deuterium substitution in glycine, alanine and β-alanine1,2,3. Journal of the American Chemical Society 1958, 80, 3813-3818.
(124).Ghazanfar, S. A. S.; Myers, D. V.; Edsall, J. T., Raman spectra of carbon-deuterated glycine in various ionic forms. Journal of the American Chemical Society 1964, 86, 3439-
3444.
(125).Krishnan, R.; Sankaranarayanan, V.; Krishnan, K., Raman and infra-red spectra of amino acids. Journal of the Indian Institute of Science 2013, 55, 66.
(126).Stenback, H., On the raman spectra of solid natural α-glycine and solid 15n-substituted α-glycine. Journal of Raman Spectroscopy 1976, 5, 49-55.
(127).Kromhout, R.; Moulton, W., Nuclear magnetic resonance: Structure of the amino group i. The Journal of Chemical Physics 1955, 23, 1673-1679.

References
143
(128).Gu, Z.; Ebisawa, K.; McDermott, A., Hydrogen bonding effects on amine rotation rates in crystalline amino acids. Solid state nuclear magnetic resonance 1996, 7, 161-172.
(129).Jönsson, P.-G.; Kvick, Å., Precision neutron diffraction structure determination of protein and nucleic acid components. Iii. The crystal and molecular structure of the amino
acid α-glycine. Acta Crystallographica Section B: Structural Crystallography and Crystal Chemistry 1972, 28, 1827-1833.
(130).Marsh, R. E., A refinement of the crystal structure of glycine. Acta Crystallographica
1958, 11, 654-663.
(131).Kobayashi, Y.; Sawada, S.; Furuta, H.; Endo, S.; Deguchi, K., Ferroelectric tgs
((nh2ch2cooh) 3· h2so4) under high pressure. Journal of Physics: Condensed Matter 2002, 14, 11139.
(132).Arun, K.; Jayalekshmi, S., Growth and characterization of glycinium oxalate crystals
for nonlinear optical applications. OPTOELECTRONICS AND ADVANCED MATERIALS – RAPID COMMUNICATIONS 2008, 2, 701 - 706.
(133).Matyjasek, K.; Czapla, Z., Temperature dependence of polarization switching in deuterated glycine phosphite single crystals. Phase Transitions 2013, 86, 161-166.
(134).Nayeem, J.; Wakabayashi, H.; Kikuta, T.; Yamazaki, T.; Nakatani, N., Ferroelectric
properties of deuterated glycine phosphite. Ferroelectrics 2002, 269, 153-158.
(135).Ivanov, V. V.; Kolysheva, M. V.; Klevtsova, E. A., On the relaxation of macroscopic
polarization in dtgs crystals. Ferroelectrics 2000, 238, 65-72.
(136).Schmidt, C., First deuterated drug approved. Nature Publishing Group: 2017.
(137).Mullard, A., Deuterated drugs draw heavier backing. Nature Publishing Group: 2016.
(138).Timmins, G. S., Deuterated drugs: Where are we now? Expert opinion on therapeutic patents 2014, 24, 1067-1075.
(139).Kržan, M.; Vianello, R.; Maršavelski, A.; Repič, M.; Zakšek, M.; Kotnik, K.; Fijan, E.; Mavri, J., The quantum nature of drug-receptor interactions: Deuteration changes binding affinities for histamine receptor ligands. PloS one 2016, 11, e0154002.
(140).Basu, S., A review of nonlinear optical organic materials. Industrial & Engineering Chemistry Product Research and Development 1984, 23, 183-186.
(141).Harding, M. M.; Howieson, R., L-leucine. Acta Crystallographica Section B: Structural Crystallography and Crystal Chemistry 1976, 32, 633-634.
(142).Coll, M.; Solans, X.; Font‐Altaba, M.; Subirana, J., Structure of l‐leucine: A
redetermination. Acta Crystallographica Section C 1986, 42, 599-601.
(143).Herlinger, A. W.; Wenhold, S. L.; Long, T. V., Infrared spectra of amino acids and their metal complexes. Ii. Geometrical isomerism in bis (amino acidato) copper (ii) complexes. Journal of the American Chemical Society 1970, 92, 6474-6481.

References
144
(144).Shotts, W.; Sievers, A., The far‐infrared properties of polyamino acids. Biopolymers:
Original Research on Biomolecules 1974, 13, 2593-2614.
(145).Jenkins, A. L.; Larsen, R. A.; Williams, T. B., Characterization of amino acids using
raman spectroscopy. Spectrochimica Acta Part A: Molecular and Biomolecular Spectroscopy 2005, 61, 1585-1594.
(146).Linder, R.; Nispel, M.; Häber, T.; Kleinermanns, K., Gas-phase ft-ir-spectra of natural
amino acids. Chemical physics letters 2005, 409, 260-264.
(147).Wolpert, M.; Hellwig, P., Infrared spectra and molar absorption coefficients of the 20
alpha amino acids in aqueous solutions in the spectral range from 1800 to 500 cm− 1. Spectrochimica Acta Part A: Molecular and Biomolecular Spectroscopy 2006, 64, 987-1001.
(148).Derbel, N.; Hernández, B.; Pflüger, F.; Liquier, J.; Geinguenaud, F.; Jaïdane, N.; Ben
Lakhdar, Z.; Ghomi, M., Vibrational analysis of amino acids and short peptides in hydrated media. I. L-glycine and l-leucine. The Journal of Physical Chemistry B 2007, 111, 1470-
1477.
(149).Dokmaisrijan, S.; Lee, V. S.; Nimmanpipug, P., The gas phase conformers and vibrational spectra of valine, leucine and isoleucine: An ab initio study. Journal of Molecular
Structure: THEOCHEM 2010, 953, 28-38.
(150).Görbitz, C.; Dalhus, B., Redetermination of l‐leucine at 120k. Acta Crystallographica
Section C 1996, 52, 1754-1756.
(151).Hollingsworth, M. D.; Cyr, N., High resolution solid-state nmr spectra of leucine: A re-
examination. Journal of the Chemical Society, Chemical Communications 1990, 578-580.
(152).Prasad, S.; Clark, T. M.; Sharma, R.; Kwak, H.-T.; Grandinetti, P. J.; Zimmermann, H., A combined 17o rapt and mq-mas nmr study of l-leucine. Solid state nuclear magnetic
resonance 2006, 29, 119-124.
(153).Andrew, E.; Hinshaw, W.; Hutchins, M.; Sjöblom, R.; Canepa, P., Proton magnetic
relaxation and molecular motion in polycrystalline amino acids: Ii. Alanine, isoleucine, leucine, methionine, norleucine, threonine and valine. Molecular Physics 1976, 32, 795-806.
(154).Stepanian, S. G.; Ivanov, A. Y.; Adamowicz, L., Conformational composition of
neutral leucine. Matrix isolation infrared and ab initio study. Chemical Physics 2013, 423, 20-29.
(155).Sarma, J. A.; Desiraju, G. R., The role of cl. Cntdot.. Cntdot.. Cntdot. Cl and ch. Cntdot.. Cntdot.. Cntdot. O interactions in the crystal engineering of 4-. Ang. Short-axis structures. Accounts of Chemical Research 1986, 19, 222-228.
(156).Desiraju, G. R., Hydrogen bridges in crystal engineering: Interactions without borders. Accounts of chemical research 2002, 35, 565-573.
(157).Steiner, T., The hydrogen bond in the solid state. Angewandte Chemie International Edition 2002, 41, 48-76.

References
145
(158).Lai, S. L.; Tong, W. Y.; Kui, S. C.; Chan, M. Y.; Kwok, C. C.; Che, C. M., High efficiency white organic light‐emitting devices incorporating yellow phosphorescent platinum
(ii) complex and composite blue host. Advanced Functional Materials 2013, 23, 5168-5176.
(159).Grey, J. K.; Butler, I. S.; Reber, C., Large pressure-induced increase in luminescence intensity for the [pd (scn) 4] 2-complex. Journal of the American Chemical Society 2002, 124, 9384-9385.
(160).Grey, J. K.; Butler, I. S.; Reber, C., Pressure-induced enhancements of luminescence intensities and lifetimes correlated with emitting-state distortions for thiocyanate and
selenocyanate complexes of platinum (ii) and palladium (ii). Inorganic chemistry 2003, 42, 6503-6518.
(161).Ananikov, V. P.; Gayduk, K. A.; Starikova, Z. A.; Beletskaya, I. P., Ni (acac)
2/phosphine as an excellent precursor of nickel (0) for catalytic systems. Organometallics 2010, 29, 5098-5102.
(162).Kaur, T.; Borse, V.; Sheth, S.; Sheehan, K.; Ghosh, S.; Tupal, S.; Jajoo, S.; Mukherjea, D.; Rybak, L. P.; Ramkumar, V., Adenosine a1 receptor protects against cisplatin ototoxicity by suppressing the nox3/stat1 inflammatory pathway in the cochlea. Journal of Neuroscience
2016, 36, 3962-3977.
(163).Jena, S. L. a. P., Bulletin of American Physical Society 2011, 56.
(164).Bajaj, N.; Bhatt, H.; Murli, C.; Vishwakarma, S.; Chitra, R.; Ravindran, T.; Deo, M., Perceptible isotopic effect in 3d-framework of α-glycine at low temperatures. Spectrochimica Acta Part A: Molecular and Biomolecular Spectroscopy 2018, 204, 495-507.
(165).Bajaj, N.; Bhatt, H.; Vishwakarma, S.; Deo, M. N., Orientational adaptations leading to plausible phase transitions in l-leucine at low temperatures: Revealed by infrared
spectroscopy. The Journal of Physical Chemistry B 2019.
(166).Bajaj, N.; Bhatt, H.; Pandey, K. K.; Poswal, H. K.; Arya, A.; Ghosh, P.; Deo, M., Phase transition in metal-organic complex trans-ptcl2(pet3)2 under pressure–insights of molecular
and crystal structure. CrystEngComm 2018.
(167).Ekin, J., Experimental techniques for low-temperature measurements: Cryostat design,
material properties and superconductor critical-current testing. Oxford university press: 2006.
(168).Sydoriak, S.; Roberts, T.; Sherman, R., The 1962 he3 scale of temperatures, ii.
Derivation. J. Res. Natl. Bur. Stand.(US) A 1964, 68, 559-565.
(169).McCarty, R. D.; Arp, V. D., A new wide range equation of state for helium. In
Advances in cryogenic engineering, Springer: 1990; pp 1465-1475.
(170).Younglove, B. A. Thermophysical properties of fluids. I. Argon, ethylene, parahydrogen, nitrogen, nitrogen trifluoride, and oxygen; NATIONAL STANDARD
REFERENCE DATA SYSTEM: 1982.
(171).Span, R.; Lemmon, E. W.; Jacobsen, R. T.; Wagner, W.; Yokozeki, A., A reference
equation of state for the thermodynamic properties of nitrogen for temperatures from 63.151

References
146
to 1000 k and pressures to 2200 mpa. Journal of Physical and Chemical Reference Data 2000, 29, 1361-1433.
(172).Katti, R.; Jacobsen, R.; Stewart, R.; Jahangiri, M., Thermodynamic properties of neon for temperatures from the triple point to 700 k at pressures to 700 mpa. In Advances in
cryogenic engineering, Springer: 1986; pp 1189-1197.
(173).Schmidt, R.; Wagner, W., A new form of the equation of state for pure substances and its application to oxygen. Fluid Phase Equilibria 1985, 19, 175-200.
(174).Tegeler, C.; Span, R.; Wagner, W., A new equation of state for argon covering the fluid region for temperatures from the melting line to 700 k at pressures up to 1000 mpa. Journal
of Physical and Chemical Reference Data 1999, 28, 779-850.
(175).Kreith, F.; Black, W. Z., Basic heat transfer. Harper & Row New York: 1980.
(176).Lawson, A.; Tang, T. Y., A diamond bomb for obtaining powder pictures at high
pressures. Review of Scientific instruments 1950, 21, 815-815.
(177).Weir, C.; Lippincott, E.; Van Valkenburg, A.; Bunting, E., Infrared studies in the 1-to
15-micron region to 30,000 atmospheres. J. Res. Natl. Bur. Stand. A 1959, 63, 55-62.
(178).Piermarini, G.; Block, S.; Barnett, J., Hydrostatic limits in liquids and solids to 100 kbar. Journal of Applied Physics 1973, 44, 5377-5382.
(179).Otto, J.; Vassiliou, J.; Frommeyer, G., Nonhydrostatic compression of elastically anisotropic polycrystals. I. Hydrostatic limits of 4: 1 methanol-ethanol and paraffin oil.
Physical Review B 1998, 57, 3253.
(180).Fujishiro, I. In Viscosities and glass transition pressures in the methanol-ethanol-water system, High Pressure Res. Ind. AIRAPT Conf. 8th, 1982; pp 608-511.
(181).Shen, Y.; Kumar, R. S.; Pravica, M.; Nicol, M. F., Characteristics of silicone fluid as a pressure transmitting medium in diamond anvil cells. Review of scientific instruments 2004,
75, 4450-4454.
(182).Ragan, D. D.; Clarke, D. R.; Schiferl, D., Silicone fluid as a high‐pressure medium in
diamond anvil cells. Review of scientific instruments 1996, 67, 494-496.
(183).Mao, H.; Bell, P., Observations of hydrogen at room temperature (25 c) and high
pressure (to 500 kilobars). Science 1979, 203, 1004-1006.
(184).LeSar, R.; Ekberg, S.; Jones, L.; Mills, R.; Schwalbe, L.; Schiferl, D., Raman spectroscopy of solid nitrogen up to 374 kbar. Solid State Communications 1979, 32, 131-
134.
(185).Murnaghan, F., Fd murnaghan, am. J. Math. 59, 235 (1937). Am. J. Math. 1937, 59,
235.
(186).Birch, F., Finite elastic strain of cubic crystals. Physical review 1947, 71, 809.
(187).Bhatt, H., Infrared spectroscopy of molecular solids under extreme conditions. 2016.

References
147
(188).Schmidt, C., First deuterated drug approved. Nature Biotechnology 2017, 35, 493.
(189).Mullard, A., Deuterated drugs draw heavier backing. Nature Reviews Drug Discovery
2016, 15, 219.
(190).Casati, N.; Macchi, P.; Sironi, A., Hydrogen migration in oxalic acid di-hydrate at high
pressure? Chemical communications 2009, 2679-2681.
(191).Macchi, P.; Casati, N.; Marshall, W. G.; Sironi, A., The α and β forms of oxalic acid di-hydrate at high pressure: A theoretical simulation and a neutron diffraction study.
CrystEngComm 2010, 12, 2596-2603.
(192).McMahon, M.; Nelmes, R.; Kuhst, W.; Dorwarth, R.; Piltz, R.; Tun, Z., Geometric
effects of deuteration on hydrogen-ordering phase transitions. Nature 1990, 348, 317.
(193).Merz, K.; Kupka, A., Deuterium perturbs the molecular arrangement in the solid state. Crystal Growth & Design 2015, 15, 1553-1558.
(194).Merz, K., Crystal engineering-using h/d exchange for molecular rearrangement. British Association For Crystal Growth Annual Conference 2017 2017.
(195).Rosado, M. T.; Duarte, M. L. T.; Fausto, R., Vibrational spectra of acid and alkaline glycine salts. Vibrational Spectroscopy 1998, 16, 35-54.
(196).Legros, J.-P.; Kvick, Å., Deformation electron density of α-glycine at 120 k. Acta
Crystallographica Section B: Structural Crystallography and Crystal Chemistry 1980, 36, 3052-3059.
(197).Destro, R.; Roversi, P.; Barzaghi, M.; Marsh, R. E., Experimental charge density of α-glycine at 23 k. The Journal of Physical Chemistry A 2000, 104, 1047-1054.
(198).Goncharov, A.; Struzhkin, V.; Somayazulu, M.; Hemley, R.; Mao, H., Compression of
ice to 210 gigapascals: Infrared evidence for a symmetric hydrogen-bonded phase. Science 1996, 273, 218-220.
(199).Bhatt, H.; Murli, C.; Mishra, A.; Verma, A. K.; Garg, N.; Deo, M.; Chitra, R.; Sharma, S. M., Hydrogen bond symmetrization in glycinium oxalate under pressure. The Journal of Physical Chemistry B 2016, 120, 851-859.
(200).Stewart, J. W., Compression and phase transitions of solid nh3, sif4, h2s, and cf4. The Journal of Chemical Physics 1960, 33, 128-133.
(201).Bhatt, H.; Murli, C.; Garg, N.; Deo, M.; Chitra, R.; Choudhury, R. R.; Sharma, S. M., High pressure phase transformations in bis (glycinium) oxalate–an infrared absorption study. Chemical Physics Letters 2012, 532, 57-62.
(202).Murli, C.; Thomas, S.; Venkateswaran, S.; M Sharma, S., Raman spectroscopic investigation of α-glycine at different temperatures. Physica B: Condensed Matter 2005, 364,
233-238.

References
148
(203).Chernobai, G.; Chesalov, Y. A.; Burgina, E.; Drebushchak, T.; Boldyreva, E., Temperature effects on the ir spectra of crystalliine amino acids, dipeptides, and polyamino
acids. I. Glycine. Journal of Structural Chemistry 2007, 48, 332-339.
(204).Surovtsev, N.; Malinovsky, V.; Boldyreva, E., Raman study of low-frequency modes in
three glycine polymorphs. The Journal of chemical physics 2011, 134, 01B626.
(205).Bordallo, H. N.; Boldyreva, E. V.; Buchsteiner, A.; Koza, M. M.; Landsgesell, S., Structure− property relationships in the crystals of the smallest amino acid: An incoherent
inelastic neutron scattering study of the glycine polymorphs. The Journal of Physical Chemistry B 2008, 112, 8748-8759.
(206).Feairheller, W. R.; Miller Jr, J., The infrared spectra of amino acids and some simple polypeptides to 33 cm− 1 at room and liquid nitrogen temperatures. Applied Spectroscopy 1971, 25, 175-182.
(207).Müller-Rowat, C.; Haeberlen, U.; Rowat, J.; Colpa, J. P., Temperature dependence of the reorientation of the nd3+ group in α-glycine. Chemical Physics 1985, 96, 327-332.
(208).Andrews, B.; Torrie, B. H.; Powell, B. M., Intermolecular potentials for alpha-glycine from raman and infrared scattering measurements. Biophysical Journal 1983, 41, 293-298.
(209).Ivanov, A.; Korolik, E.; Insarova, N.; Il'Ich, G., Application of low-temperature ir
spectroscopy to the analysis of the molecular structure of glycine. Journal of Applied Spectroscopy 1991, 54, 291-294.
(210).Shinozaki, A.; Komatsu, K.; Kagi, H.; Fujimoto, C.; Machida, S.; Sano-Furukawa, A.; Hattori, T., Behavior of intermolecular interactions in α-glycine under high pressure. The Journal of Chemical Physics 2018, 148, 044507.
(211).de Souza, J. M.; Freire, P. T.; Bordallo, H. N.; Argyriou, D. N., Structural isotopic effects in the smallest chiral amino acid: Observation of a structural phase transition in fully
deuterated alanine. The Journal of Physical Chemistry B 2007, 111, 5034-5039.
(212).Ichikawa, M., Hydrogen-bond geometry and its isotope effect in crystals with oho bonds—revisited. Journal of Molecular Structure 2000, 552, 63-70.
(213).Rozenberg, M.; Jung, C.; Shoham, G., Ordered and disordered hydrogen bonds in adenosine, cytidine and uridine studied by low temperature ft infrared spectroscopy. Physical
Chemistry Chemical Physics 2003, 5, 1533-1535.
(214).Rozenberg, M.; Shoham, G.; Reva, I.; Fausto, R., Low-temperature fourier transform infrared spectra and hydrogen bonding in polycrystalline l-alanine. Spectrochimica Acta Part
A: Molecular and Biomolecular Spectroscopy 2003, 59, 3253-3266.
(215).Yulei, S.; Li, W., Collective vibrational spectra of α- and γ-glycine studied by terahertz
and raman spectroscopy. Journal of Physics D: Applied Physics 2005, 38, 3741.
(216).Miao, P.; Torii, S.; Yonemura, M.; Ishikawa, Y.; Zhang, J.; Kamiyama, T. In Structure analysis on small molecular crystal by high resolution neutron powder diffraction, Journal of
Physics: Conference Series, IOP Publishing: 2014; p 012055.

References
149
(217).Thaper, C.; Dasannacharya, B.; Goyal, P.; Chakravarthy, R.; Tomkinson, J., Neutron scattering from glycine and deuterated glycine. Physica B: Condensed Matter 1991, 174,
251-256.
(218).Thaper, C. L.; Sinha, S. K.; Dasannacharya, B. A., Neutron inelastic scattering by
amino acids. AIP Conference Proceedings 1982, 89, 249-251.
(219).Kolesov, B. A.; Boldyreva, E. V., Self‐trapped n-h vibrational states in the polymorphs
of glycine, l‐and dl‐alanine. Journal of Raman Spectroscopy 2010, 41, 670-677.
(220).Novak, A., Hydrogen bonding in solids correlation of spectroscopic and crystallographic data. In Large molecules, Springer: 1974; pp 177-216.
(221).Mikenda, W., Stretching frequency versus bond distance correlation of o-d (h)⋯ y
(y=n, o, s, se, cl, br, i) hydrogen bonds in solid hydrates. Journal of Molecular Structure 1986, 147, 1-15.
(222).Rozenberg, M. S., Ir spectra and hydrogen bond energies of crystalline acid salts of carboxylic acids. Spectrochimica Acta Part A: Molecular and Biomolecular Spectroscopy
1996, 52, 1559-1563.
(223).Lutz, B.; van der Maas, J.; Kanters, J. A., Spectroscopic evidence for c-h⋯ interaction
in crystalline steroids and reference compounds. Journal of molecular structure 1994, 325, 203-214.
(224).Lutz, E.; Van der Maas, J., Hydrogen bonds in crystalline carbohydrates a variable-temperature ft-ir study. Journal of molecular structure 1994, 324, 123-132.
(225).Rozenberg, M.; Shoham, G.; Reva, I.; Fausto, R., A correlation between the proton
stretching vibration red shift and the hydrogen bond length in polycrystalline amino acids and peptides. Physical Chemistry Chemical Physics 2005, 7, 2376-2383.
(226).Iogansen, A., Direct proportionality of the hydrogen bonding energy and the intensification of the stretching ν (xh) vibration in infrared spectra. Spectrochimica Acta Part A: Molecular and Biomolecular Spectroscopy 1999, 55, 1585-1612.
(227).Li, J.; Ross, D., Evidence for two kinds of hydrogen bond in ice. Nature 1993, 365, 327-329.
(228).Zhang, X.; Sun, P.; Yan, T.; Huang, Y.; Ma, Z.; Zou, B.; Zheng, W.; Zhou, J.; Gong, Y.; Sun, C. Q., Water's phase diagram: From the notion of thermodynamics to hydrogen-bond cooperativity. Progress in Solid State Chemistry 2015, 43, 71-81.
(229).Huang, Y.; Zhang, X.; Ma, Z.; Zhou, Y.; Zheng, W.; Zhou, J.; Sun, C. Q., Hydrogen-bond relaxation dynamics: Resolving mysteries of water ice. Coordination Chemistry
Reviews 2015, 285, 109-165.
(230).Sobczyk, L.; Obrzud, M.; Filarowski, A., H/d isotope effects in hydrogen bonded systems. Molecules 2013, 18, 4467-4476.
(231).Pauwels, E.; Verstraelen, T.; De Cooman, H.; Van Speybroeck, V.; Waroquier, M., Temperature study of a glycine radical in the solid state adopting a dft periodic approach:

References
150
Vibrational analysis and comparison with epr experiments. The Journal of Physical Chemistry B 2008, 112, 7618-7630.
(232).Collins, M.; Whiffen, D., The electron spin resonance of irradiated glycine at 77° k. Molecular Physics 1966, 10, 317-325.
(233).Sanderud, A.; Sagstuen, E., Epr and endor studies of single crystals of α-glycine x-ray irradiated at 295 k. The Journal of Physical Chemistry B 1998, 102, 9353-9361.
(234).Sagstuen, E.; Sanderud, A.; Hole, E. O., The solid-state radiation chemistry of simple
amino acids, revisited. Radiation research 2004, 162, 112-119.
(235).Derbyshire, W.; Gorvin, T.; Warner, D., A deuteron magnetic resonance study of
deuterated glycine. Molecular Physics 1967, 12, 299-300.
(236).Ashcroft, N.; Mermin, N., Solid state physics (philadelphia: Saunders college). et seq 1976, 76.
(237).Sushchinskiĭ, M. M., Raman spectra of molecules and crystals. Israel Program for Scientific Translations: 1972.
(238).Forss, S., A raman spectroscopic temperature study of nh3+ torsional motion as related to hydrogen bonding in the l‐alanine crystal. Journal of Raman Spectroscopy 1982, 12, 266-
273.
(239).Bordallo, H. N.; Barthes, M.; Eckert, J., Vibrational dynamics of crystalline l-alanine.
Physica B: Condensed Matter 1997, 241, 1138-1140.
(240).Koegel, R. J.; Greenstein, J. P.; Winitz, M.; Birnbaum, S. M.; McCallum, R. A., Studies on diastereoisomeric α-amino acids and corresponding α-hydroxy acids. V. Infrared
spectra. Journal of the American Chemical Society 1955, 77, 5708-5720.
(241).Leifer, A.; Lippincott, E., The infrared spectra of some amino acids. Journal of the
American Chemical Society 1957, 79, 5098-5101.
(242).Sharma, B. B.; Murli, C.; Chitra, R.; Sharma, S. M., Hydrogen‐bonding interactions in
fully deuterated α‐glycine at high pressures. Journal of Raman Spectroscopy 2012, 43, 138-145.
(243).Ubbelohde, A., Les propriétés thermiques de la liaison hydrogène dans les cristaux. Journal de Chimie Physique 1949, 46, 429-437.
(244).Rundle, R., The deuterium effect on hydrogen bond distances in crystals. The Journal of Chemical Physics 1953, 21, 937-938.
(245).Katrusiak, A., Macroscopic and structural effects of hydrogen-bond transformations.
Crystallography Reviews 1996, 5, 133-175.
(246).Ichikawa, M.; Matsuo, T., Deuteration-induced structural phase transitions in some
hydrogen-bonded crystals. Journal of molecular structure 1996, 378, 17-27.

References
151
(247).Totsuji, C.; Matsubara, T., Deuteration induced phase transition in hydrogen bond. Solid state communications 1998, 105, 731-733.
(248).Totsuji, C.; Matsubara, T., Theory of phase transition induced by deuteration of hydrogen bond. JOURNAL-KOREAN PHYSICAL SOCIETY 1998, 32, S50-S52.
(249).Kume, Y.; Muraoka, H.; Yamamuro, O.; Matsuo, T., Deuteration-induced phase transition in ammonium hexachloroplumbate. The Journal of chemical physics 1998, 108, 4090-4097.
(250).Matsuo, T.; Inaba, A.; Yamamuro, O.; Onoda-Yamamuro, N., Proton tunnelling and deuteration-induced phase transitions in hydrogen-bonded crystals. Journal of Physics:
Condensed Matter 2000, 12, 8595.
(251).Bajaj, N.; Bhatt, H.; Murli, C.; Vishwakarma, S.; Chitra, R.; Ravindran, T.; Deo, M., Perceptible isotopic effect in 3d-framework of α-glycine at low temperatures. Spectrochimica
Acta Part A: Molecular and Biomolecular Spectroscopy 2018.
(252).Bhatt, H.; Deo, M., A synchrotron infrared absorption study of pressure induced
polymerization of acrylamide. Spectrochimica Acta Part A: Molecular and Biomolecular Spectroscopy 2017, 185, 45-51.
(253).GroŞan, C. B.; ALMĂŞAN, V., Structure and vibrational spectrum of l-leucine: A dft-
pcm investigation. CHEMIA 2011, 199.
(254).Bougeard, D., Phase transition and vibrational spectra of i‐leucine. Berichte der
Bunsengesellschaft für physikalische Chemie 1983, 87, 279-283.
(255).Pawlukojc, A.; Leciejewicz, J.; Natkaniec, I., The ins spectroscopy of amino acids: L-
leucine. Spectrochimica Acta Part A: Molecular and Biomolecular Spectroscopy 1996, 52, 29-32.
(256).Carabatos‐Nédelec, C.; Becker, P., Order–disorder and structural phase transitions in solid‐state materials by raman scattering analysis. Journal of Raman spectroscopy 1997, 28,
663-671.
(257).Minkov, V. S.; Drebushchak, V. A.; Ogienko, A. G.; Boldyreva, E. V., Decreasing
particle size helps to preserve metastable polymorphs. A case study of dl-cysteine. CrystEngComm 2011, 13, 4417-4426.
(258).Moggach, S. A.; Clark, S. J.; Parsons, S., L-cysteine-i at 30 k. Acta Crystallographica Section E: Structure Reports Online 2005, 61, o2739-o2742.
(259).Barthes, M.; Bordallo, H.; Denoyer, F.; Lorenzo, J.-E.; Zaccaro, J.; Robert, A.;
Zontone, F., Micro-transitions or breathers in l-alanine? The European Physical Journal B-Condensed Matter and Complex Systems 2004, 37, 375-382.
(260).Belo, E. A.; Pereira, J. E.; Freire, P. T.; Argyriou, D. N.; Eckert, J.; Bordallo, H. N., Hydrogen bonds in crystalline d-alanine: Diffraction and spectroscopic evidence for differences between enantiomers. IUCrJ 2018, 5, 6-12.

References
152
(261).Wu, H., Metal-organic compounds of iridium (iii) and platinum (ii): Synthesis, characterization and optoelectronic applications. 2014.
(262).Chatt, J.; Wilkins, R., 824. The nature of the co-ordinate link. Part vi. A comparison of equilibria between cis-and trans-(met 3) 2 ptcl 2, where m= p, as, and sb. Journal of the
Chemical Society (Resumed) 1952, 4300-4306.
(263).Chatt, J.; Williams, A., 677. The nature of the co-ordinate link. Part iv. Complex formation by phosphorus trifluoride. Journal of the Chemical Society (Resumed) 1951, 3061-
3067.
(264).Messmer, G.-G.; Amma, E., Crystal structures and multiple bonding in trans-pt [p
(c2h5) 3] 2cl2 and trans-pt [p (c2h5) 3] 2br2. Inorganic Chemistry 1966, 5, 1775-1781.
(265).Mason, R.; Meek, D. W., The versatility of tertiary phosphane ligands in coordination and organometallic chemistry. Angewandte Chemie International Edition 1978, 17, 183-194.
(266).Huheey, J. Organic Chemistry; Harper and Row: New York 1983, 432-441.
(267).Xiao, S.; Trogler, W.; Ellis, D.; Berkovich-Yellin, Z., Theoretical study of the frontier
orbitals of metal-phosphine complexes. Journal of the American Chemical Society 1983, 105, 7033-7040.
(268).Khramov, D. M.; Lynch, V. M.; Bielawski, C. W., N-heterocyclic carbene− transition
metal complexes: Spectroscopic and crystallographic analyses of π-back-bonding interactions. Organometallics 2007, 26, 6042-6049.
(269).Maeda, Y.; Hashimoto, H.; Kinoshita, I.; Nishioka, T., Π-back-bonding interaction depending on the bridging chain lengths of chelated n-heterocyclic carbene platinum units in heterometallic trinuclear complexes affecting their electrochemical property. Inorganic
chemistry 2014, 53, 661-663.
(270).Reddy, D.; Jaganyi, D., Controlling the extent of π-backbonding in platinum (ii)
terpyridyl systems: A detailed kinetic, mechanistic and computational approach. Dalton Transactions 2008, 6724-6731.
(271).Besara, T.; Jain, P.; Dalal, N. S.; Kuhns, P. L.; Reyes, A. P.; Kroto, H. W.; Cheetham,
A. K., Mechanism of the order–disorder phase transition, and glassy behavior in the metal-organic framework [(ch3) 2nh2] zn (hcoo) 3. Proceedings of the National Academy of
Sciences 2011.
(272).Chatt, J., The co-ordinate link in chemistry. Nature 1950, 165, 637.
(273).Chatt, J.; Leigh, G. J.; Mingos, D. M. P., Raman spectra of some tertiary phosphine
complexes of rhodium, iridium, palladium, and platinum. Journal of the Chemical Society A: Inorganic, Physical, Theoretical 1969, 2972-2975.
(274).Plyler, E. K., Infrared spectra of methanol, ethanol, and rz-propanol. Journal of Research of the National Bureau of Standards 1952, 48.
(275).Kaesz, H.; Stone, F., Infra-red spectra of some vinyl and ethyl compounds of mercury,
cadmium, zinc, tin and phosphorus. Spectrochimica Acta 1959, 15, 360-377.

References
153
(276).Goggin, P.; Goodfellow, R., Identification of the stereochemistry of square planar bis-triethylphosphine complexes by infrared spectroscopy. Journal of the Chemical Society A:
Inorganic, Physical, Theoretical 1966, 1462-1466.
(277).Goodfellow, R.; Evans, J.; Goggin, P.; Duddell, D., Infrared spectra (800–200 cm.–1)
of trimethylphosphine and trimethylarsine complexes of platinum and palladium mx 2 l 2 and m 2 x 4 l 2 (x= cl, br, or i). Journal of the Chemical Society A: Inorganic, Physical, Theoretical 1968, 1604-1609.
(278).Duddell, D.; Goggin, P.; Goodfellow, R.; Norton, M.; Smith, J., Vibrational spectra of some gold (i), palladium (ii), and platinum (ii) complexes with trialkylphosphines and
trialkylarsines. Journal of the Chemical Society A: Inorganic, Physical, Theoretical 1970, 545-564.
(279).Clark, H.; Tsang, W., Chemistry of metal hydrides. Ii. Spectroscopic studies of
fluorovinylplatinum (ii) derivatives. Journal of the American Chemical Society 1967, 89, 533-539.
(280).Bhatt, H.; Deo, M.; Vishwakarma, S.; Bajaj, N.; Sharma, S. M. In Ft-raman spectroscopy of structural isomers of pt (ii) complex ptcl2(pet3)2, AIP Conference Proceedings, AIP Publishing: 2015; p 090045.
h⋅⋅⋅ cl hydrogen bonding using inorganic supramolecular synthons: Lamellar, stitched
stair‐case, linked‐ladder, and helical structures. Chemistry-a European Journal 2004, 10,
1683-1690.
(282).Maczka, M.; da Silva, T. A.; Paraguassu, W.; Ptak, M.; Hermanowicz, K., Raman and ir studies of pressure-and temperature-induced phase transitions in [(ch2) 3nh2][zn (hcoo) 3].
Inorganic chemistry 2014, 53, 12650-12657.
(283).Suffren, Y.; Rollet, F.-G.; Reber, C., Raman spectroscopy of transition metal
complexes: Molecular vibrational frequencies, phase transitions, isomers, and electronic structure. Comments on Inorganic Chemistry 2011, 32, 246-276.
(284).Genre, C.; Levasseur-Thériault, G.; Reber, C., Emitting-state properties of square-
planar dithiocarbamate complexes of palladium (ii) and platinum (ii) probed by pressure-dependent luminescence spectroscopy. Canadian Journal of Chemistry 2009, 87, 1625-1635.
(285).Tidey, J. P.; Wong, H. L.; Schröder, M.; Blake, A. J., Structural chemistry of metal coordination complexes at high pressure. Coordination Chemistry Reviews 2014, 277, 187-207.
(286).Takeda, K.; Hayashi, J.; Shirotani, I.; Fukuda, H.; Yakushi, K., Structural, optical, and electrical properties of one-dimensional bis (dimethylglyoximato) nickel (ii), ni (dmg) 2 at
high pressure. Molecular Crystals and Liquid Crystals 2006, 460, 131-144.
(287).Shirotani, I.; Hayashi, J.; Takeda, K., X-ray study with synchrotron radiation for one-dimensional complex bis (diphenylglyoximato)-platinum (ii), pt (dpg) 2 at high pressures.
Molecular Crystals and Liquid Crystals 2005, 442, 157-166.

References
154
(288).Konno, M.; Okamoto, T.; Shirotani, I., Structure changes and proton transfer between o⋯ o in bis (dimethylglyoximato) platinum (ii) at low temperature (150k) and at high
pressures (2.39 and 3.14 gpa). Acta Crystallographica Section B: Structural Science 1989,
45, 142-147.
(289).Hansson, C.; Carlson, S.; Giveen, D.; Johansson, M.; Yong, S.; Oskarsson, Å., Cis/trans isomers of ptx2l2 (x= halogen, l= neutral ligand); the crystal structure of trans-
dichlorobis (dimethyl sulfide) platinum (ii) and the pressure dependence of its unit-cell dimensions. Acta Crystallographica Section B: Structural Science 2006, 62, 474-479.
(290).Kumar, A.; Ghosh, B.; Poswal, H.; Pandey, K.; Hosur, M.; Dwivedi, A.; Makde, R. D.; Sharma, S. M., Protein crystallography beamline (px-bl21) at indus-2 synchrotron. Journal of synchrotron radiation 2016, 23, 629-634.
(291).Pandey, K.; Poswal, H.; Mishra, A.; Dwivedi, A.; Vasanthi, R.; Garg, N.; Sharma, S. M., Energy-dispersive x-ray diffraction beamline at indus-2 synchrotron source. Pramana
2013, 80, 607-619.
(292).Jayaraman, A., Diamond anvil cell and high-pressure physical investigations. Reviews of Modern Physics 1983, 55, 65.
(293).Dewaele, A.; Loubeyre, P.; Mezouar, M., Equations of state of six metals above 94 gpa. Physical Review B 2004, 70, 094112.
(294).Hammersley, A., Fit2d: An introduction and overview. European Synchrotron Radiation Facility Internal Report ESRF97HA02T 1997, 68, 58.
(295).Toby, B. H.; Von Dreele, R. B., Gsas-ii: The genesis of a modern open-source all
purpose crystallography software package. Journal of Applied Crystallography 2013, 46, 544-549.
(296).Mao, H.; Xu, J.-A.; Bell, P., Calibration of the ruby pressure gauge to 800 kbar under quasi‐hydrostatic conditions. Journal of Geophysical Research: Solid Earth 1986, 91, 4673-
4676.
(297).Slebodnick, C.; Zhao, J.; Angel, R.; Hanson, B. E.; Song, Y.; Liu, Z.; Hemley, R. J., High pressure study of ru3 (co) 12 by x-ray diffraction, raman, and infrared spectroscopy.
Inorganic chemistry 2004, 43, 5245-5252.
(298).Murli, C.; Sharma, S. M.; Kulshreshtha, S.; Sikka, S., High-pressure behavior of β-ni
(oh) 2—a raman scattering study. Physica B: Condensed Matter 2001, 307, 111-116.
(299).Kresse, G., G. Kresse and j. Furthmüller, phys. Rev. B 54, 11169 (1996). Phys. Rev. B 1996, 54, 11169.
(300).Kresse, G.; Furthmüller, J., Efficiency of ab-initio total energy calculations for metals and semiconductors using a plane-wave basis set. Computational materials science 1996, 6,
15-50.
(301).Blöchl, P. E., Projector augmented-wave method. Physical review B 1994, 50, 17953.

References
155
(302).Perdew, J. P.; Burke, K.; Ernzerhof, M., Generalized gradient approximation made simple. Physical review letters 1996, 77, 3865.
(303).Monkhorst, H. J.; Pack, J. D., Special points for brillouin-zone integrations. Physical review B 1976, 13, 5188.
(304).Allkins, J. R.; Obremski, R. J.; Brown, C. W.; Lippincott, E. R., Effect of high pressure on the vibrational spectra of square-planar coordination compounds. Inorganic Chemistry 1969, 8, 1450-1454.
(305).Gonzalez-Platas, J.; Alvaro, M.; Nestola, F.; Angel, R., Eosfit7-gui: A new graphical user interface for equation of state calculations, analyses and teaching. Journal of Applied
Crystallography 2016, 49, 1377-1382.
(306).Cliffe, M. J.; Goodwin, A. L., Pascal: A principal axis strain calculator for thermal expansion and compressibility determination. Journal of Applied Crystallography 2012, 45,
1321-1329.
(307).Bondi, A., Van der waals volumes and radii. The Journal of physical chemistry 1964,
68, 441-451.
(308).Aullón, G.; Bellamy, D.; Orpen, A. G.; Brammer, L.; Bruton, E. A., Metal-bound chlorine often accepts hydrogen bonds. Chemical Communications 1998, 653-654.
(309).Aakeröy, C. B.; Evans, T. A.; Seddon, K. R.; Pálinkó, I., The c–h··· cl hydrogen bond: Does it exist? New Journal of Chemistry 1999, 23, 145-152.
(310).Shimon, L.; Vaida, M.; Addadi, L.; Lahav, M.; Leiserowitz, L., Molecular recognition at the solid-solution interface: A relay mechanism for the effect of solvent on crystal growth and dissolution. Journal of the American Chemical Society 1990, 112, 6215-6220.
(311).Perlstein, J., The weak hydrogen bond in structural chemistry and biology (international union of crystallography, monographs on crystallography, 9) by gautam r.
Desiraju (university of hyderabad) and thomas steiner (freie universität berlin). Oxford university press: Oxford and new york. 1999. Xiv+ 507 pp. $150. Isbn 0-19-850252-4. ACS Publications: 2001.
(312).Spanu, L.; Donadio, D.; Hohl, D.; Schwegler, E.; Galli, G., Stability of hydrocarbons at deep earth pressures and temperatures. Proceedings of the National Academy of Sciences
2011, 108, 6843-6846.
(313).Livengood, T.; Kostiuk, T.; Sonnabend, G.; Annen, J.; Fast, K.; Tokunaga, A.; Murakawa, K.; Hewagama, T.; Schmülling, F.; Schieder, R., High‐resolution infrared
spectroscopy of ethane in titan's stratosphere in the huygens epoch. Journal of Geophysical
Research: Planets 2006, 111.
(314).Levasseur-Thériault, G.; Reber, C.; Aronica, C.; Luneau, D., Large pressure-induced red shift of the luminescence band originating from nonstacked square-planar [pt (scn) 4] 2-in
a novel trimetallic complex. Inorganic chemistry 2006, 45, 2379-2381.

References
156
(315).Postmus, C.; Nakamoto, K.; Ferraro, J. R., High-pressure effect on far-infrared spectra. I. Symmetric and antisymmetric metal-halogen stretching vibrations. Inorganic Chemistry
1967, 6, 2194-2199.
(316).Mitra, S.; Postmus, C.; Ferraro, J., Pressure dependence of long-wavelength optical
phonons in ionic crystals. Physical Review Letters 1967, 18, 455.
(317).Allan, D. R.; Bailey, D.; Bird, N.; Blake, A. J.; Champness, N. R.; Huang, D.; Keane, C. P.; McMaster, J.; Prior, T. J.; Tidey, J. P., High-pressure studies of palladium and platinum
thioether macrocyclic dihalide complexes. Acta Crystallographica Section B: Structural Science, Crystal Engineering and Materials 2014, 70, 469-486.
(318).Gould, J. A.; Rosseinsky, M. J.; Moggach, S. A., Tuning the coordination chemistry of a cu (ii) complex at high-pressure. Dalton Transactions 2012, 41, 5464-5467.
(319).Scheins, S.; Overgaard, J.; Timco, G. A.; Stash, A.; Chen, Y. S.; Larsen, F. K.;
Christensen, M.; Jørgensen, M. R.; Madsen, S. R.; Schmøkel, M. S., Pressure versus temperature effects on intramolecular electron transfer in mixed‐valence complexes.
Chemistry-A European Journal 2013, 19, 195-205.
(320).Wilson, C.; Iversen, B. B.; Overgaard, J.; Larsen, F. K.; Wu, G.; Palii, S. P.; Timco, G.
A.; Gerbeleu, N. V., Multi-temperature crystallographic studies of mixed-valence polynuclear complexes; valence trapping process in the trinuclear oxo-bridged iron compound,[fe3o (o2cc
(ch3) 3) 6 (c5h5n) 3]. Journal of the American Chemical Society 2000, 122, 11370-11379.
(321).Galloway, K. W.; Moggach, S. A.; Parois, P.; Lennie, A. R.; Warren, J. E.; Brechin, E. K.; Peacock, R. D.; Valiente, R.; González, J.; Rodríguez, F., Pressure-induced switching in a
copper (ii) citrate dimer. CrystEngComm 2010, 12, 2516-2519.
(322).Prescimone, A.; Sanchez-Benitez, J.; Kamenev, K. K.; Moggach, S. A.; Warren, J. E.;
Lennie, A. R.; Murrie, M.; Parsons, S.; Brechin, E. K., High pressure studies of hydroxo-bridged cu (ii) dimers. Dalton Transactions 2010, 39, 113-123.
(323).Allan, D. R.; Blake, A. J.; Huang, D.; Prior, T. J.; Schröder, M., High pressure co-
ordination chemistry of a palladium thioether complex: Pressure versus electrons. Chemical Communications 2006, 4081-4083.
(324).Boldyreva, E.; Kivikoski, J.; Howard, J. A., Distortion of crystal structures of some coiii ammine complexes. I. Distortion of crystal structure of [co (nh3) 5no2] cl (no3) on cooling. Acta Crystallographica Section B: Structural Science 1997, 53, 394-404.
(325).Boldyreva, E. V., High-pressure diffraction studies of molecular organic solids. A personal view. Acta Crystallographica Section A: Foundations of Crystallography 2008, 64,
218-231.
(326).Bujak, M.; Angel, R. J., High-pressure-and low-temperature-induced changes in [(ch3) 2nh (ch2) 2nh3][sbcl5]. The Journal of Physical Chemistry B 2006, 110, 10322-10331.
(327).Fisher, G. A.; Norman, N. C., The structures of the group 15 element (iii) halides and halogenoanions. In Advances in inorganic chemistry, Elsevier: 1994; Vol. 41, pp 233-271.
References
157
(328).Sobczyk, L.; Jakubas, R.; Zaleski, J., Self-assembly of sb (iii) and bi (iii) halo-coordinated octahedra in salts of organic cations. Structure, properties and phase transitions.
Polish Journal of Chemistry 1997, 71, 265-300.
(329).Bujak, M.; Zaleski, J., Synthesis of chloroantimonates (iii) with selected organic
cations. X-ray studies of phase transition in ferroelectric tris (trimethylammonium) nonachlorodiantimonate (iii) at 125k. Journal of Solid State Chemistry 2004, 177, 3202-3211.
(330).Bujak, M.; Angel, R. J., Low-temperature single crystal x-ray diffraction and high-
pressure raman studies on [(ch 3) 2 nh 2] 2 [sbcl 5]. Journal of Solid State Chemistry 2007, 180, 3026-3034.