rôle du couple flt3-ligand/flt3 et de l'activation des ... · gpix : glycoprotein ix gpv :...
TRANSCRIPT

HAL Id: tel-00652595https://tel.archives-ouvertes.fr/tel-00652595
Submitted on 15 Dec 2011
HAL is a multi-disciplinary open accessarchive for the deposit and dissemination of sci-entific research documents, whether they are pub-lished or not. The documents may come fromteaching and research institutions in France orabroad, or from public or private research centers.
L’archive ouverte pluridisciplinaire HAL, estdestinée au dépôt et à la diffusion de documentsscientifiques de niveau recherche, publiés ou non,émanant des établissements d’enseignement et derecherche français ou étrangers, des laboratoirespublics ou privés.
Rôle du couple Flt3-ligand/Flt3 et de l’activation des”Mitogen-activated protein kinases” p38 dans la
dysmégacaryopoïèse des patients atteints demyélofibrose primitive
Christophe Desterke
To cite this version:Christophe Desterke. Rôle du couple Flt3-ligand/Flt3 et de l’activation des ”Mitogen-activated proteinkinases” p38 dans la dysmégacaryopoïèse des patients atteints de myélofibrose primitive. Médecinehumaine et pathologie. Université Paris Sud - Paris XI, 2011. Français. <NNT : 2011PA11T020>.<tel-00652595>
ECOLE DOCTORALE DE CANCEROLOGIE
UNIVERSITE PARIS SUD/11
FACULTE DE MEDECINE PARIS SUD
THESE pour l’obtention du grade de
DOCTEUR DE L’UNIVERSITE PARIS SUD/11
Spécialité : CANCEROLOGIE
Présentée et soutenue publiquement par
DESTERKE Christophe
Le 25 mai 2011, à Villejuif
Rôle du couple Flt3 ligand/Flt3 et de l’activation des « Mitogen-
activated protein Kinases » p38 dans la dysmégacaryopoïèse
des patients atteints de myélofibrose primitive
Membres du jury
Président: Pr. Olivier Hermine
Rapporteur : Dr. Françoise Porteu
Rapporteur : Dr. Jean Ripoche
Examinateur : Dr. Marie-Françoise Bourgeade
Examinateur : Pr. Jean-Loup Demory
Directeur de thèse : Dr. Marie-Caroline Le Bousse-Kerdilès
Co-directeur de thèse : Dr. Chrystèle Bilhou-Nabéra
1

2

REMERCIEMENTS
Je tiens à remercier toutes les personnes qui m’ont soutenu au cours de ma thèse, tant
sur le plan scientifique que personnel.
La thèse est une grande aventure au cours de laquelle il faut savoir tenir « le cap » et
sans le soutien des personnes qui m’ont accompagné, jamais je n’aurais pu atteindre cet
objectif.
A mon père : André DESTERKE,
A ma mère : Nicole DESTERKE,
A ma famille et à mes amis,
je voudrais exprimer un grand merci pour tous leurs encouragements.
Je remercie les membres de mon jury de thèse.
Mr le Professeur Olivier Hermine de me faire l’honneur de juger ma thèse en
qualité de président de jury et pour l’intérêt scientifique manifesté.
Mme le Dr Françoise Porteu et Mr le Docteur Jean Ripoche de me faire
l’honneur de juger ma thèse en qualité de rapporteur et pour l’intérêt scientifique manifesté.
Mme le Dr Marie-Françoise Bourgeade et Mr le Docteur Jean-Loup Demory
de me faire l’honneur de juger ma thèse en qualité d’examinateur et pour l’intérêt scientifique
manifesté.
Je remercie mon directeur de thèse Marie-Caroline Le Bousse-Kerdilès, pour m’avoir
donné l’opportunité de mener à bien ce travail au sein de son équipe, pour son soutien continu
pendant toutes ces années d’étude et pour sa gentillesse.
Je remercie mon co-directeur de thèse Chrystèle Bilhou-Nabéra pour m’avoir éclairé
de ses connaissances en génétique et pour son soutien.
Je remercie les membres de l’équipe de Marie-Caroline Le Bousse-Kerdilès
notamment et particulièrement Bernadette Guerton pour son soutien, sa gentillesse, sa
disponibilité et son aide. Je tiens à remercier Denis Clay pour ses conseils en cytométrie. Je
tiens à remercier aussi les personnes de passage dans l’équipe au cours de cette
3

période notamment : Olivier Pierre-Louis, Aurélie Chabanon, Christophe Martinaud, Frédéric
Torossian avec qui j’ai passé des moments constructifs au cours de cette période.
Je remercie, Claude Boucheix et Georges Uzan, qui m’ont accueilli dans leur unité
INSERM respective U602, puis U972, durant la réalisation de mes travaux de thèse.
Je remercie les organismes financiers qui ont investi dans ces études :
- L’association NRB : Nouvelles Recherches Biomédicales pour les contrats m’ayant
permis de débuter ma thèse
- L’Institut National du Cancer (INCA) pour le financement accordé à ce sujet d’étude
- L’association Laurette Fugain pour le financement accordé à ce sujet d’étude
- La Société Française d’Hématologie pour l’obtention du prix d’Hématologie 2008
- L’Université Paris Sud/11 qui m’a octroyé un poste d’Ingénieur de Recherche ; ceci
m’a permis de mener à bien la fin de mon travail de thèse.
Je remercie les patients ainsi que les cliniciens pour les échantillons qui ont permis la
réalisation de cette étude.
Je remercie également le Centre de Transfusion Sanguine des Armées (CTSA) de
l’hôpital Percy à Clamart et tout particulièrement le Professeur Jean-Jacques Lataillade, pour
les échantillons sanguins.
Je remercie les chirurgiens orthopédistes du Centre Hospitalier Robert Ballanger
d’Aulnay sous Bois pour les prélèvements de moelle osseuse.
4

ABREVIATIONS 3’UTR : « 3’untranslated-region » 5-AZA : 5-azacytidine 5-FU : 5-fluorouracil ABCG2 : ATP-binding cassette, sub-family G (WHITE), member 2 ABL : oncogène Abelson ADN : acide désoxyribonucléique AGM : aorta gonad mesonephros ALDH : aldehyde dehydrogenase Ang-1 : angiopoïétine 1 Anx2 : annexine 2 AP1 : activator Protein 1 ARE : AU rich elements ARNm : acide ribonucléique messager Atf : activating transcription factor ATM : ataxia telangiectasia mutated BCL2 : B-cell CLL/lymphoma 2 Bcl-XL : BCL2-like 1 bFGF : basic fibroblast growth factor BFU-EM : « burst forming unit » érythro-mégacaryocytaire BIM : BCL2-like 11 (apoptosis facilitator) BMI1 : BMI1 polycomb ring finger oncogene BNIP3 : BCL2/adenovirus E1B 19 kDa interacting protein 3a BOM : biopsie ostéo-médullaire Cad : cadhérine CAFC : cobblestone aera-forming cell-assay CAMT : thrombocytopénie amégacaryocytaire congénitale CAR : CXCL12 abundant reticular cell CBL : Cas-Br-M (murine) ecotropic retroviral transforming sequence CBP : Csk-binding protein CD9 : tétraspanine 9 CDKI : cyclin dependent kinase inhibitor c-FMS : alias CSF1R (colony stimulating factor 1 receptor) CFU: colony forming unit CFU-EM : « colony forming unit » érythro-mégacaryocytaire CFU-GEMM : « colony forming unit » granulo-érythro-méga-monocytaire CFU-Meg : « colony forming unit » mégacaryocytaire CFU-S : colony forming unit in the spleen c-kit : v-kit Hardy-Zuckerman 4 feline sarcoma viral oncogene homolog CLP : progéniteur commun lymphoïde CMP : progéniteur commun myéloïde c-MPL : gène du récepteur à la thrombopoïétine c-myc : v-myc myelocytomatosis viral oncogene homolog (avian) CNTF : ciliary neurotrophic factor Creb : cAMP responsive element binding protein CSH : cellule souche hématopoïétique CSM : cellule souche/stromale mésenchymateuse CXCR4 : récepteur de la chimiokine CXCL12 Cys : région riche en cystéine DAPI : 4',6'-diamidino-2-phénylindole DMS : système de démarcation membranaire DUSP : « Dual specificity MAPK phosphatase » E : répétition EGF homologue
5

EGF : epithelial growth factor EPO : érythropoïétine EPO-R : récepteur de l'érythropoïétine ERK : elk-related tyrosine kinase FERM : domaine de liaison des partenaires FGF-4 : fibroblast growth factor 4 FGFR : récepteur du « fibroblast growth factor » FITC : fluorescein isothiocyanate FL : Flt3-ligand FLI-1 : Friend leukemia virus integration 1 FLK1 : « fetal liver kinase 1 », alias KDR ou VEGFR2
FLK2 : « fetal liver kinase 2 », alias FLT3
FLT1 : « FMS-like tyrosine kinase 1 », alias VEGFR1 FLT3: « FMS-like tyrosine kinase 3 » FLT4: « FMS-like tyrosine kinase 4 », alias VEGFR3
Fn : fibronectine FOG-1 : Friend of GATA-1 FOS : FBJ murine osteosarcoma viral oncogene homolog FRA1 : jun B proto-oncogene, alias JUNB
G6PD : glucose 6 phosphate dehydrogenase GATA-1 : GATA binding protein 1 (globin transcription factor 1) G-CSF : granulocyte colony stimulating factor GM-CSF : « granulocyte monocyte colony stimulating factor » GMP : progéniteur granulo-monocytaire gp130 : chaîne de glycoprotéines 130 kDa des récepteurs aux cytokines GPCR : récepteur couplé aux protéines G GPIb! : glycoprotein Ib, alpha polypeptide GPIX : glycoprotein IX GPV : glycoprotein V Grb2 : growth factor receptor-bound protein 2 H2A : histone 2A H2B : histone 2B H3 : histone 3 H4 : histone 4 HAC : histone acétylase HDAC : histone déacétylase HDACi : inhibiteur d'HDAC HLA : human leukocyte antigen HPRT : hypoxanthine phosphoribosyltransferase IFN : interféron IGF-1 : insulin growth factor IL : interleukine IR : récepteur à l'insuline ITD : internal tandem duplication Jak : Janus kinase Jak2V617F : mutation V617F de la tyrosine Jak2 JH1 : domaine Janus-like 1 JH2 : domaine Janus-like 2 JNK : c-Jun NH2-terminal kinase JUN : oncogene JUN, alias AP1
L : leucine LAM : leucémie aiguë myéloïde LCM : laser capture microdissection LEF-1 : lymphoid enhancer-binding factor 1 LIF : leukemia inhibitor factor
6

Lin : lineage LMC : leucémie myéloïde chronique LTC-IC : long term culture-initiating cell MAF: v-maf musculoaponeurotic fibrosarcoma oncogene homolog (avian) MAPK : mitogen-activated protein kinase mb-FL : Flt3-ligand membranaire MCAM : melanoma-associated cell adhesion molecule MCL1 : myeloid cell leukemia sequence 1 M-CSF : macrophage colony stimulating factor MEP : progéniteur érythrocytaire mégacaryocytaire MFP : myélofibrose primitive MK : mégacaryocyte MMP : métalloprotéase Nix : BCL2/adenovirus E1B 19kDa interacting protein 3-like NK : “natural killer” NOD/SCID : nonobese diabetes/severe combined immunodeficiency OSM : oncostatin M PDGFR : récepteur du “platelet-derived growth factor" PF4 : facteur 4 plaquéttaire PGK : phosphoglycerate kinase PH : progéniteur hématopoïétique PI3K : phosphotidylinositol 3 kinase PICP : carboxy-terminal peptique du procollagène de type I PIIIP : amino-terminal peptide du procollagène de type III PM : progéniteur multipotent PRL : prolactine Pseudo TK : domaine pseudo tyrosine kinase PU.1 : “spleen focus forming virus (SFFV) proviral integration oncogene SPI1” PUMA : “Bcl2 binding component 3” PV : polycythemia vera QRT-PCR : « quantitative reverse transcription-polymerase chain reaction » RANK : “receptor activator of nuclear factor kappa B” RANKL : “receptor activator of nuclear factor kappa B ligand” RET : “rearranged during transfection protooncogene” RPL38 : « ribosomal protein L38 » RTK : récepteur à activité tyrosine kinase S1P : sphingosine-1-phosphate SCF : “stem cell factor” ou “kit ligand” SDF-1 : “stromal derived factor-1”, alias CXCL12 s-FL : Flt3-ligand soluble SH2 : domaine SRC homologue 2 SHC : «SHC (Src homology 2 domain containing) transforming protein 1 SKF : « Src kinase family » SLAM : « signaling lymphocyte activation molecule » SMD : syndrome myélodysplasique SMP : néoplasme myéloprolifératif SNO : “spindle-shaped N-cadherin+ osteoblasts” SOCS3 : “suppressor of cytokine signaling 3” SRC : “SCID repopulating cell” STAT5 : “Signal transducer and activator of transcription 5” TACE : “TNF-alpha converting enzyme” TE : thrombocythémie essentielle TET2 : “TET oncogene family member 2” TF : “transcription factor” TGF-"1 : « transforming growth factor-beta 1 »
7

Thr : thréonine Tie-1 : « tyrosine kinase with immunoglobulin-like and EGF-like domains 1 » Tie-2 : TEK : « angiopoietin-1 receptor » TK : tyrosine kinase TM : transmembranaire TNF : « tumor necrosis factor » TPO : thrombopoïétine TRE : « TPA-response element » TRK : récepteur de la tropomyosine TrkA : « tyrosine kinase receptor A » TrkB : « tyrosine kinase receptor B » TrkC : « tyrosine kinase receptor C » TSA : trichostatine A Tyr : tyrosine UTR : « untranslated region » VCAM-1 : « vascular cell adhesion molecule 1 » VEGF : « vascular endothelial growth factor » VEGFR : "vascular endothelial growth factor receptor" VLA-4 : « very late antigen-4» VPA : acide valproïque VWF : facteur von Willebrand WNT : « wingless-related MMTV integration site » "2M : beta 2 microglobuline "-TG : "-thromboglobuline
8
LISTE DES FIGURES
Figure 1 : Coupe de biopsie ostéo-médullaire......................................................................... 24 Figure 2 : Représentation schématique des différents types cellulaires constituant le tissu
médullaire................................................................................................................................. 27 Figure 3 : Représentation schématique des voies extrinsèque (membranaire) et intrinsèque
(mitochondriale) de l’apoptose ................................................................................................ 28 Figure 4 : Points de contrôle apoptotique au cours de la différenciation hématopoïétique ... 31 Figure 5 : Organisation hiérarchique de l’hématopoïèse ....................................................... 33 Figure 6 : Principaux tests de mise en évidence des différents types de cellules
hématopoïétiques humaines ..................................................................................................... 36 Figure 7: Principaux marqueurs des cellules hématopoïétiques au cours de la différenciation
lympho-myéloïde chez l’homme ............................................................................................... 39 Figure 8 : Profil d’expression des molécules SLAM chez la souris......................................... 40 Figure 9 : Transmission du signal de la membrane au noyau................................................. 43 Figure 10 : Cellules cibles de l’action des cytokines et des facteurs de croissance au cours de
la différenciation hématopoïétique........................................................................................... 45 Figure 11 : Représentation schématique des familles de récepteurs aux cytokines selon la
présence de chaînes communes ................................................................................................ 47 Figure 12 : Structure des Janus kinases (Jak). ........................................................................ 47 Figure 13 : Représentation des familles de RTK exprimés dans le tissu hématopoïétique. .... 49 Figure 14 : Principales activités biologiques des chimiokines................................................ 53 Figure 15 : Les niches ostéoblastiques et vasculaires de la moelle osseuse ........................... 59 Figure 16 : Régulation de l’équilibre entre quiescence et mise en cycle des cellules souches hématopoïétiques (CSH) dans la niche médullaire endostéale................................................ 64 Figure 17 : Organisation du nucléosome et code histone ....................................................... 67 Figure 18 : Effets à court ou long terme liés aux modifications des histones ......................... 67 Figure 19 : Principaux marqueurs membranaires exprimés au cours de la différenciation
mégacaryocytaire ..................................................................................................................... 71 Figure 20 : Illustration de la maturation mégacaryocytaire ................................................... 73 Figure 21 : Régulation de la mégacaryopoïèse par les cytokines, les chimiokines et les
facteurs de transcription. ......................................................................................................... 74 Figure 22 : Principales voies de signalisation activées par la thrombopoïétine au cours de la
mégacaryopoïèse in vitro. ........................................................................................................ 79 Figure 23 : Structure du récepteur Flt3................................................................................... 81 Figure 24 : Principales voies de signalisation activées par la liaison de Flt3 ligand (FL) à
son récepteur Flt3 .................................................................................................................... 83 Figure 25 : Rôle du Flt3-ligand dans les interactions CSH-microenvironnement au sein de la
moelle osseuse .......................................................................................................................... 87 Figure 26 : Schéma simplifié de la signalisation des MAP Kinases........................................ 91 Figure 27 : Mécanismes impliqués dans la régulation des MAPKs p38 ................................. 95 Figure 28 : Sénescence induite par p38 dans les cellules normales versus les cellules de
patients atteints de LMC exprimant la protéine de fusion BCR-ABL ...................................... 98 Figure 29 : Réponse transcriptionnelle du complexe JUN/AP1 en aval des MAPK ............ 101 Figure 30 : Modulation croisée de la voie MAPK p38 avec d’autres voies de signalisation 102 Figure 31 : Classification des néoplasmes myéloprolifératifs............................................... 104 Figure 32 : Activation des voies de signalisation dans les néoplasmes myéloprolifératifs ... 108 Figure 33 : Altérations cellulaires (sang et moelle osseuse) observées chez un patient atteint de MFP ................................................................................................................................... 114 Figure 34 : Caractérisation histologique de la fibrose médullaire ....................................... 114
9

Figure 35 : Eléments anatomo-pathologiques diagnostiques de la Myélofibrose Primitive . 115 Figure 36 : Caractéristiques physiopathologiques de la myélofibrose primitive .................. 120 Figure 37: Rôle des facteurs de croissance produits par les cellules du clone hématopoïétique dans le processus fibrotique ................................................................................................... 127 Figure 38 : Modèle physiopathologique « Bad Seed in Bad Soil » ....................................... 129 Figure 39 : Schéma expérimental de la CGH array pangénomique...................................... 146 Figure 40 : Diagramme résumant les variations moyennes quantitatives par chromosomes
dans les cellules CD34+ et polynucléaires chez les patients par rapport aux sujets sains.... 147
Figure 41: Cartographie des délétions 13q dans les cellules CD34+ et les polynucléaires de
patients atteints de MFP par CGH array pan-génomique..................................................... 148 Figure 42 : Transcriptome des cellules CD34
+ de patients atteints de myélofibrose primitive :
................................................................................................................................................ 150 Figure 43 : Comparaison des données du transcriptome des cellules CD34
+ et des données de
CGH array ciblées sur la région de la délétion 13q .............................................................. 151 Figure 44 : Organisation du promoteur du gène FLT3 sur le chromosome 13 et prédiction
bioinformatique d’ilots CpG et des sites de fixation de facteurs de transcription................. 160 Figure 45 : Effet de la 5-azacytidine sur l’expression membranaire de Flt3 sur les cellules de
lignées hématopoïétiques ....................................................................................................... 162 Figure 46 : Effet du 5-AZA sur la migration des précurseurs mégacaryoctaires en réponse au
Flt3-ligand (FL) ..................................................................................................................... 165 Figure 47 : Effet de la trichostatine A (TSA) sur la migration des précurseurs
mégacaryoctaires en réponse au Flt3-ligand (FL) ................................................................ 165 Figure 48 : Etude de la modification du pourcentage de précurseurs mégacayocytaires de
patients présentant differents résidus lysine acétylés d’histones en réponse à une stimulation
par le Flt3-ligand (FL) ........................................................................................................... 166 Figure 49 : Rôle de l’activation des MAPK dans la réponse aux cytokines et le contrôle de la
prolifération cellulaire ........................................................................................................... 179 Figure 50 : La réponse cellulaire aux cytokines et au stress peut induire une régulation
transcriptionnelle conduisant à une modification de l’acétylation des histones par
l’intermédaire du complexe AP-1 .......................................................................................... 180 Figure 51: Conséquences du processus inflammatoire au sein d’un tissu ............................ 180 Figure 52 : Rôle d’une altération de l’axe « Flt3-ligand/Flt3/p38 » dans la
dysmégacaryopoïèse des patients atteints de MFP ................................................................ 184 Figure 53: Evolution clinique possible des NMP BCR-ABL-1 négatifs ................................ 189 Figure 54: Hypothèse d’acquisition des événements génétiques et cytogénétiques dans la
progression des pathologies myéloïdes.................................................................................. 189 Figure 55: Gain et perte de fonctions associées à une activation STAT ............................... 192
10

LISTE DES TABLEAUX
Tableau 1 : Profil phénotypique, fonctionnel et métabolique des populations enrichies en
cellules souches hématopoïétiques chez la souris et chez l’homme au cours du développement
.................................................................................................................................................. 39 Tableau 2 : Comparaison des profils d’expression des molécules SLAM chez l’homme et la
souris ........................................................................................................................................ 40 Tableau 3 : Principaux agents mobilisateurs des CSH/PH ..................................................... 56 Tableau 4 : Fonction des MAPKs en relation avec les phénotypes des souris déficientes...... 89 Tableau 5 : Protéines MAPK et leurs principaux effecteurs ................................................... 89 Tableau 6 : Bilan des mutations présentes chez les patients atteints de néoplasmes
myéloprolifératifs chroniques BCR-ABL1 négatifs................................................................ 108 Tableau 7 : Critères diagnostiques de la myélofibrose primitive .......................................... 113 Tableau 8: Classification des lésions histologiques médullaires dans la MFP..................... 113 Tableau 9: Description des UPD découverts dans les pathologies myéloïdes ...................... 188
11

12

SOMMAIRE
13

14
INTRODUCTION.................................................................................................................... 21 1/ L’hématopoïèse .................................................................................................................... 25 1.1/ Organisation du tissu hématopoïétique ............................................................................. 25 1.2/ Les cellules souches hématopoïétiques............................................................................. 26 1.3/ Rôle de l’apoptose dans l’homéostasie des cellules hématopoïétiques et l’équilibre survie/différenciation des CSH ................................................................................................ 29 2/ Propriétés et mise en évidence des cellules souches hématopoïétiques............................... 32 2.1/ Propriétés des cellules souches hématopoiètiques ............................................................ 32 2.2/ Tests de mise en évidence des cellules souches et progéniteurs hématopoïétiques.......... 34
2.2.1/ Caractérisation des cellules souches et progéniteurs hématopoïétiques par des tests fonctionnels ...................................................................................................................... 35 2.2.2/ Caractérisation des cellules souches et progéniteurs hématopoïétiques par leurs propriétés métaboliques.................................................................................................... 37 2.2.3/ Caractérisation des progéniteurs hématopoïétiques par l’expression de marqueurs membranaires ................................................................................................................... 37
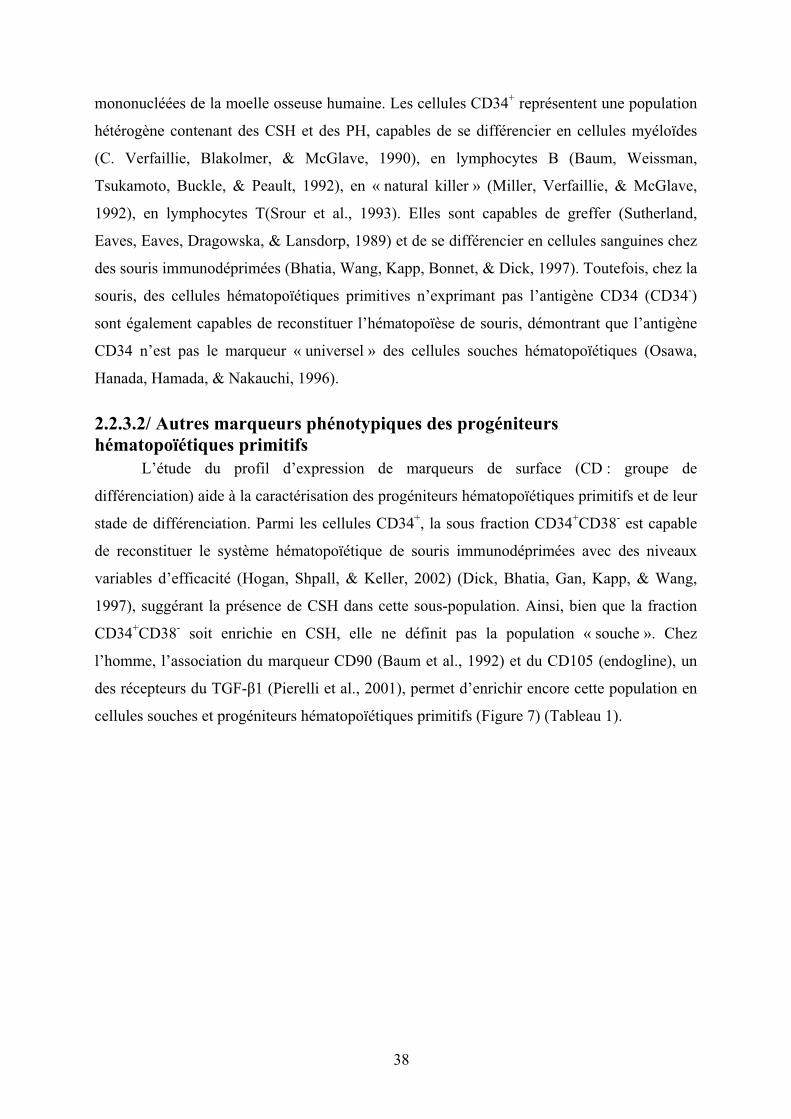
2.2.3.1/ La molécule de surface CD34 ......................................................................... 37 2.2.3.2/ Autres marqueurs phénotypiques des progéniteurs hématopoïétiques primitifs...................................................................................................................................... 38
3/ Régulation de l’hématopoïèse .............................................................................................. 42 3.1/ Les cytokines et facteurs de croissance............................................................................. 44 3.2/ Les récepteurs des cytokines............................................................................................. 44 3.3/ Transduction du signal des récepteurs des cytokines via les Janus tyrosine kinases (Jaks).................................................................................................................................................. 48 3.4/ Les récepteurs à activité tyrosine kinase........................................................................... 50 4/ Les chimiokines et les récepteurs aux chimiokines ............................................................. 52 5/ La mobilisation des cellules souches hématopoïétiques ...................................................... 52 5.1/ Migration des cellules souches hématopoïétiques au cours de l’ontogénie...................... 54 5.2/ Circulation des cellules souches et progéniteurs hématopoïétiques adultes ..................... 54 5.3/ Mobilisation des cellules souches et des progéniteurs hématopoïétiques......................... 55 5.4/ Migration des cellules souches et progéniteurs hématopoïétiques en réponse au ligand de Flt3 ........................................................................................................................................... 55 6/ La niche hématopoïétique .................................................................................................... 57 6.1/ Principales cellules constituant les niches hématopoïétiques ........................................... 58
6.1.1/ Les cellules souches mésenchymateuses ............................................................... 58 6.1.2/ Les ostéoblastes...................................................................................................... 60 6.1.3/ Les adipocytes ........................................................................................................ 60 6.1.4/ Les ostéoclastes ...................................................................................................... 61 6.1.5/ Les cellules endothéliales....................................................................................... 61
6.2/ Les molécules de la matrice extracellulaire ...................................................................... 62 6.2.1/ Molécules fibrillaires : collagènes et réticuline ..................................................... 62 6.2.2/ Molécules non fibrillaires ...................................................................................... 62
6.3/ Régulation fonctionnelle des cellules souches hématopoïétiques dans la niche médullaire.................................................................................................................................................. 65 7/ Epigénétique et hématopoïèse.............................................................................................. 66 7.1/ La méthylation de l’ADN.................................................................................................. 66 7.2/ Le code des histones et hétérochromatine......................................................................... 68 7.3/ Les histones déacétylases (HDAC) et histones acétylases (HAT).................................... 68 8/ La mégacaryopoïèse............................................................................................................. 70 8.1/ Endomitose mégacaryocytaire .......................................................................................... 72
15
8.2/ Maturation cytoplasmique................................................................................................. 72 8.3/ Régulation moléculaire de la mégacaryopïèse.................................................................. 76 9/ Le couple Flt3 ligand/Flt3.................................................................................................... 80 9.1/ Le récepteur Flt3 ............................................................................................................... 80
9.1.1/ Souris déficientes pour le gène codant pour le récepteur Flt3 ............................... 82 9.1.2/ Expression du récepteur Flt3 chez l’homme.......................................................... 82 9.1.3/ La signalisation induite par Flt3 en réponse au Flt3-ligand................................... 82 9.1.4/ Rôle de Flt3 dans les leucémies ............................................................................. 84
9.2/ Le Flt3-ligand (FL) ........................................................................................................... 84 9.2.1/ Souris déficientes pour le gène codant pour le Flt3-ligand.................................... 85 9.2.2/ Activité biologique du Flt3-ligand in vivo et rôle dans la niche hématopoïétique 86
10/ La voie des « mitogen-activated protein » kinases ............................................................ 88 10.1/ Rôle des « Mitogen-activated protein kinases » p38 dans l’hématopoïèse normale et leucémique ............................................................................................................................... 96
10.1.1/ Les « Mitogen-activated protein kinases » p38.................................................... 96 10.1.2/ Rôle de p38 dans la niche hématopoïétique......................................................... 97 10.1.3/ Rôle de p38 dans les leucémies............................................................................ 99
10.2/ ATF2 effecteur en aval de p38........................................................................................ 99 10.3/ Réponse transcriptionnelle du complexe AP1 en aval des « Mitogen-activated protein kinases » dont p38 .................................................................................................................. 100 11/ Des syndromes aux néoplasmes myéloprolifératifs chroniques ...................................... 105 11.1/ Historique des néoplasmes myéloprolifératifs dits « classiques » ................................ 106 11.2/ Les mutations et les néoplasmes myéloprolifératifs ..................................................... 107 12/ La myélofibrose primitive (MFP) .................................................................................... 110 12.1/Diagnostic clinique et anatomopathologique ................................................................. 110
12.1.1/ Clinique .............................................................................................................. 110 12.1.2/ Hémogramme ..................................................................................................... 111 12.1.3/ Augmentation du nombre de progéniteurs circulants CD34
+............................ 111 12.1.4/ Histologie médullaire et myélofibrose ............................................................... 111
12.2/ Diagnostic génétique..................................................................................................... 112 12.2.1/ Anomalies cytogénétiques .................................................................................. 112 12.2.2/ Clones et mutations ............................................................................................ 116 12.2.3/ Anomalies épigénétiques .................................................................................... 118
12.3/ Approches thérapeutiques ............................................................................................. 119 12.4/ Caractéristiques physiopathologiques........................................................................... 119
12.4.1/ La myéloprolifération......................................................................................... 121 12.4.2/ La réaction stromale et les altérations du microenvironnement ....................... 123
12.4.2.1/ Myélofibrose et Contexte inflammatoire ................................................... 123 12.4.2.2/ Importance du TGF-"1................................................................................ 124 12.4.2.3/Ostéomyélosclérose et Néoangiogenèse ...................................................... 125 12.4.2.4/ Rôle clé du mégacaryocyte ......................................................................... 125
12.4.3/ Le modèle physiopathologique........................................................................... 128 12.5/ Les modèles animaux............................................................................................ 130
OBJECTIFS DU TRAVAIL .................................................................................................. 131 MATERIEL ET METHODES ............................................................................................... 135 1/ Technique de détection de la mutation Jak2V617F ........................................................... 137 2/ Hybridation Génomique Comparative (CGH array).......................................................... 137 2.1/ Obtention des populations cellulaires pour la CGHarray ............................................... 138 2.2/ Extraction de l’ADN cellulaire pour la CGH array ........................................................ 138 2.3/ Amplification globale du génome des cellules CD34+ ................................................... 138
16

2.4/ Synthèse des sondes de CGH array et hybridation ......................................................... 139 2.5/ Normalisation des données et interprétation chromosomique ........................................ 139 3/ Analyse transcriptomique des cellules CD34+ ................................................................... 140 RESULTATS EXPERIMENTAUX ...................................................................................... 141 1/ Contexte des travaux .......................................................................................................... 143 2/ Recherche d’anomalies moléculaires participant à la pathogenèse de la Myélofibrose primitive ................................................................................................................................. 144 2.1/ Apport de la CGH array pangénomique.......................................................................... 144 2.2/ Apport de l’étude transcriptomique ................................................................................ 145 3/ Etude du rôle du couple Flt3-ligand/Flt3 et de l’activation des « Mitogen activated protein kinases » p38 dans la dysmégacaryopoïèse chez les patients atteints de myélofibrose primitive................................................................................................................................................ 152 4/ Rôle de la régulation épigénétique dans les anomalies d’expression de Flt3 et la migration des précurseurs mégacaryocytaires; Résultats préliminaires ................................................. 159 4.1/ Prédiction bioinformatique de la présence d’îlots CpG, cibles de la méthylation, dans la région promotice de Flt3 ........................................................................................................ 159 4.2/ Une déméthylation par la 5-azacytidine (AZA) entraîne une augmentation de l’expression membranaire du récepteur Flt3 sur des lignées hématopoïétiques......................................... 161 4.3/ Approche fonctionnelle de la méthylation du promoteur Flt3 ........................................ 161 4.4/ Approche fonctionnelle de l’acétylation des histones..................................................... 163
4.3.1/ Le Flt3-ligand induit une modification de l’acétylation des histones et plus particulièrement de l’histone H4 en Lysine 8 ................................................................ 163
DISCUSSION ET PERSPECTIVES ..................................................................................... 167 1/ De la recherche d’anomalies génomiques à l’identification du cluster « FLT » à proximité de la délétion 13q14-13q21 et d’une dérégulation du gène FLT3 ......................................... 169 2/ D’une dérégulation du gène FLT3 à une activation de la voie des MAPKs p38 ; de nouveaux acteurs de la pathogenèse de la myélofibrose primitive ? ..................................... 171 2.1/ Une augmentation de l’expression de Flt3 et de son ligand Flt3-ligand : une « spécificité » de la MFP, quelque soit le statut mutationnel Jak2 des patients..................... 172 2.2/ Comment l’activation de la voie Flt3/p38 participe-t-elle à la dérégulation de la mégacaryopoïèse? .................................................................................................................. 175 2.3/ Quelle est la place du processus inflammatoire dans la pathogenèse de la MFP ?......... 177 2.4/ Le couple Flt3-ligand/Flt3 est-il un médiateur du dialogue entre les progéniteurs hématopoïétiques et leur niches régulatrices et en quoi étaye-t-il l’hypothèse du « Bad seed in Bad soil »?.............................................................................................................................. 181 2.5/ Peut-on proposer des approches ciblées sur l’axe Flt3-ligand/Flt3/p38 comme thérapies adjuvantes dans la MFP?........................................................................................................ 185 3/ Comment intégrer nos résultats dans la hiérarchie des évènements moléculaires agrégeant les néoplasmes myéloprolifératifs? ........................................................................................ 186 REFERENCES....................................................................................................................... 193 ANNEXES ............................................................................................................................. 223 1/ Implication de l’interleukine 8 et de ses récepteurs dans la dysmégacaryopoïèse des patients atteints de myélofibrose primitive.......................................................................................... 225 2/ Augmentation d’expression du gène HMGA2 dans les leucocytes et les progéniteurs hématopoiètiques CD34+ de patients atteints de myélofibrose primitive .............................. 227 3/ Corrélation entre la présence de la mutation JAK2V617F et le taux de survie chez les patients atteints de MFP ......................................................................................................... 229 4/ le gène NOG, un inhibiteur des BMP, est impliqué dans un réarrangement chromosomique chez un patient atteint de myélofibrose.................................................................................. 231
17

5/ Le promoteur de CXCR4 est hyperméthylé dans les cellules CD34+ des patients atteints de MFP........................................................................................................................................ 233 6/ L’adaptateur LNK se lie différentiellement à Jak2V617F et modifie la régulation de la signalisation JAK/STAT chez les patients atteints de néoplasmes myéloprolifératifs. ......... 235 RESUME................................................................................................................................ 238
18

AVANT PROPOS
Les néoplasmes myéloprolifératifs (NMP) sont des hémopathies clonales caractérisées
par la dérégulation d’une tyrosine kinase telle qu’Abl ou Jak2. Parmi les NMP, la
myélofibrose primitive (MFP) est caractérisée par une myéloprolifération clonale associée à
une hématopoïèse ectopique splénique et hépatique et à une anomalie du stroma identifiée par
une myélofibrose, une néoangiogénèse et une ostéomyélosclérose. Au cours de cette
pathologie, les cellules souches et progéniteurs hématopoïétiques (CSH/PH) CD34+
prolifèrent et migrent de façon excessive de la moelle osseuse vers la rate et le foie. Ces
cellules sont caractérisées par une hypersensibilité aux cytokines, une différenciation
subnormale et des anomalies génétiques/cytogénétiques clonales. Les mégacaryocytes des
patients sont dystrophiques et produisent de façon anormale de nombreux facteurs de
croissance qui contribuent à la réaction stromale définissant cette maladie. La myélofibrose
primitive est donc actuellement considérée comme une maladie de la cellule souche
hématopoïétique dans laquelle le mégacaryocyte joue un rôle pivot. Malgré la découverte de
la mutation Jak2V617F chez environ 50% des patients, la cause primaire de l’anomalie
clonale et les mécanismes conduisant au développement du clone pathologique ne sont
toujours pas identifiés.
Au cours de ma thèse, j’ai abordé l’étude de la physiopathologie de la myélofibrose
primitive grâce à des techniques pangénomiques permettant de cribler les dérégulations
géniques et transcriptionnelles des cellules hématopoïétiques des patients. Ces deux approches
m’ont permis d’identifier une dérégulation du couple Flt3/FL au niveau des cellules CD34+ et
des mégacaryocytes conduisant à des altérations fonctionnelles de la mégacaryopoïèse, via
une activation de la MAP kinase p38.
Ce travail a donné lieu à une publication qui vient d’être acceptée en 2011 dans le
journal « Cancer Research ». Il a également été sélectionné en communication orale aux
congrès suivants: 1) « American School of Hematology » (ASH 2009, Nouvelle-Orléans ;
USA), 2) « European School of Hematology » (ESH-MPD 2008, Athènes ; Grèce), 3)
« Société Française d’Hématologie» (SFH 2008, Paris); Cette présentation en séance plénière
m’a permis d’obtenir le prix de la SFH 2008.
19

20

INTRODUCTION
21

22

23

Figure 1 : Coupe de biopsie ostéo-médullaire(Coloration au May Grunvald Giemsa, grossissement X100)
24

Le sujet qui fait l’objet de cette thèse nécessite de préciser un nombre important de
notions touchant à l’hématopoïèse et à sa régulation ainsi qu’aux néoplasmes
myéloprolifératifs. Pour cette raison, nous n’avons pas détaillé de façon exhaustive les
différents chapitres de cette introduction.
1/ L’hématopoïèse
L’hématopoïèse est une séquence dynamique et ordonnée d’événements de prolifération
et de différenciation permettant le remplacement continu et permanent des cellules sanguines
matures à partir d’une population rare de cellules souches hématopoïétiques (CSH)
multipotentes. L’hématopoïèse est finement régulée par des mécanismes intrinsèques
(facteurs de transcription) et extrinsèques microenvironnementaux. Au sein du
microenvironnement médullaire, des interactions cellulaires et humorales impliquant en
particulier des cytokines et des chimiokines, vont conduire, via l’activation de différentes
voies de signalisation, à la modulation des gènes cibles impliqués dans l’autorenouvellement,
la prolifération et la différenciation des CSH. La connaissance des mécanismes impliqués
dans la régulation de l’hématopoïèse est croissante, cependant leurs rôles respectifs dans
l’autorenouvellement et la différenciation des CSH restent encore à définir.
1.1/ Organisation du tissu hématopoïétique
Chez l’adulte sain, l’hématopoïèse a lieu dans la moelle osseuse des os courts et plats
(sternum, côtes, vertèbres, os iliaque) au sein de niches spécifiques. La moelle osseuse est
composée de cellules hématopoïétiques et de leurs précurseurs, de cellules stromales dont les
cellules endothéliales, les fibroblastes, les adipocytes, les cellules ostéocompétentes
(ostéoblastes et ostéoclastes) et de plusieurs molécules comme les collagènes qui forment un
réseau de soutien au sein de la matrice extracellulaire. Ce tissu est irrigué par de nombreux
vaisseaux sanguins dits fenestrés (Figure 1).
Cet environnement médullaire complexe forme les niches hématopoïétiques (Figure 2) qui
régulent, de concert avec les facteurs de transcription, la production des cellules sanguines
différenciées fonctionnelles. Ces cellules ne se divisent plus et présentent une faible activité
de synthèse protéique (les plaquettes et les érythrocytes ne possèdent pas de noyau). Leur
25
durée de vie est courte et varie de quelques heures pour les polynucléaires à quelques
semaines pour les érythrocytes. Pour des raisons d’homéostasie, l’hématopoïèse doit donc
produire de façon régulée une quantité importante de cellules différenciées (Sachs, 1996). De
même, lors d’hémorragies ou d’infections, elle doit compenser de façon rapide et efficace les
variations importantes qu’il en résulte. Cette considérable activité de production cellulaire est
réalisée à partir d’un petit nombre de cellules souches hématopoïétiques (CSH) présentes au
sein des niches médullaires chez l’adulte (Morrison, Uchida, & Weissman, 1995) (Watowich
et al., 1996) (Arai et al., 2009).
1.2/ Les cellules souches hématopoïétiques
Les cellules souches hématopoïétiques sont caractérisées par : i) leur propriété
d’autorenouvellement (capacité à donner naissance à une cellule fille « identique » à la cellule
mère, mise en évidence par des greffes sériées chez un animal léthalement irradié) et ii) leur
multipotence (capacité à engendrer des cellules appartenant aux différentes lignées
hématopoïétiques myéloïdes et lymphoïdes).
Comme nous le verrons plus tard, les CSH ont été identifiées par Till et McCulloch en
1961 (Till & Mc Culloch, 1961) dans la moelle osseuse de souris, site primaire de
l’hématopoïèse à l’âge adulte. Les CSH représentent environ 0,05 % des cellules totales de la
moelle osseuse. Deux populations cellulaires ont été identifiées chez la souris : une population
Lin-cKIT+SCA+THY1.1low (fréquence : 1/10000) avec une capacité de repopulation à long
terme et une population Lin low cKIT+SCA+THY1.1low (fréquence : 1/2000) avec une capacité
de repopulation à court terme. Après injection à des souris irradiées, ces cellules ont la
capacité de migrer vers un microenvironnement approprié pour proliférer et se différencier.
Les cellules capables de reconstitution à court terme confèrent une radioprotection à l’animal
en générant les cellules érythroïdes et myéloïdes nécessaires à sa survie. Les cellules capables
de reconstitution à court et long terme confèrent une radioprotection à l’animal mais, seules
les cellules permettant une reconstitution au delà de 10 semaines greffent à nouveau quand
elles sont injectées dans un hôte secondaire ; ces cellules sont appelées « cellules souches
hématopoïétiques » (Morrison & Weissman, 1994).
26

Figure 2 : Représentation schématique des différents types cellulaires constituant le tissu
médullaire
27
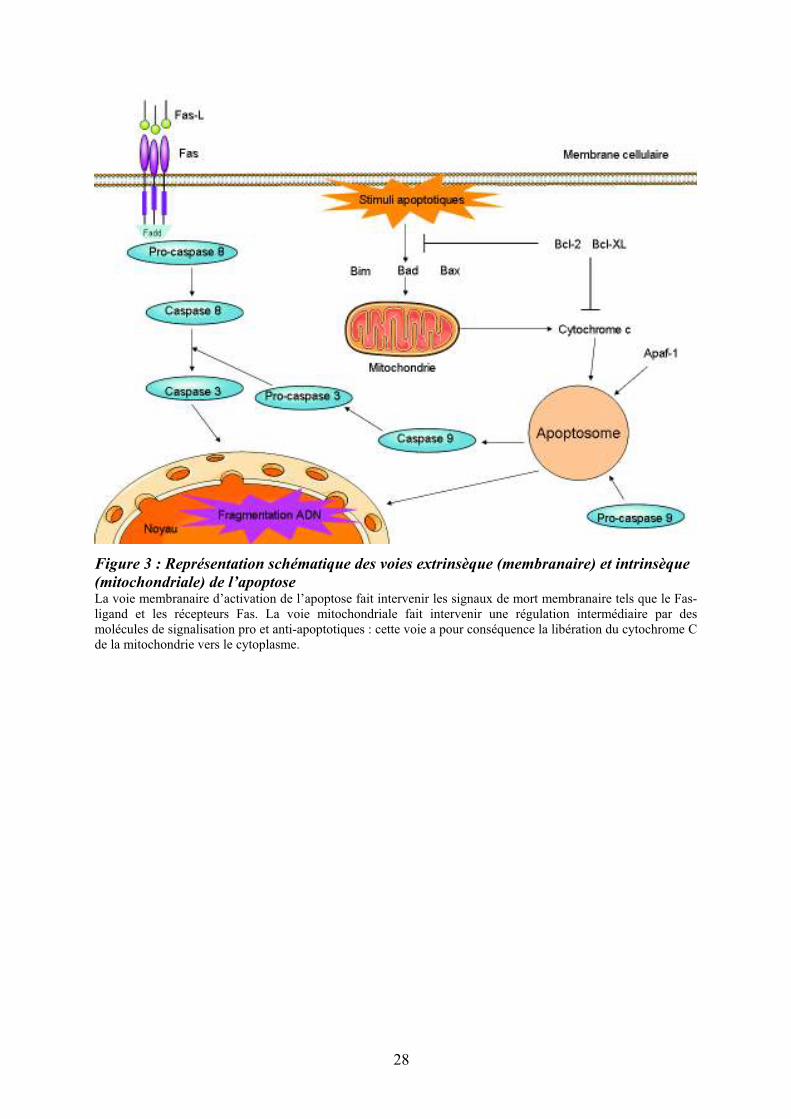
Figure 3 : Représentation schématique des voies extrinsèque (membranaire) et intrinsèque
(mitochondriale) de l’apoptoseLa voie membranaire d’activation de l’apoptose fait intervenir les signaux de mort membranaire tels que le Fas-ligand et les récepteurs Fas. La voie mitochondriale fait intervenir une régulation intermédiaire par des molécules de signalisation pro et anti-apoptotiques : cette voie a pour conséquence la libération du cytochrome C de la mitochondrie vers le cytoplasme.
28
1.3/ Rôle de l’apoptose dans l’homéostasie des cellules hématopoïétiques et l’équilibre survie/différenciation des CSH
L’apoptose (ou mort cellulaire génétiquement programmée) est le processus par lequel
des cellules déclenchent leur auto-destruction en réponse à un signal de mort. C'est l'une des
voies physiologiques de la mort cellulaire, en équilibre constant avec la prolifération
cellulaire. L’apoptose est régulée par des messages pro- et anti-apoptotiques. Cette régulation
est importante pour l’homéostasie de l’hématopoièse comme le montre le rôle d’une
expression forcée de l’oncogène BCL2 sur l’augmentation du nombre de CSH in vivo
(Domen, Gandy, & Weissman, 1998) et son altération dans les syndromes myélodysplasiques
(J. Wang, Fernald, Anastasi, Le Beau, & Qian, 2010).
Le processus apoptotique est orchestré par une famille de protéines très conservées au
cours de l’évolution, telles que les protéases à cystéine (caspases) présentes dans la cellule
sous forme de précurseurs latents (pro-caspases) (Ghobrial, Witzig, & Adjei, 2005). Parmi les
caspases à activité pro-apoptotique, on distingue les caspases initiatrices (2, 8, 9, 10), à
prodomaine long, qui sont actives sous forme monomérique et les caspases effectrices (3, 6 et
7), à petit prodomaine, qui s’hétérodimèrisent. Les caspases initiatrices répondent à différents
stimuli mitochondriaux ou membranaires. La voie intrinsèque (mitochondriale) implique le
relargage du cytochrome C par la mitochondrie ; elle est principalement régulée par la famille
des protéines Bcl-2 (Goodsell, 2002) (Figure 3). La voie extrinsèque (membranaire) fait
intervenir des récepteurs présents à la surface cellulaire avec un domaine de mort
intracellulaire comme le CD95 (Fas). Quelles que soient les voies d’apoptose mises en œuvre,
elles conduisent à la fragmentation de l’ADN.
Outre leurs rôles dans la mort programmée, les mécanismes apoptotiques sont également
impliqués dans l’équilibre survie/différenciation des CSH/PH. Comme nous l’avons exposé
précédemment, les membres de la famille Bcl-2 jouent un rôle essentiel dans cet équilibre.
Mcl-1, une molécule anti-apoptotique de la famille Bcl-2 fortement exprimée dans CSH/PH
primitifs mais plus faiblement dans PH determinés. Cette dernière joue un rôle dans la
régulation des stades précoces de l’hématopoïèse via une augmentation de la survie des
CSH/PH primitifs (Opferman et al., 2005) et intervient dans les stades terminaux de la
différenciation granulocytaire (Opferman, 2007) (Leuenroth, Grutkoski, Ayala, & Simms,
2000) (Figure 4).
29

Dans la lignée érythroïde, Bcl-XL, régulateur anti-apoptotique, est essentiel à la survie
cellulaire (Rhodes, Kopsombut, Bondurant, Price, & Koury, 2005). La perte de la molécule
pro-apoptotique Bim conduit à l’expansion des progéniteurs et des cellules différenciées
myéloïdes et lymphoïdes (Kuribara et al., 2004) et la perte combinée de Bim et Puma favorise
la résistance de ces cellules à l’apoptose (Erlacher et al., 2006). L’apoptose joue un rôle
majeur dans la différenciation érythroïde notamment via l’action de HSP70 et de Nix (Ribeil
et al., 2007) (Diwan et al., 2007) (figure 4).
30

Figure 4 : Points de contrôle apoptotique au cours de la différenciation hématopoïétique Pour chaque sous-population cellulaire ou pour chaque étape de différenciation, il est représenté les régulateurs apoptotiques inhibiteurs (régulateurs anti-apoptotiques) ou activateurs (régulateurs pro-apoptotiques) (Opferman, 2007)
31

2/ Propriétés et mise en évidence des cellules souches hématopoïétiques
2.1/ Propriétés des cellules souches hématopoiètiques
Chez l’adulte et en conditions physiologiques, les CSH et PH primitifs sont
caractérisées par une activité mitotique peu intense, la majorité d’entre elles sont quiescentes,
c’est à dire en phase G0/G1 du cycle cellulaire (Nie, Han, & Zou, 2008) (Tipping et al., 2009).
Afin de maintenir leur nombre constant, ces cellules sont cependant douées d’une grande
capacité de prolifération. Il a été proposé que les CSH se divisent de façon asymétrique,
conduisant ainsi à la production d’une cellule fille « identique » à elle-même et une cellule
fille différenciée et hautement proliférative. Les mécanismes régissant l’équilibre entre
quiescence, auto-renouvellement/prolifération ne sont encore que partiellement identifiés.
Parmi les différents facteurs influençant l’auto-renouvellement des CSH, citons : i) les
facteurs de transcription tels que HOXB4 (Sauvageau et al., 1995) (Antonchuk, Sauvageau, &
Humphries, 2002), ii) les régulateurs du cycle cellulaire tels que p21 (Cheng et al., 2000), iii)
les protéines impliquées dans le développement telles que Notch, Sonic Hedgehog et Wnt
(Varnum-Finney et al., 2000) (Stier, Cheng, Dombkowski, Carlesso, & Scadden, 2002)
(Bhardwaj et al., 2001) et iv) certains gènes modifiant la structure chromatinienne.
32

Figure 5 : Organisation hiérarchique de l’hématopoïèseAbréviations : LT-SRC : « long term repopulation SCID cells », ST-SRC : « short term repopulation SCID cells », Ly : lymphocyte, Figure adaptée de : (Reya, Morrison, Clarke, & Weissman, 2001)
33

2.2/ Tests de mise en évidence des cellules souches et progéniteurs hématopoïétiques
Les techniques d’hématologie expérimentale ont permis de proposer l’existence d’une
hiérarchie cellulaire de type pyramidale au sein du système hématopoïétique. Très
schématiquement et de façon théorique, on définit trois grands compartiments constitués d’un
continuum de cellules avec différents niveaux de maturation (Figures 5 et 6):
Le compartiment des cellules souches hématopoïétiques, situé au sommet de la
pyramide, représente un pool de cellules capables de se différencier vers les différentes
lignées hématopoïétiques myéloïdes et lymphoïdes B et T et de reconstituer l’hématopoïèse à
long terme après greffes sériées chez la souris irradiée. Ces cellules sont douées d’un potentiel
d’autorenouvellement et sont majoritairement quiescentes, bien que présentant une grande
capacité de prolifération.
Le compartiment des progéniteurs hématopoïétiques comprend les cellules issues de la
prolifération et de la différenciation des cellules souches. On y distingue des progéniteurs
primitifs, capables d’une prolifération importante et de différenciation vers plusieurs lignages
hématopoïétiques et des progéniteurs plus matures, déterminés ou commis vers une, au plus
deux, lignées distinctes. Ces cellules ne possèdent plus de capacité d’autorenouvellement.
Les cellules du compartiment des précurseurs hématopoïétiques engendrent les
cellules matures, morphologiquement reconnaissables sur frottis cellulaire et ne se divisant
plus. A la fin de ce processus de maturation médullaire, les cellules hématopoïétiques
traversent la barrière endothéliale, quittent la moelle et migrent dans la circulation sanguine.
La difficulté majeure rencontrée dans les approches de caractérisation des CSH, réside
dans la mise au point de techniques permettant d’étudier l’ensemble des propriétés de ces
cellules. A cela s’ajoute, la rareté des CSH (moins de 0,01 à 0,05 % des cellules médullaires),
leur hétérogénéité et l’absence de caractère morphologique distinctif. Ainsi, depuis un certain
nombre d’années, différentes méthodes d’évaluation in vivo et de nombreux tests in vitro,
associés ou non à des méthodes de caractérisation phénotypique par cytométrie en flux, ont
été développées. L’analyse de ces tests in vivo ou in vitro est cependant rétroactive par étude
de la descendance des cellules générées au cours du test. De ce fait, des tests basés sur des
caractéristiques fonctionnelles/métaboliques des CSH (fonctionnalité SP et ALDH) ont été
récemment développés pour faciliter l’identification, la quantification et surtout l’isolement
des CSH.
34
2.2.1/ Caractérisation des cellules souches et progéniteurs hématopoïétiques par des tests fonctionnels
La Figure 6 illustre les principaux tests fonctionnels utilisés pour mettre en évidence les
différents types de cellules hématopoïétiques.
Les tests in vivo les plus couramment utilisés pour identifier les cellules du compartiment
souche sont les CFU-S (“Colony Forming Unit Spleen”), chez la souris (Siminovitch,
McCulloch, & Till, 1963) et les SRC (SCID Repopulating Cells”) (Bhatia, Bonnet, Murdoch,
Gan, & Dick, 1998) que l’on peut subdiviser en « Long term » et « Short term » SRC (LT-
SRC et ST-SRC), chez l’homme. Ces tests sont les seuls permettant d’identifier les CSH
humaines dans des modèles de souris immunodéficientes (Souris NOD/SCID et autres…)
(Coulombel, 2004).
Parmi les tests fonctionnels in vitro permettant la caractérisation des PH, trois principaux
types de culture ont été développés: i) les cultures de type Dexter où les cellules
hématopoïétiques sont mises en culture sur un stroma médullaire (T. D. Allen & Dexter,
1983), ii) les cultures dites « sans stroma » mais en présence de cytokines (Brandt, Srour, van
Besien, Briddell, & Hoffman, 1990) et iii) les cultures de type « stroma non-contact » dans
lesquelles les progéniteurs sont séparés du stroma par une membrane microporeuse (C. M.
Verfaillie, 1992). On distingue ainsi les tests des « long term culture-initiating cell » (LTC-
IC) et les Cobblestone aera-forming cell-assay (CAFC) (Ploemacher, van der Sluijs, van
Beurden, Baert, & Chan, 1991) où les cellules hématopoïétiques sont cultivées sur une sous-
couche de cellules stromales préalablement irradiées et qui permettent de mesurer la
fréquence des progéniteurs hématopoïétiques primitifs dans une suspension cellulaire.
Les tests en milieu semi-solide permettent d’identifier et de quantifier les PH plus
engagés, de type CFC (“Colony Forming Cells”). Il est ainsi possible de distinguer des
colonies issues de progéniteurs primitifs (HPP-CFC, CFU-Blast et CFU-GEMM), des
colonies issues de progéniteurs plus engagés de type mégacaryocytaire (CFU-Mk),
myélomonocytaire (CFU-GM, CFU-G et CFU-M) ou érythrocytaire (BFU-E “Burst forming
unit” et CFU-E) (O'Brien & Horton, 1984).
35

Figure 6 : Principaux tests de mise en évidence des différents types de cellules
hématopoïétiques humaines
36

2.2.2/ Caractérisation des cellules souches et progéniteurs hématopoïétiques par leurs propriétés métaboliques
Les CSH et les PH primitifs peuvent également être identifiés et purifiés sur la base de
marqueurs métaboliques comme une faible incorporation de colorants vitaux (la Rhodamine
123, le Hoechst-33342) (Wolf, Kone, Priestley, & Bartelmez, 1993) ou de certaines drogues
mais aussi une forte expression de l’aldéhyde deshydrogénase.
Cette faible incorporation est liée à l’activité d’une pompe membranaire de type MDR
(« Multi-Drug Resistance ») appartenant à la famille des transporteurs ABCG (sous famille
ABCG2) qui exfluent le colorant/drogue ayant pénétré dans la cellule (Zhou et al., 2001). En
1996, l’équipe de M. Goodell (Goodell, Brose, Paradis, Conner, & Mulligan, 1996) montrait
chez la souris, que les cellules excluant le Hoechst étaient primitives, voire « souches ». Ces
cellules, baptisées « SP cells » pour « Side Population », représentent une population
cellulaire identifiable en position marginale sur le « côté » d’un cytogramme bi-paramétrique
d’exclusion du Hoechst-33342. Depuis, la présence de CSH de type SP a été confirmée dans
la moelle osseuse chez l’homme (Arai, Hirao, & Suda, 2005).
L’aldéhyde deshydrogénase (ALDH) est une enzyme de détoxification exprimée dans
le foie. Elle est impliquée dans le métabolisme de l’alcool, de la vitamine A et est responsable
de l’oxydation des aldéhydes en acides carboxyliques. Les CSH expriment l’isoforme active
l’ALDH1-A1, ce qui leur confère une résistance aux agents alkylants comme le
cyclophosphamide (Chute et al., 2006). Dans de nombreux tissus et notamment dans le tissu
hématopoïétique, un haut niveau d’activité de l’aldéhyde deshydrogénase est considéré
comme un marqueur associé à la nature « souche » d’une cellule (Kastan et al., 1990). Des
substrats fluorescents de cette enzyme (BAAA: réactif ALDEFLUOR® ; StemCell
technologies) ont récemment été développés dans le but d’identifier et d’isoler, par cytométrie
en flux, les CSH humaines.
2.2.3/ Caractérisation des progéniteurs hématopoïétiques par l’expression de marqueurs membranaires
2.2.3.1/ La molécule de surface CD34
La molécule de surface CD34 est une sialomucine exprimée sur les CS et les
progéniteurs de nombreux tissus et en particulier dans le tissu hématopoïétique. Son rôle n’est
pas connu actuellement mais elle semble participer au processus d’adhésion (Krause, Fackler,
Civin, & May, 1996). L’antigène CD34 est exprimé à la surface de 1 à 5 % des cellules
37
mononucléées de la moelle osseuse humaine. Les cellules CD34+ représentent une population
hétérogène contenant des CSH et des PH, capables de se différencier en cellules myéloïdes
(C. Verfaillie, Blakolmer, & McGlave, 1990), en lymphocytes B (Baum, Weissman,
Tsukamoto, Buckle, & Peault, 1992), en « natural killer » (Miller, Verfaillie, & McGlave,
1992), en lymphocytes T(Srour et al., 1993). Elles sont capables de greffer (Sutherland,
Eaves, Eaves, Dragowska, & Lansdorp, 1989) et de se différencier en cellules sanguines chez
des souris immunodéprimées (Bhatia, Wang, Kapp, Bonnet, & Dick, 1997). Toutefois, chez la
souris, des cellules hématopoïétiques primitives n’exprimant pas l’antigène CD34 (CD34-)
sont également capables de reconstituer l’hématopoïèse de souris, démontrant que l’antigène
CD34 n’est pas le marqueur « universel » des cellules souches hématopoïétiques (Osawa,
Hanada, Hamada, & Nakauchi, 1996).
2.2.3.2/ Autres marqueurs phénotypiques des progéniteurs
hématopoïétiques primitifs
L’étude du profil d’expression de marqueurs de surface (CD : groupe de
différenciation) aide à la caractérisation des progéniteurs hématopoïétiques primitifs et de leur
stade de différenciation. Parmi les cellules CD34+, la sous fraction CD34+CD38- est capable
de reconstituer le système hématopoïétique de souris immunodéprimées avec des niveaux
variables d’efficacité (Hogan, Shpall, & Keller, 2002) (Dick, Bhatia, Gan, Kapp, & Wang,
1997), suggérant la présence de CSH dans cette sous-population. Ainsi, bien que la fraction
CD34+CD38- soit enrichie en CSH, elle ne définit pas la population « souche ». Chez
l’homme, l’association du marqueur CD90 (Baum et al., 1992) et du CD105 (endogline), un
des récepteurs du TGF-"1 (Pierelli et al., 2001), permet d’enrichir encore cette population en
cellules souches et progéniteurs hématopoïétiques primitifs (Figure 7) (Tableau 1).
38

CSH Souris Homme
hémangioblaste Flk!1"(Kdr+) ND
pré!CSH"(AGM) CD34+"CD41+"Sca!1!"CD45! ND
CSH"(AGM,"placenta) CD34+"CD45
+"CD41
+/!"Sca!1"
+/!CD34
+
CSH"(foie"fétal) Sca!1+"CD34
+"CD45
+"Mac1
+"CXCR4
+CD34
+"CD133
+"CXCR4
+"Lin
!
CSH"(moelle"osseuse) CD34+"CD38
low"CD90
+"lin
!
Sca!1+"CD34
+/!"CD45
+"Lin
!CD34
+"CD133
+"CXCR4
+"Lin
!
Rh123low,"Hoe3342
low""PyroninY
lowRh123
low,"Hoe3342
low,"PyroninY
low
Aldehyde"deshydrogenasehigh
ALDHhigh
"(ALDHhigh
"CD133+"Lin
!)"
Side"population"cells"(SP) Side"population"(SP)
CD150+"CD48
!"CD244
!"(SLAM) CD150
+"CD48
!"CD244
!"(SLAM)
5!FU"Resistant"
Fr25"(small"cells)"lin!
Tableau 1 : Profil phénotypique, fonctionnel et métabolique des populations enrichies en
cellules souches hématopoïétiques chez la souris et chez l’homme au cours du
développementAbréviations : AGM : aorta gonad mesonephros, ALDH : aldhyde deshydrogénase, 5-FU : fluorouracil, CSH : cellule souche hématopoïétique, ND : le phénotype n’a pas été décrit pour les CSH humaines, SLAM : « signaling lymphocyte activation molecule »
Figure 7: Principaux marqueurs des cellules hématopoïétiques au cours de la
différenciation lympho-myéloïde chez l’homme
39
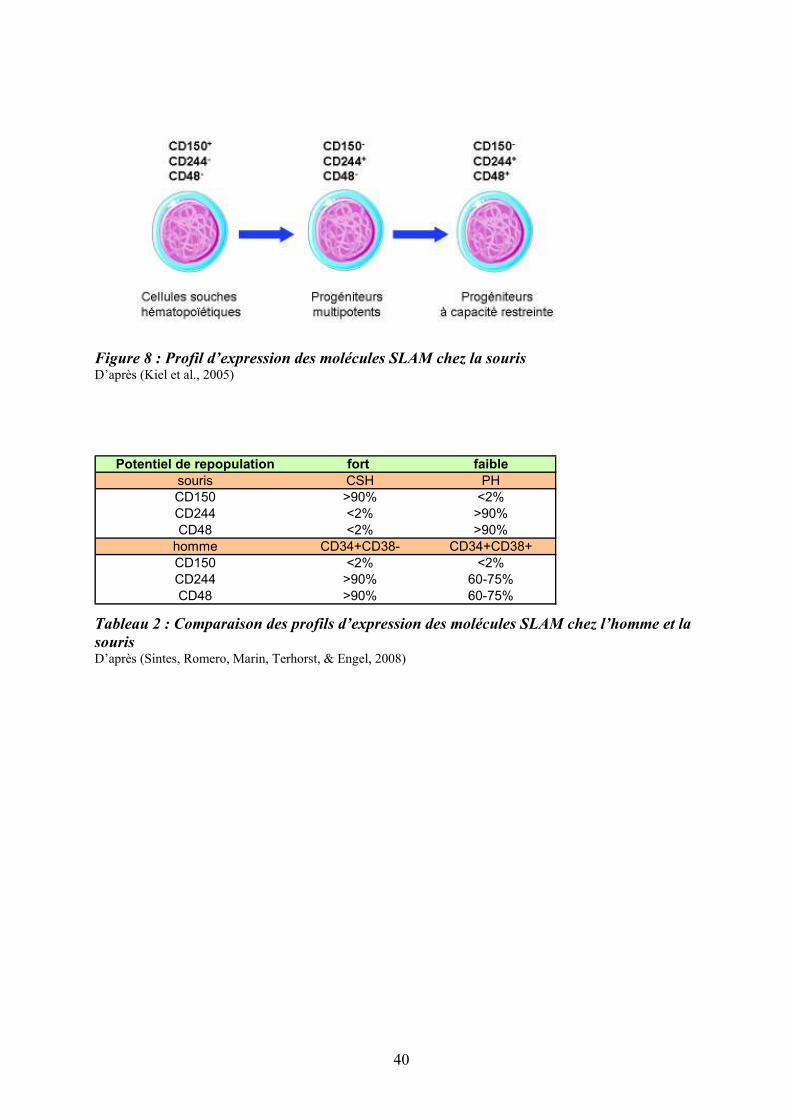
Figure 8 : Profil d’expression des molécules SLAM chez la souris D’après (Kiel et al., 2005)
Potentiel de repopulation fort faible
souris CSH PH
CD150 >90% <2%
CD244 <2% >90%
CD48 <2% >90%
homme CD34+CD38- CD34+CD38+
CD150 <2% <2%
CD244 >90% 60-75%
CD48 >90% 60-75%
Tableau 2 : Comparaison des profils d’expression des molécules SLAM chez l’homme et la
sourisD’après (Sintes, Romero, Marin, Terhorst, & Engel, 2008)
40
La famille des « signaling lymphocyte activation molecule » (SLAM) est un groupe de
récepteurs de surface de type Ig-like comprenant une dizaine de membres localisés en tandem
sur un seul locus du chromosome 1 (Sidorenko & Clark, 2003). C’est la première famille de
récepteurs qui, par l’étude de leur expression combinée, permet de distinguer différents types
de CSH et de PH primitifs chez la souris : le profil CD150+CD244-CD48- identifierait les
CSH, le profil CD150-CD244+CD48- est associé aux progéniteurs multipotents et le profil
CD150-CD244+CD48+, aux progéniteurs plus engagés (Kiel et al., 2005) (Figure 8).
Malgré son expression sur les CSH murines, la molécule CD150 ne semble pas
indispensable à l’hématopoïèse car les souris déficientes pour son gène (CD150-/-) ne
présentent pas d’anomalies hématopoïétiques (N. Wang et al., 2004). Les molécules SLAM
sont également exprimées à la surface des CSH/PH humains mais leur profil d’expression est
différent de celui de la souris (Sintes et al., 2008) (Tableau 2). Ainsi, les profils SLAM
diffèrent entre l’homme et la souris et semblent moins discriminants pour les cellules
humaines que pour les cellules murines. Le Tableau (2) et la Figure (8) ci-après, résument les
principales caractéristiques phénotypiques, fonctionnelles et métaboliques des CSH humaines
et murines ainsi que le profil de différenciation des CSH humaines (Ratajczak, 2008).
En conclusion, de nombreux tests ont été développés au cours des cinquante dernières
années, cependant aucun d’entre eux ne remplit l’ensemble des critères permettant
d’identifier, de caractériser et surtout de purifier les CSH. La quête d’une possible
identification des CSH nécessitera de relier l’ensemble de ces données aux propriétés
fondamentales des cellules souches telles que la quiescence, l’autorenouvellement et la
capacité de repopulation d’animaux irradiés.
41
3/ Régulation de l’hématopoïèse
Le système hématopoïétique doit s’adapter à de nombreuses variations qu’elles soient
physiologiques, pour maintenir l’homéostasie de l’hématopoïèse ou pathologiques, pour
répondre à divers stress comme les hémorragies, les infections, etc... L’hématopoïèse doit
donc être finement régulée. Cette régulation fait intervenir des facteurs extrinsèques
(interactions cellulaires, cytokines, chemokines et facteurs de croissance) et des facteurs
intrinsèques (facteurs de transcription). Les facteurs extrinsèques agissent, par l’intermédiaire
de récepteurs ou de contre-récepteurs. Les changements de conformation qui en découlent,
induisent l’activation de voies de signalisation, via la génération de seconds messagers. Ces
derniers activent à leur tour des facteurs de transcription spécifiques dont l’action coordonnée
permet le recrutement de cofacteurs et l’expression des gènes cibles impliqués dans la
prolifération, la survie et la différenciation (Rosenbauer & Tenen, 2007) (Figure 9). Des
modifications épigénétiques jouent également un rôle important dans la régulation de
l’hématopoïèse en modifiant l’accessibilité des facteurs de transcription à l’ADN, avec pour
conséquence, une modification spécifique de la transcription des gènes (Bottardi, Ghiam,
Bergeron, & Milot, 2007).
Si le rôle des différents acteurs de la régulation des CSH a été largement exploré et
commence à être mieux connu, il est actuellement difficile de leur attribuer une fonction
unique dans la régulation des CSH. Il est, en effet, très vraisemblable que de multiples
combinaisons soient à l’origine de leurs actions finales sur l’hématopoïèse et l’orchestration
de cette harmonie au sein des niches médullaires reste à préciser.
42

Figure 9 : Transmission du signal de la membrane au noyau Les facteurs extrinsèques (facteurs de croissance et autres ligands membranaires) agissent, par l’intermédiaire de récepteurs ou de molécules d’adhésion, de concert avec des facteurs intrinsèques pour induire l’activation de seconds (2nd) messagers. Il en résulte la fixation des facteurs de transcription sur l’ADN avec, pour conséquence, la transcription de gènes impliqués dans la survie, la prolifération, l’apoptose et la différenciation.
43
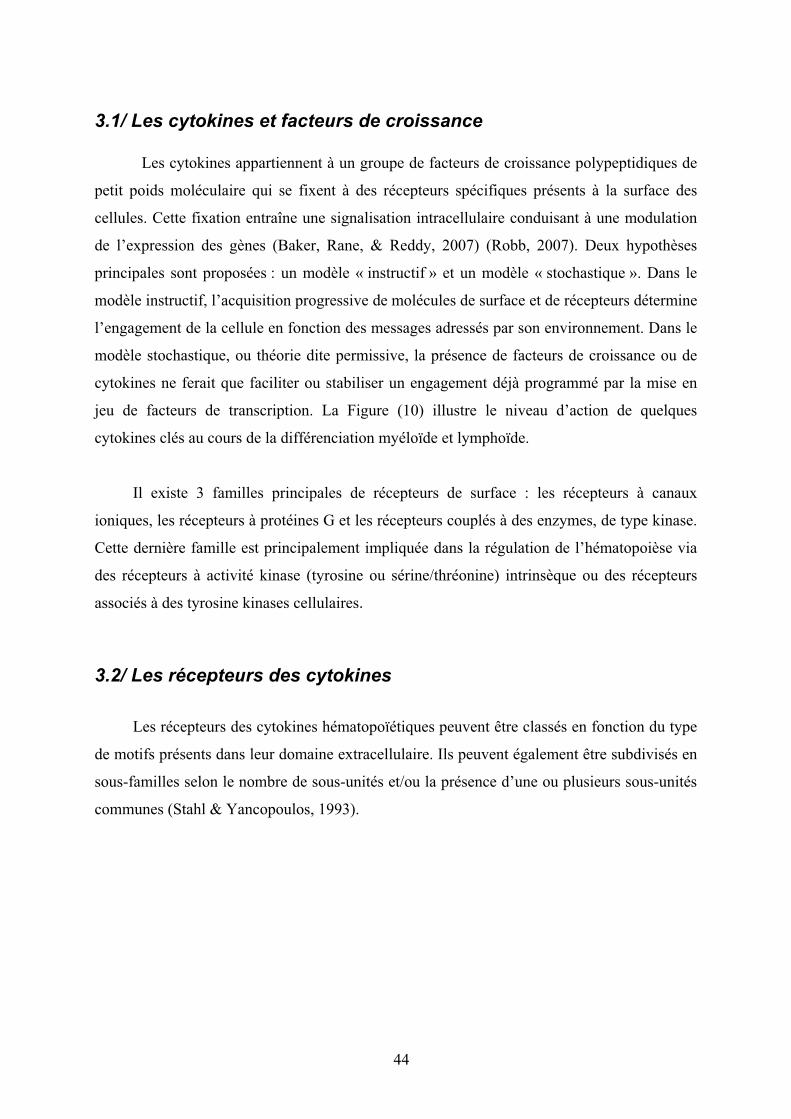
3.1/ Les cytokines et facteurs de croissance
Les cytokines appartiennent à un groupe de facteurs de croissance polypeptidiques de
petit poids moléculaire qui se fixent à des récepteurs spécifiques présents à la surface des
cellules. Cette fixation entraîne une signalisation intracellulaire conduisant à une modulation
de l’expression des gènes (Baker, Rane, & Reddy, 2007) (Robb, 2007). Deux hypothèses
principales sont proposées : un modèle « instructif » et un modèle « stochastique ». Dans le
modèle instructif, l’acquisition progressive de molécules de surface et de récepteurs détermine
l’engagement de la cellule en fonction des messages adressés par son environnement. Dans le
modèle stochastique, ou théorie dite permissive, la présence de facteurs de croissance ou de
cytokines ne ferait que faciliter ou stabiliser un engagement déjà programmé par la mise en
jeu de facteurs de transcription. La Figure (10) illustre le niveau d’action de quelques
cytokines clés au cours de la différenciation myéloïde et lymphoïde.
Il existe 3 familles principales de récepteurs de surface : les récepteurs à canaux
ioniques, les récepteurs à protéines G et les récepteurs couplés à des enzymes, de type kinase.
Cette dernière famille est principalement impliquée dans la régulation de l’hématopoièse via
des récepteurs à activité kinase (tyrosine ou sérine/thréonine) intrinsèque ou des récepteurs
associés à des tyrosine kinases cellulaires.
3.2/ Les récepteurs des cytokines
Les récepteurs des cytokines hématopoïétiques peuvent être classés en fonction du type
de motifs présents dans leur domaine extracellulaire. Ils peuvent également être subdivisés en
sous-familles selon le nombre de sous-unités et/ou la présence d’une ou plusieurs sous-unités
communes (Stahl & Yancopoulos, 1993).
44

Figure 10 : Cellules cibles de l’action des cytokines et des facteurs de croissance au cours
de la différenciation hématopoïétique D’après (Robb, 2007)
45
La première classification repose sur la présence de certains motifs protéiques. Ils
sont alors classés en récepteur de type I ou II.
Les récepteurs de type I partagent des propriétés basiques structurales caractérisées par
la présence de 4 résidus cystéine conservés, d’un motif tryptophan-serine-x-serine-tryptophan,
d’un domaine fibronectine de type III dans la partie extra-cellulaire du récepteur et des
régions conservées Box1/Box2 dans le domaine intracytoplasmique proximal à la membrane.
Les récepteurs de type I peuvent être homodimériques ou hétérodimériques. Les récepteurs
des cytokines sont composés de dimères de récepteurs simples, comme celui du G-CSF, celui
de l’EPO (EPO-R) et celui de la TPO (MPL). Ils peuvent également être hétérodimériques
avec une chaîne de signalisation commune et une chaîne unique de liaison au ligand. Ces
récepteurs hétérodimériques peuvent être classés en plusieurs groupes : i) les récepteurs
partageant une chaîne beta commune (GM-CSFR alpha, IL-3R alpha, IL-5R alpha), ii) les
récepteurs partageant la chaîne gp130 (IL-6R alpha, LIFR beta, ciliary neurotrophic factor
receptor alpha, IL-11R alpha, oncostatin M receptor alpha, cardiotrophin-like cytokine factor
1) et iii) les récepteurs partageant une chaîne gamma commune (IL-2R alpha, IL-2R beta, IL-
4R alpha, IL-7R alpha, IL-9R alpha, IL-13R alpha, IL-15R alpha, IL-21R alpha).
Les récepteurs de type II, tels que les récepteurs aux interférons et à l’IL-10,
conservent les Box1/2 mais ne possèdent pas le motif tryptophan-serine-x-serine-tryptophan.
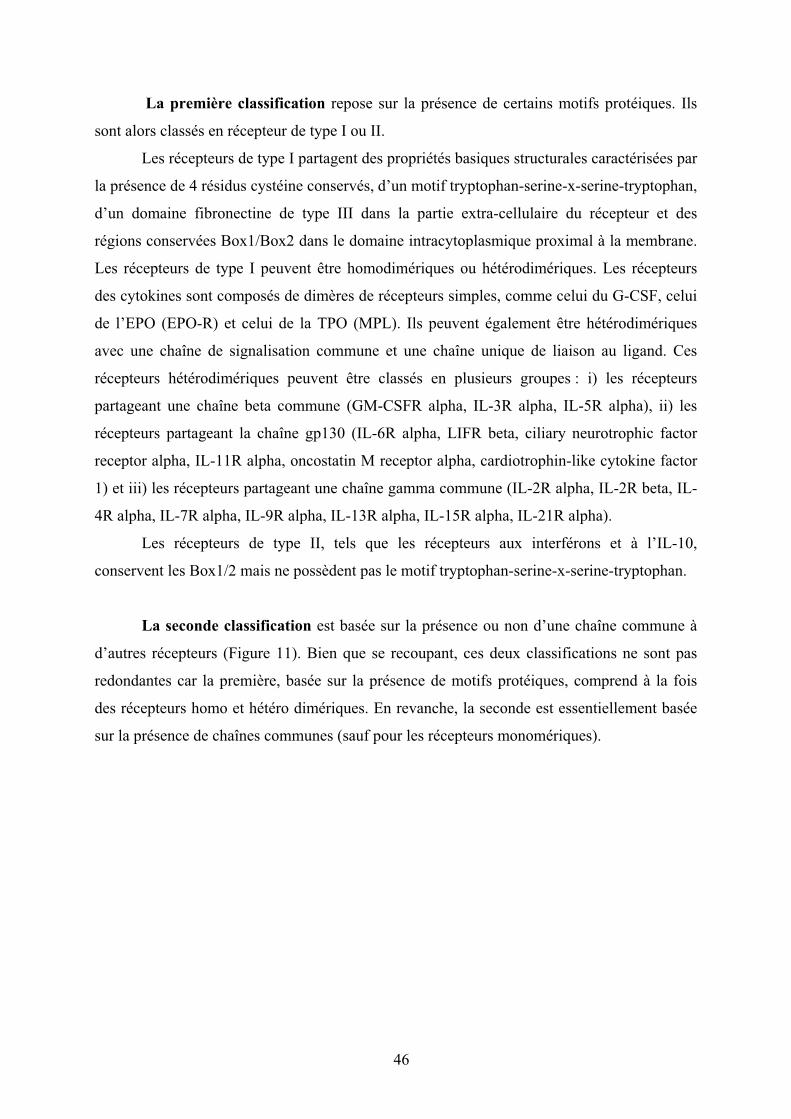
La seconde classification est basée sur la présence ou non d’une chaîne commune à
d’autres récepteurs (Figure 11). Bien que se recoupant, ces deux classifications ne sont pas
redondantes car la première, basée sur la présence de motifs protéiques, comprend à la fois
des récepteurs homo et hétéro dimériques. En revanche, la seconde est essentiellement basée
sur la présence de chaînes communes (sauf pour les récepteurs monomériques).
46

Figure 11 : Représentation schématique des familles de récepteurs aux cytokines selon la
présence de chaînes communes D’après (Baker et al., 2007)
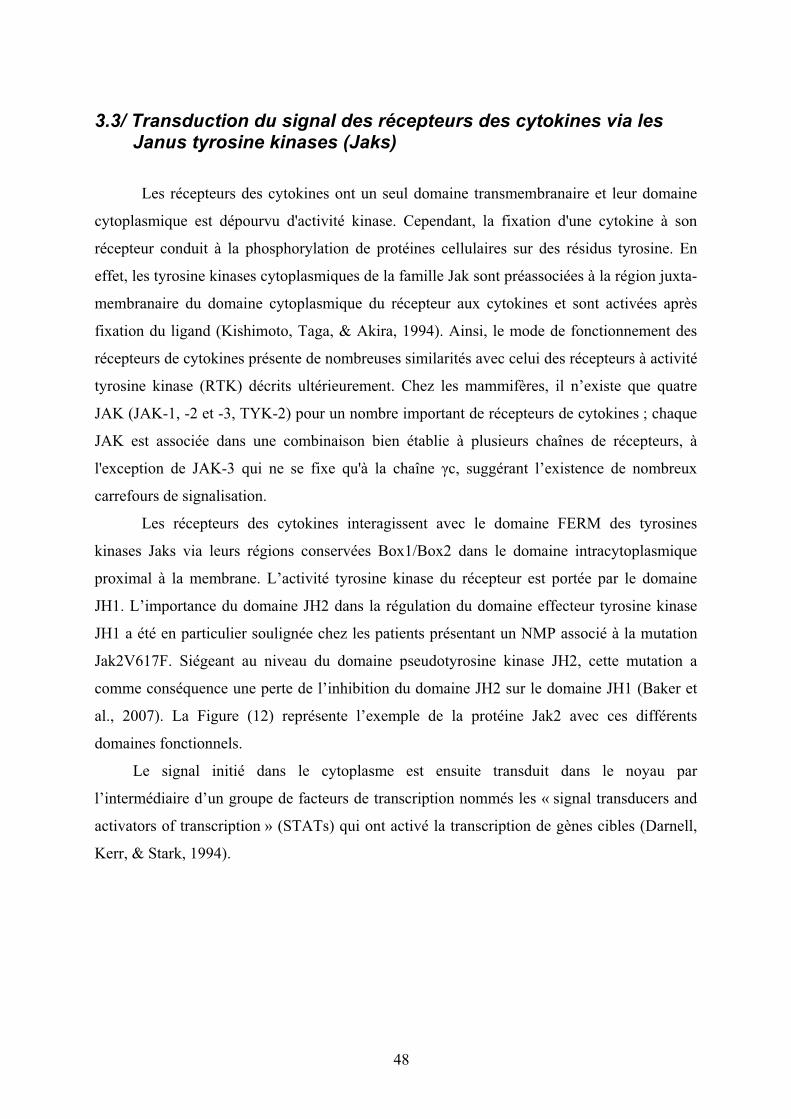
Figure 12 : Structure des Janus kinases (Jak). Les protéines Jak possèdent 4 domaines fonctionnels: le domaine FERM, le domaine src homologue 2 (SH2), le domaine pseudo-tyrosine kinase (PSEUDO TK), et le domaine tyrosine kinase (TK) à activité catalytique. Le domaine SH2 régule négativement l’activité de la protéine JAK. Les domaines FERM (liaison des partenaires) et SH2 servent comme domaines d’association et de liaison aux phosphotyrosines.
47
3.3/ Transduction du signal des récepteurs des cytokines via les Janus tyrosine kinases (Jaks)
Les récepteurs des cytokines ont un seul domaine transmembranaire et leur domaine
cytoplasmique est dépourvu d'activité kinase. Cependant, la fixation d'une cytokine à son
récepteur conduit à la phosphorylation de protéines cellulaires sur des résidus tyrosine. En
effet, les tyrosine kinases cytoplasmiques de la famille Jak sont préassociées à la région juxta-
membranaire du domaine cytoplasmique du récepteur aux cytokines et sont activées après
fixation du ligand (Kishimoto, Taga, & Akira, 1994). Ainsi, le mode de fonctionnement des
récepteurs de cytokines présente de nombreuses similarités avec celui des récepteurs à activité
tyrosine kinase (RTK) décrits ultérieurement. Chez les mammifères, il n’existe que quatre
JAK (JAK-1, -2 et -3, TYK-2) pour un nombre important de récepteurs de cytokines ; chaque
JAK est associée dans une combinaison bien établie à plusieurs chaînes de récepteurs, à
l'exception de JAK-3 qui ne se fixe qu'à la chaîne #c, suggérant l’existence de nombreux
carrefours de signalisation.
Les récepteurs des cytokines interagissent avec le domaine FERM des tyrosines
kinases Jaks via leurs régions conservées Box1/Box2 dans le domaine intracytoplasmique
proximal à la membrane. L’activité tyrosine kinase du récepteur est portée par le domaine
JH1. L’importance du domaine JH2 dans la régulation du domaine effecteur tyrosine kinase
JH1 a été en particulier soulignée chez les patients présentant un NMP associé à la mutation
Jak2V617F. Siégeant au niveau du domaine pseudotyrosine kinase JH2, cette mutation a
comme conséquence une perte de l’inhibition du domaine JH2 sur le domaine JH1 (Baker et
al., 2007). La Figure (12) représente l’exemple de la protéine Jak2 avec ces différents
domaines fonctionnels.
Le signal initié dans le cytoplasme est ensuite transduit dans le noyau par
l’intermédiaire d’un groupe de facteurs de transcription nommés les « signal transducers and
activators of transcription » (STATs) qui ont activé la transcription de gènes cibles (Darnell,
Kerr, & Stark, 1994).
48

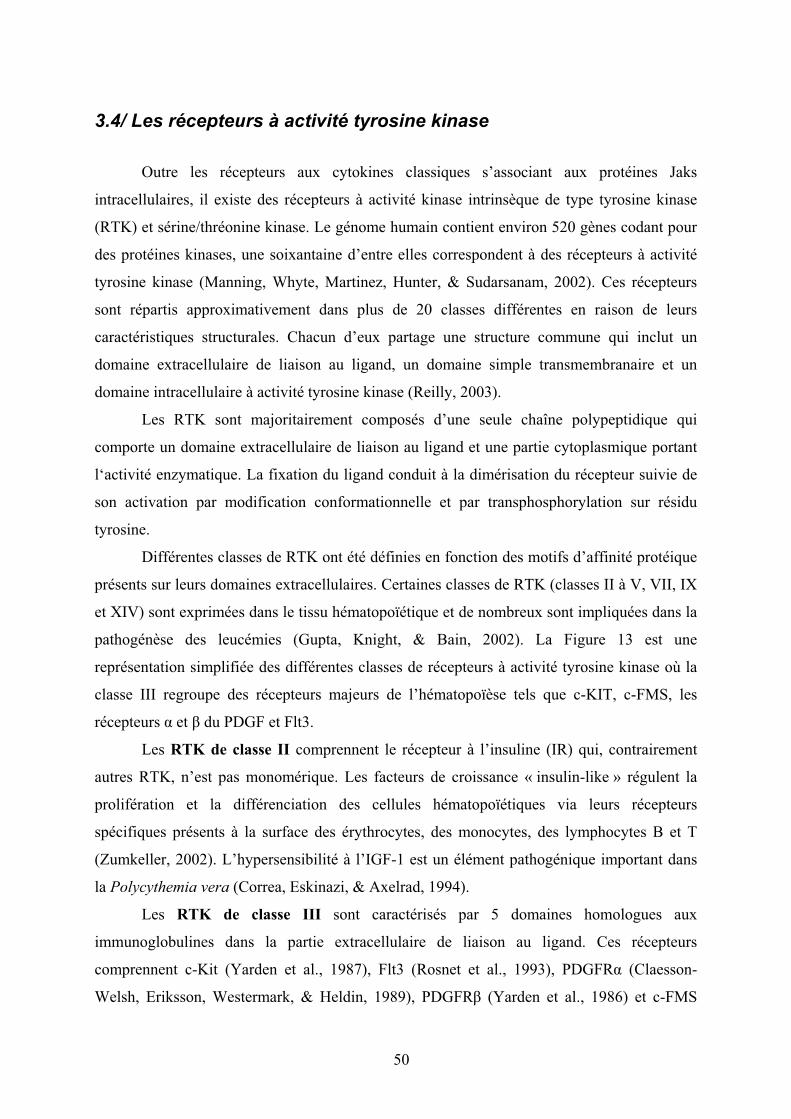
Figure 13 : Représentation des familles de RTK exprimés dans le tissu hématopoïétique. Parmi les familles de récepteurs à activité TK, citons : IR, récepteur l’insuline ; PDGFR, récepteur au « platelet-derived growth factor »; FGFR, récepteur au « fibroblast growth factor »; VEGFR, récepteur au « vascular endothelial growth factor »; TRK, récepteur à la tropomyosine; TIE, tyrosine kinase avec domaines Ig et EGF homologues; RET, « REarranged during Transfection» (Reilly, 2003) Cad : motif cadhérine ; Cys : région riche en cystéine ; E : répétition EGF homologue ; Fn : répétion fibronectine III ; Ig : répétition immunoglobuline homologue ; L : motif riche en leucine ; TM : transmembranaire.
49
3.4/ Les récepteurs à activité tyrosine kinase
Outre les récepteurs aux cytokines classiques s’associant aux protéines Jaks
intracellulaires, il existe des récepteurs à activité kinase intrinsèque de type tyrosine kinase
(RTK) et sérine/thréonine kinase. Le génome humain contient environ 520 gènes codant pour
des protéines kinases, une soixantaine d’entre elles correspondent à des récepteurs à activité
tyrosine kinase (Manning, Whyte, Martinez, Hunter, & Sudarsanam, 2002). Ces récepteurs
sont répartis approximativement dans plus de 20 classes différentes en raison de leurs
caractéristiques structurales. Chacun d’eux partage une structure commune qui inclut un
domaine extracellulaire de liaison au ligand, un domaine simple transmembranaire et un
domaine intracellulaire à activité tyrosine kinase (Reilly, 2003).
Les RTK sont majoritairement composés d’une seule chaîne polypeptidique qui
comporte un domaine extracellulaire de liaison au ligand et une partie cytoplasmique portant
l‘activité enzymatique. La fixation du ligand conduit à la dimérisation du récepteur suivie de
son activation par modification conformationnelle et par transphosphorylation sur résidu
tyrosine.
Différentes classes de RTK ont été définies en fonction des motifs d’affinité protéique
présents sur leurs domaines extracellulaires. Certaines classes de RTK (classes II à V, VII, IX
et XIV) sont exprimées dans le tissu hématopoïétique et de nombreux sont impliquées dans la
pathogénèse des leucémies (Gupta, Knight, & Bain, 2002). La Figure 13 est une
représentation simplifiée des différentes classes de récepteurs à activité tyrosine kinase où la
classe III regroupe des récepteurs majeurs de l’hématopoïèse tels que c-KIT, c-FMS, les
récepteurs ! et " du PDGF et Flt3.
Les RTK de classe II comprennent le récepteur à l’insuline (IR) qui, contrairement
autres RTK, n’est pas monomérique. Les facteurs de croissance « insulin-like » régulent la
prolifération et la différenciation des cellules hématopoïétiques via leurs récepteurs
spécifiques présents à la surface des érythrocytes, des monocytes, des lymphocytes B et T
(Zumkeller, 2002). L’hypersensibilité à l’IGF-1 est un élément pathogénique important dans
la Polycythemia vera (Correa, Eskinazi, & Axelrad, 1994).
Les RTK de classe III sont caractérisés par 5 domaines homologues aux
immunoglobulines dans la partie extracellulaire de liaison au ligand. Ces récepteurs
comprennent c-Kit (Yarden et al., 1987), Flt3 (Rosnet et al., 1993), PDGFR! (Claesson-
Welsh, Eriksson, Westermark, & Heldin, 1989), PDGFR" (Yarden et al., 1986) et c-FMS
50

(Coussens et al., 1986). Flt3 et c-KIT jouent un rôle important dans la survie, la prolifération
et la différenciation des progéniteurs hématopoïétiques primitifs ; c-FMS, le récepteur pour le
« macrophage colony-stimulating factor » (M-CSF) est impliqué dans la croissance et la
différenciation des monocytes/macrophages et des précurseurs ostéoclastiques. Le rôle du
PDGFR" dans l’hématopoïèse est encore mal connu : il joue vraisemblablement un rôle dans
la mégacaryopoïèse (M. Yang, Khachigian, Hicks, Chesterman, & Chong, 1997). Nous
détaillerons ultérieurement (cf. Chapitre § 9), le rôle du couple FL/Flt3 dans la régulation de
l’hématopoïèse.
Les RTK de classe IV correspondent à la famille des récepteurs aux « fibroblast
growth factors » (FGFR-1, FGFR-2, FGFR-3, FGFR-4) caractérisés par la présence de 3
domaines homologues aux immunoglobulines dans la partie extracellulaire. Un remaniement
du gène FGFR-1 (8p11~12) a été décrit dans des néoplasmes myéloprolifératifs atypiques
(Macdonald, Aguiar, Mason, Goldman, & Cross, 1995).
Les RTK de classe V regroupent la famille des « vascular endothelial growth factor
receptor » (VEGFR) comprenant : VEGFR-1 (flt1), VEGFR-2 (KDR/flk-1), VEGFR-3 (flt-4)
(Veikkola, Karkkainen, Claesson-Welsh, & Alitalo, 2000). Ils possèdent 7 domaines de type
immunoglobulines dans la partie extracellulaire. L’expression des ARNm messagers des
VEGFR-1 et VEGFR-2 est retrouvée dans certaines lignées cellulaires leucémiques alors
qu’elle est absente dans les progéniteurs normaux (Ratajczak et al., 1998).
Les RTK de classe VII identifient la famille des récepteurs « tropomyosin receptor »
(TRK) caractérisés par des répétitions riches en leucine dans leur domaine extracellulaire. Ces
récepteurs à la neurotrophine sont exprimés sur les érythroblastes immatures (TrkA),
métamyélocytes éosinophiles (TrkB), promyélocytes, myélocytes et mégacaryocytes (TrkC)
sans que l’on connaisse leur rôle précis sur ces cellules (Labouyrie et al., 1999).
Les RTK de classe IX tels que ceux de la famille des récepteurs TIE : Tie-1 et Tie-2
(Tek) sont caractérisés par une région extracellulaire contenant trois répétitions de type
fibronectine III, un domaine immunoglobuline homologue et trois répétitions EGF
homologues. L’expression élevée de Tie-1 dans les leucémies aiguës et les syndromes
myélodysplasiques suggère qu’il joue un rôle important dans l’angiogénèse et l’hématopoïèse
pathologique (Verstovsek et al., 2001).
51
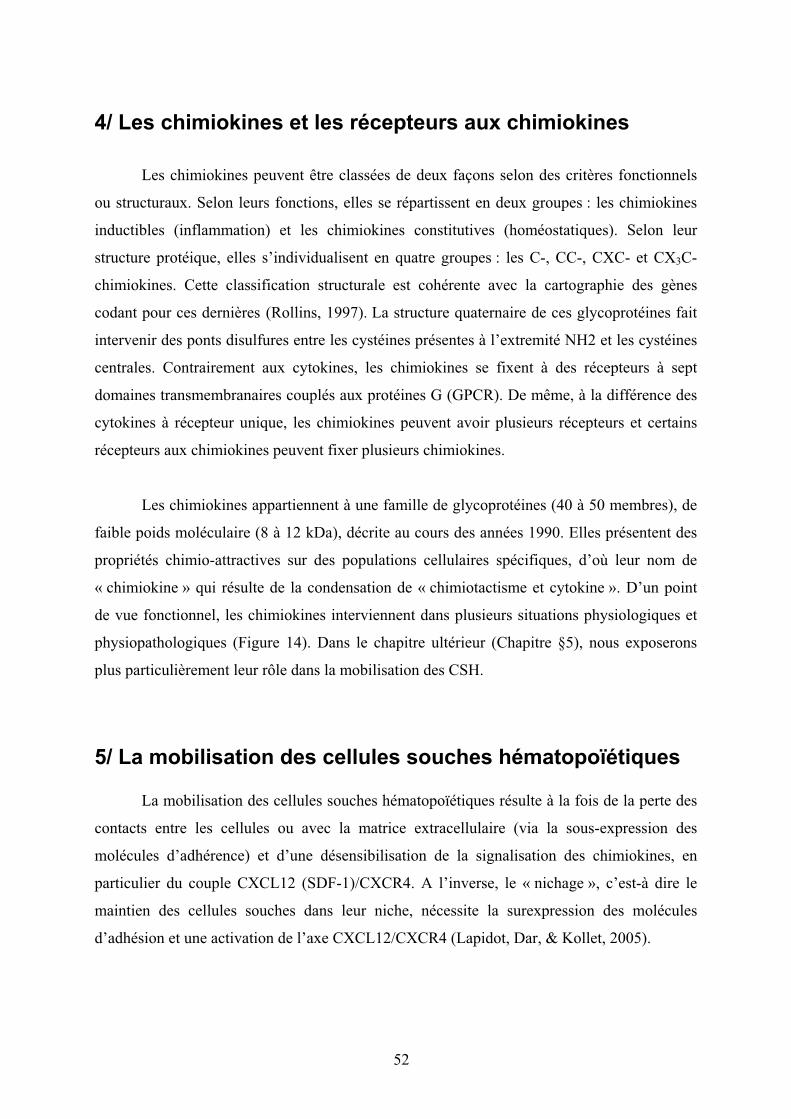
4/ Les chimiokines et les récepteurs aux chimiokines
Les chimiokines peuvent être classées de deux façons selon des critères fonctionnels
ou structuraux. Selon leurs fonctions, elles se répartissent en deux groupes : les chimiokines
inductibles (inflammation) et les chimiokines constitutives (homéostatiques). Selon leur
structure protéique, elles s’individualisent en quatre groupes : les C-, CC-, CXC- et CX3C-
chimiokines. Cette classification structurale est cohérente avec la cartographie des gènes
codant pour ces dernières (Rollins, 1997). La structure quaternaire de ces glycoprotéines fait
intervenir des ponts disulfures entre les cystéines présentes à l’extremité NH2 et les cystéines
centrales. Contrairement aux cytokines, les chimiokines se fixent à des récepteurs à sept
domaines transmembranaires couplés aux protéines G (GPCR). De même, à la différence des
cytokines à récepteur unique, les chimiokines peuvent avoir plusieurs récepteurs et certains
récepteurs aux chimiokines peuvent fixer plusieurs chimiokines.
Les chimiokines appartiennent à une famille de glycoprotéines (40 à 50 membres), de
faible poids moléculaire (8 à 12 kDa), décrite au cours des années 1990. Elles présentent des
propriétés chimio-attractives sur des populations cellulaires spécifiques, d’où leur nom de
« chimiokine » qui résulte de la condensation de « chimiotactisme et cytokine ». D’un point
de vue fonctionnel, les chimiokines interviennent dans plusieurs situations physiologiques et
physiopathologiques (Figure 14). Dans le chapitre ultérieur (Chapitre §5), nous exposerons
plus particulièrement leur rôle dans la mobilisation des CSH.
5/ La mobilisation des cellules souches hématopoïétiques
La mobilisation des cellules souches hématopoïétiques résulte à la fois de la perte des
contacts entre les cellules ou avec la matrice extracellulaire (via la sous-expression des
molécules d’adhérence) et d’une désensibilisation de la signalisation des chimiokines, en
particulier du couple CXCL12 (SDF-1)/CXCR4. A l’inverse, le « nichage », c’est-à dire le
maintien des cellules souches dans leur niche, nécessite la surexpression des molécules
d’adhésion et une activation de l’axe CXCL12/CXCR4 (Lapidot, Dar, & Kollet, 2005).
52
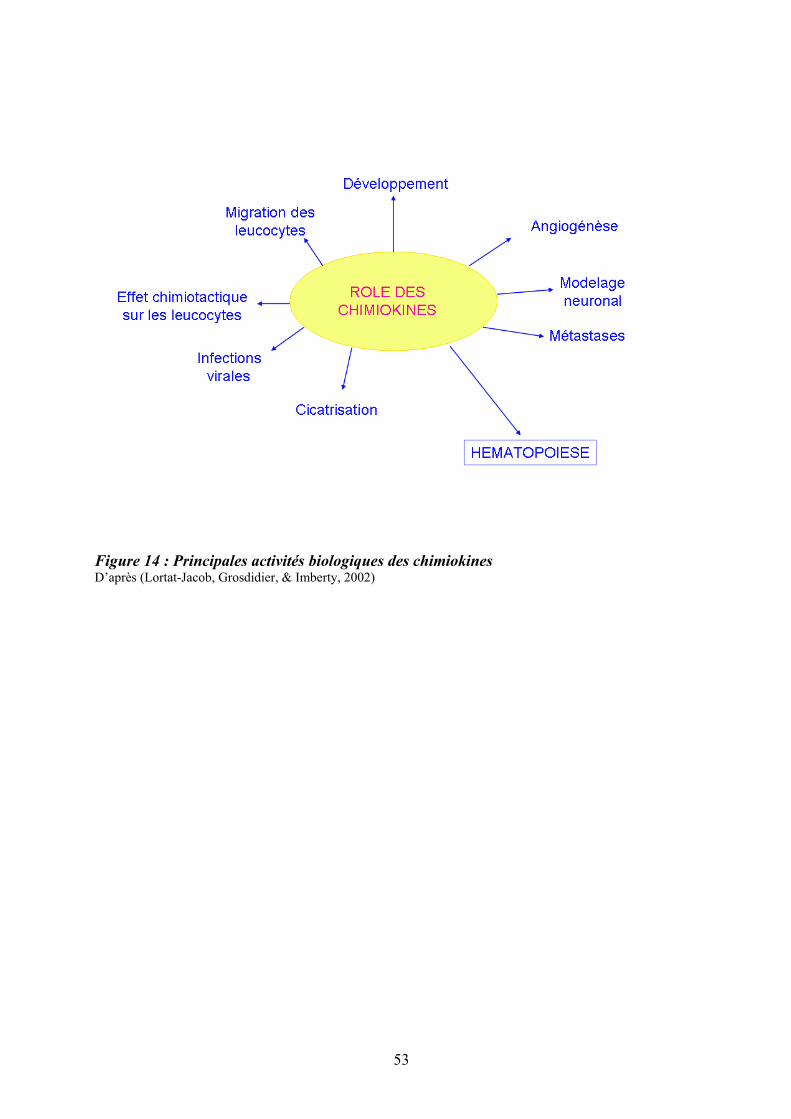
Figure 14 : Principales activités biologiques des chimiokines D’après (Lortat-Jacob, Grosdidier, & Imberty, 2002)
53
5.1/ Migration des cellules souches hématopoïétiques au cours de l’ontogénie
Au cours du développement embryonnaire, avant le développement de la
vascularisation, les cellules souches hématopoïétiques sont localisées dans le sac vitellin et la
région aorta-gonado-mesonephros (AGM), puis elles migrent vers le foie fœtal et la moelle
osseuse (Medvinsky & Dzierzak, 1996). Ces cellules peuvent être mobilisées dans la
circulation sanguine à l’exception des rares cellules souches qui sont maintenues dans la
moelle osseuse à l’âge adulte (Morrison et al., 1995). Immédiatement après la naissance, le
sang de cordon humain contient un nombre élevé de progéniteurs hématopoïétiques CD34+
(environ 0,5%) dont des cellules primitives de type CD34+/CD38low, suggérant une migration
importante des cellules souches et progéniteurs hématopoïétiques dans les phases tardives du
développement (Broxmeyer, 1996).
5.2/ Circulation des cellules souches et progéniteurs hématopoïétiques adultes
A l’état adulte, la majorité des cellules souches hématopoïétiques siègent dans la moelle
osseuse où elles s’auto-renouvellent, prolifèrent et donnent naissance à des cellules
hématopoïétiques différenciées. Certaines de ces CSH quittent la moelle osseuse et migrent,
via le sang, vers les organes périphériques, particulièrement lymphoïdes, où elles se divisent
et se différencient. Les CSH circulantes peuvent se lier aux cellules endothéliales grâce aux
sélectines vasculaires qui s’associent au CD44 et à la « P-Selectin Glycoprotein Ligand-1 »
(PSGL-1) présents sur les CSH. L’interaction du VCAM-1 endothélial avec l’intégrine VLA-
4 permet à la CSH de « rouler » à l’intérieur du vaisseau sanguin. Le gradient de
CXCL12/SDF1 active le VLA-4 par un changement conformationnel qui augmente son
affinité pour VCAM-1, augmentant la fixation des CSH à la paroi interne du vaisseau et
diminue leur roulement. Les CSH traversent alors la paroi endothéliale et migrent dans la
moelle osseuse grâce à l’action d’agents chimiotactiques dont le message est transduit via les
GPCR présents sur les CSH (Laird, von Andrian, & Wagers, 2008).
54
5.3/ Mobilisation des cellules souches et des progéniteurs hématopoïétiques
Une augmentation du taux de cellules souches et progéniteurs circulants peut être
observée lors d’une inflammation, d’un traumatisme ou d’une lésion tissulaire (Fu &
Liesveld, 2000). Ainsi, le passage des cellules souches et progéniteurs dans la circulation et
leur retour vers la moelle osseuse sont des événements séquentiels importants à l’équilibre
homéostatique. Le concept de niche occupée par des cellules souches quiescentes dans la
moelle osseuse se complexifie par l’existence d’une situation plus dynamique intégrant
migration, circulation et nichage dans la moelle osseuse (Lapidot & Petit, 2002). La
mobilisation des cellules souches peut être provoquée en réponse à la chimiothérapie mais
également après un traitement par des cytokines ou différents agents mobilisateurs tels que le
G-CSF ou l’AMD3100, un antagoniste du récepteur CXCR4 de la chimiokine CXCL12
(Tableau 3) (To, Haylock, Simmons, & Juttner, 1997).
Comparativement à la mobilisation induite par les cytokines (de l’ordre de quelques
jours), celle provoquée par les chimiokines est très rapide avec un pic de mobilisation dans les
60 minutes suivant l’injection, suggèrant des mécanismes différents (Pelus, Horowitz,
Cooper, & King, 2002) (Pruijt, Willemze, & Fibbe, 1999).
5.4/ Migration des cellules souches et progéniteurs hématopoïétiques en réponse au ligand de Flt3
Le ligand de Flt3 (FL) facilite la mobilisation des cellules souches hématopoïétiques in vivo.
En effet, il stimule la migration des cellules CD34+ de donneurs sains lorsqu’il est utilisé seul
et augmente de façon synergique celle induite par SDF-1/CXCL12 (Fukuda, Broxmeyer, &
Pelus, 2005). De façon intéressante, il a été montré, chez les grands sportifs, une
augmentation du Flt3-ligand plasmatique pendant l’effort et une élévation du nombre de
progéniteurs circulants mais pas immédiatement après l’effort (Bonsignore et al., 2002). Ceci
suggère que la cytokine FL pourrait intervenir physiologiquement dans la régulation de la
circulation des PH d’une façon relativement lente comme ceci est montré dans le tableau 3
lorsque FL (Flt3-ligand) est utilisé comme agent mobilisateur chez l’homme.
55

Classe"d'agents Temps"maximal"de"mobilisation Exemples Mécanismes
Chimiokines 15"minutes"à"quelques"heures CCL3,"CXCL2,CXCL8,"CXCL12,"
antagoniste"CXCR4"(AMD3100)
Activation"granulocytaire"directe,"bloquage"de"
la"fonction"de"CXCR4
Stress 1!2"heures Exercice"intense,"ACTH Demargination,"activation"des"granulocytes"?
Polyanions 1!2"heures Fucoidans Libération"de"cytokines"et"chimiokines"du"
compartiment"intracellulaire"au"compartiment"
extracellulaire.
Sulfate"de"Dextran
Acide"polymethacrylique ND
5"jours Defibrotide ND
Toxines 2!3"jours Toxine"Pertussis bloque"la"signalisation"CXCR4
ND Endotoxines"bactériennes ND
Anticorps 1!2"jours Anti!CD49d,"anti!VCAM!1 Inhibition"directe"de"l'interaction"VLA4!VCAM!
1
Facteurs"de"croissance 4!6"jours G!CSF,"G!CSF"pegylé,"SCF,"IL!3,"GM!CSF,"
Flt3!ligand,"Thrombopoiétine,"hormone"
de"croissance,"érythropoiétine,"VEGF,"
angiopoiétine!1
Expansion"et"activation"des"granulocytes,"
Synergie"avec"le"G!CSF,"ND
Myélosuppresseurs 1!3"semaines Cyclophosphamide,"5!FU Expansion"de"granulocytes,"activation"suivant"
la"myélo!suppression
Tableau 3 : Principaux agents mobilisateurs des CSH/PH(ND : non déterminé) (Winkler & Levesque, 2006)
56

6/ La niche hématopoïétique
Comme nous l’avons précisé en introduction, les CSH résident dans la moelle osseuse
au sein de niches spécifiques. Ce concept de niche, initialement proposé par Schofield (1978),
repose sur une réalité anatomique et fonctionnelle favorisant le maintien en quiescence et
l’auto-renouvellement des CSH.
Bien que controversées, les connaissances actuelles font état de l’existence de 2 types
de niches hématopoïétiques : la niche endostéale et la niche vasculaire (Yin & Li, 2006)
(Figure 15). La niche endostéale, au contact de l’os, serait impliquée dans le maintien en
quiescence des CSH. Elle est constituée d’ostéoblastes, de fibroblastes et d’adipocytes ayant
tous pour origine la cellule souche mésenchymateuse (CSM), ainsi que d’ostéoclastes,
d’origine hématopoïétique, impliqués dans la résorption osseuse. La niche vasculaire, quant à
elle, consiste en un réseau de vaisseaux fenêtrés formés par des cellules endothéliales dérivant
de la cellule souche endothéliale (CSE). Bien que participant à la prolifération et
différenciation des CSH, des études récentes de l’équipe de Rafii suggèrent que la niche
vasculaire aurait également un rôle dans leur autorenouvellement (Kobayashi et al., 2010).
Les CSH entretiennent un dialogue constant avec leur niche où elles sont régulées via
des contacts directs avec les différentes cellules stromales et les molécules de la matrice
extracellulaire (Stier et al., 2005), ainsi que via des interactions avec des facteurs diffusibles et
environnementaux tels que le calcium (G. B. Adams et al., 2006) et l’oxygène. Un certain
nombre de couples ligands/récepteurs (Calvi et al., 2003) (Arai et al., 2004) et de molécules
d’adhérence sont impliqués dans les interactions entre l’ostéoblaste et la CSH et réguleraient
l’équilibre quiescence/auto-renouvellement de ces dernières. Les facteurs diffusibles sont,
quant à eux, représentés par certaines hormones, des BMPs (bone morphogenic protein), des
cytokines et chimiokines (Levesque, Helwani, & Winkler, 2010). En dehors de ces
interactions cellulaires et humorales, l’importance du système nerveux sympathique dans la
régulation des CSH au sein des niches médullaires a été récemment suggérée (Lapidot &
Kollet, 2010).
En condition physiologique, les CSH résident aussi bien dans la niche ostéoblastique
que dans la niche vasculaire. En réponse à une diminution du taux de SDF-1/CXCL12 dans la
moelle osseuse, certaines CSH vont quitter leur niche et circuler. Le nichage des CSH est le
processus inverse de la mobilisation et apparaît en particulier lors d’une augmentation du
gradient de SDF-1 dans la moelle osseuse. Le processus de recrutement des progéniteurs
57

hématopoïétiques (PH) au niveau de la niche vasculaire semble dépendre de la production de
FGF-4 et SDF-1 par la cellule endothéliale. Le gradient en oxygène et en FGF-4 entre la niche
ostéoblastique et la niche vasculaire joue également un rôle dans le recrutement, la
prolifération et la différenciation des CSH. Sous l’effet d’un stress, SDF-1 et VEGF activent
la MMP9 qui clive le SCF membranaire et favorise l’entrée en cycle des CSH, leur
mobilisation vers la niche vasculaire et leur différenciation (Yin & Li, 2006) (Lataillade et al.,
2000) (Lataillade et al., 2002).
Les niches médullaires sont donc un environnement « critique » pour le maintien en
quiescence et la prolifération des cellules souches hématopoïétiques. Ce sont des sanctuaires
des CSH ; leur altérations peuvent conduire et/ou participer à la génèse des hémopathies
(Raaijmakers & Scadden, 2008).
6.1/ Principales cellules constituant les niches hématopoïétiques
6.1.1/ Les cellules souches mésenchymateuses
Les cellules souches mésenchymateuses (CSM) sont des CS multipotentes d’origine
non hématopoïétique qui représentent une population rare (0,001% à 0,01%) des cellules
médullaires. Elles ont une capacité de différenciation importante puisqu’elles peuvent donner
naissance in vitro à des cellules spécialisées de type musculaire, ostéoblastique,
chondrocytaire, adipocytaire et neurale (Pittenger, 2008). Elles sont également caractérisées
par leurs propriétés immunomodulatrices et trophiques (Garrett & Emerson, 2009;
Gotherstrom, 2007).
Les CSM participent au fonctionnement de la niche médullaire et au soutien de
l’hématopoièse via des interactions entre les cellules et avec la matrice extracellulaire ainsi
que par la production de nombreux facteurs de croissance. Les CSM synthétisent également
de nombreuses molécules de la matrice extracellulaire comme le collagène, la laminine, la
fibronectine, les protéoglycans. Elles expriment également des molécules d’adhérence telles
que les intégrines "-1 VLA-4 et VLA-5 ainsi que diverses protéines contractiles telles que
l’actine alpha-SM (ASMA) (Chen, Dusevich, Feng, Manolagas, & Jilka, 2007). Des cellules
ASMA+ sont retrouvées dans différentes localisations médullaires telles qu’au niveau des
capillaires (péricytes), des sinus et en bordure de l’endosteum.
58
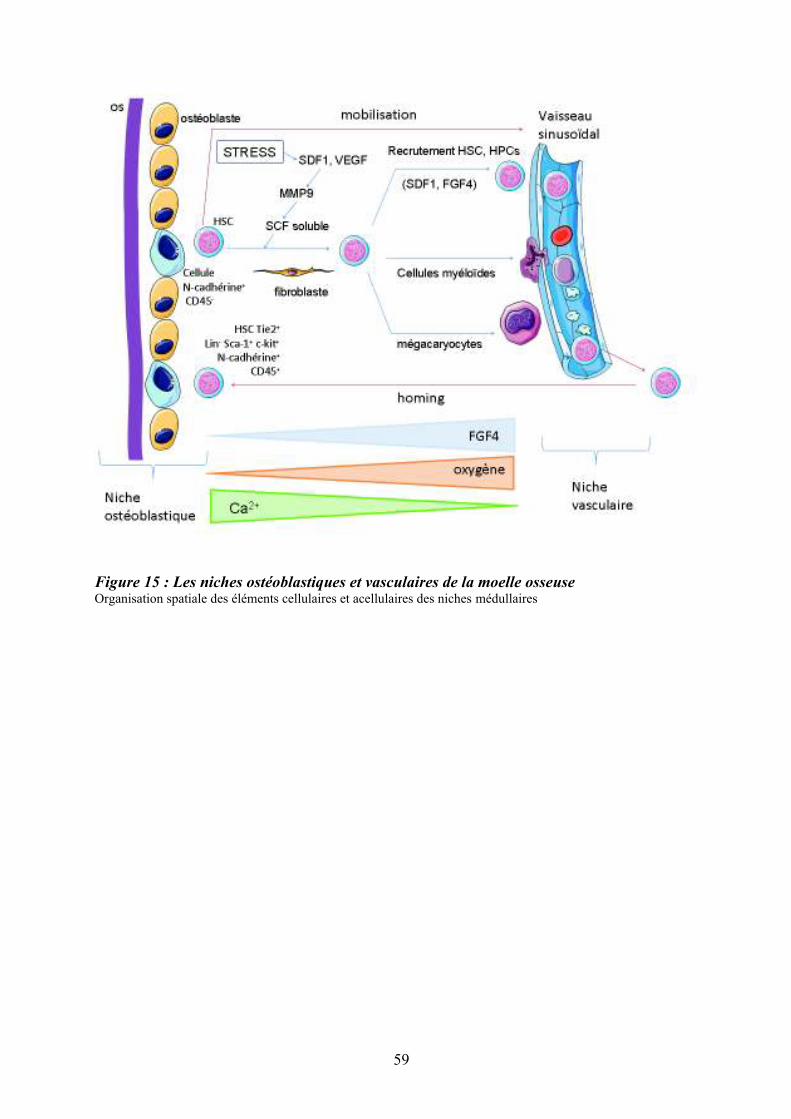
Figure 15 : Les niches ostéoblastiques et vasculaires de la moelle osseuse Organisation spatiale des éléments cellulaires et acellulaires des niches médullaires
59
Au cours de l’ontogénie hématopoïétique, les cellules mésenchymateuses sont
présentes au niveau du foie foetal et de la moelle osseuse juste avant l’apparition de
l’hématopoïèse définitive dans chacun de ces sites (Romanov, Darevskaya, Merzlikina, &
Buravkova, 2005) (Mendes, Robin, & Dzierzak, 2005). Dans les expériences de culture à long
terme de type Dexter, les cellules stromales de moelle osseuse sont capables de soutenir
l’hématopoïèse pendant plus de 6 mois et de permettre la différenciation myéloïde et
lymphoïde des CSH (Charbord, Tavian, Humeau, & Peault, 1996). De façon intéressante,
l’injection simultanée de CSM avec les CSH accélère la reprise de l’hématopoïèse après une
irradiation dans plusieurs modèles expérimentaux (Dexter, Allen, & Lajtha, 1977) (Noort et
al., 2002).
6.1.2/ Les ostéoblastes
L’os est un organe complexe qui participe au métabolisme minéral, maintient
l’intégralité structurale du corps et soutient l’hématopoïèse. La balance ostéoblaste/ostéoclaste
permet de réguler l’équilibre osseux. Les ostéoblastes sont d’origine mésemchymateuse : au-
delà de leur rôle établi dans le remodelage osseux, ce sont des composants clés de la niche
hématopoïétique (Zhou et al., 2008) (J. Zhang et al., 2003) (Calvi et al., 2003). En effet, les
interactions entre CSH et ostéoblastes sont critiques pour le maintien des propriétés
d’autorenouvellement, de différenciation et de mobilisation des CSH (Visnjic et al., 2004).
Les ostéoblastes sont absents du foie et de la rate, qui peuvent être cependant le siège d’une
hématopoïèse ectopique chez l’homme, en situation pathologique. Ainsi, si leur rôle est
crucial dans l’hématopoïèse médullaire, la composante ostéoblastique n’est pas le support
unique de l’hématopoièse (Arai & Suda, 2007).
6.1.3/ Les adipocytes
A la naissance, la moelle rouge hématopoïétique occupe virtuellement la totalité de
l’espace de la moelle osseuse et la moelle blanche, non hématopoïétique, augmente
progressivement avec l’âge. En effet, dans la moelle osseuse adulte, le nombre d’adipocytes
est inversement corrélé à l’activité hématopoïétique, suggérant une relation étroite entre les
adipocytes et les cellules hématopoïètiques.
In vitro, les adipocytes inhibent l’expansion des cellules hématopoïétiques en libérant
des facteurs inhibiteurs de l’hématopoïèse comme la neuropilline-1, la lipocaline-2 et
60

l’adiponectine (Bryon, Gentilhomme, & Fiere, 1979) (Belaid-Choucair et al., 2008)
(Miharada et al., 2008). Leur rôle spécifique, in vivo, au sein de la niche médullaire n’est
toujours pas clairement établi.
Ainsi, le tissu adipeux médullaire n’est plus considéré comme un simple tissu de
remplissage, mais comme un tissu adaptable et pourvu d’une activité métabolique sécrétoire
très vraisemblablement impliqué dans la régulation de l’hématopoïèse (Naveiras et al., 2009).
6.1.4/ Les ostéoclastes
L’ostéoclaste est l’unique type cellulaire capable de résorber l’os. D’origine
hématopoïétique, il dérive d’un précurseur monocytaire/macrophagique qui se différencie en
pré-ostéoclastes. Leur fusion va donner naissance à l'ostéoclaste multinucléé fonctionnel,
spécialisé dans la résorption osseuse. La différenciation ostéoclastique requiert un contact
direct entre les précurseurs ostéoclastiques et les ostéoblastes. Ces derniers expriment les
formes membranaires des cytokines RANKL et M-CSF alors que les précurseurs
ostéoclastiques expriment leurs récepteurs respectifs (Tanaka, Nakamura, Takahasi, & Suda,
2005). L’interaction entre ces cellules est régulée par l’ostéoprotégérine (OPG) qui, en fixant
le RANKL, joue le rôle de récepteur « leurre », bloquant l’interaction RANK/RANK-L et
inhibant l’ostéoclastogenèse (Novack & Teitelbaum, 2008).
6.1.5/ Les cellules endothéliales
La moelle osseuse est un organe extrêmement vascularisé. Les capillaires sinusoïdes
sont constitués d’une seule couche de cellules endothéliales disjointes. Ces cellules
interviennent dans la constitution des niches vasculaires où elles régulent les fonctions des
CSH. L’administration in vivo d’un anticorps anti-VE-cadhérine conduit à une altération de
l’hématopoïèse en réduisant la différenciation mégacaryocytaire (Li, Johnson, Shelley, &
Yoder, 2004). De même, comme nous l’avons précisé plus haut, elles semblent jouer un rôle
clé dans l’auto-renouvellement des CSH.
61
Un certain nombre d’autres types cellulaires participent également à la régulation des
CSH/PH au sein des niches hématopoiétiques ; parmi celles-ci, citons les cellules CD146+
(Avecilla et al., 2004), les cellules nestin+ (Mendez-Ferrer et al., 2010), les cellules CAR
(CXCL12 Abondant Reticular cells) (Sacchetti et al., 2007), les ostéomacs (Winkler et al.,
2010), localisées au niveau subendothélial et/ou proche de l’endosteum. Leur rôle respectif au
sein de ces niches est actuellement exploré par de nombreuses équipes.
6.2/ Les molécules de la matrice extracellulaire
La Matrice Extracellulaire ou MEC est une structure dynamique composée de protéines,
protéoglycanes et glycanes représentés par : i) des fibres de collagènes principalement de
types I, III et IV produits par les cellules stromales (ostéoblastes, endothéliales..), ii) des
protéines des membranes basales (laminine, entactine) et iii) d’autres composants interstitiels
comme la fibronectine, la ténascine, l’ostéopontine... Ces molécules sont de nature fibrillaire
ou non fibrillaire.
6.2.1/ Molécules fibrillaires : collagènes et réticuline
Les fibres de collagène I et de réticuline sont rares, nettement moins abondantes dans
la moelle osseuse que dans les autres organes hématopoïétiques et presque exclusivement
situées dans les zones périvasculaires des gros vaisseaux. Les fibres de collagène I deviennent
abondantes à la suite d’une activation des fibroblastes médullaires comme dans les cas de
myélofibroses. Le collagène IV, synthétisé par les cellules endothéliales, est le composant
majeur des membranes basales bordant la face externe de l’endothélium des cellules
endothéliales. Le réseau, de fibres dites de réticuline, correspond à des glycoprotéines
associées aux fibrilles de collagène III. Ce réseau renferme les cellules hématopoïétiques
bordant les sinus et encerclant les adipocytes.
6.2.2/ Molécules non fibrillaires
De nombreux composants matriciels non fibrillaires ont été identifiés à partir de la
fraction adhérente des cultures de moelle à long terme parmi ceux-ci on peut citer :
62

glycosaminoglycanes, héparanes sulfates, le perlecan, la fibronectine, l’hémonectine, la
laminine. Ces macromolécules forment, par leurs charges polyanioniques, des agrégats jouant
un rôle dans les mouvements de l’eau, régulant les phénomènes de diffusion interstitielle,
stabilisant les fibres de collagène, intervenant dans l’adhérence des précurseurs
hématopoïétiques au stroma et pouvant se lier aux facteurs de croissance pour potentialiser
leur action in situ.
63
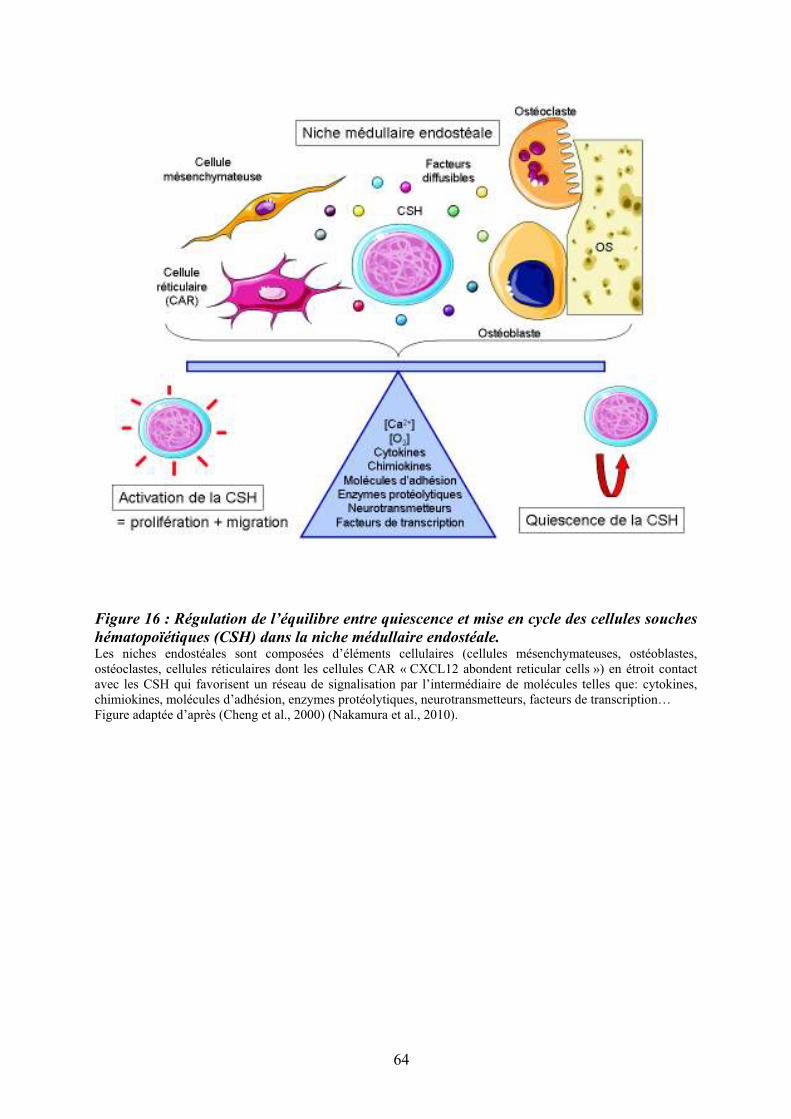
Figure 16 : Régulation de l’équilibre entre quiescence et mise en cycle des cellules souches
hématopoïétiques (CSH) dans la niche médullaire endostéale. Les niches endostéales sont composées d’éléments cellulaires (cellules mésenchymateuses, ostéoblastes, ostéoclastes, cellules réticulaires dont les cellules CAR « CXCL12 abondent reticular cells ») en étroit contact avec les CSH qui favorisent un réseau de signalisation par l’intermédiaire de molécules telles que: cytokines, chimiokines, molécules d’adhésion, enzymes protéolytiques, neurotransmetteurs, facteurs de transcription… Figure adaptée d’après (Cheng et al., 2000) (Nakamura et al., 2010).
64

6.3/ Régulation fonctionnelle des cellules souches hématopoïétiques dans la niche médullaire
La quiescence est une propriété importante des cellules souches hématopoïétiques ; en
effet, plus de 75% des CSH de la moelle osseuse sont en G0 (Hosokawa et al., 2010). Les
niches médullaires jouent un rôle important dans le maintien de l’équilibre « quiescence-
activation » et « autorenouvellement-prolifération ». Cet équilibre permet de conserver un
pool constant de CSH au long de la vie, tout en maintenant une hématopoïèse efficace
(Cheshier, Morrison, Liao, & Weissman, 1999). La Figure (16) décrit les principaux
protagonistes qui interviennent dans le maintien à l’équilibre du pool des CSH au sein de la
niche endostéale (Arai & Suda, 2007) (Wilson & Trumpp, 2006) (Trumpp, Essers, & Wilson,
2010). Malgré de nombreux travaux réalisés récemment, les mécanismes moléculaires
impliqués dans la quiescence des CSH restent encore mal connus. Il a été rapporté que
l’expression de la protéine c-Myc était faible dans les CSH quiescentes. Les actions de c-Myc
sur la quiescence des CSH sont multiple puisque celui-ci induit l’expression de nombreux
régulateurs positifs du cycle cellulaire et diminue celle de régulateurs négatifs (Morrison &
Spradling, 2008) (Wilson et al., 2004). De plus, c-Myc diminue l’expression de nombreuses
molécules d’adhésion incluant la N-cadhérine et les intégrines beta-1, alpha-2 et alpha-5 dans
les CSH et régule ainsi le processus d’adhésion des CSH à la niche médullaire. Un défaut de
quiescence des CSH conduisant à une diminution de leur capacité de repopulation à long
terme est observé chez les souris déficientes pour le gène CDKN1A (p21), confirmant
l’importance du contrôle de la division cellulaire dans la conservation de la capacité
« souche » (Baena, Ortiz, Martinez, & de Alboran, 2007). De nombreux autres acteurs
moléculaires interviennent dans la régulation fonctionnelle des CSH au sein des niches
médullaires. Parmi ceux-ci, citons : l’annexine II (anx2), une molécule d’adhésion qui semble
intervenir de façon importante dans l’interaction osteoblaste-CSH (Jung et al., 2007),
l’angiopoïétine I (Morrison & Spradling, 2008) (Arai et al., 2004), le Steel Factor (Thoren et
al., 2008), la chimiokine SDF-1!/CXCL12 (Sugiyama, Kohara, Noda, & Nagasawa, 2006), la
thrombopoïétine (Yoshihara et al., 2007), Wnt (Fleming et al., 2008), Jagged1 (Calvi et al.,
2003), l’ostéopontine (Stier et al., 2005), la N-cadhérine (Hosokawa et al., 2010) et leurs
récepteurs ou contre-récepteurs. Cette liste n’est pas exhaustive ; elle tend à s’étendre et à se
complexifier compte tenu de l’hétérogénéité d’action de ces couples ligands-récepteurs dans
la régulation des CSH in vitro et in vivo, au sein des niches hématopoïétiques.
65

7/ Epigénétique et hématopoïèse
L’épigénétique étudie les modifications réversibles de l’expression génique
transmissibles d’une génération à l’autre sans altération des séquences nucléotidiques et
l’influence de l’environnement sur l’expression des gènes. Les marqueurs épigénétiques
actuellement connus sont la méthylation de l’ADN et les modifications des histones. Ils
participent de façon dynamique au développement et aux processus de différenciation en
particulier hématopoïétique.
7.1/ La méthylation de l’ADN
Les « CpG Islands » sont des régions riches en CpG (Cytosine poly Guanine) présentes
dans 50-70 % des promoteurs des gènes humains (Bird, 1986). Les enzymes DNA-
méthyltransférases transfèrent des groupements méthyles sur les cytosines des motifs CpG
situés dans les régions promotrices des gènes. Ces méthylations ont comme conséquence la
répression de la transcription du gène en aval. La méthylation des gènes intervient dans la
différenciation cellulaire (Taylor & Jones, 1979). L’étude du profil de méthylation de l’ADN
des cellules sanguines montre que 4% des promoteurs étudiés (5549 gènes) sont totalement
méthylés (Shen et al., 2007). Il a été montré que la méthylation de l’ADN par la Dnmt1
(DNA-méthyltransférase 1) réprime les programmes de différenciation en interférant sur
l’autorenouvellement et la multipotence (Broske et al., 2009).
66
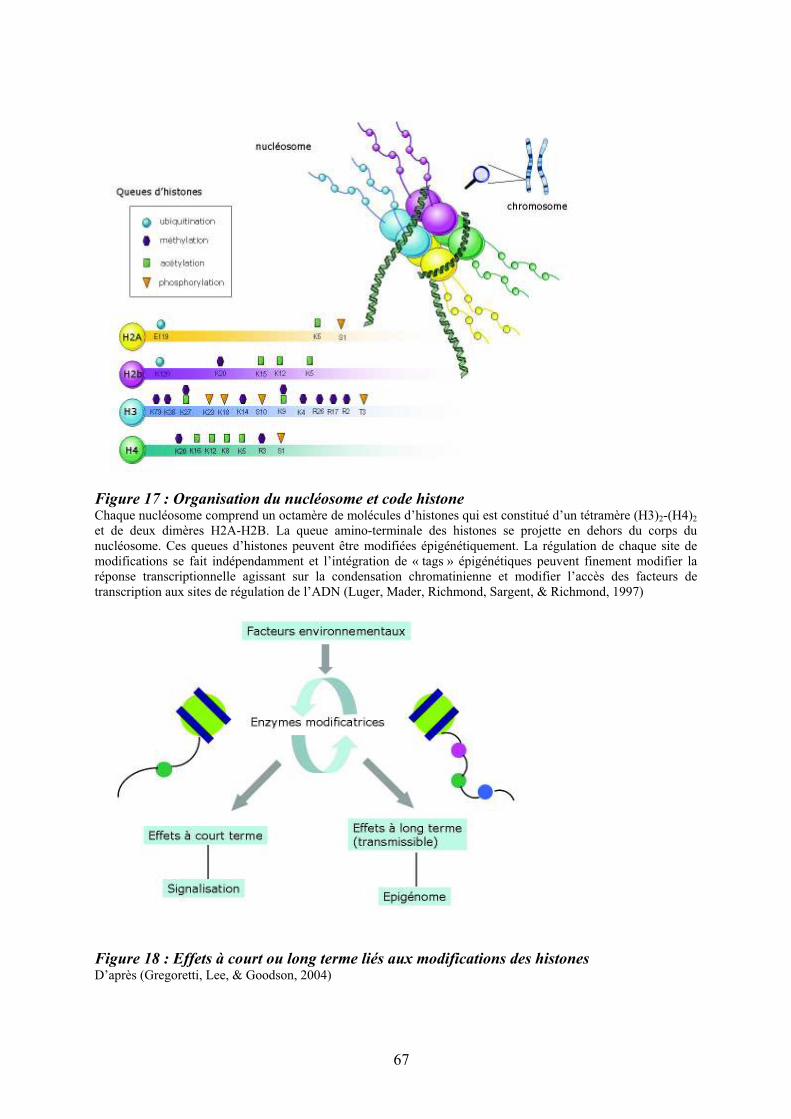
Figure 17 : Organisation du nucléosome et code histoneChaque nucléosome comprend un octamère de molécules d’histones qui est constitué d’un tétramère (H3)2-(H4)2 et de deux dimères H2A-H2B. La queue amino-terminale des histones se projette en dehors du corps du nucléosome. Ces queues d’histones peuvent être modifiées épigénétiquement. La régulation de chaque site de modifications se fait indépendamment et l’intégration de « tags » épigénétiques peuvent finement modifier la réponse transcriptionnelle agissant sur la condensation chromatinienne et modifier l’accès des facteurs de transcription aux sites de régulation de l’ADN (Luger, Mader, Richmond, Sargent, & Richmond, 1997)
Figure 18 : Effets à court ou long terme liés aux modifications des histonesD’après (Gregoretti, Lee, & Goodson, 2004)
67

7.2/ Le code des histones et hétérochromatine
Le nucléosome représente l’unité structurale de la chromatine qui est essentielle à
l’empaquetage de l’ADN. Cet octamère d’histones est constitué d’un tétramère (H3)2-(H4)2
et de deux dimères H2A-H2B autour duquel l’ADN s’enroule 1,75 fois (Richmond & Davey,
2003). Au niveau des queues d’histones, des sites de modifications, situés en surface des
nucléosomes, sont exposés à l’action catalytique d’enzymes (méthylases, acéthylases…). Ces
modifications, appelées « le code des histones », interviennent dans la condensation de la
chromatine et modulent l’expression des gènes. La Figure (17) représente l’organisation
structurale du nucléosome et illustre le code des histones.
Les modifications des queues des histones par des enzymes modificatrices peuvent
être influencées par des signaux environnementaux ou intrinsèques. Ces modifications
peuvent entraîner des effets à court terme (transcription, réplication ou réparation de l’ADN)
ou à long terme (hétérochromatine constitutive et facultative…) (Levenson & Sweatt, 2005).
La Figure (18) schématise l’influence des facteurs microenvironnementaux sur les
modifications des histones.
A titre d’exemple, l’acétylation des queues des histones H3 et H4 est reliée à un état
activé de la transcription des gènes (Allfrey, Faulkner, & Mirsky, 1964; B. M. Turner, 2007).
L’acétylation des histones est également associée à d’autres fonctions cellulaires comme la
réparation de l’ADN et la recombinaison. Il a été aussi démontré que l’acétylation des
histones retarde la réplication de certaines régions du génome. L’hétérochromatine
constitutive est pauvre en gènes, riche en séquences répétées et silencieuse du point de vue
transcriptionnel. Cette région est caractérisée par un groupe de modifications
d’histones incluant un enrichissement en histone H3 tri-méthylé en lysine 9 (H3K9me3), en
histone H4 tri-méthylé en lysine 20 (H4K20me3) et par une diminution de l’acétylation
globale des histones (Mateescu, England, Halgand, Yaniv, & Muchardt, 2004).
7.3/ Les histones déacétylases (HDAC) et histones acétylases (HAT)
Les histones déacétylases (HDAC) et histones acétylases (HAT) sont des enzymes
responsables respectivement de la déacétylation et de l’acétylation des queues amino-
terminales des histones. Ces changements chromatiniens interviennent dans la régulation de la
transcription. Les HDACs appartiennent à une famille d’enzymes conservées au cours de
68

l’évolution qui peuvent acétyler d’autres substrats que les histones (Gregoretti et al., 2004).
Quatre classes de HDACs ont été identifiées. Compte tenu de l’implication potentielle des
HDACs dans la pathogénèse de certains cancers et leucémies, les inhibiteurs des HDACs
(HDACi) sont actuellement de plus en plus souvent utilisés en thérapie.
69
8/ La mégacaryopoïèse
Chaque jour, environ 1011 plaquettes sont produites par fragmentation du cytoplasme
des mégacaryocytes, leurs précurseurs médullaires. La mégacaryopoïèse s’individualise des
autres lignées hématopoïétiques car, au cours des phases tardives de différenciation, la cellule
réalise des endomitoses (mitoses interrompues sans cytokinèse) conduisant à une
polyploïdisation nucléaire. L’augmentation du volume cytoplasmique suivie de la
fragmentation du cytoplasme donne naissance aux plaquettes, via la formation de nombreuses
extensions proplaquétogènes (Wickrema & Crispino, 2007).
Les mégacaryocytes dérivent de la CSH ; ils partagent un progéniteur commun avec
les cellules de la lignée érythroïde. Ce progéniteur va progressivement se différencier en
mégacaryocytes sous l’influence d’un réseau complexe de molécules intégrant facteurs de
transcription et cytokines, dans lequel la TPO joue un rôle majeur.
Au cours des étapes de différenciation mégacaryocytaire, les cellules expriment un panel de
marqueurs de différenciation qui varie en fonction de leur stade de maturation. La Figure (19)
résume la cinétique d’expression des principales molécules membranaires au cours de la
mégacaryopoïèse humaine. Ainsi, l’expression de molécule de surface CD34 est perdue au
cours des étapes de différenciation mégacaryocytaire (Salati et al., 2008). Il en est de même
pour le récepteur Flt3, dont l’expression est réprimée au cours de la différenciation myéloïde,
à l’exception des cellules monocytaires/macrophages. L’expression de CD117 (c-Kit) persiste
plus tardivement que celle de Flt3 (Masson & Ronnstrand, 2009). Celle du récepteur CXCR4
persiste tout au long de la différenciation mégacaryocytaire et son rôle dans le chimiotactisme
des MK en réponse à CXCL-12/SDF1 est fortement suggéré (Avecilla et al., 2004). D’autres
glycoprotéines membranaires telles que CD42a, CD62p, CD61 et plus tardivement le CD42b
sont également exprimées de façon séquentielle au cours de la différenciation MK (Lepage et
al., 2000). Plus récemment, notre laboratoire a mis en évidence l’expression de la tétraspanine
CD9 au cours de la différenciation des MK et son augmentation parallèllement à celle de
l’intégrine CD41 (Clay et al., 2001).
70

Figure 19 : Principaux marqueurs membranaires exprimés au cours de la différenciation
mégacaryocytaire
71

8.1/ Endomitose mégacaryocytaire
Au cours de la différenciation mégacaryocytaire, les promégacaryoblastes augmentent
progressivement leur ploidie et leur contenu en ADN. Cette polyploïdisation permet
d’augmenter la production de plaquettes car le volume cytoplasmique du MK croît
parallèlement à celui du noyau. Le terme d’endomitose a été donné au processus de
ploïdisation car celle-ci s’effectue sans rupture de l’enveloppe nucléaire (Youssefian &
Cramer, 2000). L’endomitose est caractérisée par un arrêt de la mitose en anaphase B (Ravid,
Lu, Zimmet, & Jones, 2002) (Nagata, Muro, & Todokoro, 1997) et plus précisément lors de la
cytokinèse tardive (Vitrat, Cohen-Solal, Pique et al., 1998) (Geddis & Kaushansky, 2006). Au
cours de la polyploïdisation, le cycle cellulaire se caractérise par une succession de phase G1,
S, G2 et d’une phase M incomplète; après celle-ci, les MKs rentrent à nouveau en G1,
réinitient un cycle cellulaire et dupliquent ainsi leur contenu en ADN (Lordier et al., 2008)
8.2/ Maturation cytoplasmique
Au cours de la différenciation, le développement d’un système complexe de membranes
appelé système de démarcation membranaire, et de différents types de granules incluant des
lysosomes, des granules denses et des granules-! sont observés dans le cytoplasme des
mégacaryocytes (Figure 20). Ces derniers sont spécialisés dans la secrétion de nombreuses
protéines. Les protéines PF4 et VWF sont détectées précocément, au stade 2N, dans l’appareil
de Golgi et le réticulum endoplasmique des cellules exprimant le CD41 (GPIIB/IIIA) et le
CD42 (GPIB) ; leur expression augmente au cours de la différenciation. Ces protéines sont
ensuite localisées dans les granules-! qui contiennent des inhibiteurs et des activateurs de
l’angiogénèse (Bluteau et al., 2009) et les granules denses riches en molécules comme la
sérotonine, les catécholamines, l’adénosine et le calcium. Les corps multivésiculaires
correspondraient à un stade de développement commun aux granules denses et aux granules-!
(Italiano et al., 2008).
72
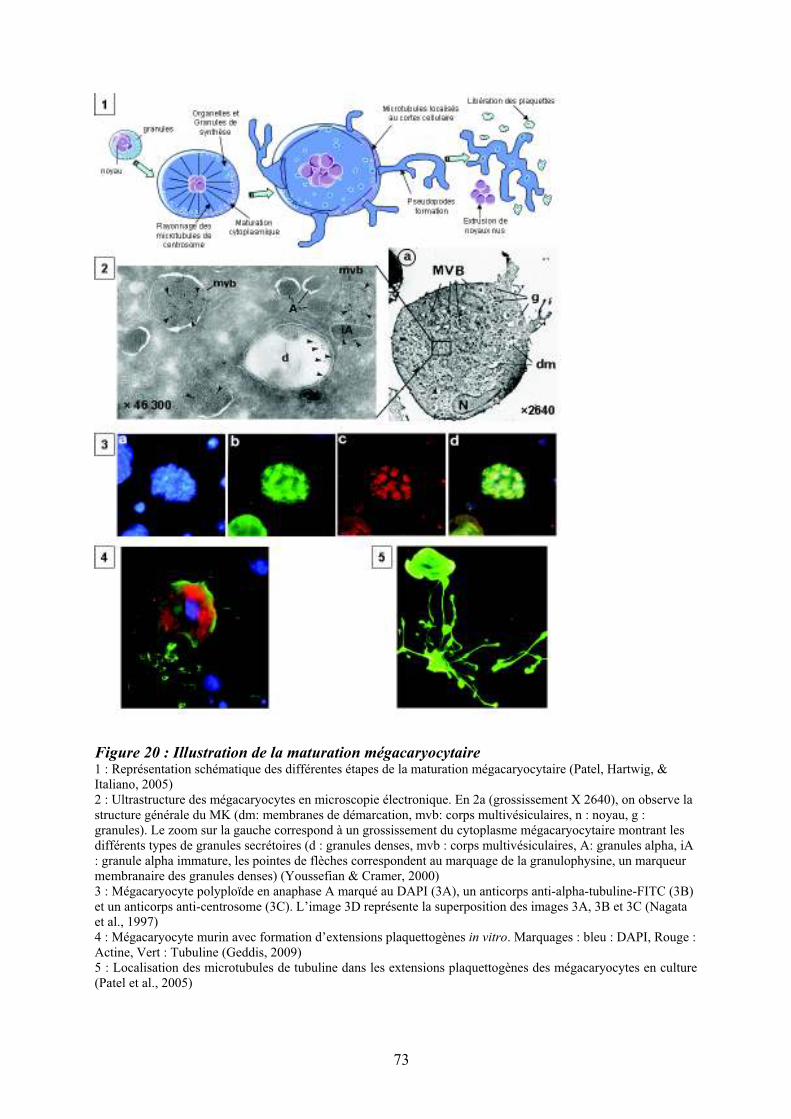
Figure 20 : Illustration de la maturation mégacaryocytaire 1 : Représentation schématique des différentes étapes de la maturation mégacaryocytaire (Patel, Hartwig, & Italiano, 2005) 2 : Ultrastructure des mégacaryocytes en microscopie électronique. En 2a (grossissement X 2640), on observe la structure générale du MK (dm: membranes de démarcation, mvb: corps multivésiculaires, n : noyau, g : granules). Le zoom sur la gauche correspond à un grossissement du cytoplasme mégacaryocytaire montrant les différents types de granules secrétoires (d : granules denses, mvb : corps multivésiculaires, A: granules alpha, iA : granule alpha immature, les pointes de flèches correspondent au marquage de la granulophysine, un marqueur membranaire des granules denses) (Youssefian & Cramer, 2000) 3 : Mégacaryocyte polyploïde en anaphase A marqué au DAPI (3A), un anticorps anti-alpha-tubuline-FITC (3B) et un anticorps anti-centrosome (3C). L’image 3D représente la superposition des images 3A, 3B et 3C (Nagata et al., 1997) 4 : Mégacaryocyte murin avec formation d’extensions plaquettogènes in vitro. Marquages : bleu : DAPI, Rouge : Actine, Vert : Tubuline (Geddis, 2009) 5 : Localisation des microtubules de tubuline dans les extensions plaquettogènes des mégacaryocytes en culture (Patel et al., 2005)
73

Figure 21 : Régulation de la mégacaryopoïèse par les cytokines, les chimiokines et les
facteurs de transcription. Représentation schématique de la mégacaryopoïèse (CSH : cellule souche hématopoïétique, CFU-GEMM : « colony forming unit » mixte, BFU-EM : « burst forming unit » érythro-mégacaryocytaire, CFU-EM : « colony forming unit » érythro-mégacaryocytaire, CFU-Meg : « colony forming unit » mégacaryocytaire). Les cytokines et les chimiokines qui influencent ce processus sont schématisées sur la droite par les flèches vertes et les facteurs de transcription par les flèches violettes sur la gauche (Vitrat, Cohen-Solal, Norol et al., 1998) (Geddis, 2010).
74

La libération des plaquettes semble être liée à un processus apoptotique augmentant en
fin de différenciation. En effet, une activation des caspases serait impliquée dans la formation
des MK pro-plaquettogènes et la surexpresion de Bcl-XL conduirait à une altération de la
fragmentation plaquettaire (Kaluzhny et al., 2002). En fin de maturation, les mégacaryocytes
forment des longues extensions cytoplasmiques appelées extensions proplaquettaires (Patel et
al., 2005) à l’origine des futures plaquettes. Les principaux acteurs impliqués dans la
libération des plaquettes sont le système de démarcation membranaire (DMS) (Schulze et al.,
2006), les microtubules et les filaments d’actine (Junt et al., 2007).
75

8.3/ Régulation moléculaire de la mégacaryopïèse
Comme nous l’avons précisé dans un chapître précédent, la mégacaryopoïèse est
régulée par de nombreux facteurs de transcription dont l’identification progresse toujours et
qui président à l’expression de gènes souvent spécifiques de cette lignée (Goldfarb, 2007).
Parmi ces derniers, citons trois acteurs principaux tels que GATA-1, FLI-1 et NF-E2 (Figure
21). GATA-1 joue un rôle majeur dans les étapes précoces de la mégacaryopoièse en agissant
sur le programme transcriptionnel mégacaryocytaire comprenant les gènes : GPIIb, PF4,
GPIb!, "-TG, GPIX ou GPV (Ravid, Beeler, Rabin, Ruley, & Rosenberg, 1991) (Martin,
Prandini, Thevenon, Marguerie, & Uzan, 1993). L’un des co-facteurs les plus importants de
GATA-1 est FOG-1 (« Friend Of GATA ») (Tsang et al., 1997). Son rôle a été en particulier
souligné dans la thrombocytopénie humaine congénitale liée au chromosome X au cours de
laquelle il est observé dans les macroplaquettes. Dans cette maladie, des mutations du gène
GATA-1 modifient sa liaison à FOG-1 conduisant à une altération de la mégacaryopoïèse.
Parmi les facteurs de transcription de la famille ETS, FLI-1 coopère également avec GATA-1
au cours de la différentiation mégacaryocytaire ; il est impliqué, via un mécanisme
d’haploinsuffisance, dans la thrombocytopénie de Paris-Trousseau. Enfin, NF-E2 contrôle
l’expression de la tubuline b1 au niveau transcriptionnel et participe ainsi à la formation des
proplaquettes et à leur libération.
L’état de condensation de la chromatine via les histones deacéthylases intervient dans
l’accessibilité des facteurs de transcription aux régions promotrices sur l’ADN et donc dans la
régulation transcriptionelle de la mégacaryopoièse. En effet, chez le rat, l’injection journalière
d’un inhibiteur des HDAC (FR235225) entraîne une répression transcriptionnelle de GATA-1
associée à une thrombopénie. Les inhibiteurs de HDAC hyperacétylent GATA-1, modifiant
ainsi ses différentes propriétés : affinité de liaison à l’ADN, activité transcriptionnelle,
stabilité protéique et interactions protéine-protéine (Matsuoka et al., 2007).
Parmi les facteurs de croissance impliqués dans la régulation de la mégacaryopoièse, la
thrombopoiétine (TPO) et son récepteur (Mpl) joue un rôle majeur. L’invalidation de Mpl et
de la Tpo chez la souris laisse apparaître que la Tpo est le seul ligand de Mpl (Alexander,
1999) (Gainsford et al., 2000) (Carver-Moore et al., 1996). La Tpo est active à tous les
niveaux de la mégacaryopoièse, de la prolifération et de la différenciation des progéniteurs
jusqu’à la production de plaquettes (Cohen-Solal, Debili, Vainchenker, & Wendling, 1997).
76
Elle favorise également la survie, l'auto-renouvellement et l'expansion des CSH, assurant ainsi
une reconstitution à long terme de l'hématopoïèse de souris irradiées (Yoshida et al., 1997)
(Seita et al., 2007) (Rongvaux et al., 2011). Dans la CSH, la Tpo est capable d’induire
l’expression de HOXB4 d’une manière p38 dépendante (Kirito, Fox, & Kaushansky, 2003).
Il est aussi reconnu que Mpl est exprimé sur les populations primitives de CSH
humaines comme les CD34+CD38- et que ces cellules exprimant c-mpl ont un potenciel de
greffe important chez la souris immuno-déprimée (Solar et al., 1998). De plus, les souris
invalidées pour Mpl présentent un déficit en cellules souches hématopoïétiques (Kimura,
Roberts, Metcalf, & Alexander, 1998). Plusieurs études récentes suggèrent également que les
MAPKs pourraient participer aux effets de la TPO sur les CSH et que la durée, l'intensité et la
localisation du signal ERK varient d'un contexte cellulaire et d'un stimulus à l'autre (Garcia,
de Gunzburg, Eychene, Gisselbrecht, & Porteu, 2001).
La Tpo, principalement exprimée dans le foie et les reins, est également produite par les
cellules stromales de la moelle osseuse. C’est une molécule de 70 kDa comprenant 2 régions.
La région N-terminale, qui présente une homologie marquée avec l’érythropoïétine, comprend
4 hélices alpha. Cette région englobe le domaine de liaison au récepteur et est suffisante à
l’activité biologique du ligand. La région C-terminale est fortement glycosylée et participe à
la secrétion de la molécule. Comme les autres récepteurs aux cytokines, Mpl possède une
seule région trans-membranaire. Seule la forme N-glycosylée de Mpl est exprimée sur la
membrane cytoplasmique. Cette glycosylation est altérée dans des pathologies
hématologiques comme dans la Polycythemia vera (PV) où une diminution de la
glycosylation semble jouer un rôle dans la pathogenèse de la maladie (Moliterno, Hankins, &
Spivak, 1998). L’interaction directe des mégacaryocytes avec ces cellules module la
formation de proplaquettes (Drachman, Rojnuckarin, & Kaushansky, 1999), suggèrant le role
des interactions cellulaires avec les cellules stromales dans la différenciation et maturation
mégacaryocytaire.
77

La Figure 22 schématise les principales voies de signalisation mises en œuvre lors de
l’activation de Mpl par son ligand : la voie des STAT, celle de PI3K/AKT/mTOR, la cascade
des MAPK par Erk1/2, plus indirectement, la voie NF-$B (Drachman et al., 1999) (Y. Zhang
et al., 2002). L’activation soutenue et à long terme de la cascade des MAPK ERK est
indispensable à l'induction de la différenciation mégacaryocytaire par la Tpo. La Tpo active
Ras (Matsumura et al., 1998) puis Erk1/2 au cours de la mégacaryopoïèse et agit ainsi sur le
processus de ploïdisation (Rojnuckarin, Drachman, & Kaushansky, 1999). Des anomalies de
la voie d’activation des MAP kinases au cours des cancers et leucémies souligne l’importance
de cette voie et suggère son rôle potentiel dans le processus pathogénique. Nous détaillerons
les principales molécules de la voie de signalisation des MAPK dans un chapitre ultérieur
(Chapitre § 10).
78
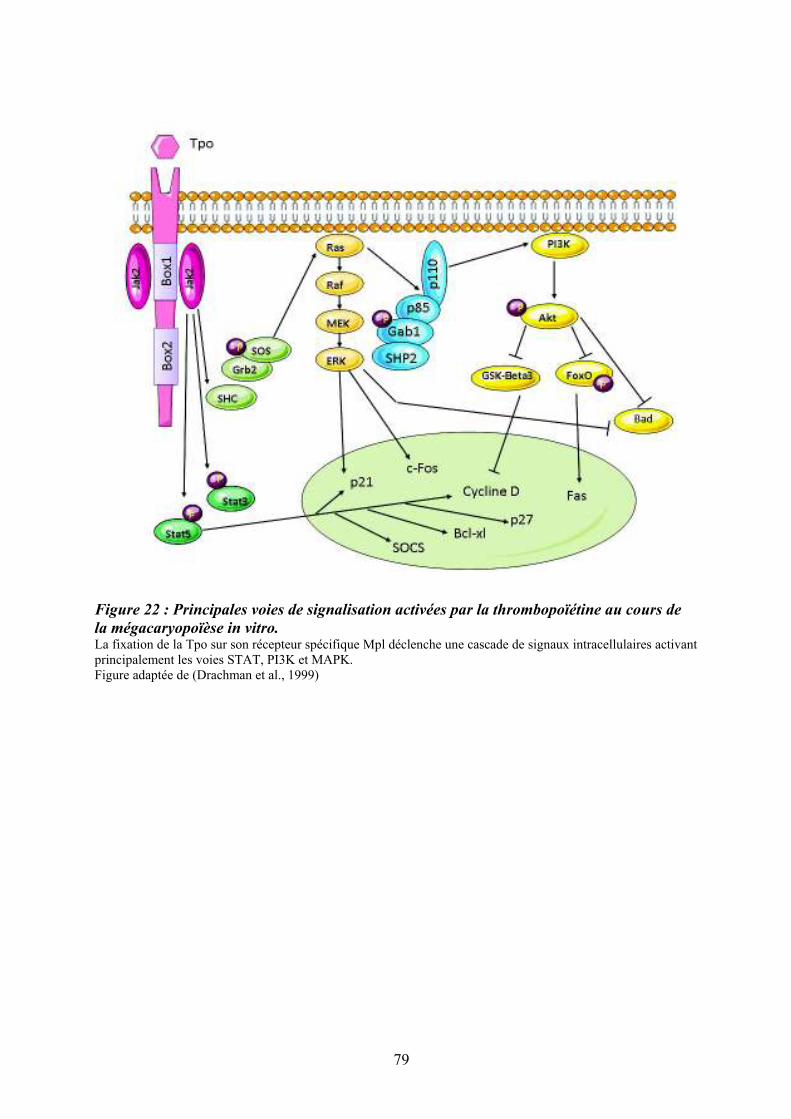
Figure 22 : Principales voies de signalisation activées par la thrombopoïétine au cours de
la mégacaryopoïèse in vitro. La fixation de la Tpo sur son récepteur spécifique Mpl déclenche une cascade de signaux intracellulaires activant principalement les voies STAT, PI3K et MAPK. Figure adaptée de (Drachman et al., 1999)
79
9/ Le couple Flt3 ligand/Flt3 La cytokine Flt3-ligand (fms-like tyrosine kinase 3 ligand ou FL) est une cytokine
pléiotrope à action précoce : elle intervient dans la survie et la prolifération des cellules
souches hématopoïétiques, la migration cellulaire et la réponse immunitaire, notamment en
interaction avec les cellules dendritiques. Au regard de la production ubiquitaire de FL,
l’expression de son récepteur Flk2/Flt3 est restreinte aux cellules hématopoïétiques et
lymphoïdes immatures (Rappold et al., 1997) chez la souris (Matthews, Jordan, Wiegand,
Pardoll, & Lemischka, 1991) comme chez l’homme (Rosnet et al., 1993).
9.1/ Le récepteur Flt3
A la suite du clonage murin de la molécule par deux groupes différents, le récepteur a
été appelé Flt3 pour « FMS-like tyrosine kinase 3 », ou Flk2 pour « fetal liver kinase 2 ».
Chez l’homme, le récepteur a aussi été appelé STK1 pour « Stem cell tyrosine kinase 1 » ou
CD135. Communément, le récepteur est actuellement nommé Flt3. Il appartient à une famille
de récepteurs à activité tyrosine kinase RTK III comprenant également FMS, c-kit et
PDGFR! et ". Le gène FLT3, localisé en 13q12-13 chez l’homme (Carow et al., 1995),
comporte 24 exons répartis sur 96 kb. Le récepteur Flt3 humain, composé de 993 acides
aminés, existe sous une forme faiblement glycosylée immature de 130-140 kD, et une forme
fortement glycosylée de 155-160 kD exprimée à la membrane plasmique (Drachman et al.,
1999). La Figure (23) illustre la structure du récepteur Flt3 et montre certaines des mutations
retrouvées dans plusieurs hémopathies humaines. La partie extra-cellulaire du récepteur
comporte cinq domaines « immunoglobulin-like », avec les trois domaines distaux impliqués
dans le site de liaison au Flt3 ligand et les deux domaines proximaux impliqués dans la
dimérisation du récepteur. Une partie transmembranaire et deux domaines tyrosine kinase
séparés par un domaine interkinase sont également décrits (Rosnet, Mattei, Marchetto, &
Birnbaum, 1991) (Dosil, Wang, & Lemischka, 1993). La partie intracytoplasmique de la
molécule comporte 23 résidus tyrosine.
80

Figure 23 : Structure du récepteur Flt3 La localisation des principales mutations impliquées en pathologie humaine est indiquée par des flèches (ITD mutations : « internal tandem duplication » ; KD mutations : mutation du domaine kinase et principalement de l’acide aspartique en position 835) (Rappold et al., 1997) KI : Kinase Insert
81
9.1.1/ Souris déficientes pour le gène codant pour le récepteur Flt3
Les souris déficientes pour le gène codant pour le récepteur Flt3 (Flt3-/-) présentent des
anomalies de l’hématopoïèse telles qu’une diminution des précurseurs lymphoïdes B
médullaires mais sans altération du nombre de lymphocytes B périphériques. Les cellules
Flt3-/- ne reconstituent pas l’hématopoièse à long terme de souris sauvages irradiées, ce qui
suggère l’importance du récepteur Flt3 dans la régulation de l’hématopoïèse primitive et des
CSH (Mackarehtschian et al., 1995).
9.1.2/ Expression du récepteur Flt3 chez l’homme
L’expression de Flt3 est restreinte aux tissus hématopoïétiques : l’ARNm est présent
dans les organes hématopoïétiques et lymphoïdes chez l’adulte comme chez le fœtus,
notamment au niveau de la rate et des ganglions (Lyman et al., 1993). Contrairement à la
souris, chez l’homme, l’expression de Flt3 est restreinte à un faible pourcentage de cellules
hématopoïétiques primitives exprimant également c-Kit (A. M. Turner, Lin, Issarachai,
Lyman, & Broudy, 1996). Flt3 est également exprimé dans les cellules du compartiment des
progéniteurs myéloïdes et lymphoïde B, avec une expression maximale sur les CFU-GM et
les progéniteurs pré-B. Au niveau du compartiment des précurseurs, l’expression de Flt3 est
maintenue tout au long de la différenciation monocytaire (Rosnet et al., 1993).
9.1.3/ La signalisation induite par Flt3 en réponse au Flt3-ligand
La cytokine Flt3-ligand étant produite de façon ubiquitaire dans l’organisme, c’est
l’expression restreinte de son récepteur qui gouverne son spectre d’activité. La liaison du
ligand à son récepteur conduit à la dimérisation de celui-ci, la juxtaposition des domaines
intracytoplasmiques rend alors possible la transphosphorylation des domaines cytoplasmiques
sur les résidus tyrosines du dimère. Cette phosphorylation constitue un évènement crucial
initiant l’activité kinase intrinsèque du récepteur. Les résidus tyrosines activés de Flt3 se lient
ensuite aux domaines SH2 de protéines cytoplasmiques cibles telles que p85, GRB2, p115
(CBL), p52 (SHC) dont la phosphorylation est impliquée dans la transduction du signal
(Lavagna-Sevenier, Marchetto, Birnbaum, & Rosnet, 1998). Le signal est alors transmis soit
par la voie des inositol phosphates 3’ kinases (PI3K), soit par d’autres voies PI3K
indépendantes (Rosnet et al., 1996). La Figure 24 représente les principales voies de
signalisation activées en aval du récepteur Flt3.
82

Figure 24 : Principales voies de signalisation activées par la liaison de Flt3 ligand (FL) à
son récepteur Flt3
SKF : Src kinase famille. d’après (Masson & Ronnstrand, 2009)
83

9.1.4/ Rôle de Flt3 dans les leucémies
Une possible implication du couple Flt3-ligand/Flt3 dans la pathogenie de certaines
leucémies repose sur plusieurs arguments. Le récepteur Flt3 est fréquemment surexprimé en
ARN et en protéine dans les leucémies de type B et les leucémies aiguës myéloïdes (Carow et
al., 1996); la surexpression de son ligand induit une boucle d’autocrine/paracrinie contribuant
à l’activation du récepteur Flt3 (Small, 2006). La structure du gène FLT3 peut être également
modifiée par l’insertion de régions dupliquées en tandem dans la partie correspondant au
domaine juxtamembranaire (FLT3-« internal tandem duplication » (ITD)) ; celles-ci sont
retrouvées dans 30% des leucémies aiguës myéloïdes. On peut également observer des
mutations ponctuelles, telles que la mutation « Asp835 » chez 3 à 8% des patients (Figure 23).
L’anomalie FLT3-ITD est également retrouvée dans les syndromes myélodysplasiques avec
une fréquence inférieure à 5% (Yokota et al., 1997). Chez la souris, la transformation de
cellules hématopoïétiques par FLT3-ITD provoque un néoplasme myéloprolifératif
oligoclonal caractérisé par une hématopoïèse extra-médullaire, une splénomégalie et une
hyperleucocytose (Kelly et al., 2002). Ces différents types de mutations conduisent à
l’activation constitutive du récepteur (Zheng et al., 2004) et sont corrélées à un pronostic
péjoratif.
Bien que l’intensification des thérapies basées sur l’utilisation de cytarabine semble
apporter des résultats intéressants, des inhibiteurs chimiques des kinases du récepteur Flt3 ont
été récemment développés sans pour autant être très spécifiques. Parmi ceux-ci, citons : le
SU11248 dérivé de la molécule SU5416 (Sugen) qui inhibe également les récepteurs au
PDGF alpha et beta, ainsi que les VEGFR1, VEGFR2 et le c-Kit (John, Thomas, Mufti, &
Padua, 2004) (O'Farrell et al., 2003).
9.2/ Le Flt3-ligand (FL)
Le Flt3-ligand a été cloné en 1993-1994 par deux groupes distincts. C’est un
homodimère qui peut exister sous forme soluble et membranaire. Ces différentes formes
résultent d’un épissage alternatif et/ou d’un clivage protéolytique (Hannum et al., 1994)
(Lyman et al., 1993). La forme membranaire et la forme soluble sont toutes les deux
biologiquement actives et capables d’activer son récepteur spécifique (Lyman et al., 1995). La
forme soluble du Flt3-ligand a été purifiée et séquencée en 1994 à partir du milieu
conditionné de cellules stromales thymiques (Lyman et al., 1994). Bien que l’expression de
l’ARN messager du Flt3-ligand soit ubiquitaire, l’expression de la protéine est limitée aux
84

cellules stromales et lymphoïdes de la moelle osseuse (Lyman & Jacobsen, 1998). Plus
récemment, il a été montré que le Flt3-ligand est également produit par les cellules
endothéliales (Solanilla, Grosset et al., 2000). La production de Flt3-ligand est constitutive
mais elle peut également être induite par différents facteurs tels que le TGF-" et l’IFN-alpha
(Solanilla, Grosset et al., 2000) ou le ligand du CD40 (le CD154) (Solanilla, Dechanet et al.,
2000).
Le taux plasmatique de Flt3-ligand est faible chez les sujets sains mais il peut être
élevé dans certaines maladies hématologiques comme l’anémie de Fanconi et l’anémie
aplasique acquise où une déficience en CSH/PH est observée (Wodnar-Filipowicz et al.,
1996). Dans ces pathologies, il a été proposé que l’élévation du taux de Flt3-ligand
permettrait de compenser cette déficience (Lyman et al., 1995).
Flt3-ligand agit essentiellement en stimulant la prolifération des cellules
hématopoïétiques immatures des lignées myéloïdes (Lyman et al., 1993) (Hannum et al.,
1994) (Lyman et al., 1994) et lymphoïdes (Hunte, Hudak, Campbell, Xu, & Rennick, 1996)
(Ray, Paige, Furlonger, Lyman, & Rottapel, 1996) (Bertho et al., 2000) et ceci en synergie
avec d’autres cytokines comme le SCF et l’IL-7, par exemple. Il est intéressant de noter que le
Flt3-ligand et le SCF sont tous deux ligands de récepteurs à tyrosine kinase de classe III et
existent sous forme soluble et membranaire (Flt3-ligand) ou liée à la matrice (SCF). Flt3-
ligand et SCF exercent également des actions similaires sur les CSH/PH mais, à la différence
de SCF, le Flt3-ligand n’a pas d’activité biologique sur les cellules mastocytaires (Lyman et
al., 1995). De même, en synergie avec la thrombopoiétine, le Flt3-ligand ralentit la maturation
des mégacaryocytes en augmentant la prolifération des progéniteurs MK et en diminuant leur
apoptose via une augmentation de Bcl-2 et un changement conformationnel de p53 (Lyman et
al., 1995).
Comme nous le verrons ci-dessous, l’importance du Flt3-ligand dans la prolifération
des cellules hématopoïétiques immatures et dans la différenciation de certaines lignées
cellulaires a été confirmée chez les souris déficientes pour le gène FLT3LG.
9.2.1/ Souris déficientes pour le gène codant pour le Flt3-ligand
Les souris FLT3LG-/- présentent un nombre réduit de leucocytes dans la moelle
osseuse, le sang périphérique, les ganglions lymphatiques et la rate sans modification de
l’hématocrite ni du nombre de plaquettes. La diminution significative du nombre des
progéniteurs myéloïdes et lymphoïdes B dans la moelle osseuse, de cellules NK dans la rate
ainsi que de cellules dentritiques dans la rate, les ganglions lymphatiques et le thymus,
85
suggére que le Flt3-ligand intervient dans l’expansion des progéniteurs primitifs et la
génération des leucocytes matures. De façon intéressante, les anomalies de l’hématopoièse
observées chez les souris déficientes pour FLT3LG sont plus intenses que celles observées
chez les souris FLT3-/-, suggèrant une action complexe et vraisemblablement de type
synergique de la cytokine sur la régulation de l’hématopoïèse (Sigurjonsson, Gudmundsson,
Haraldsdottir, Rafnar, & Gudmundsson, 2002).
9.2.2/ Activité biologique du Flt3-ligand in vivo et rôle dans la niche hématopoïétique
L’administration de Flt3-ligand à la souris, entraîne une expansion des progéniteurs
hématopoïétiques dans la moelle osseuse et la rate ainsi qu’une mobilisation des cellules
souches et des progéniteurs hématopoïétiques dans le sang périphérique et la rate
(augmentation de près de 500 fois du nombre de CFU-GEMM et CFU-GM dans le sang 10
jours après le début du traitement) (Brasel et al., 1996). La mobilisation par le Flt3-ligand
concerne également des cellules avec un potentiel de reconstitution à long terme et de
différenciation « multilignée », démontrant leur nature de cellules souches (Brasel et al.,
1997). De même, comme nous l’avons précisé dans un chapitre précedent, une mobilisation
des progéniteurs hématopoïétiques dans la circulation peut être obtenue après traitement (5 à 7
jours) par Flt3-ligand, seul ou en association avec du G-CSF ou du GM-CSF, chez la souris
comme chez l’homme (Brasel et al., 1996) (Papayannopoulou, Nakamoto, Andrews, Lyman,
& Lee, 1997).
Comme le SCF, le Flt3-ligand est exprimé de façon transmembranaire et peut être
clivé par un processus protéolytique, au sein des niches médullaires. Le clivage de Flt3-ligand
est dépendant de l’action de métalloprotéases. Cette activité protéolytique est abolie dans les
fibroblastes dans lesquels le gène de la métalloprotéase TNF-! Converting Enzyme (TACE)
est délété et peut être restituée en réintroduisant TACE, démontrant le rôle du clivage
protéolytique dans l’activation de Flt3-ligand. Ainsi libéré dans le microenvironnement, le
Flt3-ligand peut alors agir sur les CSH (Horiuchi et al., 2009) (Figure 25). A ce titre, il est
intéressant de noter que le Flt3-ligand est capable de fixer les CSH/PH au sein de la moelle
via un mécanisme VLA-4 et -5-dépendant (Solanilla et al., 2003).
L’ensemble de ces résultats suggèrent que le couple Flt3-ligand/Flt3 participe, comme
d’autres récepteurs tels que c-Kit ou CXCR4, au nichage des CSH au sein des niches
médullaires et qu'une altération des interactions adhésives induite par leurs ligands est en
partie responsable de la mobilisation des progéniteurs hors de la moelle osseuse.
86

Figure 25 : Rôle du Flt3-ligand dans les interactions CSH-microenvironnement au sein de
la moelle osseuse D’après (Wodnar-Filipowicz et al., 1996). La protéine du Flt3-ligand existe sous deux formes dans la moelle osseuse : une forme ancrée dans la membrane (mb-FL) des cellules stromales et une forme secrétée dans le microenvironnement (s-FL). Les deux formes sont actives. La forme mb-FL peut être clivée par la protéine TACE (TNF-! Converting Enzyme) (Horiuchi et al., 2009)
87

10/ La voie des « mitogen-activated protein » kinases
Les « Mitogen-Activated Protein » Kinases (MAPK) sont des sérine/thréonine kinases
très conservées au cours de l’évolution. Elles sont présentes dans tous les types cellulaires et
leurs activités diffèrent d’un type cellulaire à l’autre en réponse à des stimuli spécifiques. Ce
sont des relais intracellulaires entre les récepteurs de surface et leurs cibles régulatrices qui
sont majoritairement des facteurs de transcription. Les différentes voies des MAPKs
participent à des fonctions importantes dans la cellule telles que : la prolifération, la
différenciation, l’apoptose…etc. L’expérience de l’utilisation de souris déficientes pour les
divers isoformes des MAPKs a révélé des phénotypes bien particuliers pour chacun d’entre
eux comme en témoigne le tableau (4) (Aouadi, Binetruy, Caron, Le Marchand-Brustel, &
Bost, 2006) et le travail du groupe (Gaudry M. et Porteu F.) sur les souris ERK1-/- (Guihard
et al., 2010).
Les MAP Kinases peuvent induire des réponses cellulaires spécifiques telles que : la
prolifération, l’apoptose, la survie, la migration et la régulation transcriptionnelle en
intéragissant avec de nombreux stimuli (cytokines, facteurs de croissance, antigènes, toxines,
médicaments, stress, changement de température, irradiation, changement de conformation
cellulaire, interactions avec la matrice extracellulaire, interactions cellule-cellule…).
À ce jour, six groupes distincts de MAPK ont été identifiés dans les cellules de
mammifères : 1) les ERK 1 et 2 (Extracellular signal-Regulated Kinase), 2) les JNK 1, 2 et 3
(c-Jun aminoterminal Kinase), 3) la p38 et ses isoformes !, ", # et %, 4) les ERK 3 et 4, 5)
ERK 5 et 6) ERK 7/8. Chaque groupe de MAPK est activé par une cascade de
phosphorylation qui lui est propre suivant une organisation qui est conservée. Ainsi, les
MAPK sont activées et phosphorylées par les MAPKK qui sont elles-mêmes phosphorylées
par les MAPKKK (Dhanasekaran & Johnson, 2007) (Chang & Karin, 2001) (Tableau 5).
88
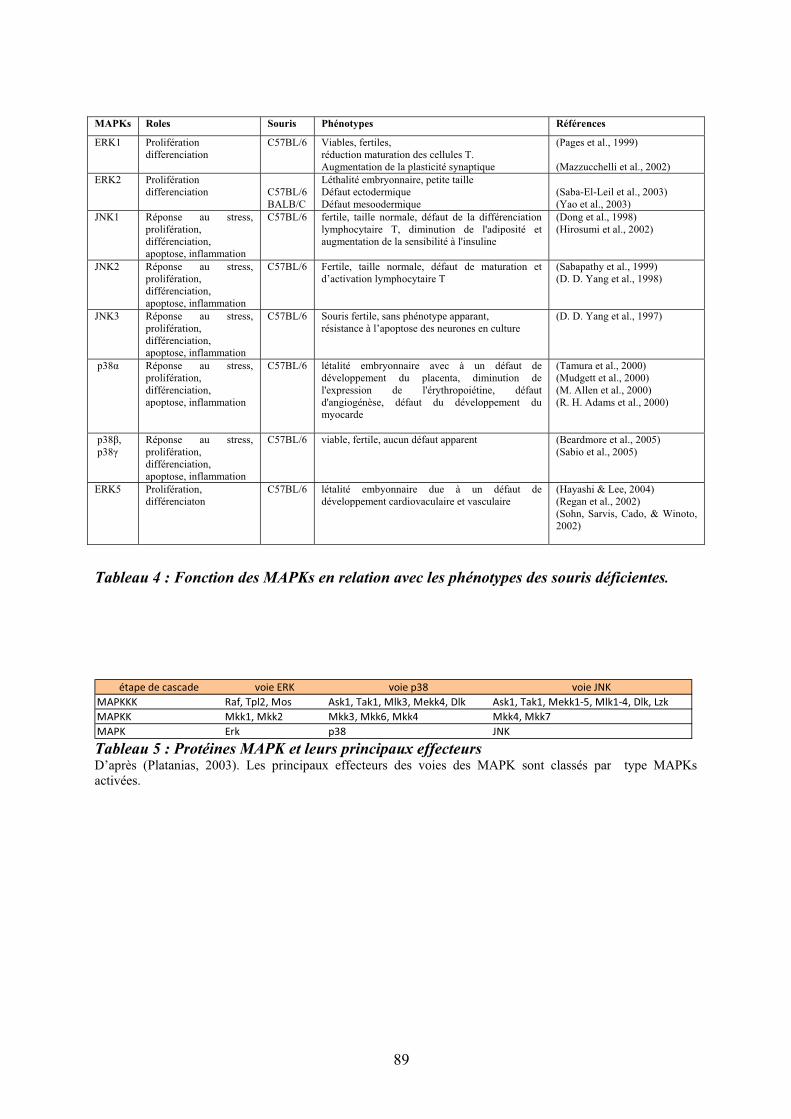
MAPKs Roles Souris Phénotypes Références
ERK1 Prolifération differenciation
C57BL/6 Viables, fertiles, réduction maturation des cellules T. Augmentation de la plasticité synaptique
(Pages et al., 1999) (Mazzucchelli et al., 2002)
ERK2 Prolifération differenciation
C57BL/6 BALB/C
Léthalité embryonnaire, petite taille Défaut ectodermique Défaut mesoodermique
(Saba-El-Leil et al., 2003) (Yao et al., 2003)
JNK1 Réponse au stress, prolifération, différenciation, apoptose, inflammation
C57BL/6 fertile, taille normale, défaut de la différenciation lymphocytaire T, diminution de l'adiposité et augmentation de la sensibilité à l'insuline
(Dong et al., 1998) (Hirosumi et al., 2002)
JNK2 Réponse au stress, prolifération, différenciation, apoptose, inflammation
C57BL/6
Fertile, taille normale, défaut de maturation et d’activation lymphocytaire T
(Sabapathy et al., 1999) (D. D. Yang et al., 1998)
JNK3 Réponse au stress, prolifération, différenciation, apoptose, inflammation
C57BL/6
Souris fertile, sans phénotype apparant, résistance à l’apoptose des neurones en culture
(D. D. Yang et al., 1997)
p38! Réponse au stress, prolifération, différenciation, apoptose, inflammation
C57BL/6 létalité embryonnaire avec à un défaut de développement du placenta, diminution de l'expression de l'érythropoiétine, défaut d'angiogénèse, défaut du développement du myocarde
(Tamura et al., 2000) (Mudgett et al., 2000) (M. Allen et al., 2000) (R. H. Adams et al., 2000)
p38", p38#
Réponse au stress, prolifération, différenciation, apoptose, inflammation
C57BL/6 viable, fertile, aucun défaut apparent
(Beardmore et al., 2005) (Sabio et al., 2005)
ERK5 Prolifération, différenciaton
C57BL/6 létalité embyonnaire due à un défaut de développement cardiovaculaire et vasculaire
(Hayashi & Lee, 2004) (Regan et al., 2002) (Sohn, Sarvis, Cado, & Winoto, 2002)
Tableau 4 : Fonction des MAPKs en relation avec les phénotypes des souris déficientes.
étape"de"cascade voie"ERK voie"p38 voie"JNK
MAPKKK Raf,"Tpl2,"Mos Ask1,"Tak1,"Mlk3,"Mekk4,"Dlk Ask1,"Tak1,"Mekk1!5,"Mlk1!4,"Dlk,"Lzk
MAPKK Mkk1,"Mkk2 Mkk3,"Mkk6,"Mkk4 Mkk4,"Mkk7
MAPK Erk p38 JNK Tableau 5 : Protéines MAPK et leurs principaux effecteursD’après (Platanias, 2003). Les principaux effecteurs des voies des MAPK sont classés par type MAPKs activées.
89
Les MAPKKK sont le plus souvent activées par phosphorylation mais également par
interaction avec les GTPases des familles Ras ou Rho, en réponse à des signaux
extracellulaires. Leur activation conduit à la phosphorylation et à l’activation des MAPKK
qui, par la suite, stimulent l’activité MAPK à travers une double phosphorylation sur un
résidu thréonine et tyrosine situé dans la boucle d’activation de la kinase. Ainsi activées, les
MAPK catalysent la phosphorylation d’une série de substrats sur des résidus sérine ou
tyrosine. Les protéines de la cascade des MAPK interagissent également avec des protéines de
cascades de signalisation, apportant un niveau supplémentaire de spécificité. Les MAP
kinases exercent leur fonction par phosphorylation de divers substrats tels que
phospholipases, facteurs de transcription, protéines du cytosquelette… Elles catalysent aussi
la phosphorylation et l’activation de différentes protéines kinases appelées « MAPK activated
protein kinase », ajoutant un échelon supplémentaire dans l’amplification de la réponse
cellulaire aux facteurs de croissance et au stress (Chang & Karin, 2001) (Schaeffer & Weber,
1999) (Figure 26).
Alors que l’activation des MAPKKs et des MAPKKKs se fait par phosphorylation,
l’inhibition ou la modulation de leur fonction se fait par déphosphorylation via l’action de
phosphatases. La régulation de la déphosphorylation des MAPKs joue un rôle important dans
l’intensité et la durée de l’activation des kinases. Chez les mammifères, ceci est
principalement régit par la famille des « Dual-specificity MAPK phosphatases » (DUSP)
comprenant 10 membres (Keyse, 2000). Les DUSP ont des niveaux de spécificité pour leurs
différents substrats suivant les membres de cette famille. En effet, DUSP6 a un rôle
inactivateur préférentiel pour Erk1/2 (Groom, Sneddon, Alessi, Dowd, & Keyse, 1996) (Muda
et al., 1996). D’autre part, les DUSP 8, 10, 16 peuvent inactiver p38 et JNK mais n’agissent
pas sur ERK (Tanoue, Moriguchi, & Nishida, 1999) (Tanoue, Yamamoto, Maeda, & Nishida,
2001). D’autres phosphatases n’appartenant pas à la famille des DUSP sont importantes pour
la régulation des MAPKs, comme par exemple PP2A peut agir en inactivant ERK
(Letourneux, Rocher, & Porteu, 2006) ou bien la protéine phosphatase 1 (PP1) peut agir en
déphosphorylant p38 (Kitatani et al., 2006).
90
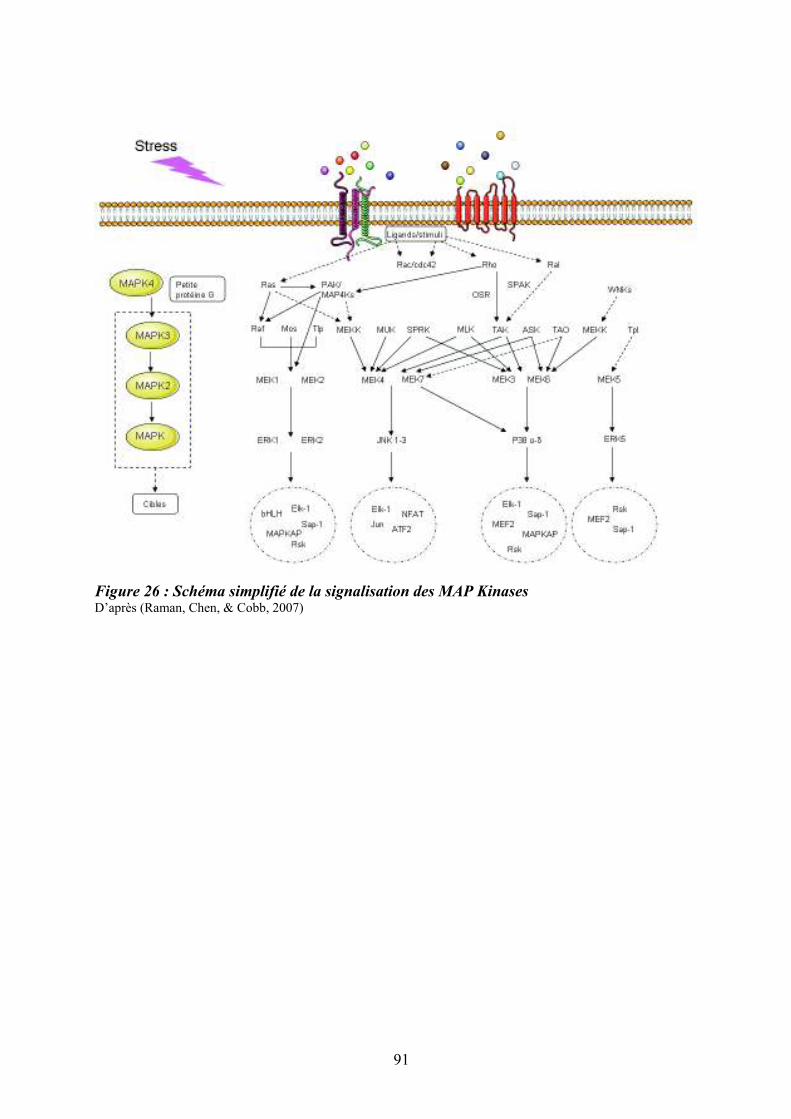
Figure 26 : Schéma simplifié de la signalisation des MAP Kinases D’après (Raman, Chen, & Cobb, 2007)
91
La voie MAPK de type ERK, activée en aval de Ras, est une des voies de
signalisation majeure relayant les fonctions des cytokines, des morphogènes et des molécules
d’adhésion. Les kinases ERK1-2 sont des acteurs clés de la régulation, de la prolifération, de
la différenciation et de la survie cellulaire. L’activation de la voie ERK est initiée par la
liaison d’un ligand à un récepteur membranaire comme les récepteurs à tyrosine kinase ou les
récepteurs couplés aux petites protéines G. Le récepteur activé recrute un certain nombre de
protéines telles que Shc, le complexe Grb2/SOS-1 et le facteur d’échange SOS-1 qui
permettent l’activation des GTPases Ras. Une fois les protéines Ras activées, elles recrutent à
la membrane plasmique, la protéine MAPKKK Raf effectrice. Chez les mammifères, la
famille Raf est constitué de trois membres : A-Raf, B-Raf et Raf-1 (ou C-Raf). Les protéines
Raf vont, à leur tour, activer leurs effecteurs MEK1/2 qui, eux-même, vont phosphoryler leurs
cibles uniques ERK1 et ERK2 qui vont alors activer leurs substrats cytoplasmiques et
nucléaires. MEK1 participe à la régulation de la localisation d’ERK1/2 dans la cellule en les
maintenant sous forme non phosphorylée dans le cytoplasme (Adachi, Fukuda, & Nishida,
2000). L’importation nucléaire d’ERK1/2 est régit par des mécanismes différents selon l’état
actif ou non des isoformes.
Les isoformes ERK1 et ERK2 sont ubiquitaires, elles partagent 83 % d’identité en
acides aminés et sont exprimés dans la totalité des tissus. Elles sont très fortement activées par
les facteurs de croissance, les esters de phorbol et, dans une moindre mesure, par les
récepteurs couplés aux protéines G (GPCR), les cytokines, le stress osmotique et la
désorganisation du cytosquelette microtubulaire (Yoon & Seger, 2006). En contribuant à la
progression du cycle cellulaire via les points de contrôle G1/S et G2/M, les kinases ERK
participent à la stimulation de la prolifération. Il a été récemment suggéré que le rôle des
ERK1/2 dans la prolifération était lié au seuil d’activation de la voie et non à la spécificité de
fonction des isoformes (Voisin, Saba-El-Leil, Julien, Fremin, & Meloche, 2010). Comme
nous le précisions ci-dessus, leur activation est généralement associée à la survie cellulaire
mais, dans certaines conditions, ERK1/2 peuvent intervenir dans l’apoptose. L’activation
d’ERK1/2 joue un rôle clé dans la différenciation des CSH vers la lignée granulomonocytaire
(Hsu, Kikuchi, & Kondo, 2007). Les travaux du groupe de F. Porteu ont également montré
l'importance de la voie ERK dans la transition prolifération/différenciation induite par la TPO
dans les cellules mégacaryocytaires (Rouyez, Boucheron, Gisselbrecht, Dusanter-Fourt, &
Porteu, 1997) (Fichelson et al., 1999) (Filippi et al., 2002). Enfin, dans les cellules ES et les
PH CD34+, l’intensité du signal ERK semble interférer dans l’équilibre entre
92
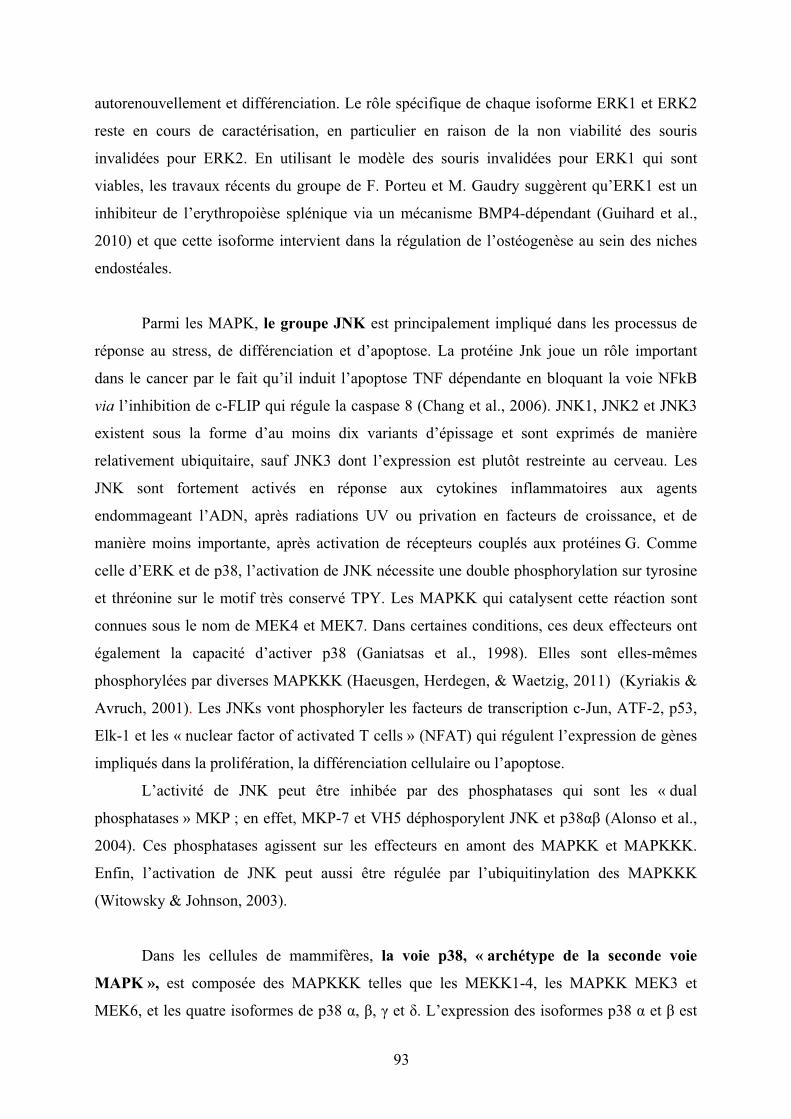
autorenouvellement et différenciation. Le rôle spécifique de chaque isoforme ERK1 et ERK2
reste en cours de caractérisation, en particulier en raison de la non viabilité des souris
invalidées pour ERK2. En utilisant le modèle des souris invalidées pour ERK1 qui sont
viables, les travaux récents du groupe de F. Porteu et M. Gaudry suggèrent qu’ERK1 est un
inhibiteur de l’erythropoièse splénique via un mécanisme BMP4-dépendant (Guihard et al.,
2010) et que cette isoforme intervient dans la régulation de l’ostéogenèse au sein des niches
endostéales.
Parmi les MAPK, le groupe JNK est principalement impliqué dans les processus de
réponse au stress, de différenciation et d’apoptose. La protéine Jnk joue un rôle important
dans le cancer par le fait qu’il induit l’apoptose TNF dépendante en bloquant la voie NFkB
via l’inhibition de c-FLIP qui régule la caspase 8 (Chang et al., 2006). JNK1, JNK2 et JNK3
existent sous la forme d’au moins dix variants d’épissage et sont exprimés de manière
relativement ubiquitaire, sauf JNK3 dont l’expression est plutôt restreinte au cerveau. Les
JNK sont fortement activés en réponse aux cytokines inflammatoires aux agents
endommageant l’ADN, après radiations UV ou privation en facteurs de croissance, et de
manière moins importante, après activation de récepteurs couplés aux protéines G. Comme
celle d’ERK et de p38, l’activation de JNK nécessite une double phosphorylation sur tyrosine
et thréonine sur le motif très conservé TPY. Les MAPKK qui catalysent cette réaction sont
connues sous le nom de MEK4 et MEK7. Dans certaines conditions, ces deux effecteurs ont
également la capacité d’activer p38 (Ganiatsas et al., 1998). Elles sont elles-mêmes
phosphorylées par diverses MAPKKK (Haeusgen, Herdegen, & Waetzig, 2011) (Kyriakis &
Avruch, 2001). Les JNKs vont phosphoryler les facteurs de transcription c-Jun, ATF-2, p53,
Elk-1 et les « nuclear factor of activated T cells » (NFAT) qui régulent l’expression de gènes
impliqués dans la prolifération, la différenciation cellulaire ou l’apoptose.
L’activité de JNK peut être inhibée par des phosphatases qui sont les « dual
phosphatases » MKP ; en effet, MKP-7 et VH5 déphosporylent JNK et p38!" (Alonso et al.,
2004). Ces phosphatases agissent sur les effecteurs en amont des MAPKK et MAPKKK.
Enfin, l’activation de JNK peut aussi être régulée par l’ubiquitinylation des MAPKKK
(Witowsky & Johnson, 2003).
Dans les cellules de mammifères, la voie p38, « archétype de la seconde voie
MAPK », est composée des MAPKKK telles que les MEKK1-4, les MAPKK MEK3 et
MEK6, et les quatre isoformes de p38 !, ", # et %. L’expression des isoformes p38 ! et " est
93

ubiquitaire, contrairement à celle des isoformes p38 # et % qui est restreinte à certains tissus. Il
est intéressant de souligner que l’isoforme p38# est activée par l’hypoxie d’une manière
calcium dépendante et qu’elle régule négativement l’expression de la cycline D1 (Conrad,
Millhorn, & Beitner-Johnson, 2000), suggérant un possible rôle de cette isoforme au sein de la
niche endostéale en réprimant la mise en cycle des CSH dans un contexte hypoxique et riche
en calcium. Les différentes isoformes sont fortement activées par les stress environnementaux
et les cytokines inflammatoires. La plupart des stimuli qui activent p38, activent également
JNK. L’activation de la MAPK p38 intervient dans de nombreuses et importantes fonctions
cellulaires telles que l’activation de facteurs de transcription, la production de cytokines, le
cycle cellulaire, la différenciation, la mobilité, l’apoptose et la mort cellulaire (Chang &
Karin, 2001) (Schaeffer & Weber, 1999). La protéine p38 qui régule principalement ses
effecteurs par phosphorylation et déphosphorylation, est aussi capable d’agir indirectement
par d’autres modifications telles que l’acétylation comme c’est le cas avec USF-1 (Corre et
al., 2009) et la protéolyse en agissant sur la « ring finger ubiquitin ligase » Siah2 qui contrôle
la stabilité de nombreux substrats impliqués dans le stress (Khurana et al., 2006) (figure 27).
p38 est principalement activée par ses effecteurs en amont (MEK3 et MEK6) qui sont
eux-mêmes activés par de multiples MAPKKKs incluant MEKK1-4, TAOs, TAK, et ASK.
Cependant, en absence de MEK3-6, p38 peut également être phosphorylée par MEK4
(Brancho et al., 2003). L’activation des isoformes de p38 se fait avec une certaine sélectivité.
En effet, alors que les isoformes !, #, % sont phosphorylés par MEK3 et MEK6, l’isoforme "
est préférentiellement activée par MEK6 (Enslen, Raingeaud, & Davis, 1998).
Certaines protéines de la voie de signalisation de JNK telles que JIP et JSAP,
participent également à la signalisation p38. Ainsi, en se liant à p38! et p38%, JIP2 augmente
la signalisation de p38 (Buchsbaum, Connolly, & Feig, 2002), il en est de même pour JIP4 qui
est un substrat de p38 (Kelkar, Standen, & Davis, 2005).
Enfin, de nombreuses phosphatases régulent la signalisation p38. Parmi celles-ci,
citons : DSPs, DSP2, MKP1, MKP5, VH5 et MKP7. A titre d’exemple, les souris déficientes
pour MKP1 sont plus sensibles aux chocs endotoxiques et présentent des taux élevés de
cytokines proinflammatoires (Chi et al., 2006).
94
Figure 27 : Mécanismes impliqués dans la régulation des MAPKs p38 Les MAPKs p38 sont principalement régulées par des mécanismes de phosphorylation et de déphosphorylation mais des mécanismes additionnels ont été décrits. D’après (Cuadrado & Nebreda, 2010)
95

10.1/ Rôle des « Mitogen-activated protein kinases » p38 dans l’hématopoïèse normale et leucémique
Il a été suggéré que des anomalies de la voie d'activation Ras/MAPK, notamment une
activation constitutive de celle-ci, pouvait participer à la pathogenèse de certaines
hémopathies, soulignant l'importance de la voie des MAPK dans le processus de
leucémogénèse.
Dans le paragraphe suivant, nous développerons le rôle de la voie p38 dans la
régulation de l’hématopoièse et nous montrerons, grâce aux travaux qui font l’objet de cette
thèse, comment la persitance de son activation contribue, dans un contexe inflammatoire, à la
dysmégacaryopoïèse qui caractérise la myélofibrose primitive.
10.1.1/ Les « Mitogen-activated protein kinases » p38
La fonction de p38 dans l’hématopoïèse normale humaine est principalement de type
inhibitrice de la croissance cellulaire, via des signaux répresseurs de prolifération et des
signaux pro-apoptotiques. Par exemple, p38 est activée dans les lignées cellulaires
hématopïétiques en réponse aux cytokines telles que les interférons de type I (IFN-alpha et -
beta) et de type II (Verma et al., 2002), le TNF-alpha (Uddin et al., 1999) (Uddin et al., 2000),
le TGF-" (Verma et al., 2002) qui sont connues pour diminuer la croissance cellulaire et/ou
provoquer l’apoptose des cellules hématopoïétiques. De plus, la protéine p38 régule
l’expression de cytokines qui peuvent en retour auto-activer la voie de signalisation p38,
créant ainsi une boucle de régulation complexe. Par exemple, l’érythropoïétine est sous le
contrôle de p38! et l’activation de p38 est essentielle pour médier les effets de cette cytokine
(Tamura et al., 2000).
96
10.1.2/ Rôle de p38 dans la niche hématopoïétique
Le rôle de la signalisation et plus particulièrement de la voie des MAPK dans la niche
hématopoïétique est actuellement mal connu. Il a été suggéré que la signalisation p38
participait à la régulation de la quiescence des CSH au sein de la niche ostéoblastique. En
effet, une augmentation de la phosphorylation de p38 entraîne une diminution de la
quiescence des CSH. La protéine ATM (ataxia telangiectasia mutated) modifie la capacité de
repopulation à long terme des CSH murines sachant que les souris ATM-/- présentent un
défaut de maintien en quiescence des CSH. Il n’y pas d’altération de leur prolifération et de
leur différenciation dans ce modèle murin (Ito et al., 2006). Les souris ATM-/- présentent une
sensibilité accrue au stress oxydatif (Rotman & Shiloh, 1997) qui, comme les autres stress
cellulaires, active la voie de signalisation p38 MAPK et altère la quiescence des CSH dans la
niche ostéoblastique (Ito et al., 2004).
97

.
Figure 28 : Sénescence induite par p38 dans les cellules normales versus les cellules de
patients atteints de LMC exprimant la protéine de fusion BCR-ABL D’après (Savona & Talpaz, 2008)
98
10.1.3/ Rôle de p38 dans les leucémies
Jusqu’à présent il existe peu d’études démontrant le rôle de l’activation de p38 dans la
pathogénèse des leucémies aiguës. La MAPKAPK-2 kinase, un effecteur en aval de p38, est
activée lors de la différenciation des cellules de la lignée NB4 (modèle de LAM avec
translocation t(15;17)) par de l’ATRA « all trans retinoic acid ». Cette dernière est inhibée par
SB203580, un inhibiteur pharmacologique de p38. L’inhibition de p38 augmente la
différenciation de NB4 induite par l’ATRA suggérant que p38 participe à l’inhibition de la
différenciation et donc au maintien de l’état indifférencié des cellules leucémiques. Dans
d’autres circonstances, p38 et ERK peuvent coopérer pour induire la réponse aux cytokines.
En particulier, il a été montré que p38 et ERK régulent la prolifération des cellules OCI-
AML5 (lignée cellulaire issue d’une AML5 myélomonocytaire) en réponse au Flt3-ligand et
G-CSF (Srinivasa & Doshi, 2002).
Dans une cellule normale, ABL exerce un effet stimulateur sur p38 et sur les
inhibiteurs des kinases cyclines dépendantes (CDKIs), p16 et p19, qui orientent la cellule vers
la sénescence. La protéine p38 phosphorylée inhibe BIM1, un répresseur épigénétique de p16
et p19. En revanche, chez les patients atteints de Leucémie Myéloide Chronique (LMC), la
protéine de fusion BCR-ABL conduit à la déphosphorylation de p38. Le rôle inhibiteur de p38
sur BIM1 étant diminué, voire interrompu, il en résulte une réduction de la sénescence des
cellules leucémiques (Figure 28) (Savona & Talpaz, 2008) .
L’ensemble de ces données suggère que les voies des MAPK et en particulier la voie
p38 sont impliquées dans la physiopathologie des leucémies (Feng, Wen, & Chang, 2009).
Notamment le rôle de p38 activé dans les syndromes myélodysplasiques a été suggéré en
réponse aux cytokines myélosuppressives telles que TNF! et TGF" (Katsoulidis et al., 2005).
La MAPK p38 est donc une cible thérapeutique potentielle dans le traitement des processus
prolifératifs tels que les leucémies et cancer (Yong, Koh, & Moon, 2009). De façon
intéressante, dans la leucémie aiguë lymphoblastique dont la prolifération cellulaire est en
partie dépendante du stroma, une thérapie ciblant p38 réduit la production de cytokines par les
cellules stromales médullaires et diminue la prolifération leucémique (Gaundar, Bradstock, &
Bendall, 2009)
10.2/ ATF2 effecteur en aval de p38
ATF2 est l’un des 16 membres du groupe ATF CREB, des facteurs de transcription de
type bZIP intervenant dans la réponse cellulaire au stress ou au dommage de l’ADN
99
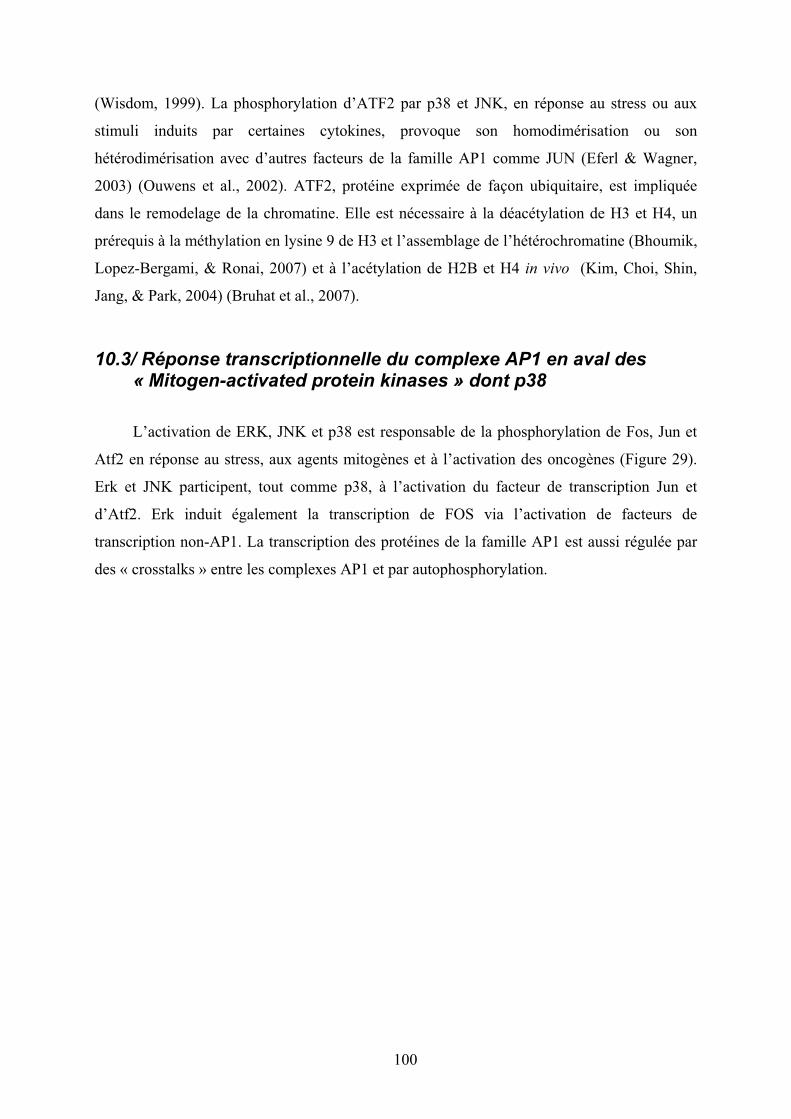
(Wisdom, 1999). La phosphorylation d’ATF2 par p38 et JNK, en réponse au stress ou aux
stimuli induits par certaines cytokines, provoque son homodimérisation ou son
hétérodimérisation avec d’autres facteurs de la famille AP1 comme JUN (Eferl & Wagner,
2003) (Ouwens et al., 2002). ATF2, protéine exprimée de façon ubiquitaire, est impliquée
dans le remodelage de la chromatine. Elle est nécessaire à la déacétylation de H3 et H4, un
prérequis à la méthylation en lysine 9 de H3 et l’assemblage de l’hétérochromatine (Bhoumik,
Lopez-Bergami, & Ronai, 2007) et à l’acétylation de H2B et H4 in vivo (Kim, Choi, Shin,
Jang, & Park, 2004) (Bruhat et al., 2007).
10.3/ Réponse transcriptionnelle du complexe AP1 en aval des « Mitogen-activated protein kinases » dont p38
L’activation de ERK, JNK et p38 est responsable de la phosphorylation de Fos, Jun et
Atf2 en réponse au stress, aux agents mitogènes et à l’activation des oncogènes (Figure 29).
Erk et JNK participent, tout comme p38, à l’activation du facteur de transcription Jun et
d’Atf2. Erk induit également la transcription de FOS via l’activation de facteurs de
transcription non-AP1. La transcription des protéines de la famille AP1 est aussi régulée par
des « crosstalks » entre les complexes AP1 et par autophosphorylation.
100
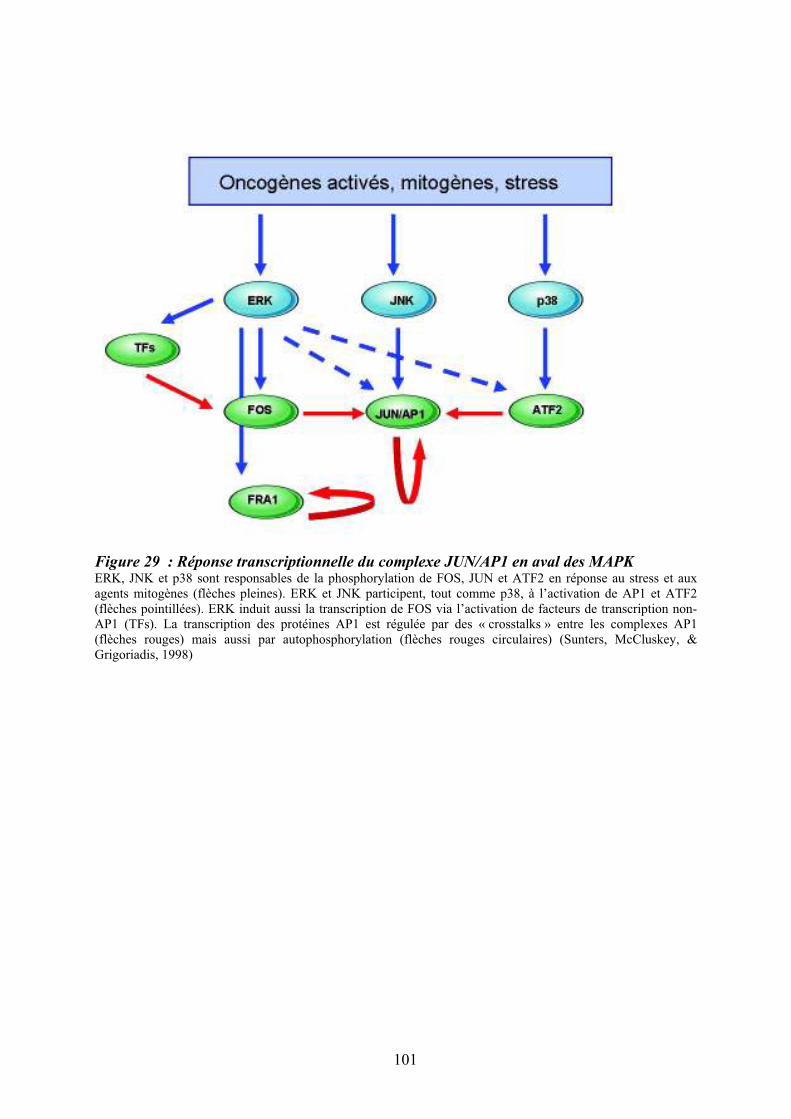
Figure 29 : Réponse transcriptionnelle du complexe JUN/AP1 en aval des MAPK ERK, JNK et p38 sont responsables de la phosphorylation de FOS, JUN et ATF2 en réponse au stress et aux agents mitogènes (flèches pleines). ERK et JNK participent, tout comme p38, à l’activation de AP1 et ATF2 (flèches pointillées). ERK induit aussi la transcription de FOS via l’activation de facteurs de transcription non-AP1 (TFs). La transcription des protéines AP1 est régulée par des « crosstalks » entre les complexes AP1 (flèches rouges) mais aussi par autophosphorylation (flèches rouges circulaires) (Sunters, McCluskey, & Grigoriadis, 1998)
101

Figure 30 : Modulation croisée de la voie MAPK p38 avec d’autres voies de signalisation D’après (Cuadrado & Nebreda, 2010)
102

JUN est un gène induit par un stimulus mitogénique, un stress ou un dommage à
l’ADN. Le niveau d’expression d’AP1 est finement contrôlé via la demi-vie courte de son
ARNm (20 à 25 minutes) et la présence de séquences AU-riches en 3’UTR. Jun transactive de
nombreux gènes contrôlant le cycle cellulaire et notamment la transition G1-S, comme la
cycline D1. JUN contrôle également des gènes régulateurs du cycle cellulaire comme TP53
(Schreiber et al., 1999). La surexpression de JUN in vitro est suffisante à la transformation de
certaines cellules de mammifères (Bakiri, Lallemand, Bossy-Wetzel, & Yaniv, 2000). Chez
ces derniers, le complexe AP-1 est constitué d’homodimères ou d’hétérodimères composés de
protéines des familles Jun et Fos, Atf, et des sous familles CREB et Maf. Ce sont des
protéines comprenant des domaines bZIP (basic leucine zipper) composés de leucine zipper et
de domaines basiques qui permettent à la protéine de se fixer à l'ADN. (Lopez-Bergami, Lau,
& Ronai, 2010) Les protéines Jun forment des dimères reconnaissant les motifs ADN 5&-
TGAC/GTCA-3& ou TPA-response elements (TRE). Les protéines ATF forment des dimères
avec AP1 reconnaissant les éléments de réponse à l'AMP cyclique (CRE, 5'-TGACGTCA-3')
(Vogt, 2001). Les protéines du complexe AP1 sont généralement activées en réponse à de
multiples signaux extracellulaires provenant de cytokines et de facteurs de croissance
impliqués dans le stress et l'inflammation (Angel et al., 1987) (van Dam & Castellazzi, 2001).
Dans un modèle murin, l’expression transgénique de Fos induit la transformation des
chondroblastes et des ostéoblastes et est à l’origine de la formation de tumeurs
chondrogéniques et ostéogéniques (Goralczyk et al., 1990). De même, la surexpression de
FRA1 accélère l’ostéoblastogénèse et induit une ostéosclérose chez la souris (Jochum et al.,
2000), suggérant une implication des membres de la famille AP1 dans la différenciation de
cellules ostéocompétentes composant la niche endostéale.
Tous ces exemples montrent l’intrication complexe entre les différentes voies MAPK,
puisque c’est la combinaison entre différents facteurs de transcription activés par ERK, JNK
et p38 qui va dicter la réponse cellulaire. Il existe aussi de nombreux exemples dans lesquels
les MAPK et en particulier p38 peuvent moduller l’activation d’autres voies de signalisation
comme NFKB (Chang et al., 2006), Akt (Zuluaga et al., 2007), SMAD (Demange, Ferrand,
Prunier, Bourgeade, & Atfi, 2009).
103

Figure 31 : Classification des néoplasmes myéloprolifératifs
104
11/ Des syndromes aux néoplasmes myéloprolifératifs
chroniques
Les Néoplasmes MyéloProlifératifs (NMP), anciennement appelés syndromes
myéloprolifératifs (SMP), sont considérés comme des maladies clonales de la cellule souche
hématopoïétique pluripotente. Les SMP rassemblaient différentes hémopathies telles que la
Leucémie Myéloïde Chronique (LMC), la Polycythemia vera (PV), la Thrombocytémie
Essentielle (TE) et la Myélofibrose Primitive (MFP) (Dameshek, 1951) (Cf. Chapitre suivant
§11).
Plus récemment, des avancées importantes dans la pathogenèse de ces hémopathies
ont permis de regrouper ces NMP selon d’autres critères tels que la présence d’une
dérégulation de protéines de la famille des tyrosines kinases soit par mutations (Jak2V617F)
ou de translocations (BCR-ABL1 ou autres tyrosines kinases plus rarement). La Figure 31
reprend cette classification.
La classification des néoplasmes myéloprolifératifs fait intervenir un premier groupe
représenté par la Leucemie Myéloïde Chronique caractérisée par le gène de fusion BCR-ABL,
un second groupe intègre les néoplasmes myéloprolifératifs classiques associés à la mutation
Jak2V617F, comprenant la PV, la TE et la MFP et un dernier groupe rassemble les
néoplasmes plus rares impliquant les gènes codant pour des protéines à activité tyrosine
kinase. La mastocytose a récemment été rattachée aux néoplasmes myéloprolifératifs en
raison de sa pathogénèse et de la présence de mutations dans le gène C-KIT. Au cours de
l’année 2008, la classification des néoplasmes myéloprolifératifs a été redéfinie par
l’organisation « World Health Organization » (WHO) et intègre actuellement les NMP
suivants (Vardiman et al., 2009) :
- la leucémie myéloïde chronique
- la polycythemia vera
- la thrombocytémie essentielle
- la myélofibrose primitive
- la leucémie chronique neutrophile
- la leucémie chronique éosinophile
- la mastocytose
- les néoplasmes myéloprolifératifs inclassables.
105
Dans cette partie de l’introduction, je ferai un état de l’art sur les connaissances
acquises sur la myélofibrose primitive en intégrant les articles auxquels j’ai participé et qui
sont mis en annexes.
11.1/ Historique des néoplasmes myéloprolifératifs dits « classiques »
L’histoire commence en 1879, lorsque le médecin allemand Gustave Heuck rapporta
le cas de deux patients avec une splénomégalie majeure, des cellules érythroblastiques
circulantes et un taux élevé de leucocytes (Heuck, 1879). Ce tableau clinique différait de celui
de la LMC par une fibrose médullaire et une hématopoïèse extramédullaire. Louis Henri
Vaquez décrivit ensuite l’existence d’une polyglobulie (Polycythemia vera) chez un patient
présentant une érythrocytose importante et une hépatomégalie (Vaquez, 1892). En 1903,
William Osler proposa le nom de « maladie de Vaquez » pour définir cette nouvelle entité
clinique caractérisée par une cyanose chronique associée à une polyglobulie et une
splénomégalie (Osler, 1903). La myélofibrose primitive a été décrite par Gustave Heuck, un
médecin allemand qui a noté la présence d’une fibrose médullaire et d’une hématopoïèse
extramédullaire chez ces patients. En 1934, Epstein et Goedel identifient des patients
présentant une thrombocytose, sans érythrocytose, comme un syndrome clinique distinct : la
thrombocythémie essentielle (Epstein & Goedel, 1934). C’est enfin William Dameshek qui,
en 1951, proposa de regrouper ces différentes hémopathies sous le terme unique de
« néoplasme myéloprolifératif » (Dameshek, 1951) (Tefferi, 2008a).
106
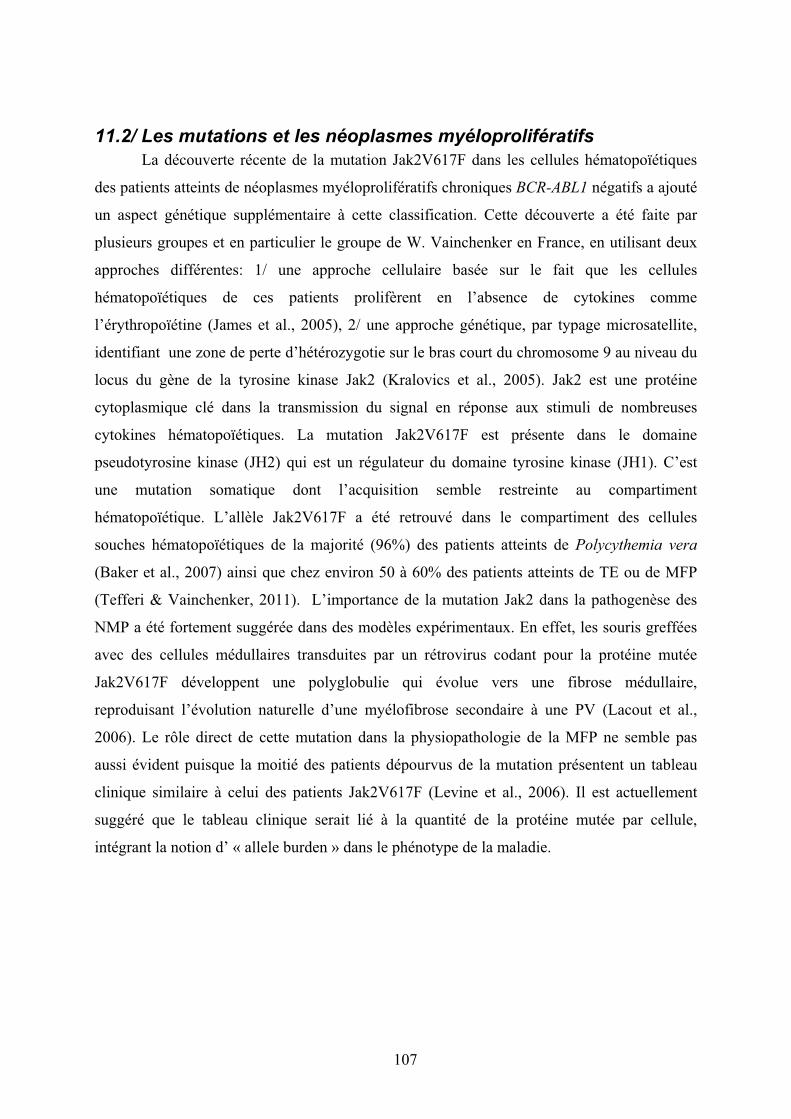
11.2/ Les mutations et les néoplasmes myéloprolifératifs
La découverte récente de la mutation Jak2V617F dans les cellules hématopoïétiques
des patients atteints de néoplasmes myéloprolifératifs chroniques BCR-ABL1 négatifs a ajouté
un aspect génétique supplémentaire à cette classification. Cette découverte a été faite par
plusieurs groupes et en particulier le groupe de W. Vainchenker en France, en utilisant deux
approches différentes: 1/ une approche cellulaire basée sur le fait que les cellules
hématopoïétiques de ces patients prolifèrent en l’absence de cytokines comme
l’érythropoïétine (James et al., 2005), 2/ une approche génétique, par typage microsatellite,
identifiant une zone de perte d’hétérozygotie sur le bras court du chromosome 9 au niveau du
locus du gène de la tyrosine kinase Jak2 (Kralovics et al., 2005). Jak2 est une protéine
cytoplasmique clé dans la transmission du signal en réponse aux stimuli de nombreuses
cytokines hématopoïétiques. La mutation Jak2V617F est présente dans le domaine
pseudotyrosine kinase (JH2) qui est un régulateur du domaine tyrosine kinase (JH1). C’est
une mutation somatique dont l’acquisition semble restreinte au compartiment
hématopoïétique. L’allèle Jak2V617F a été retrouvé dans le compartiment des cellules
souches hématopoïétiques de la majorité (96%) des patients atteints de Polycythemia vera
(Baker et al., 2007) ainsi que chez environ 50 à 60% des patients atteints de TE ou de MFP
(Tefferi & Vainchenker, 2011). L’importance de la mutation Jak2 dans la pathogenèse des
NMP a été fortement suggérée dans des modèles expérimentaux. En effet, les souris greffées
avec des cellules médullaires transduites par un rétrovirus codant pour la protéine mutée
Jak2V617F développent une polyglobulie qui évolue vers une fibrose médullaire,
reproduisant l’évolution naturelle d’une myélofibrose secondaire à une PV (Lacout et al.,
2006). Le rôle direct de cette mutation dans la physiopathologie de la MFP ne semble pas
aussi évident puisque la moitié des patients dépourvus de la mutation présentent un tableau
clinique similaire à celui des patients Jak2V617F (Levine et al., 2006). Il est actuellement
suggéré que le tableau clinique serait lié à la quantité de la protéine mutée par cellule,
intégrant la notion d’ « allele burden » dans le phénotype de la maladie.
107

Figure 32 : Activation des voies de signalisation dans les néoplasmes myéloprolifératifs D’après (Grimwade et al., 2009). Les mutations Jak2V617F et MPLW515L/K activent en continu les voies de signalisation Jak/STAT, PI3K et MAPK dans les cellules hématopoïétiques. mutations nom complet localisation chromosomique fréquence mutationnelle contribution aux processus pathogéniques
Jak2V617F exon 14 Janus kinase 2 9p24 PV ~ 96% contribue à la myéloprolifération
TE ~ 55% hypersensibilité des progéniteurs
MFP ~ 65% aux facteurs de croissance
Crise Blastique ~ 50%
Jak2 exon 12 Janus kinase 2 9p24 PV ~ 3% contribue à la myéloprolifération
TE ~ rare érythroïde primaire
MFP ~ rare
Crise Blastique ~ ?
Mpl exon 10 Myeloproliferative Leukemia Virus oncogene 1p34 PV ~ rare contribue à la myéloprolifération
(MPL 515W>L/K) TE ~ 3% mégacaryocytaire
MFP ~ 10%
Crise Blastique ~ ?
TET2 mutations dispersées TET oncogene family member 2 4q24 PV ~ 16% contribue à des modifications
TE ~ 5% épigénétiques qui modullent la
MFP ~ 17% transcription
Crise Blastique ~ 17%
ASXL1 exon 12 Additional Sex Combs-Like 1 20q11.1 PV ~ ? modifie la régulation transcriptionnelle
TE ~ ? modifie la signalisation RAR
MFP ~ ? (récepteur acide rétinoïque)
Crise Blastique ~ 19%
CBL exon 8 et 9 Casitas B-lineage lymphoma proto-oncogene 11q23.3 PV ~ rare défaut d'ubiquitinylation des
TE ~ rare oncoprotéines
MFP ~ 6%
Crise Blastique ~ ?
IDH1/IDH2 exon 4/exon 4 Isocitrate deshydrogenase 2q33.3/15q26.1 PV ~ rare induit l'accumulation de
TE ~ rare 2-hydroxyglutarate
MFP ~ 4%
Crise Blastique ~ 20%
IKZF1 IKAROS family zink finger 1 7p12 PV ~ rare altère l'activité suppresseur de tumeur
TE ~ rare de la protéine wild-type
MFP ~ 4%
Crise Blastique ~ 20%
Tableau 6 : Bilan des mutations présentes chez les patients atteints de néoplasmes
myéloprolifératifs chroniques BCR-ABL1 négatifsAdapté d’après (Tefferi, 2010). Abréviations : PV : Polycythemia vera, TE : Thrombocytémie Essentielle, MFP : Myélofibrose Primitive.
108
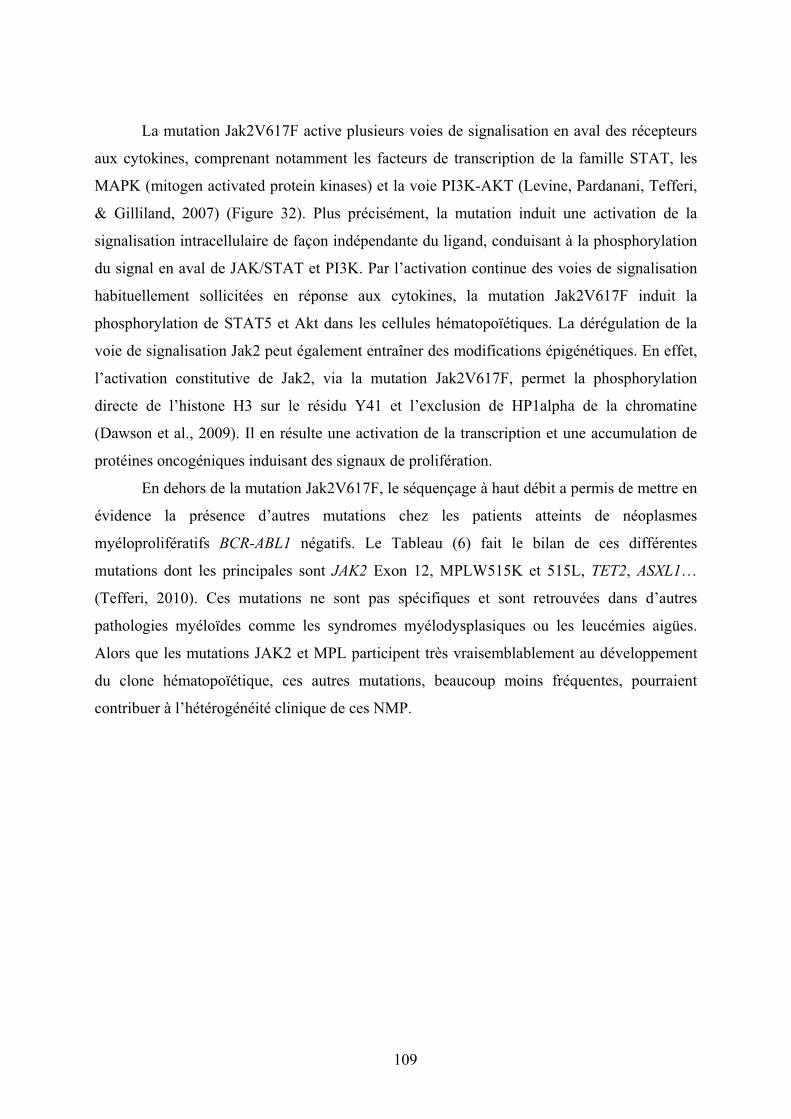
La mutation Jak2V617F active plusieurs voies de signalisation en aval des récepteurs
aux cytokines, comprenant notamment les facteurs de transcription de la famille STAT, les
MAPK (mitogen activated protein kinases) et la voie PI3K-AKT (Levine, Pardanani, Tefferi,
& Gilliland, 2007) (Figure 32). Plus précisément, la mutation induit une activation de la
signalisation intracellulaire de façon indépendante du ligand, conduisant à la phosphorylation
du signal en aval de JAK/STAT et PI3K. Par l’activation continue des voies de signalisation
habituellement sollicitées en réponse aux cytokines, la mutation Jak2V617F induit la
phosphorylation de STAT5 et Akt dans les cellules hématopoïétiques. La dérégulation de la
voie de signalisation Jak2 peut également entraîner des modifications épigénétiques. En effet,
l’activation constitutive de Jak2, via la mutation Jak2V617F, permet la phosphorylation
directe de l’histone H3 sur le résidu Y41 et l’exclusion de HP1alpha de la chromatine
(Dawson et al., 2009). Il en résulte une activation de la transcription et une accumulation de
protéines oncogéniques induisant des signaux de prolifération.
En dehors de la mutation Jak2V617F, le séquençage à haut débit a permis de mettre en
évidence la présence d’autres mutations chez les patients atteints de néoplasmes
myéloprolifératifs BCR-ABL1 négatifs. Le Tableau (6) fait le bilan de ces différentes
mutations dont les principales sont JAK2 Exon 12, MPLW515K et 515L, TET2, ASXL1…
(Tefferi, 2010). Ces mutations ne sont pas spécifiques et sont retrouvées dans d’autres
pathologies myéloïdes comme les syndromes myélodysplasiques ou les leucémies aigües.
Alors que les mutations JAK2 et MPL participent très vraisemblablement au développement
du clone hématopoïétique, ces autres mutations, beaucoup moins fréquentes, pourraient
contribuer à l’hétérogénéité clinique de ces NMP.
109

12/ La myélofibrose primitive (MFP)
Néoplasme myéloprolifératif (NMP) le plus rare, cette maladie associe, avec une
intensité variable, une splénomégalie (résultant d’une métaplasie myéloïde), des anomalies
caractéristiques de l’hémogramme et de la moelle osseuse (myélofibrose notamment). Les
nombreux synonymes, utilisés jusqu’à présent (Splénomégalie Myéloïde, Métaplasie
Myéloïde avec Myélofibrose …) témoignent de la difficulté de définir cette hémopathie de
façon simple. Les experts internationaux s’accordent désormais à leur préférer le terme de
« Myélofibrose Primitive » (MFP), la distinguant ainsi des fibroses secondaires à une
évolution des PV et TE (Mesa et al., 2007). L’incidence de la maladie représente 3 à 7
nouveaux cas/million d’habitant/an avec un âge moyen au diagnostic de 60 ans. Le sexe ratio
de la maladie est équilibré. Des facteurs favorisants ont été décrits comme une exposition
prolongée aux dérivés benzéniques (Hu, 1987) et les radiations ionisantes (Anderson,
Hoshino, & Yamamoto, 1964).
La découverte récente de la mutation Jak2V617F, redéfinissant le cadre des NMP BCR-
ABL1 négatifs a relancé l’intérêt des hématologues pour cette pathologie chronique. En effet,
le développement récent de nombreux travaux et essais thérapeutiques, permettent d’espérer
améliorer le pronostic de cette maladie dont la médiane de survie reste, à ce jour, d’environ
cinq ans.
12.1/Diagnostic clinique et anatomopathologique
12.1.1/ Clinique
Sur le plan clinique, la MFP se traduit par la présence d’une splénomégalie plus ou
moins associée à un syndrome anémique, une asthénie, des douleurs abdominales et un
amaigrissement. La splénomégalie de taille variable, parfois volumineuse, est un signe
constant ; elle apparaît précocement dans la maladie (Dupriez et al., 2008).
L’anémie est le principal facteur pronostique de la maladie : le score pronostique de
Dupriez en tient compte (Dupriez et al., 1996). L’hépatomégalie est présente dans 50% des
cas, en particulier chez les patients splénectomisés (Tefferi, Mesa, Nagorney, Schroeder, &
Silverstein, 2000). Des adénopathies sont palpables dans environ 10% des cas.
Récemment, deux nouveaux scores pronostiques, le score IPSS (Cervantes et al,
Blood 2009) et le DIPSS (Passamonti et al, Blood 2010), sont venus s’ajouter au score de
référence de Dupriez et Demory (Dupriez et al., 1996). Ces nouveaux scores utilisent 5
110

facteurs péjoratifs indépendants permettant une stratification en 4 groupes pronostiques, ne
tenant pas compte cependant des données cytogénétiques et du nombre plaquettes comme le
propose récemment Caramazza et al (Caramazza et al., 2011).
12.1.2/ Hémogramme
L’anémie est une caractéristique fréquente puisqu’elle concerne 75% des cas. Elle
s’accompagne de nombreuses anomalies morphologiques des érythrocytes comme
l’anisocytose, la poïkilocytose, la dacryocytose, la schizocytose et la sphérocytose. Une
érythromyélémie se traduisant par la présence d’érythroblastes acidophiles et
polychromatophiles est souvent observée (Figure 33). Cette érythromyélémie est plus
importante chez les patients splénectomisés. Une hyperleucocytose modérée peut
s’accompagner d’une myélémie mais aussi de la présence de quelques blastes. La numération
des plaquettes est très variable parfois normale, augmentée ou diminuée ou associée à une
anisothrombocytose.
12.1.3/ Augmentation du nombre de progéniteurs circulants CD34+
L’immunophénotypage des cellules mononucléées circulantes des patients montre une
augmentation du nombre de progéniteurs hématopoïétiques CD34+. Bien que celui-ci puisse
atteindre jusqu’à 100 fois la valeur normale et qu’il évolue avec la progression de la maladie
(Barosi et al., 2001), il n’est pas actuellement considéré comme un critère diagnostique selon
la classification de l’OMS (Vardiman et al., 2009) (Tableau 7).
12.1.4/ Histologie médullaire et myélofibrose
L’aspiration médullaire est en général infructueuse en raison de la fibrose et de la
dureté de l’os. La biopsie ostéomédullaire s’avère alors d’un grand intérêt pour évaluer la
prolifération myéloïde en particulier mégacaryocytaire, la désorganisation vasculaire et la
myélofibrose.
Les mégacaryocytes sont généralement hypertrophiques et dystrophiques. Ils ont un
aspect morphologique caractéristique avec une taille variable, des noyaux mal segmentés,
nuageux et sont regroupés en grappes.
Les remaniements vasculaires sont caractérisés par une augmentation du nombre et de
la taille des sinusoïdes. Ils sont mis en évidence précocément par immunohistochimie grâce à
des antigènes endothéliaux (CD34, CD31…).
La fibrose médullaire résulte d’une augmentation de synthèse et du dépôt de plusieurs
glycoprotéines interstitielles ou de membrane basale tels que les collagènes de types I, III, IV,
111
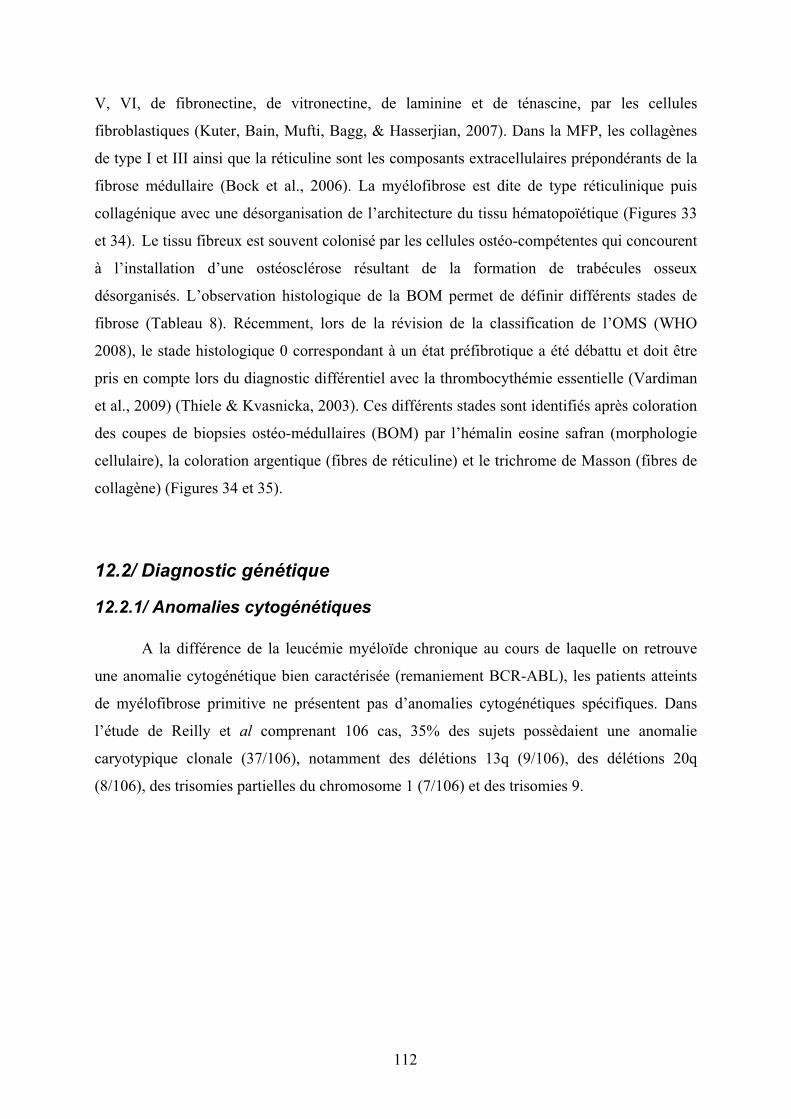
V, VI, de fibronectine, de vitronectine, de laminine et de ténascine, par les cellules
fibroblastiques (Kuter, Bain, Mufti, Bagg, & Hasserjian, 2007). Dans la MFP, les collagènes
de type I et III ainsi que la réticuline sont les composants extracellulaires prépondérants de la
fibrose médullaire (Bock et al., 2006). La myélofibrose est dite de type réticulinique puis
collagénique avec une désorganisation de l’architecture du tissu hématopoïétique (Figures 33
et 34). Le tissu fibreux est souvent colonisé par les cellules ostéo-compétentes qui concourent
à l’installation d’une ostéosclérose résultant de la formation de trabécules osseux
désorganisés. L’observation histologique de la BOM permet de définir différents stades de
fibrose (Tableau 8). Récemment, lors de la révision de la classification de l’OMS (WHO
2008), le stade histologique 0 correspondant à un état préfibrotique a été débattu et doit être
pris en compte lors du diagnostic différentiel avec la thrombocythémie essentielle (Vardiman
et al., 2009) (Thiele & Kvasnicka, 2003). Ces différents stades sont identifiés après coloration
des coupes de biopsies ostéo-médullaires (BOM) par l’hémalin eosine safran (morphologie
cellulaire), la coloration argentique (fibres de réticuline) et le trichrome de Masson (fibres de
collagène) (Figures 34 et 35).
12.2/ Diagnostic génétique
12.2.1/ Anomalies cytogénétiques
A la différence de la leucémie myéloïde chronique au cours de laquelle on retrouve
une anomalie cytogénétique bien caractérisée (remaniement BCR-ABL), les patients atteints
de myélofibrose primitive ne présentent pas d’anomalies cytogénétiques spécifiques. Dans
l’étude de Reilly et al comprenant 106 cas, 35% des sujets possèdaient une anomalie
caryotypique clonale (37/106), notamment des délétions 13q (9/106), des délétions 20q
(8/106), des trisomies partielles du chromosome 1 (7/106) et des trisomies 9.
112
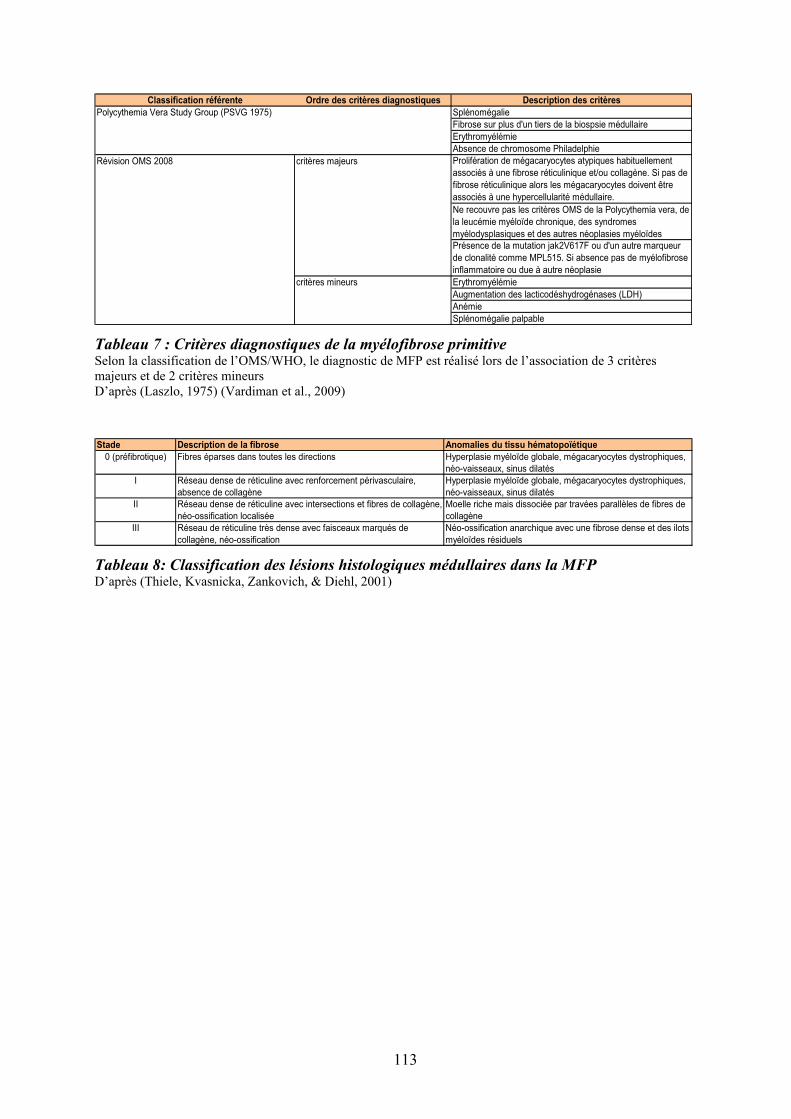
Classification référente Ordre des critères diagnostiques Description des critères
Polycythemia Vera Study Group (PSVG 1975) Splénomégalie
Fibrose sur plus d'un tiers de la biospsie médullaire
Erythromyélémie
Absence de chromosome Philadelphie
Révision OMS 2008 critères majeurs Prolifération de mégacaryocytes atypiques habituellement
associés à une fibrose réticulinique et/ou collagène. Si pas de
fibrose réticulinique alors les mégacaryocytes doivent être
associés à une hypercellularité médullaire.
Ne recouvre pas les critères OMS de la Polycythemia vera, de
la leucémie myéloïde chronique, des syndromes
myélodysplasiques et des autres néoplasies myéloïdes
Présence de la mutation jak2V617F ou d'un autre marqueur
de clonalité comme MPL515. Si absence pas de myélofibrose
inflammatoire ou due à autre néoplasie
critères mineurs Erythromyélémie
Augmentation des lacticodéshydrogénases (LDH)
Anémie
Splénomégalie palpable
Tableau 7 : Critères diagnostiques de la myélofibrose primitive Selon la classification de l’OMS/WHO, le diagnostic de MFP est réalisé lors de l’association de 3 critères majeurs et de 2 critères mineurs D’après (Laszlo, 1975) (Vardiman et al., 2009)
Stade Description de la fibrose Anomalies du tissu hématopoïétique
0 (préfibrotique) Fibres éparses dans toutes les directions Hyperplasie myéloïde globale, mégacaryocytes dystrophiques,
néo-vaisseaux, sinus dilatés
I Réseau dense de réticuline avec renforcement périvasculaire,
absence de collagène
Hyperplasie myéloïde globale, mégacaryocytes dystrophiques,
néo-vaisseaux, sinus dilatés
II Réseau dense de réticuline avec intersections et fibres de collagène,
néo-ossification localisée
Moelle riche mais dissociée par travées parallèles de fibres de
collagène
III Réseau de réticuline très dense avec faisceaux marqués de
collagène, néo-ossification
Néo-ossification anarchique avec une fibrose dense et des ilots
myéloïdes résiduels
Tableau 8: Classification des lésions histologiques médullaires dans la MFP D’après (Thiele, Kvasnicka, Zankovich, & Diehl, 2001)
113
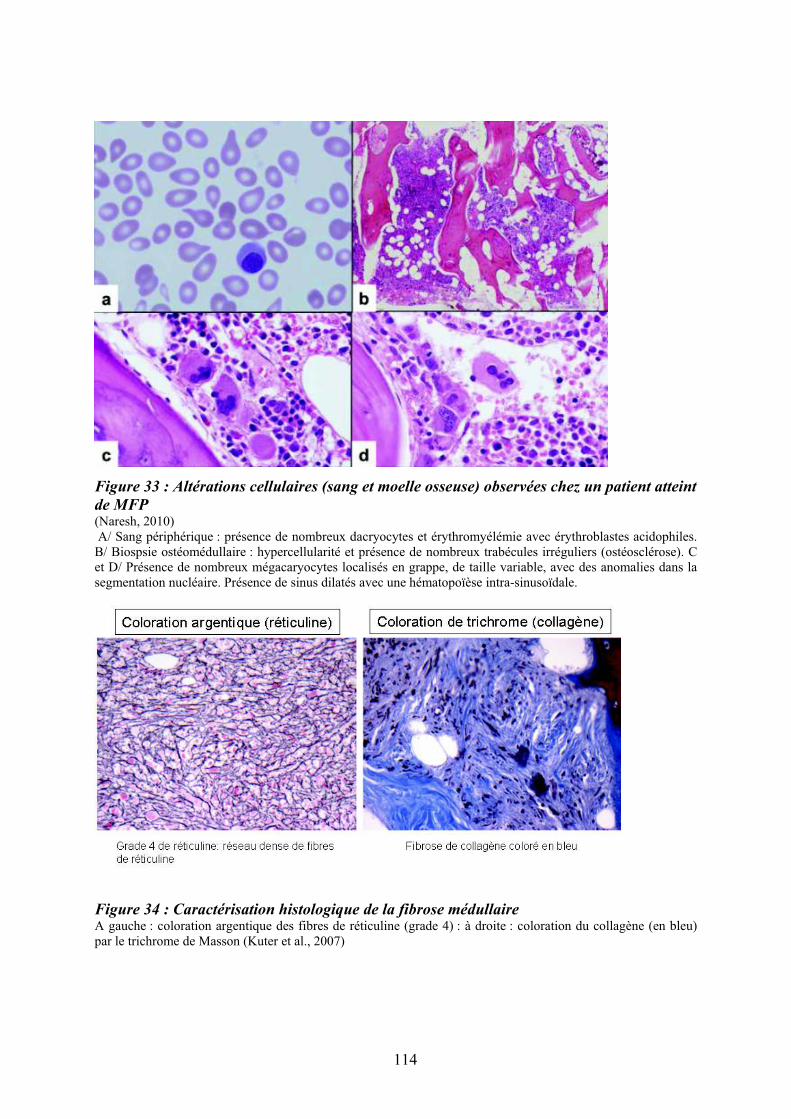
Figure 33 : Altérations cellulaires (sang et moelle osseuse) observées chez un patient atteint
de MFP(Naresh, 2010) A/ Sang périphérique : présence de nombreux dacryocytes et érythromyélémie avec érythroblastes acidophiles. B/ Biospsie ostéomédullaire : hypercellularité et présence de nombreux trabécules irréguliers (ostéosclérose). C et D/ Présence de nombreux mégacaryocytes localisés en grappe, de taille variable, avec des anomalies dans la segmentation nucléaire. Présence de sinus dilatés avec une hématopoïèse intra-sinusoïdale.
Figure 34 : Caractérisation histologique de la fibrose médullaire A gauche : coloration argentique des fibres de réticuline (grade 4) : à droite : coloration du collagène (en bleu) par le trichrome de Masson (Kuter et al., 2007)
114
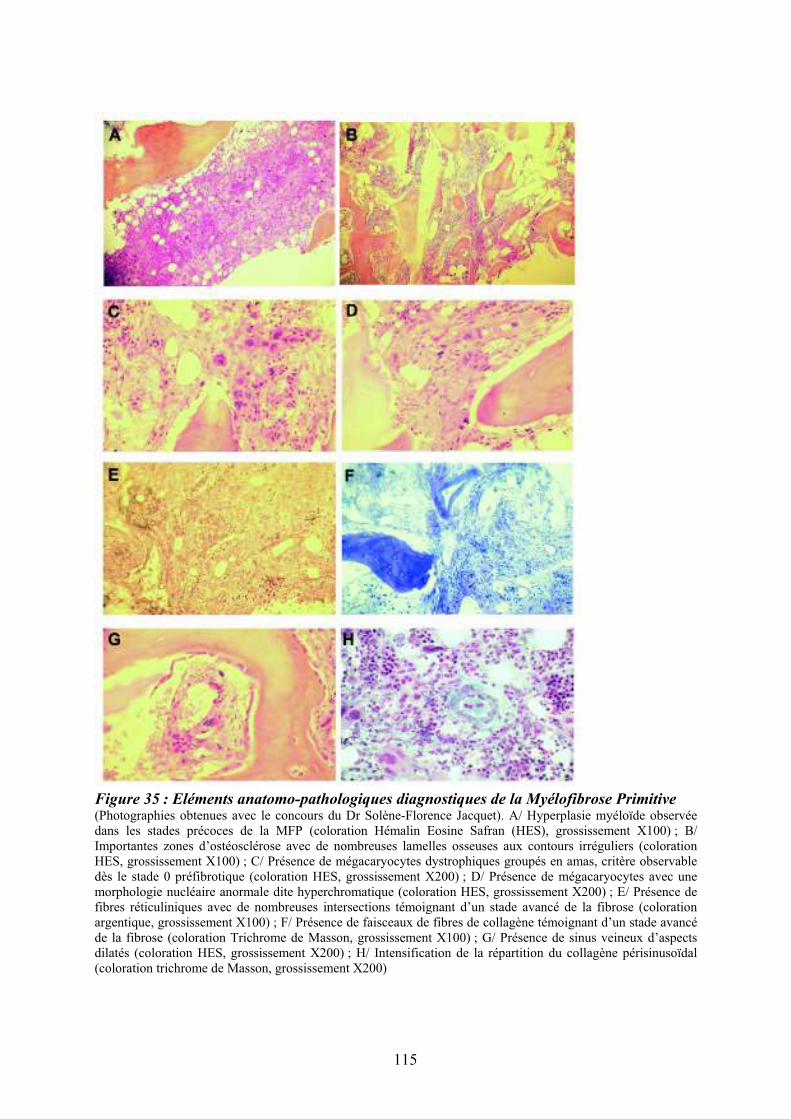
Figure 35 : Eléments anatomo-pathologiques diagnostiques de la Myélofibrose Primitive (Photographies obtenues avec le concours du Dr Solène-Florence Jacquet). A/ Hyperplasie myéloïde observée dans les stades précoces de la MFP (coloration Hémalin Eosine Safran (HES), grossissement X100) ; B/ Importantes zones d’ostéosclérose avec de nombreuses lamelles osseuses aux contours irréguliers (coloration HES, grossissement X100) ; C/ Présence de mégacaryocytes dystrophiques groupés en amas, critère observable dès le stade 0 préfibrotique (coloration HES, grossissement X200) ; D/ Présence de mégacaryocytes avec une morphologie nucléaire anormale dite hyperchromatique (coloration HES, grossissement X200) ; E/ Présence de fibres réticuliniques avec de nombreuses intersections témoignant d’un stade avancé de la fibrose (coloration argentique, grossissement X100) ; F/ Présence de faisceaux de fibres de collagène témoignant d’un stade avancé de la fibrose (coloration Trichrome de Masson, grossissement X100) ; G/ Présence de sinus veineux d’aspects dilatés (coloration HES, grossissement X200) ; H/ Intensification de la répartition du collagène périsinusoïdal (coloration trichrome de Masson, grossissement X200)
115
Dans cette étude, un caryotype anormal était associé à un mauvais pronostic tout
comme l’âge du diagnostic (âge supérieur à 68 ans), l’anémie, la thrombocytopénie et
l’hyperleucocytose (Reilly et al., 1997). Trois grandes études comprenant 256 sujets (Demory
et al., 1988) (Reilly et al., 1997) (Tefferi et al., 2001) et une étude de revue de la littérature
compilant 157 cas (Bench, Nacheva, Champion, & Green, 1998) ont révélé que les délétions
13q, 20q, les trisomies 8 et les anomalies des chromosomes 1, 7, 9 représentaient 80% des
anomalies chromosomiques observées dans la MFP. La délétion 13q est l’anomalie la plus
couramment observée dans la MFP. Une étude récente sur 433 patients considère deux
groupes d’anomalies cytogénétiques dites favorables telles que : remaniements du
chromosome 1, trisomie 9, délétions 13q et 20q, caryotype normal, une anomalie isolée ou
deux anomalies autres que les défavorables telles que : trisomie 8, monosomie 7/délétion 7q,
monosomie 5/délétion 5q, caryotype complexe (Caramazza et al., 2011).
12.2.2/ Clones et mutations
La clonalité de la prolifération des cellules souches hématopoïétiques a été
initialement suggérée par des études portant sur l’inactivation du chromosome X et le
polymorphisme du gène de la G-6-PD (Jacobson, Salo, & Fialkow, 1978) (Kahn, Bernard,
Cottreau, Marie, & Boivin, 1975). L’appartenance des lignées B et T lymphoïdes au clone
pathologique a été mise en évidence grâce aux mutations N-RAS, renforçant ainsi l’hypothèse
de l’atteinte clonale d’une cellule souche pluripotente (Buschle et al., 1988). Hormis les
mutations ponctuelles, diverses anomalies du caryotype sont également retrouvées et
correspondent probablement à des sous-clones qui émergent secondairement du fait de
l’instabilité génétique du clone mutant qui pourrait être induit en particulier par l’acquisition
de la mutation Jak2V617F (Tefferi & Vainchenker, 2011).
Les techniques de biologie moléculaire ont également permis d’identifier différentes
anomalies récurrentes. Une hyperexpression du gène HMGA2 chez des patients présentant ou
non un remaniement de la région 12q15 (Andrieux et al., 2006) et un remaniement du gène
NOG (17q22) ont été décrit chez plusieurs patients présentant une myélofibrose primitive ou
secondaire (Andrieux et al., 2007) (Travaux auxquels j’ai participé et dont les articles sont
mis en annexes). L’hybridation génomique comparative (CGH) démontre également un gain
chromosomique concernant les régions 9p, 2q, 3p, le chromosome 4, 12q et 13q17, chez 50%
des patients (Al-Assar et al., 2005).
La perte d’hétérozygotie du bras court du chromosome 9, retrouvée dans 30% des
MFP, recouvre une région contenant 33 gènes dont le gène JAK2 (9p24) (Kralovics et al.,
116

2005). La mutation ponctuelle de Jak2V617F (transversion G>T au niveau de l’exon 14) a été
mise en évidence dans 50 à 65% des cas à l’état hétérozygote et environ 13% à l’état
homozygote (Campbell et al., 2006) (article mis en annexe). La conséquence de cette
mutation est la perte de fonctionnalité du domaine auto-inhibiteur de la famille des Janus
kinases (JAK) (James et al., 2005).
Deux mutations activatrices du gène du récepteur de la thrombopoïétine (TPO) MPL
(MPLW515L et 515K) ont été identifiées chez 5 à 15% des patients. Retrouvées initialement
chez les patients ne présentant pas la mutation Jak2, elles semblent pouvoir coexister (Pikman
et al., 2006). En 2008, tout en gardant une place prépondérante aux critères histologiques dans
le diagnostic de la maladie (Tefferi et al., 2007), la nouvelle classification de l’OMS a inclus
ces données moléculaires dans le diagnostic de MFP (Tableau 6) (Vardiman et al., 2009).
Des variants du gène TET2 ont été également retrouvés dans les cellules de patients
atteints de différentes hémopathies myéloïdes (SMDs, SMPs, AML) et de MFP (Delhommeau
et al., 2009).
Plus récemment, il a été découvert des mutations faux sens dans les domaines ring et
linker de la protéine Cbl chez les patients atteints de MFP ou présentant une leucémie
myélomonocytaire chronique (Grand et al., 2009). Les mutations de CBL entraînent une
perturbation de l’activité ubiquitine ligase de la protéine. Le variant Cbl(R420Q) est la forme
anormale la plus fréquemment observée chez les patients atteints de MFP. Cette mutation est
peu fréquemment associée aux mutations Jak2V617F et MPL515 ; cependant, chez un patient
porteur de deux mutations CBL et JAK2, il a été montré que l’apparition de la mutation Cbl
était postérieure à celle de Jak2V617F et conférait un avantage prolifératif aux cellules mutées
de CBL (Grand et al., 2009).
Enfin d’autres mutations ont été plus récemment décrites; parmi celles-ci citons les
mutations ASXL1, IDH1 et IDH2, EZH2, LNK…. (Tefferi, 2010) (Baran-Marszak et al., 2010)
(Article mis en annexe).
Ainsi, chez les patients atteints de MFP, la coexistence de plusieurs clones porteurs
d’anomalies différentes suggère que l’hématopoïèse pathologie est vraisemblablement
d’origine polyclonale ou oligoclonale.
Les fibroblastes et les cellules endothéliales présentent un caryotype normal (Jacobson
et al., 1978) (J. C. Wang, Lang, Lichter, Weinstein, & Benn, 1992). Cependant, alors que les
fibroblastes ne présentent pas la mutation Jak2V617F, sa présence dans les cellules
endothéliales reste toujours très controversée (Piaggio et al., 2009) (Teofili et al., 2011).
117
L’absence d’anomalies récurrentes décelables au niveau des cellules stromales ne permet
donc pas à ce jour, de conclure sur leur appartenance ou non au(x) clone(s) pathologique(s).
12.2.3/ Anomalies épigénétiques
Au cours des cancers, il est fréquemment observé une hyper méthylation des « CpG
islands » et une désacétylation des histones interférant avec la transcription des gènes
suppresseurs de tumeurs ou des gènes de différenciation. Ces altérations conduisent en
particulier à la survie des cellules cancéreuses par diminution de l’apoptose.
Dans la MFP, le promoteur de certains gènes comme ceux codant pour la calcitonine
(Ihalainen, Juvonen, Savolainen, Ruutu, & Palotie, 1994), les gènes régulateurs du cycle
cellulaire p15 et p16 (J. C. Wang, Chen, Nallusamy, Chen, & Novetsky, 2002), le récepteur
"2 de l’acide rétinoïque (L. C. Jones et al., 2004) sont hyperméthylés. Plus récemment, des
altérations de la méthylation du promoteur de SOCS3, impliqué dans le rétro-contrôle de la
voie Jak/STAT (Fourouclas et al., 2008) (Chaligne et al., 2009), ont été également décrites.
Il en est de même pour le récepteur CXCR4 du SDF1/CXCL12 dont la diminution
d’expression sur les PH CD34+ est impliquée dans le mécanisme de migration anormale de
ces cellules (Bogani et al., 2008) (Article mis en annexe). Le traitement séquentiel des PH de
patients MFP par les agents modificateurs de la chromatine tels que TSA/5-AZA, restaure
l’expression de CXCR4 ainsi que l’adressage des cellules vers la moelle osseuse chez les
souris greffées (X. Wang et al., 2009). Malgré des résultats prometteurs chez la souris,
l’utilisation d’agents déméthylants n’a cependant donné que des résultats limités chez
l’homme (Quintas-Cardama et al., 2008) (Mesa et al., 2009).
L’inhibition du clone Jak2V617F par l’addition séquentielle d’un agent déméthylant et
de trichostatine in vitro suggère également une possible implication des histones dans les
dérégulations épigénétiques liées à la MFP (Shi et al., 2007). La mise en évidence d’une
augmentation de l’activité des HDAC dans les progéniteurs hématopoïétiques des patients est
en faveur de cette hypothèse. Cependant, le niveau des HDAC ne corrèle ni avec la présence
de la mutation Jak2V617F ni avec le degré de fibrose, mais avec la taille de la rate (J. C.
Wang et al., 2008). L’administration d’inhibiteurs des HDAC (comme l’acide valproïque)
inhibe la croissance des cellules pathologiques comme le montre l’amélioration de la fonction
médullaire chez un patient MFP échappant aux thérapies conventionnelles. Il a été suggéré
que, chez ce patient, l’acide valproïque entraînerait une accumulation des histones acétylées
modullant l’expression de gènes impliqués dans le cycle cellulaire, la différenciation et
l’apoptose (Inoue et al., 2005). Bien qu’encore très préliminaires, l’ensemble de ces résultats
118

ouvre la voie à une possible utilisation thérapeutique d’agents modulant la régulation
épigénétique dans cette pathologie. Cette approche thérapeutique pourrait venir en
complément des thérapies actuellement utilisées.
12.3/ Approches thérapeutiques
Sous l’égide de l’European LeukemiaNet, deux conférences de consensus regroupant
un certain nombre d’experts ont établi des recommandations concernant la conduite
thérapeutique à suivre pour les patients atteints de NMP et plus particulièrement de MFP
(Barbui et al., 2011). Ces recommandations, basées sur le score pronostique péjoratif de
l’IPSS, intègrent également des facteurs de risques généraux tels que diabète, risque de
thromboses, hypertension artérielle... Dans le cas de la MFP, les anomalies cytogénétiques et
le taux de CD34+ circulants, marqueur de l’aggressivité de la maladie, sont également pris en
compte. Parmi les différents traitements : les corticoïdes, angrogènes, érythropoïétine,
transfusions, immumodulateurs ciblent l’anémie ; l’hydroxyurée est le traitement
myélofreinateur de choix ; la splénectomie est indiquée lors d’une hypertension portale
symptomatique ou d’une splénomégalie douloureuse réfractaire ; la greffe allogénique de
CSH est justifiée chez les patients éligibles dont la médiane de survie est inférieure à 5 ans
et/ou qui sont réfractaires aux autres traitements. Des essais thérapeutiques de phase I/II
utilisant un inhibiteur de JAK1/JAK2, ont montré une nette amélioration de la qualité de vie
et des signes cliniques (réduction importante de la splénomégalie..) mais sans qu’aucune
modification objective de la myélofibrose ne soit observée. Deux essais de phase III sont
actuellement en cours d’évaluation.
Ces nouvelles stratégies thérapeutiques, dont nous n’avons repris que les grandes
lignes, reposent sur les avancées significatives de la compréhension de la physiopathologie de
la maladie que nous exposons dans le chapitre suivant.
12.4/ Caractéristiques physiopathologiques
Comme nous l’avons exposé précédemment, la myélofibrose primitive associe une
myéloprolifération et une réaction stromale définie par une myélofibrose, une
ostéomyélosclérose et une néoangiogénèse (Figure 36).
119

Figure 36 : Caractéristiques physiopathologiques de la myélofibrose primitiveAdaptée d’après (Le Bousse-Kerdiles & Martyre, 2001) (Lataillade et al., 2008) (Le Bousse-Kerdiles, Praloran, Martyré, & Membres du réseau de recherche clinique Inserm sur la myélofibrose, 2002)
120

12.4.1/ La myéloprolifération
La myéloprolifération se caractérise par une augmentation dans le sang et dans la rate,
du nombre de progéniteurs hématopoiétiques CD34+ (Thiele, Kvasnicka, & Czieslick, 2002).
Le nombre élevé de cellules CD34+ circulantes (jusqu’à 2000 fois) a été initialement
considéré comme un marqueur diagnostique de la maladie (Barosi et al., 2001). Contrairement
aux lymphocytes, dont l’appartenance au clone malin reste discutée, celle des cellules CD34+
est clairement établie (Delhommeau et al., 2007).
Les cellules CD34+ des patients se différencient quasi normalement le long des trois
lignées hématopoïétiques myéloïdes avec, cependant, une prédominance mégacaryocytaire.
Leur prolifération et différenciation in vitro ne sont pas autonomes. Sans qu’elles soient
spécifiques, plusieurs anomalies cellulaires ont été identifiées : i/ prolifération anormale d’une
cellule souche pathologique avec un avantage sélectif sur l’hématopoïèse normale, ii/
hypersensibilité des PH vis-à-vis des cytokines et chimiokines régulatrices (Taksin et al.,
1999). Parmi celles-ci, citons TGF-", PDGF et b-FGF, impliquées dans la pathogénèse de la
myélofibrose mais également SCF, HGF, VEGF, IL-6, IL-8, et SDF-1 participant à
l’amplification des CSH et à leur mobilisation (Lataillade et al., 2008), iii/ hyperplasie et
dysmaturation mégacaryocytaire associées à une expression altérée de l’IL-8 et de ses
récepteurs (Emadi et al., 2005) (Article mis en annexe), des mutations dans le gène du
récepteur Mpl (Pikman et al., 2006) et de l’immunophiline FKBP51 (Giraudier et al., 2002)
iv/ surexpression du gène HMGA2 (Andrieux et al., 2006) (Article en annexe).
Bien que certains marqueurs moléculaires et en particulier la mutation Jak2V617F,
aient été identifiés dans une proportion variable de patients, l’événement moléculaire initial et
les mécanismes responsables de l’avantage prolifératif du clone hématopoïétique ne sont
encore que partiellement connus. La mutation Jak2V617F étant responsable d’une activité
kinase dérégulée (James et al., 2005), son rôle pathogénique dans la prolifération et
l’hypersensibilité des PH dans les MFP est donc vraisemblable. Cette mutation est également
retrouvée dans deux autres SMP, la PV et la TE, qui peuvent évoluer vers un tableau de
myélofibrose secondaire. Plusieurs hypothèses sont actuellement proposées pour expliquer
comment une mutation unique pourrait conduire à trois maladies de phénotypes différents.
Parmi celles-ci, citons : i/ la survenue d’évènements génétiques secondaires résultant ou
générant une instabilité génétique, ii/ des polymorphismes génétiques comme l’haplotype
46/1 (A. V. Jones et al., 2010), iii/ des différences dans le niveau d’activité de la kinase Jak2
121
mutée (conséquence du nombre de copies de l’allèle muté) ou encore de la persistance de
l’allèle normal responsable d’une compétition entre les kinases Jak2 normales et mutées
(James et al., 2005). Cependant la mutation Jak2V617F ne peut expliquer à elle seule la
physiopathologie de la fibrose médullaire, car d’une part, la moitié des patients atteints de
myélofibrose primitive ne présentent pas cette mutation, et d’autre part, Jak2V617F est
également retrouvée dans d’autres hémopathies sans fibrose médullaire.
Depuis longtemps, plusieurs éléments plaidaient en faveur du rôle de MPL dans la
pathogenèse de la myélofibrose primitive : l’hyperplasie mégacaryocytaire et l’autonomie de
croissance d’une partie des mégacaryocytes observées chez les patients ainsi que la fibrose
expérimentale obtenue par surexpression de la TPO chez la souris (Taksin et al., 1999). Une
étude réalisée sur une cohorte importante de patients a confirmé le lien de Mpl avec la
maladie en identifiant deux mutations activatrices situées dans le domaine juxta-membranaire,
MplW515L et MplW515K, chez environ 5 à 15% des patients atteints de MFP (Pardanani et al.,
2006).
Plusieurs résultats illustrent également le rôle déterminant du microenvironnement
hématopoïétique et plus particulièrement des interactions entre cellules hématopoïétiques et
cellules stromales (fibroblastes) dans la dérégulation des cellules CD34+. Les fibroblastes
spléniques des patients présentent des modifications importantes du profil d'expression de
constituants de la matrice extracellulaire, de molécules d'adhérence et de
cytokines/chimiokines (Brouty-Boye et al., 2001). Des expériences de co-cultures croisées
entre cellules CD34+ et fibroblastes de sujets sains et de patients démontrent également la
contribution de ces derniers dans l’expansion du compartiment mégacaryocytaire et la
déficience en cellules lymphocytaires observées chez les patients (Briard et al., 2003). Enfin,
la forte mobilisation des cellules CD34+ et des CS endothéliales (Oppliger Leibundgut et al.,
2006) de la moelle osseuse vers la rate et le foie suggère une altération de leur adhésion au
stroma médullaire. Les mécanismes à l’origine de la mobilisation des PH hors de la moelle
osseuse sont difficiles à étudier au niveau de cet organe compte tenu de la fibrose limitant
l’aspiration cellulaire. Parmi les altérations mises en évidence au niveau sanguin, les taux
plasmatiques élevés de protéases (métalloprotéase MMP9, élastase neutrophile) et de VCAM-
1 soluble (Xu et al., 2005) ainsi qu’une activation des granulocytes (Passamonti et al., 2006)
suggèrent qu’une modification de l’environnement protéolytique de la moelle osseuse
participe très vraisemblablement à cette mobilisation. Comme mentionné précédement, une
diminution de l’expression du CXCR4 (Rosti et al., 2007) résultant, en partie, d’une altération
épigénétique de son promoteur (Bogani et al., 2008) (Article mis en annexe) et une rupture de
122

l’axe SDF-1/CXCL12 par un environnement médullaire devenu extrêmement protéolytique,
pourrait également expliquer leur plus faible rétention dans la moelle osseuse.
12.4.2/ La réaction stromale et les altérations du microenvironnement
L’importance des altérations du stroma médullaire dans la pathogenèse de la maladie
est étayée par le lien entre le degré de fibrose médullaire, la néoangiogenèse et le pronostic
des patients (Mesa, Hanson, Rajkumar, Schroeder, & Tefferi, 2000) (Boveri et al., 2008)
(Vener et al., 2008). Il a été en effet montré une corrélation entre le nombre d’ostéo-
progéniteurs CD146+ et le degré de fibrose dans la moelle (Tripodo et al., 2009). De même, le
degré de fibrose ainsi que le nombre des cellules CD146+ sont associés à un taux
d’hémoglobine faible, suggérant que la progression de la réaction stromale médullaire est
concomitante au déclin d’une hématopoïèse fonctionnelle (Thiele & Kvasnicka, 2006). Alors
que la quantification de la réticuline dans la moelle osseuse n’est pas corrélée à la sévérité de
la maladie, la présence de collagène de type I est souvent associée à un pronostic moins
favorable.
12.4.2.1/ Myélofibrose et Contexte inflammatoire
Il est actuellement admis qu’un déséquilibre entre la synthèse accrue de collagène et
une diminution de sa dégradation joue un rôle clé dans le développement de la fibrose.
Contrairement à la myéloprolifération clonale ou oligoclonale, la prolifération des fibroblastes
médullaires à l’origine de la fibrose médullaire est polyclonale (Thiele & Kvasnicka, 2005).
La réaction du stroma médullaire est un processus multifactoriel qui apparaît secondaire à la
sécrétion inappropriée de cytokines par les cellules hématopoïétiques du clone et en
particulier par les mégacaryocytes, les monocytes activés et les CD34+ pathologiques
(Rameshwar, Denny, Stein, & Gascon, 1994) (Martyre et al., 1994) (Reilly, 2003) (Lataillade
et al., 2008) (Figure 37). Parmi les cytokines potentiellement impliquées, citons le PDGF
(Platelet Derived Growth Factor), le TGF-!1 (Transforming Growth Factor), le FGF basique
(Fibroblast Growth Factor), le PF-4 (Platelet Factor), le VEGF (Vascular Endothelial
Growth Factor), l’EGF (Epidermal Growth Factor), l’IL-1 (Interleukin-1), l’IL-8
(Interleukin-8) et l'ostéoprotégérine (OPG) (Martyre et al., 1994) (Martyre, Magdelenat,
123
Bryckaert, Laine-Bidron, & Calvo, 1991) (Martyre et al., 1997) (Emadi et al., 2005) (J. C.
Wang et al., 2004). Ces facteurs sont non seulement de puissants régulateurs de la biosynthèse
de la matrice extracellulaire mais également des médiateurs de la prolifération des
fibroblastes, des ostéoblastes et des cellules endothéliales.
Cet orage cytokinique qui caratérise la MFP est le lit d’un processus inflammatoire
important dont nous tenterons d’expliquer le rôle dans la pathogenèse de la maladie (§
Chapitre « Résultats »).
12.4.2.2/ Importance du TGF-!1
Le TGF-!1 est un puissant facteur fibrogénique ; il stimule l'expression génique des
collagènes de types I, III et IV, de fibronectine et de protéoglycanes. De plus, son rôle sur la
production d’inhibiteurs de protéases tels que le PF4 favorise le développement de la matrice
extracellulaire. Plusieurs études ont rapporté des taux élévés de TGF-"1 intra-plaquettaire et
montré que les mégacaryocytes circulants des patients produisaient des quantités accrues de
TGF-"1 sous forme latente (Martyre et al., 1991) (Martyre et al., 1994) (Zauli et al., 1993).
Alors que son expression n’est pas modifiée dans les cellules CD34+ de patients, celle de son
récepteur de type II est diminuée dans ces cellules (Le Bousse-Kerdiles et al., 1996). Il en
résulte une dérégulation de la voie de signalisation TGF-"1 à l’origine d’une diminution de la
sensibilité des CSH/PH à l’action inhibitrice du TGF-"1. La raison de cette diminution
d’expression n’est pas idenfiée car le gène TGF-"1RII ne présente pas de mutations et son
promoteur ne semble pas hyperméthylé (Hemavathy et al., 2006).
Plus récemment, le rôle majeur du TGF-"1 dans la promotion de la fibrose a été
confirmé dans un modèle murin de myélofibrose obtenue par sur-expression de la
thrombopoïétine (TPO) (Villeval et al., 1997) (Chagraoui et al., 2002). Ces résultats
démontrent que mégacaryocytes et TGF-" sont étroitement liés à la pathogenèse de la
fibrose ; compte tenu de son activité angiogénique, le TGF-"1 pourrait également participer à
la néoangiogenèse observée dans la maladie.
124

12.4.2.3/Ostéomyélosclérose et Néoangiogenèse
Les mécanismes à l’origine de l’ostéosclérose et de la néoangiogenèse, qui font partie
intégrante de la réaction stromale, sont actuellement moins bien connus que ceux de la fibrose
médullaire. Une augmentation de la production d’ostéoprotégérine (OPG), une protéine clé de
l’ostéogenèse, par les cellules stromales, les ostéoblastes et cellules endothéliales a été décrite
chez les patients (J. C. Wang et al., 2004) et dans le modèle TPO (Chagraoui et al., 2003). En
bloquant l’interaction entre RANK et RANKL, l’ostéoprotégérine inhibe l’ostéoclastogenèse,
participant ainsi au mécanisme de l’ostéosclérose (J. C. Wang et al., 2004). L’implication
potentielle de l’OPG dans les complications vasculaires fréquemment observées chez les
patients renforce l’hypothèse du rôle de cette molécule dans la pathogenèse de la MFP. Les
BMP (Bone Morphogenetic Protein), synthétisées par les MK et les cellules stromales,
pourraient également jouer un rôle dans la prolifération des ostéoblastes. La mise en évidence
d’une altération de l’expression de gènes codant pour les BMP et/ou leurs récepteurs chez les
patients conforte cette hypothèse (Bock et al., 2008) (résultats non publiés MC. Le Bousse-
Kerdilès et al.; 2011). De même, il a été proposé qu’une production augmentée de VEGF et de
bFGF par les MK pathologiques pourrait expliquer la néovascularisation qui accompagne la
réaction stromale. Enfin, une mobilisation précoce des progéniteurs endothéliaux dans le sang
périphérique participerait à la néoangiogenèse observée dans la rate (Massa et al., 2005).
12.4.2.4/ Rôle clé du mégacaryocyte
Le mégacaryocyte est une cellule clé du processus fibrotique et de la réaction stromale
qui caratérise la MFP. Comme nous l’avons précisé ci-dessus, il secrète, de façon
anormalement élevée, de nombreux facteurs tels que le PDGF, TGF-"1, EGF, bFGF et
calmoduline qui exerce un rôle déterminant dans la génèse de la fibrose (Figure 37). En effet,
le TGF-"1 régule la synthèse de la matrice extracellulaire et augmente la transcription de
gènes codant pour la fibronectine, les collagènes de types I, III, IV et la ténascine. Le PDGF
également produit par les mégacaryocytes des patients stimule la prolifération, la division
cellulaire et la migration des fibroblastes (Castro-Malaspina, 1984). La calmoduline,
principalement secrétée par les plaquettes, est anormalement élevée dans les urines de patients
et joue un rôle mitogène sur le fibroblaste (Dalley, Smith, Reilly, & Neil, 1996). De même, le
125

bFGF, fortement exprimé dans les plaquettes et les mégacaryocytes des patients (Martyre et
al., 1997) stimule la prolifération des fibroblastes (Gospodarowicz, Ferrara, Schweigerer, &
Neufeld, 1987) et l’angiogénèse (Schelling, 1991). En dehors des MK, les monocytes jouent
également un rôle actif dans cette production cytokinique, en particulier dans celle du TGF-"1
et de l’IL-1 (Rameshwar, Chang, & Gascon, 1996). Il en résulte une augmentation des
glycoprotéines interstitielles et membranaires ainsi qu’une augmentation de la concentration
sérique du carboxy-terminal peptique du procollagène de type I (PICP), de l’amino-terminal
peptide du procollagène de type III (PIIIP), du collagène du type IV, des peptides relatifs à la
laminine.
126

Figure 37: Rôle des facteurs de croissance produits par les cellules du clone
hématopoïétique dans le processus fibrotique D’après (Le Bousse-Kerdiles & Martyre, 2001) (Reilly, 2003)
127
12.4.3/ Le modèle physiopathologique
Alors que l’évènement moléculaire initial à l’origine de l’apparition du clone pathologique
reste encore inconnu, l’altération des voies de signalisation (Jak/STAT, Tpo/MPL..) associées
aux récepteurs à tyrosine kinase, consécutives en particulier aux mutations Jak2 et MPL,
participe très vraisemblablement à l’amplification du clone pathologique. Des altérations de
l’expression et/ou de la transcription des facteurs de transcription érythro-mégacaryocytaires
et en particulier de GATA-1, interviendraient également dans la myéloprolifération et la
dysmégacaryopoïèse qui caractérisent la MFP (Steunou et al., 2003) (Vannucchi et al., 2002).
Une altération du dialogue entre les CSH pathologiques et les cellules stromales des
niches hématopoïétiques serait à l’origine de la tempête cytokinique initiée par les cellules du
clone et en particulier, les mégacaryocytes. L’augmentation de la production de facteurs de
croissance hématopoïétiques, fibrogéniques et angiogéniques par ces cellules stimulerait la
réaction stromale conduisant à la myélofibrose, l’ostéosclérose et la néoangiogenèse. En
retour, les cellules stromales activées participeraient à la prolifération des cellules du clone
hématopoïétique et en particulier à l’expansion du compartiment mégacaryocytaire au
détriment du lymphocytaire (Briard et al., 2003). Un déséquilibre des niches endostéales et
vasculaires interviendrait alors dans la prolifération clonale des cellules souches
hématopoïétiques et leur mobilisation de la moelle osseuse vers le sang. Ce déséquilibre
conduirait à une augmentation des cellules souches circulantes et à un déplacement de
l’hématopoïèse médullaire vers les sites d’hématopoïèse extra-médullaires tels que la rate et la
foie. Dans ces organes, les cellules souches mésenchymateuses/fibroblastes et les progéniteurs
endothéliaux contribueraient à la création d’un microenvironnement favorable à la
prolifération et à la différenciation de CSH pathologiques (Lataillade et al., 2008) (Figure 38).
Ainsi, la MFP peut être considérée comme une maladie de la CSH (bad seed) dans
laquelle une altération des niches hématopoïétiques participe très vraisemblablement au
développement du clone pathologique (bad soil), d’où le concept de « Bad seed in bad soil »
que nous avons revisité (Lataillade et al., 2008).
128

Figure 38 : Modèle physiopathologique « Bad Seed in Bad Soil »D’après (Lataillade et al., 2008) ; Abréviations : Oc (ostéoclaste), Ob (ostéoblaste), Fb (fibroblaste), Mk (mégacaryocyte).
129
12.5/ Les modèles animaux
On ne peut conclure ce chapitre sur la MFP sans parler des modèles murins
expérimentaux qui ont permis d’apporter des éléments importants dans la compréhension de
cette maladie. Parmi les modèles les plus anciens, celui des souris infectées par le rétrovirus
sarcomatogène myéloprolifératif (MPSV). La néoplasie qu’il provoque partage de
nombreuses caractéristiques cliniques et biologiques avec la pathologie humaine, notamment
une myéloprolifération accompagnée d’une myélofibrose et d’une néoangiogenèse (Le
Bousse-Kerdiles et al., 1992). Plus récemment, d’autres modèles murins induits par la
surexpression de la TPO, la sous-expression de GATA-1 ou bien encore la transfection des
mutations Jak2V617F ou MPL515 ont été développés.
Les modèles de surexpression de la Tpo provoquent une hyperplasie mégacaryocytaire
avec une hématopoïèse extramédullaire conduisant à une splénomégalie, une thrombocytose
importante et une myélofibrose réversible à l’arrêt des injections (Villeval et al., 1997)
(Wagner-Ballon et al., 2006).
Compte tenu du rôle de GATA-1 dans la MFP (Martyre, Steunou, LeBousse-Kerdiles,
& Wietzerbin, 2003), un modèle de souris trangéniques avec une sous-expression de GATA-1
(facteur de transcription important pour la mégacaryopoïèse), appellées GATA-1low, a été
developpé (Vannucchi et al., 2002). Les souris exprimant trop de GATA-1 présentent une
augmentation de la différenciation érythroïde (Farina, Girard, Vanin, Nienhuis, & Bodine,
1995) alors que les souris déficientes pour le gène GATA-1 meurent in utero d’une anémie
sévère (Pevny et al., 1991). Les souris GATA-1low sont viables et présentent après 12 à 18
mois de vie, une maladie proche de la MFP avec notamment une anémie, une fibrose
médullaire, une ostéosclérose et une hématopoïèse extramédullaire hépatosplénique. Les
mégacaryocytes de la moelle de ces souris sont hyperplasiques, dystrophiques et groupés en
amas (Vannucchi et al., 2002).
Plus récemment, différentes équipes ont developpé des modèles de souris trangéniques
pour les mutations Jak2V617F et MPL515 qui miment un néoplasme myéloprolifératif plus
ou moins rapide et de phénotypes différents : les souris Jak2V617F présentent une pathologie
proche de la PV alors que les souris MPL515 développent un SMP rapide évoluant vers une
fibrose médullaire (Pikman et al., 2006) (Tefferi, 2008b). Enfin, l’expression constitutive de la
mutation JakV617F à l’état hétérozygote provoque un SMP de type PVet non, de type TE
comme attendu, évoluant avec l’âge des souris, vers une myelofibrose secondaire (Marty et
al., 2010).
130

OBJECTIFS DU TRAVAIL
131

132

La myélofibrose primitive est un néoplasme myéloprolifératif chronique BCR-ABL1-
négatif associant une myéloprolifération et une altération du stroma hématopoiétique dans
laquelle le mégacaryocyte est un acteur majeur, via une production exacerbée de cytokines et
facteurs fibrosants.
Plusieurs travaux récents sont en faveur de l’implication d’anomalies géniques telles
que les mutations JAK2V617F et MPL515L/K dans la dérégulation de l’hématopoïèse et de la
dysmégacaryopoïèse. Cependant, seuls 50% des patients atteints de MFP présentent la
mutation JAK2V617F et un plus faible pourcentage encore portent les mutations MPL,
suggèrant que ces mutations ne sont pas l’événement initial de ces hémopathies. Cette
hypothèse est d’autant plus vraisemblable que les premiers essais cliniques réalisés avec des
inhibiteurs de Jak2 montrent une efficacité remarquable sur la splénomégalie et l’état général
des patients sans pour autant augmenter leur durée de vie ni diminuer les anomalies du
stroma. Ces résultats soulignent l’importance de rechercher d’autres anomalies, géniques ou
non, impliquées dans le processus pathogénique et en particulier dans la dysmégacaryopoïèse
qui caractérise la MFP.
L’objectif de mon travail de thèse a été de rechercher de telles autres anomalies en
développant, parallèlement à deux approches génomiques complémentaires (transcriptome et
CGH array), une démarche de biologie cellulaire ciblée sur le rôle du microenvironnement.
Après avoir comparé les profils génomiques obtenus par ces deux techniques, nous nous
sommes orientés vers la région 13q pour les raisons suivantes : 1) elle est délétée de façon
récurrente mais non spécifique chez les patients et 2) elle comprend le gène FLT3 dont le
transcrit est dérégulé dans la MFP. Compte tenu de l’action de Flt3 et de son ligand Flt3-
ligand sur l’hématopoïèse, j’ai ensuite recherché si le couple Flt3-ligand/Flt3 était impliqué
dans la dérégulation de l’hématopoïèse chez les patients.
Les résultats que j’ai obtenus m’ont permis de montrer que le couple Flt3-ligand/Flt3
participe à la dysmégacaryopoïèse qui caractérise la MFP, via une activation soutenue des
MAPK et en particulier des MAPKs p38. Ces résultats font l’objet d’une publication qui vient
d’être acceptée dans le journal « Cancer Research » en 2011 et qui est le sujet principal de ma
thèse. Cette publication s’intègre dans un ensemble de 6 autres manuscrits (cf. annexes),
abordant la recherche de différents marqueurs biologiques de la maladie, auxquels j’ai
participé et qui ont été évoqués dans l’introduction.
133

134

MATERIEL ET METHODES
135

136
Dans ce chapitre ne sont détaillées que les techniques non décrites dans les
publications intégrées à ce mémoire.
1/ Technique de détection de la mutation Jak2V617F
La détection de la mutation JAK2V617F a été réalisée sur la fraction ADN de
l’extraction au TRIZOL (Invitrogène, France) des cellules myéloïdes de patients (Cellules
mononucléées circulantes, cellules CD34+, plaquettes, mégacaryocytes). Pour ceci, 1ml
d’éthanol a été ajouté à la phase phénolique après l’étape d’extraction du trizol par
l’isopropanol. Le mélange a été centrifugé 5 minutes à 4000 tours/minutes, puis après lavage,
le culot a été dissout dans 10 µl de tampon Tris/EDTA 10/1 (TE). A partir de 10 ng d’ADN,
une amplification spécifique par polymérisation en chaine (PCR) en temps réel a été réalisée
par la technologie Lightcycler (Roche) en utilisant les amorces sens 5’-
ggCAgAgAgAATTTTCTgACC et antisens 5’-gCTTTCCTTTTTCACAAgATA. Des sondes
spécifiques placées sur la position de la mutation ont été utilisées pour effectuer le transfert
d’énergie des fluorochromes nécessaire à la détection du « fluorescence resonance energy
transfert » (FRET) pour révéler la réaction : une amorce sensitive sur la séquence sauvage
gTCTCCACAgACACATACTCCATAA-FITC et une sonde d’ancrage juxtaposée LC640-
AAAACCAAATgCTTgTgAgAAAgC-Phosphate. La réaction de PCR a été réalisée en
utilisant le kit Fast Start Hybridization Probe Kit (Roche) avec une concentration de MgCl2
de 3,5 µM, 5 pmol de chaque sonde et 5 pmol de chaque primer. L’analyse des courbes de
fusion des réactions a été faite sur le lightcycler après 35 cycles d’amplification : 95°C pour la
dénaturation, 60°C pour l’hybridation, 72°C pour l’élongation. L’ADN de la lignée cellulaire
HEL a été utilisé comme contrôle positif (JAK2V617F) et l’ADN de la lignée cellulaire K562
comme contrôle négatif (JAK2 non muté).
2/ Hybridation Génomique Comparative (CGH array)
Cette technique repose sur une hybridation comparative de l’ADN extrait de cellules
normales vs. pathologiques et permet une analyse génomique quantitative.
137
2.1/ Obtention des populations cellulaires pour la CGHarray
Le sang périphérique des patients MFP est prélevé sur EDTA. Les cellules
mononucléées ont été obtenues par centrifugation sur un gradient de densité de type Ficoll et
congélation à -80°C à raison de 10 millions de cellules/ampoule.
Les cellules érythrocytaires contenues dans le culot cellulaire du Ficoll sont lysées et
les cellules polynucléées (PN) sont récupérées par centrifugation. Les PN sont lavés 3 fois
dans du NaCl 9 g/l puis le phénotype CD15+ des PN est vérifié par cytométrie en flux. Les
cellules (10 millions/ampoule) sont ensuite congelés à -80°C.
Les cellules mononucléées sont mises à adhérer en milieu RPMI+10% de SVF
pendant 16 heures en atmosphère humide avec 5% de CO2 pour éliminer les cellules
adhérentes. Après un marquage avec un anticorps anti-CD34 couplé à des billes magnétiques,
une sélection positive sur colonne immuno-magnétique (Miltenyi) a été réalisée sur la
suspension cellulaire afin d’isoler les PH CD34+ du sang circulant. Un contrôle de pureté des
cellules ainsi purifiées est effectué au cytomètre en flux et des culots secs contenant 1 million
de cellules CD34+ sont directement congelés à -80°C.
2.2/ Extraction de l’ADN cellulaire pour la CGH array
Les culots secs sont décongelés puis lysés pendant 16 heures en présence du tampon
de lyse suivant : 1 ml par million de cellules (NaCl 200 mM, EDTA 20 mM, Tris 40 mM pH
= 8.0, dodécyl sulfate de sodium 0.5%) et 10 µl de protéinase K à 20 mg/µl (Roche, Meylan).
Deux volumes de phénol/chloroforme/alcool isoamylique : 25/24/1 (Invitrogen, Cergy
Pontoise) sont ajoutés. Après homogénéisation manuelle pendant 5 min, une centrifugation de
10 min à 3000 rpm est réalisée. La phase supérieure est transférée dans un nouveau tube en y
ajoutant 2 volumes de chloroforme. Après une centrifugation de 10 min à 3000 rpm, la phase
supérieure est transférée dans un nouveau tube en y ajoutant 0.1 volume d’acétate de sodium
3M (pH = 5.0) et 3 volumes d’éthanol à 96° froid. Une agitation manuelle est réalisée pour
précipiter l’ADN. Après une centrifugation de 10 min à 3000 rpm, la phase liquide est
éliminée et 3 volumes d’éthanol à 70° froid sont ajoutés. Après une nouvelle centrifugation
de 10 min à 3000 rpm, la phase liquide est éliminée. Les culots d’ADN sont séchés 5 min à
l’air libre et re-suspendus dans 50 µl de Tris 10mM/EDTA 1 mM (TE 10/1). Les ADN sont
quantifiés au Nanodrop (Nyxor) et leur qualité est vérifiée en gel d’agarose à 1%.
2.3/ Amplification globale du génome des cellules CD34+
L’analyse du génome des cellules CD34+ par CGH array nécessite une quantité initiale
de 1.5µg d’ADN. Pour atteindre cette quantité de matériel, l’ADN des cellules CD34+
138

purifiées a été soumis à une amplification globale par la polymérase Phi29 (GenomiPhi,
Amersham). L’analyse de la mutation Jak2V617F a été réalisée avant et après amplification et
a révélé un biais allélique inférieur à 0.5%.
2.4/ Synthèse des sondes de CGH array et hybridation
Une quantité de 1.5 µg d’ADN par échantillon est digérée à l’aide 10 unités d’enzyme
de restriction DpnII (Biolabs) pendant 1 heure à 37°C deux fois consécutivement, puis
l’enzyme est inactivée par une incubation de 10 min à 65°C. Les ADN digérés sont purifiés
sur colonne Qiaquick (Qiagen, Courtaboeuf). La digestion est contrôlée en gel d’agarose à
0.8%. Le marquage des sondes avec les cyanines (Cy3 : contrôle normal et Cy5 : ADN
patients MMM) est effectué au cours de la réaction de « random priming » avec le kit
Bioprime DNA labelling System (Invitrogen). Les cyanines employées au cours de
l’incorporation sont la cyanine 3 NEL576 (Perkin) (3 nmol) pour l’ADN normal et la cyanine
5 NEL577 (Perkin) (3 nmol) pour l’ADN pathologique. Les sondes marquées sont purifiées
sur un concentrateur Microcon YM30 (Millipore). La sonde « normale » (Cy3) et la sonde
« pathologique » (Cy5) sont précipitées en présence de DNA Cot-1 humain (Invitrogen), 0.1
volume d’acétate de sodium 3M et 2.5 volumes d’éthanol à 95°. La sonde est ensuite reprise
dans du tampon d’hybridation (50% formamide, 2X SSC pH = 6.8, 1X Denhardt, 1% SDS, 40
mM NaH2PO4 pH = 7, 10% Dextran sulfate) puis incubée à 37°C. Elle est alors déposée sur
une lame CGH array de type BAC (Institut Curie, Paris) prétraitée puis recouverte d’une
lamelle. La lame est ensuite incubée dans une chambre d’hybridation à 37°C pendant 20 à 24
heures. Le lendemain, les lames sont lavées dans le tampon 0.5X SSC 0.03% SDS pendant 5
min à 65°C, puis séchées par centrifugation et lues grâce à un scanner Axon 4000B avec le
logiciel Genepix.
2.5/ Normalisation des données et interprétation chromosomique
Sur le serveur de l’institut Curie, l’étape de normalisation des données de la lame
scannée est double : il s’agit en premier lieu d’exclure de l’analyse ultérieure les dépôts
incorrectement analysés et de corriger les biais dus aux défauts d’incorporation des cyanines.
Les dépôts en triplicate doivent avoir un coefficient de variation inférieur à 0.1 et le rapport
signal sur bruit de fond doit être supérieur à 3. Les clones normalisés sont alors croisés avec
une base de données permettant d’identifier la marche chromosomique pour chaque dépôt
interprétable.
139

3/ Analyse transcriptomique des cellules CD34+
L’ARN total des cellules CD34+ des différents échantillons a été extrait par la méthode
utilisant le réactif Trizol (Initrogène). En détail, 100.000 à 1.000.000 cellules CD34+ purifiées
ont été lysées dans 500 µl de Trizol puis congelées à -80°C jusqu’à utilisation. Après
décongélation, 100 µl de chloroforme a été ajouté sur la phase du trizol et les échantillons ont
été homogénéisés. Après décantation durant 5 minutes, les suspensions ont été centrifugées à
11500 tours/minutes pendant 15 minutes à 4°C. La phase aqueuse a été transférée dans un
nouveau tube auquel il a été ajouté 250 µl d’isopropanol froid et les échantillons ont été
homogénéisés. Après décantation à -20°C durant 2 heures, les suspensions ont été
centrifugées à 11500 tours/minutes pendant 15 minutes à 4°C. Les culots ont ensuites été
lavés avec 500 µl d’éthanol 70% froid puis centrifugés à 11500 tours/minutes pendant 15
minutes à 4°C. Les culots ont été dissous dans 10 µl d’eau RNase free. L’ARN total a été
dosé grâce à la technologie Nanodrop et la qualité des échantillons a été vérifiée sur le
bioanalyseur (Agilent Technologies).
Les sondes microarrays ont été synthétisées à l’aide du kit d’amplification linéaire
(Agilent Technologies) et marquées par la cyanine 5 pour les échantillons individuels et par la
cyanine 3 pour la sonde de référence (mélange de l’ensemble des échantillons). Ces sondes
ont permis d’hybrider des biopuces 22k A version 1 Human (Agilent Technologies). Les
données ont été extraites et normalisées par le logiciel Features Extraction (Agilent
Technologies) en utilisant l’algorithme « Locally Weighted Scatter Plot Smoothing »
(LOWESS). Les analyses des données de microarray ont ensuite été traitées en utilisant le
logiciel MultiExperiment Viewer (Mev 3.0, Institute for Genomic Research, Rockville, MD,
USA). Les gènes exprimés différentiellement ont été identifiés en utilisant l’algorithme
« Significance Analysis for Microarray » (SAM) avec un « False Discovery Rate » (FDR)
inférieur à un 1 et un « Fold Change » supérieur à 1. La classification des gènes sélectionnés a
été réalisée avec l’algorithme HCL « Hierarchical Clustering » au sein du logiciel Mev 3.0.
L’interprétation fonctionnelle des données microarray a été effectuée grâce au site Web
DAVID du NIH (Washington).
140

RESULTATS EXPERIMENTAUX
141

142
1/ Contexte des travaux
La myélofibrose primitive est un néoplasme myéloprolifératif caractérisé par une
myéloprolifération clonale impliquant les trois lignées myéloïdes (érythroïde,
mégacaryocytaire, granulo-monocytaire) associée à une myélofibrose, une néoangiogenèse et
une ostéomyélosclérose. Les techniques cytogénétiques classiques (Caryotypes, FISH, CGH
sur métaphase) n’ont permis d’identifier une anomalie cytogénétique que dans 30 à 50 % des
cas. De plus, la présence de la mutation JAK2 V617F chez seulement la moitié des patients
suggère que d'autres anomalies moléculaires sont très probablement impliquées dans la
pathogenèse de la maladie.
J’ai tout d’abord recherché l’existence de modifications chromosomiques, non
détectées par les techniques cytogénétiques classiques, dans différentes populations cellulaires
appartenant au clone pathologique (cellules mononucléées, polynucléaires CD15+ et cellules
CD34+ sanguins). Ceci a été réalisé par hybridation génomique comparative (1 mégabase) sur
puces de type BAC (Bactérial Artificial Chromosome). Nos résultats ont permis de
caractériser des zones d’intérêts, majoritairement des zones de délétions, dans l’ADN des
polynucléaires de patients MFP. La région chromosomique 12q14.1-21.33 semble
particulièrement impliquée, confirmant les données cytogénétiques de 2 patients où une
translocation récurrente a été détectée dans la région chromosomique 12q15 et plus
particulièrement dans le gène HMGA2. Ce travail a conduit à étudier l’expression du gène
HMGA2 dans les granulocytes CD15+ et les PH CD34+ circulants et à montrer que,
contrairement aux sujets sains, une augmentation de l’expression du transcrit est observée
dans dans les cellules de patients (n=24) quelque soit leur stade de différenciation. Ces
résultats ont fait l’objet d’une publication que je cosigne en 8e auteur dans le journal
« Leukemia and Lymphoma » (Annexe n°3 ; Andrieux et al. Sept 2006 ; 47 (9) : 1956-1959).
Nous avons ensuite réalisé une étude en CGH array sur les granulocytes CD15+
(appartenant au clone pathologique) de 11 patients atteints de MFP afin d’étudier la région
chromosomique encadrant le locus HMGA2 et de rechercher la présence d’autres anomalies
fines de type « gain/délétion », ne pouvant être décelées en cytogénétique conventionnelle. La
mutation JAK2 n’ayant pas encore été décrite lorsque ce travail a été initié, cette étude a été
complétée par une recherche de polymorphismes de type SNP afin d’identifier des pertes
143
d’hétérozygotie. En parallèle, une analyse transcriptomique a été réalisée dans les cellules
CD34+ et les mégacaryocytes des patients pour tenter d’établir ainsi un lien transcriptionnel à
nos observations génomiques.
Comme nous le verrons dans les paragraphes suivants, l’étude en CGH array (cf.
paragraphe §2.1.) a révélé que 4 patients sur les 11 analysés et dont l’index de
myéloprolifération était élevé, présentaient plusieurs délétions associées à la délétion 12q14-
q21 telles que des délétions 12p13.1-13.2 (impliquant ETV6 et P27), 13q12-13q14
(impliquant Rb) et 20q11-q13 (impliquant P107). Le transcriptome (cf. paragraphe §2.2.), a
identifié plusieurs gènes, dont FLT3, avec une expression dérégulée chez les patients quelque
soit leur status JAK2 (analysé rétrospectivement).
2/ Recherche d’anomalies moléculaires participant à la pathogenèse de la Myélofibrose primitive
2.1/ Apport de la CGH array pangénomique
La myélofibrose primitive étant une maladie « clonale » de la cellule souche
hématopoïétique, nous avons respecté la hiérarchie hématopoïétique en analysant l’ADN de
progéniteurs CD34+ et de cellules différenciées, les polynucléaires CD15+. Ces ADNs ont été
utilisés comme sondes, marqués à l’aide de fluorochromes et hybridés différentiellement sur
une puce de type BAC. Ces puces ont été conçues par le programme national de « Carte
d’identité tumorale » (CIT) de la Ligue contre le Cancer (Alain Aurias). La figure 39 illustre
la démarche expérimentale que nous avons suivie.
Nous avons observé des variations quantitatives moyennes d’ADN dans les deux types
cellulaires étudiés (CD34+ et polynucléaires) chez les patients MFP. Certaines de ces
anomalies ne sont retrouvées que dans un seul type cellulaire ; il s’agit essentiellement
d’amplifications dans les régions subtélomériques principalement observées dans les cellules
CD34+. D’autres anomalies, majoritairement des trisomies 1q, des délétions 12q, 13q, 17p et
17q, 20q et des amplifications du chromosome 22, sont retrouvées dans les deux types
cellulaires (figure 40). Toutes ces anomalies ont déjà été décrites et répertoriées
précédemment par des techniques de cytogénétique conventionnelle comme le caryotype (§
Introduction). Les amplifications du chromosome 22 correspondent à des anomalies
144
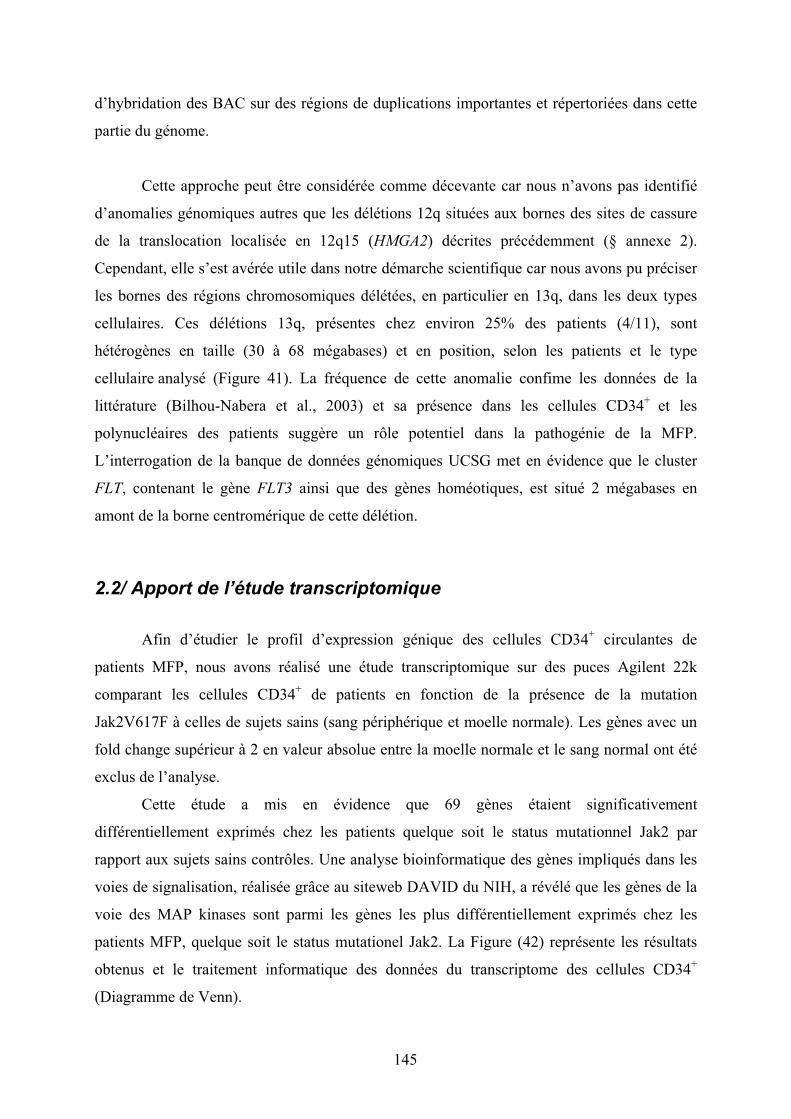
d’hybridation des BAC sur des régions de duplications importantes et répertoriées dans cette
partie du génome.
Cette approche peut être considérée comme décevante car nous n’avons pas identifié
d’anomalies génomiques autres que les délétions 12q situées aux bornes des sites de cassure
de la translocation localisée en 12q15 (HMGA2) décrites précédemment (§ annexe 2).
Cependant, elle s’est avérée utile dans notre démarche scientifique car nous avons pu préciser
les bornes des régions chromosomiques délétées, en particulier en 13q, dans les deux types
cellulaires. Ces délétions 13q, présentes chez environ 25% des patients (4/11), sont
hétérogènes en taille (30 à 68 mégabases) et en position, selon les patients et le type
cellulaire analysé (Figure 41). La fréquence de cette anomalie confime les données de la
littérature (Bilhou-Nabera et al., 2003) et sa présence dans les cellules CD34+ et les
polynucléaires des patients suggère un rôle potentiel dans la pathogénie de la MFP.
L’interrogation de la banque de données génomiques UCSG met en évidence que le cluster
FLT, contenant le gène FLT3 ainsi que des gènes homéotiques, est situé 2 mégabases en
amont de la borne centromérique de cette délétion.
2.2/ Apport de l’étude transcriptomique
Afin d’étudier le profil d’expression génique des cellules CD34+ circulantes de
patients MFP, nous avons réalisé une étude transcriptomique sur des puces Agilent 22k
comparant les cellules CD34+ de patients en fonction de la présence de la mutation
Jak2V617F à celles de sujets sains (sang périphérique et moelle normale). Les gènes avec un
fold change supérieur à 2 en valeur absolue entre la moelle normale et le sang normal ont été
exclus de l’analyse.
Cette étude a mis en évidence que 69 gènes étaient significativement
différentiellement exprimés chez les patients quelque soit le status mutationnel Jak2 par
rapport aux sujets sains contrôles. Une analyse bioinformatique des gènes impliqués dans les
voies de signalisation, réalisée grâce au siteweb DAVID du NIH, a révélé que les gènes de la
voie des MAP kinases sont parmi les gènes les plus différentiellement exprimés chez les
patients MFP, quelque soit le status mutationel Jak2. La Figure (42) représente les résultats
obtenus et le traitement informatique des données du transcriptome des cellules CD34+
(Diagramme de Venn).
145

Figure 39 : Schéma expérimental de la CGH array pangénomique.L’ADN des cellules CD34+ et des polynucléaires circulants de patients MFP a été hybridé différentiellement à celui de cellules mononucléées de moelle osseuse de sujet sain. Au préalable, l’ADN des cellules CD34+ a été amplifié par l’ADN polymérase Phi29 afin d’obtenir la quantité d’ADN requise. Abrévations : BAC : « bacterial artificial chromosome », CIT : programme Carte d’Identité des Tumeurs, MNC : cellules mononucléées.
146
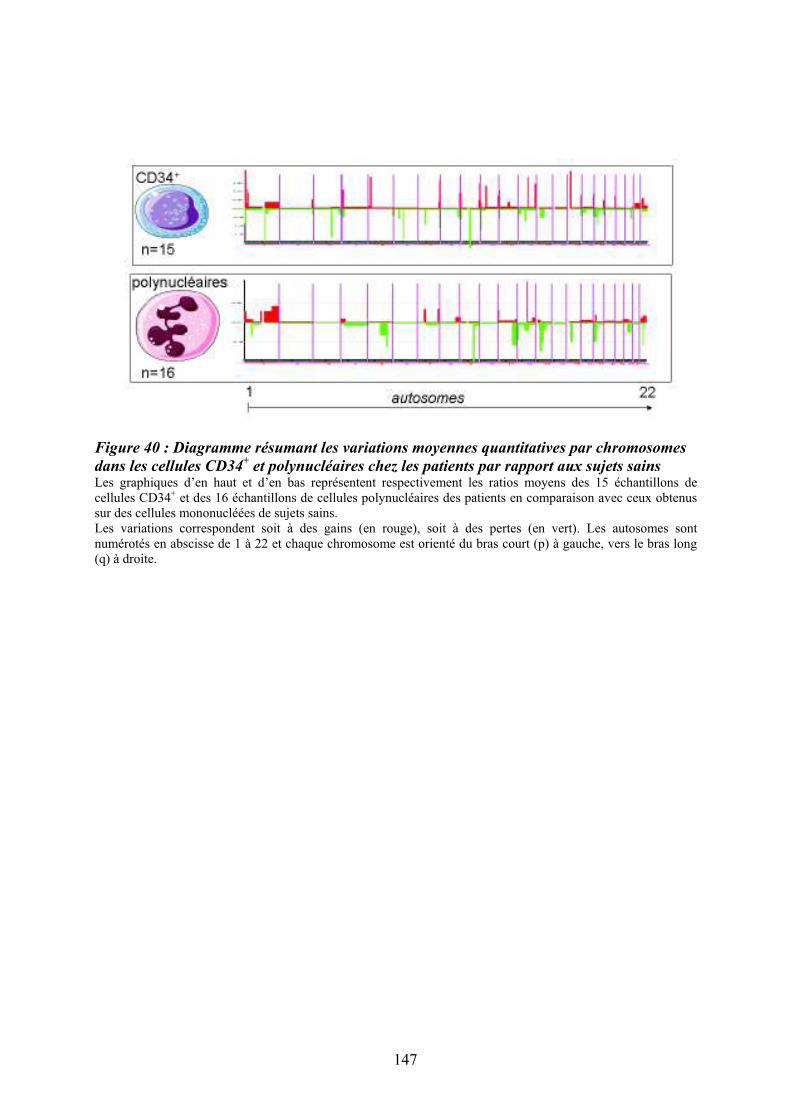
Figure 40 : Diagramme résumant les variations moyennes quantitatives par chromosomes
dans les cellules CD34+ et polynucléaires chez les patients par rapport aux sujets sains
Les graphiques d’en haut et d’en bas représentent respectivement les ratios moyens des 15 échantillons de cellules CD34+ et des 16 échantillons de cellules polynucléaires des patients en comparaison avec ceux obtenus sur des cellules mononucléées de sujets sains. Les variations correspondent soit à des gains (en rouge), soit à des pertes (en vert). Les autosomes sont numérotés en abscisse de 1 à 22 et chaque chromosome est orienté du bras court (p) à gauche, vers le bras long (q) à droite.
147
Figure 41: Cartographie des délétions 13q dans les cellules CD34+ et les polynucléaires de
patients atteints de MFP par CGH array pan-génomique Le cluster génomique « FLT » délimité sur le site internet « génomique UCSG genome browser » comprenant notamment le gène FLT3, est localisé en amont des délétions 13q cartographiées en CGH array.
148
Parmi ces 69 gènes, nous retrouvons notamment le transcript Flt3, sous-exprimé dans
les CD34+ de patients MFP. En collaboration avec le groupe de Stéphane Giraudier (U1009;
IGR, Villejuif), nous avons réalisé en parallèle une analyse transcriptomique sur les
mégacaryocytes, des cellules clés du processus pathogénique (§ Introduction). De façon
intéressante, FLT3 est l’un des rares gènes impliqués dans l’hématopoièse dont l’expression
était modulée dans les deux types cellulaires (diminuée dans les CD34+ et augmentée dans les
mégacaryocytes). Flt3 est le récepteur du facteur de croissance Flt3-ligand, produit
principalement par les cellules stromales. Alors que son rôle dans la prolifération des
progéniteurs hématopoïétiques primitifs est bien connu, son action sur la mégacaryopoïèse est
controversée.
Lorsque nous avons comparé les données de CGH array et du transcriptome ciblé sur
la région 13q, nous avons mis en évidence que l’expression des gènes inclus dans la zone de
délétion 13q (Figure 43) ainsi que ceux du cluster « FLT » et en particulier FLT3, était
modulée dans les cellules CD34+ des patients. Le fait que le gène FLT3 soit situé 2 mégabases
en amont de la borne de délétion suggère que la dérégulation de son expression n’est
vraisemblablement pas la conséquence directe d’une anomalie génétique quantitative.
D’autres mécanismes tels qu’une dérégulation de type épigénétique pourraient être impliqués.
Nous avons initié une étude portant sur le rôle potentiel de la méthylation et de l’acétylation
sur l’expression de Flt3 et sur la migration des mégacaryocytes (Flt3-ligand)-dépendante.
L’ensemble de ces données a orienté mon travail vers l’étude du rôle de Flt3 et de son
ligand Flt3-ligand, dans la dérégulation de l’hématopoïèse et plus particulièrement dans la
dysmégacaryopoïèse chez les patients atteints de myélofibrose primitive. Les résultats que
nous avons obtenus sont exposés dans le manuscrit suivant qui vient d’être accepté pour
publication dans le journal « Cancer Research ».
149
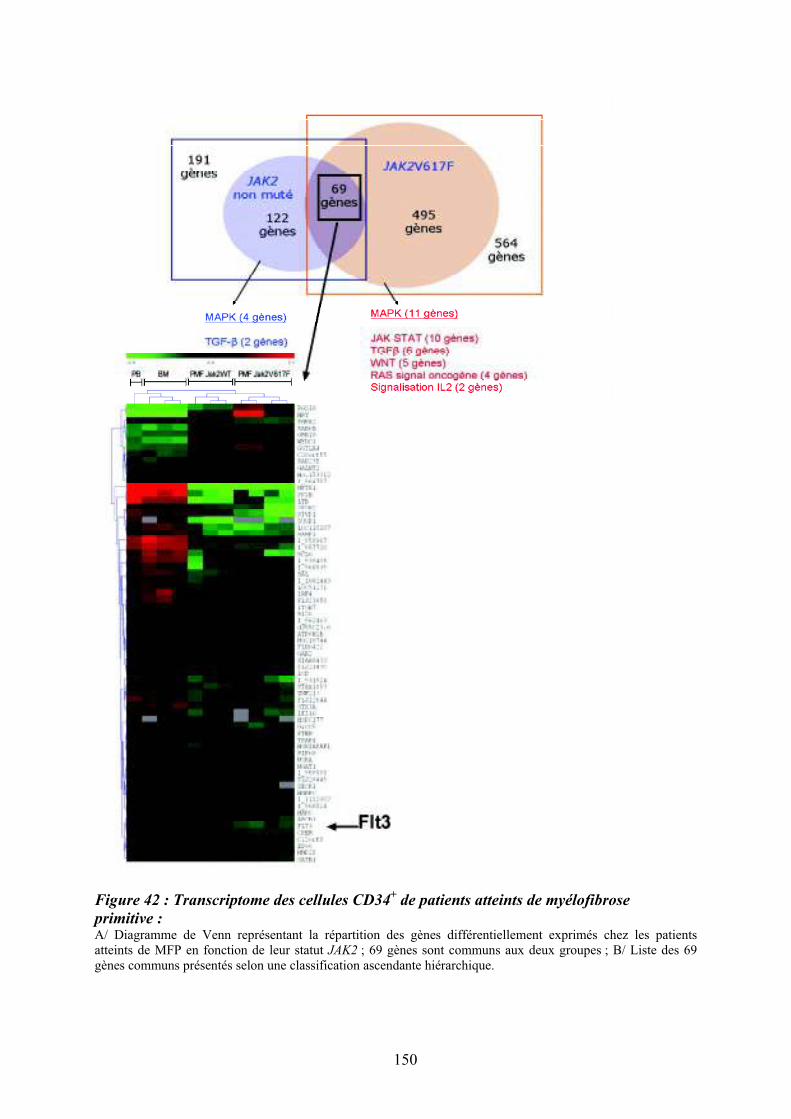
Figure 42 : Transcriptome des cellules CD34+ de patients atteints de myélofibrose
primitive : A/ Diagramme de Venn représentant la répartition des gènes différentiellement exprimés chez les patients atteints de MFP en fonction de leur statut JAK2 ; 69 gènes sont communs aux deux groupes ; B/ Liste des 69 gènes communs présentés selon une classification ascendante hiérarchique.
150

Figure 43 : Comparaison des données du transcriptome des cellules CD34+ et des données
de CGH array ciblées sur la région de la délétion 13q Dans la partie supérieure du graphique est figurée la délétion 13q cartographiée en CGH array. La zone rouge encadrée représente la région du cluster « Flt » localisée grâce au site internet « UCSG genome browser ». les fléches noires représentent les bornes de la délétion 13q. Les données du transcriptome ciblé sur la région 13q sont figurées sur le graphique inférieur (en rouge, sur-expression chez patient ; en vert, sous-expression; en noir, absence de modulation).
151
3/ Etude du rôle du couple Flt3-ligand/Flt3 et de l’activation des « Mitogen activated protein kinases » p38 dans la dysmégacaryopoïèse chez les patients atteints de myélofibrose primitive
L’analyse comparative du transcriptome des progéniteurs hématopoïétiques CD34+ de
patients atteints de myélofibrose primitive vis-à-vis des cellules de sujets sains a mis en
évidence une dérégulation de la voie de signalisation des MAP Kinases ainsi qu’une
modulation d’expression du récepteur Flt3. Ce dernier est sous exprimé dans les PH CD34+ de
patients MFP, indépendamment de la présence de la mutation Jak2V617F, contrairement aux
mégacaryocytes dans lesquels, il est surexprimé. Cette surexpression est également retrouvée
dans les cellules mononucléées des patients et semble spécifique de la MFP puisqu’elle n’est
pas observée chez des patients atteints de Polycythemia vera ou de Thrombocythémie
essentielle. La surexpression du transcrit FLT3 dans les mégacaryocytes est associée à une
augmentation du pourcentage de progéniteurs mégacaryocytaires CD34+Flt3+CD41+ dans le
sang des patients et uniquement chez ceux atteints de MFP. On observe également une
augmentation de phosphorylation de Flt3, témoin de son activation dans ces cellules.
Contrairement aux sujets sains, l’expression de Flt3 persiste au cours de la différenciation
mégacaryocytaire chez les patients avec une expression maximale entre le J6 et J10 de
culture. Enfin, cette surexepression est associée à une augmentation des taux sériques du
ligand (Flt3-ligand), produit par les progéniteurs eux-mêmes ainsi que par les cellules
stromales de la moelle et de la rate des patients, quelque soit leur statut mutationnel Jak2.
La liaison de Flt3-ligand à son récepteur active différentes voies de signalisation dont
celle des MAPK. L’analyse bioinformatique des voies de signalisation sur le transcriptome
des cellules CD34+ a mis en évidence une dérégulation des gènes codant pour des protéines de
la voie MAPK et des facteurs de transcription p38-dépendants impliqués dans les processus
inflammatoires tels que AP1 et FOS. Nous avons donc analysé la dérégulation de la voie
MAPK dans les cellules CD34+ des patients et au cours de leur différenciation
mégacaryocytaire in vitro. Nos résultats ont montré que le niveau de phosphorylation des
MAPK p38, Jnk et p42/44 et de leurs effecteurs est augmenté dans les cellules CD34+ et les
MK exprimant Flt3 chez les patients et ceci quelque soit leur statut Jak2.
152
Nous avons ensuite concentré notre étude sur la voie p38, compte tenu de son rôle
dans la réaction inflammatoire qui caractérise la MFP. Par des approches
d’inhibition/neutralisation de la protéine p38 par des si-ARN, des anticorps neutralisants et
des inhibiteurs chimiques, nous avons montré que son activation dans les cellules CD34+ et
les MK en culture était dépendante de l’activation du récepteur Flt3. Il en est de même après
stimulation des progéniteurs mégacaryocytaires en présence de son ligand Flt3-ligand qui
provoque l’augmentation d’expression des gènes cibles de p38 tels que NFATC4, p53, AP1 et
en stabilisant les transcrits de l’IL8. Il est intéressant de noter que l’Il-8, chimiokine impliquée
dans l’inflammation et dont les transcrits sont stabilisés par p38 (Clark, Dean, & Saklatvala,
2003), participe à la dysmégacaryopoïèse chez les patients (cf. Article en annexe). Nos
résultats montrant que la surexpression de l’Il-8 observée chez les patients est diminuée après
« silencing » de Flt3 ou de p38 renforcent le rôle de la voie Flt-3/p38 dans cette régulation.
Nos résultats ayant montré que l’axe FLT3/MAPK était dérégulé dans les cellules
CD34+ et les MK des patients, nous avons alors recherché s’il participait à la
dysmégacaryopoïèse qui caractérise la maladie. Le ciblage thérapeutique in vitro de la voie
des MAPK et en particulier de p38, ou du récepteur Flt3 par des agents chimiques, des
anticorps monoclonaux ou des si-ARN restaure la différenciation et la maturation des MK en
culture. Nous avons montré l’implication de la voie de signalisation Flt3/p38 dans le contrôle
de l’expression des facteurs de transcription mégacaryocytaires (GATA-1, FOG-1, FLI-1, et
NFE2..) et de marqueurs de différenciation (TGF-"1, PF4, CD9...). En utilisant la même
démarche, nous avons également mis en évidence le rôle de la voie Flt3/p38 dans la migration
in vitro des MK en réponse au Flt3-ligand.
En résumé, ce travail a mis en évidence une dérégulation de Flt3 et des MAPKs p38
dans les PH CD34+ et les MK des patients atteints de PMF, quelque soit leur statut
mutationnel Jak2 et démontre que la persistance de la stimulation de l’axe Flt3-
ligand/Flt3/p38 participe à la dysmégacaryopoïèse qui caractérise la maladie.
En conclusion, nos résultats ont permis de proposer un modèle physiopathologique
dans lequel une augmentation de production de la cytokine Flt3-ligand par le stroma
médullaire et les cellules CD34+ participe à la dysmégacaryopoïèse via une activation
persistante de son récepteur Flt3 et de la voie de signalisation p38. Ce dialogue altéré entre les
cellules hématopoïétiques pathologiques sur-exprimant Flt3 et en particulier les cellules
mégacaryocytaires, et les cellules stromales s’intègre dans notre hypothèse
153
physiopathologique globale de la maladie et renforce le concept du « Bad seeds in Bad soil »
évoqué précédemment.
Nos résultats pourraient expliquer, au moins en partie, l’efficacité thérapeutique de
certains inhibiteurs non spécifiques de Jak2, agissant également sur les kinases associées à
Flt3 et ouvrent de nouvelles perspectives thérapeutiques pour restaurer une mégacaryopoïèse
plus fonctionnelle. A ce titre, nous avons montré que chez des patients porteurs de la mutation
Jak2, le traitement des précurseurs hématopoiétiques et en particulier mégacayocytaires par
des inhibiteurs de Flt3 ne modifie pas leur charge allélique Jak2V617F. Ceci suggère que de
tels inhibiteurs ne ciblent pas uniquement le clone muté et pourraient donc être utilisés
quelque soit le statut Jak2 des patients. Enfin, le modèle prédictif de réponse aux inhibiteurs
de Flt3 intégrant les données clinico-biologiques (myéloprolifération, score de Dupriez et
statut mutationnel Jak2) que nous proposons dans ce travail devrait permettre, une fois validé
sur un plus grand nombre de patients, d’aider le clinicien dans sa décision thérapeutique.
154

Molecular and Cellular Pathobiology
FLT3-Mediated p38–MAPK Activation Participates in the
Control of Megakaryopoiesis in Primary Myelofibrosis
Christophe Desterke1,2, Chrystele Bilhou-Nab!era7, Bernadette Guerton1,2, Christophe Martinaud1,8,
Carole Tonetti9, Denis Clay1,2, Paola Guglielmelli10, Alessandro Vannucchi10, Dominique Bordessoule11,
Hans Hasselbalch12, Brigitte Dupriez13, Nassima Benzoubir3, Marie-Francoise Bourgeade3,4,
Olivier Pierre-Louis1,2, Vladimir Lazar5, William Vainchenker5, Annelise Bennaceur-Griscelli4,6,
Heinz Gisslinger14, St!ephane Giraudier5,9, and Marie-Caroline Le Bousse-Kerdil"es1,2,4 on behalf of the
French Intergroup of Myeloproliferative Disorders, the French INSERM, and the European EUMNET
Networks on Myelofibrosis
Abstract
Primary myelofibrosis (PMF) is characterized by increased number of hematopoietic progenitors and a
dysmegakaryopoiesis which supports the stromal reaction defining this disease.We showed that increased ligand
(FL) levels in plasma, hematopoietic progenitors, and stromal cells from PMF patients were associated with
upregulation of the cognate Flt3 receptor on megakaryocytic (MK) cells. This connection prompted us to study a
functional role for the FL/Flt3 couple in PMF dysmegakaryopoiesis, as a route to reveal insights into pathobiology
and therapy in this disease. Analysis of PMF CD34þ and MK cell transcriptomes revealed deregulation of the
mitogen-activated protein kinase (MAPK) pathway along with Flt3 expression. In PMF patients, a higher
proportion of circulating Flt3þCD34þCD41þ cells exhibited an increased MAPK effector phosphorylation
independently of Jak2V617F mutation. Activation of FL/Flt3 axis in PMF MK cell cultures, in response to FL,
induced activation of the p38–MAPK cascade, which is known to be involved in inflammation, also increasing
expression of its target genes (NFATC4, p53, AP-1, IL-8). Inhibiting Flt3 or MAPK or especially p38 by chemical,
antibody, or silencing strategies restoredmegakaryopoiesis and reduced phosphorylation of Flt3 and p38 pathway
effectors, confirming the involvement of Flt3 in PMF dysmegakaryopoiesis via p38 activation. In addition, in
contrast to healthy donors,MK cells derived from PMFCD34þ cells exhibited an FL-inducedmigration that could
be reversed by p38 inhibition. Taken together, our results implicate the FL/Flt3 ligand–receptor complex in PMF
dysmegakaryopoiesis through persistent p38–MAPK activation, with implications for therapeutic prospects to
correct altered megakaryopoiesis in an inflammatory context. Cancer Res; 71(8); 2901–15. !2011 AACR.
Introduction
Primary myelofibrosis (PMF) is a Ph (Philadelphia)-negative
myeloproliferative neoplasm (MPN) characterized by extrame-
dullary hematopoiesis with splenomegaly, myelofibrosis, and
neoangiogenesis. The clonal myeloproliferative process is illu-
strated by an increased number and mobilization of hemato-
poietic stem cells/progenitors (HSC/HP) with a hypersensitivity
to cytokines partly resulting from Jak2V617F or MPL515L/Kmuta-
tions (1–6). A prominent proliferation of megakaryocytes (MK)
with a dysmegakaryopoiesis characterized by dysplastic MK
with plump lobulation of nuclei and disturbance of nuclear/
cytoplasmic maturation is observed in patients (7). Previous
studies (8–10) have suggested that bone marrow fibrosis was
secondary to fibroblast activation by inflammatory and fibro-
genic growth factors including TGF-b produced by the necrotic
and dysplastic MKs (11, 12). Recently, evidences have been
accumulating that stromal cells also contribute to the hema-
topoietic clone development through specific and mutually
dependent interactions with pathologic HSCs (13).
FL, the ligand for the tyrosine kinase receptor Flt3 (14), is
mainly expressed in stromal cells, including fibroblasts, likely
stimulated by TGF-b. FL is of paramount importance in the
proliferation of primitive hematopoietic progenitors (15–17)
as confirmed by the reduced myeloid and B-lymphoid pro-
genitor content observed in FL"/" and Flt3"/" mice (18, 19).
Authors' Affiliations: 1INSERM U972, 2Paris-11 University, Institut Andr!eLwoff, 3INSERM U785, 4AP-HP, Paul Brousse Hospital, 5INSERM U1009,IGR, 6INSERM U935, Villejuif, France; 7Hematology Laboratory, CHUKremlin-Bicetre, Kremlin-Bicetre, France; 8Centre de Transfusion San-
guine des Arm!ees, Clamart, France; 9Hematology Laboratory, Henri Mon-
dor Hospital, Cr!eteil, France; 10Department of Hematology, FirenzeUniversity, Firenze-Italy; 11CHU Dupuytren, Limoges, France; 12Hematol-ogy Department, Roskilde University Hospital, Copenhagen, Denmark;13Hematology Department, CH Dr Schaffner, Lens, France; 14HematologyDepartment, Medical University of Vienna, Vienna, Austria
Note: Supplementary data for this article are available at Cancer ResearchOnline (http://cancerres.aacrjournals.org/).
S. Giraudier and M-C. Le Bousse-Kerdil"es contributed equally to thisstudy.
Corresponding Author: Marie-Caroline Le Bousse-Kerdil"es, INSERMU972, Paris 11 University, Paul Brousse Hospital, 14, Avenue Paul-VaillantCouturier, Villejuif Cedex 94807, France. Phone: 33(0)1-45595303; Fax:33(0)1-47260319; E-mail: [email protected]
doi: 10.1158/0008-5472.CAN-10-1731
!2011 American Association for Cancer Research.
Cancer
Research
www.aacrjournals.org 2901
American Association for Cancer Research Copyright © 2011 on April 14, 2011cancerres.aacrjournals.orgDownloaded from
Published OnlineFirst April 12, 2011; DOI:10.1158/0008-5472.CAN-10-1731
However, role of FL on normal megakaryopoiesis appears
controversial because it does not stimulate, as a single agent,
MK progenitors (20), but it enhances their proliferation in
association with cytokines such as thrombopoietin (TPO; ref.
21). Its cognate receptor, Flt3, is expressed by HSC and
myeloid progenitors (22) in which it signals through several
downstream pathways including the mitogen-activated pro-
tein kinase (MAPK) pathway (16). Alterations of Flt3 are
frequently observed in leukemic cells and mutations have
been detected in about 30% of patients with acute myelogen-
ous leukemia as well as in patients with acute lymphocytic
leukemia or myelodysplastic syndrome. Mutations most often
involve small tandem duplications within the juxtamembrane
domain of the receptor (Flt3-ITD), resulting in constitutive
tyrosine kinase activity. The recent demonstration that
expression of Flt3-ITD in murine marrow cells results in a
lethal MPN (23) strengthens the role of FL/Flt3 deregulation in
leukemia and encourages us to investigate its possible con-
tribution to human MPN pathogenesis and especially in PMF,
in which a deregulation of primitive hematopoieisis is strongly
associated with profound alterations of stroma.
In this study, we evidenced that the FL plasma level is
increased in PMF patients and is overexpressed by stromal
and CD34þ hematopoietic cells. FL augmentation is asso-
ciated with an aberrant Flt3 expression in CD34þ andMK cells
and with an alteration of the MAPK pathway and especially of
p38, in patients, independently of their Jak2 mutational status.
We further showed that the persistence of Flt3 signaling,
which elicits activation of MAPK, known to be involved in
MK polyploidization (24), participates in the dysmegakaryo-
poiesis that characterizes PMF. Taken together, our results
implicate the "FL/Flt3" couple in PMF MK deregulation
through persistent p38–MAPK activation.
Materials and Methods
Patients
One hundred twenty-six PMF patients [Jak2V617F (n ¼ 51),
Jak2WT (n ¼ 45), and Jak2 status not determined (n ¼ 30)],
obtained from clinicians of the French and European net-
works, and 90 unmobilized healthy donors (HD) were enrolled.
Samples were obtained with the informed consent of subjects
according to the Helsinki declaration.
Cell selection
CD34þ cell selection was carried out on mononuclear cells
(MNC) from peripheral blood (PB) or bone marrow (BM)
samples from PMF patients and HD as previously described
(purity > 97%; ref. 25). Stromal cells obtained from osteome-
dullar biopsies or hip surgery from PMF patients and HD,
respectively, were cultivated for 3 to 4 passages in DMEM
(Dulbecco's modified Eagle's medium) þ 10% FCS (fetal calf
serum). FL plasma level was quantified using Quantikine
ELISA (R&D Systems).
Microarray analysis and quantitative RT-PCR
For microarray technique, see Supplementary Material. For
quantitative reverse transcription PCR (QRT-PCR), total RNAs
were subjected to RNase-free DNase and converted into cDNA
by using the Reverse Transcription Kit (Applied Biosystem).
cDNA (2 mL) was added to the QuantiTect SYBR Green
amplification reaction (QIAGEN) in a 20 mL final volume
and 10 pmol of each primer (Supplementary Table S1) were
added to carry out specific amplification. RPL38 was used as
housekeeping gene and relative quantification was based on
the 2DDCT method (26).
Phenotypic analysis of CD34þ cells
Cells (5 $ 104) were labeled with 2 mg/mL of the following
monoclonal antibodies (mAb): CD38-fluorescein isothiocya-
nate (FITC; clone-T16) or CD41-FITC (clone-P2; Beckman
Coulter) versus IgG1-FITC isotype; Flt3-PE (CD135, clone-
4G8; BD Pharmingen) or CD41-PE (clone-5B12; Dako) versus
IgG1-PE isotype; CD34-PerCP (clone-8G12) versus IgG1-PerCP
isotype; CD41-APC (clone-386629) versus IgG1-APC isotype
(BD Pharmingen). Membrane antigen fluorescence was quan-
tified by using CellQuest software on a FACScalibur (Becton
Dickinson). Live cells (5 $ 103) were analyzed.
MK derived from CD34þ cultures
CD34þ cells (5$ 104/500 mL per well) were cultured for 10 to14 days in MK differentiation medium [SYN.H serum-free
medium containing Recombinant human stem cell factor
(rhSCF): 5 ng/mL; rhIL-3: 2 ng/mL; rhIL-6: 1 ng/mL; rhIL-11:
40 ng/mL, rhTpo: 50 ng/mL; AbCys Synergie] with or without
inhibitors and viability was evaluated by trypan blue. For RNA
silencing, cells were cultured for 6 days and distributed in 24
well per plate per 250 mL with or without control or specific
siRNA (1 mg) and a vector MISSION II (1/50; Sigma). Biological
effect of siRNA was evaluated after 48-hour incubation.
Megakaryocyte ploidy measurement
DNA content was measured by incorporation of propidium
iodine (PI). Megakaryocytes obtained at day 12 (D12) of
culture were fixed with 70% ethanol ("20%C), centrifuged
and treated with RNase (500 mg/mL) and PI (50 mg/mL;
Sigma). Live cells (3 $ 104) were analyzed and the percentage
of polyploid cells (8N-256N) was determined on FACScalibur
with CellQuest software. The B/S ratio (big/small MK propor-
tion) was calculated as following: S(64N þ 128N þ 256N)/
S(8N þ 16N þ 32N) $ 100.
For cyclin D3 expression, MK derived from PMF CD34þ
culture (D10) were labeled with a cyclin D3-FITC mAb
(MOPC-21; BD Pharmingen) and analyzed by fluorescence
microscopy (400 $).
MAPK and effector phosphorylation analysis by flow
cytometry
Cells were fixed in PBS with formalin (2%) for 1 hour and in
70% ethanol overnight (4%C). After washes in PBS–0.5% BSA–
Triton 0.25$ (PBT), cells were incubated with either anti-
MAPK mAbs [Cell Signaling; phospho-p38 Thr180/Tyr182
(clone-12F8), phospho-p42/44 Thr202/Tyr204 (clone-20G11),
phospho JNK/SAPK (c-jun N-terminal kinase/ stress-activated
protein kinase) T183/Y185 (clone-98-F2)] or rabbit IgG isotype
for 45 minutes (4%C). Cells were washed and incubated with a
Desterke et al.
Cancer Res; 71(8) April 15, 2011 Cancer Research2902
American Association for Cancer Research Copyright © 2011 on April 14, 2011cancerres.aacrjournals.orgDownloaded from
Published OnlineFirst April 12, 2011; DOI:10.1158/0008-5472.CAN-10-1731

secondary anti-rabbit antibody coupled to Alexa Fluor 488 nm
(Invitrogen). Phosphorylation levels of Raf, p38 effectors, and
Flt3 on gated CD34þCD41þFLT3þ cells were determined after
labeling with rabbit mAbs included in Raf Family Antibody or
Phospho-p38 MAPK Pathway Sampler Kits (nos. 2330 and
9913, respectively) or Tyr591-Flt3 from Cell Signaling, followed
by a secondary GAR-Alexa Fluor 633 nm antibody (Invitrogen).
About 104 events were analyzed on a FACScalibur.
In vitro migration assay
Transwell migration assays were carried out on MK derived
from CD34þ cultures (D6) as previously described (27). Cells
(105) were loaded on the top chamber and rhFL (10–100 ng/
mL) was added or not to the bottom chamber, with or without
rhSDF-1 (100 ng/mL), and incubated for 48 hours at 37%C in
RPMI/0.5%BSA. In some experiments, Flt3 inhibitor IV (42
nmol/L; Calbiochem) or p38 inhibitors (SB203580, 1 mmol/L,
SB202190, 40 nmol/L; Sigma) were added to the culture. The
percentage of migrating cells was calculated after quantifica-
tion of live cells in top and bottom chambers.
Western blot
Total cell lysates (10/30 mg), obtained as previously
described (28), were subjected to SDS-PAGE, electrophoreti-
cally transferred into nitrocellulose membranes, and blotted
using primary mAbs similar to those used for cytometric
analysis or using actin antibody (Santa Cruz Biotechnology).
Membranes were revealed with anti-mouse or anti-rabbit IgG
horseradish peroxidase–linked antibodies and a chemilumi-
nescence detection kit (ECL-Plus; GE-Healthcare); signals
were quantified by using ImageJ software.
Patient group prediction model
Upstream p38 effectors and C-MYC expression modulation
in MK derived from CD34þ (D6) in response to 18-hour FL
stimulation kinetics was quantified by QRT-PCR. Ratio at each
time point of kinetics was normalized as compared with
quantification at the starting point of stimulation. Cumulative
scores of each kinetic time ratio were included in a multi-
variate model composed of a principal component analysis
associated to a hierarchical clustering in which patient clin-
icobiological information were reported.
Statistical analysis
Results were expressed as mean& SD. Statistical differences
between patients and controls were validated by unpaired t test
with a significant P < 0.05. Statistical differences between
conditions were validated by paired t test with significant P <0.001 (***); P¼ 0.001 to 0.01 (**); and P¼ 0.01 to 0.05 (*). Fisher
ANOVA test with 2 factors (samples and time of differentiation)
was also used; a P < 0.05 was significant. NS, not significant.
Results
FL plasma level is increased in PMF patients and is
overexpressed in CD34þ hematopoietic and stromal cells
We first showed that FL plasma level was significantly
increased in PMF patients as than in HDs (Fig. 1A; 130.1 &
78.41, n ¼ 52 vs. 69.84 & 30.94, n ¼ 28; P ¼ 0.0001) with no
significant difference between PMF patients according to their
Jak2 status (181.4 & 70.8 pg/mL, n ¼ 7 vs. 128.8 & 81.9 pg/mL,
n ¼ 18 for Jak2V617F and Jak2WT, respectively). The increased
FL level appears to be restricted to PMF patients, as it was
statistically different from that of polycythemia vera (PV; n ¼
17) and essential thrombocytopenia (ET; n ¼ 17) patients.
We further analyzed the nature of FL producing cells and
showed that fibroblasts from PMF BM expressed higher FL
level than those from HD (1.17& 0.4, n¼ 8 vs. 0.56& 0.17, n¼
6, respectively; P ¼ 0.002). As CD34þ and MK cells from PMF
patients are known to produce cytokines (13, 29), we analyzed
whether they expressed FL. Whereas we did not detect FL
transcript in PMF or HD MK cells (data not shown), a 2-fold
increase in FL mRNA level was observed in PMF CD34þ cells
as compared with that in HD cells (Fig. 1A; 0.080 & 0.218, n ¼
22 vs. "0.294 & 0.242, n ¼ 6; P ¼ 0.0006).
Flt3 expression and phosphorylation are increased in
PBMNC, MK, and CD34þ cells from PMF patients
Figure 1B shows that Flt3 mRNA level was increased in
mononuclear cells from peripheral (PBMNC) from PMF
patients than in HD (0.69 & 0.96, n ¼ 11 vs. "0.06 & 0.47,
n ¼ 16, respectively; P < 0.006). Similar to FL, Flt3 over-
expression was restricted to PMF because Flt3 mRNA level
was statistically different in PMF as compared with ET and PV.
We further analyzed Flt3 expression on PBMNC by flow
cytometry and showed that the percentage of cells coexpres-
sing the CD41þ MK antigen and Flt3 was higher in PMF than
in HD (Fig. 1B). Western blot analysis confirmed the Flt3
increased expression and evidenced its phosphorylation in
PBMNC from PMF patients (Fig. 1B). As Flt3 is reported to be
expressed in HP, we analyzed its distribution on freshly
purified CD34þ cells. Figure 1C showed that the percentage
of CD34þFlt3þ cells was increased in PMF compared with that
in HD cells (17.77 & 14.98, n ¼ 11 vs. 4.72 & 7.09, n ¼ 10,
respectively; P¼ 0.01). Flt3 was mainly expressed on PMF MK
progenitors, as the proportion of CD34þFlt3þCD41þ cells was
significantly increased in Jak2WT and Jak2V617F patients than
in HD (76.11 & 14.49, n ¼ 4 and 43.37 & 23.86, n ¼ 12 vs. 9.11
& 10.97, n ¼ 11; P < 0.0001 and P ¼ 0.0001, respectively;
Fig. 1D) with a higher proportion in Jak2WT patients (P¼ 0.01).
To assess Flt3 activation on this cell subset, we quantified the
percentage of CD34þCD41þFlt3þ cells expressing phospho-
Flt3 and showed that it was increased in PMF patients (Jak2WT
and Jak2V617F) versus HD (28.21 & 22.67, n ¼ 5 and 18.35 &
24.81, n ¼ 4 vs. 0.22 & 0.34, n ¼ 10; P ¼ 0.007 and P ¼ 0.01,
respectively; Fig. 1D). In accordance with these results, Wes-
tern blot analysis also evidenced the presence of the Flt3
protein and of its phosphorylated form in freshly isolated
CD34þ cells and in MK-derived CD34þ cells from PMF
patients (Fig. 1E).
The increased percentage of PMF CD34þCD41þ MK pro-
genitors expressing Flt3 and its activated form motivated us
to analyze its expression during in vitro megakaryopoiesis.
We quantified by QRT-PCR the Flt3 transcript in MK derived
from CD34þ culture (D10) and showed that it was signi-
ficantly overexpressed in PMF patients as compared with
FLT3-Mediated p38–MAPK Activation in PMF
www.aacrjournals.org Cancer Res; 71(8) April 15, 2011 2903
American Association for Cancer Research Copyright © 2011 on April 14, 2011cancerres.aacrjournals.orgDownloaded from
Published OnlineFirst April 12, 2011; DOI:10.1158/0008-5472.CAN-10-1731
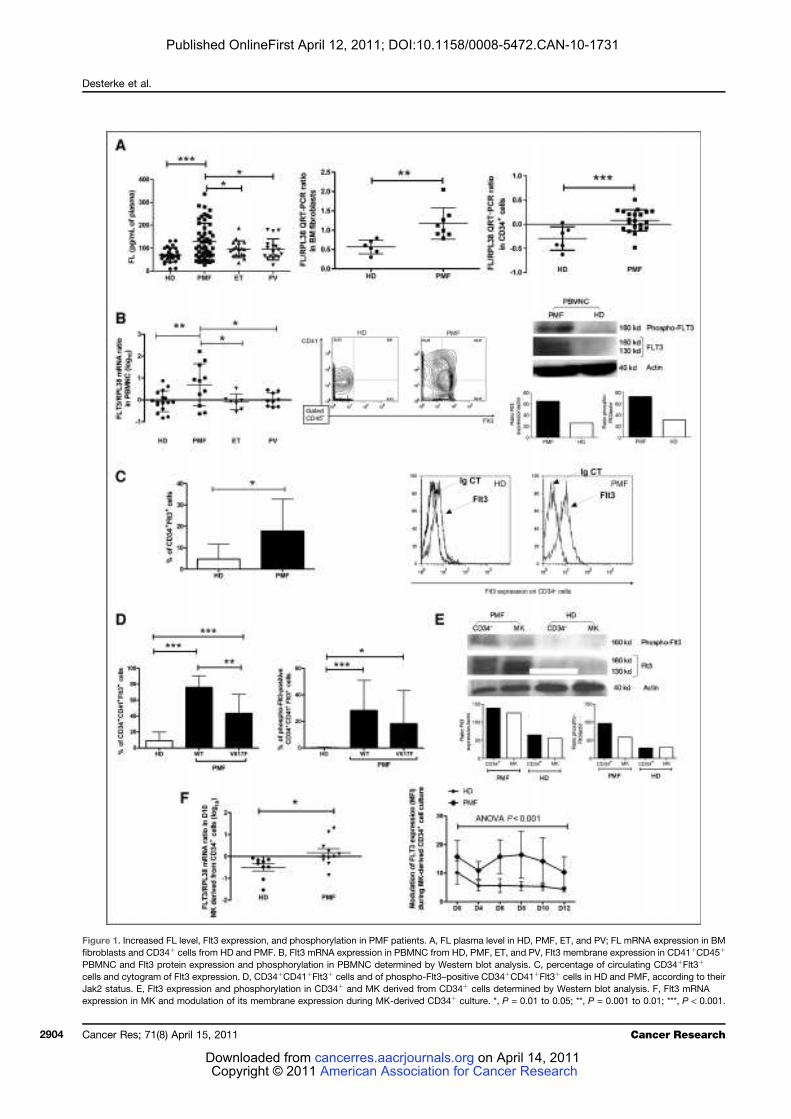
Figure 1. Increased FL level, Flt3 expression, and phosphorylation in PMF patients. A, FL plasma level in HD, PMF, ET, and PV; FL mRNA expression in BM
fibroblasts and CD34þ cells from HD and PMF. B, Flt3 mRNA expression in PBMNC from HD, PMF, ET, and PV, Flt3 membrane expression in CD41þCD45þ
PBMNC and Flt3 protein expression and phosphorylation in PBMNC determined by Western blot analysis. C, percentage of circulating CD34þFlt3þ
cells and cytogram of Flt3 expression. D, CD34þCD41þFlt3þ cells and of phospho-Flt3–positive CD34þCD41þFlt3þ cells in HD and PMF, according to their
Jak2 status. E, Flt3 expression and phosphorylation in CD34þ and MK derived from CD34þ cells determined by Western blot analysis. F, Flt3 mRNA
expression in MK and modulation of its membrane expression during MK-derived CD34þ culture. *, P = 0.01 to 0.05; **, P = 0.001 to 0.01; ***, P < 0.001.
Desterke et al.
Cancer Res; 71(8) April 15, 2011 Cancer Research2904
American Association for Cancer Research Copyright © 2011 on April 14, 2011cancerres.aacrjournals.orgDownloaded from
Published OnlineFirst April 12, 2011; DOI:10.1158/0008-5472.CAN-10-1731
HD (0.168 & 0.615, n ¼ 11 vs."0.498 & 0.488, n¼ 9; P¼ 0.008;
Fig. 1F). We further analyzed the variation of Flt3 membrane
expression at different time points during in vitro MK differ-
entiation. In contrast to HD, Flt3 expression persisted in
patients throughout the culture with a maximal expression
between days 6 and 10; the ANOVA/Fisher test showed a
significant difference (P < 0.001) between HD (BM, n¼ 10; PB,
n ¼ 12) and PMF patients (n ¼ 16; Fig. 1F).
Altogether, these data indicate that Flt3 expression and
phosphorylation are increased in PMF CD34þ cells and are
maintained during MK differentiation.
MAPK phosphorylation is increased in PMF CD34þ and
MK cells and is related to cells expressing Flt3
Binding of FL to Flt3 triggers several downstream signals
mainly including PI3K and Ras/MAPK pathways. A profiling
gene expression of PMF CD34þ cells had allowed us to
generate 2 lists of differentially expressed genes (HD vs.
PMF Jak2WT and HD vs. PMF Jak2V617F; Gene Expression
Omnibus, GEO, no. GSE12234). These lists were used to carry
out a functional representation based on a pathway annota-
tion using NIH DAVID software (http://david.abcc.ncifcrf.
gov/). This analysis indicated that several genes involved in
the MAPK pathway are commonly deregulated in PMF
patients (Fig. 2A and Supplementary Table S2). We also
evidenced that MAPK pathway gene and especially p38-
dependent transcription factors involved in inflammatory
process, such as AP-1 and Fos, were altered in PMF MK cells
(Supplementary Table S3). We further investigated MAPK
pathway deregulation in CD34þ cells and during in vitro
megakaryopoiesis in PMF patients.
Figure 2B shows that p38, Jnk, and p42/p44 phosphorylation
levels were significantly increased in PMF CD34þ cells, inde-
pendently of their Jak2 status, as compared with that in HD
cells: p38 (HD: 7.74 & 3.67, n ¼ 21 vs. PMF Jak2WT: 21.08 &
12.05, n¼ 8; P < 0.0001 and vs. PMF Jak2V617F: 16.78& 8.11, n¼
12; P < 0.0001), p42/p44 (HD: 6.8 & 2.97, n ¼ 22 vs. PMF
Jak2WT: 16.58 & 9.84, n ¼ 8; P ¼ 0.0001 and vs. PMF Jak2V617F:
12.11& 11.76, n¼ 12; P¼ 0.02), and JNK (HD: 6.17 & 4.54, n¼
24 vs. PMF Jak2WT: 26.76& 19.56, n¼ 8; P < 0.0001 and vs. PMF
Jak2V617F: 13.87 & 12.15, n ¼ 12, P ¼ 0.005).
We then analyzed whether MAPK activation was main-
tained during in vitro MK differentiation and showed that,
similar to CD34þ cells, increased phosphorylation levels of p38
and Jnk were observed in D10 MK derived from PMF CD34þ
culture irrespectively of their Jak2 status (p38: 18.34 & 11.62, n
¼ 10 and 18.27 & 12.09, n ¼ 18, for PMF Jak2WT and Jak2V617F,
respectively vs. 8.99 & 5.11, n ¼ 17 for HD, P ¼ 0.0038 and P¼
0.0030, respectively; JNK: 21.95 & 20.98, n ¼ 10 and 22.76 &
25.35, n ¼ 16 for PMF Jak2WT and Jak2V617F, respectively vs.
6.91 & 3.96, n ¼ 17 for HD, P ¼ 0.0038 and P ¼ 0.0079,
respectively; Fig. 2B). A modest increased p42/p44 phosphor-
ylation was also observed in PMF MK cells.
We further studied the phosphorylation of up- and down-
stream p38, JNK, and p42/p44 effectors in PMF cells and
whether this phosphorylation was associated with Flt3
expression. Figure 2C showed that the percentage of
CD34þCD41þFlt3þ cells expressing phospho-a/b/c-Rafs or
phosphorylated forms of p38 effectors such as MKK3-6, MAP-
KAPK2, and ATF2 as well as of MSK1 and HSP27 were
significantly increased in PMF patients whatever their Jak2
status (Jak2V617F, n ¼ 4 and Jak2WT, n ¼ 5) as compared with
HD (PB, n ¼ 6 and BM, n ¼ 3).
Therefore, our data showed that MAPK phosphorylation is
increased in PMF CD34þ and MK cells and is related to Flt3
expressing cells.
Flt3-dependent p38–MAPK pathway deregulation in
PMF CD34þ and MK cells
Among MAPKs, p38 is strongly responsive to stress and
inflammatory mediators such as TNF-a, IL-1b, and IL-8
known to be highly expressed in PMF (30); so, we further
focused our study on p38–MAPK and on its main up and
downstream effectors. We confirmed that p38 was phosphory-
lated in CD34þ and MK cells from patients by Western blot
analyses (Fig. 3A), and that p38 phosphorylation was asso-
ciated with MK expressing Flt3 (Fig. 3B). p38 phophorylation
was associated with activation of its upstream MKK3-6 effec-
tor and with upregulation of downstream AP-1 target gene
expression in both CD34þ and CD41þMK derived from CD34þ
cells (Fig. 3C and D) reinforcing the notion that p38 axis is
activated in PMF cells.
To analyze the role of Flt3 in p38–MAPK pathway activation
in PMF CD41þMK derived from CD34þ culture, we quantified
the phosphorylation of p38–MAPK effectors after addition of a
neutralizing Flt3 antibody (10 mg/mL) to PMF cells from 6
patients. We showed that such treatment reduced phosphor-
ylation of up- and downstream targets of p38 (Fig. 2E). Finally,
to ascertain the implication of Flt3 in p38–MAPK activation,
we showed that silencing 50% of Flt3 protein expression
(Fig. 3F) and 80% of its transcript (data not shown) in MK
derived from CD34þ resulted in a decreased percentage of
phospho-p38þ cells (Fig. 3G).
Altogether these data showed that p38–MAPK pathway
effectors are activated in CD34þ and MK cells from patients
and that Flt3 expression/phosphorylation participates in this
activation process.
In vitro FL stimulation activates p38 and modulates
downstream regulator expression in PMF MK–derived
CD34þ cells through Flt3 axis
To further show that MAPKs and especially p38 were
activated in PMF MK–derived CD34þ cells in response to
FL, we compared the effect of 18-hour dose-dependent FL
stimulation on MAPK phosphorylation in MK precursors
obtained from PMF or HD CD34þ cultures (D6). Figure 4A
shows that no variations were observed for p42/p44 or JNK
phosphorylations either in PMF or HD cells at 50 ng/mL FL.
This result was identical whatever the dose of FL added (data
not shown). In contrast, 50 ng/mL FL stimulation induced a
progressive increase of phospho-p38 level in PMF MK as
compared with HD (ANOVA; P ¼ 0.002). This increased p38
phosphorylation level in PMF MK–derived CD34þ cells after
FL stimulation was confirmed by Western blot analysis and
implication of Flt3 activation was supported by a reduced p38
phosphorylation by addition of Flt3 inhibitor IV (Fig. 4B). To
FLT3-Mediated p38–MAPK Activation in PMF
www.aacrjournals.org Cancer Res; 71(8) April 15, 2011 2905
American Association for Cancer Research Copyright © 2011 on April 14, 2011cancerres.aacrjournals.orgDownloaded from
Published OnlineFirst April 12, 2011; DOI:10.1158/0008-5472.CAN-10-1731

40
A
B C
30
20
10
0
0
0
10
20
30
0
5
10
15
20
25
10
20
30
40
0
20
40
6050
40
30
20
10
0
0
20
40
60
80
0
20
40
60
80
0
20
40
60
80
0
20
40
60
80
HD WT V617F
PMF
HD WT V617F
PMF
HD WT V617F
PMF
HD WT V617F
PMF
HD WT V617F
PMF
HD WT V617F
PMF
HD WT V617F
PMF
HD WT V617F
PMF
0
20
40
60
80
HD WT V617F
PMF
0
20
40
60
80
HD WT V617F
PMF
0
20
40
60
80
HD WT V617F
PMF
0
20
40
60
80
HD WT V617F
PMF
0
20
40
60
80
HD WT V617F
PMF
HD WT V617F
PMF
HD WT V617F
PMF
Ph
osp
ho
-p3
8expre
ssio
n leve
lin
CD
34
+ c
ells
(M
FI)
% o
f phospho-
a-r
af-
289-p
ositiv
eC
D34
+C
D41+
Flt3+
cells
% o
f phospho-
b-r
af-
445-p
ositiv
eC
D34+
CD
41
+F
lt3+
cells
% o
f phospho-
c-r
af-
289-p
ositiv
eC
D34+
CD
41+
Flt3+
cells
% o
f phospho-
HS
P27-p
ositiv
eC
D34+
CD
41
+F
lt3+
cells
% o
f phospho-
MS
K1-p
ositiv
eC
D34+
CD
41+
Flt3+
cells
% o
f phospho-
AT
F2-p
ositiv
eC
D34+
CD
41
+F
lt3+
cells
% o
f phospho-
MK
K3/M
KK
6-p
ositiv
eC
D34+
CD
41+
Flt3+
cells
% o
f phospho-
MA
PK
AP
K2-p
ositiv
eC
D34
+C
D41+
Flt3+
cells
% o
f phospho-
p38-p
ositiv
eC
D34+
CD
41
+F
lt3+
cells
Phospho-J
NK
/SA
PK
expre
ssio
n leve
l in
CD
34
+ c
ells
(M
FI)
Phospho-p
42
expre
ssio
n leve
l in
CD
34+
cells
(M
FI)
Phospho-p
42
expre
ssio
n leve
l in
MK
deri
ved f
rom
CD
34+
cells
(M
FI)
Phospho-J
NK
/SA
PK
expre
ssio
n leve
l in
MK
deri
ved f
rom
CD
34+
cells
(M
FI)
Phospho-p
38
expre
ssio
n leve
l in
MK
deri
ved fro
m C
D34+
cells
(M
FI)
Figure 2. MAPK effector expression and phosphorylation in CD34þ cells and MK cells from PMF patients. A, Venn diagram showing MAPK deregulation
in PMF CD34þ cell transcriptome. Phosphorylation level (MFI) of p38, JNK/SAPK, and p42/p44 in CD34þ and MK derived from CD34þ cells (B) of Raf
(a-raf-289, b-raf-445, c-raf-289) and p38 pathway effectors (MKK3-6, MSK1, MAPKAPK2, ATF2, and HSP27) in CD34þFlt3þCD41þMK progenitors (C) from
HD and PMF patients according to their Jak2 status. *, P = 0.01 to 0.05; **, P = 0.001 to 0.01; ***, P < 0.001.
Desterke et al.
Cancer Res; 71(8) April 15, 2011 Cancer Research2906
American Association for Cancer Research Copyright © 2011 on April 14, 2011cancerres.aacrjournals.orgDownloaded from
Published OnlineFirst April 12, 2011; DOI:10.1158/0008-5472.CAN-10-1731
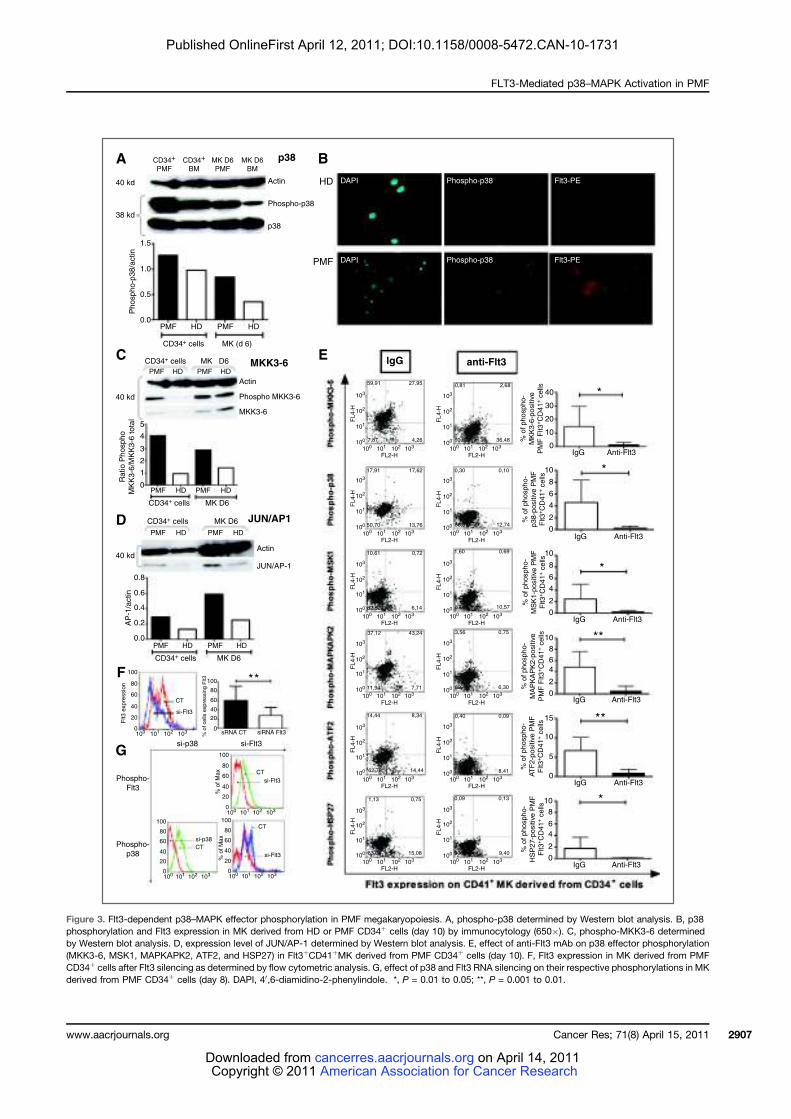
CD34+
PMF
CD34+ cells MK (d 6)
CD34+ cells MK D6 MKK3-6
p38A B
EC
D
F
G
HD
PMF
lgG anti-Flt3
40 kd
40 kd
40 kd
5
4
3
2
1
0
0.8
0.6
0.4
0.2
0.0
AP
-1/a
ctin
Ra
tio
Ph
osp
ho
MK
K3
-6/M
KK
3-6
to
tal
Phospho-
Flt3
Phospho-
p38
38 kd
1.5
1.0
Ph
osp
ho
-p3
8/a
ctin
0.5
0.0PMF HD
PMF HD
CD34+ cells MK D6
CD34+ cells MK D6
PMF HD
PMF HD PMF HD
PMF HD
CD34+ cells MK D6
PMF
100
80
60
40
20
Flt3
exp
ressio
n
% o
f cells
expre
ssin
g F
lt3
0
100
80
60
40
20
0
100
80CT
si-Flt3
CT
si-Flt3
CT
si-Flt3
CT
si-p38
60
40
% o
f M
ax
% o
f M
ax
20
0
sRNA CT
si-p38 si-Flt3
siRNA Flt3100 101 102 103
100 101 102 103
100 101
FL2-H
FL
4-H
102 103 100 101
FL2-H102 103
100
101
102
103
FL
4-H
100
101
102
103
100 101
FL2-H
FL
4-H
102 103 100 101
FL2-H102 103
100
101
102
103
FL
4-H
100
101
102
103
100 101
FL2-H
FL
4-H
102 103 100 101
FL2-H102 103
100
101
102
103
FL
4-H
100
101
102
103
100 101
FL2-H
FL
4-H
102 103 100 101
FL2-H102 103
100
101
102
103
FL
4-H
100
101
102
103
100 101
FL2-H
FL
4-H
102 103 100 101
FL2-H102 103
100
101
102
103
FL
4-H
100
101
102
103
100 101
FL2-H
FL4-H
102 103 100 101
FL2-H102 103
100
101
102
103
FL
4-H
100
101
102
103
59,91
17,91 17,62 0,30 0,10
86,87 12,7450,70
10,61 0,72 1,60 0,69
10,5787,1482,52
37,12 43,24 3,56 0,75
89,40
0,4014,44 8,34
14,4462,78
1,13 0,75
15,0883,04
0,09
8,41
0,130,09
90,38 9,40
91,
6,307,7111,94
6,14
13,76
27,95
4,267,87
0,81 2,68
40 *
*
*
**
**
*
**
30
20
10
0
0
2
4
6
8
10
0
2
4
6
8
10
0
0
5
10
15
2
4
6
8
10
0
2
4
6
8
10
% o
f phospho-
MK
K3-6
-positiv
e
PM
F F
lt3
+C
D41
+ c
ells
% o
f phospho-
p38-p
ositiv
e P
MF
Flt3
+C
D41
+ c
ells
% o
f phospho-
MS
K1-p
ositiv
e P
MF
Flt3
+C
D41
+ c
ells
% o
f phospho-
MA
PK
AP
K2-p
ositiv
e
PM
F F
lt3
+C
D41
+ c
ells
% o
f phospho-
AT
F2-p
ositiv
e P
MF
Flt3
+C
D41
+ c
ells
% o
f phospho-
HS
P27-p
ositiv
e P
MF
Flt3
+C
D41
+ c
ells
IgG Anti-Flt3
IgG Anti-Flt3
IgG Anti-Flt3
IgG Anti-Flt3
IgG Anti-Flt3
IgG Anti-Flt3
36,4860,02
100
80
60
40
20
0100 101 102 103
100
80
60
40
20
0100 101 102 103
HD PMF HD
PMF HD
PMF HD
p38
Phospho-p38
Actin
MKK3-6
Phospho MKK3-6
Actin
JUN/AP-1
JUN/AP1
Actin
MK D6
PMF
MK D6
BM
CD34+
BM
DAPI Phospho-p38 Flt3-PE
DAPI Phospho-p38 Flt3-PE
Figure 3. Flt3-dependent p38–MAPK effector phosphorylation in PMF megakaryopoiesis. A, phospho-p38 determined by Western blot analysis. B, p38
phosphorylation and Flt3 expression in MK derived from HD or PMF CD34þ cells (day 10) by immunocytology (650$). C, phospho-MKK3-6 determined
by Western blot analysis. D, expression level of JUN/AP-1 determined by Western blot analysis. E, effect of anti-Flt3 mAb on p38 effector phosphorylation
(MKK3-6, MSK1, MAPKAPK2, ATF2, and HSP27) in Flt3þCD41þMK derived from PMF CD34þ cells (day 10). F, Flt3 expression in MK derived from PMF
CD34þ cells after Flt3 silencing as determined by flow cytometric analysis. G, effect of p38 and Flt3 RNA silencing on their respective phosphorylations in MK
derived from PMF CD34þ cells (day 8). DAPI, 40,6-diamidino-2-phenylindole. *, P = 0.01 to 0.05; **, P = 0.001 to 0.01.
FLT3-Mediated p38–MAPK Activation in PMF
www.aacrjournals.org Cancer Res; 71(8) April 15, 2011 2907
American Association for Cancer Research Copyright © 2011 on April 14, 2011cancerres.aacrjournals.orgDownloaded from
Published OnlineFirst April 12, 2011; DOI:10.1158/0008-5472.CAN-10-1731
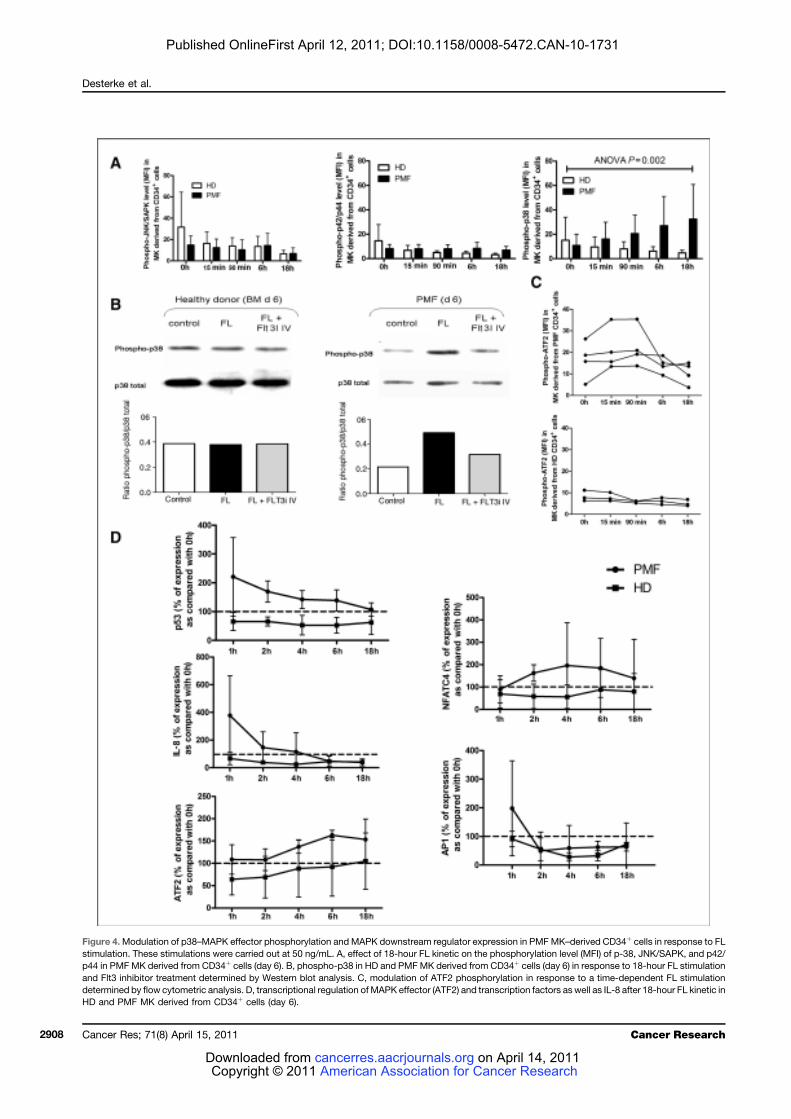
Figure 4.Modulation of p38–MAPK effector phosphorylation and MAPK downstream regulator expression in PMF MK–derived CD34þ cells in response to FL
stimulation. These stimulations were carried out at 50 ng/mL. A, effect of 18-hour FL kinetic on the phosphorylation level (MFI) of p-38, JNK/SAPK, and p42/
p44 in PMF MK derived from CD34þ cells (day 6). B, phospho-p38 in HD and PMFMK derived from CD34þ cells (day 6) in response to 18-hour FL stimulation
and Flt3 inhibitor treatment determined by Western blot analysis. C, modulation of ATF2 phosphorylation in response to a time-dependent FL stimulation
determined by flow cytometric analysis. D, transcriptional regulation of MAPK effector (ATF2) and transcription factors as well as IL-8 after 18-hour FL kinetic in
HD and PMF MK derived from CD34þ cells (day 6).
Desterke et al.
Cancer Res; 71(8) April 15, 2011 Cancer Research2908
American Association for Cancer Research Copyright © 2011 on April 14, 2011cancerres.aacrjournals.orgDownloaded from
Published OnlineFirst April 12, 2011; DOI:10.1158/0008-5472.CAN-10-1731
confirm the triggering effect of FL/Flt3 on p38 pathway, we
further analyzed by flow cytometry the activation of ATF2, a
key cross-talk molecule for p38 transcriptional activity, in
response to FL stimulation. Figure 4C shows that ATF2
phophorylation level is increased in MK derived from PMF
CD34þ in response to FL in a time-dependent manner. In
contrast, there is no ATF2 phosphorylation in response to FL
stimulation in HDs.
We further analyzed whether the expression of MAPK-
associated downstream transcription factors was modu-
lated in response to FL. Figure 4D shows that p38-asso-
ciated p53, NFATc4/NFAT3, AP-1, and ATF2 transcripts are
upregulated after FL stimulation in PMF but not in HD
samples. In contrast, MSK2, PARK, MK3, MNK1, MNK2, and
MSK1 transcripts that are Erk (extracellular signal–regu-
lated kinase)-dependent transcriptional factors were not
affected by FL stimulation either in HD or in PMF (Sup-
plementary Table S4). Interestingly, the transcript of IL-8,
known to be involved in PMF dysmegakaryopoiesis (30) and
to be stabilized by p38 (31), showed a rapid increase in
response to FL in PMF cells (Fig. 4D). This IL-8 overexpres-
sion was reduced after Flt3 or p38 silencing (data not
shown) strengthening the role of the Flt3/p38 signaling
in IL-8 regulation.
Altogether our data confirm that FL in vitro activates p38
cascade and increases its target gene expression through Flt3
in PMF MK–derived CD34þ cells.
Modulation of upstream MAPK linker expression in
response to FL allows definition of PMF patient group
prediction
We further searched whether p38–MAPK upstream lin-
ker expression was modified in response to FL in PMF MK–
derived CD34þ cells and whether modulation of their
expression could predict exaggerated FL/MAPK axis
response. We have principally selected upstream MAPK
linkers proximal to Flt3, minimizing the influence of other
pathways such as PI3K and JAK/STAT (Fig. 5A) and quan-
tified their mRNA expression at different time points of FL
kinetics, by QRT-PCR. Data (Supplementary Table S5) were
used to draw a gene neuronal network that shows a good
correlation between genes selected and validates their
choice for the predictive model (Fig. 5B). A three-dimen-
sional (3D) projection plot of principal component multi-
variate analysis (PCA) showed that HD samples (BM, PB)
are closely related in the centre of the plot. The PMF4
patient, who is de novo diagnosed, is close to the HD
aggregate, in contrast to the 3 other patients (PMF1,
PMF2, and PMF3) who were earlier diagnosed (Fig. 5C).
These PCA dispersion data incited us to build a hierarchical
classification plot correlating this clustering to clinicobio-
logical data (Fig. 5D). This classification allowed to distin-
guish HD and PMF groups and to identify PMF subgroups
correlated with clinical data such as Jak2 mutation status,
myeloproliferation, and Dupriez score.
This predictive model confirms the implication of Flt3/
MAPK axis activation in PMF megakaryopoiesis and estab-
lishes a link with patient clinicobiological parameters.
Flt3/MAPK axis is involved in PMF
dysmegakaryopoiesis
Our results showing that Flt3/MAPKaxis was altered in PMF
megakaryopoiesis raise the question of whether it is involved in
this pathologic process (30). Therefore, we assessed the effect
of p38, p42/p44, Jnk, and Flt3 inhibitors (refs. 32, 33; Supple-
mentary Table S6) or of anti-Flt3mAb (10mg/mL) onPMFMK–
derived CD34þ cultures. Inhibition of either MAPK or Flt3
significantly reduced the proliferation ofMKderived fromPMF
CD34þ cells (Fig. 6A), without affecting their viability (Fig. 6B).
Figure 6C showed that such treatment increased the percen-
tage of polyploidMK derived from PMF CD34þ cells, especially
of cells with a ploidy more than 64N (Supplementary Table S6)
and induced a nuclear localization of cyclin D3, known to
promote endomitosis. It also stimulated MK differentiation as
shown by an increased expression of the CD41 MK differentia-
tion marker (Fig. 6D). A similar effect on CD41 expression was
observed after p38 or Flt3 silencing, confirming their participa-
tion in the differentiation process (Fig. 6D and Supplementary
Fig. S1). Furthermore, Flt3 inhibitors restored the formation of
proplatelets (Fig. 6D). Participation of the Flt3/p38-mediated
pathway in the control of PMF megakaryopoieis was further
confirmedby results showing anupregulation ofGATA-1, FOG-
1, FLI-1, NFE2 MK transcriptional factors, of Aurora B endo-
mitotic regulator and of TGFB1, PF4, andCD9MKmarker gene
expression after Flt3 or p38 silencing (Fig. 6E).
FL has been reported to be a mobilization factor (27).
Therefore, we analyzed whether Flt3/p38 axis participates in
PMF MK migration in response to FL. We first determined FL
doses that induced amaximalMKmigration (data not shown).
In contrast to HD, in PMF patients, addition of 10 ng/mL FL
induced a significant MK precursor migration as compared
with untreated cells (46.85%& 10.09% vs. 25.88%& 5.29%; n¼
3, P ¼ 0.03; Fig. 6F). FL-mediated migration was inhibited by
addition of Flt3 inhibitor (Fig. 6F), confirming the role of Flt3 in
the PMF FL–inducedmigration. Addition of p38 inhibitors also
totally inhibited the FL-mediated migration (Fig. 6F) showing
that it was dependent on p38 activation. As expected, addition
of SDF-1 alone used as control, stimulated themigration ofMK
precursors from either PMF patients or HD (Fig. 6F). However,
when added to FL, SDF-1 did not increase the PMFFL–induced
migration (Fig. 6F), suggesting that both processes are differ-
entially regulated in patients.
Altogether, our data support the notion for a role for the
Flt3/p38-MAPK axis in PMF dysmegakaryopoiesis.
Discussion
PMF is characterized by a clonal amplification of HSC, an
increased circulating CD34þ cell number, and a prominentMK
proliferationwith alteredmaturation anddysplastic features in
the bone marrow. This myeloproliferation is associated with
marked changes in the BM stroma characterized by myelofi-
brosis, osteosclerosis, and neoangiogenesis consequent to an
overproduction of fibrogenic and inflammatory cytokines by
hematopoietic cells and especially by MKs (34). Reciprocally,
studies from our group have shown the role of stromal cells
from PMF patients in the myeloproliferation and especially in
FLT3-Mediated p38–MAPK Activation in PMF
www.aacrjournals.org Cancer Res; 71(8) April 15, 2011 2909
American Association for Cancer Research Copyright © 2011 on April 14, 2011cancerres.aacrjournals.orgDownloaded from
Published OnlineFirst April 12, 2011; DOI:10.1158/0008-5472.CAN-10-1731

Figure 5. PMF patient group prediction model according to modulation of upstream MAPK linker and effector expression in response to FL stimulation.
A, scheme of genes involved in Flt3/MAPK axis drawn from www.genego.com. Red frame genes were selected for conducting a predictive model of
PMF patient groups according to FL-dependent MAPK response (B–D). Predictive model: (B) neural network with selected genes, (C) principal component
analysis, (D) hierarchical clustering with correlation of clinicobiological data.
Desterke et al.
Cancer Res; 71(8) April 15, 2011 Cancer Research2910
American Association for Cancer Research Copyright © 2011 on April 14, 2011cancerres.aacrjournals.orgDownloaded from
Published OnlineFirst April 12, 2011; DOI:10.1158/0008-5472.CAN-10-1731

Figure 6. Flt3/MAPK axis is involved in PMF dysmegakaryopoiesis. Effect of Flt3 or MAPK inhibitors on proliferation (A) and viability (B) of PMF MK
derived from CD34þ culture (D10), polyploidy cell percentage, cyclin D3 expression and cytologic maturation (400$; C). D, effect of inhibitors and siRNA on
CD41 expression and proplatelet formation. E, effect of Flt3 and p38 silencing on gene expression involved in MK regulation quantified by QRT-PCR.
F, percentage of migration of MK derived from CD34þ cells purified from HD or PMF patients in response to FL (10 ng/mL) in the presence or absence
of SDF-1a (100 ng/mL) and effect of Flt3 and p38 inhibitors on PMF MK derived from CD34þ cell migration in response to FL (10 ng/mL). *, P = 0.01 to 0.05;
**, P = 0.001 to 0.01; ***, P < 0.001; ns, not signficant.
FLT3-Mediated p38–MAPK Activation in PMF
www.aacrjournals.org Cancer Res; 71(8) April 15, 2011 2911
American Association for Cancer Research Copyright © 2011 on April 14, 2011cancerres.aacrjournals.orgDownloaded from
Published OnlineFirst April 12, 2011; DOI:10.1158/0008-5472.CAN-10-1731

the dysmegakaryopoiesis that characterizes the disease (35).
Among cytokines secreted by stromal cells, FL (36) has been
reported to play a role inHSCproliferation and survival (37). Its
receptor, Flt3, is frequently altered in leukemia through gene
rearrangements such as ITD that induces a myeloproliferative
syndrome in knockin mice model (23). Evidence for such a
myeloproliferative phenotype incited us to study the potential
involvement of the FL/Flt3 couple in PMF pathogenesis.
Our present data show that the FL plasma level is speci-
fically increased in PMF patients, in whom it is produced by
stromal and hematopoietic cells. Furthermore, in contrast to
HD in whom Flt3 expression is restricted to HSC/HP and
granulomacrophagic progenitors (22), in PMF patients, Flt3
expression and phosphorylation are associated with MK dif-
ferentiation, as shown by an increased percentage of circulat-
ing CD34þFlt3þ cells expressing the CD41 MK antigen as well
as by the increased Flt3 expression on CD41þMK cells. Flt3
overexpression is maintained during CD41þMK derived from
PMF CD34þ cell culture, consistent with sustained Flt3
expression along the MK lineage in patients.
Whereaswehave shown that Flt3 overexpression is Jak2V617F
independent, its mechanism is still unknown. Actually, we did
not find any mutations of the Flt3 gene sequence that could
lead to the receptor activation, being compatible with a recent
study in PMF patients (38). Among other hypotheses, muta-
tions in the c-Cbl gene, an adapter protein that regulates the
ubiquitination of receptor protein tyrosine kinases, recently
reported in PMF (39), could participate in maintaining Flt3
membrane expression. Flt3 deregulation could be also second-
ary to other signals including epigenetic modifications, as
already shown for CXCR4 in PMF CD34þ cells (40).
Evidence for specific alterations of the FL/Flt3 couple in
PMF patients encouraged us to study its potential role in the
dysmegakaryopoiesis that characterizes the disease. Among
the different mechanisms proposed to be involved, NF-kB (41)
activation and IL-8 (30) overexpression are reported to parti-
cipate in this dystrophic process. Jak2V617F and MPLW515L/K
mutations that induce enhanced STAT signaling (42), are
suggested to indirectly activate MAPK pathways, known to
be important in MK differentiation and especially in endo-
mitosis (24). Our present data, showing in PMF MK cells (i) an
increased expression of Flt3 and its phosphorylation, (ii) a
modulation of gene profiling involved in MAPK signaling, (iii)
an increased phosphorylation of p38, p42/44, and JNKMAPKs,
(iv) an increased phosphorylation of p38 pathway effectors,
and (v) an activation of Flt3/p38-MAPK axis and an increase of
p38 target genes in response to FL, establish a link between
Flt3 and MAPK activation, and especially p38, in PMF MKs.
Participation of Flt3 signaling in the PMF dysmegakaryo-
poiesis through MAPK pathways is suggested by our results
showing that treatment with MAPK inhibitors or p38 RNA
silencing reverses MAPK phosphorylation and restores MK
differentiation. Our hypothesis that a sustained MAPK path-
way activation participates in MK maturation block observed
in PMF is also supported by our data showing that FL
stimulation of PMF MK precursors provokes an increase of
p38, recently reported to play a role in PMA (phorbol-12-
myristate-13-acetate)-induced MK differentiation of K562
cells (43). The presence of phospho-p38 in the cytoplasm of
polyploid MKs (Fig. 3B) strongly suggests its activation in
those cells (44). It is also consistent with the stabilization of
transcripts with 30UTR (untranslated regions) AU-rich
element-motif (ARE-motif; ref. 31) like IL-8, shown to be
upregulated in response to FL (Fig. 4D) and to participate
in PMF dysmegakaryopoiesis (30). The p38 phosphorylation
recently reported in BM sections from MPN patients (45)
confirms our data obtained in culture and supports our
hypothesis on p38 activation in PMF.
As expected, FL-induced MAPK phosphorylation is not
observed in HD MK precursors which no longer express
membrane Flt3. In contrast, in PMF patients, we suggest that
an elevated FL level maintains MAPK activation in MK pre-
cursors which abnormally expressed Flt3. Our data, showing
that Flt3 inhibition by either antibodies or gene silencing
improves the megakaryopoiesis in PMF CD34þ cultures and
reduces the p38–MAPK effector phosphorylation, reinforce
the role of Flt3/p38 axis in PMF dysmegakaryopoiesis. As IL-8
transcripts are suggested to be upregulated by FL stimulation
via p38 activation, it can be speculated that phospho-p38 may
participate in inflammation observed in PMF by stabilizing
transcripts for cytokines/chemokines participating in this
process (31). AP-1 and NFATc4 that are upregulated during
megakaryopoiesis (46), are overexpressed in response to FL in
MK-derived PMF CD34þ cells. Being partners in transcription,
they likely cooperate to induce transcription of genes involved
in such inflammatory process (47).
In PMF,CD34þ cells egress fromthebonemarrow tocirculate
and invade spleen and liver where an extramedullary hemato-
poiesis is developing. Several mechanisms, including distur-
bance of SDF-1a-CXCR4 axis (48) and increased extracellular
matrix proteolytic activity reducing HP adhesion to BM stroma
(49), can explain this migration. Besides its role in primitive
hematopoiesis, the FL/Flt3 couple has been reported to regulate
cell migration (27). Our data showing that FL stimulates the in
vitro migration of PMF MK precursors support the hypothesis
that the FL/Flt3 couple also participates in the abnormal
migration of MKs. In our experimental conditions, the FL-
dependent migration PMF MKs is not modified by addition
of SDF-1a, suggesting that both processes are differentially
regulated in those cells. This FL-dependent migration process
is p38 dependent, leading to the assumption that targeting p38
could reduce Flt3-expressing cell mobilization in patients.
Up to now, the general concept in PMF is that stromal
changes are secondary to the proliferation of hematopoietic
cells and especially of MKs. Recently, we have proposed that
an abnormal dialogue between hematopoietic and stromal
cells, resulting from microenvironmental niche alterations,
participates in the hematopoietic deregulation that charac-
terizes PMF (13). Our present demonstration that FL, over-
produced by stromal cells, participates in the altered
megakaryopoiesis, supports this hypothesis (35).
In conclusion, our results suggest that activation of the Flt3/
MAPK pathway and especially of p38–MAPK participate in
PMF dysmegakaryopoiesis, including alterations of prolifera-
tion/differentiation andmigration processes within an inflam-
matory context (Fig. 7).
Desterke et al.
Cancer Res; 71(8) April 15, 2011 Cancer Research2912
American Association for Cancer Research Copyright © 2011 on April 14, 2011cancerres.aacrjournals.orgDownloaded from
Published OnlineFirst April 12, 2011; DOI:10.1158/0008-5472.CAN-10-1731

The recent therapeutic strategies for PMF mainly target the
Jak2 kinase and some of the Jak2 inhibitors also inhibit the Flt3
kinase (50). The clinical efficacy of these inhibitors has been
ascribed to a general downregulation of inflammatory cyto-
kine production and signaling (29). Our data suggest that this
anti-inflammatory effect could be mediated, at least partially,
by the FL/Flt3/p38 axis. In this context, our patient group
predictive model, based on FL/MAPK response in MKs and
including clinicobiological data, could be powerful in the
therapeutic decision to use inhibitors also targeting the
Flt3 kinase.
Disclosure of Potential Conflicts of Interest
The authors declare no competing financial interest.
Acknowledgments
The authors thank Prof. Y. Masse, Drs. C. Blondeau and A. Touma (HôpitalIntercommunal, Aulnay-Sous-Bois, France), and G!en!eral M. Joussemet (JeanJulliard Army Blood Transfusion Center, Clamart, France) for supplying humanbone marrow and blood samples. They also thank Ms. Chantal Tisseuil, IDERecherche Clinique (CHU Dupytren, Limoges, France), and Ms. Corinne Graflfrom the Department of Internal Medicine I, Division of Haematology andHaemostaseology (Medical University of Vienna, Austria), for their tremendoushelp in supplying blood patient samples.
Grant Support
This work was supported by grants from the Association "NouvellesRecherches Biom!edicales" (ANRB), Convention de Recherche INCa no. PL054and no. R06031LP; the Association pour la Recherche contre le Cancer (ARC,9806), "Laurette Fugain" association (ALF/no. 06-06, project no. R06067LL), the"Contrat d’Interface" with Paul Brousse Hospital, the "Groupement d’Int!eret
Scientifique (GIS)-Institut des Maladies Rares 03/GIS/PB/SJ/no. 35, the Eur-opean Union-EUMNET Project (QLRT-2001-01123), INCa (PL054 and 2007-1-PL5-INSERM 11-1), and the "Ligue Contre le Cancer" (Equipe labellis!ee "LALIGUE 2010").
The costs of publication of this article were defrayed in part by the paymentof page charges. This article must therefore be hereby marked advertisement inaccordance with 18 U.S.C. Section 1734 solely to indicate this fact.
Members of the French INSERM Network on Myelofibrosis: Jean-FrancoisAbgrall, CHU de Brest, Brest, France; Chrystele Bilhou-Nab!era, CHU Kremlin-Bicetre, Kremlin-Bicetre, France; Dominique Bordessoule, CHR Dupuytren,Limoges, France; Jean-Henri Bourhis and St!ephane de Botton, IGR, Villejuif,France; Jean Bri"ere, CHU Beaujon, Clichy, France; Jean-Loup Demory, HôpitalCatholique de Lille, Lille, France; Brigitte Dupriez, CH Dr. Schaffner, Lens,France; Pierre Fenaux, Hôpital Avicenne, Bobigny, France; St!ephaneGiraudier, Hôpital H. Mondor, Cr!eteil and INSERM U790, Villejuif, France;Jean-Jacques Kiladjian, Hôpital Avicenne, Bobigny, France; Marie-Caroline LeBousse-Kerdil"es, INSERM U972, Villejuif, France; Jean-Max Pasquet, UMR 5533,Univ. Bordeaux 2, Bordeaux, France; Eric Lippert and Vincent Praloran, CHU deBordeaux, Bordeaux, France; Pierre Morel, CH Dr. Schaffner, Lens, France;J!erôme Rey, Institut Paoli-Calmette, Marseille, France; Lydia Roy, CHU Poitier,Poitier, France; Jean-Francois Viallard, CHU de Bordeaux, Bordeaux, France.
Members of the European EUMNET Network on Myelofibrosis: GiovanniBarosi, IRCCS Policlinico S. Matteo, Pavia, Italy; Francisco Cervantes, HospitalClinic, IDIBAPS, Barcelona, Spain; Heinz Gisslinger, Department of Hematologyand Blood Coagulation, University of Vienna, Austria; Martin Griesshammer,Department of Medicine III, University of Ulm, Ulm, Germany; Hans Hassel-balch, Department of Oncology-Hematology, Roskilde Hospital, University ofCopenhagen, Denmark; Hans Kreipe; Hannover, Germany; Hans M. Kvasnicka,University of Cologne, Germany; Rajko Kusec, University Hospital Merkur,Zagreb, Croatia; Monia Marchetti, IRCCS Policlinico S. Matteo, Pavia, Italy;Mats Merup, Karolinska Institute, Stockholm, Sweden; Heike Pahl, University ofFreiburg, Freiburg, Germany; Jan Palmblad, Karolinska Institute, Stockholm,Sweden; John T. Reilly, Royal Hallamshire Hospital, Sheffield, UK; Radek Skoda,University of Basel, Basel, Switzerland; Alessandro M. Vannucchi, University ofFlorence, Florence, Italy; Jurgen Thiele, Institute of Pathology, University ofCologne, Germany and the French INSERM Network members.
Received May 17, 2010; revised February 1, 2011; accepted February 15, 2011;published online April 12, 2011.
References
1. Pikman Y, Lee BH, Mercher T, McDowell E, Ebert BL, Gozo M, et al.
MPLW515L is a novel somatic activating mutation in myelofibrosis
with myeloid metaplasia. PLoS Med 2006;3:e270.
2. Pardanani AD, Levine RL, Lasho T, Pikman Y, Mesa RA, Wadleigh M,
et al. MPL515 mutations in myeloproliferative and other myeloid
disorders: a study of 1182 patients. Blood 2006;108:3472–76.
3. Baxter EJ, Scott LM, Campbell PJ, East C, Fourouclas N, Swan-
ton S, et al. Acquired mutation of the tyrosine kinase JAK2
in human myeloproliferative disorders. Lancet 2005;365:
1054–61.
4. James C, Ugo V, Le Couedic JP, Staerk J, Delhommeau F, Lacout
C, et al. A unique clonal JAK2 mutation leading to constitutive
Figure 7. Potential role of Flt3/
MAPK axis deregulation in PMF
pathogenesis. Pathophysiologic
model integrating the "FL/Flt3"
couple in PMF MK deregulation
through persistent p38–MAPK
activation.
FLT3-Mediated p38–MAPK Activation in PMF
www.aacrjournals.org Cancer Res; 71(8) April 15, 2011 2913
American Association for Cancer Research Copyright © 2011 on April 14, 2011cancerres.aacrjournals.orgDownloaded from
Published OnlineFirst April 12, 2011; DOI:10.1158/0008-5472.CAN-10-1731
signalling causes polycythaemia vera. Nature 2005;434:1144–
48.
5. Levine RL, Wadleigh M, Cools J, Ebert BL, Wernig G, Huntly BJ, et al.
Activating mutation in the tyrosine kinase JAK2 in polycythemia vera,
essential thrombocythemia, and myeloid metaplasia with myelofibro-
sis. Cancer Cell 2005;7:387–97.
6. Kralovics R, Passamonti F, Buser AS, Teo SS, Tiedt R, Passweg JR,
et al. A gain-of-function mutation of JAK2 in myeloproliferative dis-
orders. N Engl J Med 2005;352:1779–90.
7. Hibbin JA, Njoku OS, Matutes E, Lewis SM, Goldman JM. Myeloid
progenitor cells in the circulation of patients with myelofibrosis and
other myeloproliferative disorders. Br J Haematol 1984;57:495–03.
8. Jacobson RJ, Salo A, Fialkow PJ. Agnogenic myeloid metaplasia: a
clonal proliferation of hematopoietic stem cells with secondary mye-
lofibrosis. Blood 1978;51:189–94.
9. Wang JC, Lang HD, Lichter S, Weinstein M, Benn P. Cytogenetic
studies of bone marrow fibroblasts cultured from patients with mye-
lofibrosis and myeloid metaplasia. Br J Haematol 1992;80:184–88.
10. Bilhou-Nabera C, Brigaudeau C, Clay D, Andrieux J, Lai JL, Brouty-
Boye D, et al. Does cytogenetic mosaicism in CD34þCD38low cells
reflect the persistence of normal primitive hematopoietic progenitors
in myeloid metaplasia with myelofibrosis? Blood 2003;102:1551–52.
11. Castro-Malaspina H, Jhanwar SC. Properties of myelofibrosis-derived
fibroblasts. Prog Clin Biol Res 1984;154:307–22.
12. Martyre MC, Romquin N, Le Bousse-Kerdil"es MC, Chevillard S,
Benyahia B, Dupriez B, et al. Transforming growth factor-beta and
megakaryocytes in the pathogenesis of idiopathic myelofibrosis. Br J
Haematol 1994;88:9–16.
13. Lataillade JJ, Pierre-Louis O, Hasselbalch HC, Uzan G, Jasmin C,
MartyreMC, et al. Does primarymyelofibrosis involve a defective stem
cell niche? From concept to evidence. Blood 2008;112:3026–35.
14. Rosnet O, Schiff C, Pebusque MJ, Marchetto S, Tonnelle C, Toiron Y,
et al. Human FLT3/FLK2 gene: cDNA cloning and expression in
hematopoietic cells. Blood 1993;82:1110–19.
15. Broxmeyer HE, Lu L, Cooper S, Ruggieri L, Li ZH, Lyman SD. Flt3
ligand stimulates/costimulates the growth of myeloid stem/progenitor
cells. Exp Hematol 1995;23:1121–29.
16. Zhang S, Broxmeyer HE. Flt3 ligand induces tyrosine phosphorylation
of gab1 and gab2 and their association with shp-2, grb2, and PI3
kinase. Biochem Biophys Res Commun 2000;277:195–99.
17. Hannum C, Culpepper J, Campbell D, McClanahan T, Zurawski S,
Bazan JF, et al. Ligand for FLT3/FLK2 receptor tyrosine kinase
regulates growth of haematopoietic stem cells and is encoded by
variant RNAs. Nature 1994;368:643–48.
18. Mackarehtschian K, Hardin JD, Moore KA, Boast S, Goff SP,
Lemischka IR. Targeted disruption of the flk2/flt3 gene leads to
deficiencies in primitive hematopoietic progenitors. Immunity
1995;3:147–61.
19. McKenna HJ, Stocking KL, Miller RE, Brasel K, De Smedt T, Mar-
askovsky E, et al. Mice lacking flt3 ligand have deficient hematopoi-
esis affecting hematopoietic progenitor cells, dendritic cells, and
natural killer cells. Blood 2000;95:3489–97.
20. Ratajczak MZ, Ratajczak J, Ford J, Kregenow R, Marlicz W, Gewirtz
AM. FLT3/FLK-2 (STK-1) ligand does not stimulate human megakar-
yopoiesis in vitro. Stem Cells 1996;14:146–50.
21. Piacibello W, Garetto L, Sanavio F, Severino A, Fubini L, Stacchini A,
et al. The effects of human FLT3 ligand on in vitro human megakar-
yocytopoiesis. Exp Hematol 1996;24:340–46.
22. Kikushige Y, Yoshimoto G,Miyamoto T, Iino T, Mori Y, Iwasaki H, et al.
Human flt3 is expressed at the hematopoietic stem cell and the
granulocyte/macrophage progenitor stages to maintain cell survival.
J Immunol 2008;180:7358–67.
23. Li L, Piloto O, Nguyen HB, Greenberg K, Takamiya K, Racke F, et al.
Knock-in of an internal tandem duplication mutation into murine FLT3
confers myeloproliferative disease in a mouse model. Blood
2008;111:3849–58.
24. Guerriero R, Parolini I, Testa U, Samoggia P, Petrucci E, Sargiacomo
M, et al. Inhibition of TPO-induced MEK or mTOR activity induces
opposite effects on the ploidy of human differentiating megakaryo-
cytes. J Cell Sci 2006;119:744–52.
25. Chabanon A, Desterke C, Rodenburger E, Clay D, Guerton B, Boutin L,
et al. A cross-talk between stromal cell-derived factor-1 and trans-
forming growth factor-beta controls the quiescence/cycling switch of
CD34(þ) progenitors through FoxO3 and mammalian target of rapa-
mycin. Stem Cells 2008;26:3150–61.
26. Pfaffl MW. A new mathematical model for relative quantification in
real-time RT-PCR. Nucleic Acids Res 2001;29:e45.
27. Fukuda S, Broxmeyer HE, Pelus LM. Flt3 ligand and the Flt3 receptor
regulate hematopoietic cell migration by modulating the SDF-1alpha
(CXCL12)/CXCR4 axis. Blood 2005;105:3117–26.
28. Abecassis L, Rogier E, Vazquez A, Atfi A, Bourgeade MF. Evidence for
a role of MSK1 in transforming growth factor-beta-mediated
responses through p38alpha and Smad signaling pathways. J Biol
Chem 2004;279:30474–79.
29. Vannucchi AM. How do JAK2-inhibitors work in myelofibrosis: an
alternative hypothesis. Leukemia Res 2009;33:1581–83.
30. Emadi S, Clay D, Desterke C, Guerton B, Maquarre E, Charpentier A,
et al. IL-8 and its CXCR1 and CXCR2 receptors participate in the
control of megakaryocytic proliferation, differentiation, and ploidy in
myeloid metaplasia with myelofibrosis. Blood 2005;105:464–73.
31. Clark AR, Dean JL, Saklatvala J. Post-transcriptional regulation of
gene expression by mitogen-activated protein kinase p38. FEBS Lett
2003;546:37–44.
32. Patch RJ, Baumann CA, Liu J, Gibbs AC, Ott H, Lattanze J, et al.
Identification of 2-acylaminothiophene-3-carboxamides as potent
inhibitors of FLT3. Bioorg Med Chem Lett 2006;16:3282–86.
33. Dai Y, Hartandi K, Ji Z, Ahmed AA, Albert DH, Bauch JL, et al.
Discovery of N-(4-(3-amino-1H-indazol-4-yl)phenyl)-N’-(2-fluoro-5-
methylphenyl)urea (ABT-869), a 3-aminoindazole-based orally active
multitargeted receptor tyrosine kinase inhibitor. J Med Chem
2007;50:1584–97.
34. Barosi G, Viarengo G, Pecci A, Rosti V, Piaggio G, Marchetti M, et al.
Diagnostic and clinical relevance of the number of circulating CD34(þ)
cells in myelofibrosis with myeloid metaplasia. Blood 2001;98:3249–
55.
35. Brouty-Boye D, Briard D, Azzarone B, Le Bousse-KerdilesMC, Clay D,
Pottin-Clemenceau C, et al. Effects of human fibroblasts from mye-
lometaplasic and non-myelometaplasic hematopoietic tissues on
CD34þ stem cells. Int J Cancer 2001;92:484–88.
36. Lisovsky M, Braun SE, Ge Y, Takahira H, Lu L, Savchenko VG, et al.
Flt3-ligand production by human bone marrow stromal cells. Leuke-
mia 1996;10:1012–8.
37. Lyman SD, Williams DE. Biology and potential clinical applications of
flt3 ligand. Curr Opin Hematol 1995;2:177–81.
38. Abu-Duhier FM, Goodeve AC, Care RS, Gari M, Wilson GA, Peake IR,
et al. Mutational analysis of class III receptor tyrosine kinases (C-KIT,
C-FMS, FLT3) in idiopathic myelofibrosis. Br J Haematol
2003;120:464–70.
39. Grand FH, Hidalgo-Curtis CE, Ernst T, Zoi K, Zoi C, McGuire C, et al.
Frequent CBL mutations associated with 11q acquired uniparental
disomy in myeloproliferative neoplasms. Blood 2009;113:6182–92.
40. Bogani C, Ponziani V, Guglielmelli P, Desterke C, Rosti V, Bosi A, et al.
Hypermethylation of CXCR4 promoter in CD34 þcells from patients
with primary myelofibrosis. Stem Cells 2008;26:1920–30.
41. Komura E, Tonetti C, Penard-Lacronique V, Chagraoui H, Lacout C,
Lecouedic JP, et al. Role for the nuclear factor kappaB pathway in
transforming growth factor-beta1 production in idiopathic myelofi-
brosis: possible relationship with FK506 binding protein 51 over-
expression. Cancer Res 2005;65:3281–89.
42. Komura E, Chagraoui H, Mansat de Mas V, Blanchet B, de Sepulveda
P, Larbret F, et al. Spontaneous STAT5 activation induces growth
factor independence in idiopathic myelofibrosis: possible relationship
with FKBP51 overexpression. Exp Hematol 2003;31:622–30.
43. Chang YI, Hua WK, Yao CL, Hwang SM, Hung YC, Kuan CJ, et al.
Protein-arginine methyltransferase 1 suppresses megakaryocytic dif-
ferentiation via modulation of the p38 MAPK pathway in K562 cells.
J Biol Chem 2010;285:20595–606.
44. Ben-Levy R, Hooper S, Wilson R, Paterson HF, Marshall CJ. Nuclear
export of the stress-activated protein kinase p38 mediated by its
substrate MAPKAP kinase-2. Curr Biol 1998;8:1049–57.
Desterke et al.
Cancer Res; 71(8) April 15, 2011 Cancer Research2914
American Association for Cancer Research Copyright © 2011 on April 14, 2011cancerres.aacrjournals.orgDownloaded from
Published OnlineFirst April 12, 2011; DOI:10.1158/0008-5472.CAN-10-1731

45. Shahjahan M, Dunphy CH, Ewton A, Zu Y, Monzon FA, Rice L, et al.
p38 mitogen-activated protein kinase has different degrees of activa-
tion in myeloproliferative disorders and myelodysplastic syndromes.
Am J Clin Pathol 2008;130:635–41.
46. Kiani A, Kuithan H, Kuithan F, Kyttala S, Habermann I, Temme A,
et al. Expression analysis of nuclear factor of activated T cells
(NFAT) during myeloid differentiation of CD34þ cells: regulation
of Fas ligand gene expression in megakaryocytes. Exp Hematol
2007;35:757–70.
47. Macian F, Lopez-Rodriguez C, Rao A. Partners in transcription: NFAT
and AP-1. Oncogene 2001;20:2476–89.
48. Guglielmelli P, Zini R, Bogani C, Salati S, Pancrazzi A, Bianchi E,
et al. Molecular profiling of CD34þ cells in idiopathic myelofibrosis
identifies a set of disease-associated genes and reveals the clinical
significance of Wilms’ tumor gene 1 (WT1). Stem Cells 2007;25:
165–73.
49. Xu M, Bruno E, Chao J, Huang S, Finazzi G, Fruchtman SM, et al.
Constitutive mobilization of CD34þ cells into the peripheral blood in
idiopathic myelofibrosis may be due to the action of a number of
proteases. Blood 2005;105:4508–15.
50. Barosi G, Rosti V. Novel strategies for patients with chronic myelo-
proliferative disorders. Curr Opin Hematol 2009;16:129–34.
FLT3-Mediated p38–MAPK Activation in PMF
www.aacrjournals.org Cancer Res; 71(8) April 15, 2011 2915
American Association for Cancer Research Copyright © 2011 on April 14, 2011cancerres.aacrjournals.orgDownloaded from
Published OnlineFirst April 12, 2011; DOI:10.1158/0008-5472.CAN-10-1731

156

4/ Rôle de la régulation épigénétique dans les anomalies d’expression de Flt3 et la migration des précurseurs mégacaryocytaires; Résultats préliminaires
Nos résultats précédents montrent que chez les patients, le gène FLT3 est situé 2
mégabases en amont de la borne de délétion 13q14. Ceci suggère que la dérégulation de
l’expression de Flt3 dans les cellules CD34+ et les mégacaryocytes n’est vraisemblablement
pas la conséquence directe d’une anomalie génétique quantitative. De plus, la diminution de
son expression dans les progéniteurs hématopoïétiques et son augmentation au cours de la
différenciation mégacaryocytaire nous oriente vers une dérégulation épigénétique de cette
modulation. Afin de confirmer cette hypothèse, nous avons analysé le rôle potentiel d’une
méthylation et/ou acétylation du promoteur de Flt3 sur son expression membranaire.
L’implication fonctionnelle d’une telle régulation a été également évaluée sur la migration des
mégacaryocytes en réponse au Flt3-ligand.
4.1/ Prédiction bioinformatique de la présence d’îlots CpG, cibles de la méthylation, dans la région promotice de Flt3
On peut prédire par bioinformatique la susceptibilité de méthylation de l’ADN d’un
promoteur en recherchant les ilots CpG en amont du codon d’initiation de la transcription. Les
algorithmes bioinformatiques (dont l’algorithme Bimas) que nous avons utilisés prédisent un
îlot CpG localisé 2000 pb en amont du codon d’initiation du gène FLT3 et des sites de
fixation de facteurs de transcription (UCE-2, element II rs-3, AP-2, sp1) (Figure 44). La
méthylation du promoteur FLT3 pourrait donc entraîner une inhibition de l’accès de la région
promotrice à ces facteurs de transcription et en conséquence, une diminution de son
expression.
159

Figure 44 : Organisation du promoteur du gène FLT3 sur le chromosome 13 et prédiction
bioinformatique d’ilots CpG et des sites de fixation de facteurs de transcription
160
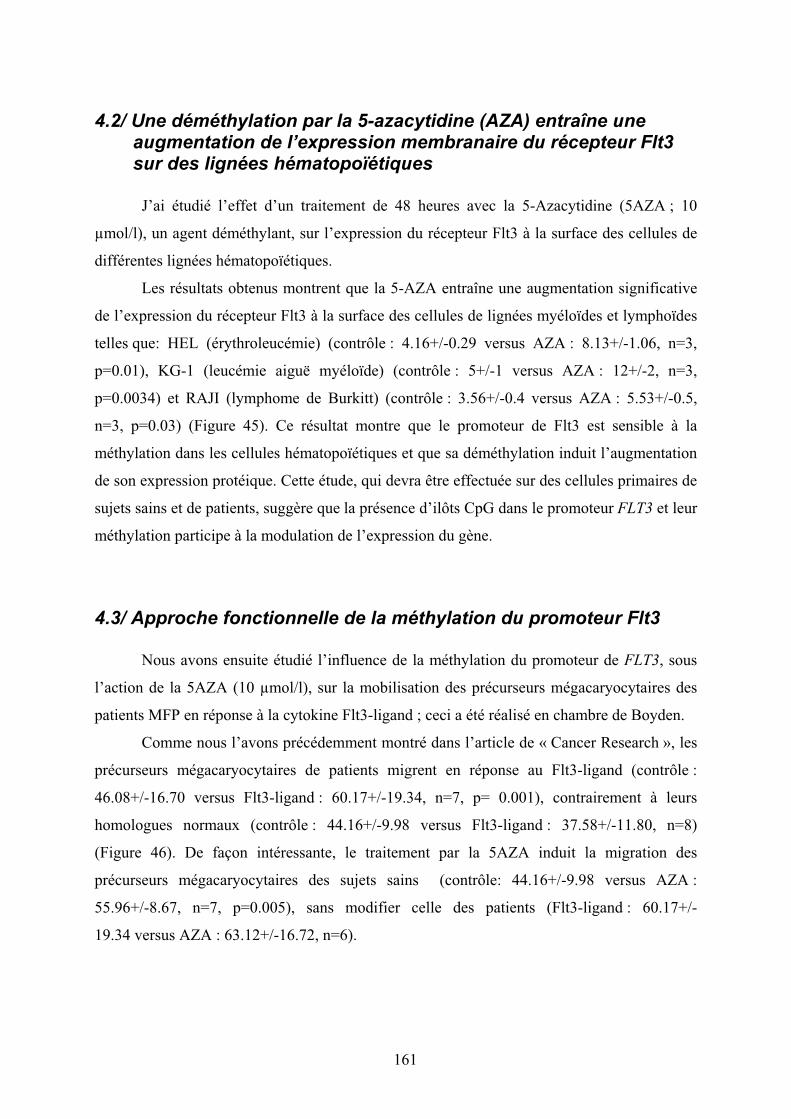
4.2/ Une déméthylation par la 5-azacytidine (AZA) entraîne une augmentation de l’expression membranaire du récepteur Flt3 sur des lignées hématopoïétiques
J’ai étudié l’effet d’un traitement de 48 heures avec la 5-Azacytidine (5AZA ; 10
µmol/l), un agent déméthylant, sur l’expression du récepteur Flt3 à la surface des cellules de
différentes lignées hématopoïétiques.
Les résultats obtenus montrent que la 5-AZA entraîne une augmentation significative
de l’expression du récepteur Flt3 à la surface des cellules de lignées myéloïdes et lymphoïdes
telles que: HEL (érythroleucémie) (contrôle : 4.16+/-0.29 versus AZA : 8.13+/-1.06, n=3,
p=0.01), KG-1 (leucémie aiguë myéloïde) (contrôle : 5+/-1 versus AZA : 12+/-2, n=3,
p=0.0034) et RAJI (lymphome de Burkitt) (contrôle : 3.56+/-0.4 versus AZA : 5.53+/-0.5,
n=3, p=0.03) (Figure 45). Ce résultat montre que le promoteur de Flt3 est sensible à la
méthylation dans les cellules hématopoïétiques et que sa déméthylation induit l’augmentation
de son expression protéique. Cette étude, qui devra être effectuée sur des cellules primaires de
sujets sains et de patients, suggère que la présence d’ilôts CpG dans le promoteur FLT3 et leur
méthylation participe à la modulation de l’expression du gène.
4.3/ Approche fonctionnelle de la méthylation du promoteur Flt3
Nous avons ensuite étudié l’influence de la méthylation du promoteur de FLT3, sous
l’action de la 5AZA (10 µmol/l), sur la mobilisation des précurseurs mégacaryocytaires des
patients MFP en réponse à la cytokine Flt3-ligand ; ceci a été réalisé en chambre de Boyden.
Comme nous l’avons précédemment montré dans l’article de « Cancer Research », les
précurseurs mégacaryocytaires de patients migrent en réponse au Flt3-ligand (contrôle :
46.08+/-16.70 versus Flt3-ligand : 60.17+/-19.34, n=7, p= 0.001), contrairement à leurs
homologues normaux (contrôle : 44.16+/-9.98 versus Flt3-ligand : 37.58+/-11.80, n=8)
(Figure 46). De façon intéressante, le traitement par la 5AZA induit la migration des
précurseurs mégacaryocytaires des sujets sains (contrôle: 44.16+/-9.98 versus AZA :
55.96+/-8.67, n=7, p=0.005), sans modifier celle des patients (Flt3-ligand : 60.17+/-
19.34 versus AZA : 63.12+/-16.72, n=6).
161
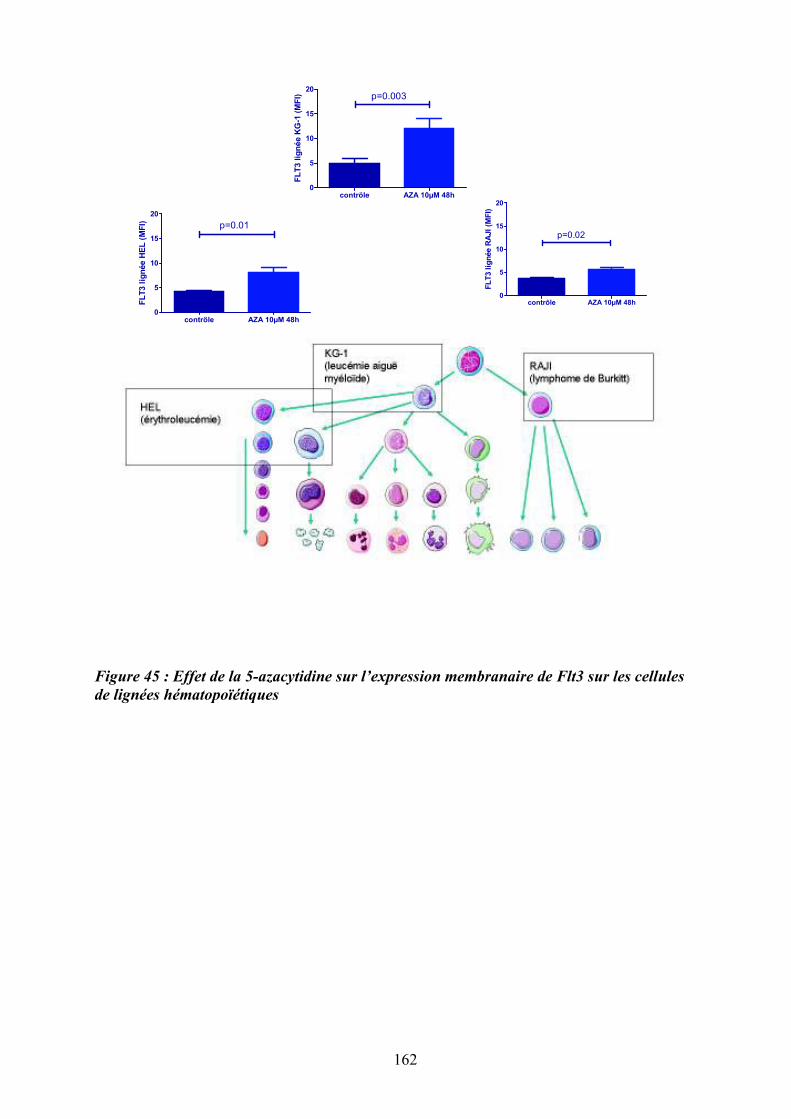
contröle AZA 10µM 48h0
5
10
15
20p=0.003
FL
T3 lig
née K
G-1
(M
FI)
contrôle AZA 10µM 48h0
5
10
15
20
p=0.02
FL
T3 l
ign
ée R
AJI
(MF
I)
contröle AZA 10µM 48h0
5
10
15
20
p=0.01
FL
T3 l
ign
ée H
EL
(M
FI)
Figure 45 : Effet de la 5-azacytidine sur l’expression membranaire de Flt3 sur les cellules
de lignées hématopoïétiques
162

Ces résultats montrent que, chez les sujets sains, la déméthylation de l’ADN favorise
la migration des précurseurs mégacaryocytaires en réponse au Flt3-ligand alors qu’elle est
sans influence chez les patients. Cette absence d’effet de la 5AZA sur la migration des
précurseurs mégacaryocytaires des patients pourrait être expliquée par une déméthylation déjà
existante au stade progéniteur et persistant au cours de la différenciation mégacaryocytaire.
4.4/ Approche fonctionnelle de l’acétylation des histones
Nous avons également testé l’influence de la trichostatine A (TSA ; un inhibiteur des
histones déacétylases) sur la migration (Flt3-ligand)-dépendante des précurseurs
mégacaryocytaires. La TSA, un inhibiteur des HDAC, induit une hyperacétylation de l’ADN
et l’expression des gènes par décondensation de l’ADN.
De la même façon que pour l’effet de la 5AZA, l’addition de trichostatine A stimule la
migration des précurseurs mégacaryocytaires de sujets sains en présence de Flt3-ligand
(contrôle : 44.16+/-9.98 v.s. Trichostatine A : 61.33+/-10.32, n=8, p<0.0001). Au contraire,
chez les patients, l’addition de trichostatine A annule leur migration en réponse au Flt3-ligand
(contrôle : 46.08+/-16.70 v.s. Trichostatine A : 42.20+/-16.12, n=7, p=0.0001) (figure 47).
L’effet differentiel de la trichostatine A sur la migration des précurseurs
mégacaryocytaires chez les sujets sains et les patients suggère qu’une modification de
l’acétylation des histones intervient dans la régulation de la migration (Flt3-ligand)-
dépendante des précurseurs mégacaryocytaires de sujets sains.
4.3.1/ Le Flt3-ligand induit une modification de l’acétylation des histones et plus particulièrement de l’histone H4 en Lysine 8
L’hyperacétylation des histones observée chez les patients en réponse au Flt3-ligand
nous a incité à rechercher l’histone et la lysine cibles de cette acétylation. Dans ce but, nous
avons quantifié le pourcentage de précurseurs mégacaryocytaires présentant un résidu lysine
d’histone acétylé déterminé (H2aK5, H2bK5, H3K27 et H4K8) par cytométrie en flux, après
stimulation par le Flt3-ligand (50 ng/ml pendant 48 heures).
La Figure 48 montre que, chez les patients, la stimulation par le Flt3-ligand ne modifie
pas le pourcentage de cellules présentant une acétylation des 1) lysine 5 de l’histone H2a
(contrôle : 20.28+/-5.68 versus Flt3-ligand : 15.34+/-8.32, n=6), 2) lysine 5 de l’histone H2b
(contrôle : 18.63+/-10.68 versus Flt3-ligand : 20.53+/-11.86, n=6) et 3) lysine 27 de l’histone
163

H3 (contrôle : 6.69+/-9.83 versus Flt3-ligand : 4.23+/-4.07, n=6). Par contre, cette stimulation
entraîne une augmentation du pourcentage de cellules présentant une l’acétylation de la lysine
8 de l’histone H4 (contrôle : 27.95+/-18.82 versus Flt3-ligand : 54.52+/-29.31, n=6, p=0.04).
Ceci suggère que, chez les patients, l’influence de l’acétylation sur la migration Flt3-ligand
dépendante pourrait être liée une acétylation de la lysine 8 de l’histone H4.
Bien que ces résultats soient très préliminaires, nous avons choisi de les présenter pour
étayer l’hypothèse d’une possible régulation épigénétique de l’expression de Flt 3 chez les
patients et de son rôle potentiel dans la réponse migratoire des précurseurs mégacaryocytaires
au Flt3-ligand.
164
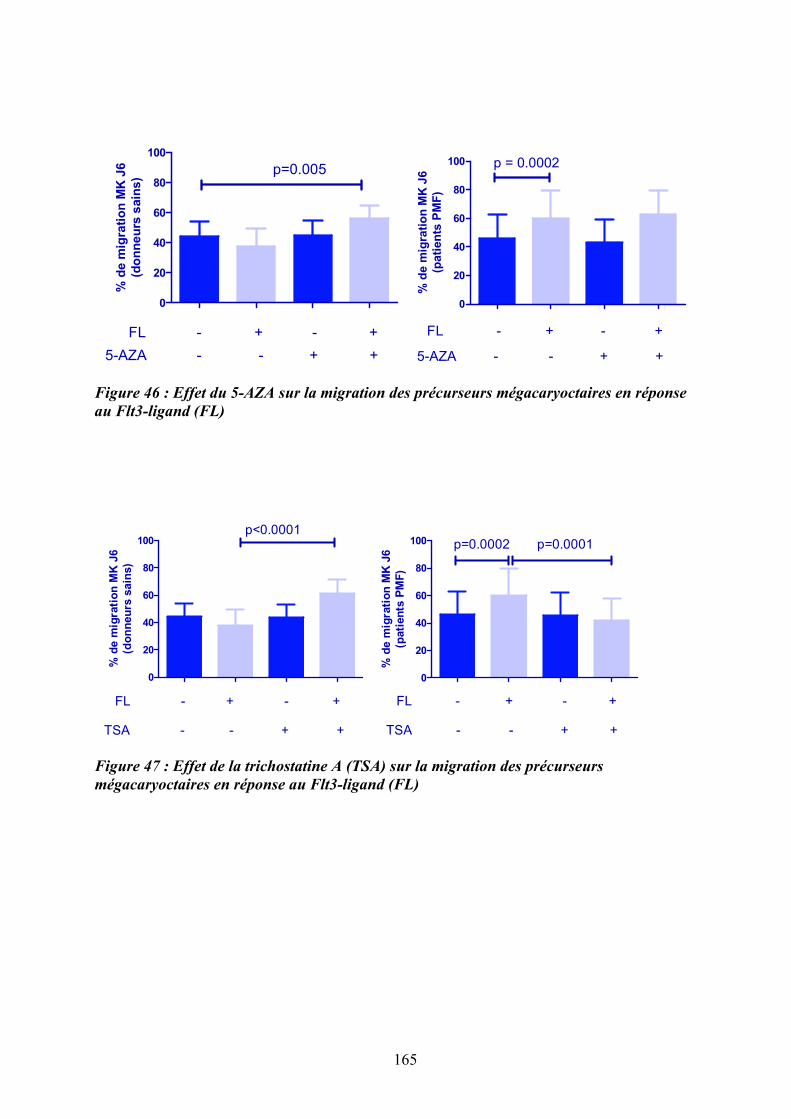
0
20
40
60
80
100
FL
5-AZA
+ +
+ +
--
- -
p=0.005
% d
e m
igra
tio
n M
K J
6
(do
nn
eu
rs s
ain
s)
0
20
40
60
80
100 p = 0.0002
FL
5-AZA
- + - +
- - + +
% d
e m
igra
tio
n M
K J
6
(pati
en
ts P
MF
)
Figure 46 : Effet du 5-AZA sur la migration des précurseurs mégacaryoctaires en réponse
au Flt3-ligand (FL)
0
20
40
60
80
100p<0.0001
FL
TSA
- + - +
+ +- -
% d
e m
igra
tio
n M
K J
6
(do
nn
eu
rs s
ain
s)
0
20
40
60
80
100 p=0.0002 p=0.0001
FL
TSA
- + - +
+ +- -
% d
e m
igra
tio
n M
K J
6
(pati
en
ts P
MF
)
Figure 47 : Effet de la trichostatine A (TSA) sur la migration des précurseurs
mégacaryoctaires en réponse au Flt3-ligand (FL)
165
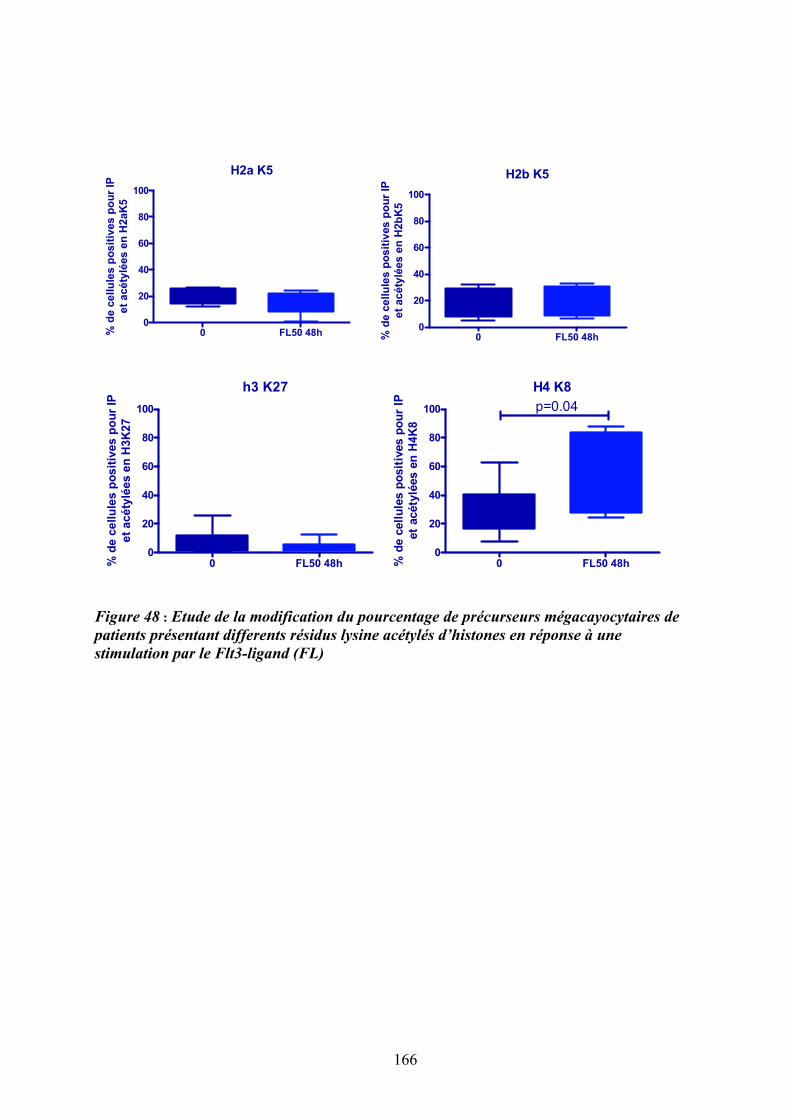
H2a K5
0 FL50 48h0
20
40
60
80
100
% d
e c
ell
ule
s p
osit
ives p
ou
r IP
et
acéty
lées e
n H
2aK
5
H2b K5
0 FL50 48h0
20
40
60
80
100
% d
e c
ellu
les p
osit
ives
po
ur
IP
et
ac
éty
lées
en
H2b
K5
h3 K27
0 FL50 48h0
20
40
60
80
100
% d
e c
ell
ule
s p
os
itiv
es
po
ur
IP
et
acé
tylé
es e
n H
3K
27
H4 K8
0 FL50 48h0
20
40
60
80
100 p=0.04%
de c
ell
ule
s p
osit
ives p
ou
r IP
et
acéty
lées e
n H
4K
8
Figure 48 : Etude de la modification du pourcentage de précurseurs mégacayocytaires de
patients présentant differents résidus lysine acétylés d’histones en réponse à une
stimulation par le Flt3-ligand (FL)
166

DISCUSSION ET PERSPECTIVES
167

168
La myélofibrose primitive est un néoplasme myéloprolifératif chronique BCR-ABL1-
négatif associant une dérégulation de l’hématopoïèse (myéloprolifération,
dysmégacaryopoïèse et migration des CSH/PH) à une altération du stroma médullaire et
splénique (ostéomyélofibrose, néoangiogenèse). Le mégacaryocyte est un acteur majeur de sa
pathogenèse, via la production exacerbée de cytokines et facteurs fibrosants, dans un contexte
inflammatoire.
De nombreux arguments suggèrent que les mutations JAK2V617F et MPL515L/K qui
caractérisent les NMP ne sont vraisemblablement pas les événements initiaux de la
myélofibrose primitive car elles ne sont retrouvées que chez la moitié des patients
(§Introduction). L’objectif du travail qui a fait l’objet de ma thèse a été de rechercher si
d’autres anomalies, géniques ou non, pourraient expliquer la pathogenèse de la MFP. Pour
cela, parallèlement à une démarche génomique (transcriptome et CGH array), nous avons
développé une approche de biologie cellulaire ciblée sur le microenvironnement.
1/ De la recherche d’anomalies génomiques à l’identification du cluster « FLT » à proximité de la délétion 13q14-13q21 et d’une dérégulation du gène FLT3
L’approche génomique que nous avons tout d’abord choisie visait à identifier de
nouvelles régions génomiques pouvant être responsables de l’anomalie clonale initiale. Cette
approche ne nous a hélas pas permis de mettre en évidence de nouveaux gènes cibles et en
particulier, de gènes tels que JAK2. En effet, alors que ce travail venait de commencer, la
découverte de la mutation Jak2 n’était pas encore publiée. Plusieurs explications peuvent être
proposées pour expliquer nos résultats. Bien que l’on ne puisse écarter la présence d’un
mosaïcisme au sein des populations cellulaires étudiées (PH CD34+ et polynucléaires
purifiés), ces cellules appartiennent au clone pathologique et portent donc très
vraisemblablement les anomalies géniques recherchées. Il est donc possible que les
techniques que nous avons utilisées manquaient de sensibilité. En effet, les puces BAC (CIT
Curie) utilisées au début de notre étude (début 2005) et qui privilégiaient des régions
impliquées dans les tumeurs solides, ne recouvraient peut-être pas, ou peu, de régions
impliquées dans l’hématopoïèse. Les puces que nous avons utilisées ultérieurement sur une
dizaine de patients étaient de type 44K, c'est-à-dire avec un seuil de sensibilité de l’ordre de
0.5 Mb et seules les cellules de deux patients ont été hybridées sur des puces 244K, plus
sensibles. Ce manque de sensibilité technique peut donc expliquer l’absence de détection d’un
169

remaniement (délétion, amplification) « sentinelle » qui aurait pu attirer notre attention sur la
cible JAK2 par exemple. De plus, compte tenu de la fréquence de la mutation touchant
environ 50% des patients atteints de MFP, le nombre limité de patients étudiés, de l’ordre
d’une dizaine, ne nous plaçait pas dans des conditions optimales pour la pressentir. Seule une
approche de type « microsatellites » (SNP) ciblées sur le 9p aurait pu nous permettre de
l’identifier. Une telle étude a été également entreprise mais n’a pas abouti en raison de notre
difficulté à obtenir, rétrospectivement, l’ADN constitutionnel des patients étudiés dont le
recrutement était très dispersé à l’échelle Européenne. En effet, en 2004-2005, on commençait
à peine à prendre conscience de l’importance de l’ADN constitutionnel comme référence pour
distinguer les anomalies délétères observées, des polymorphismes.
N’ayant pas identifié d’autres anomalies génomiques que celles décrites dans la
littérature (délétions 12q, 13q, 20q et trisomie 1q), cette approche génomique aurait donc pu
paraître décevante. Cependant, elle s’est avérée très utile car elle nous a permis de préciser les
bornes de la région 13q délétée dans les PH CD34+ et les polynucléaires des patients. En effet,
parmi les anomalies génomiques que nous avons identifiées par CGH array, celle qui
paraissait la plus en concordance avec l’hypothèse d’une altération du dialogue CSH/PH-
stroma (Lataillade et al., 2008) était la délétion de la région chromosomique minimale 13q14-
13q21, située à 2 mégabases (télomérique) du cluster FLT dans lequel est localisé le gène
FLT3.
Plusieurs arguments expérimentaux étayaient notre choix : i) la comparaison des
données de CGH array et du transcriptome (réalisé sur les cellules CD34+ et
mégacaryocytaires des patients) ciblées sur cette région 13q, montrait l’existence d’une
modulation d’expression de gènes inclus dans la zone de délétion 13q et dans le cluster FLT,
dont le gène FLT3, ii) Flt3 est un récepteur clé de la régulation de l’hématopoïèse primitive et
est souvent impliqué dans la pathogenèse d’hémopathies malignes et iii) son ligand, Flt3-
ligand, est majoritairement produit par le stroma hématopoïétique.
Ces différents résultats nous ont alors conduits à rechercher si le couple Flt3-
ligand/Flt3 était impliqué dans la dérégulation de l’hématopoïèse et plus particulièrement dans
la dysmégacaryopoïèse observée chez les patients atteints de MFP.
170

2/ D’une dérégulation du gène FLT3 à une activation de la voie des MAPKs p38 ; de nouveaux acteurs de la pathogenèse de la myélofibrose primitive ?
Notre étude met en évidence une dérégulation de Flt3 et des MAPKs p38 dans les
PH CD34+ et les MK des patients atteints de MFP et ceci, quelque soit leur statut mutationnel
Jak2. Elle démontre également que la persistance de la stimulation de l’axe Flt3/p38 en
réponse à une production accrue de Flt3-ligand, participe à la dysmégacaryopoïèse qui
caractérise la maladie. Les résultats énoncés ci-après viennent étayer cette hypothèse, à savoir
: 1) une augmentation du taux sérique de Flt3-ligand et de son expression par les cellules du
stroma médullaire et splénique ainsi que par les PH des patients atteints de MFP, 2) une
surexpression spécifique de son récepteur Flt3 et de sa phosphorylation dans les cellules
CD34+ et les progéniteurs mégacaryocytaires (MK), qui persistent au cours de la
différenciation MK, quelque soit le statut mutationnel de Jak2 des patients, 3) une activation
de Flt3 dans les progéniteurs MK en réponse au Flt3-ligand conduisant à la phosphorylation
en cascade de la voie de signalisation des MAPKs p38 et à l’expression de ses gènes cibles, 4)
une restauration de la mégacaryopoïèse et une inhibition de la migration (Flt3-ligand)-
dépendante des progéniteurs MK des patients après inhibition d’Flt3 ou de p38.
Nos résultats suscitent de nombreuses interrogations. Dans cette discussion, nous
avons privilégié une réflexion sur les points suivants: 1) quelles sont les causes de la
surexpression spécifique du Flt3-ligand et de son récepteur Flt3 chez les patients atteints de
MFP, quelque soit leur statut mutationnel Jak2? 2) en quoi les conséquences de l’activation de
l’axe Flt3/p38 participent-t-elles à la dérégulation de la mégacaryopoïèse et au processus
inflammatoire qui caractérise la MFP ? 3) quel rôle peut-on attribuer à l’axe Flt3-
ligand/Flt3/p38 dans l’altération du dialogue cellules hématopoïétiques-stroma et en quoi
étaye-t-il notre hypothèse physiopathologique du « Bad seed in Bad soil » ? 4) sur la base de
nos résultats, peut-on proposer des approches ciblées en particulier sur l’axe Flt3-
ligand/Flt3/p38 comme thérapies adjuvantes, en raison de leur action potentielle sur
l’inflammation ? 5) comment peut-on intégrer nos résultats dans la hiérarchie des évènements
moléculaires agrégeant les syndromes myéloprolifératifs ?
171

2.1/ Une augmentation de l’expression de Flt3 et de son ligand Flt3-ligand : une « spécificité » de la MFP, quelque soit le statut mutationnel Jak2 des patients
Le couple Flt3-ligand/Flt3 joue un rôle important dans la survie et la prolifération des
cellules souches hématopoïétiques. Il a été proposé que l’autocrinie de production de Flt3-
ligand par les cellules leucémiques exprimant Flt3 contribuait au processus leucémogène
(Drexler, 1996). Dans notre travail, nous avons observé une augmentation de la concentration
plasmatique de Flt3-ligand chez les patients atteints de myélofibrose primitive ; celle-ci
semble spécifique de cette maladie puisqu’elle n’est pas observée chez les patients atteints
d’autres néoplasmes myéloprolifératifs BCR-ABL1 négatifs tels que la PV et la TE. De façon
intéressante, cette augmentation n’est pas liée à la présence de la mutation Jak2V617F
puisqu’elle est observée chez les patients quelque soit leur statut mutationnel.
Le Flt3-ligand est un régulateur majeur de l'homéostasie hématopoïétique en
particulier dans les situations d'aplasie médullaire. En effet, une augmentation du taux sérique
et plasmatique de Flt3-ligand est fréquemment observée lors d’un défaut de production
médullaire comme par exemple dans l’anémie de Fanconi, l’aplasie médullaire idiopathique et
les insuffisances médullaires radio- et chimio-induites (Lyman et al., 1995) (Prat et al., 2006).
Chez les patients atteints de MFP, on observe également une aplasie médullaire
progressive. N’ayant pas eu accès au chiffre de CD34+ circulantes chez les patients pour
lesquels nous avons dosé le taux de Flt3-ligand, nous n’avons pas pu établir de corrélation
entre le taux sérique de Flt3-ligand et le nombre de cellules CD34+. Une telle étude serait
intéressante pour rechercher si le Flt3-ligand pourrait être un bio indicateur de l’insuffisance
médullaire dans la MFP.
Le Flt3-ligand est produit par différents types cellulaires et principalement par les
cellules stromales endothéliales et mésenchymateuses. Dans les cellules endothéliales, cette
production peut être constitutive ou induite par différents facteurs tels que le TGF-", l’INF-!,
MIP-1! ou le ligand du CD40, une molécule de la superfamille du TNF (Solanilla, Grosset et
al., 2000) (Solanilla, Dechanet et al., 2000). Dans les cellules souches mésenchymateuses,
Flt3-ligand est produit après induction par le TNF-! (Dormady, Bashayan, Dougherty, Zhang,
& Basch, 2001), l’IL-1 (Lisovsky et al., 1996) et l’IL-6 (Peters, Solem, Goldschmidt,
Schirmacher, & Rose-John, 2001). Il peut être également exprimé, comme son récepteur Flt3,
par les progéniteurs hématopoïétiques et agir alors de façon autocrine/paracrine sur leur
prolifération (Weisel, Yildirim, Schweikle, Kanz, & Mohle, 2009). Chez les patients atteints
de MFP, l’expression moléculaire et protéique de Flt3-ligand est significativement augmentée
172

dans les cellules CD34+ de sang périphérique ainsi que dans les CSM médullaires et
spléniques. Il est vraisemblable que les cellules endothéliales des patients soient également
une source de Flt3-ligand mais nous n’avons pu l’étudier par manque de cellules endothéliales
purifiées. Une étude sur coupe histologique de moelle ou de rate nous permettra d’aborder
plus facilement ce point. L’expression du ligand Flt3-ligand est augmentée en réponse à de
nombreuses cytokines inflammatoires. La myélofibrose primitive est une pathologie dans
laquelle le contexte inflammatoire est particulièrement développé (Vannucchi, 2009). Il est
donc très vraisemblable que l’orage cytokinique qui la caractérise participe à cette
augmentation.
Dans notre étude, l’expression protéique du récepteur Flt3 est augmentée chez les
patients dans les progéniteurs hématopoïétiques pluripotents CD34+ mais également
mégacaryocytaires. Ce profil d’expression est maintenu au cours de la différenciation MK
chez les patients alors qu’elle disparaît rapidement chez les sujets sains. De façon surprenante,
contrairement aux progéniteurs MK, l’expression moléculaire de Flt3 est « downrégulée »
dans les cellules CD34+. Différents mécanismes peuvent contribuer à la modulation
d’expression de Flt3 dans les CD34+ et au cours de la mégacaryopoïèse. Parmi ceux-ci, citons,
des mutations du gène FLT3, des mutations de Cbl, une dérégulation épigénétique…
Nous n’avons pas trouvé de mutations dans le gène FLT3, et en particulier pas de
duplications internes en tandem (FLT3-ITD), confirmant les données d’Abu-Duhier et al
(Abu-Duhier et al., 2003). De plus, dans le cadre d’une collaboration avec le groupe de S.
Giraudier (Inserm U1009, Villejuif), nous n’avons pas identifié d’autres mutations de FLT3,
suggérant que la modulation de son expression ne résulte pas de modification de la séquence
du gène. Des mutations de Cbl ont été décrites chez environ 6% des patients atteints de
MFP ; cette protéine contrôle, par ubiquitinylation, la dégradation de récepteurs tels que c-Kit,
Tpo et Flt3... Il a été montré qu’après fixation du ligand Flt3-ligand, Flt3 est ubiquitinylé par
Cbl sauvage mais non par la forme mutante R420Q, principalement retrouvée chez les
patients (Sargin et al., 2007). Ainsi, l’absence de dégradation de Flt3 secondaire à l’altération
de l’activité ubiquitine ligase de Cbl pourrait expliquer la dérégulation de l’expression de Flt3
observée dans les cellules hématopoïétiques des patients. Chez les patients porteurs de la
mutation Jak2, ce processus serait Jak2 indépendant et conférerait un avantage prolifératif des
cellules Cbl mutées sur le clone Jak2V617F (Grand et al., 2009). Il serait donc intéressant de
rechercher la présence de telles mutations chez les patients que nous avons étudiés. Les
données de la littérature montrent que seuls 6% des patients présente une mutation Cbl (Grand
173
et al., 2009), ce qui suggère que d’autres évènements participent très vraisemblablement à la
dérégulation de l’expression de Flt3.
Comme cela a été proposé pour CXCR4 (Bogani et al., 2008) pour lequel une
hyperméthylation du promoteur participe à la sous-expression chez les patients, une
régulation épigénétique du gène FLT3 pourrait également être envisagée. Le cluster FLT,
comprenant le gène FLT3, est localisé en amont de région de délétion 13q14 et les gènes qui
le composent sont sous-exprimés (cartographie chromosomique du transcriptome).
L’hypothèse d’une régulation épigénétique du gène FLT3 est renforcée par la présence d’un
ilot CpG en amont du codon start (analyse bioinformatique de la séquence promotrice FLT3).
Nos résultats préliminaires, montrant que la 5AZA (agent déméthylant) et la TSA (agent
acétylant) modulent l’expression de Flt3 et la migration (Flt3-ligand)-dépendante des
précurseurs MK des patients, confortent également cette hypothèse. En effet, contrairement
aux sujets sains, le gène FLT3 est déméthylé chez les patients et cette déméthylation persiste
au cours de la différenciation mégacaryocytaire. Bien que l’effet de la méthylation du
promoteur FLT3 sur l’expression protéique du gène doive être confirmé sur les cellules
primaires des patients, l’effet de la 5AZA sur la migration (Flt3-ligand)-dépendante des
progéniteurs MK suggère l’implication du statut de méthylation de promoteur FLT3 sur la
fonction du gène et l’activité biologique de la protéine. Cette hypothèse sera confirmée par
l’étude du statut de méthylation du promoteur en utilisant des techniques spécifiques telles
que le pyroséquencage après traitement au bisulfite par exemple.
L’effet différentiel observé sur la migration des précurseurs mégacaryocytaires entre
les sujets sains et les patients après action de la trichostatine A (agent acétylant) laisse
supposer une possible différence d’acétylation du promoteur de FLT3 et son hyper-acétylation
chez les patients. Chez ces derniers, nos résultats suggèrent que l’influence de l’acétylation
sur la migration (Flt3-ligand)-dépendante pourrait être liée à une acétylation de la lysine 8 de
l’histone H4. Il est intéressant de noter l’implication de celle-ci dans les mécanismes liés au
stress oxydatif et dans la libération d’IL-8 participant à la réponse inflammatoire (Tomita,
Barnes, & Adcock, 2003).
174

2.2/ Comment l’activation de la voie Flt3/p38 participe-t-elle à la dérégulation de la mégacaryopoïèse?
La fixation du ligand Flt3-ligand sur son récepteur spécifique Flt3 entraîne la
dimérisation du récepteur et l'activation de son domaine tyrosine kinase qui est stabilisé par
auto-phosphorylation. Flt3 phosphorylé transduit des signaux d'activation mitogénique grâce à
différentes voies de signalisation comme la voie Ras/MAPK, la voie PI3K...
Chez les patients, la surexpression du Flt3 est associée à une augmentation de son
niveau de phosphorylation dans les cellules CD34+ et au maintien de cette
phosphorylation au cours de la différenciation MK. L’augmentation de la production du
Flt3-ligand chez les patients participe très vraisemblablement au maintien de son activation.
Les résultats de notre étude transcriptomique ayant mis en évidence une dérégulation de
l’expression de nombreux gènes impliqués dans la signalisation des MAPK dans les cellules
CD34+ et dans les MK des patients, quelque soit leur statut mutationnel Jak2, nous avons
recherché des altérations de cette voie de signalisation. Nous avons ainsi mis en évidence que
la phosphorylation de Flt3 induit une cascade d’activation des molécules de la voie de
signalisation des MAP kinases, telles qu’ERK1/2, JNK et plus particulièrement de p38 et de
ses effecteurs. Le rôle du couple Flt3-ligand/Flt3 dans cette activation est renforcé par nos
résultats montrant que la stimulation in vitro des progéniteurs MK de patients par le Flt3-
ligand provoque également une augmentation de la phosphorylation de p38. Cette
phosphorylation est associée à celle de plusieurs effecteurs en aval de p38 tels que ATF2, une
molécule clé de l’activité transcriptionnelle de p38 et a une augmentation d’expression de
nombreux facteurs de transcription cibles de p38 tels que le complexe AP1, NFATC4, p53...
La phosphorylation de p38 ainsi que celle de ses effecteurs est diminuée après inhibition de
Flt3 par des approches de type siRNA, inhibiteurs pharmacologiques ou anticorps
neutralisants, confirmant le rôle de Flt3 dans cette activation.
Des résultats récents obtenus sur des coupes histologiques de moelle osseuse mettent
en évidence une modification de la phosphorylation de p38 chez les patients atteints de NMP
et de syndromes myélodysplasiques (SMD), avec un niveau de phosphorylation plus élevé
chez les patients atteints de SMD (Shahjahan et al., 2008). Nos résultats, confirment donc ces
données et suggèrent que si l’activation de p38 n’est pas spécifique de la MFP, son niveau de
175

phosphorylation et son maintien élevé via l’activation persistante de Flt3 contribue très
vraisemblablement à cette spécificité.
La persistance de l’activation des MAPK et plus particulièrement de la voie p38, au
cours de la différenciation des progéniteurs MK chez les patients, nous a incité à étudier son
rôle dans la dysmégacaryopoïèse qui défini la MFP. Cette dysmégacaryopoïèse est
caractérisée par une augmentation du nombre de mégacaryocytes immatures et dystrophiques
dans la moelle osseuse et la présence de micromégacayocytes dans la circulation. Par la
production de nombreuses cytokines fibrosantes, angiogéniques et inflammatoires, le
mégacaryocyte est un élément clé de la pathogenèse de la MFP et plus particulièrement de la
réaction stromale. Nos résultats montrent que l’inhibition d’ERK-1/2, de JNK mais surtout de
p38 dans les mégacaryocytes des patients, restaure leur différenciation/maturation comme le
montre : i) une réduction de prolifération des MK, ii) une augmentation de la ploïdie, iii) une
augmentation de l’expression des marqueurs de différenciation MK tels que le CD41 et
CD42a à leur surface et iv) la formation de pro-plaquettes en culture. Comme nous le verrons
ci-dessous, cet effet sur la différenciation MK est associé à une réduction de leur migration en
réponse au Flt3-ligand. Le rôle de l’axe Flt3/p38 dans cette dysmégacaryopoièse a été ensuite
confirmé après inhibition de Flt3 et de p38 par des siRNA, des inhibiteurs chimiques ou des
anticorps spécifiques.
La MFP est caractérisée par un nombre élevé de cellules CD34+ et de micro-
mécaryocytes circulants. En collaboration avec notre groupe, l’équipe d’A. Vannuchi
(Florence, Italie) a mis en évidence le rôle de CXCL12(SDF-1) dans les mécanismes de
mobilisation des cellules CD34+ via une sous-expression de son récepteur CXCR4, liée à une
hyperméthylation de son promoteur, dans les progéniteurs hématopoïétiques des patients
(Bogani et al., 2008). D’autres molécules telles que le G-CSF, le SCF, le LF et l’Il-8 sont
également capables d’induire la mobilisation des PH mais avec un timing différent. Chez
l’animal, l’Il-8 induit une mobilisation très rapide des PH (Laterveer et al., 1996)
contrairement au Flt3-ligand dont l’action mobilisatrice est plus lente (Brasel et al., 1996).
L’intervention de ces deux cytokines dans la mobilisation de cellules hématopoïétiques
observée chez les patients atteints de MFP n’a pas été étudiée jusqu’à présent. Nos résultats
montrent que le Flt3-ligand pourrait participer à la mobilisation des précurseurs MK.
Dans ce processus, le Flt3-ligand pourrait agir seul ou en synergie avec l’IL-8 (de Kruijf,
Hagoort, Velders, Fibbe, & van Pel, 2010) en stabilisant les transcrits de l’IL-8 via
l’activation de p38 (nos résultats) (Clark et al., 2003). De façon surprenante, contrairement à
176

ce qui a été décrit par l’équipe de Broxmeyer et Pelus sur des cellules CD34+ de sujets sains
(Fukuda et al., 2005), la migration (Flt3-ligand)-dépendante des précurseurs MK de patients
n’est pas modifiée par l’adjonction de CXCL12 (SDF-1). Ceci suggère que, dans la MFP, ces
deux processus coexistent mais qu’il est possible qu’ils agissent sur des cellules à des stades
de différenciation différents.
2.3/ Quelle est la place du processus inflammatoire dans la pathogenèse de la MFP ?
La voie p38 est principalement activée en réponse à un stress environnemental, aux
cytokines inflammatoires et aux facteurs de croissance. En fonction des stimuli (facteurs de
croissance hématopoïétique ou cytokines inflammatoires), l’activation de p38 et de ses
isoformes peut conduire à un effet inverse sur l’hématopoïèse : les cytokines inflammatoires
de type TGF-", IL-6, INF-!, TNF-!… médient les effets inhibiteurs de p38 alors que les
facteurs de croissance hématopoïétique médient ses effets promoteurs sur l’hématopoïèse
(Feng et al., 2009). Ainsi, les effets de p38 sur l’hématopoïèse résultent d’un subtil équilibre
entre le stimulus, l’intensité de la stimulation, les isoformes présents et la lignée cellulaire…
Chez les souris invalidées pour le gène ATM, une élévation des ROS provoque l’activation
spécifique de p38 dans les CSH. L’inactivation de cette voie protège les CSH contre une
réduction de leur capacité d’autorenouvellement (Ito et al., 2006). Chez les patients atteints de
MFP, l’activation de p38 pourrait conduire à une réduction de la capacité
d’autorenouvellement des CSH de patients et contribuer, par une prolifération accrue des
CSH, à l’aplasie médullaire observée au stade terminal de la maladie. Nos résultats suggèrent
donc qu’une activation persistante de p38 via la stimulation de l’axe Flt3-ligand/Flt3 participe
très vraisemblablement au déséquilibre entre prolifération et différenciation/maturation des
progéniteurs MK conduisant à la dysmégacaryopoïèse observée chez les patients.
Au cours de la myélofibrose primitive, une importante libération de cytokines
inflammatoires est observée (Vannucchi, 2009). De nombreuses cytokines telles que IL-1, IL-
6, IL-8, TNF, G-CSF, MIP-1, VEGF…. participent à cet orage cytokinique. Nous avons
montré que le taux d’Il-8 était fortement augmenté chez les patients et qu’elle jouait un rôle
important dans la dysmégacaryopoïèse (Emadi et al., 2005). Il a été récemment proposé que le
taux élevé d’Il-8 a une valeur pronostique chez les patients atteints de MFP (Tefferi et al.,
2011), soulignant son importance dans le processus pathogénique. Dans le travail qui fait
177
l’objet de ma thèse, nous montrons également que la transcription de son gène est régulée via
l’activation de la voie p38 (Clark et al., 2003), en réponse au Flt3-ligand. Chez les patients,
l’activation de p38 participe au processus inflammatoire en stabilisant les transcrits de l’Il-8
mais également, très vraisemblablement, ceux d’autres cytokines et chimiokines
inflammatoires. Les facteurs de transcription AP-1 et NFATc4, activés au cours de la
mégacaryopoïèse, sont surexprimés en réponse à Flt3-ligand dans les MK des patients.
Agissant de concert au niveau transcriptionnel (Macian, Lopez-Rodriguez, & Rao, 2001), ils
pourraient coopérer pour induire la transcription de gènes impliqués dans l’inflammation.
Ainsi, dans la MFP, la tempête cytokinique émanant du stroma inflammatoire activerait la
signalisation p38 qui, à son tour, entretiendrait la production de cytokines inflammatoires ou
non via une activation transcriptionnelle de leurs gènes, faisant de p38, un des messagers
secondaires clés de ce processus (Platanias, 2003) (figure 49).
L’inflammation est un processus adaptatif développé à la suite d’une rupture de
l’homéostasie cellulaire ou tissulaire. Au cours de l’inflammation, de nombreux processus tels
qu’une modification de la composition cellulaire, de la capacité de réponse aux stimuli
inflammatoires, de la régulation des voies de signalisation et de la régulation des gènes au
niveau transcriptionnel sont observés (Figure 51) (Medzhitov & Horng, 2009). Les processus
inflammatoires peuvent également jouer un rôle dans la structure chromatinienne. Pourraient-
ils alors avoir un rôle dans une possible régulation épigénétique de la mégacaryopoièse au
cours de la MFP ?
Nous avons observé que la trichostatine A pouvait influencer la migration (Flt3-
ligand)-dépendante des précurseurs MK des patients en modifiant l’acétylation des histones et
en particulier, en modulant l’acétylation de la lysine 8 de l’histone H4. Le Flt3-ligand induit la
sur-expression du transcript AP-1 qui peut être à l’origine d’une modification chromatinienne
dont la signature est fréquemment retrouvée dans un contexte inflammatoire ; en effet, le
remodelage de la chromatine par l'acétylation des histones joue un rôle dans les réponses pro-
inflammatoires (Tomita et al., 2003). Ainsi, des cytokines inflammatoires tels que le TNF-
alpha ou des dérivées oxydatifs tels que le peroxyde d'hydrogène (H2O2) peuvent modifier
l'acétylation des histones/la déacétylation et l'activation de NF-kappaB et AP-1, menant à la
libération de cytokines pro-inflammatoires comme l’IL-8 (Rahman, 2002). Dans notre étude,
la stimulation des mégacaryocytes par le Flt3-ligand entraîne une sur-expression de
l’interleukine 8, elle-même impliquée dans l’inflammation et dans la dysmégacaryopoïèse des
patients MFP (Emadi et al., 2005).
178

Figure 49 : Rôle de l’activation des MAPK dans la réponse aux cytokines et le contrôle de
la prolifération cellulaire D’après (Platanias, 2003)
179
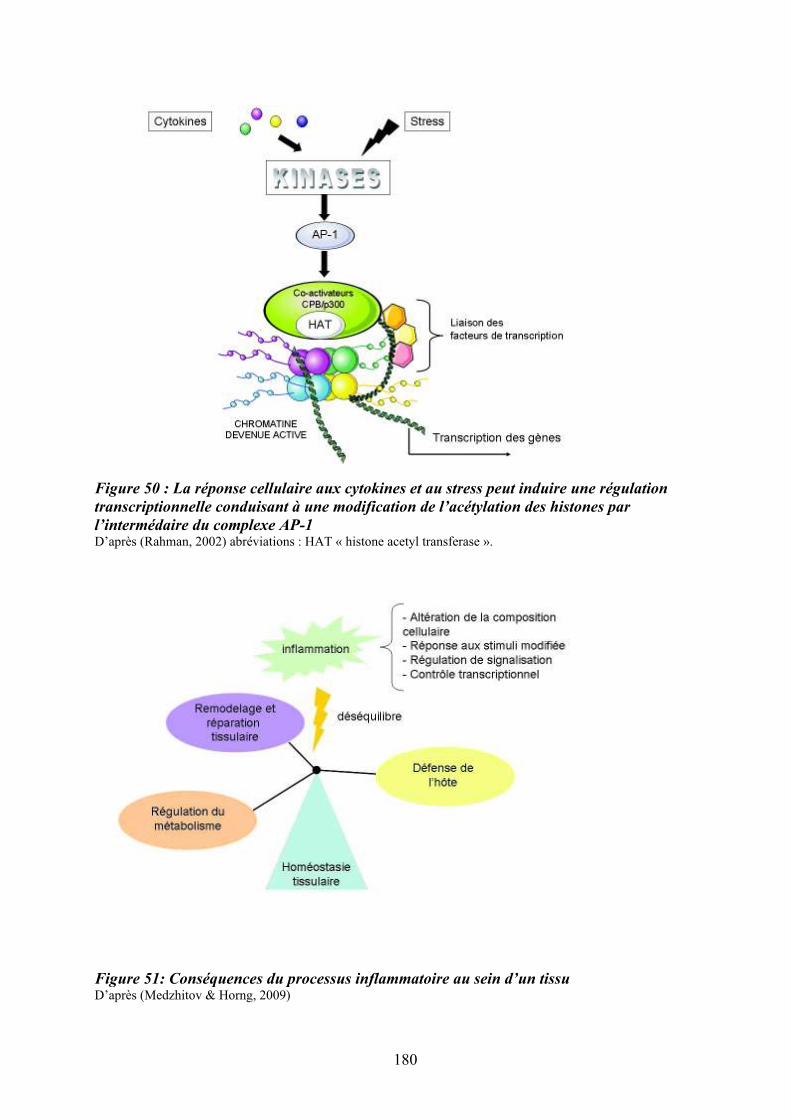
Figure 50 : La réponse cellulaire aux cytokines et au stress peut induire une régulation
transcriptionnelle conduisant à une modification de l’acétylation des histones par
l’intermédaire du complexe AP-1 D’après (Rahman, 2002) abréviations : HAT « histone acetyl transferase ».
Figure 51: Conséquences du processus inflammatoire au sein d’un tissu D’après (Medzhitov & Horng, 2009)
180

Compte tenu du rôle de la réaction inflammatoire chronique dans la cancérogenèse, il
est possible que les mécanismes épigénétiques sous-jacents participent à ce processus en
régulant l’expression de cytokines pro-inflammatoires (Villagra, Sotomayor, & Seto, 2010).
(Figure 48). Les protéines HMG (high mobility group) ont été caractérisées il y a près de 30
ans comme jouant un rôle essentiel dans le contrôle conformationnel de la chromatine, en
participant à la régulation de la transcription, de la recombinaison, et à certains processus de
réplication. L'une de ces protéines, HMGB1, a été récemment identifiée comme agissant en
tant que cytokine pro-inflammatoire (Murakami et al., 2011). La mise en évidence d’une
altération d’expression de la protéine HMGA2 dans les progéniteurs hématopoïétiques des
patients (ref Andrieux et article en Annexe) conforte l’hypothèse d’un lien possible entre une
altération de molécules participant au remodelage chromatinien et le processus inflammatoire
qui caractérise la MFP. Nous avons observé des modifications épigénétiques de type
acétylation des histones au cours de la différenciation mégacaryocytaire in vitro chez patients
MFP. L’acétylation des histones est notamment régulée par des familles d’enzymes les
histones déacétylases (HDAC) qui peuvent être inhibées par la trichostatine A ou le SAHA.
En dehors des histones, les HDACs peuvent également désacétyler d’autres protéines telles
que p53, E2F1 (Glozak, Sengupta, Zhang, & Seto, 2005) et réguler l’expression de gènes tels
que GATA-1 (Watamoto et al., 2003). Compte tenu des conséquences d’une modification
épigénétique de GATA-1 sur la différenciation mégacaryocytaire et de son rôle potentiel dans
la pathogenèse de la MFP (Vannucchi et al., 2002), il serait intéressant d’étudier l’implication
des HDACs et notamment celle de HDAC5, au cours de la différenciation mégacaryocytaire
chez les patients atteints de MFP ainsi que son interaction avec le facteur de transcription
GATA-1.
2.4/ Le couple Flt3-ligand/Flt3 est-il un médiateur du dialogue entre les progéniteurs hématopoïétiques et leur niches régulatrices et en quoi étaye-t-il l’hypothèse du « Bad seed in Bad soil »?
En cancérologie, le concept de « seed and soil » illustre la notion selon laquelle
l’implantation et le développement d’une tumeur (ou d’une métastase) nécessitent qu’un
environnement adapté fasse le lit de la tumeur. S’il est actuellement avéré que le stroma joue
un rôle important dans l’évolution des tumeurs solides, son rôle dans les hémopathies
malignes est également très probable. Dans la myélofibrose primitive, une importante
mobilisation des cellules souches, quelles soient hématopoïétiques, mésenchymateuses ou
181

endothéliales, de la moelle osseuse vers la rate et le foie via le sang périphérique est observée,
expliquant l’augmentation très importante du volume et du poids de ces organes chez les
patients. Si la dérégulation du couple CXCL12/CXCR4 et en particulier la sous-expression de
CXCR4, permet d’expliquer en partie la mobilisation des PH de la moelle osseuse vers le
sang, elle n’explique pas pour autant pourquoi ces cellules migrent vers ces organes
secondaires et s’y nichent. La rate est par excellence un lieu de production de la cytokine Flt3-
ligand (Lyman et al., 1994) vers laquelle les progéniteurs hématopoïétiques et plus
particulièrement les mégacarycocytaires des patients, migrent de façon anomale in vitro. Il
serait donc intéressant de rechercher si la production de Flt3-ligand au niveau de la rate des
patients participe à l’adressage splénique des PH au cours de cette maladie. Il serait également
intéressant de chercher si, comme cela a été proposé dans le cas de patients porteurs de
leucémies aigües myéloïdes, le Flt3-ligand contribue à leur survie en régulant la molécule
anti-apoptotique Mcl-1 (Yoshimoto et al., 2009) (Opferman et al., 2005). Nos résultats
préliminaires suggèrent une augmentation du nombre de cellules dendritiques dans le sang et
la rate des patients atteints de MFP. Compte tenu du rôle du Flt3-ligand dans la
différenciation des cellules dendritiques en synergie avec d’autres cytokines telles que SCF,
GM-CSF et TNF-!, il serait également intéressant d’étudier si l'augmentation du taux sérique
de Flt3-ligand favorise le recrutement des lymphocytes et/ou des cellules dendritiques dans
cet organe. Une telle hypothèse est compatible avec le fait qu’une réduction très significative
du poids de la rate est observée chez les patients traités avec des « anti-jak2 » tels que le CEP-
701, initialement développé pour cibler FLT3-ITD dans les LAM (Santos et al., 2010).
Un nombre croissant d’arguments suggère que le stroma hématopoïétique
médullaire et splénique, participe au développement de la MFP. Nous avons mis en évidence
l'existence de modulations sélectives d’expression de protéines structurales (!-sm-actine) et
matricielles, de molécules de surface et de production de cytokines et chimiokines dans les
cellules souches mésenchymateuses (CSM) de la rate des patients. Nous avons également
montré l’interdépendance du couple CD34+/CSM chez les patients ainsi que le rôle
déterminant du stroma splénique dans la dérégulation de l’hématopoïèse et plus
particulièrement dans la dysmégacaryopoïèse (Brouty-Boye et al., 2001). La mise en évidence
d’une production accrue de Flt3-ligand par les CSM médullaires et spléniques renforce le lien
étroit existant, chez les patients, entre la dérégulation du stroma et la dysmégacaryopoïèse
(Figure 52).
Par la production de nombreux facteurs fibrosants, angiogéniques et ostéogéniques, les
mégacaryocytes exercent un rôle direct ou indirect sur la niche hématopoïétique et jouent un
182

rôle crucial dans la pathogenèse de la MFP (Breton-Gorius et al., 1992) (Lataillade et al.,
2008) (Wickenhauser et al., 1995). La fibrose, indispensable au diagnostic, participe de façon
importante à la détérioration de l'hématopoïèse médullaire. Bien que supposée d'origine
réactionnelle, peu de données permettaient d'en comprendre la pathogenèse. C’est H. Castro-
Malaspina qui, le premier, avait apporté des preuves tangibles du rôle du mégacaryocyte
(MK), via le relargage du PDGF (Platelet Derived Growth Factor) stocké dans les plaquettes,
dans ce processus (Castro-Malaspina, 1984). Au laboratoire, nous avons montré que deux
autres cytokines, le Transforming-Growth-Factor-" (TGF-") et le Fibroblast-Growth-Factor
basique (bFGF), dont les taux étaient fortement augmentés dans les MK et plaquettes des
patients, jouaient également un rôle clé dans la synthèse du collagène. Ces résultats nous ont
permis de proposer l’hypothèse selon laquelle le relargage local de ces facteurs fibrosants,
stockés dans les MK dystrophiques et les granules alpha des plaquettes, participait à la
pathogenèse de la myélofibrose (Martyre et al., 1994) (Martyre et al., 1997) (Le Bousse-
Kerdiles & Martyre, 2001). En dehors de leurs rôles dans la fibrose médullaire, les
mégacaryocytes participent également, en association avec d’autres types cellulaires comme
les cellules ostéocompétentes, à l’homéostasie du tissu osseux. En effet, les souris déficientes
pour GATA-1 présentent une dérégulation mégacaryocytaire associée à une augmentation de
la masse osseuse. L’augmentation des mégacaryocytes immatures observée chez ces souris est
corrélée à une prolifération accrue des ostéoblastes et à une réduction de la différenciation
ostéoclastique (Breton-Gorius et al., 1992). Les souris exprimant faiblement GATA
développent un néoplasme myéloprolifératif proche de la pathologie humaine avec une
augmentation importante des MK (Vannucchi et al., 2002). Ces souris présentent une
ostéomyélosclérose résultant d’une stimulation de l’activité ostéoblastique et d’un taux élevé
de facteurs tels que les BMP. De façon intéressante, un lien entre la prolifération MK, la
production de BMP, la formation osseuse et la voie des MAPK a été également très
récemment démontré chez des souris déficientes pour Erk1 (Guihard et al., 2010).
183

Figure 52 : Rôle d’une altération de l’axe « Flt3-ligand/Flt3/p38 » dans la
dysmégacaryopoïèse des patients atteints de MFP
184

2.5/ Peut-on proposer des approches ciblées sur l’axe Flt3-ligand/Flt3/p38 comme thérapies adjuvantes dans la MFP?
Hormis le traitement curatif par greffe allogénique de cellules souches proposé à
certains patients dans un cadre d’éligibilité stricte, les axes actuels de développement
thérapeutique dans la myélofibrose incluent : les traitements cytoréducteurs, l’immuno-
modulation, les modulateurs de l’épigénétique et les inhibiteurs de Jak2 (Mesa, 2010).
Plusieurs essais thérapeutiques anti-Jak2 dans la myélofibrose ont été recensés au cours de ces
dernières années (Abdel-Wahab & Levine, 2009). Parmi ceux-ci, deux classes d’inhibiteurs
ont été testés ou sont en cours d’essai : 1) les inhibiteurs sélectifs de Jak2 tels que TG101209,
TG101348, INCB018424, SB1518, XL019 et CYT387, le premier des inhibiteurs
expérimentaux démontrant un effet sur l’anémie et 2) des inhibiteurs non sélectifs intégrant
des inhibiteurs de la kinase Aurora (MK0407 et AT9283), un inhibiteur d’histone déacétylase
(ITF2357) et des inhibiteurs de Flt3 (CEP-701 et SB1518) (Lasho et al., 2008; Santos et al.,
2010). Ces différentes molécules induisent une réduction importante de la splénomégalie, une
amélioration des « symptômes constitutionnels » et une réduction de la production de
cytokines inflammatoires (Vannucchi, 2009). Nos résultats permettent d’expliquer l’efficacité
des inhibiteurs non spécifiques de Jak2, ciblant la kinase Flt3, et de proposer un modèle de
prédiction de réponse à ces inhibiteurs. Cependant, de tels traitements ne réduisent ni l’anémie
(sauf dans le cas de CYT387), ni la charge allélique de la mutation Jak2V617F et encore
moins l’intensité de la fibrose, un élément pathogénique central de la MFP.
Ces résultats partiellement décevants orientent actuellement le clinicien vers
l’utilisation des combinaisons thérapeutiques associant, à ces inhibiteurs, des molécules
issues des nouvelles connaissances physiopathologiques. Ces nouvelles approches devront
améliorer le dialogue entre les cellules hématopoïétiques, en particulier mégacaryocytaires, et
leurs niches régulatrices. Ainsi, la restauration d’une mégacaryopoïèse « normale » par
l’inhibition de l’activation de la voie p38 devrait réguler la production de cytokines
impliquées dans la réaction stromale, telles que TGF-", bFGF, PDGF, TNF-! etc… et donc la
limiter. Compte tenu de la modulation d’expression des isoformes de p38 en fonction de la
lignée et du stade de différenciation des cellules hématopoïétiques (Feng et al., 2009), des
inhibiteurs pharmacologiques dirigés contre ces isoformes pourraient apporter une spécificité
thérapeutique. De tels inhibiteurs de p38 ont été utilisés dans la LMC, les syndromes
myélodysplasiques et le myélome pour inhiber de façon spécifique (VX-745) ou non
185
(SB203580, SB202190), la production de cytokines agissant sur le clone leucémique (Feng et
al., 2009)
Par son action anti-apoptotique mais également pro-apoptotique en fonction de son
stimulus et de son niveau d’activation, p38 est considérée comme une kinase « dualiste ».
Ainsi, pour obtenir une efficacité thérapeutique, le clinicien devra prendre en compte la
subtilité qui régit l’activation de cette voie de signalisation. L’efficacité de l’interféron sous
forme pégylée a été démontrée dans les néoplasmes myéloprolifératifs. En raison de son rôle
sur la signalisation p38, il est possible que l’interféron interfère dans cette dualité, modulant
ainsi les effets de p38. Il serait donc intéressant d’étudier l’action combinée de l’interféron et
d’inhibiteurs de p38 sur la différenciation in vitro des progéniteurs CD34+ des patients ainsi
que dans des modèles expérimentaux de myélofibrose chez la souris (Chagraoui et al., 2002)
(Chagraoui et al., 2003).
3/ Comment intégrer nos résultats dans la hiérarchie des évènements moléculaires agrégeant les néoplasmes myéloprolifératifs?
Les arguments avancées par Damesheck selon lesquels les quatre entités représentées
par la LMC, la PV, la TE, la MFP devaient être regroupées sous le terme de syndromes
myéloprolifératifs en raison d’une présentation clinique proche, de caractéristiques
histologiques (myéloprolifération non régulée des trois linéages myéloïdes) et d’un
mécanisme physiopathologique similaire restent valables, plus de 60 ans après la publication
princeps. En effet, à l’éclairage des connaissances actuelles dont nous disposons, ces quatre
pathologies semblent être issues d’une population ancestrale de cellules souches polyclonales
ou oligoclonales « présentant des caractères de prédisposition » à partir desquelles émergerait
le clone pathologique.
Récemment, la mise en évidence d’un spectre mutationnel somatique Jak2V617F,
hétérogène en fonction du NMP concerné, de nouvelles mutations (MPL, TET2, ASXL1,
IDH1, IDH2, IKZF1, IZH2, CBL, LNK…) et d’un haplotype de prédisposition JAK2 46/1 sont
autant d’éléments accumulés qu’il va falloir hiérarchiser dans les années à venir pour tenter
d’expliquer l’émergence d’un NMP (Tefferi & Vainchenker, 2011). Ainsi, dans l’état actuel
des connaissances, on ne peut encore affirmer quels facteurs génétiques modulent l’évolution
vers un phénotype NMP donné et l’évolution de celui-ci dans le temps. Actuellement, la MFP
186

n’est pas caractérisée par un profil mutationnel particulier. Placer dans cet ordre hiérarchique,
l’anomalie 13q identifiée chez les patients que nous avons étudiés, est difficile. De plus, en
dehors de la mutation JAK2, nous n’avons pas recherché, chez les patients étudiés, la présence
ou non des mutations MPL, TET2, ASLX1, IDH1 ou LNK, récemment décrites.
Pour comprendre l’ordre de survenue des différentes mutations décrites dans le
contexte des NMP, on ne peut actuellement qu’avoir recours à l’analyse du profil mutationnel
et cytogénétique des patients lors des deux phases de leur maladie : en phase chronique puis
après évolution vers une leucémie aiguë. Ainsi, le statut mutationnel de plusieurs gènes a été
étudié : JAK2, MPL, TET2, ASLX1, IDH1, LNK. Ces mutations, présentes de façon
hétérogène en fonction d’un NMP donné, ne sont pas mutuellement exclusives. Certains
patients présentant une mutation JAK2 en phase chronique développent une leucémie aiguë
sur un clone dépourvu de la mutation Jak2V617F. Ainsi, l’anomalie génétique à l’origine de
la transformation serait survenue plus précocement que la mutation JAK2.
L’observation selon laquelle une anomalie TET2 n’est présente que lorsque JAK2 est
muté et qu’une mutation JAK2 n’est jamais retrouvée chez des patients non mutés pour TET2
laisserait également supposer que la survenue de la mutation TET2 est antérieure à celle de
JAK2. Cependant, cette donnée vient d’être très récemment controversée (Abdel-Wahab &
Levine, 2009). Lors d’une transformation aiguë myéloïde, la mutation ASLX1, identifiée
quelque soit le stade de la pathologie, précèderait la survenue d’une anomalie TET2 et d’une
mutation JAK2. Les mutations de LNK, acquises précocement ou tardivement au cours de
l’évolution de la maladie, peuvent concerner les deux allèles (survenue indépendante et
séquentielle), et sont préférentiellement retrouvées dans les MFP. Une observation récente
(Lasho, Tefferi, Finke, & Pardanani, 2011) montre que les mutations de LNK et JAK2 ne sont
pas mutuellement exclusives. Il est intéressant de noter que la fréquence des anomalies
génotypiques JAK2, TET2, ASLX1, IDH1 retrouvées dans les NMP en transformation est très
proche de celle existant dans les leucémies aiguës myéloïdes de novo.
Récemment, l’analyse de polymorphismes par la technologie de type SNP, a mis en
évidence des régions de perte d’hétérozygotie (appelées « copy-neutral-loss of heterozygoty »
(CN-LOH), équivalent somatique de la disomie uniparentale (UPD)). L’identification de ces
régions chromosomiques a permis d’identifier des gènes candidats mutés, impliqués dans de
nombreuses pathologies myéloïdes (O'Keefe, McDevitt, & Maciejewski, 2010). Le tableau (9)
suivant fait état des anomalies de type UPD trouvées dans les pathologies myéloïdes, les
gènes candidats mutés dans les régions d’intérêts sont également mentionnés.
187

région d'UPD gène pathologie de description
UPD 1p MPL SMP, SMD
UPD 1p NRAS LMMJ, LMMC
UPD 4q TET2 LAM, SMP, SMD
UPD 9p JAK2 SMP, SMD
UPD 11p WT1 LAM
UPD 11q c-CBL LMMC, LMMJ, PMF
UPD 13 FLT3ITD LAM
UPD 17p TP53 SMD, LAM
UPD 17q NF1 LMMJ
UPD 19q CEBPa LAM
UPD 21q RUNX1 LAM
Tableau 9: Description des UPD découverts dans les pathologies myéloïdes D’après (O'Keefe et al., 2010)
De façon intéressante, l’analyse des CN-LOH a permis d’identifier les loci JAK2,
MPL, CBL et TET2 mais aussi, celui de FLT3. L’identification de cet UPD par une approche
SNP est en cohérence avec la délétion 13q14 identifiée en CGH array. Dans notre étude, nous
n’avons pas pu mettre en évidence la présence ou non d’un CN-LOH FLT3 en raison du
nombre faible de patients analysés.
Comme nous l’avons mentionné, la délétion 13q, bien que non spécifique est
fréquemment retrouvée dans les SMD et les NMP dont la myélofibrose primitive. Il en est de
même pour les délétions 5q et 20q. La survenue de la délétion 20q (Delhommeau, données
personnelles) survient plus précocement que la mutation JAK. Les données du laboratoire
(Bilhou-Nabera et al., 2003) montraient, en 2003, que la del13q était présente dans des
précurseurs très immatures CD34+CD38- et coexistait avec des précurseurs dépourvus de
l’anomalie clonale, ce qui supposait l’existence d’un mosaïcisme ou d’une anomalie
cytogénétique d’apparition relativement tardive conférant, au clone pathologique, un avantage
prolifératif.
188

Figure 53: Evolution clinique possible des NMP BCR-ABL-1 négatifs
Figure 54: Hypothèse d’acquisition des événements génétiques et cytogénétiques dans la
progression des pathologies myéloïdes
189
Sur le plan clinique, la PV et de la TE peuvent évoluer vers une myélofibrose (Figure
53). Sur le plan génétique, cette évolution est peu documentée. S’agit-il d’une évolution
phénotypique secondaire à d’autres événements génétiques ou épigénétiques ? Comment alors
expliquer la diversité phénotypique des NMP agrégés autour de la mutation JakV617F ? Les
anomalies génétiques identifiées sont-elles associées ou alternatives ? Sont-elles primaires ou
secondaires, concernent-elles des voies de signalisation similaires ou différentes ? Sont-elles
spécifiques des cellules hématopoïétiques ou intéressent-elles également les cellules
stromales, ce qui remettrait en question le schéma physiopathologique actuellement admis de
la MFP? Les cellules stromales (dépourvues d’anomalies géniques ?) exerceraient-elles une
pression de sélection sur les CSH/PH en favorisant l’émergence ou le développement d’un ou
plusieurs clones adaptés à cet environnement? De telles hypothèses sont actuellement en
cours d’étude sans que l’on ne puisse, aujourd’hui, répondre à ces questions.
Ainsi, il est actuellement proposé que des anomalies épigénétiques (TET2, ASXL1,
EZH2…) non spécifiques aux NMP (méthylation de l’ADN, remodelage chromatinien), des
mutations initiatrices (ASXL-1, EZH2, TET2, del 20q…) et une prédisposition
constitutionnelle (JAK2 46/1...) joueraient un rôle initiateur dans l’émergence d’un clone pré-
malin. Des mutations oncogéniques (JAK2, MPL, KIT, CBL, LNK…) conduiraient alors au
développement des NMP de phénotypes différents, dont l’évolution vers une phase de
transformation aiguë serait liée à une accumulation d’anomalies additionnelles (aberrations
chromosomiques, C-CBL, RUNX1, TP53, CBLB, FLT3, IDH1…) (Figure 54).
Quelque soit l’anomalie initiale à l’origine du développement du clone pathologique et quelle
que soit la séquence d’apparition des anomalies géniques dont le nombre va croissant au cours
de ces dernières années, elles concourent directement ou indirectement à une dérégulation de
tyrosine kinases. Il est actuellement admis que des altérations de la signalisation Jak/STAT
jouent très vraisemblablement un rôle central dans la pathogenèse des NMP et sont la cible
privilégiée des thérapies actuelles (Figure 55). Cependant, d’autres voies de signalisation
telles que la voie PI3K/AKT et la voie des MAPK participent également à la pathogénie de
ces néoplasmes, comme cela a été en particulier montré dans la PV (Cleyrat et al.) et la
mastocytose (Patrice Dubreuil).
Les résultats de mon travail confirment l’importance des MAPK et souligne le rôle
d’une activation persistante de la voie p38, via le couple Flt3-ligand/Flt3, dans la
dysmégacaryopoïèse qui caractérise la myélofibrose primitive. Ils suggèrent également que
cette dérégulation participe au processus inflammatoire à l’origine de la réaction stromale et
« lit » d’une transformation leucémique potentielle.
190

Conclusion générale
L’ensemble de nos résultats a permis de proposer un modèle physiopathologique dans
lequel une augmentation de production de la cytokine Flt3-ligand par le stroma médullaire et
les cellules CD34+ participe à la dysmégacaryopoïèse via une activation persistante de son
récepteur Flt3 et de la voie de signalisation p38. Ce dialogue altéré entre les cellules
hématopoïétiques pathologiques (Bad seeds), en particulier mégacaryocytaires et les cellules
stromales (Bad soil), conforte notre concept « Bad seeds in Bad soil ». Ce travail pourrait
contribuer à l’amélioration de ce dialogue par des approches thérapeutiques ciblées sur l’axe
Flt3-ligand/Flt3 médié par l’activation de p38 qui, en réduisant le processus inflammatoire,
rétablirait un lien entre le « Seed » et le « Soil ».
191
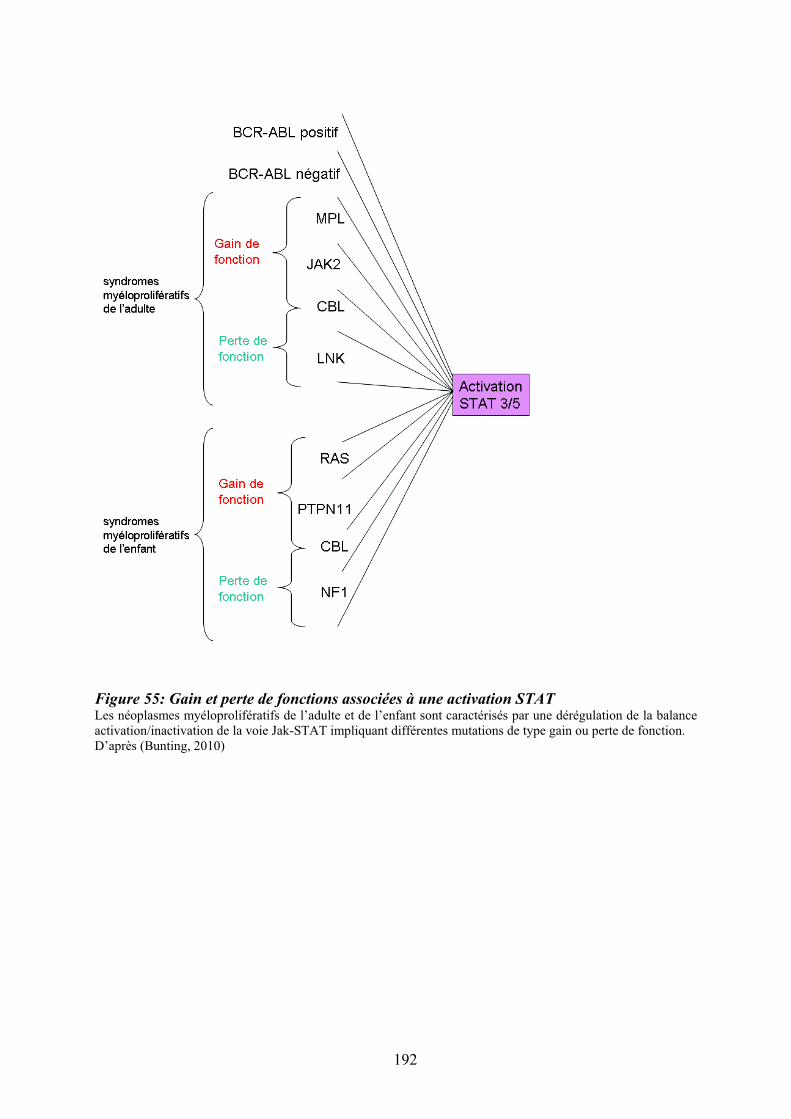
Figure 55: Gain et perte de fonctions associées à une activation STAT Les néoplasmes myéloprolifératifs de l’adulte et de l’enfant sont caractérisés par une dérégulation de la balance activation/inactivation de la voie Jak-STAT impliquant différentes mutations de type gain ou perte de fonction. D’après (Bunting, 2010)
192

REFERENCES
193

194
Abdel-Wahab, O. I., & Levine, R. L. (2009). Primary myelofibrosis: update on definition, pathogenesis, and treatment. Annu Rev Med, 60, 233-245.
Abu-Duhier, F. M., Goodeve, A. C., Care, R. S., Gari, M., Wilson, G. A., Peake, I. R., et al. (2003). Mutational analysis of class III receptor tyrosine kinases (C-KIT, C-FMS, FLT3) in idiopathic myelofibrosis. Br J Haematol, 120(3), 464-470.
Adachi, M., Fukuda, M., & Nishida, E. (2000). Nuclear export of MAP kinase (ERK) involves a MAP kinase kinase (MEK)-dependent active transport mechanism. J Cell
Biol, 148(5), 849-856. Adams, G. B., Chabner, K. T., Alley, I. R., Olson, D. P., Szczepiorkowski, Z. M., Poznansky,
M. C., et al. (2006). Stem cell engraftment at the endosteal niche is specified by the calcium-sensing receptor. Nature, 439(7076), 599-603.
Adams, R. H., Porras, A., Alonso, G., Jones, M., Vintersten, K., Panelli, S., et al. (2000). Essential role of p38alpha MAP kinase in placental but not embryonic cardiovascular development. Mol Cell, 6(1), 109-116.
Al-Assar, O., Ul-Hassan, A., Brown, R., Wilson, G. A., Hammond, D. W., & Reilly, J. T. (2005). Gains on 9p are common genomic aberrations in idiopathic myelofibrosis: a comparative genomic hybridization study. Br J Haematol, 129(1), 66-71.
Alexander, W. S. (1999). Thrombopoietin and the c-Mpl receptor: insights from gene targeting. Int J Biochem Cell Biol, 31(10), 1027-1035.
Allen, M., Svensson, L., Roach, M., Hambor, J., McNeish, J., & Gabel, C. A. (2000). Deficiency of the stress kinase p38alpha results in embryonic lethality: characterization of the kinase dependence of stress responses of enzyme-deficient embryonic stem cells. J Exp Med, 191(5), 859-870.
Allen, T. D., & Dexter, T. M. (1983). Long term bone marrow cultures: an ultrastructural review. Scan Electron Microsc(Pt 4), 1851-1866.
Allfrey, V. G., Faulkner, R., & Mirsky, A. E. (1964). Acetylation and Methylation of Histones and Their Possible Role in the Regulation of Rna Synthesis. Proc Natl Acad Sci U S A,
51, 786-794. Alonso, A., Sasin, J., Bottini, N., Friedberg, I., Friedberg, I., Osterman, A., et al. (2004).
Protein tyrosine phosphatases in the human genome. Cell, 117(6), 699-711. Anderson, R. E., Hoshino, T., & Yamamoto, T. (1964). Myelofibrosis with Myeloid
Metaplasia in Survivors of the Atomic Bomb in Hiroshima. Ann Intern Med, 60, 1-18. Andrieux, J., Bilhou-Nabera, C., Lippert, E., Le Bousse-Kerdiles, M. C., Dupriez, B., Grardel,
N., et al. (2006). Expression of HMGA2 in PB leukocytes and purified CD34+ cells from controls and patients with Myelofibrosis and myeloid metaplasia. Leuk
Lymphoma, 47(9), 1956-1959. Andrieux, J., Roche-Lestienne, C., Geffroy, S., Desterke, C., Grardel, N., Plantier, I., et al.
(2007). Bone morphogenetic protein antagonist gene NOG is involved in myeloproliferative disease associated with myelofibrosis. Cancer Genet Cytogenet,
178(1), 11-16. Angel, P., Imagawa, M., Chiu, R., Stein, B., Imbra, R. J., Rahmsdorf, H. J., et al. (1987).
Phorbol ester-inducible genes contain a common cis element recognized by a TPA-modulated trans-acting factor. Cell, 49(6), 729-739.
Antonchuk, J., Sauvageau, G., & Humphries, R. K. (2002). HOXB4-induced expansion of adult hematopoietic stem cells ex vivo. Cell, 109(1), 39-45.
Aouadi, M., Binetruy, B., Caron, L., Le Marchand-Brustel, Y., & Bost, F. (2006). Role of MAPKs in development and differentiation: lessons from knockout mice. Biochimie,
88(9), 1091-1098.
195
Arai, F., Hirao, A., Ohmura, M., Sato, H., Matsuoka, S., Takubo, K., et al. (2004). Tie2/angiopoietin-1 signaling regulates hematopoietic stem cell quiescence in the bone marrow niche. Cell, 118(2), 149-161.
Arai, F., Hirao, A., & Suda, T. (2005). Regulation of hematopoiesis and its interaction with stem cell niches. Int J Hematol, 82(5), 371-376.
Arai, F., & Suda, T. (2007). Maintenance of quiescent hematopoietic stem cells in the osteoblastic niche. Ann N Y Acad Sci, 1106, 41-53.
Arai, F., Yoshihara, H., Hosokawa, K., Nakamura, Y., Gomei, Y., Iwasaki, H., et al. (2009). Niche regulation of hematopoietic stem cells in the endosteum. Ann N Y Acad Sci,
1176, 36-46. Avecilla, S. T., Hattori, K., Heissig, B., Tejada, R., Liao, F., Shido, K., et al. (2004).
Chemokine-mediated interaction of hematopoietic progenitors with the bone marrow vascular niche is required for thrombopoiesis. Nat Med, 10(1), 64-71.
Baena, E., Ortiz, M., Martinez, A. C., & de Alboran, I. M. (2007). c-Myc is essential for hematopoietic stem cell differentiation and regulates Lin(-)Sca-1(+)c-Kit(-) cell generation through p21. Exp Hematol, 35(9), 1333-1343.
Baker, S. J., Rane, S. G., & Reddy, E. P. (2007). Hematopoietic cytokine receptor signaling. Oncogene, 26(47), 6724-6737.
Bakiri, L., Lallemand, D., Bossy-Wetzel, E., & Yaniv, M. (2000). Cell cycle-dependent variations in c-Jun and JunB phosphorylation: a role in the control of cyclin D1 expression. Embo J, 19(9), 2056-2068.
Baran-Marszak, F., Magdoud, H., Desterke, C., Alvarado, A., Roger, C., Harel, S., et al. (2010). Expression level and differential JAK2-V617F-binding of the adaptor protein Lnk regulates JAK2-mediated signals in myeloproliferative neoplasms. Blood,
116(26), 5961-5971. Barbui, T., Barosi, G., Birgegard, G., Cervantes, F., Finazzi, G., Griesshammer, M., et al.
(2011). Philadelphia-negative classical myeloproliferative neoplasms: critical concepts and management recommendations from European LeukemiaNet. J Clin Oncol, 29(6), 761-770.
Barosi, G., Viarengo, G., Pecci, A., Rosti, V., Piaggio, G., Marchetti, M., et al. (2001). Diagnostic and clinical relevance of the number of circulating CD34(+) cells in myelofibrosis with myeloid metaplasia. Blood, 98(12), 3249-3255.
Baum, C. M., Weissman, I. L., Tsukamoto, A. S., Buckle, A. M., & Peault, B. (1992). Isolation of a candidate human hematopoietic stem-cell population. Proc Natl Acad
Sci U S A, 89(7), 2804-2808. Beardmore, V. A., Hinton, H. J., Eftychi, C., Apostolaki, M., Armaka, M., Darragh, J., et al.
(2005). Generation and characterization of p38beta (MAPK11) gene-targeted mice. Mol Cell Biol, 25(23), 10454-10464.
Belaid-Choucair, Z., Lepelletier, Y., Poncin, G., Thiry, A., Humblet, C., Maachi, M., et al. (2008). Human bone marrow adipocytes block granulopoiesis through neuropilin-1-induced granulocyte colony-stimulating factor inhibition. Stem Cells, 26(6), 1556-1564.
Bench, A. J., Nacheva, E. P., Champion, K. M., & Green, A. R. (1998). Molecular genetics and cytogenetics of myeloproliferative disorders. Baillieres Clin Haematol, 11(4), 819-848.
Bertho, J. M., Chapel, A., Loilleux, S., Frick, J., Aigueperse, J., Gorin, N. C., et al. (2000). CD135 (Flk2/Flt3) expression by human thymocytes delineates a possible role of FLT3-ligand in T-cell precursor proliferation and differentiation. Scand J Immunol,
52(1), 53-61.
196

Bhardwaj, G., Murdoch, B., Wu, D., Baker, D. P., Williams, K. P., Chadwick, K., et al. (2001). Sonic hedgehog induces the proliferation of primitive human hematopoietic cells via BMP regulation. Nat Immunol, 2(2), 172-180.
Bhatia, M., Bonnet, D., Murdoch, B., Gan, O. I., & Dick, J. E. (1998). A newly discovered class of human hematopoietic cells with SCID-repopulating activity. Nat Med, 4(9), 1038-1045.
Bhatia, M., Wang, J. C., Kapp, U., Bonnet, D., & Dick, J. E. (1997). Purification of primitive human hematopoietic cells capable of repopulating immune-deficient mice. Proc Natl
Acad Sci U S A, 94(10), 5320-5325. Bhoumik, A., Lopez-Bergami, P., & Ronai, Z. (2007). ATF2 on the double - activating
transcription factor and DNA damage response protein. Pigment Cell Res, 20(6), 498-506.
Bilhou-Nabera, C., Brigaudeau, C., Clay, D., Andrieux, J., Lai, J. L., Brouty-Boye, D., et al. (2003). Does cytogenetic mosaicism in CD34+CD38low cells reflect the persistence of normal primitive hematopoietic progenitors in myeloid metaplasia with myelofibrosis? Blood, 102(4), 1551-1552.
Bird, A. P. (1986). CpG-rich islands and the function of DNA methylation. Nature,
321(6067), 209-213. Bluteau, D., Lordier, L., Di Stefano, A., Chang, Y., Raslova, H., Debili, N., et al. (2009).
Regulation of megakaryocyte maturation and platelet formation. J Thromb Haemost, 7
Suppl 1, 227-234. Bock, O., Hoftmann, J., Theophile, K., Hussein, K., Wiese, B., Schlue, J., et al. (2008). Bone
morphogenetic proteins are overexpressed in the bone marrow of primary myelofibrosis and are apparently induced by fibrogenic cytokines. Am J Pathol,
172(4), 951-960. Bock, O., Neuse, J., Hussein, K., Brakensiek, K., Buesche, G., Buhr, T., et al. (2006).
Aberrant collagenase expression in chronic idiopathic myelofibrosis is related to the stage of disease but not to the JAK2 mutation status. Am J Pathol, 169(2), 471-481.
Bogani, C., Ponziani, V., Guglielmelli, P., Desterke, C., Rosti, V., Bosi, A., et al. (2008). Hypermethylation of CXCR4 promoter in CD34+ cells from patients with primary myelofibrosis. Stem Cells, 26(8), 1920-1930.
Bottardi, S., Ghiam, A. F., Bergeron, F., & Milot, E. (2007). Lineage-specific transcription factors in multipotent hematopoietic progenitors: a little bit goes a long way. Cell
Cycle, 6(9), 1035-1039. Boveri, E., Passamonti, F., Rumi, E., Pietra, D., Elena, C., Arcaini, L., et al. (2008). Bone
marrow microvessel density in chronic myeloproliferative disorders: a study of 115 patients with clinicopathological and molecular correlations. Br J Haematol, 140(2), 162-168.
Brancho, D., Tanaka, N., Jaeschke, A., Ventura, J. J., Kelkar, N., Tanaka, Y., et al. (2003). Mechanism of p38 MAP kinase activation in vivo. Genes Dev, 17(16), 1969-1978.
Brandt, J., Srour, E. F., van Besien, K., Briddell, R. A., & Hoffman, R. (1990). Cytokine-dependent long-term culture of highly enriched precursors of hematopoietic progenitor cells from human bone marrow. J Clin Invest, 86(3), 932-941.
Brasel, K., McKenna, H. J., Charrier, K., Morrissey, P. J., Williams, D. E., & Lyman, S. D. (1997). Flt3 ligand synergizes with granulocyte-macrophage colony-stimulating factor or granulocyte colony-stimulating factor to mobilize hematopoietic progenitor cells into the peripheral blood of mice. Blood, 90(9), 3781-3788.
Brasel, K., McKenna, H. J., Morrissey, P. J., Charrier, K., Morris, A. E., Lee, C. C., et al. (1996). Hematologic effects of flt3 ligand in vivo in mice. Blood, 88(6), 2004-2012.
197
Breton-Gorius, J., Clezardin, P., Guichard, J., Debili, N., Malaval, L., Vainchenker, W., et al. (1992). Localization of platelet osteonectin at the internal face of the alpha-granule membranes in platelets and megakaryocytes. Blood, 79(4), 936-941.
Briard, D., Brouty-Boye, D., Giron-Michel, J., Azzarone, B., Jasmin, C., & Le Bousse-Kerdiles, C. (2003). Impaired NK cell differentiation of blood-derived CD34+ progenitors from patients with myeloid metaplasia with myelofibrosis. Clin Immunol,
106(3), 201-212. Broske, A. M., Vockentanz, L., Kharazi, S., Huska, M. R., Mancini, E., Scheller, M., et al.
(2009). DNA methylation protects hematopoietic stem cell multipotency from myeloerythroid restriction. Nat Genet, 41(11), 1207-1215.
Brouty-Boye, D., Briard, D., Azzarone, B., Le Bousse-Kerdiles, M. C., Clay, D., Pottin-Clemenceau, C., et al. (2001). Effects of human fibroblasts from myelometaplasic and non-myelometaplasic hematopoietic tissues on CD34+ stem cells. Int J Cancer, 92(4), 484-488.
Broxmeyer, H. E. (1996). Primitive hematopoietic stem and progenitor cells in human umbilical cord blood: an alternative source of transplantable cells. Cancer Treat Res,
84, 139-148. Bruhat, A., Cherasse, Y., Maurin, A. C., Breitwieser, W., Parry, L., Deval, C., et al. (2007).
ATF2 is required for amino acid-regulated transcription by orchestrating specific histone acetylation. Nucleic Acids Res, 35(4), 1312-1321.
Bryon, P. A., Gentilhomme, O., & Fiere, D. (1979). [Histomorphometric analysis of bone-marrow adipose density and heterogeneity in myeloid aplasia and dysplasia (author's transl)]. Pathol Biol (Paris), 27(4), 209-213.
Buchsbaum, R. J., Connolly, B. A., & Feig, L. A. (2002). Interaction of Rac exchange factors Tiam1 and Ras-GRF1 with a scaffold for the p38 mitogen-activated protein kinase cascade. Mol Cell Biol, 22(12), 4073-4085.
Bunting, K. D. (2010). Another Lnk to STAT activation. Blood, 116(6), 862-864. Buschle, M., Janssen, J. W., Drexler, H., Lyons, J., Anger, B., & Bartram, C. R. (1988).
Evidence for pluripotent stem cell origin of idiopathic myelofibrosis: clonal analysis of a case characterized by a N-ras gene mutation. Leukemia, 2(10), 658-660.
Calvi, L. M., Adams, G. B., Weibrecht, K. W., Weber, J. M., Olson, D. P., Knight, M. C., et al. (2003). Osteoblastic cells regulate the haematopoietic stem cell niche. Nature,
425(6960), 841-846. Campbell, P. J., Griesshammer, M., Dohner, K., Dohner, H., Kusec, R., Hasselbalch, H. C., et
al. (2006). V617F mutation in JAK2 is associated with poorer survival in idiopathic myelofibrosis. Blood, 107(5), 2098-2100.
Caramazza, D., Begna, K. H., Gangat, N., Vaidya, R., Siragusa, S., Van Dyke, D. L., et al. (2011). Refined cytogenetic-risk categorization for overall and leukemia-free survival in primary myelofibrosis: a single center study of 433 patients. Leukemia, 25(1), 82-88.
Carow, C. E., Kim, E., Hawkins, A. L., Webb, H. D., Griffin, C. A., Jabs, E. W., et al. (1995). Localization of the human stem cell tyrosine kinase-1 gene (FLT3) to 13q12-->q13. Cytogenet Cell Genet, 70(3-4), 255-257.
Carow, C. E., Levenstein, M., Kaufmann, S. H., Chen, J., Amin, S., Rockwell, P., et al. (1996). Expression of the hematopoietic growth factor receptor FLT3 (STK-1/Flk2) in human leukemias. Blood, 87(3), 1089-1096.
Carver-Moore, K., Broxmeyer, H. E., Luoh, S. M., Cooper, S., Peng, J., Burstein, S. A., et al. (1996). Low levels of erythroid and myeloid progenitors in thrombopoietin-and c-mpl-deficient mice. Blood, 88(3), 803-808.
198

Castro-Malaspina, H. (1984). Pathogenesis of myelofibrosis: role of ineffective megakaryopoiesis and megakaryocyte components. Prog Clin Biol Res, 154, 427-454.
Chagraoui, H., Komura, E., Tulliez, M., Giraudier, S., Vainchenker, W., & Wendling, F. (2002). Prominent role of TGF-beta 1 in thrombopoietin-induced myelofibrosis in mice. Blood, 100(10), 3495-3503.
Chagraoui, H., Tulliez, M., Smayra, T., Komura, E., Giraudier, S., Yun, T., et al. (2003). Stimulation of osteoprotegerin production is responsible for osteosclerosis in mice overexpressing TPO. Blood, 101(8), 2983-2989.
Chaligne, R., Tonetti, C., Besancenot, R., Marty, C., Kiladjian, J. J., Socie, G., et al. (2009). SOCS3 inhibits TPO-stimulated, but not spontaneous, megakaryocytic growth in primary myelofibrosis. Leukemia, 23(6), 1186-1190.
Chang, L., Kamata, H., Solinas, G., Luo, J. L., Maeda, S., Venuprasad, K., et al. (2006). The E3 ubiquitin ligase itch couples JNK activation to TNFalpha-induced cell death by inducing c-FLIP(L) turnover. Cell, 124(3), 601-613.
Chang, L., & Karin, M. (2001). Mammalian MAP kinase signalling cascades. Nature,
410(6824), 37-40. Charbord, P., Tavian, M., Humeau, L., & Peault, B. (1996). Early ontogeny of the human
marrow from long bones: an immunohistochemical study of hematopoiesis and its microenvironment. Blood, 87(10), 4109-4119.
Chen, X. D., Dusevich, V., Feng, J. Q., Manolagas, S. C., & Jilka, R. L. (2007). Extracellular matrix made by bone marrow cells facilitates expansion of marrow-derived mesenchymal progenitor cells and prevents their differentiation into osteoblasts. JBone Miner Res, 22(12), 1943-1956.
Cheng, T., Rodrigues, N., Shen, H., Yang, Y., Dombkowski, D., Sykes, M., et al. (2000). Hematopoietic stem cell quiescence maintained by p21cip1/waf1. Science, 287(5459), 1804-1808.
Cheshier, S. H., Morrison, S. J., Liao, X., & Weissman, I. L. (1999). In vivo proliferation and cell cycle kinetics of long-term self-renewing hematopoietic stem cells. Proc Natl
Acad Sci U S A, 96(6), 3120-3125. Chi, H., Barry, S. P., Roth, R. J., Wu, J. J., Jones, E. A., Bennett, A. M., et al. (2006).
Dynamic regulation of pro- and anti-inflammatory cytokines by MAPK phosphatase 1 (MKP-1) in innate immune responses. Proc Natl Acad Sci U S A, 103(7), 2274-2279.
Chute, J. P., Muramoto, G. G., Whitesides, J., Colvin, M., Safi, R., Chao, N. J., et al. (2006). Inhibition of aldehyde dehydrogenase and retinoid signaling induces the expansion of human hematopoietic stem cells. Proc Natl Acad Sci U S A, 103(31), 11707-11712.
Claesson-Welsh, L., Eriksson, A., Westermark, B., & Heldin, C. H. (1989). cDNA cloning and expression of the human A-type platelet-derived growth factor (PDGF) receptor establishes structural similarity to the B-type PDGF receptor. Proc Natl Acad Sci U S
A, 86(13), 4917-4921. Clark, A. R., Dean, J. L., & Saklatvala, J. (2003). Post-transcriptional regulation of gene
expression by mitogen-activated protein kinase p38. FEBS Lett, 546(1), 37-44. Clay, D., Rubinstein, E., Mishal, Z., Anjo, A., Prenant, M., Jasmin, C., et al. (2001). CD9 and
megakaryocyte differentiation. Blood, 97(7), 1982-1989. Cleyrat, C., Jelinek, J., Girodon, F., Boissinot, M., Ponge, T., Harousseau, J. L., et al. JAK2
mutation and disease phenotype: a double L611V/V617F in cis mutation of JAK2 is associated with isolated erythrocytosis and increased activation of AKT and ERK1/2 rather than STAT5. Leukemia, 24(5), 1069-1073.
Cohen-Solal, K., Debili, N., Vainchenker, W., & Wendling, F. (1997). Thrombopoietin (Mpl ligand) and the regulation of platelet production. Eur Cytokine Netw, 8(3), 311-314.
199

Conrad, P. W., Millhorn, D. E., & Beitner-Johnson, D. (2000). Hypoxia differentially regulates the mitogen- and stress-activated protein kinases. Role of Ca2+/CaM in the activation of MAPK and p38 gamma. Adv Exp Med Biol, 475, 293-302.
Corre, S., Primot, A., Baron, Y., Le Seyec, J., Goding, C., & Galibert, M. D. (2009). Target gene specificity of USF-1 is directed via p38-mediated phosphorylation-dependent acetylation. J Biol Chem, 284(28), 18851-18862.
Correa, P. N., Eskinazi, D., & Axelrad, A. A. (1994). Circulating erythroid progenitors in polycythemia vera are hypersensitive to insulin-like growth factor-1 in vitro: studies in an improved serum-free medium. Blood, 83(1), 99-112.
Coulombel, L. (2004). Identification of hematopoietic stem/progenitor cells: strength and drawbacks of functional assays. Oncogene, 23(43), 7210-7222.
Coussens, L., Van Beveren, C., Smith, D., Chen, E., Mitchell, R. L., Isacke, C. M., et al. (1986). Structural alteration of viral homologue of receptor proto-oncogene fms at carboxyl terminus. Nature, 320(6059), 277-280.
Cuadrado, A., & Nebreda, A. R. (2010). Mechanisms and functions of p38 MAPK signalling. Biochem J, 429(3), 403-417.
Dalley, A., Smith, J. M., Reilly, J. T., & Neil, S. M. (1996). Investigation of calmodulin and basic fibroblast growth factor (bFGF) in idiopathic myelofibrosis: evidence for a role of extracellular calmodulin in fibroblast proliferation. Br J Haematol, 93(4), 856-862.
Dameshek, W. (1951). Some speculations on the myeloproliferative syndromes. Blood, 6(4), 372-375.
Darnell, J. E., Jr., Kerr, I. M., & Stark, G. R. (1994). Jak-STAT pathways and transcriptional activation in response to IFNs and other extracellular signaling proteins. Science,
264(5164), 1415-1421. Dawson, M. A., Bannister, A. J., Gottgens, B., Foster, S. D., Bartke, T., Green, A. R., et al.
(2009). JAK2 phosphorylates histone H3Y41 and excludes HP1alpha from chromatin. Nature, 461(7265), 819-822.
de Kruijf, E. J., Hagoort, H., Velders, G. A., Fibbe, W. E., & van Pel, M. (2010). Hematopoietic stem and progenitor cells are differentially mobilized depending on the duration of Flt3-ligand administration. Haematologica, 95(7), 1061-1067.
Delhommeau, F., Dupont, S., Della Valle, V., James, C., Trannoy, S., Masse, A., et al. (2009). Mutation in TET2 in myeloid cancers. N Engl J Med, 360(22), 2289-2301.
Delhommeau, F., Dupont, S., Tonetti, C., Masse, A., Godin, I., Le Couedic, J. P., et al. (2007). Evidence that the JAK2 G1849T (V617F) mutation occurs in a lymphomyeloid progenitor in polycythemia vera and idiopathic myelofibrosis. Blood,
109(1), 71-77. Demange, C., Ferrand, N., Prunier, C., Bourgeade, M. F., & Atfi, A. (2009). A model of
partnership co-opted by the homeodomain protein TGIF and the Itch/AIP4 ubiquitin ligase for effective execution of TNF-alpha cytotoxicity. Mol Cell, 36(6), 1073-1085.
Demory, J. L., Dupriez, B., Fenaux, P., Lai, J. L., Beuscart, R., Jouet, J. P., et al. (1988). Cytogenetic studies and their prognostic significance in agnogenic myeloid metaplasia: a report on 47 cases. Blood, 72(3), 855-859.
Dexter, T. M., Allen, T. D., & Lajtha, L. G. (1977). Conditions controlling the proliferation of haemopoietic stem cells in vitro. J Cell Physiol, 91(3), 335-344.
Dhanasekaran, D. N., & Johnson, G. L. (2007). MAPKs: function, regulation, role in cancer and therapeutic targeting. Oncogene, 26(22), 3097-3099.
Dick, J. E., Bhatia, M., Gan, O., Kapp, U., & Wang, J. C. (1997). Assay of human stem cells by repopulation of NOD/SCID mice. Stem Cells, 15 Suppl 1, 199-203; discussion 204-197.
200

Diwan, A., Koesters, A. G., Odley, A. M., Pushkaran, S., Baines, C. P., Spike, B. T., et al. (2007). Unrestrained erythroblast development in Nix-/- mice reveals a mechanism for apoptotic modulation of erythropoiesis. Proc Natl Acad Sci U S A, 104(16), 6794-6799.
Domen, J., Gandy, K. L., & Weissman, I. L. (1998). Systemic overexpression of BCL-2 in the hematopoietic system protects transgenic mice from the consequences of lethal irradiation. Blood, 91(7), 2272-2282.
Dong, C., Yang, D. D., Wysk, M., Whitmarsh, A. J., Davis, R. J., & Flavell, R. A. (1998). Defective T cell differentiation in the absence of Jnk1. Science, 282(5396), 2092-2095.
Dormady, S. P., Bashayan, O., Dougherty, R., Zhang, X. M., & Basch, R. S. (2001). Immortalized multipotential mesenchymal cells and the hematopoietic microenvironment. J Hematother Stem Cell Res, 10(1), 125-140.
Dosil, M., Wang, S., & Lemischka, I. R. (1993). Mitogenic signalling and substrate specificity of the Flk2/Flt3 receptor tyrosine kinase in fibroblasts and interleukin 3-dependent hematopoietic cells. Mol Cell Biol, 13(10), 6572-6585.
Drachman, J. G., Rojnuckarin, P., & Kaushansky, K. (1999). Thrombopoietin signal transduction: studies from cell lines and primary cells. Methods, 17(3), 238-249.
Drexler, H. G. (1996). Expression of FLT3 receptor and response to FLT3 ligand by leukemic cells. Leukemia, 10(4), 588-599.
Dupriez, B., Demory, J. L., Le Bousse-Kerdiles, M. C., Giraudier, S., Bilhou-Nabera, C., Abgrall, J. F., et al. (2008). Myélofibrose primitive. Encyclopédie Médico-
Chirurgicale, Hématologie. Dupriez, B., Morel, P., Demory, J. L., Lai, J. L., Simon, M., Plantier, I., et al. (1996).
Prognostic factors in agnogenic myeloid metaplasia: a report on 195 cases with a new scoring system. Blood, 88(3), 1013-1018.
Eferl, R., & Wagner, E. F. (2003). AP-1: a double-edged sword in tumorigenesis. Nat Rev
Cancer, 3(11), 859-868. Emadi, S., Clay, D., Desterke, C., Guerton, B., Maquarre, E., Charpentier, A., et al. (2005).
IL-8 and its CXCR1 and CXCR2 receptors participate in the control of megakaryocytic proliferation, differentiation, and ploidy in myeloid metaplasia with myelofibrosis. Blood, 105(2), 464-473.
Enslen, H., Raingeaud, J., & Davis, R. J. (1998). Selective activation of p38 mitogen-activated protein (MAP) kinase isoforms by the MAP kinase kinases MKK3 and MKK6. J Biol Chem, 273(3), 1741-1748.
Epstein, E., & Goedel, A. (1934). Hemorrhagic thrombocythemia with a cascular, sclerotic spleen. Virchows Arch, 293, 233-248.
Erlacher, M., Labi, V., Manzl, C., Bock, G., Tzankov, A., Hacker, G., et al. (2006). Puma cooperates with Bim, the rate-limiting BH3-only protein in cell death during lymphocyte development, in apoptosis induction. J Exp Med, 203(13), 2939-2951.
Farina, S. F., Girard, L. J., Vanin, E. F., Nienhuis, A. W., & Bodine, D. M. (1995). Dysregulated expression of GATA-1 following retrovirus-mediated gene transfer into murine hematopoietic stem cells increases erythropoiesis. Blood, 86(11), 4124-4133.
Feng, Y., Wen, J., & Chang, C. C. (2009). p38 Mitogen-activated protein kinase and hematologic malignancies. Arch Pathol Lab Med, 133(11), 1850-1856.
Fichelson, S., Freyssinier, J. M., Picard, F., Fontenay-Roupie, M., Guesnu, M., Cherai, M., et al. (1999). Megakaryocyte growth and development factor-induced proliferation and differentiation are regulated by the mitogen-activated protein kinase pathway in primitive cord blood hematopoietic progenitors. Blood, 94(5), 1601-1613.
201
Filippi, M. D., Porteu, F., Le Pesteur, F., Schiavon, V., Millot, G. A., Vainchenker, W., et al. (2002). Requirement for mitogen-activated protein kinase activation in the response of embryonic stem cell-derived hematopoietic cells to thrombopoietin in vitro. Blood,
99(4), 1174-1182. Fleming, H. E., Janzen, V., Lo Celso, C., Guo, J., Leahy, K. M., Kronenberg, H. M., et al.
(2008). Wnt signaling in the niche enforces hematopoietic stem cell quiescence and is necessary to preserve self-renewal in vivo. Cell Stem Cell, 2(3), 274-283.
Fourouclas, N., Li, J., Gilby, D. C., Campbell, P. J., Beer, P. A., Boyd, E. M., et al. (2008). Methylation of the suppressor of cytokine signaling 3 gene (SOCS3) in myeloproliferative disorders. Haematologica, 93(11), 1635-1644.
Fu, S., & Liesveld, J. (2000). Mobilization of hematopoietic stem cells. Blood Rev, 14(4), 205-218.
Fukuda, S., Broxmeyer, H. E., & Pelus, L. M. (2005). Flt3 ligand and the Flt3 receptor regulate hematopoietic cell migration by modulating the SDF-1alpha(CXCL12)/CXCR4 axis. Blood, 105(8), 3117-3126.
Gainsford, T., Nandurkar, H., Metcalf, D., Robb, L., Begley, C. G., & Alexander, W. S. (2000). The residual megakaryocyte and platelet production in c-mpl-deficient mice is not dependent on the actions of interleukin-6, interleukin-11, or leukemia inhibitory factor. Blood, 95(2), 528-534.
Ganiatsas, S., Kwee, L., Fujiwara, Y., Perkins, A., Ikeda, T., Labow, M. A., et al. (1998). SEK1 deficiency reveals mitogen-activated protein kinase cascade crossregulation and leads to abnormal hepatogenesis. Proc Natl Acad Sci U S A, 95(12), 6881-6886.
Garcia, J., de Gunzburg, J., Eychene, A., Gisselbrecht, S., & Porteu, F. (2001). Thrombopoietin-mediated sustained activation of extracellular signal-regulated kinase in UT7-Mpl cells requires both Ras-Raf-1- and Rap1-B-Raf-dependent pathways. Mol
Cell Biol, 21(8), 2659-2670. Garrett, R. W., & Emerson, S. G. (2009). Bone and blood vessels: the hard and the soft of
hematopoietic stem cell niches. Cell Stem Cell, 4(6), 503-506. Gaundar, S. S., Bradstock, K. F., & Bendall, L. J. (2009). p38MAPK inhibitors attenuate
cytokine production by bone marrow stromal cells and reduce stroma-mediated proliferation of acute lymphoblastic leukemia cells. Cell Cycle, 8(18), 2975-2983.
Geddis, A. E. (2009). The regulation of proplatelet production. Haematologica, 94(6), 756-759.
Geddis, A. E. (2010). Megakaryopoiesis. Semin Hematol, 47(3), 212-219. Geddis, A. E., & Kaushansky, K. (2006). Endomitotic megakaryocytes form a midzone in
anaphase but have a deficiency in cleavage furrow formation. Cell Cycle, 5(5), 538-545.
Ghobrial, I. M., Witzig, T. E., & Adjei, A. A. (2005). Targeting apoptosis pathways in cancer therapy. CA Cancer J Clin, 55(3), 178-194.
Giraudier, S., Chagraoui, H., Komura, E., Barnache, S., Blanchet, B., LeCouedic, J. P., et al. (2002). Overexpression of FKBP51 in idiopathic myelofibrosis regulates the growth factor independence of megakaryocyte progenitors. Blood, 100(8), 2932-2940.
Glozak, M. A., Sengupta, N., Zhang, X., & Seto, E. (2005). Acetylation and deacetylation of non-histone proteins. Gene, 363, 15-23.
Goldfarb, A. N. (2007). Transcriptional control of megakaryocyte development. Oncogene,
26(47), 6795-6802. Goodell, M. A., Brose, K., Paradis, G., Conner, A. S., & Mulligan, R. C. (1996). Isolation and
functional properties of murine hematopoietic stem cells that are replicating in vivo. JExp Med, 183(4), 1797-1806.
202
Goodsell, D. S. (2002). The molecular perspective: Bcl-2 and apoptosis. Stem Cells, 20(4), 355-356.
Goralczyk, R., Closs, E. I., Ruther, U., Wagner, E. F., Strauss, P. G., Erfle, V., et al. (1990). Characterization of fos-induced osteogenic tumours and tumour-derived murine cell lines. Differentiation, 44(2), 122-131.
Gospodarowicz, D., Ferrara, N., Schweigerer, L., & Neufeld, G. (1987). Structural characterization and biological functions of fibroblast growth factor. Endocr Rev, 8(2), 95-114.
Gotherstrom, C. (2007). Immunomodulation by multipotent mesenchymal stromal cells. Transplantation, 84(1 Suppl), S35-37.
Grand, F. H., Hidalgo-Curtis, C. E., Ernst, T., Zoi, K., Zoi, C., McGuire, C., et al. (2009). Frequent CBL mutations associated with 11q acquired uniparental disomy in myeloproliferative neoplasms. Blood, 113(24), 6182-6192.
Gregoretti, I. V., Lee, Y. M., & Goodson, H. V. (2004). Molecular evolution of the histone deacetylase family: functional implications of phylogenetic analysis. J Mol Biol,
338(1), 17-31. Grimwade, L. F., Happerfield, L., Tristram, C., McIntosh, G., Rees, M., Bench, A. J., et al.
(2009). Phospho-STAT5 and phospho-Akt expression in chronic myeloproliferative neoplasms. Br J Haematol, 147(4), 495-506.
Groom, L. A., Sneddon, A. A., Alessi, D. R., Dowd, S., & Keyse, S. M. (1996). Differential regulation of the MAP, SAP and RK/p38 kinases by Pyst1, a novel cytosolic dual-specificity phosphatase. Embo J, 15(14), 3621-3632.
Guihard, S., Clay, D., Cocault, L., Saulnier, N., Opolon, P., Souyri, M., et al. (2010). The MAPK ERK1 is a negative regulator of the adult steady-state splenic erythropoiesis. Blood, 115(18), 3686-3694.
Gupta, R., Knight, C. L., & Bain, B. J. (2002). Receptor tyrosine kinase mutations in myeloid neoplasms. Br J Haematol, 117(3), 489-508.
Haeusgen, W., Herdegen, T., & Waetzig, V. (2011). The bottleneck of JNK signaling: Molecular and functional characteristics of MKK4 and MKK7. Eur J Cell Biol.
Hannum, C., Culpepper, J., Campbell, D., McClanahan, T., Zurawski, S., Bazan, J. F., et al. (1994). Ligand for FLT3/FLK2 receptor tyrosine kinase regulates growth of haematopoietic stem cells and is encoded by variant RNAs. Nature, 368(6472), 643-648.
Hayashi, M., & Lee, J. D. (2004). Role of the BMK1/ERK5 signaling pathway: lessons from knockout mice. J Mol Med, 82(12), 800-808.
Hemavathy, K. C., Chang, T. H., Zhang, H., Charles, W., Goldberg, A., Aithal, S., et al. (2006). Reduced expression of TGF beta1RII in agnogenic myeloid metaplasia is not due to mutation or methylation. Leuk Res, 30(1), 47-53.
Heuck, G. (1879). Two cases of leukemia with peculiar blood and bone marrow findings, respectively. Arch Pathol Anat, 78, 475-496.
Hirosumi, J., Tuncman, G., Chang, L., Gorgun, C. Z., Uysal, K. T., Maeda, K., et al. (2002). A central role for JNK in obesity and insulin resistance. Nature, 420(6913), 333-336.
Hogan, C. J., Shpall, E. J., & Keller, G. (2002). Differential long-term and multilineage engraftment potential from subfractions of human CD34+ cord blood cells transplanted into NOD/SCID mice. Proc Natl Acad Sci U S A, 99(1), 413-418.
Horiuchi, K., Morioka, H., Takaishi, H., Akiyama, H., Blobel, C. P., & Toyama, Y. (2009). Ectodomain shedding of FLT3 ligand is mediated by TNF-alpha converting enzyme. JImmunol, 182(12), 7408-7414.
203

Hosokawa, K., Arai, F., Yoshihara, H., Iwasaki, H., Nakamura, Y., Gomei, Y., et al. (2010). Knockdown of N-cadherin suppresses the long-term engraftment of hematopoietic stem cells. Blood, 116(4), 554-563.
Hsu, C. L., Kikuchi, K., & Kondo, M. (2007). Activation of mitogen-activated protein kinase kinase (MEK)/extracellular signal regulated kinase (ERK) signaling pathway is involved in myeloid lineage commitment. Blood, 110(5), 1420-1428.
Hu, H. (1987). Benzene-associated myelofibrosis. Ann Intern Med, 106(1), 171-172. Hunte, B. E., Hudak, S., Campbell, D., Xu, Y., & Rennick, D. (1996). flk2/flt3 ligand is a
potent cofactor for the growth of primitive B cell progenitors. J Immunol, 156(2), 489-496.
Ihalainen, J., Juvonen, E., Savolainen, E. R., Ruutu, T., & Palotie, A. (1994). Calcitonin gene methylation in chronic myeloproliferative disorders. Leukemia, 8(2), 230-235.
Inoue, Y., Suzuki, T., Takimoto, M., Irei, M., Yoshioka, S., Shibuya, Y., et al. (2005). Treatment with valproic acid for myelofibrosis with myeloid metaplasia. Ann
Hematol, 84(12), 833-834. Italiano, J. E., Jr., Richardson, J. L., Patel-Hett, S., Battinelli, E., Zaslavsky, A., Short, S., et
al. (2008). Angiogenesis is regulated by a novel mechanism: pro- and antiangiogenic proteins are organized into separate platelet alpha granules and differentially released. Blood, 111(3), 1227-1233.
Ito, K., Hirao, A., Arai, F., Matsuoka, S., Takubo, K., Hamaguchi, I., et al. (2004). Regulation of oxidative stress by ATM is required for self-renewal of haematopoietic stem cells. Nature, 431(7011), 997-1002.
Ito, K., Hirao, A., Arai, F., Takubo, K., Matsuoka, S., Miyamoto, K., et al. (2006). Reactive oxygen species act through p38 MAPK to limit the lifespan of hematopoietic stem cells. Nat Med, 12(4), 446-451.
Jacobson, R. J., Salo, A., & Fialkow, P. J. (1978). Agnogenic myeloid metaplasia: a clonal proliferation of hematopoietic stem cells with secondary myelofibrosis. Blood, 51(2), 189-194.
James, C., Ugo, V., Le Couedic, J. P., Staerk, J., Delhommeau, F., Lacout, C., et al. (2005). A unique clonal JAK2 mutation leading to constitutive signalling causes polycythaemia vera. Nature, 434(7037), 1144-1148.
Jochum, W., David, J. P., Elliott, C., Wutz, A., Plenk, H., Jr., Matsuo, K., et al. (2000). Increased bone formation and osteosclerosis in mice overexpressing the transcription factor Fra-1. Nat Med, 6(9), 980-984.
John, A. M., Thomas, N. S., Mufti, G. J., & Padua, R. A. (2004). Targeted therapies in myeloid leukemia. Semin Cancer Biol, 14(1), 41-62.
Jones, A. V., Campbell, P. J., Beer, P. A., Schnittger, S., Vannucchi, A. M., Zoi, K., et al. (2010). The JAK2 46/1 haplotype predisposes to MPL-mutated myeloproliferative neoplasms. Blood, 115(22), 4517-4523.
Jones, L. C., Tefferi, A., Idos, G. E., Kumagai, T., Hofmann, W. K., & Koeffler, H. P. (2004). RARbeta2 is a candidate tumor suppressor gene in myelofibrosis with myeloid metaplasia. Oncogene, 23(47), 7846-7853.
Jung, Y., Wang, J., Song, J., Shiozawa, Y., Wang, J., Havens, A., et al. (2007). Annexin II expressed by osteoblasts and endothelial cells regulates stem cell adhesion, homing, and engraftment following transplantation. Blood, 110(1), 82-90.
Junt, T., Schulze, H., Chen, Z., Massberg, S., Goerge, T., Krueger, A., et al. (2007). Dynamic visualization of thrombopoiesis within bone marrow. Science, 317(5845), 1767-1770.
Kahn, A., Bernard, J. F., Cottreau, D., Marie, J., & Boivin, P. (1975). Gd(--) Abrami: a deficient G-6PD variant with hemizygous expression in blood cells of a woman with primary myelofibrosis. Humangenetik, 30(1), 41-46.
204

Kaluzhny, Y., Yu, G., Sun, S., Toselli, P. A., Nieswandt, B., Jackson, C. W., et al. (2002). BclxL overexpression in megakaryocytes leads to impaired platelet fragmentation. Blood, 100(5), 1670-1678.
Kastan, M. B., Schlaffer, E., Russo, J. E., Colvin, O. M., Civin, C. I., & Hilton, J. (1990). Direct demonstration of elevated aldehyde dehydrogenase in human hematopoietic progenitor cells. Blood, 75(10), 1947-1950.
Katsoulidis, E., Li, Y., Yoon, P., Sassano, A., Altman, J., Kannan-Thulasiraman, P., et al. (2005). Role of the p38 mitogen-activated protein kinase pathway in cytokine-mediated hematopoietic suppression in myelodysplastic syndromes. Cancer Res,
65(19), 9029-9037. Kelkar, N., Standen, C. L., & Davis, R. J. (2005). Role of the JIP4 scaffold protein in the
regulation of mitogen-activated protein kinase signaling pathways. Mol Cell Biol,
25(7), 2733-2743. Kelly, L. M., Liu, Q., Kutok, J. L., Williams, I. R., Boulton, C. L., & Gilliland, D. G. (2002).
FLT3 internal tandem duplication mutations associated with human acute myeloid leukemias induce myeloproliferative disease in a murine bone marrow transplant model. Blood, 99(1), 310-318.
Keyse, S. M. (2000). Protein phosphatases and the regulation of mitogen-activated protein kinase signalling. Curr Opin Cell Biol, 12(2), 186-192.
Khurana, A., Nakayama, K., Williams, S., Davis, R. J., Mustelin, T., & Ronai, Z. (2006). Regulation of the ring finger E3 ligase Siah2 by p38 MAPK. J Biol Chem, 281(46), 35316-35326.
Kiel, M. J., Yilmaz, O. H., Iwashita, T., Yilmaz, O. H., Terhorst, C., & Morrison, S. J. (2005). SLAM family receptors distinguish hematopoietic stem and progenitor cells and reveal endothelial niches for stem cells. Cell, 121(7), 1109-1121.
Kim, H. S., Choi, E. S., Shin, J. A., Jang, Y. K., & Park, S. D. (2004). Regulation of Swi6/HP1-dependent heterochromatin assembly by cooperation of components of the mitogen-activated protein kinase pathway and a histone deacetylase Clr6. J Biol
Chem, 279(41), 42850-42859. Kimura, S., Roberts, A. W., Metcalf, D., & Alexander, W. S. (1998). Hematopoietic stem cell
deficiencies in mice lacking c-Mpl, the receptor for thrombopoietin. Proc Natl Acad
Sci U S A, 95(3), 1195-1200. Kirito, K., Fox, N., & Kaushansky, K. (2003). Thrombopoietin stimulates Hoxb4 expression:
an explanation for the favorable effects of TPO on hematopoietic stem cells. Blood,
102(9), 3172-3178. Kishimoto, T., Taga, T., & Akira, S. (1994). Cytokine signal transduction. Cell, 76(2), 253-
262. Kitatani, K., Idkowiak-Baldys, J., Bielawski, J., Taha, T. A., Jenkins, R. W., Senkal, C. E., et
al. (2006). Protein kinase C-induced activation of a ceramide/protein phosphatase 1 pathway leading to dephosphorylation of p38 MAPK. J Biol Chem, 281(48), 36793-36802.
Kobayashi, H., Butler, J. M., O'Donnell, R., Kobayashi, M., Ding, B. S., Bonner, B., et al. (2010). Angiocrine factors from Akt-activated endothelial cells balance self-renewal and differentiation of haematopoietic stem cells. Nat Cell Biol, 12(11), 1046-1056.
Kralovics, R., Passamonti, F., Buser, A. S., Teo, S. S., Tiedt, R., Passweg, J. R., et al. (2005). A gain-of-function mutation of JAK2 in myeloproliferative disorders. N Engl J Med,
352(17), 1779-1790. Krause, D. S., Fackler, M. J., Civin, C. I., & May, W. S. (1996). CD34: structure, biology,
and clinical utility. Blood, 87(1), 1-13.
205
Kuribara, R., Honda, H., Matsui, H., Shinjyo, T., Inukai, T., Sugita, K., et al. (2004). Roles of Bim in apoptosis of normal and Bcr-Abl-expressing hematopoietic progenitors. Mol
Cell Biol, 24(14), 6172-6183. Kuter, D. J., Bain, B., Mufti, G., Bagg, A., & Hasserjian, R. P. (2007). Bone marrow fibrosis:
pathophysiology and clinical significance of increased bone marrow stromal fibres. Br
J Haematol, 139(3), 351-362. Kyriakis, J. M., & Avruch, J. (2001). Mammalian mitogen-activated protein kinase signal
transduction pathways activated by stress and inflammation. Physiol Rev, 81(2), 807-869.
Labouyrie, E., Dubus, P., Groppi, A., Mahon, F. X., Ferrer, J., Parrens, M., et al. (1999). Expression of neurotrophins and their receptors in human bone marrow. Am J Pathol,
154(2), 405-415. Lacout, C., Pisani, D. F., Tulliez, M., Gachelin, F. M., Vainchenker, W., & Villeval, J. L.
(2006). JAK2V617F expression in murine hematopoietic cells leads to MPD mimicking human PV with secondary myelofibrosis. Blood, 108(5), 1652-1660.
Laird, D. J., von Andrian, U. H., & Wagers, A. J. (2008). Stem cell trafficking in tissue development, growth, and disease. Cell, 132(4), 612-630.
Lapidot, T., Dar, A., & Kollet, O. (2005). How do stem cells find their way home? Blood,
106(6), 1901-1910. Lapidot, T., & Kollet, O. (2010). The brain-bone-blood triad: traffic lights for stem-cell
homing and mobilization. Hematology Am Soc Hematol Educ Program, 2010, 1-6. Lapidot, T., & Petit, I. (2002). Current understanding of stem cell mobilization: the roles of
chemokines, proteolytic enzymes, adhesion molecules, cytokines, and stromal cells. Exp Hematol, 30(9), 973-981.
Lasho, T. L., Tefferi, A., Finke, C., & Pardanani, A. (2011). Clonal hierarchy and allelic mutation segregation in a myelofibrosis patient with two distinct LNK mutations. Leukemia.
Lasho, T. L., Tefferi, A., Hood, J. D., Verstovsek, S., Gilliland, D. G., & Pardanani, A. (2008). TG101348, a JAK2-selective antagonist, inhibits primary hematopoietic cells derived from myeloproliferative disorder patients with JAK2V617F, MPLW515K or JAK2 exon 12 mutations as well as mutation negative patients. Leukemia, 22(9), 1790-1792.
Laszlo, J. (1975). Myeloproliferative disorders (MPD): myelofibrosis, myelosclerosis, extramedullary hematopoiesis, undifferentiated MPD, and hemorrhagic thrombocythemia. Semin Hematol, 12(4), 409-432.
Lataillade, J. J., Clay, D., Bourin, P., Herodin, F., Dupuy, C., Jasmin, C., et al. (2002). Stromal cell-derived factor 1 regulates primitive hematopoiesis by suppressing apoptosis and by promoting G(0)/G(1) transition in CD34(+) cells: evidence for an autocrine/paracrine mechanism. Blood, 99(4), 1117-1129.
Lataillade, J. J., Clay, D., Dupuy, C., Rigal, S., Jasmin, C., Bourin, P., et al. (2000). Chemokine SDF-1 enhances circulating CD34(+) cell proliferation in synergy with cytokines: possible role in progenitor survival. Blood, 95(3), 756-768.
Lataillade, J. J., Pierre-Louis, O., Hasselbalch, H. C., Uzan, G., Jasmin, C., Martyre, M. C., et al. (2008). Does primary myelofibrosis involve a defective stem cell niche? From concept to evidence. Blood, 112(8), 3026-3035.
Laterveer, L., Lindley, I. J., Heemskerk, D. P., Camps, J. A., Pauwels, E. K., Willemze, R., et al. (1996). Rapid mobilization of hematopoietic progenitor cells in rhesus monkeys by a single intravenous injection of interleukin-8. Blood, 87(2), 781-788.
206

Lavagna-Sevenier, C., Marchetto, S., Birnbaum, D., & Rosnet, O. (1998). FLT3 signaling in hematopoietic cells involves CBL, SHC and an unknown P115 as prominent tyrosine-phosphorylated substrates. Leukemia, 12(3), 301-310.
Le Bousse-Kerdiles, M. C., Chevillard, S., Charpentier, A., Romquin, N., Clay, D., Smadja-Joffe, F., et al. (1996). Differential expression of transforming growth factor-beta, basic fibroblast growth factor, and their receptors in CD34+ hematopoietic progenitor cells from patients with myelofibrosis and myeloid metaplasia. Blood, 88(12), 4534-4546.
Le Bousse-Kerdiles, M. C., & Martyre, M. C. (2001). Involvement of the fibrogenic cytokines, TGF-beta and bFGF, in the pathogenesis of idiopathic myelofibrosis. Pathol Biol (Paris), 49(2), 153-157.
Le Bousse-Kerdiles, M. C., Praloran, V., Martyré, M. C., & Membres du réseau de recherche clinique Inserm sur la myélofibrose. (2002). La splénomégalie myéloïde. De données récentes à un modèle physiopathologique. Hématologie, 8(3), 187-196.
Le Bousse-Kerdiles, M. C., Souyri, M., Smadja-Joffe, F., Praloran, V., Jasmin, C., & Ziltener, H. J. (1992). Enhanced hematopoietic growth factor production in an experimental myeloproliferative syndrome. Blood, 79(12), 3179-3187.
Lepage, A., Leboeuf, M., Cazenave, J. P., de la Salle, C., Lanza, F., & Uzan, G. (2000). The alpha(IIb)beta(3) integrin and GPIb-V-IX complex identify distinct stages in the maturation of CD34(+) cord blood cells to megakaryocytes. Blood, 96(13), 4169-4177.
Letourneux, C., Rocher, G., & Porteu, F. (2006). B56-containing PP2A dephosphorylate ERK and their activity is controlled by the early gene IEX-1 and ERK. Embo J, 25(4), 727-738.
Leuenroth, S. J., Grutkoski, P. S., Ayala, A., & Simms, H. H. (2000). The loss of Mcl-1 expression in human polymorphonuclear leukocytes promotes apoptosis. J Leukoc
Biol, 68(1), 158-166. Levenson, J. M., & Sweatt, J. D. (2005). Epigenetic mechanisms in memory formation. Nat
Rev Neurosci, 6(2), 108-118. Levesque, J. P., Helwani, F. M., & Winkler, I. G. (2010). The endosteal 'osteoblastic' niche
and its role in hematopoietic stem cell homing and mobilization. Leukemia, 24(12), 1979-1992.
Levine, R. L., Belisle, C., Wadleigh, M., Zahrieh, D., Lee, S., Chagnon, P., et al. (2006). X-inactivation-based clonality analysis and quantitative JAK2V617F assessment reveal a strong association between clonality and JAK2V617F in PV but not ET/MMM, and identifies a subset of JAK2V617F-negative ET and MMM patients with clonal hematopoiesis. Blood, 107(10), 4139-4141.
Levine, R. L., Pardanani, A., Tefferi, A., & Gilliland, G. (2007). Role of JAK2 in the pathogenesis and therapy of myeloproliferative disorders. Nature Reviews Cancer, 7, 673-683.
Li, W., Johnson, S. A., Shelley, W. C., & Yoder, M. C. (2004). Hematopoietic stem cell repopulating ability can be maintained in vitro by some primary endothelial cells. Exp
Hematol, 32(12), 1226-1237. Lisovsky, M., Braun, S. E., Ge, Y., Takahira, H., Lu, L., Savchenko, V. G., et al. (1996). Flt3-
ligand production by human bone marrow stromal cells. Leukemia, 10(6), 1012-1018. Lopez-Bergami, P., Lau, E., & Ronai, Z. (2010). Emerging roles of ATF2 and the dynamic
AP1 network in cancer. Nat Rev Cancer, 10(1), 65-76. Lordier, L., Jalil, A., Aurade, F., Larbret, F., Larghero, J., Debili, N., et al. (2008).
Megakaryocyte endomitosis is a failure of late cytokinesis related to defects in the contractile ring and Rho/Rock signaling. Blood, 112(8), 3164-3174.
207

Lortat-Jacob, H., Grosdidier, A., & Imberty, A. (2002). Structural diversity of heparan sulfate binding domains in chemokines. Proc Natl Acad Sci U S A, 99(3), 1229-1234.
Luger, K., Mader, A. W., Richmond, R. K., Sargent, D. F., & Richmond, T. J. (1997). Crystal structure of the nucleosome core particle at 2.8 A resolution. Nature, 389(6648), 251-260.
Lyman, S. D., & Jacobsen, S. E. (1998). c-kit ligand and Flt3 ligand: stem/progenitor cell factors with overlapping yet distinct activities. Blood, 91(4), 1101-1134.
Lyman, S. D., James, L., Johnson, L., Brasel, K., de Vries, P., Escobar, S. S., et al. (1994). Cloning of the human homologue of the murine flt3 ligand: a growth factor for early hematopoietic progenitor cells. Blood, 83(10), 2795-2801.
Lyman, S. D., James, L., Vanden Bos, T., de Vries, P., Brasel, K., Gliniak, B., et al. (1993). Molecular cloning of a ligand for the flt3/flk-2 tyrosine kinase receptor: a proliferative factor for primitive hematopoietic cells. Cell, 75(6), 1157-1167.
Lyman, S. D., Seaberg, M., Hanna, R., Zappone, J., Brasel, K., Abkowitz, J. L., et al. (1995). Plasma/serum levels of flt3 ligand are low in normal individuals and highly elevated in patients with Fanconi anemia and acquired aplastic anemia. Blood, 86(11), 4091-4096.
Macdonald, D., Aguiar, R. C., Mason, P. J., Goldman, J. M., & Cross, N. C. (1995). A new myeloproliferative disorder associated with chromosomal translocations involving 8p11: a review. Leukemia, 9(10), 1628-1630.
Macian, F., Lopez-Rodriguez, C., & Rao, A. (2001). Partners in transcription: NFAT and AP-1. Oncogene, 20(19), 2476-2489.
Mackarehtschian, K., Hardin, J. D., Moore, K. A., Boast, S., Goff, S. P., & Lemischka, I. R. (1995). Targeted disruption of the flk2/flt3 gene leads to deficiencies in primitive hematopoietic progenitors. Immunity, 3(1), 147-161.
Manning, G., Whyte, D. B., Martinez, R., Hunter, T., & Sudarsanam, S. (2002). The protein kinase complement of the human genome. Science, 298(5600), 1912-1934.
Martin, F., Prandini, M. H., Thevenon, D., Marguerie, G., & Uzan, G. (1993). The transcription factor GATA-1 regulates the promoter activity of the platelet glycoprotein IIb gene. J Biol Chem, 268(29), 21606-21612.
Marty, C., Lacout, C., Martin, A., Hasan, S., Jacquot, S., Birling, M. C., et al. (2010). Myeloproliferative neoplasm induced by constitutive expression of JAK2V617F in knock-in mice. Blood, 116(5), 783-787.
Martyre, M. C., Le Bousse-Kerdiles, M. C., Romquin, N., Chevillard, S., Praloran, V., Demory, J. L., et al. (1997). Elevated levels of basic fibroblast growth factor in megakaryocytes and platelets from patients with idiopathic myelofibrosis. Br J
Haematol, 97(2), 441-448. Martyre, M. C., Magdelenat, H., Bryckaert, M. C., Laine-Bidron, C., & Calvo, F. (1991).
Increased intraplatelet levels of platelet-derived growth factor and transforming growth factor-beta in patients with myelofibrosis with myeloid metaplasia. Br J
Haematol, 77(1), 80-86. Martyre, M. C., Romquin, N., Le Bousse-Kerdiles, M. C., Chevillard, S., Benyahia, B.,
Dupriez, B., et al. (1994). Transforming growth factor-beta and megakaryocytes in the pathogenesis of idiopathic myelofibrosis. Br J Haematol, 88(1), 9-16.
Martyre, M. C., Steunou, V., LeBousse-Kerdiles, M. C., & Wietzerbin, J. (2003). Lack of alteration in GATA-1 expression in CD34+ hematopoietic progenitors from patients with idiopathic myelofibrosis. Blood, 101(12), 5087-5088; author reply 5088-5089.
Massa, M., Rosti, V., Ramajoli, I., Campanelli, R., Pecci, A., Viarengo, G., et al. (2005). Circulating CD34+, CD133+, and vascular endothelial growth factor receptor 2-positive endothelial progenitor cells in myelofibrosis with myeloid metaplasia. J Clin
Oncol, 23(24), 5688-5695.
208
Masson, K., & Ronnstrand, L. (2009). Oncogenic signaling from the hematopoietic growth factor receptors c-Kit and Flt3. Cell Signal, 21(12), 1717-1726.
Mateescu, B., England, P., Halgand, F., Yaniv, M., & Muchardt, C. (2004). Tethering of HP1 proteins to chromatin is relieved by phosphoacetylation of histone H3. EMBO Rep,
5(5), 490-496. Matsumura, I., Nakajima, K., Wakao, H., Hattori, S., Hashimoto, K., Sugahara, H., et al.
(1998). Involvement of prolonged ras activation in thrombopoietin-induced megakaryocytic differentiation of a human factor-dependent hematopoietic cell line. Mol Cell Biol, 18(7), 4282-4290.
Matsuoka, H., Unami, A., Fujimura, T., Noto, T., Takata, Y., Yoshizawa, K., et al. (2007). Mechanisms of HDAC inhibitor-induced thrombocytopenia. Eur J Pharmacol, 571(2-3), 88-96.
Matthews, W., Jordan, C. T., Wiegand, G. W., Pardoll, D., & Lemischka, I. R. (1991). A receptor tyrosine kinase specific to hematopoietic stem and progenitor cell-enriched populations. Cell, 65(7), 1143-1152.
Mazzucchelli, C., Vantaggiato, C., Ciamei, A., Fasano, S., Pakhotin, P., Krezel, W., et al. (2002). Knockout of ERK1 MAP kinase enhances synaptic plasticity in the striatum and facilitates striatal-mediated learning and memory. Neuron, 34(5), 807-820.
Medvinsky, A., & Dzierzak, E. (1996). Definitive hematopoiesis is autonomously initiated by the AGM region. Cell, 86(6), 897-906.
Medzhitov, R., & Horng, T. (2009). Transcriptional control of the inflammatory response. Nat
Rev Immunol, 9(10), 692-703. Mendes, S. C., Robin, C., & Dzierzak, E. (2005). Mesenchymal progenitor cells localize
within hematopoietic sites throughout ontogeny. Development, 132(5), 1127-1136. Mendez-Ferrer, S., Michurina, T. V., Ferraro, F., Mazloom, A. R., Macarthur, B. D., Lira, S.
A., et al. (2010). Mesenchymal and haematopoietic stem cells form a unique bone marrow niche. Nature, 466(7308), 829-834.
Mesa, R. A. (2010). New drugs for the treatment of myelofibrosis. Curr Hematol Malig Rep,
5(1), 15-21. Mesa, R. A., Hanson, C. A., Rajkumar, S. V., Schroeder, G., & Tefferi, A. (2000). Evaluation
and clinical correlations of bone marrow angiogenesis in myelofibrosis with myeloid metaplasia. Blood, 96(10), 3374-3380.
Mesa, R. A., Verstovsek, S., Cervantes, F., Barosi, G., Reilly, J. T., Dupriez, B., et al. (2007). Primary myelofibrosis (PMF), post polycythemia vera myelofibrosis (post-PV MF), post essential thrombocythemia myelofibrosis (post-ET MF), blast phase PMF (PMF-BP): Consensus on terminology by the international working group for myelofibrosis research and treatment (IWG-MRT). Leuk Res, 31(6), 737-740.
Mesa, R. A., Verstovsek, S., Rivera, C., Pardanani, A., Hussein, K., Lasho, T., et al. (2009). 5-Azacitidine has limited therapeutic activity in myelofibrosis. Leukemia, 23(1), 180-182.
Miharada, K., Hiroyama, T., Sudo, K., Danjo, I., Nagasawa, T., & Nakamura, Y. (2008). Lipocalin 2-mediated growth suppression is evident in human erythroid and monocyte/macrophage lineage cells. J Cell Physiol, 215(2), 526-537.
Miller, J. S., Verfaillie, C., & McGlave, P. (1992). The generation of human natural killer cells from CD34+/DR- primitive progenitors in long-term bone marrow culture. Blood, 80(9), 2182-2187.
Moliterno, A. R., Hankins, W. D., & Spivak, J. L. (1998). Impaired expression of the thrombopoietin receptor by platelets from patients with polycythemia vera. N Engl J
Med, 338(9), 572-580.
209

Morrison, S. J., & Spradling, A. C. (2008). Stem cells and niches: mechanisms that promote stem cell maintenance throughout life. Cell, 132(4), 598-611.
Morrison, S. J., Uchida, N., & Weissman, I. L. (1995). The biology of hematopoietic stem cells. Annu Rev Cell Dev Biol, 11, 35-71.
Morrison, S. J., & Weissman, I. L. (1994). The long-term repopulating subset of hematopoietic stem cells is deterministic and isolatable by phenotype. Immunity, 1(8), 661-673.
Muda, M., Theodosiou, A., Rodrigues, N., Boschert, U., Camps, M., Gillieron, C., et al. (1996). The dual specificity phosphatases M3/6 and MKP-3 are highly selective for inactivation of distinct mitogen-activated protein kinases. J Biol Chem, 271(44), 27205-27208.
Mudgett, J. S., Ding, J., Guh-Siesel, L., Chartrain, N. A., Yang, L., Gopal, S., et al. (2000). Essential role for p38alpha mitogen-activated protein kinase in placental angiogenesis. Proc Natl Acad Sci U S A, 97(19), 10454-10459.
Murakami, K., Koide, M., Dumont, T. M., Russell, S. R., Tranmer, B. I., & Wellman, G. C. (2011). Subarachnoid Hemorrhage Induces Gliosis and Increased Expression of the Pro-inflammatory Cytokine High Mobility Group Box 1 Protein. Transl Stroke Res,
2(1), 72-79. Nagata, Y., Muro, Y., & Todokoro, K. (1997). Thrombopoietin-induced polyploidization of
bone marrow megakaryocytes is due to a unique regulatory mechanism in late mitosis. J Cell Biol, 139(2), 449-457.
Nakamura, Y., Arai, F., Iwasaki, H., Hosokawa, K., Kobayashi, I., Gomei, Y., et al. (2010). Isolation and characterization of endosteal niche cell populations that regulate hematopoietic stem cells. Blood, 116(9), 1422-1432.
Naresh, K. N. (2010). Bone marrow trephine biopsy findings in primary myelofibrosis. Am J
Hematol, 85(12), 954-955. Naveiras, O., Nardi, V., Wenzel, P. L., Hauschka, P. V., Fahey, F., & Daley, G. Q. (2009).
Bone-marrow adipocytes as negative regulators of the haematopoietic microenvironment. Nature, 460(7252), 259-263.
Nie, Y., Han, Y. C., & Zou, Y. R. (2008). CXCR4 is required for the quiescence of primitive hematopoietic cells. J Exp Med, 205(4), 777-783.
Noort, W. A., Kruisselbrink, A. B., in't Anker, P. S., Kruger, M., van Bezooijen, R. L., de Paus, R. A., et al. (2002). Mesenchymal stem cells promote engraftment of human umbilical cord blood-derived CD34(+) cells in NOD/SCID mice. Exp Hematol, 30(8), 870-878.
Novack, D. V., & Teitelbaum, S. L. (2008). The osteoclast: friend or foe? Annu Rev Pathol, 3, 457-484.
O'Brien, H. A., & Horton, M. A. (1984). A short-term assay of myeloid precursor cells in man. Exp Hematol, 12(7), 575-580.
O'Farrell, A. M., Abrams, T. J., Yuen, H. A., Ngai, T. J., Louie, S. G., Yee, K. W., et al. (2003). SU11248 is a novel FLT3 tyrosine kinase inhibitor with potent activity in vitro and in vivo. Blood, 101(9), 3597-3605.
O'Keefe, C., McDevitt, M. A., & Maciejewski, J. P. (2010). Copy neutral loss of heterozygosity: a novel chromosomal lesion in myeloid malignancies. Blood, 115(14), 2731-2739.
Opferman, J. T. (2007). Life and death during hematopoietic differentiation. Curr Opin
Immunol, 19(5), 497-502. Opferman, J. T., Iwasaki, H., Ong, C. C., Suh, H., Mizuno, S., Akashi, K., et al. (2005).
Obligate role of anti-apoptotic MCL-1 in the survival of hematopoietic stem cells. Science, 307(5712), 1101-1104.
210

Oppliger Leibundgut, E., Horn, M. P., Brunold, C., Pfanner-Meyer, B., Marti, D., Hirsiger, H., et al. (2006). Hematopoietic and endothelial progenitor cell trafficking in patients with myeloproliferative diseases. Haematologica, 91(11), 1465-1472.
Osawa, M., Hanada, K., Hamada, H., & Nakauchi, H. (1996). Long-term lymphohematopoietic reconstitution by a single CD34-low/negative hematopoietic stem cell. Science, 273(5272), 242-245.
Osler, W. (1903). Chronic cyanosis, with polycythaemia and enlarged spleen: a new clinical entity. American journal of the medical sciences, 126, 187-201.
Ouwens, D. M., de Ruiter, N. D., van der Zon, G. C., Carter, A. P., Schouten, J., van der Burgt, C., et al. (2002). Growth factors can activate ATF2 via a two-step mechanism: phosphorylation of Thr71 through the Ras-MEK-ERK pathway and of Thr69 through RalGDS-Src-p38. Embo J, 21(14), 3782-3793.
Pages, G., Guerin, S., Grall, D., Bonino, F., Smith, A., Anjuere, F., et al. (1999). Defective thymocyte maturation in p44 MAP kinase (Erk 1) knockout mice. Science, 286(5443), 1374-1377.
Papayannopoulou, T., Nakamoto, B., Andrews, R. G., Lyman, S. D., & Lee, M. Y. (1997). In vivo effects of Flt3/Flk2 ligand on mobilization of hematopoietic progenitors in primates and potent synergistic enhancement with granulocyte colony-stimulating factor. Blood, 90(2), 620-629.
Pardanani, A. D., Levine, R. L., Lasho, T., Pikman, Y., Mesa, R. A., Wadleigh, M., et al. (2006). MPL515 mutations in myeloproliferative and other myeloid disorders: a study of 1182 patients. Blood, 108(10), 3472-3476.
Passamonti, F., Rumi, E., Pietra, D., Della Porta, M. G., Boveri, E., Pascutto, C., et al. (2006). Relation between JAK2 (V617F) mutation status, granulocyte activation, and constitutive mobilization of CD34+ cells into peripheral blood in myeloproliferative disorders. Blood, 107(9), 3676-3682.
Patel, S. R., Hartwig, J. H., & Italiano, J. E., Jr. (2005). The biogenesis of platelets from megakaryocyte proplatelets. J Clin Invest, 115(12), 3348-3354.
Pelus, L. M., Horowitz, D., Cooper, S. C., & King, A. G. (2002). Peripheral blood stem cell mobilization. A role for CXC chemokines. Crit Rev Oncol Hematol, 43(3), 257-275.
Peters, M., Solem, F., Goldschmidt, J., Schirmacher, P., & Rose-John, S. (2001). Interleukin-6 and the soluble interleukin-6 receptor induce stem cell factor and Flt-3L expression in vivo and in vitro. Exp Hematol, 29(2), 146-155.
Pevny, L., Simon, M. C., Robertson, E., Klein, W. H., Tsai, S. F., D'Agati, V., et al. (1991). Erythroid differentiation in chimaeric mice blocked by a targeted mutation in the gene for transcription factor GATA-1. Nature, 349(6306), 257-260.
Piaggio, G., Rosti, V., Corselli, M., Bertolotti, F., Bergamaschi, G., Pozzi, S., et al. (2009). Endothelial colony-forming cells from patients with chronic myeloproliferative disorders lack the disease-specific molecular clonality marker. Blood, 114(14), 3127-3130.
Pierelli, L., Bonanno, G., Rutella, S., Marone, M., Scambia, G., & Leone, G. (2001). CD105 (endoglin) expression on hematopoietic stem/progenitor cells. Leuk Lymphoma, 42(6), 1195-1206.
Pikman, Y., Lee, B. H., Mercher, T., McDowell, E., Ebert, B. L., Gozo, M., et al. (2006). MPLW515L is a novel somatic activating mutation in myelofibrosis with myeloid metaplasia. PLoS Med, 3(7), e270.
Pittenger, M. F. (2008). Mesenchymal stem cells from adult bone marrow. Methods Mol Biol,
449, 27-44. Platanias, L. C. (2003). Map kinase signaling pathways and hematologic malignancies. Blood,
101(12), 4667-4679.
211
Ploemacher, R. E., van der Sluijs, J. P., van Beurden, C. A., Baert, M. R., & Chan, P. L. (1991). Use of limiting-dilution type long-term marrow cultures in frequency analysis of marrow-repopulating and spleen colony-forming hematopoietic stem cells in the mouse. Blood, 78(10), 2527-2533.
Prat, M., Demarquay, C., Frick, J., Dudoignon, N., Thierry, D., & Bertho, J. M. (2006). Use of flt3 ligand to evaluate residual hematopoiesis after heterogeneous irradiation in mice. Radiat Res, 166(3), 504-511.
Pruijt, J. F., Willemze, R., & Fibbe, W. E. (1999). Mechanisms underlying hematopoietic stem cell mobilization induced by the CXC chemokine interleukin-8. Curr Opin
Hematol, 6(3), 152-158. Quintas-Cardama, A., Tong, W., Kantarjian, H., Thomas, D., Ravandi, F., Kornblau, S., et al.
(2008). A phase II study of 5-azacitidine for patients with primary and post-essential thrombocythemia/polycythemia vera myelofibrosis. Leukemia, 22(5), 965-970.
Raaijmakers, M. H., & Scadden, D. T. (2008). Evolving concepts on the microenvironmental niche for hematopoietic stem cells. Curr Opin Hematol, 15(4), 301-306.
Rahman, I. (2002). Oxidative stress, transcription factors and chromatin remodelling in lung inflammation. Biochem Pharmacol, 64(5-6), 935-942.
Raman, M., Chen, W., & Cobb, M. H. (2007). Differential regulation and properties of MAPKs. Oncogene, 26(22), 3100-3112.
Rameshwar, P., Chang, V. T., & Gascon, P. (1996). Implication of CD44 in adhesion-mediated overproduction of TGF-beta and IL-1 in monocytes from patients with bone marrow fibrosis. Br J Haematol, 93(1), 22-29.
Rameshwar, P., Denny, T. N., Stein, D., & Gascon, P. (1994). Monocyte adhesion in patients with bone marrow fibrosis is required for the production of fibrogenic cytokines. Potential role for interleukin-1 and TGF-beta. J Immunol, 153(6), 2819-2830.
Rappold, I., Ziegler, B. L., Kohler, I., Marchetto, S., Rosnet, O., Birnbaum, D., et al. (1997). Functional and phenotypic characterization of cord blood and bone marrow subsets expressing FLT3 (CD135) receptor tyrosine kinase. Blood, 90(1), 111-125.
Ratajczak, M. Z. (2008). Phenotypic and functional characterization of hematopoietic stem cells. Curr Opin Hematol, 15(4), 293-300.
Ratajczak, M. Z., Ratajczak, J., Machalinski, B., Majka, M., Marlicz, W., Carter, A., et al. (1998). Role of vascular endothelial growth factor (VEGF) and placenta-derived growth factor (PlGF) in regulating human haemopoietic cell growth. Br J Haematol,
103(4), 969-979. Ravid, K., Beeler, D. L., Rabin, M. S., Ruley, H. E., & Rosenberg, R. D. (1991). Selective
targeting of gene products with the megakaryocyte platelet factor 4 promoter. Proc
Natl Acad Sci U S A, 88(4), 1521-1525. Ravid, K., Lu, J., Zimmet, J. M., & Jones, M. R. (2002). Roads to polyploidy: the
megakaryocyte example. J Cell Physiol, 190(1), 7-20. Ray, R. J., Paige, C. J., Furlonger, C., Lyman, S. D., & Rottapel, R. (1996). Flt3 ligand
supports the differentiation of early B cell progenitors in the presence of interleukin-11 and interleukin-7. Eur J Immunol, 26(7), 1504-1510.
Regan, C. P., Li, W., Boucher, D. M., Spatz, S., Su, M. S., & Kuida, K. (2002). Erk5 null mice display multiple extraembryonic vascular and embryonic cardiovascular defects. Proc Natl Acad Sci U S A, 99(14), 9248-9253.
Reilly, J. T. (2003). Receptor tyrosine kinases in normal and malignant haematopoiesis. Blood
Rev, 17(4), 241-248. Reilly, J. T., Snowden, J. A., Spearing, R. L., Fitzgerald, P. M., Jones, N., Watmore, A., et al.
(1997). Cytogenetic abnormalities and their prognostic significance in idiopathic myelofibrosis: a study of 106 cases. Br J Haematol, 98(1), 96-102.
212
Reya, T., Morrison, S. J., Clarke, M. F., & Weissman, I. L. (2001). Stem cells, cancer, and cancer stem cells. Nature, 414(6859), 105-111.
Rhodes, M. M., Kopsombut, P., Bondurant, M. C., Price, J. O., & Koury, M. J. (2005). Bcl-x(L) prevents apoptosis of late-stage erythroblasts but does not mediate the antiapoptotic effect of erythropoietin. Blood, 106(5), 1857-1863.
Ribeil, J. A., Zermati, Y., Vandekerckhove, J., Cathelin, S., Kersual, J., Dussiot, M., et al. (2007). Hsp70 regulates erythropoiesis by preventing caspase-3-mediated cleavage of GATA-1. Nature, 445(7123), 102-105.
Richmond, T. J., & Davey, C. A. (2003). The structure of DNA in the nucleosome core. Nature, 423(6936), 145-150.
Robb, L. (2007). Cytokine receptors and hematopoietic differentiation. Oncogene, 26(47), 6715-6723.
Rojnuckarin, P., Drachman, J. G., & Kaushansky, K. (1999). Thrombopoietin-induced activation of the mitogen-activated protein kinase (MAPK) pathway in normal megakaryocytes: role in endomitosis. Blood, 94(4), 1273-1282.
Rollins, B. J. (1997). Chemokines. Blood, 90(3), 909-928. Romanov, Y. A., Darevskaya, A. N., Merzlikina, N. V., & Buravkova, L. B. (2005).
Mesenchymal stem cells from human bone marrow and adipose tissue: isolation, characterization, and differentiation potentialities. Bull Exp Biol Med, 140(1), 138-143.
Rongvaux, A., Willinger, T., Takizawa, H., Rathinam, C., Auerbach, W., Murphy, A. J., et al. (2011). Human thrombopoietin knockin mice efficiently support human hematopoiesis in vivo. Proc Natl Acad Sci U S A, 108(6), 2378-2383.
Rosenbauer, F., & Tenen, D. G. (2007). Transcription factors in myeloid development: balancing differentiation with transformation. Nat Rev Immunol, 7(2), 105-117.
Rosnet, O., Buhring, H. J., deLapeyriere, O., Beslu, N., Lavagna, C., Marchetto, S., et al. (1996). Expression and signal transduction of the FLT3 tyrosine kinase receptor. Acta
Haematol, 95(3-4), 218-223. Rosnet, O., Mattei, M. G., Marchetto, S., & Birnbaum, D. (1991). Isolation and chromosomal
localization of a novel FMS-like tyrosine kinase gene. Genomics, 9(2), 380-385. Rosnet, O., Schiff, C., Pebusque, M. J., Marchetto, S., Tonnelle, C., Toiron, Y., et al. (1993).
Human FLT3/FLK2 gene: cDNA cloning and expression in hematopoietic cells. Blood, 82(4), 1110-1119.
Rosti, V., Massa, M., Vannucchi, A. M., Bergamaschi, G., Campanelli, R., Pecci, A., et al. (2007). The expression of CXCR4 is down-regulated on the CD34+ cells of patients with myelofibrosis with myeloid metaplasia. Blood Cells Mol Dis, 38(3), 280-286.
Rotman, G., & Shiloh, Y. (1997). Ataxia-telangiectasia: is ATM a sensor of oxidative damage and stress? Bioessays, 19(10), 911-917.
Rouyez, M. C., Boucheron, C., Gisselbrecht, S., Dusanter-Fourt, I., & Porteu, F. (1997). Control of thrombopoietin-induced megakaryocytic differentiation by the mitogen-activated protein kinase pathway. Mol Cell Biol, 17(9), 4991-5000.
Saba-El-Leil, M. K., Vella, F. D., Vernay, B., Voisin, L., Chen, L., Labrecque, N., et al. (2003). An essential function of the mitogen-activated protein kinase Erk2 in mouse trophoblast development. EMBO Rep, 4(10), 964-968.
Sabapathy, K., Jochum, W., Hochedlinger, K., Chang, L., Karin, M., & Wagner, E. F. (1999). Defective neural tube morphogenesis and altered apoptosis in the absence of both JNK1 and JNK2. Mech Dev, 89(1-2), 115-124.
Sabio, G., Arthur, J. S., Kuma, Y., Peggie, M., Carr, J., Murray-Tait, V., et al. (2005). p38gamma regulates the localisation of SAP97 in the cytoskeleton by modulating its interaction with GKAP. Embo J, 24(6), 1134-1145.
213
Sacchetti, B., Funari, A., Michienzi, S., Di Cesare, S., Piersanti, S., Saggio, I., et al. (2007). Self-renewing osteoprogenitors in bone marrow sinusoids can organize a hematopoietic microenvironment. Cell, 131(2), 324-336.
Sachs, L. (1996). The control of hematopoiesis and leukemia: from basic biology to the clinic. Proc Natl Acad Sci U S A, 93(10), 4742-4749.
Salati, S., Zini, R., Bianchi, E., Testa, A., Mavilio, F., Manfredini, R., et al. (2008). Role of CD34 antigen in myeloid differentiation of human hematopoietic progenitor cells. Stem Cells, 26(4), 950-959.
Santos, F. P., Kantarjian, H. M., Jain, N., Manshouri, T., Thomas, D. A., Garcia-Manero, G., et al. (2010). Phase 2 study of CEP-701, an orally available JAK2 inhibitor, in patients with primary or post-polycythemia vera/essential thrombocythemia myelofibrosis. Blood, 115(6), 1131-1136.
Sargin, B., Choudhary, C., Crosetto, N., Schmidt, M. H., Grundler, R., Rensinghoff, M., et al. (2007). Flt3-dependent transformation by inactivating c-Cbl mutations in AML. Blood, 110(3), 1004-1012.
Sauvageau, G., Thorsteinsdottir, U., Eaves, C. J., Lawrence, H. J., Largman, C., Lansdorp, P. M., et al. (1995). Overexpression of HOXB4 in hematopoietic cells causes the selective expansion of more primitive populations in vitro and in vivo. Genes Dev,
9(14), 1753-1765. Savona, M., & Talpaz, M. (2008). Getting to the stem of chronic myeloid leukaemia. Nat Rev
Cancer, 8(5), 341-350. Schaeffer, H. J., & Weber, M. J. (1999). Mitogen-activated protein kinases: specific messages
from ubiquitous messengers. Mol Cell Biol, 19(4), 2435-2444. Schelling, M. E. (1991). FGF mediation of coronary angiogenesis. Ann N Y Acad Sci, 638,
467-469. Schreiber, M., Kolbus, A., Piu, F., Szabowski, A., Mohle-Steinlein, U., Tian, J., et al. (1999).
Control of cell cycle progression by c-Jun is p53 dependent. Genes Dev, 13(5), 607-619.
Schulze, H., Korpal, M., Hurov, J., Kim, S. W., Zhang, J., Cantley, L. C., et al. (2006). Characterization of the megakaryocyte demarcation membrane system and its role in thrombopoiesis. Blood, 107(10), 3868-3875.
Seita, J., Ema, H., Ooehara, J., Yamazaki, S., Tadokoro, Y., Yamasaki, A., et al. (2007). Lnk negatively regulates self-renewal of hematopoietic stem cells by modifying thrombopoietin-mediated signal transduction. Proc Natl Acad Sci U S A, 104(7), 2349-2354.
Shahjahan, M., Dunphy, C. H., Ewton, A., Zu, Y., Monzon, F. A., Rice, L., et al. (2008). p38 mitogen-activated protein kinase has different degrees of activation in myeloproliferative disorders and myelodysplastic syndromes. Am J Clin Pathol,
130(4), 635-641. Shen, L., Kondo, Y., Guo, Y., Zhang, J., Zhang, L., Ahmed, S., et al. (2007). Genome-wide
profiling of DNA methylation reveals a class of normally methylated CpG island promoters. PLoS Genet, 3(10), 2023-2036.
Shi, J., Zhao, Y., Ishii, T., Hu, W., Sozer, S., Zhang, W., et al. (2007). Effects of chromatin-modifying agents on CD34+ cells from patients with idiopathic myelofibrosis. Cancer
Res, 67(13), 6417-6424. Sidorenko, S. P., & Clark, E. A. (2003). The dual-function CD150 receptor subfamily: the
viral attraction. Nat Immunol, 4(1), 19-24. Sigurjonsson, O. E., Gudmundsson, K. O., Haraldsdottir, V., Rafnar, T., & Gudmundsson, S.
(2002). Flt3/Flk-2-ligand in synergy with thrombopoietin delays megakaryocyte
214
development and increases the numbers of megakaryocyte progenitor cells in serum-free cultures initiated with CD34+ cells. J Hematother Stem Cell Res, 11(2), 389-400.
Siminovitch, L., McCulloch, E. A., & Till, J. E. (1963). The Distribution of Colony-Forming Cells among Spleen Colonies. J Cell Physiol, 62, 327-336.
Sintes, J., Romero, X., Marin, P., Terhorst, C., & Engel, P. (2008). Differential expression of CD150 (SLAM) family receptors by human hematopoietic stem and progenitor cells. Exp Hematol, 36(9), 1199-1204.
Small, D. (2006). FLT3 mutations: biology and treatment. Hematology Am Soc Hematol Educ
Program, 178-184. Sohn, S. J., Sarvis, B. K., Cado, D., & Winoto, A. (2002). ERK5 MAPK regulates embryonic
angiogenesis and acts as a hypoxia-sensitive repressor of vascular endothelial growth factor expression. J Biol Chem, 277(45), 43344-43351.
Solanilla, A., Dechanet, J., El Andaloussi, A., Dupouy, M., Godard, F., Chabrol, J., et al. (2000). CD40-ligand stimulates myelopoiesis by regulating flt3-ligand and thrombopoietin production in bone marrow stromal cells. Blood, 95(12), 3758-3764.
Solanilla, A., Grosset, C., Duchez, P., Legembre, P., Pitard, V., Dupouy, M., et al. (2003). Flt3-ligand induces adhesion of haematopoietic progenitor cells via a very late antigen (VLA)-4- and VLA-5-dependent mechanism. Br J Haematol, 120(5), 782-786.
Solanilla, A., Grosset, C., Lemercier, C., Dupouy, M., Mahon, F. X., Schweitzer, K., et al. (2000). Expression of Flt3-ligand by the endothelial cell. Leukemia, 14(1), 153-162.
Solar, G. P., Kerr, W. G., Zeigler, F. C., Hess, D., Donahue, C., de Sauvage, F. J., et al. (1998). Role of c-mpl in early hematopoiesis. Blood, 92(1), 4-10.
Srinivasa, S. P., & Doshi, P. D. (2002). Extracellular signal-regulated kinase and p38 mitogen-activated protein kinase pathways cooperate in mediating cytokine-induced proliferation of a leukemic cell line. Leukemia, 16(2), 244-253.
Srour, E. F., Zanjani, E. D., Cornetta, K., Traycoff, C. M., Flake, A. W., Hedrick, M., et al. (1993). Persistence of human multilineage, self-renewing lymphohematopoietic stem cells in chimeric sheep. Blood, 82(11), 3333-3342.
Stahl, N., & Yancopoulos, G. D. (1993). The alphas, betas, and kinases of cytokine receptor complexes. Cell, 74(4), 587-590.
Steunou, V., Le Bousse-Kerdiles, M. C., Colin-Micouin, A., Clay, D., Chevillard, S., & Martyre, M. C. (2003). Altered transcription of the stem cell leukemia gene in myelofibrosis with myeloid metaplasia. Leukemia, 17(10), 1998-2006.
Stier, S., Cheng, T., Dombkowski, D., Carlesso, N., & Scadden, D. T. (2002). Notch1 activation increases hematopoietic stem cell self-renewal in vivo and favors lymphoid over myeloid lineage outcome. Blood, 99(7), 2369-2378.
Stier, S., Ko, Y., Forkert, R., Lutz, C., Neuhaus, T., Grunewald, E., et al. (2005). Osteopontin is a hematopoietic stem cell niche component that negatively regulates stem cell pool size. J Exp Med, 201(11), 1781-1791.
Sugiyama, T., Kohara, H., Noda, M., & Nagasawa, T. (2006). Maintenance of the hematopoietic stem cell pool by CXCL12-CXCR4 chemokine signaling in bone marrow stromal cell niches. Immunity, 25(6), 977-988.
Sunters, A., McCluskey, J., & Grigoriadis, A. E. (1998). Control of cell cycle gene expression in bone development and during c-Fos-induced osteosarcoma formation. Dev Genet,
22(4), 386-397. Sutherland, H. J., Eaves, C. J., Eaves, A. C., Dragowska, W., & Lansdorp, P. M. (1989).
Characterization and partial purification of human marrow cells capable of initiating long-term hematopoiesis in vitro. Blood, 74(5), 1563-1570.
Taksin, A. L., Couedic, J. P., Dusanter-Fourt, I., Masse, A., Giraudier, S., Katz, A., et al. (1999). Autonomous megakaryocyte growth in essential thrombocythemia and
215

idiopathic myelofibrosis is not related to a c-mpl mutation or to an autocrine stimulation by Mpl-L. Blood, 93(1), 125-139.
Tamura, K., Sudo, T., Senftleben, U., Dadak, A. M., Johnson, R., & Karin, M. (2000). Requirement for p38alpha in erythropoietin expression: a role for stress kinases in erythropoiesis. Cell, 102(2), 221-231.
Tanaka, S., Nakamura, K., Takahasi, N., & Suda, T. (2005). Role of RANKL in physiological and pathological bone resorption and therapeutics targeting the RANKL-RANK signaling system. Immunol Rev, 208, 30-49.
Tanoue, T., Moriguchi, T., & Nishida, E. (1999). Molecular cloning and characterization of a novel dual specificity phosphatase, MKP-5. J Biol Chem, 274(28), 19949-19956.
Tanoue, T., Yamamoto, T., Maeda, R., & Nishida, E. (2001). A Novel MAPK phosphatase MKP-7 acts preferentially on JNK/SAPK and p38 alpha and beta MAPKs. J Biol
Chem, 276(28), 26629-26639. Taylor, S. M., & Jones, P. A. (1979). Multiple new phenotypes induced in 10T1/2 and 3T3
cells treated with 5-azacytidine. Cell, 17(4), 771-779. Tefferi, A. (2008a). The history of myeloproliferative disorders: before and after Dameshek.
Leukemia, 22(1), 3-13. Tefferi, A. (2008b). JAK and MPL mutations in myeloid malignancies. Leuk Lymphoma,
49(3), 388-397. Tefferi, A. (2010). Novel mutations and their functional and clinical relevance in
myeloproliferative neoplasms: JAK2, MPL, TET2, ASXL1, CBL, IDH and IKZF1. Leukemia, 24(6), 1128-1138.
Tefferi, A., Mesa, R. A., Nagorney, D. M., Schroeder, G., & Silverstein, M. N. (2000). Splenectomy in myelofibrosis with myeloid metaplasia: a single-institution experience with 223 patients. Blood, 95(7), 2226-2233.
Tefferi, A., Mesa, R. A., Schroeder, G., Hanson, C. A., Li, C. Y., & Dewald, G. W. (2001). Cytogenetic findings and their clinical relevance in myelofibrosis with myeloid metaplasia. Br J Haematol, 113(3), 763-771.
Tefferi, A., Thiele, J., Orazi, A., Kvasnicka, H. M., Barbui, T., Hanson, C. A., et al. (2007). Proposals and rationale for revision of the World Health Organization diagnostic criteria for polycythemia vera, essential thrombocythemia, and primary myelofibrosis: recommendations from an ad hoc international expert panel. Blood, 110(4), 1092-1097.
Tefferi, A., Vaidya, R., Caramazza, D., Finke, C., Lasho, T., & Pardanani, A. (2011). Circulating Interleukin (IL)-8, IL-2R, IL-12, and IL-15 Levels Are Independently Prognostic in Primary Myelofibrosis: A Comprehensive Cytokine Profiling Study. JClin Oncol, 29(10), 1356-1363.
Tefferi, A., & Vainchenker, W. (2011). Myeloproliferative neoplasms: molecular pathophysiology, essential clinical understanding, and treatment strategies. J Clin
Oncol, 29(5), 573-582. Teofili, L., Martini, M., Iachininoto, M. G., Capodimonti, S., Nuzzolo, E. R., Torti, L., et al.
(2011). Endothelial progenitor cells are clonal and exhibit the JAK2V617F mutation in a subset of thrombotic patients with Ph-negative myeloproliferative neoplasms. Blood, 117(9), 2700-2707.
Thiele, J., & Kvasnicka, H. M. (2003). Chronic myeloproliferative disorders with thrombocythemia: a comparative study of two classification systems (PVSG, WHO) on 839 patients. Ann Hematol, 82(3), 148-152.
Thiele, J., & Kvasnicka, H. M. (2005). Hematopathologic findings in chronic idiopathic myelofibrosis. Semin Oncol, 32(4), 380-394.
216

Thiele, J., & Kvasnicka, H. M. (2006). Grade of bone marrow fibrosis is associated with relevant hematological findings-a clinicopathological study on 865 patients with chronic idiopathic myelofibrosis. Ann Hematol, 85(4), 226-232.
Thiele, J., Kvasnicka, H. M., & Czieslick, C. (2002). CD34+ progenitor cells in idiopathic (primary) myelofibrosis: a comparative quantification between spleen and bone marrow tissue. Ann Hematol, 81(2), 86-89.
Thiele, J., Kvasnicka, H. M., Zankovich, R., & Diehl, V. (2001). Clinical and morphological criteria for the diagnosis of prefibrotic idiopathic (primary) myelofibrosis. Ann
Hematol, 80(3), 160-165. Thoren, L. A., Liuba, K., Bryder, D., Nygren, J. M., Jensen, C. T., Qian, H., et al. (2008). Kit
regulates maintenance of quiescent hematopoietic stem cells. J Immunol, 180(4), 2045-2053.
Till, J. E., & Mc Culloch, E. (1961). A direct measurement of the radiation sensitivity of normal mouse bone marrow cells. Radiat Res, 14, 213-222.
Tipping, A. J., Pina, C., Castor, A., Hong, D., Rodrigues, N. P., Lazzari, L., et al. (2009). High GATA-2 expression inhibits human hematopoietic stem and progenitor cell function by effects on cell cycle. Blood, 113(12), 2661-2672.
To, L. B., Haylock, D. N., Simmons, P. J., & Juttner, C. A. (1997). The biology and clinical uses of blood stem cells. Blood, 89(7), 2233-2258.
Tomita, K., Barnes, P. J., & Adcock, I. M. (2003). The effect of oxidative stress on histone acetylation and IL-8 release. Biochem Biophys Res Commun, 301(2), 572-577.
Tripodo, C., Di Bernardo, A., Ternullo, M. P., Guarnotta, C., Porcasi, R., Ingrao, S., et al. (2009). CD146(+) bone marrow osteoprogenitors increase in the advanced stages of primary myelofibrosis. Haematologica, 94(1), 127-130.
Trumpp, A., Essers, M., & Wilson, A. (2010). Awakening dormant haematopoietic stem cells. Nat Rev Immunol, 10(3), 201-209.
Tsang, A. P., Visvader, J. E., Turner, C. A., Fujiwara, Y., Yu, C., Weiss, M. J., et al. (1997). FOG, a multitype zinc finger protein, acts as a cofactor for transcription factor GATA-1 in erythroid and megakaryocytic differentiation. Cell, 90(1), 109-119.
Turner, A. M., Lin, N. L., Issarachai, S., Lyman, S. D., & Broudy, V. C. (1996). FLT3 receptor expression on the surface of normal and malignant human hematopoietic cells. Blood, 88(9), 3383-3390.
Turner, B. M. (2007). Defining an epigenetic code. Nat Cell Biol, 9(1), 2-6. Uddin, S., Lekmine, F., Sharma, N., Majchrzak, B., Mayer, I., Young, P. R., et al. (2000). The
Rac1/p38 mitogen-activated protein kinase pathway is required for interferon alpha-dependent transcriptional activation but not serine phosphorylation of Stat proteins. JBiol Chem, 275(36), 27634-27640.
Uddin, S., Majchrzak, B., Woodson, J., Arunkumar, P., Alsayed, Y., Pine, R., et al. (1999). Activation of the p38 mitogen-activated protein kinase by type I interferons. J Biol
Chem, 274(42), 30127-30131. van Dam, H., & Castellazzi, M. (2001). Distinct roles of Jun : Fos and Jun : ATF dimers in
oncogenesis. Oncogene, 20(19), 2453-2464. Vannucchi, A. M. (2009). How do JAK2-inhibitors work in myelofibrosis: an alternative
hypothesis. Leuk Res, 33(12), 1581-1583. Vannucchi, A. M., Bianchi, L., Cellai, C., Paoletti, F., Rana, R. A., Lorenzini, R., et al.
(2002). Development of myelofibrosis in mice genetically impaired for GATA-1 expression (GATA-1(low) mice). Blood, 100(4), 1123-1132.
Vaquez, H. (1892). On a special form of cyanosis accompagnied by excessive and persistent erythrocythosis. Comp Rend Soc Biol, 12.
217
Vardiman, J. W., Thiele, J., Arber, D. A., Brunning, R. D., Borowitz, M. J., Porwit, A., et al. (2009). The 2008 revision of the World Health Organization (WHO) classification of myeloid neoplasms and acute leukemia: rationale and important changes. Blood,
114(5), 937-951. Varnum-Finney, B., Xu, L., Brashem-Stein, C., Nourigat, C., Flowers, D., Bakkour, S., et al.
(2000). Pluripotent, cytokine-dependent, hematopoietic stem cells are immortalized by constitutive Notch1 signaling. Nat Med, 6(11), 1278-1281.
Veikkola, T., Karkkainen, M., Claesson-Welsh, L., & Alitalo, K. (2000). Regulation of angiogenesis via vascular endothelial growth factor receptors. Cancer Res, 60(2), 203-212.
Vener, C., Fracchiolla, N. S., Gianelli, U., Calori, R., Radaelli, F., Iurlo, A., et al. (2008). Prognostic implications of the European consensus for grading of bone marrow fibrosis in chronic idiopathic myelofibrosis. Blood, 111(4), 1862-1865.
Verfaillie, C., Blakolmer, K., & McGlave, P. (1990). Purified primitive human hematopoietic progenitor cells with long-term in vitro repopulating capacity adhere selectively to irradiated bone marrow stroma. J Exp Med, 172(2), 509-502.
Verfaillie, C. M. (1992). Direct contact between human primitive hematopoietic progenitors and bone marrow stroma is not required for long-term in vitro hematopoiesis. Blood,
79(11), 2821-2826. Verma, A., Deb, D. K., Sassano, A., Kambhampati, S., Wickrema, A., Uddin, S., et al. (2002).
Cutting edge: activation of the p38 mitogen-activated protein kinase signaling pathway mediates cytokine-induced hemopoietic suppression in aplastic anemia. JImmunol, 168(12), 5984-5988.
Verstovsek, S., Estey, E., Manshouri, T., Keating, M., Kantarjian, H., Giles, F. J., et al. (2001). High expression of the receptor tyrosine kinase Tie-1 in acute myeloid leukemia and myelodysplastic syndrome. Leuk Lymphoma, 42(3), 511-516.
Villagra, A., Sotomayor, E. M., & Seto, E. (2010). Histone deacetylases and the immunological network: implications in cancer and inflammation. Oncogene, 29(2), 157-173.
Villeval, J. L., Cohen-Solal, K., Tulliez, M., Giraudier, S., Guichard, J., Burstein, S. A., et al. (1997). High thrombopoietin production by hematopoietic cells induces a fatal myeloproliferative syndrome in mice. Blood, 90(11), 4369-4383.
Visnjic, D., Kalajzic, Z., Rowe, D. W., Katavic, V., Lorenzo, J., & Aguila, H. L. (2004). Hematopoiesis is severely altered in mice with an induced osteoblast deficiency. Blood, 103(9), 3258-3264.
Vitrat, N., Cohen-Solal, K., Norol, F., Guichard, J., Cramer, E., Vainchenker, W., et al. (1998). Compared effects of Mpl ligand and other cytokines on human MK differentiation. Stem Cells, 16 Suppl 2, 37-51.
Vitrat, N., Cohen-Solal, K., Pique, C., Le Couedic, J. P., Norol, F., Larsen, A. K., et al. (1998). Endomitosis of human megakaryocytes are due to abortive mitosis. Blood,
91(10), 3711-3723. Vogt, P. K. (2001). Jun, the oncoprotein. Oncogene, 20(19), 2365-2377. Voisin, L., Saba-El-Leil, M. K., Julien, C., Fremin, C., & Meloche, S. (2010). Genetic
demonstration of a redundant role of extracellular signal-regulated kinase 1 (ERK1) and ERK2 mitogen-activated protein kinases in promoting fibroblast proliferation. Mol Cell Biol, 30(12), 2918-2932.
Wagner-Ballon, O., Chagraoui, H., Prina, E., Tulliez, M., Milon, G., Raslova, H., et al. (2006). Monocyte/macrophage dysfunctions do not impair the promotion of myelofibrosis by high levels of thrombopoietin. J Immunol, 176(11), 6425-6433.
218

Wang, J., Fernald, A. A., Anastasi, J., Le Beau, M. M., & Qian, Z. (2010). Haploinsufficiency of Apc leads to ineffective hematopoiesis. Blood, 115(17), 3481-3488.
Wang, J. C., Chen, C., Dumlao, T., Naik, S., Chang, T., Xiao, Y. Y., et al. (2008). Enhanced histone deacetylase enzyme activity in primary myelofibrosis. Leuk Lymphoma,
49(12), 2321-2327. Wang, J. C., Chen, W., Nallusamy, S., Chen, C., & Novetsky, A. D. (2002).
Hypermethylation of the P15INK4b and P16INK4a in agnogenic myeloid metaplasia (AMM) and AMM in leukaemic transformation. Br J Haematol, 116(3), 582-586.
Wang, J. C., Hemavathy, K., Charles, W., Zhang, H., Dua, P. K., Novetsky, A. D., et al. (2004). Osteosclerosis in idiopathic myelofibrosis is related to the overproduction of osteoprotegerin (OPG). Exp Hematol, 32(10), 905-910.
Wang, J. C., Lang, H. D., Lichter, S., Weinstein, M., & Benn, P. (1992). Cytogenetic studies of bone marrow fibroblasts cultured from patients with myelofibrosis and myeloid metaplasia. Br J Haematol, 80(2), 184-188.
Wang, N., Satoskar, A., Faubion, W., Howie, D., Okamoto, S., Feske, S., et al. (2004). The cell surface receptor SLAM controls T cell and macrophage functions. J Exp Med,
199(9), 1255-1264. Wang, X., Zhang, W., Ishii, T., Sozer, S., Wang, J., Xu, M., et al. (2009). Correction of the
abnormal trafficking of primary myelofibrosis CD34+ cells by treatment with chromatin-modifying agents. Cancer Res, 69(19), 7612-7618.
Watamoto, K., Towatari, M., Ozawa, Y., Miyata, Y., Okamoto, M., Abe, A., et al. (2003). Altered interaction of HDAC5 with GATA-1 during MEL cell differentiation. Oncogene, 22(57), 9176-9184.
Watowich, S. S., Wu, H., Socolovsky, M., Klingmuller, U., Constantinescu, S. N., & Lodish, H. F. (1996). Cytokine receptor signal transduction and the control of hematopoietic cell development. Annu Rev Cell Dev Biol, 12, 91-128.
Weisel, K. C., Yildirim, S., Schweikle, E., Kanz, L., & Mohle, R. (2009). Regulation of FLT3 and its ligand in normal hematopoietic progenitor cells. Ann Hematol, 88(3), 203-211.
Wickenhauser, C., Hillienhof, A., Jungheim, K., Lorenzen, J., Ruskowski, H., Hansmann, M. L., et al. (1995). Detection and quantification of transforming growth factor beta (TGF-beta) and platelet-derived growth factor (PDGF) release by normal human megakaryocytes. Leukemia, 9(2), 310-315.
Wickrema, A., & Crispino, J. D. (2007). Erythroid and megakaryocytic transformation. Oncogene, 26(47), 6803-6815.
Wilson, A., Murphy, M. J., Oskarsson, T., Kaloulis, K., Bettess, M. D., Oser, G. M., et al. (2004). c-Myc controls the balance between hematopoietic stem cell self-renewal and differentiation. Genes Dev, 18(22), 2747-2763.
Wilson, A., & Trumpp, A. (2006). Bone-marrow haematopoietic-stem-cell niches. Nat Rev
Immunol, 6(2), 93-106. Winkler, I. G., & Levesque, J. P. (2006). Mechanisms of hematopoietic stem cell
mobilization: when innate immunity assails the cells that make blood and bone. Exp
Hematol, 34(8), 996-1009. Winkler, I. G., Sims, N. A., Pettit, A. R., Barbier, V., Nowlan, B., Helwani, F., et al. (2010).
Bone marrow macrophages maintain hematopoietic stem cell (HSC) niches and their depletion mobilizes HSCs. Blood, 116(23), 4815-4828.
Wisdom, R. (1999). AP-1: one switch for many signals. Exp Cell Res, 253(1), 180-185. Witowsky, J. A., & Johnson, G. L. (2003). Ubiquitylation of MEKK1 inhibits its
phosphorylation of MKK1 and MKK4 and activation of the ERK1/2 and JNK pathways. J Biol Chem, 278(3), 1403-1406.
219

Wodnar-Filipowicz, A., Lyman, S. D., Gratwohl, A., Tichelli, A., Speck, B., & Nissen, C. (1996). Flt3 ligand level reflects hematopoietic progenitor cell function in aplastic anemia and chemotherapy-induced bone marrow aplasia. Blood, 88(12), 4493-4499.
Wolf, N. S., Kone, A., Priestley, G. V., & Bartelmez, S. H. (1993). In vivo and in vitro characterization of long-term repopulating primitive hematopoietic cells isolated by sequential Hoechst 33342-rhodamine 123 FACS selection. Exp Hematol, 21(5), 614-622.
Xu, M., Bruno, E., Chao, J., Huang, S., Finazzi, G., Fruchtman, S. M., et al. (2005). Constitutive mobilization of CD34+ cells into the peripheral blood in idiopathic myelofibrosis may be due to the action of a number of proteases. Blood, 105(11), 4508-4515.
Yang, D. D., Conze, D., Whitmarsh, A. J., Barrett, T., Davis, R. J., Rincon, M., et al. (1998). Differentiation of CD4+ T cells to Th1 cells requires MAP kinase JNK2. Immunity,
9(4), 575-585. Yang, D. D., Kuan, C. Y., Whitmarsh, A. J., Rincon, M., Zheng, T. S., Davis, R. J., et al.
(1997). Absence of excitotoxicity-induced apoptosis in the hippocampus of mice lacking the Jnk3 gene. Nature, 389(6653), 865-870.
Yang, M., Khachigian, L. M., Hicks, C., Chesterman, C. N., & Chong, B. H. (1997). Identification of PDGF receptors on human megakaryocytes and megakaryocytic cell lines. Thromb Haemost, 78(2), 892-896.
Yao, Y., Li, W., Wu, J., Germann, U. A., Su, M. S., Kuida, K., et al. (2003). Extracellular signal-regulated kinase 2 is necessary for mesoderm differentiation. Proc Natl Acad
Sci U S A, 100(22), 12759-12764. Yarden, Y., Escobedo, J. A., Kuang, W. J., Yang-Feng, T. L., Daniel, T. O., Tremble, P. M.,
et al. (1986). Structure of the receptor for platelet-derived growth factor helps define a family of closely related growth factor receptors. Nature, 323(6085), 226-232.
Yarden, Y., Kuang, W. J., Yang-Feng, T., Coussens, L., Munemitsu, S., Dull, T. J., et al. (1987). Human proto-oncogene c-kit: a new cell surface receptor tyrosine kinase for an unidentified ligand. Embo J, 6(11), 3341-3351.
Yin, T., & Li, L. (2006). The stem cell niches in bone. J Clin Invest, 116(5), 1195-1201. Yokota, S., Kiyoi, H., Nakao, M., Iwai, T., Misawa, S., Okuda, T., et al. (1997). Internal
tandem duplication of the FLT3 gene is preferentially seen in acute myeloid leukemia and myelodysplastic syndrome among various hematological malignancies. A study on a large series of patients and cell lines. Leukemia, 11(10), 1605-1609.
Yong, H. Y., Koh, M. S., & Moon, A. (2009). The p38 MAPK inhibitors for the treatment of inflammatory diseases and cancer. Expert Opin Investig Drugs, 18(12), 1893-1905.
Yoon, S., & Seger, R. (2006). The extracellular signal-regulated kinase: multiple substrates regulate diverse cellular functions. Growth Factors, 24(1), 21-44.
Yoshida, M., Tsuji, K., Ebihara, Y., Muraoka, K., Tanaka, R., Miyazaki, H., et al. (1997). Thrombopoietin alone stimulates the early proliferation and survival of human erythroid, myeloid and multipotential progenitors in serum-free culture. Br J
Haematol, 98(2), 254-264. Yoshihara, H., Arai, F., Hosokawa, K., Hagiwara, T., Takubo, K., Nakamura, Y., et al.
(2007). Thrombopoietin/MPL signaling regulates hematopoietic stem cell quiescence and interaction with the osteoblastic niche. Cell Stem Cell, 1(6), 685-697.
Yoshimoto, G., Miyamoto, T., Jabbarzadeh-Tabrizi, S., Iino, T., Rocnik, J. L., Kikushige, Y., et al. (2009). FLT3-ITD up-regulates MCL-1 to promote survival of stem cells in acute myeloid leukemia via FLT3-ITD-specific STAT5 activation. Blood, 114(24), 5034-5043.
220

Youssefian, T., & Cramer, E. M. (2000). Megakaryocyte dense granule components are sorted in multivesicular bodies. Blood, 95(12), 4004-4007.
Zauli, G., Visani, G., Catani, L., Vianelli, N., Gugliotta, L., & Capitani, S. (1993). Reduced responsiveness of bone marrow megakaryocyte progenitors to platelet-derived transforming growth factor beta 1, produced in normal amount, in patients with essential thrombocythaemia. Br J Haematol, 83(1), 14-20.
Zhang, J., Niu, C., Ye, L., Huang, H., He, X., Tong, W. G., et al. (2003). Identification of the haematopoietic stem cell niche and control of the niche size. Nature, 425(6960), 836-841.
Zhang, Y., Sun, S., Wang, Z., Thompson, A., Kaluzhny, Y., Zimmet, J., et al. (2002). Signaling by the Mpl receptor involves IKK and NF-kappaB. J Cell Biochem, 85(3), 523-535.
Zheng, R., Levis, M., Piloto, O., Brown, P., Baldwin, B. R., Gorin, N. C., et al. (2004). FLT3 ligand causes autocrine signaling in acute myeloid leukemia cells. Blood, 103(1), 267-274.
Zhou, S., Greenberger, J. S., Epperly, M. W., Goff, J. P., Adler, C., Leboff, M. S., et al. (2008). Age-related intrinsic changes in human bone-marrow-derived mesenchymal stem cells and their differentiation to osteoblasts. Aging Cell, 7(3), 335-343.
Zhou, S., Schuetz, J. D., Bunting, K. D., Colapietro, A. M., Sampath, J., Morris, J. J., et al. (2001). The ABC transporter Bcrp1/ABCG2 is expressed in a wide variety of stem cells and is a molecular determinant of the side-population phenotype. Nat Med, 7(9), 1028-1034.
Zuluaga, S., Alvarez-Barrientos, A., Gutierrez-Uzquiza, A., Benito, M., Nebreda, A. R., & Porras, A. (2007). Negative regulation of Akt activity by p38alpha MAP kinase in cardiomyocytes involves membrane localization of PP2A through interaction with caveolin-1. Cell Signal, 19(1), 62-74.
Zumkeller, W. (2002). The insulin-like growth factor system in hematopoietic cells. Leuk
Lymphoma, 43(3), 487-491.
221

222

ANNEXES
223

224
1/ Implication de l’interleukine 8 et de ses récepteurs dans la dysmégacaryopoïèse des patients atteints de myélofibrose primitive
« IL-8 and its CXCR1 and CXCR2 receptors participate in the control of
megakaryocytic proliferation, differentiation, and ploidy in myeloid metaplasia with
myelofibrosis ».
Emadi S, Clay D, Desterke C, Guerton B, Maquarre E, Charpentier A, Jasmin C, Le
Bousse-Kerdilès MC.
Blood. 2005 Jan 15;105(2):464-73.
L’Il-8 est une cytokine inflammatoire principalement secrétée par les mégacaryocytes et
les cellules endothéliales et participe au processus de mobilisation cellulaire. Le taux
d’interleukine 8 circulant est fortement augmenté chez les patients atteints de myélofibrose
primitive. De plus, les mégacaryocytes des patients sur-expriment les récepteurs CXCR1 et
CXCR2 de l’Il-8. Au cours de ce travail, nous avons montré que le couple Il-8/récepteurs
participent à la dysmégacaryopoïèse des patients atteints de Myélofibrose Primitive. Son rôle
dans notre travail a été détaillé dans la discussion de ma thèse.
225


CHEMOKINES
IL-8 and its CXCR1 and CXCR2 receptors participate in the control ofmegakaryocytic proliferation, differentiation, and ploidy in myeloid metaplasiawith myelofibrosis
Sharareh Emadi, Denis Clay, Christophe Desterke, Bernadette Guerton, Eliane Maquarre, Agnes Charpentier, Claude Jasmin,
Marie-Caroline Le Bousse-Kerdiles, for the French INSERM Research Network on MMM
Myeloproliferation, myelofibrosis, and neo-
angiogenesis are the 3 major intrinsic patho-
physiologic features of myeloid metaplasia
with myelofibrosis (MMM). The myeloprolif-
eration is characterized by an increased
number of circulating CD341 progenitors
with the prominent amplification of dystro-
phic megakaryocytic (MK) cells and myeloid
metaplasia in the spleen and liver. The vari-
ous biologic activities of interleukin 8 (IL-8)
inhematopoieticprogenitorproliferationand
mobilization as well as in neoangiogenesis
prompted us to analyze its potential role in
MMM. We showed that the level of IL-8
chemokine is significantly increased in the
serum of patients and that various hemato-
poietic cells, including platelets, participate
in its production. In vitro inhibition of auto-
crine IL-8 expressed by CD341 cells with
either a neutralizing or an antisense anti–
IL-8 treatment increases the proliferation of
MMM CD341-derived cells and stimulates
their MK differentiation. Moreover, addition
of neutralizing anti–IL-8 receptor (CXC che-
mokine receptor 1 [CXCR1] or 2 [CXCR2])
antibodies to MMM CD341 cells cultured
under MK liquid culture conditions increases
the proliferation and differentiation of MMM
CD411 MK cells and restores their
polyploidization. Our results suggest that
IL-8 and its receptors participate in the al-
tered MK growth that features MMM and
open new therapeutic prospects for this still
incurable disease. (Blood. 2005;105:464-473)
© 2005 by The American Society of Hematology
Introduction
Myeloid metaplasia with myelofibrosis (MMM), a chronic myelo-
proliferative disorder also called idiopathic myelofibrosis or agno-
genic myeloid metaplasia, is a clonal process with a hematopoietic
stem cell/progenitor origin. Myeloproliferation with inefficient
hematopoiesis and bone marrow fibrosis are the main biologic
hallmarks of this rare disease.1,2 Neoangiogenesis is also frequently
observed. Cytogenetic and enzymatic studies have demonstrated
the clonal nature of the hematopoietic progenitor (HP) expansion
and the polyclonality of the neighboring proliferating fibroblasts.3-5
Bone marrow fibrosis is considered a reactive process resulting
from the stimulation of nonclonal fibroblasts by growth factors
derived from necrotic and dysplastic megakaryocytes.6-8
The myeloproliferative process is characterized by an increased
number of HPs9 with a prominent proliferation of the megakaryo-
cytic (MK) cells that exhibited a dysplastic appearance created by
their plump lobulation of nuclei and the disturbance of nuclear/
cytoplasmic maturation.10 This process is associated with a tremen-
dous CD341 HP mobilization from the bone marrow (BM) to
spleen and liver through to the peripheral blood (PB).11,12 While the
underlying molecular genetic alterations remain unknown, recent
data led us to propose a model integrating alterations in the
expression and function of MK nuclear regulatory factors and in
the complex network of humoral and cellular interactions between
hematopoietic cells and stroma in the pathogenetic mechanisms of
the disease.13,14
Interleukin 8 (IL-8) is a member of the family of chemokines
related by a CXC motif. It binds to two 7-transmembrane–domain
CXC chemokine receptor 1 (CXCR1) and 2 (CXCR2) receptors
that belong to the superfamilly of G protein–coupled receptors with
high affinity.15-17 CXCR1 also binds to granulocyte chemotactic
protein 2 (GCP-2), neutrophil-activating peptide 2 (NAP2), and
epithelial neutrophil-activating peptide 78 (ENA-78) with low
affinity,18,19 while CXCR2 responds to additional chemokines such
as those of the growth-related oncogene (GRO) family.20,21 IL-8 is
produced in vitro by many cell types, including fibroblasts,
keratinocytes, endothelial cells, neutrophils, mast cells, monocytes,
macrophages, and megakaryocytes,22-25 and exhibits several bio-
logic activities. IL-8 is a major factor in acute inflammation, acting
as a potent chemoattractant and activator of neutrophils by
activation of CXCR1 and CXCR2.26-28 IL-8 administration in mice
induces a rapid neutrophilia and a concurrent HP mobilization.29-31
Similarly, IL-8 and macrophage inflammatory protein–1a (MIP-1a)
can modulate the homing of HPs by affecting the secretion of
matrix metalloproteinase (MMP) and tissue inhibitor of metallopro-
teinase (TIMP) proteases by BM and PB CD341 cells.32 IL-8 also
modulates myelopoiesis by suppressing the myeloid progenitor
From the Institut National de la Sante et de la Recherche Medicale
(INSERM), Unit 602, Andre Lwoff Institute, Paul Brousse Hospital, Villejuif,
France; Department of Chemical and Material Engineering (CME), Arizona
State University, Tempe AZ; and the Laboratory of Hematology,
Saint-Vincent Hospital, Groupe Hospitalier de l’Institut Catholique de Lille,
Lille Cedex, France.
Submitted December 29, 2003; accepted September 7, 2004. Prepublished
online as Blood First Edition Paper, September 28, 2004; DOI 10.1182/blood-
2003-12-4415.
A complete list of the memers of the French INSERM Research Network on
MMM appears in the “Appendix.”
Supported by grants from the Association Nouvelles Recherches Biomedicales
(ANRB), Association pour la Recherche contre le Cancer (ARC) no. 9806, and from
Groupement d’Interet Scientifique (GIS)–Institut des Maladies Rares no.
03/GIS/PB/SJ/n°35. S.E. was awarded a fellowship from the Fondation de France.
Reprints: M. C. Le Bousse-Kerdiles, INSERM U602, Andre Lwoff Institute,
Paul Brousse Hospital, 14, Avenue Paul Vaillant Couturier, 94800 Villejuif,
France; e-mail: [email protected].
The publication costs of this article were defrayed in part by page charge
payment. Therefore, and solely to indicate this fact, this article is hereby
marked ‘‘advertisement’’ in accordance with 18 U.S.C. section 1734.
© 2005 by The American Society of Hematology
464 BLOOD, 15 JANUARY 2005 z VOLUME 105, NUMBER 2
For personal use only. at INSERM DISC on February 23, 2011. www.bloodjournal.orgFrom

proliferation.33,34 It is suggested that this suppressive activity is
mediated via the expression of CXCR2 receptor on BM-derived
HPs.20,35 In contrast to platelet factor 4 (PF4), IL-8 that contains the
ELR-CXC chemokine motif induces endothelial chemotaxis and
proliferation in vitro and angiogenesis in vivo.36,37
The various biologic activities of IL-8 prompted us to analyze
its role in the pathogenesis of MMM, a disease in which myelopro-
liferation, myelofibrosis, and neoangiogenesis are the major intrin-
sic pathophysiologic characteristics. In the present study, we
showed that the IL-8 level is strongly increased in the serum of
patients with MMM and that its expression is partly related to
hematopoietic cells including platelets. By using antisense and
antibodies against IL-8, we showed its involvement in the
myeloproliferative process observed in patients with MMM.
Using a similar strategy, we also demonstrated the participation
of CXCR1 and CXCR2 receptors in the altered MMM MK
proliferation, differentiation, and ploidization.
Materials and methods
Monoclonal antibodies (mAbs)
The mAbs directed against CD14 (RM052-phycoerythrin/RM052–
fluorescein isothiocyanate [RM052-PE/RM052-FITC]), CD38 (T16-
FITC), CD41/glycoprotein IIb (CD41/GPIIb) (P2-FITC), CD42a/GPIX
(SZ1-FITC), CD42b/GPIb (SZ2-FITC), CD117/c-kit (95C3-PE), glyco-
phorin A (GPA) (11E4B-7-6–FITC) were obtained from Beckman Coulter-
Immunotech (Marseille, France). Mouse antihuman CD15 (Leu-M1-FITC),
CD34 8G12–peridinin chlorophyll-alpha protein (8G12-PerCP), CD62P
(AK-4–PE), IL-8RA/CXCR1 (5A12-PE), IL-8RB/CXCR2 (6C6-PE), and
CD90/thymus cell antigen–1 (Thy1) (5E10-PE) were from Becton Dickin-
son/Pharmingen (Le Pont de Claix, France); CD41 (5B12 unconjugated or
PE) and CD61 (Y2/51-FITC) were from DakoCytomation (Trappes,
France). Murine immunoglobulin Gs (IgGs) of the same isotype were used
as negative controls. The unconjugated CD41 was revealed with the use of
goat anti-mouse–FITC (GAM-FITC) as the secondary antibody (Beckman
Coulter-Immunotech). Mouse antihuman CD9 (SYB-1) was a gift from C.
Boucheix (Paul Brousse Hospital, Villejuif, France).
Sample collections
Since fibrosis precludes marrow aspiration, samples were obtained from
the PB of 37 patients with MMM (age, 65 6 9 years) not receiving
chemotherapy at the time of the study. Diagnosis was established
according to the Polycythemia Vera Study Group (PVSG) clinical and
hematologic criteria.38 Normal bone marrow (NBM) and peripheral
blood (NPB) samples were obtained from 8 healthy individuals undergo-
ing hip prosthesis surgery and from 32 healthy unmobilized subjects,
respectively, with their informed consent.
Cell preparations
Mononuclear cells were isolated either from NBM or NPB or from the PB
of patients with MMM through Ficoll centrifugation, and CD341 cells were
recovered by the immunomagnetic magnetic-activated cell sorting (MACS)
system (Miltenyi Biotec, Paris, France) as previously described.39 This
procedure gave rise to more than 98% pure viable CD341 cells. Washed
platelets were obtained as previously described.40
Flow cytometry analysis
Purified CD341 cells were costained with fluorochrome-conjugated mAbs
directed against the CD34 antigen (8G12-PerCP) and against other antigens
to allow flow cytometric analysis using a 4-color FACScalibur (Becton
Dickinson) as already described.41 When used, the biotin-labeled mAb was
revealed by allophycocyanin (APC)–conjugated streptavidin. For IL-8
intracellular detection, whole blood cells and freshly purified CD341 were
incubated for 5 hours with brefeldin A (Golgistop; Becton Dickinson/
Pharmingen) (10 mg/mL, 4°C). After being washed in phosphate-buffered
saline (PBS) 1 3 containing 0.5% bovine serum albumin (BSA), cells were
surface stained with CD14-, CD15-, CD41-, CD42b-, GPA-, CD42a-FITC
or their isotype controls and subjected to intracellular IL-8 labeling by
means of Cytofix/Cytoperm kit and a PE-mouse antihuman IL-8 antibody
(Becton Dickinson/Pharmingen). For each sample, 5 3 104 events were
acquired, stored in list mode data files, and analyzed with Cellquest (Becton
Dickinson) or WinMDI (Joe Trotter; The Scripps Research Institute, La
Jolla, CA) softwares.
IL-8 immunostaining
PB mononuclear cells (PBMCs) (8 3 104) were smeared onto glass slides
by cytospin centrifugation and permeabilized with 100% methanol for 20
minutes at 4°C. After being washed, cells were coincubated with anti-CD41–
FITC (P2; Beckman Coulter-Immunotech) and anti–IL-8–PE antibodies
(G265-8; Pharmingen) for 45 minutes in the dark at room temperature.
After being washed, cells were incubated for 30 minutes with a 1:200
dilution of goat anti-IgG2b mouse antibody (Alexa fluor 595; BD Bio-
sciences, le Pont de Claix, France), washed again 3 times in PBS/0.5% BSA
for 5 minutes, mounted on a slide with Moviol, and photographed under a
fluorescence microscope (Leica DMR with 200 3/0.30 objective lens;
Leica, Heidelberg, Germany) (magnification 3 200). Images were captured
with an LEI-750 CE camera and LIDA vol. 54 software (Leica). Images
were further processed with Adobe Photoshop 7.0 (Adobe, San Jose, CA).
IL-8 enzyme-linked immunosorbent assay (ELISA)
Detection of IL-8 in sera and in culture media was assessed by means of an
IL-8 ELISA kit according to the manufacturer’s description (Beckman
Coulter-Immunotech).
CD341 and MK liquid cultures
Purified CD341 cells were cultured in a serum-free medium either
containing IL-1, IL-3, IL-6, granulocyte colony-stimulating factor (G-CSF),
granulocyte-macrophage CSF (GM-CSF), Flt3, stem cell factor
(SCF), erythropoietin (Epo), thrombopoietin (Tpo) (RM-BO2; Mabio-
International, Tourcoing, France) for their granulo-macrophagic, erythroid,
and MK differentiation (9-factor [9F] medium) or containing IL-3, IL-6,
IL-11, Tpo (RM-BO3; RTM/Mabio-International) for specific MK differen-
tiation (MK medium). Cells were incubated in the presence or absence of 10
mg/mL antihuman IL-8–neutralizing polyclonal goat antibody (AF-208-
NA; R&D Systems, Abingdon, United Kingdom), antihuman IL-8RA/
CXCR1 (5A12-PE), or IL-8RB/CXCR2 (6C6-PE). Isotypic immunoglobu-
lins were used as controls. On days 7 to 14 of the culture, cells were
harvested, counted, and labeled with mAbs directed against surface
differentiation markers or were prepared for cell cycle analysis. Superna-
tants, smears, and pellets were prepared for ELISA, cytologic, and
molecular analysis.
Clonogenic MK colony-forming unit (CFU-MK) progenitors
MK progenitors were assessed in collagen matrix by means of the
DM-CB00V kit (Mabio-International). CD341 cells (5 3 103) were
incubated in 1 mL serum-free collagen medium supplemented by IL-3
(2.5 ng) (Mabio-International), IL-6 (10 ng), and Tpo (50 ng) (Pepro-
tech, Tebu International, Le Perray en Yvelines, France) with or without
anti-CXCR12 or anti-CXCR22 neutralizing antibodies (10 mg/mL). IgG
isotype was used as control (Pharmingen). Duplicate cultures were
incubated for 10 to 12 days at 37°C in a humidified atmosphere
containing 5% CO2. Standard May-Grunwald-Giemsa staining and
immunocytochemistry using a CD41 mAb-FITC were performed for
reliable and accurate identification of MK colonies.
MK ploidy quantification
DNA content of MK CD411 cells (controlled by flow cytometry greater
than 95% to 97% pure) was measured by propidium iodide (PI) staining on
IL-8, CXCR1, AND CXCR2 IN MYELOFIBROSIS 465BLOOD, 15 JANUARY 2005 z VOLUME 105, NUMBER 2
For personal use only. at INSERM DISC on February 23, 2011. www.bloodjournal.orgFrom

day 12 of the MK liquid culture. Cells (5 3 104) were fixed in 70% ice-cold
ethanol overnight at 220°C and incubated for 30 minutes in the dark at
4°C in PBS containing PI (50 mg/mL) (Molecular Probes Europe, Breda,
The Netherlands) and RNAse A (100 mg/mL) (Sigma, Saint Quentin
Fallavier, France). Cells were gated and analyzed for ploidy and S phase
percentages with WinMDI and Cylchred freewares (Nigel Garrahan;
www.uwcm.ac.uk/uwcm/hg/hoy).
Antisense (AS) oligonucleotide treatment
To verify the oligonucleotide nontoxicity, CD341 cells were incubated for 7
days in liquid medium containing cytokines and IL-8 antisense or control
CG-matched randomized-sequence phosphorothioate oligonucleotides
(Biognostik, Gottingen, Germany) at 2, 5, and 10 mM concentrations, and
viability was assessed with trypan blue exclusion. The 5-mM concentration
was thus determined to be efficient and nontoxic. Oligonucleotide sequence
specificity was addressed by quantitative real-time polymerase chain
reaction (QRT-PCR), and specific inhibition due to the AS was also verified
on the protein level by ELISA, according to the manufacturer’s recommen-
dation for highly expressed genes. To assess the IL-8 AS effect, purified
CD341 cells from patients or healthy donors were set up in double wells (at
a cell density of 5 3 103/mL) and cultured for 14 days, with or without 5
mM IL-8 antisense or control oligonucleotides. Cultures were renewed
every 3 days with 3 mM IL-8 antisense or control oligonucleotides. After 7
and 14 days of culture, cells were harvested, counted, and labeled with
anti-CD41mAbs. Supernatants were stocked at 220°C; smears and pellets
were prepared for cytological and molecular studies.
Primers and probes
Primers and probes were designed by means of primer Express software
(PerkinElmer Life and Analytical Sciences, Courtaboeuf, France) and
synthesized by PE Biosystems (Courtaboeuf, France). For human IL-8, the
forward and reverse primers were 59-CAC CGG AAG GAA CCA TTC
TC-39 and 59-AAT CAG GAA GGC TGC CAA GA-39, respectively, and
the TaqMan probe was 6 6-carboxyfluorescein (FAM)-TGA CTT CCA
AGC TGG CCG TGG C-6-carboxy-tetramethyl-rhodamine (TAMRA). For
human glyceraldehyde-3-phosphate dehydrogenase (GAPDH), the forward
and reverse primers were 59-GAA GGT GAA GGT CGG AGT CA-39 and
59-GAA GAT GGT GAT GGG ATT TC-39, respectively, and the TaqMan
probe was 2,7-dimetoxy-4,5-dichloro-6-carboxyfluorescein (JOE)-CCGACT
CTT GCC CTT CGAAC-TAMRA.
RNA isolation and QRT-PCR assay
Total RNA from CD341 cells (1 3 106; purity exceeding 98%) prepared
according to Chomczynski and Sacchi42 was applied for reverse transcrip-
tion and amplification by means of the TaqMan RT-PCR kit (PE Biosys-
tems).43 Briefly, cDNA corresponding to reverse-transcribed total RNA was
amplified in a 30-mL vol reaction in triplicate assays. IL-8 and GAPDH
were amplified in the presence of 400 nM IL-8 primers or 200 nM GAPDH
primers, 200 nM IL-8 probe, and 100 nM GAPDH probe. A no-template
control and the unknown samples were also amplified in triplicate in a final
volume of 30 mL. Thermal cycling conditions were performed as described
previously.43 Amplifications were performed on an ABI PRISM 7700
Sequence detector (PE Biosystems). During the assay, the linear increase in
fluorescence signals (DRn) from the reporter dye was collected by a Prism
7700 (Applied Biosystems, Weiterstadt, Germany), and raw data were
calculated by means of Sequence Detector Software 1.6.3 (Applied
Biosystems), according to the manufacturer’s protocol. For each sample,
data were normalized to the GAPDH housekeeping gene level.
Statistical analysis
Data were expressed as means 6 standard deviation (SD). P values of less
than .05 were considered statistically significant (Student t test).
Results
Serum IL-8 level is increased in patients with MMM
IL-8 was quantified in the serum of 32 patients with MMM and 10
healthy subjects by ELISA. As shown in Figure 1, the IL-8 level
was heterogeneous but highly elevated in most analyzed patients,
with a mean serum IL-8 value in patients with MMM 30-fold
increased as compared with healthy subjects (60.20 6 100 pg/mL
versus 2.7 6 2.5 pg/mL, respectively; P 5 .003).
Hematopoietic cells, including megakaryocytic cells and
platelets, participate in IL-8 production in patients with MMM
The nature of the IL-8–producing cells was analyzed by intracellu-
lar flow cytometry, immunocytochemistry, and ELISA. Flow
cytometry analysis, performed on total blood cells excluding the
platelet gate, shows that in healthy donors IL-8 was expressed in
CD151 granulocytic (50% 6 26%; 14 6 1.4 mean fluorescence
intensity [MFI]; n 5 3) and CD141 monocytic (10% 6 6%; 47 6 27
MFI; n 5 3) cells. In patients with MMM, circulating CD411 MK
cells (30% 6 15%; 85 6 54 MFI; n 5 4) also participated with
CD151 (32% 6 3.7%; 73 6 19 MFI; n 5 4) and CD141 cells
(11% 6 3.6%; 117 6 18 MFI; n 5 4) in the IL-8 production.
Absence of CD42b labeling on these cells eliminated a possible
contamination by sticky platelets (data not shown). IL-8 detection
in MMM MK cells was confirmed by double IL-8/CD41 labeling
performed on blood mononuclear cells (Figure 2) as well as by
ELISA performed on supernatants of CD411 cells generated from
CD341 cell culture in MK conditions (651 6 185 pg/mL in MMM
MK cells versus 299 6 59 pg/mL in NPB MK cells; n 5 3,
Figure 1. Elevated IL-8 serum level in patients with MMM. Sera from 32 patients
with MMM and from 10 healthy controls (NPB) were assayed for IL-8 by ELISA. Mean
levels are indicated by the horizontal bars. The difference between patients with
MMM and healthy subjects was significant (P 5 .003).
466 EMADI et al BLOOD, 15 JANUARY 2005 z VOLUME 105, NUMBER 2
For personal use only. at INSERM DISC on February 23, 2011. www.bloodjournal.orgFrom

P , .05). Participation of MMM platelets in the IL-8 overproduc-
tion was supported by results showing that platelet-rich plasma
(PRP) contains significantly higher levels of IL-8 than platelet-poor
plasma (PPP) in patients or in PRP or PPP from healthy subjects
(Table 1). This result was confirmed by a 5- to 70-fold higher IL-8
production per platelet in MMM as compared with healthy subjects
and by an elevated IL-8 level in purified, washed MMM platelets
(54 6 4 pg/mL; n 5 2) versus normal platelets (10 6 2 pg/mL;
n 5 2).
IL-8 is expressed in CD341 cells from healthy subjects and
patients with MMM
The high number of circulating CD341 cells in patients’ blood led
us to analyze possible participation of these cells in IL-8 produc-
tion. QRT-PCR showed that normal PB CD341 expressed a higher
relative IL-8 transcript level than their medullar counterparts
(2.25 6 0.5 versus 0.25 6 0.25, respectively; P 5 .05; n 5 3 pools
of 6 to 7 healthy donors for NPB and n 5 3 individual NBM)
(Figure 3). In patients with MMM, IL-8 expression by PB CD341
cells was heterogeneous and displayed intermediate or similar
relative transcript levels for normal PB and BM expression,
respectively (Figure 3). Intracellular IL-8 protein was detected by
flow cytometry in CD341 cells purified from either normal BM
(36.6% 6 17%, 18 6 0.5 MFI) or MMM PB (24.5% 6 16%,
30 6 10 MFI). Evaluation of intracellular IL-8 protein expression
in NPB CD341 cells was not possible owing to the low number of
recovered cells.
Inhibition of IL-8 expression/production increases the
proliferation of MMM CD341-derived cells and stimulates their
megakaryocytic differentiation
The potential role of autocrine IL-8 on CD341-derived cell
proliferation was analyzed by adding either IL-8 AS oligonucleo-
tides or neutralizing antibodies to purified CD341 cells in 9F
culture condition. Figure 4A shows that addition of 5mM AS,
which was previously demonstrated to be the most effective
nontoxic concentration, increased the number of CD341-derived
cells by 30% to 70% after 10 to 14 days of culture in 3 of the 4
tested patients whereas it did not alter the growth of normal
CD341-derived cells. Reduction of the IL-8 transcript level
(R 5 0.695, when normalized on GAPDH expression) and of the
IL-8 protein level (30% to 77%, when quantified by ELISA) (Table
2) was detected in the AS-treated cells as compared with matched
random control cells.
To further substantiate the role of secreted IL-8 on CD341
growth, we assessed the effect of an anti–IL-8–neutralizing anti-
body (10 mg/mL) in such cultures. In contrast to NPB CD341 cells,
such treatment also significantly increased the number of CD341-
derived cells by 50% to 5000% in 5 of the 7 tested patients with
MMM (Figure 4B). This effect, which was not observed in control
isotype-treated cells, was maximal on day 14 of the culture.
Increased cell proliferation in anti–IL-8 MMM treated cultures was
correlated with a reduction in the IL-8 supernatant level (Table 2).
Interestingly, the 2 unresponsive patients (MMM6 and MMM7)
(Figure 4) exhibited a low IL-8 level reduction (Table 2). Even if
theses values may be biased by a possible competition between the
antibodies added in the culture and those used in the ELISA, they
are correlated with the biologic response of patients.
Flow cytometry analysis demonstrated that a 14-day anti–IL-8
antibody treatment significantly reduced, by 82% 6 30% and
50% 6 4%, the number of MMM cells expressing the primitive
multilineage Thy1 and CD34 antigens, respectively, as compared
with IgG-treated control (P 5 .005). Such a reduction was not
observed in normal PB CD341 anti–IL-8–treated cultures. There
was no modification in the percentage of cells expressing CD15,
CD14, CD71, GPA, or CD41 (Figure 5) after anti–IL-8 antibody
treatment in either MMM or normal cultures. In contrast, the
expression level of the CD41/GpIIb megakaryocytic membrane
glycoprotein was significantly increased after either an anti–IL-8
Figure 2. Circulating MMM CD411 megakaryocytic cells expressed IL-8 protein.
Smears of blood mononuclear cells from patients with MMM were subjected to
double labeling with anti-CD41 and anti–IL-8. The 3 panels show the same field of
cells (magnification 3 200). (A) Green fluorescent staining of anti-CD41–FITC. (B)
Red-orange fluorescence staining of anti–IL-8–PE. (C) Double labeling of IL-8 and
CD41 antigens. Slides were observed with a fluorescence microscope (Leica DMR,
200 3 aperture .30, 400 3 aperture .50; Leica, Heidelberg, Germany).
Table 1. IL-8 levels in PRP and PPP of patients with MMM or
healthy subjects
Sample
IL-8, pg/mL
PRP* PPP
H1 46 , 8
H2 , 8 , 8
H3 , 8 , 8
MMM1 252 72
MMM2 249 54
MMM4 324 77
MMM11 64 , 8
MMM12 96 , 8
H indicates healthy donor; MMM, patients with MMM.
IL-8 concentrations were assessed by means of an IL-8 ELISA kit. The threshold
sensitivity for the IL-8 ELISA was $ 8 pg/mL.
*Indicates significant difference between PRP and PPP values for H and MMM
subjects; P , .05.
Figure 3. IL-8 gene expression in CD341 cells from patients with MMM and
healthy subjects. Real-time quantitative PCR was performed with appropriate
primers for IL-8 and GAPDH as described in “Materials and methods.” Amplification
results were calculated by means of Sequence Detector Software 1.6.3. Mean
IL-8/GAPDH normalized values with standard deviations are plotted for NPB (n 5 3
pools of 6 to 7 blood samples) and NBM (n 5 3). The IL-8/GAPDH ratio was
individually calculated for the 3 patients with MMM.
IL-8, CXCR1, AND CXCR2 IN MYELOFIBROSIS 467BLOOD, 15 JANUARY 2005 z VOLUME 105, NUMBER 2
For personal use only. at INSERM DISC on February 23, 2011. www.bloodjournal.orgFrom
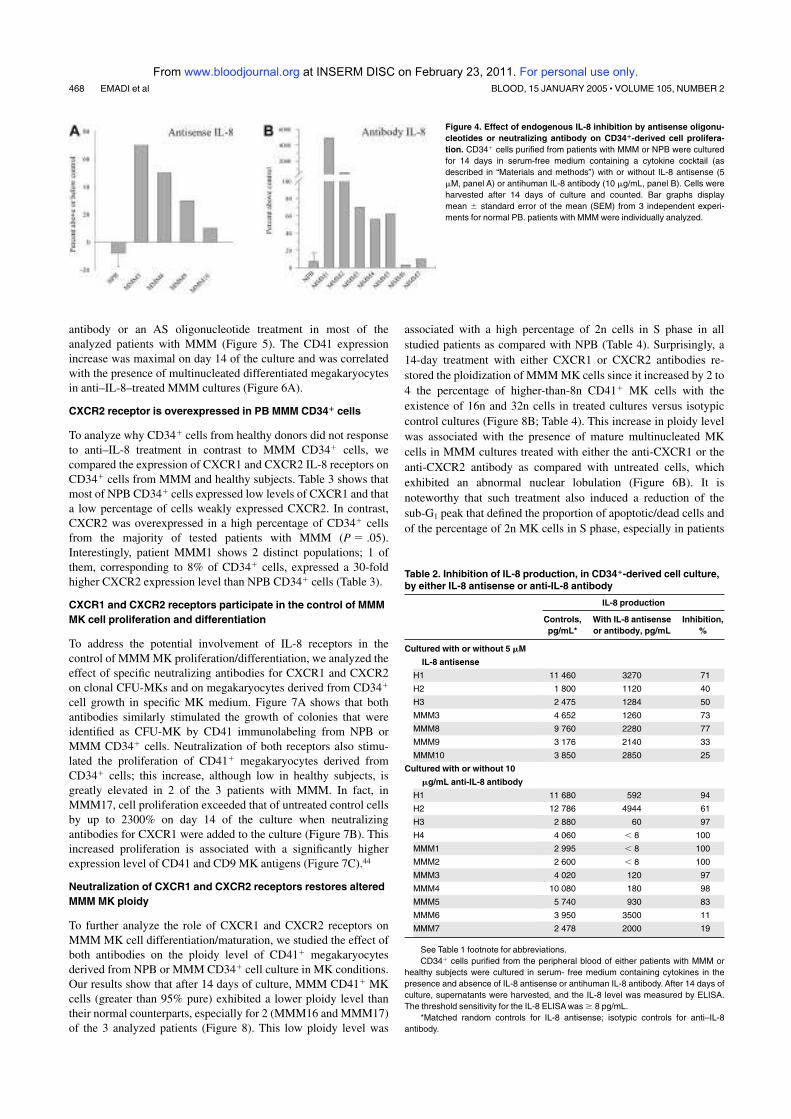
antibody or an AS oligonucleotide treatment in most of the
analyzed patients with MMM (Figure 5). The CD41 expression
increase was maximal on day 14 of the culture and was correlated
with the presence of multinucleated differentiated megakaryocytes
in anti–IL-8–treated MMM cultures (Figure 6A).
CXCR2 receptor is overexpressed in PB MMM CD341 cells
To analyze why CD341 cells from healthy donors did not response
to anti–IL-8 treatment in contrast to MMM CD341 cells, we
compared the expression of CXCR1 and CXCR2 IL-8 receptors on
CD341 cells from MMM and healthy subjects. Table 3 shows that
most of NPB CD341 cells expressed low levels of CXCR1 and that
a low percentage of cells weakly expressed CXCR2. In contrast,
CXCR2 was overexpressed in a high percentage of CD341 cells
from the majority of tested patients with MMM (P 5 .05).
Interestingly, patient MMM1 shows 2 distinct populations; 1 of
them, corresponding to 8% of CD341 cells, expressed a 30-fold
higher CXCR2 expression level than NPB CD341 cells (Table 3).
CXCR1 and CXCR2 receptors participate in the control of MMM
MK cell proliferation and differentiation
To address the potential involvement of IL-8 receptors in the
control of MMM MK proliferation/differentiation, we analyzed the
effect of specific neutralizing antibodies for CXCR1 and CXCR2
on clonal CFU-MKs and on megakaryocytes derived from CD341
cell growth in specific MK medium. Figure 7A shows that both
antibodies similarly stimulated the growth of colonies that were
identified as CFU-MK by CD41 immunolabeling from NPB or
MMM CD341 cells. Neutralization of both receptors also stimu-
lated the proliferation of CD411 megakaryocytes derived from
CD341 cells; this increase, although low in healthy subjects, is
greatly elevated in 2 of the 3 patients with MMM. In fact, in
MMM17, cell proliferation exceeded that of untreated control cells
by up to 2300% on day 14 of the culture when neutralizing
antibodies for CXCR1 were added to the culture (Figure 7B). This
increased proliferation is associated with a significantly higher
expression level of CD41 and CD9 MK antigens (Figure 7C).44
Neutralization of CXCR1 and CXCR2 receptors restores altered
MMM MK ploidy
To further analyze the role of CXCR1 and CXCR2 receptors on
MMM MK cell differentiation/maturation, we studied the effect of
both antibodies on the ploidy level of CD411 megakaryocytes
derived from NPB or MMM CD341 cell culture in MK conditions.
Our results show that after 14 days of culture, MMM CD411 MK
cells (greater than 95% pure) exhibited a lower ploidy level than
their normal counterparts, especially for 2 (MMM16 and MMM17)
of the 3 analyzed patients (Figure 8). This low ploidy level was
associated with a high percentage of 2n cells in S phase in all
studied patients as compared with NPB (Table 4). Surprisingly, a
14-day treatment with either CXCR1 or CXCR2 antibodies re-
stored the ploidization of MMM MK cells since it increased by 2 to
4 the percentage of higher-than-8n CD411 MK cells with the
existence of 16n and 32n cells in treated cultures versus isotypic
control cultures (Figure 8B; Table 4). This increase in ploidy level
was associated with the presence of mature multinucleated MK
cells in MMM cultures treated with either the anti-CXCR1 or the
anti-CXCR2 antibody as compared with untreated cells, which
exhibited an abnormal nuclear lobulation (Figure 6B). It is
noteworthy that such treatment also induced a reduction of the
sub-G1 peak that defined the proportion of apoptotic/dead cells and
of the percentage of 2n MK cells in S phase, especially in patients
Figure 4. Effect of endogenous IL-8 inhibition by antisense oligonu-
cleotides or neutralizing antibody on CD341-derived cell prolifera-
tion. CD341 cells purified from patients with MMM or NPB were cultured
for 14 days in serum-free medium containing a cytokine cocktail (as
described in “Materials and methods”) with or without IL-8 antisense (5
mM, panel A) or antihuman IL-8 antibody (10 mg/mL, panel B). Cells were
harvested after 14 days of culture and counted. Bar graphs display
mean 6 standard error of the mean (SEM) from 3 independent experi-
ments for normal PB. patients with MMM were individually analyzed.
Table 2. Inhibition of IL-8 production, in CD341-derived cell culture,
by either IL-8 antisense or anti-IL-8 antibody
IL-8 production
Controls,
pg/mL*
With IL-8 antisense
or antibody, pg/mL
Inhibition,
%
Cultured with or without 5 mM
IL-8 antisense
H1 11 460 3270 71
H2 1 800 1120 40
H3 2 475 1284 50
MMM3 4 652 1260 73
MMM8 9 760 2280 77
MMM9 3 176 2140 33
MMM10 3 850 2850 25
Cultured with or without 10
mg/mL anti-IL-8 antibody
H1 11 680 592 94
H2 12 786 4944 61
H3 2 880 60 97
H4 4 060 , 8 100
MMM1 2 995 , 8 100
MMM2 2 600 , 8 100
MMM3 4 020 120 97
MMM4 10 080 180 98
MMM5 5 740 930 83
MMM6 3 950 3500 11
MMM7 2 478 2000 19
See Table 1 footnote for abbreviations.
CD341 cells purified from the peripheral blood of either patients with MMM or
healthy subjects were cultured in serum- free medium containing cytokines in the
presence and absence of IL-8 antisense or antihuman IL-8 antibody. After 14 days of
culture, supernatants were harvested, and the IL-8 level was measured by ELISA.
The threshold sensitivity for the IL-8 ELISA was $ 8 pg/mL.
*Matched random controls for IL-8 antisense; isotypic controls for anti–IL-8
antibody.
468 EMADI et al BLOOD, 15 JANUARY 2005 z VOLUME 105, NUMBER 2
For personal use only. at INSERM DISC on February 23, 2011. www.bloodjournal.orgFrom

MMM16 and MMM17 in whom ploidy was the most altered
(Table 4).
Discussion
The numerous biologic activities of IL-8 on HP mobilization,
regulation, and angiogenesis prompted us to analyze its potential
role in MMM, a myeloproliferative syndrome characterized by
severe alteration of these processes. In the present study, we
showed that IL-8 level is highly increased in the serum of patients
with MMM and that hematopoietic cells participated in its produc-
tion. MMM platelets that express higher level of IL-8 than their
normal counterparts are likely to participate in such an overproduc-
tion. However, the fact that there is no clear correlation (r 5 20.203;
n 5 19) between the average platelet count (9000 to 524 000/mm3)
and the IL-8 serum level in patients with MMM suggests that other
cells also participate in such an increased production. Actually,
whereas circulating MMM granulocytes/monocytes, MK cells, and
CD341 cells expressed IL-8 protein level similar to that of their
normal counterparts, their elevated numbers in patients’ PB1,11
suggest that they take part in the IL-8 overproduction. Our results
showing that CD341 and megakaryocytically derived CD341 cells
from unmobilized normal blood or from patients with MMM
expressed IL-8 protein, reinforce recent data reporting IL-8 produc-
tion by CD341 cells and MK cells derived from cord blood or
BM.45,46 IL-8 is known to also be produced by BM stromal and
endothelial cells. Since myeloproliferation is associated with
myelofibrosis and neoangiogenesis, the participation of stromal
and endothelial cells in the elevated serum IL-8 level observed in
MMM cannot be excluded.
IL-8 is reported to exert an inhibitory effect on hematopoiesis
and specially on MK proliferation.47,48 However, in synergy with
M-CSF, it could also act on promotion of monocyte/macrophage
growth and differentiation.49 As for other chemokines, it has been
Figure 5. Effect of endogenous IL-8 inhibition by antisense
oligonucleotides or neutralizing antibody on CD41 antigen ex-
pression levels. CD341 cells purified from either MMM or NPB were
cultured in serum-free medium containing a cytokine cocktail in the
presence and absence of 5 mM IL-8 antisense (panel A) or 10 mg/mL
antihuman IL-8 antibody (panel B). Cells were harvested after 14 days
of culture and labeled with monoclonal antibody against CD41. The
percentage (■) and MFI (■) of CD411 cells were analyzed with
Cellquest software by means of a FASCcalibur flow cytometer. Bar
graphs display mean 6 SEM from 3 independent experiments.
patients with MMM were individually analyzed.
Figure 6. Effect of neutralizing anti–IL-8 or anti-CXCR1/anti-CXCR2 antibodies
on the maturation of megakaryocytic cells derived from MMM CD341 cells.
Purified CD341 cells from MMM and healthy subjects (NPB) were cultured for 14
days in serum-free medium containing a cytokine cocktail (9F or MK medium) in the
absence or presence of neutralizing anti–IL-8 (panel A) or anti-CXCR1 or anti-
CXCR2 (panel B) antibodies. The cells were cytocentrifuged and stained with
May-Grunwald-Giemsa (magnification 3 400). In panel B, the asterisk indicates the
presence of MK cells with plump lobulated nucleus in MMM untreated cells, and the
black arrow designates MK cells with polylobulated nucleus in the anti–IL-8– or
anti-CXCR1 antibody–treated cultures in patients with MMM. Similar polylobulated
nuclei were also obtained in anti-CXCR2 antibody–treated MMM cultures.
Table 3. Expression of CXCR1 and CXCR2 IL-8 receptors
on CD341 cells
CXCR1 CXCR2
% MFI % MFI
NPB1 97 18 30 8
NPB2 70 8 18 7
NPB3 60 10 Ud Ud
NPB4 89 11 Ud Ud
NPB5 94 13 25 6
MMM1
Population 1 39 10 71 10
Population 2 Ud Ud 8 183
MMM2 ND ND ND ND
MMM3 90 32 96 39
MMM4 ND ND 73 19
MMM5 97 14 95 10
MMM6 ND ND ND ND
MMM7 90 21 4 14
MMM8 99 20 77 7
MMM9 7 18 20 41
MMM10 88 15 97 16
CD341 cells purified from either MMM or NPB were labeled with PE-conjugated
anti-CXCR1 and anti-CXCR2 or isotype control. The percentage and MFI of positive
cells were analyzed on 5 3 104 cells with FACScalibur flow cytometer. Note that
patient MMM1 exhibited 2 distinct CXCR2-expressing populations.
Ud indicates undetectable; ND, not determined.
IL-8, CXCR1, AND CXCR2 IN MYELOFIBROSIS 469BLOOD, 15 JANUARY 2005 z VOLUME 105, NUMBER 2
For personal use only. at INSERM DISC on February 23, 2011. www.bloodjournal.orgFrom
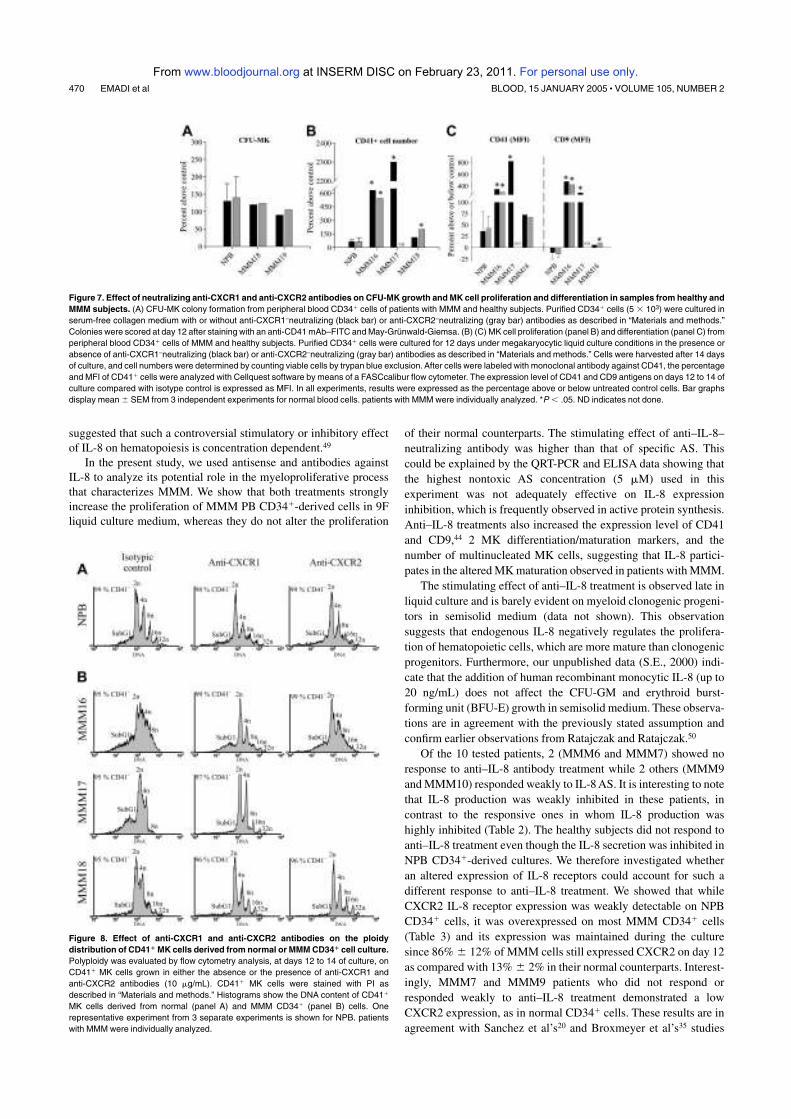
suggested that such a controversial stimulatory or inhibitory effect
of IL-8 on hematopoiesis is concentration dependent.49
In the present study, we used antisense and antibodies against
IL-8 to analyze its potential role in the myeloproliferative process
that characterizes MMM. We show that both treatments strongly
increase the proliferation of MMM PB CD341-derived cells in 9F
liquid culture medium, whereas they do not alter the proliferation
of their normal counterparts. The stimulating effect of anti–IL-8–
neutralizing antibody was higher than that of specific AS. This
could be explained by the QRT-PCR and ELISA data showing that
the highest nontoxic AS concentration (5 mM) used in this
experiment was not adequately effective on IL-8 expression
inhibition, which is frequently observed in active protein synthesis.
Anti–IL-8 treatments also increased the expression level of CD41
and CD9,44 2 MK differentiation/maturation markers, and the
number of multinucleated MK cells, suggesting that IL-8 partici-
pates in the altered MK maturation observed in patients with MMM.
The stimulating effect of anti–IL-8 treatment is observed late in
liquid culture and is barely evident on myeloid clonogenic progeni-
tors in semisolid medium (data not shown). This observation
suggests that endogenous IL-8 negatively regulates the prolifera-
tion of hematopoietic cells, which are more mature than clonogenic
progenitors. Furthermore, our unpublished data (S.E., 2000) indi-
cate that the addition of human recombinant monocytic IL-8 (up to
20 ng/mL) does not affect the CFU-GM and erythroid burst-
forming unit (BFU-E) growth in semisolid medium. These observa-
tions are in agreement with the previously stated assumption and
confirm earlier observations from Ratajczak and Ratajczak.50
Of the 10 tested patients, 2 (MMM6 and MMM7) showed no
response to anti–IL-8 antibody treatment while 2 others (MMM9
and MMM10) responded weakly to IL-8 AS. It is interesting to note
that IL-8 production was weakly inhibited in these patients, in
contrast to the responsive ones in whom IL-8 production was
highly inhibited (Table 2). The healthy subjects did not respond to
anti–IL-8 treatment even though the IL-8 secretion was inhibited in
NPB CD341-derived cultures. We therefore investigated whether
an altered expression of IL-8 receptors could account for such a
different response to anti–IL-8 treatment. We showed that while
CXCR2 IL-8 receptor expression was weakly detectable on NPB
CD341 cells, it was overexpressed on most MMM CD341 cells
(Table 3) and its expression was maintained during the culture
since 86% 6 12% of MMM cells still expressed CXCR2 on day 12
as compared with 13% 6 2% in their normal counterparts. Interest-
ingly, MMM7 and MMM9 patients who did not respond or
responded weakly to anti–IL-8 treatment demonstrated a low
CXCR2 expression, as in normal CD341 cells. These results are in
agreement with Sanchez et al’s20 and Broxmeyer et al’s35 studies
Figure 7. Effect of neutralizing anti-CXCR1 and anti-CXCR2 antibodies on CFU-MK growth and MK cell proliferation and differentiation in samples from healthy and
MMM subjects. (A) CFU-MK colony formation from peripheral blood CD341 cells of patients with MMM and healthy subjects. Purified CD341 cells (5 3 103) were cultured in
serum-free collagen medium with or without anti-CXCR1–neutralizing (black bar) or anti-CXCR2–neutralizing (gray bar) antibodies as described in “Materials and methods.”
Colonies were scored at day 12 after staining with an anti-CD41 mAb–FITC and May-Grunwald-Giemsa. (B) (C) MK cell proliferation (panel B) and differentiation (panel C) from
peripheral blood CD341 cells of MMM and healthy subjects. Purified CD341 cells were cultured for 12 days under megakaryocytic liquid culture conditions in the presence or
absence of anti-CXCR1–neutralizing (black bar) or anti-CXCR2–neutralizing (gray bar) antibodies as described in “Materials and methods.” Cells were harvested after 14 days
of culture, and cell numbers were determined by counting viable cells by trypan blue exclusion. After cells were labeled with monoclonal antibody against CD41, the percentage
and MFI of CD411 cells were analyzed with Cellquest software by means of a FASCcalibur flow cytometer. The expression level of CD41 and CD9 antigens on days 12 to 14 of
culture compared with isotype control is expressed as MFI. In all experiments, results were expressed as the percentage above or below untreated control cells. Bar graphs
display mean 6 SEM from 3 independent experiments for normal blood cells. patients with MMM were individually analyzed. *P , .05. ND indicates not done.
Figure 8. Effect of anti-CXCR1 and anti-CXCR2 antibodies on the ploidy
distribution of CD411 MK cells derived from normal or MMM CD341 cell culture.
Polyploidy was evaluated by flow cytometry analysis, at days 12 to 14 of culture, on
CD411 MK cells grown in either the absence or the presence of anti-CXCR1 and
anti-CXCR2 antibodies (10 mg/mL). CD411 MK cells were stained with PI as
described in “Materials and methods.” Histograms show the DNA content of CD411
MK cells derived from normal (panel A) and MMM CD341 (panel B) cells. One
representative experiment from 3 separate experiments is shown for NPB. patients
with MMM were individually analyzed.
470 EMADI et al BLOOD, 15 JANUARY 2005 z VOLUME 105, NUMBER 2
For personal use only. at INSERM DISC on February 23, 2011. www.bloodjournal.orgFrom

showing that the inhibitory effect of CXC chemokines on myelopoi-
esis is mediated by CXCR2.
Involvement of IL-8 receptors in this process, especially in the
altered MMM MK proliferation/differentiation, was further ad-
dressed by using neutralizing antibodies against CXCR1 or CXCR2
receptors on megakaryocyte-derived CD341 cells. While anti-
CXCR1 or anti-CXCR2 treatments similarly affect the clonal
growth of NPB and MMM CFU-MKs, neutralization of both
receptors greatly stimulated the proliferation of CD411 megakaryo-
cytically derived CD341 cells from patients with MMM as
compared with healthy subjects. The significantly higher expres-
sion levels of CD41 and CD9 MK differentiation marker in
MMM-treated cultures confirmed the involvement of both recep-
tors in stimulating the MK differentiation/maturation. Interestingly,
both antibodies also restored the altered polyploidization of MMM
CD411 MK cells. Such an effect was observed particularly in
MMM16 and MMM17 patients, who exhibited the lowest ploidy as
compared with MMM18, or in NPB MK cells, which exhibit a
higher or “normal” endomitotic process with the presence of 32n
cells. The reduction in the percentage of cells in sub-G1 phase and
of 2n cells in S phase in MMM-treated culture suggested that
neutralization of IL-8 receptors reduced the apoptosis of dysma-
tured MK cells and favored their maturation by stimulating the
endomitosis versus the proliferation process. The presence of
multinucleated mature MK cells in treated cultures reinforces such
an assumption.
Neutralization of either CXCR1 or CXCR2 stimulated the
maturation of MMM megakaryocytes, restored their ploidy, and
reduced their percentage in sub-G1 phase, which strongly suggests
that their ligands, including IL-8, participate in the altered MK
growth. In contrast to cytokines, the relation between chemokines
and their receptors is of a “polygamous” type since chemokine
receptors bind several different chemokines and chemokines bind
several different receptors.51 Therefore, it could be hypothesized
that other CXC chemokines participate in the MMM MK dysregu-
lation. The serum levels of NAP2, quantified by densitometry on
protein array (data not shown) and of ENA-78 (1354 6 1021
pg/mL and 1393 6 843 pg/mL, respectively) were similar in
MMM and healthy subjects. In contrast, those of GRO alpha and
granulocyte chemotactic protein 2, which are higher potent ago-
nists for CXCR2 than for CXCR1,52 are increased in patients
(645 6 320 pg/mL and 590 6 180 pg/mL, respectively) as com-
pared with healthy subjects (120 6 40 pg/mL and 164 6 130
pg/mL, respectively). Although the implication of these chemo-
kines in MMM pathogenesis cannot be excluded, our results
showing that inhibition of either IL-8 or its receptors resulted in
similar biologic effects supports a major role for IL-8 in the
process described.
MMM is a heterogeneous and puzzling disease in which
myeloproliferation is associated with an alteration of MK matura-
tion and with the extramedullary migration of HP to the spleen and
liver. Considering the inhibitory role of IL-8 in hematopoiesis, the
presence of myeloproliferation associated with a high level of IL-8
in MMM could appear paradoxical. Interestingly, abnormal produc-
tion of IL-8 has also been reported in a number of proliferative
hematologic disorders such as polycythemia vera, where its action
is still not well understood.53 The most significant biologic effect of
IL-8 and its receptors suggested by our results is that they
participate in the altered MK cell proliferation and differentiation
in MMM. Therefore, it can be suggested that IL-8, most likely in
synergy with other cytokines/chemokines overproduced in this
disease, contributed to maintaining the CD341 progenitor compart-
ment in a proliferative immature state by a feedback mechanism.
Our results showing that the anti–IL-8 treatment significantly
reduced the number of MMM cells expressing the primitive
multilineage Thy1 and CD34 antigens are in agreement with such a
hypothesis. It has been recently reported that the binding of PF4 to
IL-8 could impair IL-8–dependent signaling in CD341 progenitors
through the formation of IL-8/PF4 heterodimers or heterotetra-
mers.54 A similar process could be evoked in MMM, in which PF4
is highly increased in the BM microenvironment.55,56 Interestingly,
intramedullary accumulation of PF4 is suggested to promote the
displacement of hematopoiesis to other organs such as liver and
spleen.54 Such a hypothesis is of pathophysiologic relevance with
regard to MMM, in which medullary aplasia is associated with
myeloid metaplasia in spleen and liver.12
Our results showed that the altered MK maturation observed in
patients with MMM could be reproduced in vitro in CD341
cell–derived cultures, corroborating the intrinsic alteration of
MMM HPs. To our knowledge, this is the first time that IL-8 and its
receptors are reported to be involved in MMM-altered MK growth.
This observation, which is relevant to a significant subpopulation
Table 4. Ploidy distribution of CD411 MK cells derived from healthy subjects and patients with MMM with and without anti-CXCR1 and
anti-CXCR2 antibodies
Lower than 2n ploidy,
sub-G1 phase, %
2n ploidy 4n ploidyGreater than 8n
ploidy, %% S phase % % S phase %
NPB
Control 2863 6162 3661 2560 43 6 3 14 6 2
Anti-CXCR1 2265 5863 2565 2760 39 6 10 15 6 2
Anti-CXCR2 2166 6165 2666 2661 41 6 4 14 6 2
MMM16
Control 43 69 80 26 60 5
Anti-CXCR1 33 63 31 24 40 13
Anti-CXCR2 24 53 40 32 45 15
MMM17
Control 40 83 57 15 18 2
Anti-CXCR1 3 69 31 23 26 8
Anti-CXCR2 ND ND ND ND ND ND
MMM18
Control 29 64 55 27 45 9
Anti-CXCR1 19 62 38 22 28 16
Anti-CXCR2 19 57 33 26 35 17
Data for healthy subjects are the mean of 3 distinct experiments; data for MMM subjects are presented individually. See Table 3 for abbreviations.
IL-8, CXCR1, AND CXCR2 IN MYELOFIBROSIS 471BLOOD, 15 JANUARY 2005 z VOLUME 105, NUMBER 2
For personal use only. at INSERM DISC on February 23, 2011. www.bloodjournal.orgFrom
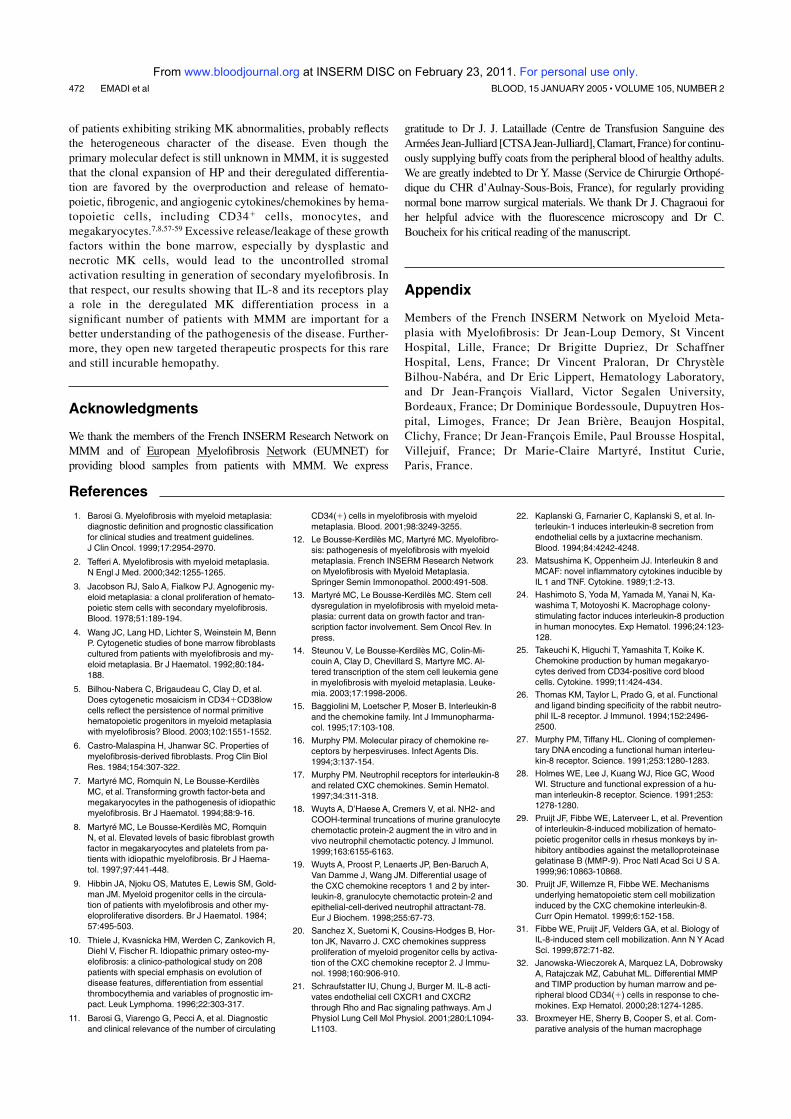
of patients exhibiting striking MK abnormalities, probably reflects
the heterogeneous character of the disease. Even though the
primary molecular defect is still unknown in MMM, it is suggested
that the clonal expansion of HP and their deregulated differentia-
tion are favored by the overproduction and release of hemato-
poietic, fibrogenic, and angiogenic cytokines/chemokines by hema-
topoietic cells, including CD341 cells, monocytes, and
megakaryocytes.7,8,57-59 Excessive release/leakage of these growth
factors within the bone marrow, especially by dysplastic and
necrotic MK cells, would lead to the uncontrolled stromal
activation resulting in generation of secondary myelofibrosis. In
that respect, our results showing that IL-8 and its receptors play
a role in the deregulated MK differentiation process in a
significant number of patients with MMM are important for a
better understanding of the pathogenesis of the disease. Further-
more, they open new targeted therapeutic prospects for this rare
and still incurable hemopathy.
Acknowledgments
We thank the members of the French INSERM Research Network on
MMM and of European Myelofibrosis Network (EUMNET) for
providing blood samples from patients with MMM. We express
gratitude to Dr J. J. Lataillade (Centre de Transfusion Sanguine des
Armees Jean-Julliard [CTSAJean-Julliard], Clamart, France) for continu-
ously supplying buffy coats from the peripheral blood of healthy adults.
We are greatly indebted to Dr Y. Masse (Service de Chirurgie Orthope-
dique du CHR d’Aulnay-Sous-Bois, France), for regularly providing
normal bone marrow surgical materials. We thank Dr J. Chagraoui for
her helpful advice with the fluorescence microscopy and Dr C.
Boucheix for his critical reading of the manuscript.
Appendix
Members of the French INSERM Network on Myeloid Meta-
plasia with Myelofibrosis: Dr Jean-Loup Demory, St Vincent
Hospital, Lille, France; Dr Brigitte Dupriez, Dr Schaffner
Hospital, Lens, France; Dr Vincent Praloran, Dr Chrystele
Bilhou-Nabera, and Dr Eric Lippert, Hematology Laboratory,
and Dr Jean-Francois Viallard, Victor Segalen University,
Bordeaux, France; Dr Dominique Bordessoule, Dupuytren Hos-
pital, Limoges, France; Dr Jean Briere, Beaujon Hospital,
Clichy, France; Dr Jean-Francois Emile, Paul Brousse Hospital,
Villejuif, France; Dr Marie-Claire Martyre, Institut Curie,
Paris, France.
References
1. Barosi G. Myelofibrosis with myeloid metaplasia:
diagnostic definition and prognostic classification
for clinical studies and treatment guidelines.
J Clin Oncol. 1999;17:2954-2970.
2. Tefferi A. Myelofibrosis with myeloid metaplasia.
N Engl J Med. 2000;342:1255-1265.
3. Jacobson RJ, Salo A, Fialkow PJ. Agnogenic my-
eloid metaplasia: a clonal proliferation of hemato-
poietic stem cells with secondary myelofibrosis.
Blood. 1978;51:189-194.
4. Wang JC, Lang HD, Lichter S, Weinstein M, Benn
P. Cytogenetic studies of bone marrow fibroblasts
cultured from patients with myelofibrosis and my-
eloid metaplasia. Br J Haematol. 1992;80:184-
188.
5. Bilhou-Nabera C, Brigaudeau C, Clay D, et al.
Does cytogenetic mosaicism in CD341CD38low
cells reflect the persistence of normal primitive
hematopoietic progenitors in myeloid metaplasia
with myelofibrosis? Blood. 2003;102:1551-1552.
6. Castro-Malaspina H, Jhanwar SC. Properties of
myelofibrosis-derived fibroblasts. Prog Clin Biol
Res. 1984;154:307-322.
7. Martyre MC, Romquin N, Le Bousse-Kerdiles
MC, et al. Transforming growth factor-beta and
megakaryocytes in the pathogenesis of idiopathic
myelofibrosis. Br J Haematol. 1994;88:9-16.
8. Martyre MC, Le Bousse-Kerdiles MC, Romquin
N, et al. Elevated levels of basic fibroblast growth
factor in megakaryocytes and platelets from pa-
tients with idiopathic myelofibrosis. Br J Haema-
tol. 1997;97:441-448.
9. Hibbin JA, Njoku OS, Matutes E, Lewis SM, Gold-
man JM. Myeloid progenitor cells in the circula-
tion of patients with myelofibrosis and other my-
eloproliferative disorders. Br J Haematol. 1984;
57:495-503.
10. Thiele J, Kvasnicka HM, Werden C, Zankovich R,
Diehl V, Fischer R. Idiopathic primary osteo-my-
elofibrosis: a clinico-pathological study on 208
patients with special emphasis on evolution of
disease features, differentiation from essential
thrombocythemia and variables of prognostic im-
pact. Leuk Lymphoma. 1996;22:303-317.
11. Barosi G, Viarengo G, Pecci A, et al. Diagnostic
and clinical relevance of the number of circulating
CD34(1) cells in myelofibrosis with myeloid
metaplasia. Blood. 2001;98:3249-3255.
12. Le Bousse-Kerdiles MC, Martyre MC. Myelofibro-
sis: pathogenesis of myelofibrosis with myeloid
metaplasia. French INSERM Research Network
on Myelofibrosis with Myeloid Metaplasia.
Springer Semin Immonopathol. 2000:491-508.
13. Martyre MC, Le Bousse-Kerdiles MC. Stem cell
dysregulation in myelofibrosis with myeloid meta-
plasia: current data on growth factor and tran-
scription factor involvement. Sem Oncol Rev. In
press.
14. Steunou V, Le Bousse-Kerdiles MC, Colin-Mi-
couin A, Clay D, Chevillard S, Martyre MC. Al-
tered transcription of the stem cell leukemia gene
in myelofibrosis with myeloid metaplasia. Leuke-
mia. 2003;17:1998-2006.
15. Baggiolini M, Loetscher P, Moser B. Interleukin-8
and the chemokine family. Int J Immunopharma-
col. 1995;17:103-108.
16. Murphy PM. Molecular piracy of chemokine re-
ceptors by herpesviruses. Infect Agents Dis.
1994;3:137-154.
17. Murphy PM. Neutrophil receptors for interleukin-8
and related CXC chemokines. Semin Hematol.
1997;34:311-318.
18. Wuyts A, D’Haese A, Cremers V, et al. NH2- and
COOH-terminal truncations of murine granulocyte
chemotactic protein-2 augment the in vitro and in
vivo neutrophil chemotactic potency. J Immunol.
1999;163:6155-6163.
19. Wuyts A, Proost P, Lenaerts JP, Ben-Baruch A,
Van Damme J, Wang JM. Differential usage of
the CXC chemokine receptors 1 and 2 by inter-
leukin-8, granulocyte chemotactic protein-2 and
epithelial-cell-derived neutrophil attractant-78.
Eur J Biochem. 1998;255:67-73.
20. Sanchez X, Suetomi K, Cousins-Hodges B, Hor-
ton JK, Navarro J. CXC chemokines suppress
proliferation of myeloid progenitor cells by activa-
tion of the CXC chemokine receptor 2. J Immu-
nol. 1998;160:906-910.
21. Schraufstatter IU, Chung J, Burger M. IL-8 acti-
vates endothelial cell CXCR1 and CXCR2
through Rho and Rac signaling pathways. Am J
Physiol Lung Cell Mol Physiol. 2001;280:L1094-
L1103.
22. Kaplanski G, Farnarier C, Kaplanski S, et al. In-
terleukin-1 induces interleukin-8 secretion from
endothelial cells by a juxtacrine mechanism.
Blood. 1994;84:4242-4248.
23. Matsushima K, Oppenheim JJ. Interleukin 8 and
MCAF: novel inflammatory cytokines inducible by
IL 1 and TNF. Cytokine. 1989;1:2-13.
24. Hashimoto S, Yoda M, Yamada M, Yanai N, Ka-
washima T, Motoyoshi K. Macrophage colony-
stimulating factor induces interleukin-8 production
in human monocytes. Exp Hematol. 1996;24:123-
128.
25. Takeuchi K, Higuchi T, Yamashita T, Koike K.
Chemokine production by human megakaryo-
cytes derived from CD34-positive cord blood
cells. Cytokine. 1999;11:424-434.
26. Thomas KM, Taylor L, Prado G, et al. Functional
and ligand binding specificity of the rabbit neutro-
phil IL-8 receptor. J Immunol. 1994;152:2496-
2500.
27. Murphy PM, Tiffany HL. Cloning of complemen-
tary DNA encoding a functional human interleu-
kin-8 receptor. Science. 1991;253:1280-1283.
28. Holmes WE, Lee J, Kuang WJ, Rice GC, Wood
WI. Structure and functional expression of a hu-
man interleukin-8 receptor. Science. 1991;253:
1278-1280.
29. Pruijt JF, Fibbe WE, Laterveer L, et al. Prevention
of interleukin-8-induced mobilization of hemato-
poietic progenitor cells in rhesus monkeys by in-
hibitory antibodies against the metalloproteinase
gelatinase B (MMP-9). Proc Natl Acad Sci U S A.
1999;96:10863-10868.
30. Pruijt JF, Willemze R, Fibbe WE. Mechanisms
underlying hematopoietic stem cell mobilization
induced by the CXC chemokine interleukin-8.
Curr Opin Hematol. 1999;6:152-158.
31. Fibbe WE, Pruijt JF, Velders GA, et al. Biology of
IL-8-induced stem cell mobilization. Ann N Y Acad
Sci. 1999;872:71-82.
32. Janowska-Wieczorek A, Marquez LA, Dobrowsky
A, Ratajczak MZ, Cabuhat ML. Differential MMP
and TIMP production by human marrow and pe-
ripheral blood CD34(1) cells in response to che-
mokines. Exp Hematol. 2000;28:1274-1285.
33. Broxmeyer HE, Sherry B, Cooper S, et al. Com-
parative analysis of the human macrophage
472 EMADI et al BLOOD, 15 JANUARY 2005 z VOLUME 105, NUMBER 2
For personal use only. at INSERM DISC on February 23, 2011. www.bloodjournal.orgFrom

inflammatory protein family of cytokines (chemo-
kines) on proliferation of human myeloid progeni-
tor cells: interacting effects involving suppression,
synergistic suppression, and blocking of suppres-
sion. J Immunol. 1993;150:3448-3458.
34. Lu CY, Tang ZS. Interleukin-8 and inflammation
[in Chinese]. Sheng Li Ke Xue Jin Zhan. 1993;24:
351-353.
35. Broxmeyer HE, Cooper S, Cacalano G, Hague
NL, Bailish E, Moore MW. Involvement of inter-
leukin (IL) 8 receptor in negative regulation of my-
eloid progenitor cells in vivo: evidence from mice
lacking the murine IL-8 receptor homologue. J
Exp Med. 1996;184:1825-1832.
36. Koch AE, Polverini PJ, Kunkel SL, et al. Interleu-
kin-8 as a macrophage-derived mediator of an-
giogenesis. Science. 1992;258:1798-1801.
37. Strieter RM, Polverini PJ, Kunkel SL, et al. The
functional role of the ELR motif in CXC chemo-
kine-mediated angiogenesis. J Biol Chem. 1995;
270:27348-27357.
38. Berlin N. Diagnosis and classification of the poly-
cythemias. Semin Hematol. 1975;12:339-351.
39. de Wynter EA, Coutinho LH, Pei X, et al. Com-
parison of purity and enrichment of CD341 cells
from bone marrow, umbilical cord and peripheral
blood (primed for aphresis) using five separation
systems. Stem Cells. 1995;13:524-532.
40. Mustard JF, Perry DW, Ardlie NG, Packham MA.
Preparation of suspensions of washed platelets
from humans. Br J Haematol. 1972;22:193-204.
41. Baumgarth N, Roederer M. A practical approach
to multicolor flow cytometry for immunophenotyp-
ing. J Immunol Methods. 2000;243:77-97.
42. Chomczynski P, Sacchi N. Single-step method of
RNA isolation by acid guanidinium thiocyanate-
phenol-chloroform extraction. Anal Biochem.
1987;162:156-159.
43. Heid CA, Stevens J, Livak KJ, Williams PM. Real
time quantitative PCR. Genome Res. 1996;6:
986-994.
44. Clay D, Rubinstein E, Mishal Z, et al. CD9 and
megakaryocyte differentiation. Blood. 2001;97:
1982-1989.
45. Higuchi T, Koike K, Sawai N, et al. Megakaryo-
cytes derived from CD34-positive cord blood cells
produce interleukin-8. Br J Haematol. 1997;99:
509-516.
46. Majka M, Janowska-Wieczorek A, Ratajczak J, et
al. Numerous growth factors, cytokines, and che-
mokines are secreted by human CD34(1) cells,
myeloblasts, erythroblasts, and megakaryoblasts
and regulate normal hematopoiesis in an auto-
crine/paracrine manner. Blood. 2001;97:3075-
3085.
47. Gewirtz AM, Zhang J, Ratajczak J, et al. Chemo-
kine regulation of human megakaryocytopoiesis.
Blood. 1995;86:2559-2567.
48. Daly TJ, LaRosa GJ, Dolich S, Maione TE, Coo-
per S, Broxmeyer HE. High activity suppression
of myeloid progenitor proliferation by chimeric
mutants of interleukin 8 and platelet factor 4.
J Biol Chem. 1995;270:23282-23292.
49. Corre I, Pineau D, Hermouet S. Interleukin-8: an
autocrine/paracrine growth factor for human he-
matopoietic progenitors acting in synergy with
colony stimulating factor-1 to promote monocyte-
macrophage growth and differentiation. Exp He-
matol. 1999;27:28-36.
50. Ratajczak J, Ratajczak MZ. In vitro study about
the influence of recombinant interleukin-8 on hu-
man hematopoiesis [in Polish]. Acta Haematol
Pol. 1994;25:269-275.
51. Devalaraja MN, Richmond A. Multiple chemotac-
tic factors: fine control or redundancy? Trends
Pharmacol Sci. 1999;20:151-156.
52. Feniger-Barish R, Belkin D, Zaslaver A, et al.
GCP-2-induced internalization of IL-8 receptors:
hierarchical relationships between GCP-2 and
other ELR(1)-CXC chemokines and mechanisms
regulating CXCR2 internalization and recycling.
Blood. 2000;95:1551-1559.
53. Hermouet S, Godard A, Pineau D, et al. Abnormal
production of interleukin (IL)-11 and IL-8 in poly-
cythaemia vera. Cytokine. 2002;20:178-183.
54. Dudek AZ, Nesmelova I, Mayo K, Verfaillie CM,
Pitchford S, Slungaard A. Platelet factor 4 pro-
motes adhesion of hematopoietic progenitor cells
and binds IL-8: novel mechanisms for modulation
of hematopoiesis. Blood. 2003;101:4687-4694.
55. Rosenstingl S, Brouland JP, Zini JM, Tobelem G,
Dupuy E. Mixed myelodysplastic syndrome and
myeloproliferative disorder with bone marrow and
pulmonary fibrosis: the role of megakaryocytes.
Acta Haematol. 2003;109:145-149.
56. Rueda F, Pinol G, Marti F, Pujol-Moix N. Abnor-
mal levels of platelet-specific proteins and mito-
genic activity in myeloproliferative disease. Acta
Haematol. 1991;85:12-15.
57. Gilbert HS, Praloran V, Stanley ER. Increased
circulating CSF-1 (M-CSF) in myeloproliferative
disease: association with myeloid metaplasia and
peripheral bone marrow extension. Blood. 1989;
74:1231-1234.
58. Le Bousse-Kerdiles MC, Chevillard S, Charpen-
tier A, et al. Differential expression of transform-
ing growth factor-beta, basic fibroblast growth
factor, and their receptors in CD341 hematopoi-
etic progenitor cells from patients with myelofibro-
sis and myeloid metaplasia. Blood. 1996;88:
4534-4546.
59. Rameshwar P, Denny TN, Stein D, Gascon P.
Monocyte adhesion in patients with bone marrow
fibrosis is required for the production of fibrogenic
cytokines: potential role for interleukin-1 and
TGF-beta. J Immunol. 1994;153:2819-2830.
Erratum
In the response letter by Arbab et al entitled “Feride–protamine sulfate
labeling does not alter differentiation of mesenchymal stem cells,” which
appeared in the November 15, 2004, issue of Blood (Volume 104:3412-
3413), the title’s first word was incorrect. The title should read “Ferumoxide–
protamine sulfate labeling does not alter differentiation of mesenchymal stem
cells.”
IL-8, CXCR1, AND CXCR2 IN MYELOFIBROSIS 473BLOOD, 15 JANUARY 2005 z VOLUME 105, NUMBER 2
For personal use only. at INSERM DISC on February 23, 2011. www.bloodjournal.orgFrom
2/ Augmentation d’expression du gène HMGA2 dans les leucocytes et les progéniteurs hématopoiètiques CD34+ de patients atteints de myélofibrose primitive
« Expression of HMGA2 in PB leukocytes and purified CD34+ cells from controls and
patients with Myelofibrosis and myeloid metaplasia ».
Andrieux J, Bilhou-Nabera C, Lippert E, Le Bousse-Kerdiles MC, Dupriez B, Grardel
N, Pierre-Louis O, Desterke C, Praloran V, Laï JL, Demory JL.
Leuk Lymphoma. 2006 Sep;47(9):1956-9.
HMGA2 (High-mobility group AT-hook 2) est un facteur architectural appartenant au
complexe protéique « enhancesome » qui se fixe sur la région « enhancer » du promoteur
d’un gène. Cette fixation a pour conséquence d’accélérer la transcription du gène concerné.
Des réarrangements du gène HMGA2 sont associés aux lipomes.
Au cours de ce travail, réalisé en collaboration avec Joris Andrieux et Jean-Loup
Demory, des réarrangements en région chromosomique 12q comprenant le locus du gène
HMGA2 ont été détectés chez les patients atteints de MFP. Des modifications quantitatives en
12q ont été également retrouvées par CGH-array BAC. Au cours de ce travail, nous avons mis
en évidence une augmentation significative de l’expression de HMGA2 dans les progéniteurs
hématopoïétiques et les granulocytes de patients atteints de MFP. L’ensemble de ces résultats
suggère une possible implication de HMGA2 dans la pathogenèse de la maladie.
227

LETTER TO THE EDITOR
Expression of HMGA2 in PB leukocytes and purified
CD34+cells from controls and patients with Myelofibrosis and
myeloid metaplasia
JORIS ANDRIEUX1,2, CHRYSTELE BILHOU-NABERA3, ERIC LIPPERT3,
MARIE-CAROLINE LE BOUSSE-KERDILES4, BRIGITTE DUPRIEZ5,
NATHALIE GRARDEL6, OLIVIER PIERRE-LOUIS3, CHRISTOPHE DESTERKE4,
VINCENT PRALORAN3, JEAN LUC LAI1,2, & JEAN-LOUP DEMORY7
1INSERM Unite 524, Institut de Recherche sur le Cancer de Lille, Lille, France,
2Laboratoire de Genetique Medicale, Hopital
Jeanne de Flandre, CHRU de Lille, France,3Laboratoire d’Hematologie, CHU de Bordeaux, France,
4INSERM U602,
Hopital Paul Brousse, Villejuif, France,5Service des Maladies du Sang, CHRU de Lille, France,
6Service d’Hematologie,
Hopital Calmette, CHRU de Lille, France, and7Departement d’Hematologie, Universite Catholique de Lille, France
(Received 10 November 2005; accepted 6 March 2006)
Introduction
Myelofibrosis with myeloıd metaplasia (MMM) is a
rare myeloproliferative disorder which associates
clonal proliferation of multi-potent hematologic
progenitors and reactive fibrosis [1]. The karyotype
performed on bone marrow (BM) or peripheral
blood (PB) progenitors is abnormal in 40% of the
cases [2,3]. Some patients exhibit 12q rearrange-
ments [4]: a previous analysis of two such patients
using BAC-FISH and RT-PCR lead to demonstrate
an expression of the embryonic gene HMGA2.
Transcripts of HMGA2 were also found in purified
mononuclear blood cells from 10 additional MMM
patients bearing no visible 12q alteration [5]. The
next step was, thus, to quantify the expression of the
gene and look for correlation with the other
biological features of the disease and to test selected
cellular populations with a special interest to CD34þ
progenitors, high blood concentrations of those cells
being a hallmark of MMM [6].
Material and methods
We studied 24 patients diagnosed as primary
MMM according to the set of criteria recently
updated through an Italian Consensus Conference
[7]. Besides, we required a blood monocytosis
51.109 l71 to avoid possible confusion with Chronic
myelomonocytic leukemia. Patients were orally in-
formed of the research purpose and agreed for the test
to be performed on the blood drawn for routine
monitoring of their disease. Six volunteers free from
hematologic malignancy were used as controls.
We also studied purified sub-sets of CD34þ cells:
eight samples were isolated from the PB of MMM
patients, seven CD34þ cell samples were purified
from the BM of consenting subjects undergoing
surgery for hip replacement.
Total RNA was isolated from the leukocytes
separated on Ficoll gradients. The RNAwas extracted
using High Pure RNA Isolation Kit (Roche, Ger-
many) according to the manufacturer’s instructions.
Reverse transcription was done using Oligo(dT)12 – 18primer (Invitrogen, USA) and SuperSciptTM II Rnase
H7 Reverse Transcriptase according to the manufac-
turer’s instructions (Invitrogen, USA).
CD34þ cells were isolated by MACS immuno-
magnetic method; granulocytic cells were recovered
from Ficoll separation tubes after lysis of the
erythrocyte pellets and controlled by CD15 labelling
490 – 95%. Real-time quantitative RT-PCR was
performed using the Taq-Man core reagents (Ap-
plied biosystems) according to the manufacturer’s
Correspondence: Dr J. Andrieux, Laboratoire de Genetique Medicale, Hopital Jeanne de Flandre, Barre Nord CHRU, 2 Avenue Oscar Lambret, 59037 Lille
Cedex, France. E-mail: [email protected]
Leukemia & Lymphoma, September 2006; 47(9): 1956 – 1959
ISSN 1042-8194 print/ISSN 1029-2403 online Ó 2006 Informa UK Ltd.
DOI: 10.1080/10428190600687596
Leu
k L
ym
phom
a D
ow
nlo
aded
fro
m i
nfo
rmah
ealt
hca
re.c
om
by I
NS
ER
M o
n 0
2/2
3/1
1F
or
per
sonal
use
only
.
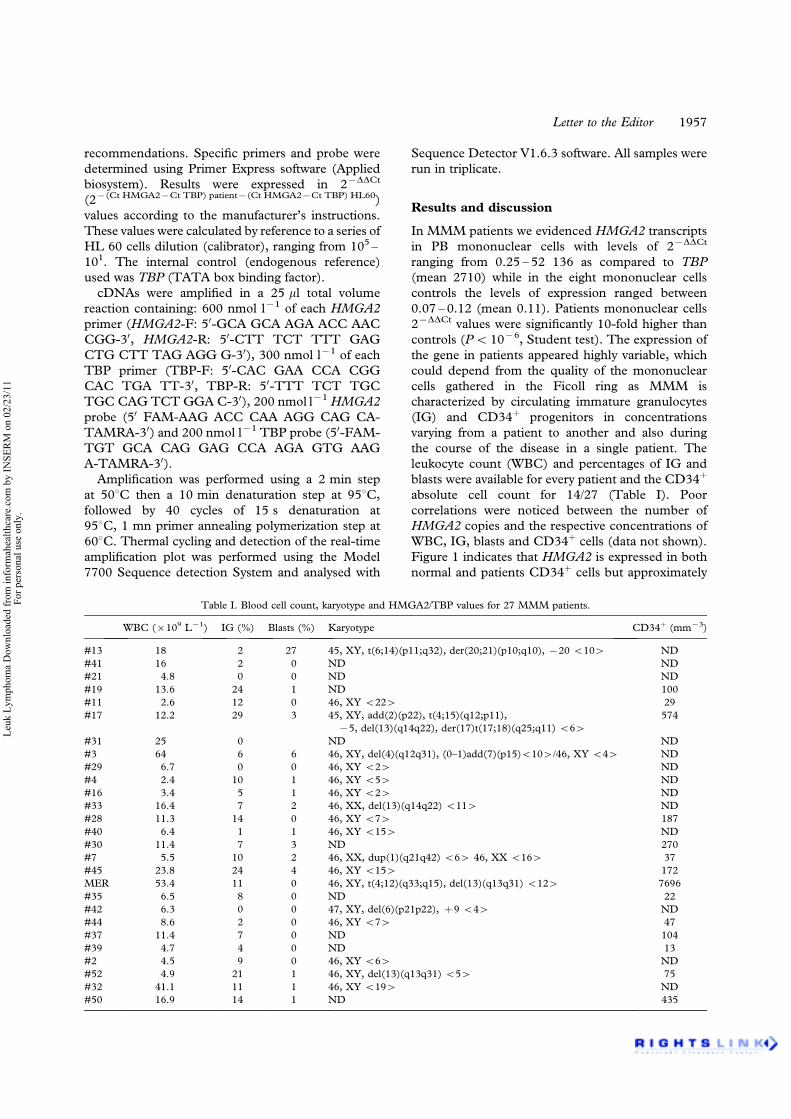
recommendations. Specific primers and probe were
determined using Primer Express software (Applied
biosystem). Results were expressed in 27DDCt
(27(Ct HMGA27Ct TBP) patient7(Ct HMGA27Ct TBP) HL60)
values according to the manufacturer’s instructions.
These values were calculated by reference to a series of
HL 60 cells dilution (calibrator), ranging from 105 –
101. The internal control (endogenous reference)
used was TBP (TATA box binding factor).
cDNAs were amplified in a 25 ml total volume
reaction containing: 600 nmol l71 of each HMGA2
primer (HMGA2-F: 50-GCA GCA AGA ACC AAC
CGG-30, HMGA2-R: 50-CTT TCT TTT GAG
CTG CTT TAG AGG G-30), 300 nmol l71 of each
TBP primer (TBP-F: 50-CAC GAA CCA CGG
CAC TGA TT-30, TBP-R: 50-TTT TCT TGC
TGC CAG TCT GGA C-30), 200 nmol l71HMGA2
probe (50 FAM-AAG ACC CAA AGG CAG CA-
TAMRA-30) and 200 nmol l71 TBP probe (50-FAM-
TGT GCA CAG GAG CCA AGA GTG AAG
A-TAMRA-30).
Amplification was performed using a 2 min step
at 508C then a 10 min denaturation step at 958C,
followed by 40 cycles of 15 s denaturation at
958C, 1 mn primer annealing polymerization step at
608C. Thermal cycling and detection of the real-time
amplification plot was performed using the Model
7700 Sequence detection System and analysed with
Sequence Detector V1.6.3 software. All samples were
run in triplicate.
Results and discussion
In MMM patients we evidenced HMGA2 transcripts
in PB mononuclear cells with levels of 27DDCt
ranging from 0.25 – 52 136 as compared to TBP
(mean 2710) while in the eight mononuclear cells
controls the levels of expression ranged between
0.07 – 0.12 (mean 0.11). Patients mononuclear cells
27DDCt values were significantly 10-fold higher than
controls (P5 1076, Student test). The expression of
the gene in patients appeared highly variable, which
could depend from the quality of the mononuclear
cells gathered in the Ficoll ring as MMM is
characterized by circulating immature granulocytes
(IG) and CD34þ progenitors in concentrations
varying from a patient to another and also during
the course of the disease in a single patient. The
leukocyte count (WBC) and percentages of IG and
blasts were available for every patient and the CD34þ
absolute cell count for 14/27 (Table I). Poor
correlations were noticed between the number of
HMGA2 copies and the respective concentrations of
WBC, IG, blasts and CD34þ cells (data not shown).
Figure 1 indicates that HMGA2 is expressed in both
normal and patients CD34þ cells but approximately
Table I. Blood cell count, karyotype and HMGA2/TBP values for 27 MMM patients.
WBC (6109 L71) IG (%) Blasts (%) Karyotype CD34þ (mm73)
#13 18 2 27 45, XY, t(6;14)(p11;q32), der(20;21)(p10;q10), 720 5104 ND
#41 16 2 0 ND ND
#21 4.8 0 0 ND ND
#19 13.6 24 1 ND 100
#11 2.6 12 0 46, XY 5224 29
#17 12.2 29 3 45, XY, add(2)(p22), t(4;15)(q12;p11),
75, del(13)(q14q22), der(17)t(17;18)(q25;q11) 564
574
#31 25 0 ND ND
#3 64 6 6 46, XY, del(4)(q12q31), (0–1)add(7)(p15)5104/46, XY 544 ND
#29 6.7 0 0 46, XY 524 ND
#4 2.4 10 1 46, XY 554 ND
#16 3.4 5 1 46, XY 524 ND
#33 16.4 7 2 46, XX, del(13)(q14q22) 5114 ND
#28 11.3 14 0 46, XY 574 187
#40 6.4 1 1 46, XY 5154 ND
#30 11.4 7 3 ND 270
#7 5.5 10 2 46, XX, dup(1)(q21q42) 564 46, XX 5164 37
#45 23.8 24 4 46, XY 5154 172
MER 53.4 11 0 46, XY, t(4;12)(q33;q15), del(13)(q13q31) 5124 7696
#35 6.5 8 0 ND 22
#42 6.3 0 0 47, XY, del(6)(p21p22), þ 9 544 ND
#44 8.6 2 0 46, XY 574 47
#37 11.4 7 0 ND 104
#39 4.7 4 0 ND 13
#2 4.5 9 0 46, XY 564 ND
#52 4.9 21 1 46, XY, del(13)(q13q31) 554 75
#32 41.1 11 1 46, XY 5194 ND
#50 16.9 14 1 ND 435
Letter to the Editor 1957
Leu
k L
ym
phom
a D
ow
nlo
aded
fro
m i
nfo
rmah
ealt
hca
re.c
om
by I
NS
ER
M o
n 0
2/2
3/1
1F
or
per
sonal
use
only
.
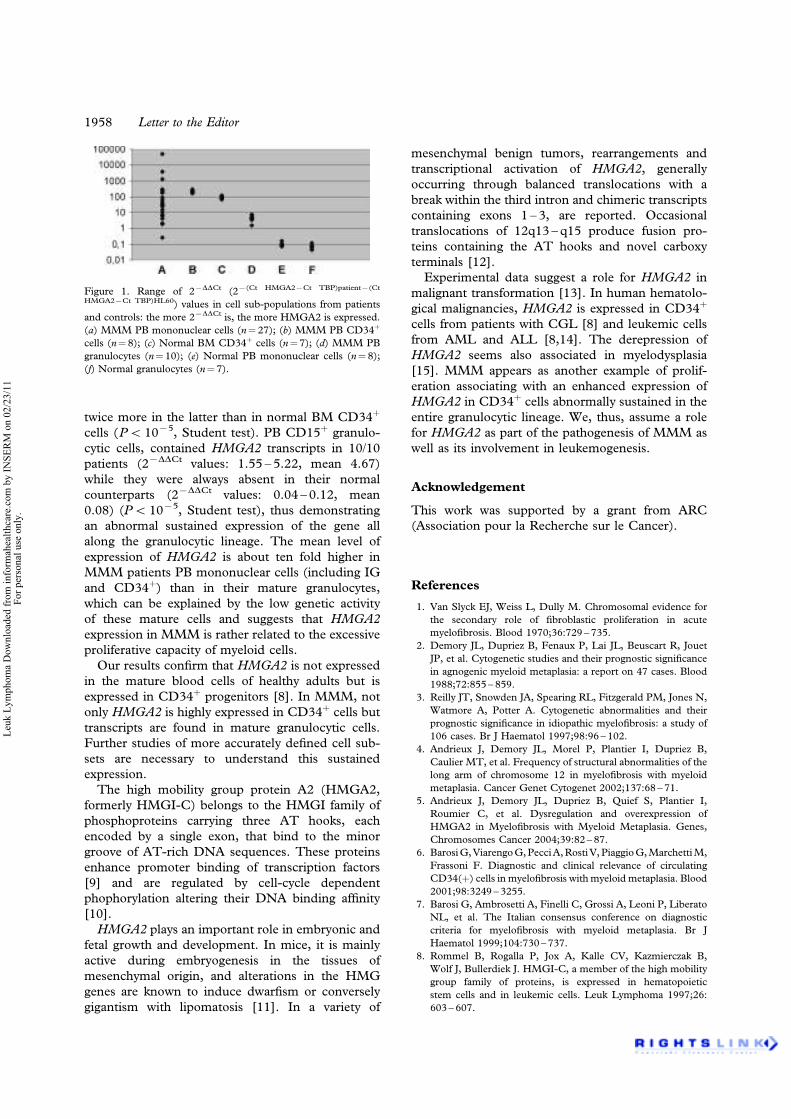
twice more in the latter than in normal BM CD34þ
cells (P5 1075, Student test). PB CD15þ granulo-
cytic cells, contained HMGA2 transcripts in 10/10
patients (27DDCt values: 1.55 – 5.22, mean 4.67)
while they were always absent in their normal
counterparts (27DDCt values: 0.04 – 0.12, mean
0.08) (P5 1075, Student test), thus demonstrating
an abnormal sustained expression of the gene all
along the granulocytic lineage. The mean level of
expression of HMGA2 is about ten fold higher in
MMM patients PB mononuclear cells (including IG
and CD34þ) than in their mature granulocytes,
which can be explained by the low genetic activity
of these mature cells and suggests that HMGA2
expression in MMM is rather related to the excessive
proliferative capacity of myeloid cells.
Our results confirm that HMGA2 is not expressed
in the mature blood cells of healthy adults but is
expressed in CD34þ progenitors [8]. In MMM, not
only HMGA2 is highly expressed in CD34þ cells but
transcripts are found in mature granulocytic cells.
Further studies of more accurately defined cell sub-
sets are necessary to understand this sustained
expression.
The high mobility group protein A2 (HMGA2,
formerly HMGI-C) belongs to the HMGI family of
phosphoproteins carrying three AT hooks, each
encoded by a single exon, that bind to the minor
groove of AT-rich DNA sequences. These proteins
enhance promoter binding of transcription factors
[9] and are regulated by cell-cycle dependent
phophorylation altering their DNA binding affinity
[10].
HMGA2 plays an important role in embryonic and
fetal growth and development. In mice, it is mainly
active during embryogenesis in the tissues of
mesenchymal origin, and alterations in the HMG
genes are known to induce dwarfism or conversely
gigantism with lipomatosis [11]. In a variety of
mesenchymal benign tumors, rearrangements and
transcriptional activation of HMGA2, generally
occurring through balanced translocations with a
break within the third intron and chimeric transcripts
containing exons 1 – 3, are reported. Occasional
translocations of 12q13 – q15 produce fusion pro-
teins containing the AT hooks and novel carboxy
terminals [12].
Experimental data suggest a role for HMGA2 in
malignant transformation [13]. In human hematolo-
gical malignancies, HMGA2 is expressed in CD34þ
cells from patients with CGL [8] and leukemic cells
from AML and ALL [8,14]. The derepression of
HMGA2 seems also associated in myelodysplasia
[15]. MMM appears as another example of prolif-
eration associating with an enhanced expression of
HMGA2 in CD34þ cells abnormally sustained in the
entire granulocytic lineage. We, thus, assume a role
for HMGA2 as part of the pathogenesis of MMM as
well as its involvement in leukemogenesis.
Acknowledgement
This work was supported by a grant from ARC
(Association pour la Recherche sur le Cancer).
References
1. Van Slyck EJ, Weiss L, Dully M. Chromosomal evidence for
the secondary role of fibroblastic proliferation in acute
myelofibrosis. Blood 1970;36:729 – 735.
2. Demory JL, Dupriez B, Fenaux P, Lai JL, Beuscart R, Jouet
JP, et al. Cytogenetic studies and their prognostic significance
in agnogenic myeloid metaplasia: a report on 47 cases. Blood
1988;72:855 – 859.
3. Reilly JT, Snowden JA, Spearing RL, Fitzgerald PM, Jones N,
Watmore A, Potter A. Cytogenetic abnormalities and their
prognostic significance in idiopathic myelofibrosis: a study of
106 cases. Br J Haematol 1997;98:96 – 102.
4. Andrieux J, Demory JL, Morel P, Plantier I, Dupriez B,
Caulier MT, et al. Frequency of structural abnormalities of the
long arm of chromosome 12 in myelofibrosis with myeloid
metaplasia. Cancer Genet Cytogenet 2002;137:68 – 71.
5. Andrieux J, Demory JL, Dupriez B, Quief S, Plantier I,
Roumier C, et al. Dysregulation and overexpression of
HMGA2 in Myelofibrosis with Myeloid Metaplasia. Genes,
Chromosomes Cancer 2004;39:82 – 87.
6. BarosiG,ViarengoG,PecciA,RostiV,PiaggioG,MarchettiM,
Frassoni F. Diagnostic and clinical relevance of circulating
CD34(þ) cells in myelofibrosis with myeloid metaplasia. Blood
2001;98:3249 – 3255.
7. Barosi G, Ambrosetti A, Finelli C, Grossi A, Leoni P, Liberato
NL, et al. The Italian consensus conference on diagnostic
criteria for myelofibrosis with myeloid metaplasia. Br J
Haematol 1999;104:730 – 737.
8. Rommel B, Rogalla P, Jox A, Kalle CV, Kazmierczak B,
Wolf J, Bullerdiek J. HMGI-C, a member of the high mobility
group family of proteins, is expressed in hematopoietic
stem cells and in leukemic cells. Leuk Lymphoma 1997;26:
603 – 607.
Figure 1. Range of 27DDCt (27(Ct HMGA27Ct TBP)patient7(Ct
HMGA27Ct TBP)HL60) values in cell sub-populations from patients
and controls: the more 27DDCt is, the more HMGA2 is expressed.
(a) MMM PB mononuclear cells (n¼ 27); (b) MMM PB CD34þ
cells (n¼8); (c) Normal BM CD34þ cells (n¼7); (d) MMM PB
granulocytes (n¼10); (e) Normal PB mononuclear cells (n¼ 8);
(f) Normal granulocytes (n¼ 7).
1958 Letter to the Editor
Leu
k L
ym
phom
a D
ow
nlo
aded
fro
m i
nfo
rmah
ealt
hca
re.c
om
by I
NS
ER
M o
n 0
2/2
3/1
1F
or
per
sonal
use
only
.
9. Mantovani F, Covaceuszach S, Rustighi A, Sgarra R, Heath C,
Goodwin GH, Manfioletti G. NF-kappaB mediated transcrip-
tional activation is enhanced by the architectural factor
HMGI-C. Nucleic Acids Res 1998;26:1433 – 1439.
10. Diana F, Sgarra R, Manfioletti G, Rustighi A, Poletto D,
Sciortino MT, et al. A link between apoptosis and degree of
phosphorylation of high mobility group A1a protein in
leukemic cells. J Biol Chem 2001;276:11354 – 11361.
11. Battista S, Fidanza V, Fedele M, Klein-Szanto AJ, Outwater
E, Brunner H, et al. The expression of a truncated HMGI-C
gene induces gigantism associated with lipomatosis. Cancer
Res 1999;59:4793 – 4797.
12. Ashar HR, Fejzo MS, Tkachenko A, Zhou X, Fletcher JA,
Weremowicz S, et al. Disruption of the architectural factor
HMGI-C: DNA-binding AT hook motifs fused in lipomas to
distinct transcriptional regulatory domains. Cell 1995;82:
57 – 65.
13. Baldassarre G, Fedele M, Battista S, Vecchione A,
Klein-Szanto AJ, Santoro M, et al. Onset of natural killer
cell lymphomas in transgenic mice carrying a truncated HMGI-
C gene by the chronic stimulation of the IL-2 and IL-15
pathway. Proc Natl Acad Sci USA 2001;98:7970 – 7975.
14. Pierantoni GM, Santulli B, Caliendo I, Pentimalli F,
Chiappetta G, Zanesi N, et al. HMGA2 locus rearrangement
in a case of acute lymphoblastic leukemia. Int J Oncol
2003;23:363 – 367.
15. Odero MD, Grand FH, Iqbal S, Ross F, Roman JP, Vizmanos
JL, et al. Disruption and aberrant expression of HMGA2 as a
consequence of diverse chromosomal translocations in mye-
loid malignancies. Leukemia 2005;19:245 – 252.
Letter to the Editor 1959
Leu
k L
ym
phom
a D
ow
nlo
aded
fro
m i
nfo
rmah
ealt
hca
re.c
om
by I
NS
ER
M o
n 0
2/2
3/1
1F
or
per
sonal
use
only
.

3/ Corrélation entre la présence de la mutation JAK2V617F et le taux de survie chez les patients atteints de MFP
« V617F mutation in JAK2 is associated with poorer survival in idiopathic
myelofibrosis ».
Campbell PJ, Griesshammer M, Döhner K, Döhner H, Kusec R, Hasselbalch HC,
Larsen TS, Pallisgaard N, Giraudier S, Le Bousse-Kerdilès MC, Desterke C, Guerton B,
Dupriez B, Bordessoule D, Fenaux P, Kiladjian JJ, Viallard JF, Brière J, Harrison CN,
Green AR, Reilly JT.
Blood. 2006 Mar 1;107(5):2098-100. Epub 2005 Nov 17
La découverte de la mutation activatrice Jak2V617F a révolutionné le diagnostic et a
favorisé une meilleure compréhension des néoplasmes myéloprolifératifs chroniques BCR-
ABL négatif.
Au cours d’une étude internationale réalisée sur une large cohorte de patients atteints de
myélofibrose primitive, il a été établit que la mutation Jak2V617F était associée à un taux de
survie plus faible.
229


NEOPLASIA
Brief report
V617F mutation in JAK2 is associated with poorer survival inidiopathic myelofibrosis
Peter J. Campbell, Martin Griesshammer, Konstanze Dohner, Hartmut Dohner, Rajko Kusec, Hans C. Hasselbalch,
Thomas Stauffer Larsen, Niels Pallisgaard, Stephane Giraudier, Marie-Caroline Le Bousse-Kerdiles, Christophe Desterke,
Bernadette Guerton, Brigitte Dupriez, Dominique Bordessoule, Pierre Fenaux, Jean-Jacques Kiladjian,
Jean-Francois Viallard, Jean Briere, Claire N. Harrison, Anthony R. Green, and John T. Reilly
Most patients with polycythemia vera and
half with idiopathic myelofibrosis and es-
sential thrombocythemia have an ac-
quired V617F mutation in JAK2. Using
sensitive polymerase chain reaction (PCR)–
based methods, we genotyped 152 pa-
tients with idiopathic myelofibrosis to es-
tablish whether there were differences in
presentation and outcome between those
with and those without the mutation. Pa-
tients positive for V617F had higher neu-
trophil and white cell counts (P 5 .02)
than did patients negative for V617F, but
other diagnostic features were compa-
rable between the 2 groups. Patients posi-
tive for V617F were less likely to require
blood transfusion during follow-up
(P 5 .03). Despite this, patients positive
for V617F had poorer overall survival,
even after correction for confounding fac-
tors (P 5 .01). (Blood. 2006;107:2098-2100)
© 2006 by The American Society of Hematology
Introduction
An acquired mutation in the JAK2 gene has recently been described in a
large proportion of patients with myeloproliferative disorders.1-4 Most
patients with polycythemia vera and about half those with idiopathic
myelofibrosis (IMF) and essential thrombocythemia have the mutation.
For patients with IMF, it is unknown whether there are differences
between patients who are V617F-positive and -negative in their
presenting features or survival. We therefore genotyped 152 patients
with IMF for the V617F mutation and correlated their JAK2 status with
diagnostic features and outcome.
Study design
The study patients were treated in 14 centers in Europe and satisfied standard
diagnostic criteria for idiopathic myelofibrosis.5 We specifically excluded pa-
tients with secondary myelofibrosis, preceding polycythemia vera, or essential
thrombocythemia and transitional myeloproliferative disorder. Sixteen patients
were included in one of the original descriptions of the JAK2 V617F mutation.1
All centers had local ethics committee approval for the research, with overall
approval from the Eastern Region Multicentre Research Ethics Committee,
United Kingdom.All patients provided informed consent, in accordance with the
Declaration of Helsinki. Information was collected on clinical and laboratory
parameters at diagnosis, together with transfusion requirements and survival
during follow-up. The Lille prognostic score was calculated as described.6
Allele-specific polymerase chain reaction (PCR) or sequencing was used to
screen genomic DNA(136 patients) or cDNA(16 patients) from peripheral blood
or marrow, using previously published protocols.1,7 Diagnostic variables were
compared between patients who were V617F-positive and V617F-negative using
the Wilcoxon rank-sum test for continuous variables and Pearson chi-squared test
for categorical variables. Multivariate survival analysis was performed using Cox
proportional hazards techniques.8 The same Cox model resulted from both
forward stepwise and backward elimination approaches.
Results and discussion
We screened 152 samples from patients with IMF for JAK2 V617F
using allele-specific PCR1 or sequencing. In total, 83 patients were
positive for the mutation, giving an overall frequency of the
mutation of 54.6% (95% confidence interval, 50.7%-58.5%).
From the Department of Haematology, University of Cambridge, United
Kingdom; the Department of Internal Medicine III, University of Ulm, Germany;
the Department of Haematology and Clinical Chemistry, Merkur University
Hospital, Zagreb, Croatia; the Department of Haematology and Pathology,
Odense University Hospital, Denmark; the Institut National de la Sante et de la
Recherche Medicale (INSERM) U362, Villejuif, and Laboratoire d’Hematologie,
Henri Mondor Hospital, Creteil; INSERM U602, Villejuif, France; the
Hematologie Clinique, Centre Hospitalier de Lens; the Hematologie Clinique,
Center Hospitalier Regional Universitaire (CHRU) Limoges; the Hematologie
Clinique, Hopital Avicenne, Bobigny; the Hopital du Haut-Leveque, Pessac; the
Department of Hematology, Hopital Beaujon, Clichy, France; the Department of
Haematology, St Thomas’s Hospital, London, United Kingdom; and the
Department of Haematology, Royal Hallamshire Hospital, Sheffield, United
Kingdom.
Submitted August 22, 2005; accepted October 19, 2005. Prepublished online
as Blood First Edition Paper, November 17, 2005; DOI 10.1182/blood-2005-08-
3395.
Supported by research grants from the Leukaemia Research Fund, United
Kingdom (P.J.C., A.R.G., and J.T.R.).
P.J.C. contributed patient samples, clinical data, and genotype analyses, as
well as performing the statistical analyses and drafting the manuscript. M.G.,
K.D., H.D., S.G., M.-C.L.B.-K., C.D., B.G., C.N.H., and A.R.G. contributed
patient samples, clinical data, and genotype analyses. B.D., D.B., P.F., J.-J.K.,
J.-F.V., J.B., R.K., H.C.H., T.S.L., and N.P. contributed patient samples and
clinical data. J.T.R. contributed patient samples, clinical data, and genotype
analyses, as well as directing and coordinating the research. All authors have
reviewed and contributed to the manuscript.
Reprints: John T. Reilly, Department of Haematology, Royal Hallamshire
Hospital, Glossop Rd, Sheffield S10 2JF, United Kingdom; e-mail:
The publication costs of this article were defrayed in part by page charge
payment. Therefore, and solely to indicate this fact, this article is hereby
marked ‘‘advertisement’’ in accordance with 18 U.S.C. section 1734.
© 2006 by The American Society of Hematology
2098 BLOOD, 1 MARCH 2006 z VOLUME 107, NUMBER 5
For personal use only. at INSERM DISC on February 23, 2011. www.bloodjournal.orgFrom

Diagnostic clinical and laboratory features were compared
between patients who were V617F-positive and -negative (Table 1).
There were no significant differences in age, sex, hemoglobin
levels, platelet count, peripheral blood blast counts, and spleen
size. Similarly, there were no differences in lactate dehydrogenase
(LDH) levels, CD34 counts, or frequency of abnormal karyotype,
although data were only available on these variables for 48, 43, and
71 patients, respectively. In contrast, patients positive for V617F
had significantly higher white cell counts than patients negative for
V617F (median, 10.0 versus 7.2 3 109/L; P 5 .02) and signifi-
cantly higher neutrophil counts (median, 7.7 versus 4.7 3 109/L;
P 5 .02). This fact meant that the Lille prognostic scores tended to
be lower (indicating better prognostic group) for patients positive
for V617F (P 5 .06).
Patients positive for V617F were significantly less likely to
require blood transfusions during follow-up than patients negative
for V617F (Table 1). Of 78 patients positive for V617F in whom
data were available, 47 (60%) did not require transfusions,
compared with 25 (42%) of 60 patients negative for V617F (P 5 .03).
Patients positive for V617F had worse survival. With a median
38 months of follow-up, 17 patients positive for V617F and
12 patients negative for V617F died. To explore whether this
apparent difference was due to the V617F mutation or explained
by other potential confounding factors, we fitted multivariate
Cox proportional hazards models for 110 patients from whom
full clinical data were available (Table 2). When the effects of
age and hemoglobin level were controlled for, patients positive
for V617F had significantly poorer survival than patients
negative for V617F (adjusted hazard ratio, 3.30; 95% confidence
interval, 1.26-8.68; P 5 .01). Sex, Lille prognostic score, spleen
Table 1. Laboratory and clinical features at diagnosis of idiopathic myelofibrosis analyzed by presence or absence of the JAK2 V617F mutation
JAK2 V617F JAK2 wild-type P
Total, no. 83 69
Percentage (95% CI) 54.6 (50.7-58.5) 45.4 (41.5-49.3)
Demographics
Male, no. (%) 44 (53) 42 (61) .3
Female, no. (%) 39 (47) 27 (39)
Median age, y (10th-90th centile) 64 (48-77) 62 (43-77) .3
Laboratory and clinical features at diagnosis
LDH, U/L .9
Mean 6 SD 546 6 374 501 6 358
Median (10th-90th centile) 440 (182-939) 451 (214-764)
CD34, 3 106/L .9
Mean 6 SD 568 6 724 620 6 840
Median (10th-90th centile) 292 (67-1332) 222 (22-1345)
Blast cell count, 3 109/L .5
Mean 6 SD 0.25 6 0.85 0.29 6 0.71
Median (10th-90th centile) 0.02 (0-0.56) 0.06 (0-0.67)
Hemoglobin level, g/L .1
Mean 6 SD 110 6 24 104 6 22
Median (10th-90th centile) 109 (73-139) 100 (81-132)
White cell count, 3 109/L .02
Mean 6 SD 15.3 6 15.4 10.1 6 7.9
Median (10th-90th centile) 10.0 (4.0-32.9) 7.2 (2.5-21.1)
Neutrophil count, 3 109/L .02
Mean 6 SD 13.1 6 15.7 8.1 6 12.1
Median (10th-90th centile) 7.7 (2.9-23.7) 4.7 (1.8-16.1)
Platelet count, 3 109/L .3
Mean 6 SD 312 6 252 254 6 203
Median (10th-90th centile) 227 (51-723) 232 (48-494)
Spleen size, cm .7
Mean 6 SD 6.7 6 5.2 7.4 6 6.0
Median (10th-90th centile) 7.0 (0-14.0) 5.0 (0-15.0)
Cytogenetics, no. .8
Normal 18 22
Abnormal 16 15
Lille score, no. .06
0 36 17
1 23 28
2 6 5
Transfusion required during follow-up, no. .03
None 47 25
Intermittent or regular 31 35
Table 2. Cox proportional hazards model of factors independently
predictive of overall survival in myelofibrosis cohort
Variable Adjusted hazard ratio 95% confidence interval P
Hemoglobin level* 0.74 0.60-0.91 .004
Age† 1.61 1.10-2.36 .01
V617F 3.30 1.26-8.68 .01
Variables not independently associated with survival were sex, Lille prognostic
score, white cell count, platelet count, and spleen size.
*Hazard ratio refers to proportional decrease in hazard ratio per 10 g/L (1 g/dL)
increase in hemoglobin level at diagnosis.
†Hazard ratio refers to proportional increase in hazard ratio per 10-year increase
in age.
V617F-POSITIVE MYELOFIBROSIS HAS POORER SURVIVAL 2099BLOOD, 1 MARCH 2006 z VOLUME 107, NUMBER 5
For personal use only. at INSERM DISC on February 23, 2011. www.bloodjournal.orgFrom
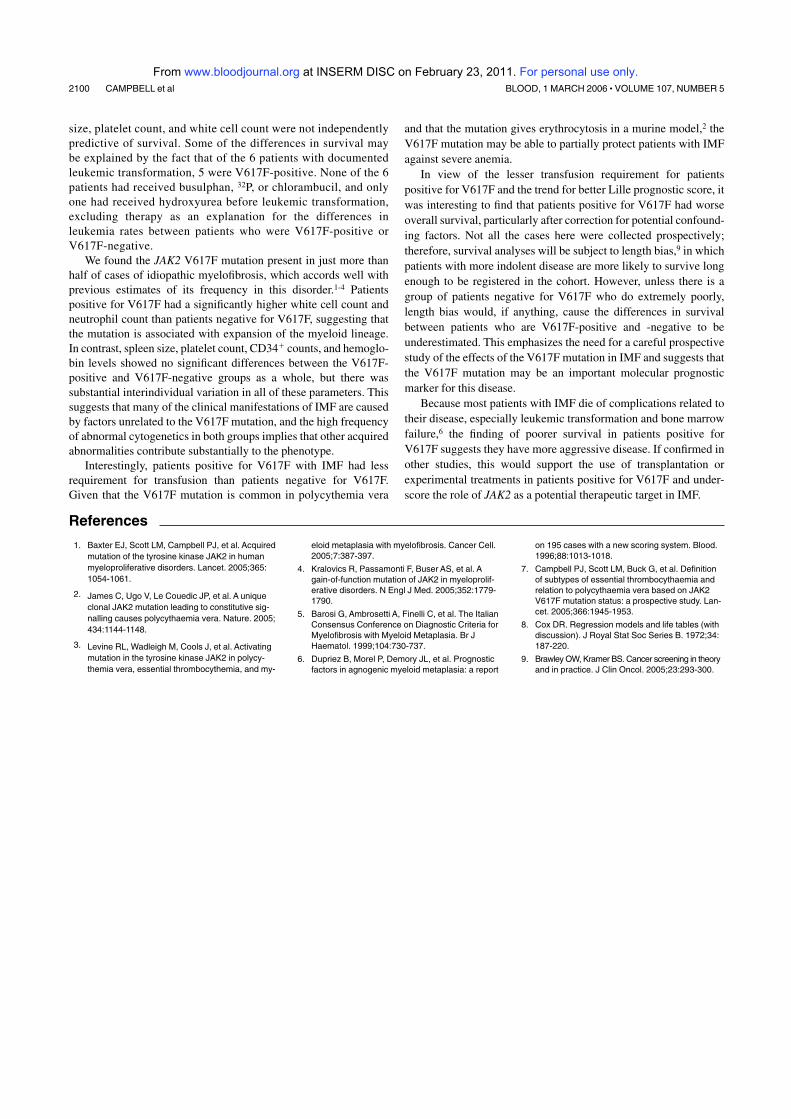
size, platelet count, and white cell count were not independently
predictive of survival. Some of the differences in survival may
be explained by the fact that of the 6 patients with documented
leukemic transformation, 5 were V617F-positive. None of the 6
patients had received busulphan, 32P, or chlorambucil, and only
one had received hydroxyurea before leukemic transformation,
excluding therapy as an explanation for the differences in
leukemia rates between patients who were V617F-positive or
V617F-negative.
We found the JAK2 V617F mutation present in just more than
half of cases of idiopathic myelofibrosis, which accords well with
previous estimates of its frequency in this disorder.1-4 Patients
positive for V617F had a significantly higher white cell count and
neutrophil count than patients negative for V617F, suggesting that
the mutation is associated with expansion of the myeloid lineage.
In contrast, spleen size, platelet count, CD341 counts, and hemoglo-
bin levels showed no significant differences between the V617F-
positive and V617F-negative groups as a whole, but there was
substantial interindividual variation in all of these parameters. This
suggests that many of the clinical manifestations of IMF are caused
by factors unrelated to the V617F mutation, and the high frequency
of abnormal cytogenetics in both groups implies that other acquired
abnormalities contribute substantially to the phenotype.
Interestingly, patients positive for V617F with IMF had less
requirement for transfusion than patients negative for V617F.
Given that the V617F mutation is common in polycythemia vera
and that the mutation gives erythrocytosis in a murine model,2 the
V617F mutation may be able to partially protect patients with IMF
against severe anemia.
In view of the lesser transfusion requirement for patients
positive for V617F and the trend for better Lille prognostic score, it
was interesting to find that patients positive for V617F had worse
overall survival, particularly after correction for potential confound-
ing factors. Not all the cases here were collected prospectively;
therefore, survival analyses will be subject to length bias,9 in which
patients with more indolent disease are more likely to survive long
enough to be registered in the cohort. However, unless there is a
group of patients negative for V617F who do extremely poorly,
length bias would, if anything, cause the differences in survival
between patients who are V617F-positive and -negative to be
underestimated. This emphasizes the need for a careful prospective
study of the effects of the V617F mutation in IMF and suggests that
the V617F mutation may be an important molecular prognostic
marker for this disease.
Because most patients with IMF die of complications related to
their disease, especially leukemic transformation and bone marrow
failure,6 the finding of poorer survival in patients positive for
V617F suggests they have more aggressive disease. If confirmed in
other studies, this would support the use of transplantation or
experimental treatments in patients positive for V617F and under-
score the role of JAK2 as a potential therapeutic target in IMF.
References
1. Baxter EJ, Scott LM, Campbell PJ, et al. Acquired
mutation of the tyrosine kinase JAK2 in human
myeloproliferative disorders. Lancet. 2005;365:
1054-1061.
2. James C, Ugo V, Le Couedic JP, et al. A unique
clonal JAK2 mutation leading to constitutive sig-
nalling causes polycythaemia vera. Nature. 2005;
434:1144-1148.
3. Levine RL, Wadleigh M, Cools J, et al. Activating
mutation in the tyrosine kinase JAK2 in polycy-
themia vera, essential thrombocythemia, and my-
eloid metaplasia with myelofibrosis. Cancer Cell.
2005;7:387-397.
4. Kralovics R, Passamonti F, Buser AS, et al. A
gain-of-function mutation of JAK2 in myeloprolif-
erative disorders. N Engl J Med. 2005;352:1779-
1790.
5. Barosi G, Ambrosetti A, Finelli C, et al. The Italian
Consensus Conference on Diagnostic Criteria for
Myelofibrosis with Myeloid Metaplasia. Br J
Haematol. 1999;104:730-737.
6. Dupriez B, Morel P, Demory JL, et al. Prognostic
factors in agnogenic myeloid metaplasia: a report
on 195 cases with a new scoring system. Blood.
1996;88:1013-1018.
7. Campbell PJ, Scott LM, Buck G, et al. Definition
of subtypes of essential thrombocythaemia and
relation to polycythaemia vera based on JAK2
V617F mutation status: a prospective study. Lan-
cet. 2005;366:1945-1953.
8. Cox DR. Regression models and life tables (with
discussion). J Royal Stat Soc Series B. 1972;34:
187-220.
9. Brawley OW, Kramer BS. Cancer screening in theory
and in practice. J Clin Oncol. 2005;23:293-300.
2100 CAMPBELL et al BLOOD, 1 MARCH 2006 z VOLUME 107, NUMBER 5
For personal use only. at INSERM DISC on February 23, 2011. www.bloodjournal.orgFrom


4/ le gène NOG, un inhibiteur des BMP, est impliqué dans un réarrangement chromosomique chez un patient atteint de myélofibrose
« Bone morphogenetic protein antagonist gene NOG is involved in myeloproliferative
disease associated with myelofibrosis. »
Andrieux J, Roche-Lestienne C, Geffroy S, Desterke C, Grardel N, Plantier I, Selleslag
D, Demory JL, Laï JL, Leleu X, Le Bousse-Kerdiles C, Vandenberghe P.
Cancer Genet Cytogenet. 2007 Oct 1;178(1):11-6
Au cours de la myélofibrose primitive, les patients développent une réaction stromale
caractérisée par une ostéosclérose, une myélofibrose et une néoangiogenèse. Les « Bone
morphogenetic proteins » (BMPs) appartiennent à un groupe de facteurs de croissance
impliqué dans l’ostéogenèse et la néoangiogenèse. Le gène NOG est un inhibiteur de ce
groupe de protéines.
Au cours de ce travail réalisé en collaboration avec Joris Andrieux et Jean-Loup
Demory, nous avons étudié l’expression des BMP et de NOG dans les cellules CD34+ de
patients atteints de MFP. Les résultats de ce travail suggèrent que, chez les patients, une
altération du gène NOG pourrait participer à la modulation d’expression des BMP et donc
contribuer au processus conduisant à la réaction stromale.
231


Bone morphogenetic protein antagonist gene NOG is involvedin myeloproliferative disease associated with myelofibrosis
Joris Andrieuxa,*, Catherine Roche-Lestiennea,b, Sandrine Geffroya, Christophe Desterkec,Nathalie Grardeld, Isabelle Plantiere, Dominik Selleslagf, Jean-Loup Demoryg,
Jean-Luc Laıa,b, Xavier Leleuh, Caroline Le Bousse-Kerdilesc, Peter Vandenberghei
aMedical Genetics Laboratory, Jeanne de Flandre Hospital, CHRU, 2 Avenue Oscar Lambret, 59037 Lille, FrancebCancer Research Institute of Lille, INSERM U817, 59000 Lille, FrancecINSERM U602, Paul-Brousse Hospital, 94807 Villejuif Cedex, France
dHematology Laboratory, Calmette Hospital, CHRU, 59000 Lille, FranceeClinical Hemtaology Service, Hospital Center of Roubaix, Roubaix, France
fHematology Department, AZ Sint-Jan, Brugge, BelgiumgHematology Department, Catholic University of Lille, Lille, France
hBlood Disorders Service, Huriez Hospital, CHRU, 59000 Lille, FranceiCME-UZ, University Hospital Leuven, Leuven, Belgium
Received 30 April 2007; received in revised form 24 May 2007; accepted 1 June 2007
Abstract In a case with secondary myelofibrosis occurring after essential thrombocythemia, cytogenetic
analysis revealed an isolated translocation t(X;17)(q27;q22) in all cells. We found that a bacterial
artificial chromosome (BAC) encompassing the breakpoint on chromosome 17 long arm contained
only one gene, NOG. We therefore investigated the occurrence of this rare breakpoint in myelopro-
liferative disorders (MPDs). We identified three more patients with a 17q abnormality in MPDs:
myelofibrosis with myeloid metaplasia (MMM); chronic myeloid leukemia positive for
t(9;22)(q34;q11) with additional t(4;17)(p15;q22) at diagnosis; and myelofibrosis complicating
polycythemia vera. All three cases exhibited a split of BACs containing NOG. The protein encoded
by NOG, noggin, acts as an antagonist to bone morphogenetic secreted protein 2 and 4 (BMP2 and
BMP4). A comparative analysis of gene expression on Agilent 22K oligonucleotide microarrays in
purified CD34þ cells from the blood of MMM patients showed significant downregulation
of BMPR2, BMPR1B, BMP2, and BMP8; upregulation of BMP3 and BMP10; and a trend to lower
expression of NOG. Thus, given that expression and release of BMPs are important in the induction
of osteosclerosis and angiogenic activity, the observed BMP deregulations could be triggered by
potential NOG genetic alterations in the four cases here described, and may contribute to the
myelofibrotic process characterized by bone marrow stromal reaction including collagen fibrosis,
osteosclerosis, and angiogenesis. Ó 2007 Elsevier Inc. All rights reserved.
1. Introduction
Myelofibrosis with myeloid metaplasia (MMM) is a rare
myeloproliferative disorder (MPD) that associates clonal
proliferation of multipotent hematologic progenitors and
reactive fibrosis. The karyotype performed on bone marrow
or peripheral blood progenitors is abnormal in less than half
the cases of MMM, with some patients exhibiting appar-
ently balanced translocations. Distinguishing the power of
analysis of cytogenetic abnormalities in the comprehension
and the identification of genetic mechanisms of the disease,
we previously documented 12q rearrangements in several
myelodysplastic syndromes patients leading to the identifi-
cation of aberrant overexpression of the embryonic gene
HMGA2 [1,2].
We first performed fluorescence in situ hybridization
(FISH) analysis in one patient who had developed myelofi-
brosis after essential thrombocythemia. This analysis
revealed an isolated rare balanced t(X;17)(q27;q22) that
could interact with the normal expression of the sole
identified gene in this region, NOG. We documented the
* Corresponding author. Tel.: þ33-3-2044-4018; fax: þ33-3-2044-
6804.
E-mail address: [email protected] (J. Andrieux).
0165-4608/07/$ e see front matter Ó 2007 Elsevier Inc. All rights reserved.
doi:10.1016/j.cancergencyto.2007.06.001
Cancer Genetics and Cytogenetics 178 (2007) 11e16
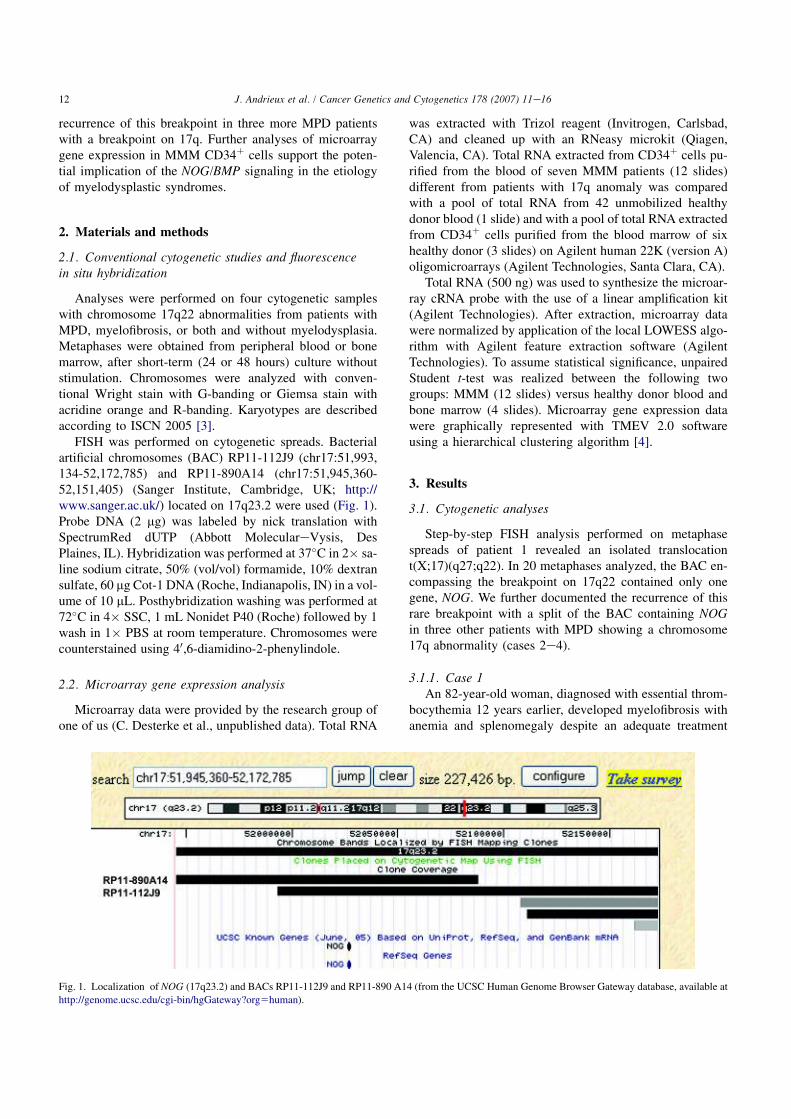
recurrence of this breakpoint in three more MPD patients
with a breakpoint on 17q. Further analyses of microarray
gene expression in MMM CD34þ cells support the poten-
tial implication of the NOG/BMP signaling in the etiology
of myelodysplastic syndromes.
2. Materials and methods
2.1. Conventional cytogenetic studies and fluorescence
in situ hybridization
Analyses were performed on four cytogenetic samples
with chromosome 17q22 abnormalities from patients with
MPD, myelofibrosis, or both and without myelodysplasia.
Metaphases were obtained from peripheral blood or bone
marrow, after short-term (24 or 48 hours) culture without
stimulation. Chromosomes were analyzed with conven-
tional Wright stain with G-banding or Giemsa stain with
acridine orange and R-banding. Karyotypes are described
according to ISCN 2005 [3].
FISH was performed on cytogenetic spreads. Bacterial
artificial chromosomes (BAC) RP11-112J9 (chr17:51,993,
134-52,172,785) and RP11-890A14 (chr17:51,945,360-
52,151,405) (Sanger Institute, Cambridge, UK; http://
www.sanger.ac.uk/) located on 17q23.2 were used (Fig. 1).
Probe DNA (2 mg) was labeled by nick translation with
SpectrumRed dUTP (Abbott MoleculareVysis, Des
Plaines, IL). Hybridization was performed at 37"C in 2# sa-
line sodium citrate, 50% (vol/vol) formamide, 10% dextran
sulfate, 60 mg Cot-1 DNA (Roche, Indianapolis, IN) in a vol-
ume of 10 mL. Posthybridization washing was performed at
72"C in 4# SSC, 1 mL Nonidet P40 (Roche) followed by 1
wash in 1# PBS at room temperature. Chromosomes were
counterstained using 40,6-diamidino-2-phenylindole.
2.2. Microarray gene expression analysis
Microarray data were provided by the research group of
one of us (C. Desterke et al., unpublished data). Total RNA
was extracted with Trizol reagent (Invitrogen, Carlsbad,
CA) and cleaned up with an RNeasy microkit (Qiagen,
Valencia, CA). Total RNA extracted from CD34þ cells pu-
rified from the blood of seven MMM patients (12 slides)
different from patients with 17q anomaly was compared
with a pool of total RNA from 42 unmobilized healthy
donor blood (1 slide) and with a pool of total RNA extracted
from CD34þ cells purified from the blood marrow of six
healthy donor (3 slides) on Agilent human 22K (version A)
oligomicroarrays (Agilent Technologies, Santa Clara, CA).
Total RNA (500 ng) was used to synthesize the microar-
ray cRNA probe with the use of a linear amplification kit
(Agilent Technologies). After extraction, microarray data
were normalized by application of the local LOWESS algo-
rithm with Agilent feature extraction software (Agilent
Technologies). To assume statistical significance, unpaired
Student t-test was realized between the following two
groups: MMM (12 slides) versus healthy donor blood and
bone marrow (4 slides). Microarray gene expression data
were graphically represented with TMEV 2.0 software
using a hierarchical clustering algorithm [4].
3. Results
3.1. Cytogenetic analyses
Step-by-step FISH analysis performed on metaphase
spreads of patient 1 revealed an isolated translocation
t(X;17)(q27;q22). In 20 metaphases analyzed, the BAC en-
compassing the breakpoint on 17q22 contained only one
gene, NOG. We further documented the recurrence of this
rare breakpoint with a split of the BAC containing NOG
in three other patients with MPD showing a chromosome
17q abnormality (cases 2e4).
3.1.1. Case 1
An 82-year-old woman, diagnosed with essential throm-
bocythemia 12 years earlier, developed myelofibrosis with
anemia and splenomegaly despite an adequate treatment
Fig. 1. Localization of NOG (17q23.2) and BACs RP11-112J9 and RP11-890 A14 (from the UCSC Human Genome Browser Gateway database, available at
http://genome.ucsc.edu/cgi-bin/hgGateway?org5human).
12 J. Andrieux et al. / Cancer Genetics and Cytogenetics 178 (2007) 11e16

with oral hydroxyurea from the year 2000 onwards. At this
stage, karyotyping performed on circulating myeloid cells
showed 46,XX,t(X;17)(q27;q22)[20]. Administration of
erythropoietin induced improvement of anemia, but the
subsequent evolution was marked by progressive appear-
ance of thrombopenia and leucopenia. In August 2004,
the differential count was suggestive of an acute transforma-
tion, with 4% circulating micromegakaryocytes and 13%
undifferentiated blasts. Bone marrow analysis confirmed
this hypothesis. FISH analysis with BAC RP11-112J9 probe
exhibited a split signal on all metaphases analyzed (Fig. 2).
3.1.2. Case 2
A 79-year-old woman was diagnosed with chronic mye-
loid leukemia in 2004. In addition to the classical
t(9;22)(q34;q11), her karyotype showed another transloca-
tion, t(4;17)(p15;q22), in 26 cells. The patient was first
treated for 3 months with oral hydroxyurea and then
switched to imatinib mesylate, which soon had to be
interrupted because of acute renal failure, possibly drug-re-
lated. Imatinib was finally resumed without further adverse
effect, and after 6 months the patient achieved a complete
hematological and cytogenetic responses and a satisfying
molecular response. FISH analysis with BAC RP11-112J9
probe on diagnostic metaphases exhibited a split signal
on all metaphases analyzed (Fig. 3).
3.1.3. Case 3
A 55-year-old woman with liver cirrhosis presented in
January 2002 with anemia, a leukoerythroblastic blood pic-
ture, thrombocytosis, and splenomegaly. The suspected di-
agnosis of chronic idiopathic myelofibrosis was confirmed
by the absence of the BCR/ABL fusion gene and by bone
marrow histology showing a dense marrow with distorted
megakaryocytes, myelofibrosis, and a slight increase of
blast cells. The complex karyotype showed various numer-
ous structural anomalies: 45,X,del(7)(p12),add(11)(q21),
t(12;13)(p11;p13),der(16)t(16;17)(q24;q11),%17,add(20)
(p13)[2]/46,XX[4]. In August 2002, blood count showed
37% blasts, and the acute megakaryocytic transformation
was demonstrated by electron microscopic analysis of
new bone marrow biopsy. The patient died less than 1
month later. FISH analysis with BAC RP11-112J9 probe
on diagnostic sample exhibited a split signal in 5 of the
12 cells analyzed (Fig. 4).
3.1.4. Case 4
Case 4 was diagnosed with polycythemia vera in 1989 at
age 37. He was treated with phlebotomy, radiation therapy
(6 mCi of 32P), and intermittent courses of busulfan. After
developing a t(3;8)(q26;q12) in 1995, with clinical signs of
acceleration, he underwent a conventional sibling HLA-
matched bone marrow transplantation in 1996, followed
by cytogenetic relapse in 1997 with 46.XY,t(3;8)(q26;q12)
in one cell and an unrelated clone with 46,XY,del(20)(q12)
in two cells. He underwent a second allogeneic stem cell
transplantation following reduced-intensity conditioning
Fig. 2. FISH study (BAC RP11-112J9) of case 1 with 3 red spots showing
split FISH signals. Partial G-banding karyogram of chromosomes 17 and X.
Fig. 3. FISH study (BAC RP11-112J9) of case 2 with 3 red spots showing
split FISH signals. Partial G-banding karyogram of chromosomes.
Fig. 4. FISH study (BAC RP11-112J9) of case 3 with 3 red spots showing
split FISH signals. Partial R-banding karyogram of chromosomes.
13J. Andrieux et al. / Cancer Genetics and Cytogenetics 178 (2007) 11e16

in 2000, followed by graft failure despite three donor lym-
phocyte infusions. In 2001, he again developed increasing
erythrocytosis, leukocytosis and thrombocytosis. Examina-
tion of bone marrow aspirate and biopsy revealed a picture
of myeloproliferative disease, with increase of reticulin
fibers. Bone marrow karyotyping indicated 46,XY,t(3;11)
(q27;q14),t(13;17)(q14;q21) in two cells, nonclonal abnor-
malities in four cells, and a normal karyotype in four cells,
without the original t(3;8). Following administration of hy-
droxyurea, his disease remained rather well controlled from
2001 onward.
FISH analysis with BAC RP11-112J9 probe exhibited
(Fig. 5) a split signal on 2 of 12 metaphases (17%) and
three spots on 18 of 150 nuclei (12%).
3.2. Gene expression analysis
Comparative analysis of gene expression profiles array
revealed 213 genes with a twofold change in CD34þ cells.
Among them, the 149 genes that are underexpressed are
implicated in lymphocytes differentiation, apoptosis, and
response to interferon.
The pattern of NOG expression revealed no statistical
difference (P 5 0.07), but we distinguished a trend to
a lower expression profile in MMM CD34þ cells (Fig. 6).
Notably, genes from the bone morphogenetic protein
(BMP) pathway were differentially expressed (P < 0.05).
We observed lower expression of BMP Receptor 2
(BMPR2) (P ! 0.006), BMPR1B (P ! 0.036), BMP2
(P ! 0.005) and BMP8 (P ! 0.028) and an increased ex-
pression of BMP3 (P ! 0.019) and BMP10 (P ! 0.041).
In contrast, we observed no statistical variation of expres-
sion of the BMP1, %4, %5, %6, %7, %15, and BMPR1A
expression in MMM CD34þ cells.
4. Discussion
Myelofibrosis is a clonal stem cell disorder characterized
by a bone marrow stromal reaction with collagen fibrosis,
osteosclerosis, and angiogenesis. The characteristic stromal
proliferation is secondary to aberrant release of a variety of
growth factors from megakaryocytes and monocytes, such
as basic fibroblast growth factor, platelet-derived growth
factor, and vascular endothelial growth factors [5e7].
BMPs significantly increase the mRNA expression of
type I collagen, alkaline phosphatase, osterix, osteocalcin,
osteopontin, vascular endothelial growth factor, platelet-
derived growth factor A, and parathyroid hormone receptor
time dependently during the osteoblastic differentiation [8].
Apparently balanced translocations are useful in identi-
fying gene involvement in oncohematological diseases.
FISH analyses of four patients with MPDs with or without
myelofibrosis and with a 17q anomaly show a recurrent
breakpoint in the NOG gene. In a physiological context, se-
creted NOG protein binds and inactivates members of the
TGF-b superfamily of signaling proteins, molecules that
mediate many key events in normal growth and develop-
ment, including cellular differentiation, proliferation, motil-
ity, organization, and death. NOG acts as a BMP2 and
BMP4 antagonist [9,10]. It also synergizes with basic
fibroblast growth factor to repress BMP signaling [11].
Several dominant human NOG mutations in families
with proximal symphalangism and multiple synostoses
syndrome were identified [12,13]. Mutations of NOG
have also been found in patients with fibrodysplasia ossi-
ficans progressiva, a very rare disease characterized by
congenital malformation of the great toes and progressive
heterotopic ossification of the muscles [14,15]. Transgenic
mice overexpressing NOG in the bone microenvironment
have decreased trabecular bone volume and impaired
osteoblastic function, leading to osteopenia and fractures
[16].
In the cases reported here (patients 1 and 2) and in 28
other patients with myelofibrosis, we could not document
any mutation found by direct DNA sequencing of NOG
(data not shown). However, we could argue that, in the
present four cases, the breakpoint in 17q potentially dereg-
ulates directly NOG expression or a regulating sequence
around this gene. Likewise, the gene expression profiles an-
alyzed by microarray in CD34þ cells from MMM patients
revealed a trend to lower expression of NOG.
The correlation between BMPs and NOG expression
(Fig. 6) leads us to speculate about connection between
NOG involvement and BMP-pathway genes in either pri-
mary or secondary myelofibrosis. Further investigations
are needed to improve these preliminary observations.
Several models have shown that NOGGIN can antagonize
BMP signaling. BMP4-induced heterotopic ossification can
be prevented in vivo by local delivery of wild-type NOGGIN
or after somatic cell of an engineered Noggin mutein transfer
[17]. Likewise, the BMP2-induced enhancement of tumor
neovascularization, could be inhibited by soluble BMP re-
ceptor 1A or by noggin [18e20].
The expression and release of BMPs by megakaryo-
cytes, within platelets and perhaps by secretion, may helpFig. 5. FISH study (BAC RP11-112J9) of case 4 with 3 red spots showing
split FISH signals. Partial R-banding karyogram of chromosomes.
14 J. Andrieux et al. / Cancer Genetics and Cytogenetics 178 (2007) 11e16
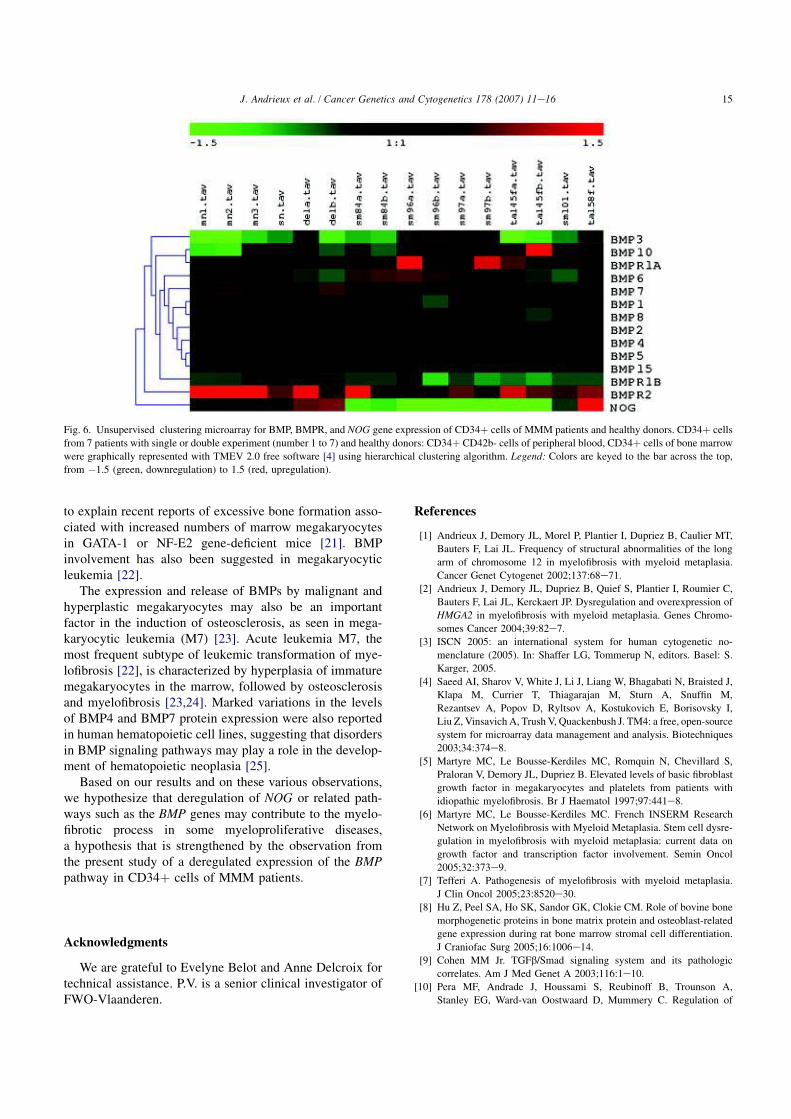
to explain recent reports of excessive bone formation asso-
ciated with increased numbers of marrow megakaryocytes
in GATA-1 or NF-E2 gene-deficient mice [21]. BMP
involvement has also been suggested in megakaryocytic
leukemia [22].
The expression and release of BMPs by malignant and
hyperplastic megakaryocytes may also be an important
factor in the induction of osteosclerosis, as seen in mega-
karyocytic leukemia (M7) [23]. Acute leukemia M7, the
most frequent subtype of leukemic transformation of mye-
lofibrosis [22], is characterized by hyperplasia of immature
megakaryocytes in the marrow, followed by osteosclerosis
and myelofibrosis [23,24]. Marked variations in the levels
of BMP4 and BMP7 protein expression were also reported
in human hematopoietic cell lines, suggesting that disorders
in BMP signaling pathways may play a role in the develop-
ment of hematopoietic neoplasia [25].
Based on our results and on these various observations,
we hypothesize that deregulation of NOG or related path-
ways such as the BMP genes may contribute to the myelo-
fibrotic process in some myeloproliferative diseases,
a hypothesis that is strengthened by the observation from
the present study of a deregulated expression of the BMP
pathway in CD34þ cells of MMM patients.
Acknowledgments
We are grateful to Evelyne Belot and Anne Delcroix for
technical assistance. P.V. is a senior clinical investigator of
FWO-Vlaanderen.
References
[1] Andrieux J, Demory JL, Morel P, Plantier I, Dupriez B, Caulier MT,
Bauters F, Lai JL. Frequency of structural abnormalities of the long
arm of chromosome 12 in myelofibrosis with myeloid metaplasia.
Cancer Genet Cytogenet 2002;137:68e71.
[2] Andrieux J, Demory JL, Dupriez B, Quief S, Plantier I, Roumier C,
Bauters F, Lai JL, Kerckaert JP. Dysregulation and overexpression of
HMGA2 in myelofibrosis with myeloid metaplasia. Genes Chromo-
somes Cancer 2004;39:82e7.
[3] ISCN 2005: an international system for human cytogenetic no-
menclature (2005). In: Shaffer LG, Tommerup N, editors. Basel: S.
Karger, 2005.
[4] Saeed AI, Sharov V, White J, Li J, Liang W, Bhagabati N, Braisted J,
Klapa M, Currier T, Thiagarajan M, Sturn A, Snuffin M,
Rezantsev A, Popov D, Ryltsov A, Kostukovich E, Borisovsky I,
Liu Z, Vinsavich A, Trush V, Quackenbush J. TM4: a free, open-source
system for microarray data management and analysis. Biotechniques
2003;34:374e8.
[5] Martyre MC, Le Bousse-Kerdiles MC, Romquin N, Chevillard S,
Praloran V, Demory JL, Dupriez B. Elevated levels of basic fibroblast
growth factor in megakaryocytes and platelets from patients with
idiopathic myelofibrosis. Br J Haematol 1997;97:441e8.
[6] Martyre MC, Le Bousse-Kerdiles MC. French INSERM Research
Network on Myelofibrosis with Myeloid Metaplasia. Stem cell dysre-
gulation in myelofibrosis with myeloid metaplasia: current data on
growth factor and transcription factor involvement. Semin Oncol
2005;32:373e9.
[7] Tefferi A. Pathogenesis of myelofibrosis with myeloid metaplasia.
J Clin Oncol 2005;23:8520e30.
[8] Hu Z, Peel SA, Ho SK, Sandor GK, Clokie CM. Role of bovine bone
morphogenetic proteins in bone matrix protein and osteoblast-related
gene expression during rat bone marrow stromal cell differentiation.
J Craniofac Surg 2005;16:1006e14.
[9] Cohen MM Jr. TGFb/Smad signaling system and its pathologic
correlates. Am J Med Genet A 2003;116:1e10.
[10] Pera MF, Andrade J, Houssami S, Reubinoff B, Trounson A,
Stanley EG, Ward-van Oostwaard D, Mummery C. Regulation of
Fig. 6. Unsupervised clustering microarray for BMP, BMPR, and NOG gene expression of CD34þ cells of MMM patients and healthy donors. CD34þ cells
from 7 patients with single or double experiment (number 1 to 7) and healthy donors: CD34þ CD42b- cells of peripheral blood, CD34þ cells of bone marrow
were graphically represented with TMEV 2.0 free software [4] using hierarchical clustering algorithm. Legend: Colors are keyed to the bar across the top,
from %1.5 (green, downregulation) to 1.5 (red, upregulation).
15J. Andrieux et al. / Cancer Genetics and Cytogenetics 178 (2007) 11e16

human embryonic stem cell differentiation by BMP-2 and its antag-
onist noggin. J Cell Sci 2004;117:1269e80.
[11] Xu RH, Peck RM, Li DS, Feng X, Ludwig T, Thomson JA. Basic
FGF and suppression of BMP signaling sustain undifferentiated
proliferation of human ES cells. Nat Methods 2005;2:185e90.
[12] Marcelino J, Sciortino CM, Romero MF, Ulatowski LM, Ballock RT,
Economides AN, Eimon PM, Harland RM, Warman ML. Human dis-
ease-causing NOG missense mutations: effects on noggin secretion,
dimer formation, and bone morphogenetic protein binding. Proc Natl
Acad Sci U S A 2001;98:11353e8.
[13] Brown DJ, Kim TB, Petty EM, Downs CA, Martin DM, Strouse PJ,
Moroi SE, Gebarski SS, Lesperance MM. Characterization of a stapes
ankylosis family with a NOG mutation. Otol Neurotol 2003;24:
210e5.
[14] Semonin O, Fontaine K, Daviaud C, Ayuso C, Lucotte G. Identifica-
tion of three novel mutations of the noggin gene in patients with
fibrodysplasia ossificans progressiva. Am J Med Genet 2001;102:
314e7.
[15] Fontaine K, Semonin O, Legarde JP, Lenoir G, Lucotte G. A new
mutation of the noggin gene in a French fibrodysplasia ossificans
progressiva (FOP) family. Genet Couns 2005;16:149e54.
[16] Devlin RD, Du Z, Pereira RC, Kimble RB, Economides AN,
Jorgetti V, Canalis E. Skeletal overexpression of noggin results in os-
teopenia and reduced bone formation. Endocrinology 2003;144:
1972e8.
[17] Glaser DL, Economides AN, Wang L, Liu X, Kimble RD, Fandl JP,
Wilson JM, Stahl N, Kaplan FS, Shore EM. In vivo somatic cell gene
transfer of an engineered Noggin mutein prevents BMP4-induced
heterotopic ossification. J Bone Joint Surg Am 2003;85:2332e42.
[18] Raida M, Clement JH, Leek RD, Ameri K, Bicknell R,
Niederwieser D, Harris AL. Bone morphogenetic protein 2 (BMP-
2) and induction of tumor angiogenesis. J Cancer Res Clin Oncol
2005;131:741e50.
[19] Deckers MM, van Bezooijen RL, van der Horst G, Hoogendam J, van
Der Bent C, Papapoulos SE, Lowik CW. Bone morphogenetic
proteins stimulate angiogenesis through osteoblast-derived vascular
endothelial growth factor A. Endocrinology 2002;143:1545e53.
[20] Langenfeld EM, Langenfeld J. Bone morphogenetic protein-2 stimu-
lates angiogenesis in developing tumors. Mol Cancer Res 2004;2:
141e9.
[21] Sipe JB, Zhang J, Waits C, Skikne B, Garimella R, Anderson HC.
Localization of bone morphogenetic proteins (BMPs)-2, -4, and -6
within megakaryocytes and platelets. Bone 2004;35:1316e22.
[22] Mesa RA, Li CY, Ketterling RP, Schroeder GS, Knudson RA,
Tefferi A. Leukemic transformation in myelofibrosis with myeloid
metaplasia: a single-institution experience with 91 cases. Blood
2005;105:973e7.
[23] Reilly J. Pathogenesis of idiopathic myelofibrosis: role of growth
factors. J Clin Pathol 1992;45:461e4.
[24] Bergstrom K, Van Slyke E. Acute myelofibrosis: an accelerated var-
iant of agnogenic myeloid metaplasia. Ann Int Med 1971;74:232e5.
[25] Detmer K, Steele TA, Shoop MA, Dannawi H. Lineage-restricted ex-
pression of bone morphogenetic protein genes in human hematopoi-
etic cell lines. Blood Cells Mol Dis 1999;25:310e23.
16 J. Andrieux et al. / Cancer Genetics and Cytogenetics 178 (2007) 11e16
5/ Le promoteur de CXCR4 est hyperméthylé dans les cellules CD34+ des patients atteints de MFP
« Hypermethylation of CXCR4 promoter in CD34+ cells from patients with primary
myelofibrosis ».
Bogani C, Ponziani V, Guglielmelli P, Desterke C, Rosti V, Bosi A, Le Bousse-Kerdilès
MC, Barosi G, Vannucchi AM.
Stem Cells. 2008 Aug;26(8):1920-30. Epub 2008 May 29
Le CXCR4, un des récepteurs de la chimiokine CXCL12/SDF-1, est fortement impliqué
dans la migration des cellules souches et des progéniteurs hématopoïétiques.
Les patients atteints de MFP présentent un taux élevé de cellules CD34+ circulantes et
cette augmentation est associée à l’aplasie médullaire qui survient chez les patients en phase
terminale de la maladie. Ce récepteur est sous exprimé à la membrane des cellules CD34+ de
patients atteints de MFP et sa sous-expression participe au processus de migration de ces
CSH/PH hors de la moelle osseuse.
Au cours d’un échange universitaire Franco-Italien avec le laboratoire du Pr.
Alessandro Vannucchi de l’Université de Florence, nous avons montré que la sous expression
de CXCR4 dans les CD34+ était associée à l’hyperméthylation de son promoteur.
233

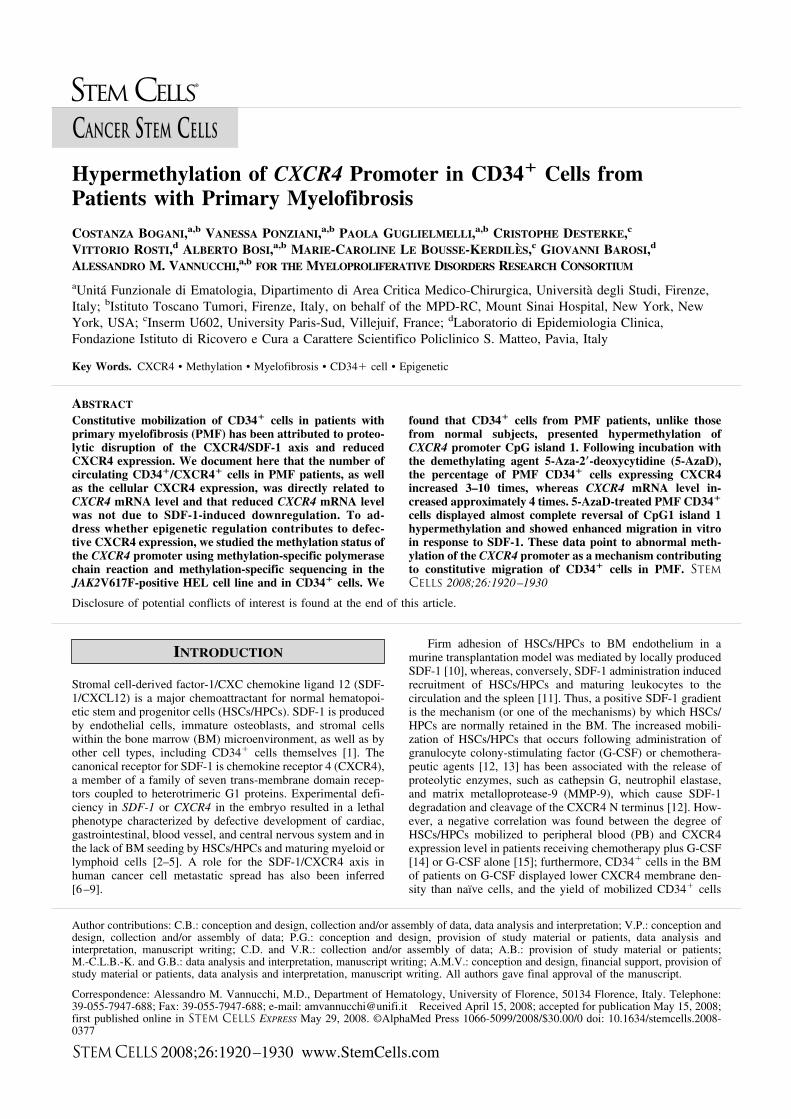
Hypermethylation of CXCR4 Promoter in CD341 Cells fromPatients with Primary Myelofibrosis
COSTANZA BOGANI,a,b VANESSA PONZIANI,a,b PAOLA GUGLIELMELLI,a,b CRISTOPHE DESTERKE,c
VITTORIO ROSTI,d ALBERTO BOSI,a,b MARIE-CAROLINE LE BOUSSE-KERDILES,c GIOVANNI BAROSI,d
ALESSANDRO M. VANNUCCHI,a,bFOR THE MYELOPROLIFERATIVE DISORDERS RESEARCH CONSORTIUM
aUnita Funzionale di Ematologia, Dipartimento di Area Critica Medico-Chirurgica, Universita degli Studi, Firenze,
Italy; bIstituto Toscano Tumori, Firenze, Italy, on behalf of the MPD-RC, Mount Sinai Hospital, New York, New
York, USA; cInserm U602, University Paris-Sud, Villejuif, France; dLaboratorio di Epidemiologia Clinica,
Fondazione Istituto di Ricovero e Cura a Carattere Scientifico Policlinico S. Matteo, Pavia, Italy
Key Words. CXCR4 • Methylation • Myelofibrosis • CD341 cell • Epigenetic
ABSTRACT
Constitutive mobilization of CD341 cells in patients withprimary myelofibrosis (PMF) has been attributed to proteo-lytic disruption of the CXCR4/SDF-1 axis and reducedCXCR4 expression. We document here that the number ofcirculating CD341/CXCR41 cells in PMF patients, as wellas the cellular CXCR4 expression, was directly related toCXCR4 mRNA level and that reduced CXCR4 mRNA levelwas not due to SDF-1-induced downregulation. To ad-dress whether epigenetic regulation contributes to defec-tive CXCR4 expression, we studied the methylation status ofthe CXCR4 promoter using methylation-specific polymerasechain reaction and methylation-specific sequencing in theJAK2V617F-positive HEL cell line and in CD341 cells. We
found that CD341 cells from PMF patients, unlike thosefrom normal subjects, presented hypermethylation ofCXCR4 promoter CpG island 1. Following incubation withthe demethylating agent 5-Aza-2*-deoxycytidine (5-AzaD),the percentage of PMF CD341 cells expressing CXCR4increased 3–10 times, whereas CXCR4 mRNA level in-creased approximately 4 times. 5-AzaD-treated PMF CD341
cells displayed almost complete reversal of CpG1 island 1hypermethylation and showed enhanced migration in vitroin response to SDF-1. These data point to abnormal meth-ylation of the CXCR4 promoter as a mechanism contributingto constitutive migration of CD341 cells in PMF. STEM
CELLS 2008;26:1920–1930
Disclosure of potential conflicts of interest is found at the end of this article.
INTRODUCTION
Stromal cell-derived factor-1/CXC chemokine ligand 12 (SDF-1/CXCL12) is a major chemoattractant for normal hematopoi-etic stem and progenitor cells (HSCs/HPCs). SDF-1 is producedby endothelial cells, immature osteoblasts, and stromal cellswithin the bone marrow (BM) microenvironment, as well as byother cell types, including CD341 cells themselves [1]. Thecanonical receptor for SDF-1 is chemokine receptor 4 (CXCR4),a member of a family of seven trans-membrane domain recep-tors coupled to heterotrimeric G1 proteins. Experimental defi-ciency in SDF-1 or CXCR4 in the embryo resulted in a lethalphenotype characterized by defective development of cardiac,gastrointestinal, blood vessel, and central nervous system and inthe lack of BM seeding by HSCs/HPCs and maturing myeloid orlymphoid cells [2–5]. A role for the SDF-1/CXCR4 axis inhuman cancer cell metastatic spread has also been inferred[6–9].
Firm adhesion of HSCs/HPCs to BM endothelium in amurine transplantation model was mediated by locally producedSDF-1 [10], whereas, conversely, SDF-1 administration inducedrecruitment of HSCs/HPCs and maturing leukocytes to thecirculation and the spleen [11]. Thus, a positive SDF-1 gradientis the mechanism (or one of the mechanisms) by which HSCs/HPCs are normally retained in the BM. The increased mobili-zation of HSCs/HPCs that occurs following administration ofgranulocyte colony-stimulating factor (G-CSF) or chemothera-peutic agents [12, 13] has been associated with the release ofproteolytic enzymes, such as cathepsin G, neutrophil elastase,and matrix metalloprotease-9 (MMP-9), which cause SDF-1degradation and cleavage of the CXCR4 N terminus [12]. How-ever, a negative correlation was found between the degree ofHSCs/HPCs mobilized to peripheral blood (PB) and CXCR4expression level in patients receiving chemotherapy plus G-CSF[14] or G-CSF alone [15]; furthermore, CD341 cells in the BMof patients on G-CSF displayed lower CXCR4 membrane den-sity than naıve cells, and the yield of mobilized CD341 cells
Author contributions: C.B.: conception and design, collection and/or assembly of data, data analysis and interpretation; V.P.: conception anddesign, collection and/or assembly of data; P.G.: conception and design, provision of study material or patients, data analysis andinterpretation, manuscript writing; C.D. and V.R.: collection and/or assembly of data; A.B.: provision of study material or patients;M.-C.L.B.-K. and G.B.: data analysis and interpretation, manuscript writing; A.M.V.: conception and design, financial support, provision ofstudy material or patients, data analysis and interpretation, manuscript writing. All authors gave final approval of the manuscript.
Correspondence: Alessandro M. Vannucchi, M.D., Department of Hematology, University of Florence, 50134 Florence, Italy. Telephone:39-055-7947-688; Fax: 39-055-7947-688; e-mail: [email protected] Received April 15, 2008; accepted for publication May 15, 2008;first published online in STEM CELLS EXPRESS May 29, 2008. ©AlphaMed Press 1066-5099/2008/$30.00/0 doi: 10.1634/stemcells.2008-0377
CANCER STEM CELLS
STEM CELLS 2008;26:1920–1930 www.StemCells.com

correlated with the proportion of BM CD341/CXCR42 cells[15]. These data support the contention that mobilization ofCD341 cells is also dependent on the density of CXCR4 on thecell membrane; accordingly, antagonist-induced desensitizationof CXCR4 caused the egress of HSCs/HPCs from BM to PB[16]. The mechanisms by which G-CSF affects the expression ofCXCR4 have not been completely elucidated, but at least in partthey depend on proteolytic modifications with functional inac-tivation of the receptor [13]. However, it has been shown thatG-CSF downregulates CXCR4 in myeloid cells [17] through thetranscriptional repressor growth factor independence-1 (Gfi-1)[18], whereas modulation of CXCR4 expression at the post-translational level has been described in both hematopoietic [19]and nonhematopoietic [7, 20] cells. CXCR4 on the cell surfaceof migrating cells is physiologically downregulated upon SDF-1binding through rapid phosphorylation and internalization of thereceptor [21]. Therefore, mobilization of HSCs/HPCs may bethe consequence of changes in the expression of either SDF-1 orCXCR4 or both.
Primary myelofibrosis (PMF) is a chronic myeloprolifera-tive disorder (MPD) characterized by variable changes in bloodcell count, leukoerythroblastosis, splenomegaly, extramedullaryhematopoiesis, and bone marrow fibrosis with extensive angio-genesis [22]. Constitutive mobilization of CD341 cells in thePB is one striking characteristic of PMF; the number of thesecells is more than 300 times greater than in healthy subjects and20–30 times greater than in other MPDs, such as polycythemiavera and essential thrombocythemia [23]. Abnormal cell mobi-lization in PMF is not limited to HSCs/HPCs, since more cellswith a CD341/CD1331/vascular endothelial growth factor re-ceptor 21 phenotype have been reported to circulate, preferen-tially at early phases of the disease [24]; although these cells donot function as true endothelial progenitor cells and their func-tion in vessel formation and/or homeostasis is still unknown[25], they might be involved in the same mechanisms leading toenhanced mobilization as for the HSCs/HPCs. Mechanismsunderlying the abnormal mobilization of CD341 cells in PMFprobably involve the establishment of a proteolytic environmentcausing SDF-1 degradation within the BM [26, 27]. However, itis likely that abnormalities of CXCR4 also play some role, assuggested by findings of reduced CXCR4 expression and anabnormally low CXCR4 mRNA level in PMF CD341 cells [28,29]. The aim of this study was to address potential mechanismsfor the reduced CXCR4 expression in PMF CD341 cells and itscontribution to the phenomenon of constitutive migration in thecirculation.
SUBJECTS, MATERIALS, AND METHODS
Subjects
This study included a total of 40 PMF patients, 11 normal blooddonors, and 31 volunteer donors of hematopoietic stem cells, ofwhom 20 donated BM cells and 11 were mobilized with G-CSF.Diagnosis of PMF was made according to the criteria identified bythe Italian Consensus Conference [30]; all patients were primaryforms in a typical fibrotic stage of the disease [31], who werestudied at diagnosis or during follow-up, but were cytotoxic agent-free from at least 1 month. Twenty-four patients were JAK2V617Fmutant (60%) [32], whereas none harbored MPL mutation [33].Seventy-five percent of the patients were in the low-risk category,20% in the intermediate category, and 5% in the high-risk category,according to Lille score [34]. The CD341 cell count in the PB ofPMF patients was 186 6 179 3 106 cells per liter (range, 10–379 3
106 cells per liter). Informed consent from patients and controls wasobtained under an IRB approval study protocol.
Flow Cytometry Analysis of Circulating CD341
Cells
CD341 cells in the PB of PMF patients were enumerated using 50ml of EDTA-anticoagulated blood, after staining with CD45-fluo-rescein isothiocyanate (FITC)-/CD34-phycoerythrin (PE)-conju-gated monoclonal antibodies (both from Becton, Dickinson andCompany, San Jose, CA, http://www.bd.com) and 7-aminoactino-mycin D (BD Pharmingen, San Diego, http://www.bdbiosciences.com/index_us.shtml) for excluding dead cells in a FACScan flowcytometer (Becton Dickinson), according to guidelines from theInternational Society of Hematotherapy and Graft Engineering [35].Cell surface expression of CXCR4 (CD184) was determined usinganti-human CD184(CXCR4)-PE antibody (BD Pharmingen) andthe appropriate isotype control. Results were expressed both as thepercentage of CD451/CD341 cells coexpressing CXCR4 and as theratio of geometric mean fluorescence intensity (MFI) by dividingthe value of specific antibodies with the corresponding isotypecontrol antibody. Intracellular CXCR4 staining in cells migrating inTranswell cells (Corning Costar, Boston, http://www.corning.com/lifesciences) (described below) was performed after blocking cellsurface CXCR4 with nonconjugated antihuman CXCR4 antibody(clone 12G5, 10 mg/ml, for 1 hour at 4°C). Cells were fixed withparaformaldehyde and permeabilized with 1% Triton X-100 beforefluorescence-activated cell sorting (FACS) analysis. Data analysiswas performed using WinMDI software (version 2.9; http://facs.scripps.edu/software.html).
CD341 Cell Purification
BM or PB mononuclear cells were separated over a Ficoll-Hypaquegradient (Lymphoprep; Nycomed Pharma, Oslo, Norway, http://www.nycomed.at), and CD341 cells were immunomagneticallyselected (Miltenyi Biotec, Bergisch Gladbach, Germany, http://www.miltenyibiotec.com) [36]. Purity of the isolated CD341 cellpopulation was evaluated by flow cytometry after labeling withPE-HPCA2 anti-CD34 monoclonal antibody (Becton Dickinson).Aliquots of CD341 cells were immediately resuspended in lysisbuffer for RNA and DNA purification or used in culture.
Ex Vivo Short-Term Incubation of CD341 Cells
Purified CD341 cells were cultured at 105 cells per milliliter inIscove’s modified Dulbecco’s medium (IMDM; Bio Whittaker)containing 10% fetal calf serum (FCS; HyClone, Logan, UT, http://www.hyclone.com) and incubated at 37°C and 5% CO2 in a hu-midified atmosphere for 4 hours. Cells were then exposed forvariable times up to 48 hours to different agents, including cyto-kines (SDF-1, transforming growth factor-b [TGF-b], and interfer-on-g [IFN-g]; all from Peprotech, Rocky Hill, NJ, http://www.peprotech.com) and the hypomethylating agent 5-Aza-29-deoxycytidine (5-AzaD; Sigma-Aldrich, Milano, Italy, http://www.sigmaaldrich.com). Parallel cultures without added cytokines or5-AzaD were prepared in each experiment as control. At the end ofincubation, cells were collected and either processed directly forFACS analysis or nucleic acid extraction, or washed in fresh me-dium for use in migration experiments.
Cell Lines
The human erythroleukemia HEL and K562 cell lines and themyeloid HL60 cell line were purchased from the American TypeCulture Collection (Manassas, VA, http://www.atcc.org). The cellswere maintained in IMDM supplemented with 10% FCS.
Real-Time Quantitative Polymerase Chain ReactionDetermination of CXCR4 mRNA Level
Total RNA was extracted using Trizol (Invitrogen, Paisley, U.K.,http://www.invitrogen.com); RNA concentration and purity/integ-rity were determined using NanoDrop technology (ND-1000 spec-trophotometer; NanoDrop, Wilmington, DE, http://www.nanodrop.com). cDNA was reverse-transcribed from 100 ng of total RNAobtained from purified CD341 cells using the High Capacity cDNAArchive Kit (Applied Biosystems, Foster City, CA, http://www.appliedbiosystems.com). TaqMan polymerase chain reactions
1921Bogani, Ponziani, Guglielmelli et al.
www.StemCells.com

(PCRs) were carried out with the TaqMan Universal PCR MasterMix, using TaqMan Gene Expression Assays (HS-00607978 forCXCR4; Applied Biosystems), by means of the ABI Prism 7300 HTSequence Detection System (Applied Biosystems). Assays wereperformed in quadruplicate. Gene expression profiling was achievedusing the comparative cycle threshold (CT) method of relativequantitation using VIC-labeled RNaseP probe as the housekeepinggene (Applied Biosystems) (DCT).
Methylation-Specific PCR and Methylation-SpecificSequencing Analysis of CXCR4 PromoterMethylation Status
To determine the location of CpG islands in the promoter region ofCXCR4, we used the MethPrimer software (http://www.urogene.org/methprimer/index1.html); five CpG islands were identified, andprimers for each CpG island were designed to be used in a meth-ylation-specific polymerase chain reaction (MSP) assay (reported insupplemental online Fig. 1). We also designed primers for use in amethylation-specific sequencing (MSS) assay (described below),which allowed the amplification of a 230-nucleotide region withinCpG island 1 containing 22 individual CpG dinucleotides. In brief,1 mg of DNA obtained from CD341 cells or cell lines was treatedwith sodium bisulfite to induce conversion of unmethylated cyto-sine to uracil (Epitect Bisulfite kit; Qiagen, Hilden, Germany,http://www1.qiagen.com). The CpG methylase SssI from Spiro-
plasma sp., strain MQ1 (New England Biolabs, Beverly, MA,http://www.neb.com), was used to produce fully methylated meth-ylate DNA from HL60 cells (positive control). MSP was performedusing primers specific for either the methylated or unmethylatedDNA under the following conditions for TaqGold polymerase (Ap-plied Biosystems): 94°C for 13 minutes followed by 40 cycles at94°C for 30 seconds, 59°C or 60°C (for methylated and unmethyl-ated CXCR4, respectively) for 30 seconds, and 72°C for 30 seconds.Amplicons were resolved in 3% agarose gel and visualized byethidium bromide staining. Bisulfite-modified DNA was also usedas direct template for MSS. PCR conditions were as follows: 94°Cfor 13 minutes; 30 cycles consisting of 30 seconds at 94°C, 30seconds at 56°C, and 30 seconds at 72°C; and 10 minutes at 72°C.The primer sequences were as follows: forward primer, 59-gaggg-ggaaagtattgtttg-39; reverse primer, 59-aaacttacacaaaatcactcattca-39.Amplicons were subjected to bidirectional sequencing on an ABIPrism 3730 DNA Analyzer (Applied Biosystems).
In Vitro Migration Assay for CD341 Cells
For these experiments, 2 3 105 purified CD341 cells were seededin 500 ml of IMDM supplemented with 10% FCS in the absence(control) or in the presence of 1 mM 5-AzaD for 12 hours. At theend of incubation, cell aliquots were labeled with anti-CD341 FITCand anti-human CD184(CXCR4) PE to evaluate changes in CXCR4content upon 5-AzaD exposure. Immediately before migration as-say, CD341 cells were washed in serum-free media, resuspended in100 ml of IMDM, and loaded into Transwell filters (5 mm pore;Transwell, 24-well cell clusters), which were then carefully trans-ferred to wells containing 500 ml of serum-free medium supple-mented or not (for calculation of passive diffusion) with 125 ng/mlrecombinant hSDF-1a. Plates were incubated at 37°C in 5% CO2
for 3 hours, and then the upper chamber was carefully removed andcells in top and bottom chambers were counted; the percentage ofCD341 cells undergoing migration in samples treated or not with5-AzaD was calculated after subtracting passive diffusion.
Statistical Analysis
Comparison between groups was performed by the Mann-WhitneyU test or Fisher test as appropriate, using the SPSS software(StatSoft, Inc., Tulsa, OK, http://www.statsoft.com), GraphPad In-Stat software (GraphPad Software, Inc., San Diego, http://www.graphpad.com), or Origin software (version 7.5; OriginLab,Northampton, MA, http://www.originlab.com) for computation.The chosen level of significance from two-sided tests was p , .05.
RESULTS
CXCR4 Expression in PMF CD341 Cells Correlateswith CXCR4 mRNA Level
The expression of membrane CXCR4 in CD341 cells from PBof PMF patients was determined by flow cytometry (FACS) andcompared with normal different sources, which included un-stimulated peripheral blood (uPB) and G-CSF-mobilized pe-ripheral blood (mPB) and BM aspirates. As shown in Figure 1Aand 1B, the frequency of CD341 cells coexpressing CXCR4 inthe PB of PMF patients was significantly lower than in normalsamples (p , .01 compared with uPB or BM cells; p , .05compared with mPB). In normal samples, CD341CXCR41
cells progressively decreased from a median of 68.3% of allCD341 cells in the BM to 54.3% in uPB and to 21.5% in mPB.Also, the density of CXCR4 molecules, expressed as the MFI,was significantly lower in PMF CD341 cells compared withnormal uPB or BM CD341 cells but not compared with mPBCD341 cells (Fig. 1B). Purified PMF CD341 cells expressedsignificantly lower CXCR4 mRNA level than normal cells fromall other sources; the highest and lowest mRNA levels weremeasured in CD341 cells from control BM and PMF PB,respectively, differing on the order of 4.9 DCT (Fig. 1B). On thebasis of the assumption that in optimized real-time quantitative(RTQ) PCR experiments a DCT n 5 3.3 corresponds to a10-fold difference in mRNA level [37], it was calculated thatCXCR4 mRNA expression in PMF CD341 cells was ;40-foldlower than in normal BM CD341 cells. Both the frequency ofcirculating CD341/CXCR41 cells and the CXCR4 MFI in PMFpatients were correlated with CXCR4 mRNA level, as shown inFigure 1C and 1D, respectively. The percentage of CD341 cellscoexpressing CXCR4, the CXCR4 MFI, and the level of CXCR4
mRNA were all similar in patients harboring the JAK2V617Fmutation and those not harboring it (not shown in detail).
Reduced CXCR4 mRNA Level Is Not Due toSDF-1-Induced Downregulation
SDF-1 level has been found to be significantly increased in theBM microenvironment and in plasma of PMF patients [28, 38];although downregulation of CXCR4 expression on the cellmembrane would be expected because of its physiologic inter-nalization upon SDF-1 cross-linking, we also asked whether thereduced CXCR4 mRNA level observed in PMF CD341 cellscould follow ligand binding. To this end, we first determined theexpression pattern of CXCR4 and CXCR4 mRNA in threedifferent hematopoietic cell lines: the HEL cell line, whichharbors JAK2 V617F mutation; the BCR/ABL-positive K562cell line; and the PML-RARa-positive HL-60 cell line. Wefound that K562 cells were virtually negative for CXCR4 ex-pression, whereas almost all HL60 cells expressed CXCR4 at ahigh level (MFI 5 1.9); on the other hand, approximately 25%(range, 9.2%–49.3%) of HEL cells were CXCR41 dim (MFI 5
1.2) (Fig. 2). The level of CXCR4 mRNA mirrored the results ofFACS analysis (Fig. 2B); CXCR4 mRNA was virtually unde-tectable in K562 cells, highly expressed in HL60 cells, andexpressed at intermediate level, approximately 15-fold lower, inHEL cells.
HEL cells were exposed to increasing concentration ofSDF-1 for 3–24 hours. Starting as soon as after 3 hours ofincubation, we observed a dose-dependent decline of membraneCXCR4 that became undetectable in the presence of 500 ng/mlSDF-1 (Fig. 3A, 3B); on the contrary, CXCR4 mRNA levelremained stable (Fig. 3B). CXCR4 was similarly downregulatedin the presence of 500 ng/ml SDF-1 in CD341 cells from normaluPB or PMF PB; again, no concurrent modification of mRNA
1922 CXCR4 Promoter Hypermethylation in Myelofibrosis
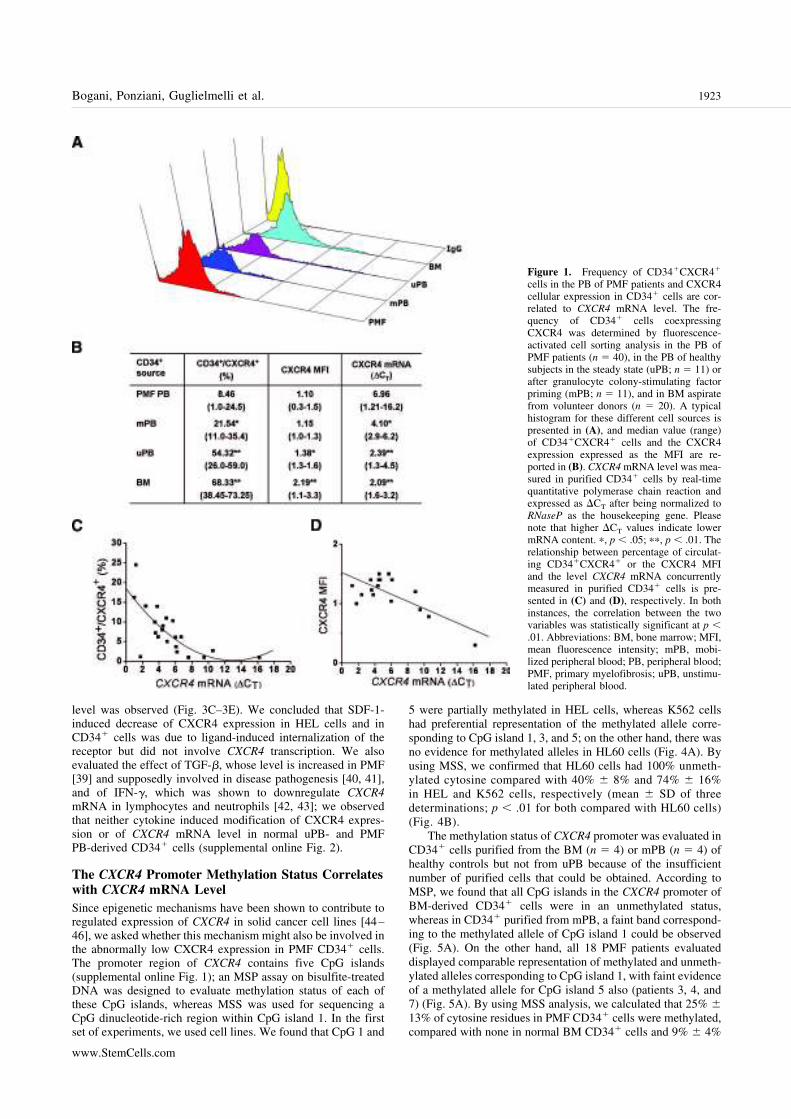
level was observed (Fig. 3C–3E). We concluded that SDF-1-induced decrease of CXCR4 expression in HEL cells and inCD341 cells was due to ligand-induced internalization of thereceptor but did not involve CXCR4 transcription. We alsoevaluated the effect of TGF-b, whose level is increased in PMF[39] and supposedly involved in disease pathogenesis [40, 41],and of IFN-g, which was shown to downregulate CXCR4
mRNA in lymphocytes and neutrophils [42, 43]; we observedthat neither cytokine induced modification of CXCR4 expres-sion or of CXCR4 mRNA level in normal uPB- and PMFPB-derived CD341 cells (supplemental online Fig. 2).
The CXCR4 Promoter Methylation Status Correlateswith CXCR4 mRNA Level
Since epigenetic mechanisms have been shown to contribute toregulated expression of CXCR4 in solid cancer cell lines [44–46], we asked whether this mechanism might also be involved inthe abnormally low CXCR4 expression in PMF CD341 cells.The promoter region of CXCR4 contains five CpG islands(supplemental online Fig. 1); an MSP assay on bisulfite-treatedDNA was designed to evaluate methylation status of each ofthese CpG islands, whereas MSS was used for sequencing aCpG dinucleotide-rich region within CpG island 1. In the firstset of experiments, we used cell lines. We found that CpG 1 and
5 were partially methylated in HEL cells, whereas K562 cellshad preferential representation of the methylated allele corre-sponding to CpG island 1, 3, and 5; on the other hand, there wasno evidence for methylated alleles in HL60 cells (Fig. 4A). Byusing MSS, we confirmed that HL60 cells had 100% unmeth-ylated cytosine compared with 40% 6 8% and 74% 6 16%in HEL and K562 cells, respectively (mean 6 SD of threedeterminations; p , .01 for both compared with HL60 cells)(Fig. 4B).
The methylation status of CXCR4 promoter was evaluated inCD341 cells purified from the BM (n 5 4) or mPB (n 5 4) ofhealthy controls but not from uPB because of the insufficientnumber of purified cells that could be obtained. According toMSP, we found that all CpG islands in the CXCR4 promoter ofBM-derived CD341 cells were in an unmethylated status,whereas in CD341 purified from mPB, a faint band correspond-ing to the methylated allele of CpG island 1 could be observed(Fig. 5A). On the other hand, all 18 PMF patients evaluateddisplayed comparable representation of methylated and unmeth-ylated alleles corresponding to CpG island 1, with faint evidenceof a methylated allele for CpG island 5 also (patients 3, 4, and7) (Fig. 5A). By using MSS analysis, we calculated that 25% 6
13% of cytosine residues in PMF CD341 cells were methylated,compared with none in normal BM CD341 cells and 9% 6 4%
Figure 1. Frequency of CD341CXCR41
cells in the PB of PMF patients and CXCR4cellular expression in CD341 cells are cor-related to CXCR4 mRNA level. The fre-quency of CD341 cells coexpressingCXCR4 was determined by fluorescence-activated cell sorting analysis in the PB ofPMF patients (n 5 40), in the PB of healthysubjects in the steady state (uPB; n 5 11) orafter granulocyte colony-stimulating factorpriming (mPB; n 5 11), and in BM aspiratefrom volunteer donors (n 5 20). A typicalhistogram for these different cell sources ispresented in (A), and median value (range)of CD341CXCR41 cells and the CXCR4expression expressed as the MFI are re-ported in (B). CXCR4 mRNA level was mea-sured in purified CD341 cells by real-timequantitative polymerase chain reaction andexpressed as DCT after being normalized toRNaseP as the housekeeping gene. Pleasenote that higher DCT values indicate lowermRNA content. p, p , .05; pp, p , .01. Therelationship between percentage of circulat-ing CD341CXCR41 or the CXCR4 MFIand the level CXCR4 mRNA concurrentlymeasured in purified CD341 cells is pre-sented in (C) and (D), respectively. In bothinstances, the correlation between the twovariables was statistically significant at p ,
.01. Abbreviations: BM, bone marrow; MFI,mean fluorescence intensity; mPB, mobi-lized peripheral blood; PB, peripheral blood;PMF, primary myelofibrosis; uPB, unstimu-lated peripheral blood.
1923Bogani, Ponziani, Guglielmelli et al.
www.StemCells.com

in mPB (p , .01 for both). These data, together with thosepresented in Figure 1, suggested that in CD341 cells fromhealthy subjects and PMF patients, as was observed in cell lines,the level of CXCR4 mRNA is correlated with the methylationstatus of CpG island 1 of the CXCR4 promoter.
Hypomethylating Agent 5-AzaD Reverts AbnormalMethylation of CXCR4 Promoter and IncreasesCXCR4 Expression
The above results prompted us to evaluate the effect of dem-ethylating agent 5-AzaD on the transcriptional activity ofCXCR4. First, we evaluated different concentrations of theagent, incubation times, and cell densities in cultures of HELcells (not shown in detail); the best conditions were representedby a 1.0 mM concentration of 5-AzaD for 6–48 hours ofincubation, using cells that had been synchronized in serum-freemedium for 12–16 hours. The number of HEL cells expressingCXCR4 in synchronized cultures was lower (median, 15%;range, 9%–19%) than in passage cultures (comparison shown inFig. 2), allowing better appreciation of any changes induced bydrug treatment. In synchronized HEL cells that had been ex-posed to 5-AzaD for 24 hours, the percentage of CXCR41 cellsincreased up to a median of 47% (range, 30%–58%; p , .01 vs.untreated cultures (Fig. 4C, 4D). There was no further increase inthe percentage of CXCR41 cells at 48 hours of culture, but celltoxicity in the presence of 5-AzaD became significant (25% 6
10% of the cells were trypan blue-positive at that time point).The level of CXCR4 mRNA was measured by RTQ-PCR at
different times after drug exposure, from 2 to 48 hours. Weobserved a statistically significant increase of CXCR4 mRNA ina very narrow time interval, peaking at 8 hours of incubation andreturning to pretreatment level at 24 hours; the mean CXCR4
mRNA increase at 8 hours was 6.1 (6 0.9)-fold compared withcontrol cultures (p , .01; Fig. 4E). We evaluated whetherenhanced transcription of CXCR4 after 5-AzaD exposure wasassociated with changes of promoter methylation status; to thisend, cells were incubated with 5-AzaD for 24 hours, and bisul-fite-treated DNA was analyzed using both MSP and MSS. Asshown in Figure 4F and 4G, we observed a significant reductionin the proportion of methylated allele corresponding to CpGisland 1, with no appreciable modification of CpG island 5,whereas the percentage of methylated cytosine using MSS anal-ysis decreased from 40% 6 12% to 14% 6 8% (n 5 3 exper-iments; p 5 .003). Overall, these results suggested that theCXCR4 mRNA level in HEL cells was correlated mainly withthe methylation status of CpG island 1, whereas the role of CpGisland 5, if any, could not be clearly ascertained.
When purified CD341 cells from PMF patients were incu-bated for 8–24 hours with 1 mM 5-AzaD, a 3.9-fold medianincrease (range, 3.5–10) in the number of CD341 cells coex-pressing CXCR4 was observed at 12 hours of incubation (p ,
.001 vs. untreated cells) (Fig. 6A, 6B); concurrently, levels ofCXCR4 mRNA were already increased 3.7-fold (range, 3.1–4.1)at 8 hours (Fig. 6B). Changes in methylation status of CXCR4
promoter were analyzed using MSP and MSS and are presentedin Figure 6C. In all patients evaluated, MSP revealed the dis-appearance of the amplicon corresponding to the methylatedallele of CpG island 1, whereas in cases where a methylatedallele of CpG island 5 was present (i.e., patients 2, 3, and 5), nosignificant modification after 5-AzaD incubation could be dem-onstrated. These data were corroborated by the results of MSSanalysis that showed a complete (as was the case for patients 1and 3) or more than 70% (i.e., patients 4 and 5) reduction inmethylated CpGs within the 230-base pair fragment correspond-ing to CpG island 1.
5-AzaD Treated PMF CD341 Cells ShowedEnhanced Migrating Properties
To assess the functional consequence of increased CXCR4expression in PMF CD341 exposed to 5-AzaD, we performedan in vitro migration assay in response to SDF-1. PurifiedCD341 cells from eight PMF patients were incubated with orwithout 5-AzaD, and their migration in response to a gradient ofSDF-1 added to the lower chamber was assessed at 3 hours.After subtracting passive diffusion (i.e., the number of CD341
cells that migrated to the lower chamber in the absence ofSDF-1), the percentage of CD341 cells migrating to the lowerchamber in response to SDF-1 increased from a mean (6 SD) of6.3% 6 1.1% in controls to 23.2% 6 8.9% in CD341 cellspreincubated with 5-AzaD (p 5 .007). We then measured theexpression of membrane and intracellular CXCR4 in nonmigrat-ing (upper chamber) and migrating (lower chamber) cells after5-AzaD treatment in four experiments. Although we observedno change in the ratio of membrane versus intracellular CXCR4-associated fluorescence in the upper-chamber cells, those thathad migrated presented a median fourfold increase in the rela-tive amount of intracellular versus membrane CXCR4 (data notshown in detail), indicating receptor internalization upon SDF-1binding.
DISCUSSION
The peripheral blood of PMF patients contains more HSCs/HPCs, including more immature progenitors capable of repop-ulating the BM of irradiated mice [27]. Stem cell mobilization isa normal phenomenon in healthy subjects that can be magnifiedafter administration of cytokines, particularly G-CSF, and/or
Figure 2. Expression of CXCR4 and level of CXCR4 mRNA in threehematopoietic cell lines. Expression of CXCR4 on the membrane ofHL60, K562, and HEL cells was measured by fluorescence-activatedcell sorting and expressed as the percentage of CXCR41 cells and as theCXCR4 MFI. A typical histogram is presented in (A), and median value(range) from at least three individual determinations is reported in (B).The CXCR4 mRNA level was measured by real-time quantitative poly-merase chain reaction and expressed as DCT after being normalized toRNaseP as the housekeeping gene. Please note that higher DCT valuesindicate lower mRNA content. Abbreviation: MFI, mean fluorescenceintensity.
1924 CXCR4 Promoter Hypermethylation in Myelofibrosis
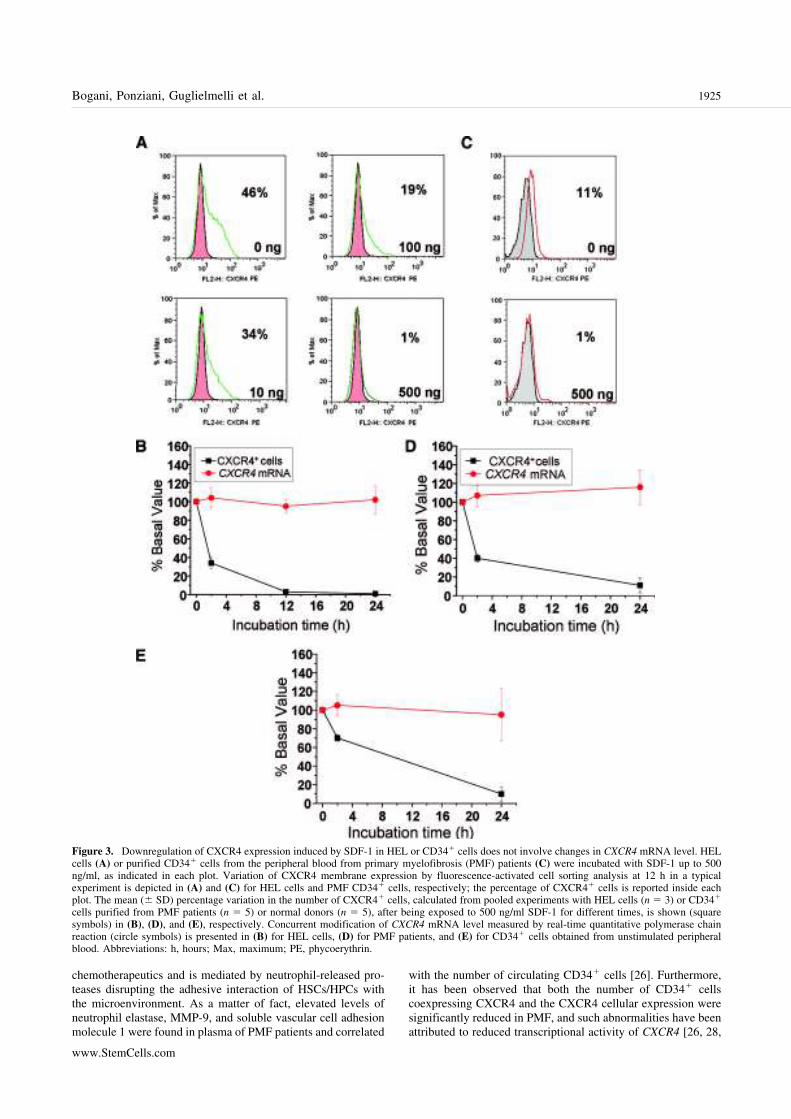
chemotherapeutics and is mediated by neutrophil-released pro-teases disrupting the adhesive interaction of HSCs/HPCs withthe microenvironment. As a matter of fact, elevated levels ofneutrophil elastase, MMP-9, and soluble vascular cell adhesionmolecule 1 were found in plasma of PMF patients and correlated
with the number of circulating CD341 cells [26]. Furthermore,it has been observed that both the number of CD341 cellscoexpressing CXCR4 and the CXCR4 cellular expression weresignificantly reduced in PMF, and such abnormalities have beenattributed to reduced transcriptional activity of CXCR4 [26, 28,
Figure 3. Downregulation of CXCR4 expression induced by SDF-1 in HEL or CD341 cells does not involve changes in CXCR4 mRNA level. HELcells (A) or purified CD341 cells from the peripheral blood from primary myelofibrosis (PMF) patients (C) were incubated with SDF-1 up to 500ng/ml, as indicated in each plot. Variation of CXCR4 membrane expression by fluorescence-activated cell sorting analysis at 12 h in a typicalexperiment is depicted in (A) and (C) for HEL cells and PMF CD341 cells, respectively; the percentage of CXCR41 cells is reported inside eachplot. The mean (6 SD) percentage variation in the number of CXCR41 cells, calculated from pooled experiments with HEL cells (n 5 3) or CD341
cells purified from PMF patients (n 5 5) or normal donors (n 5 5), after being exposed to 500 ng/ml SDF-1 for different times, is shown (squaresymbols) in (B), (D), and (E), respectively. Concurrent modification of CXCR4 mRNA level measured by real-time quantitative polymerase chainreaction (circle symbols) is presented in (B) for HEL cells, (D) for PMF patients, and (E) for CD341 cells obtained from unstimulated peripheralblood. Abbreviations: h, hours; Max, maximum; PE, phycoerythrin.
1925Bogani, Ponziani, Guglielmelli et al.
www.StemCells.com

Figure 4. CXCR4 promoter is differentially M in HL60, K562, and HEL cells and is sensitive to the hypomethylating activity of 5-AzaD. In (A),methylation-specific polymerase chain reaction (MSP) was performed using primers specific for the M or u sequence of each of the five CpG islandslocated in the CXCR4 promoter; in (B), methylation-specific sequencing (MSS) was performed on a 230-base pair region of CpG island 1. Filledcircles indicate M cytosine, and empty circles indicate u cytosine. The SssI-treated DNA from HL60 cells served as positive Ctr (all M cytosines).In (C) and (D), synchronized HEL cells were exposed to 5-AzaD for 24 h, and the percentage of CXCR41 cells, as well as the CXCR4 MFI, wasmeasured by fluorescence-activated cell sorting. In (C), a typical experiment is presented, and cumulative results from four experiments are presentedin (D). pp, p , .01 versus untreated cells. Boxes represent the interquartile range that contains 50% of the values, the horizontal line in the box marksthe median, the small square inside indicates mean value, and bars show the range of values. The level of CXCR4 mRNA was measured by real-timequantitative polymerase chain reaction in HEL cells exposed to 1 mM 5-AzaD for 2–48 h, and the mean 6 SD value from five experiments ispresented in (E). The CXCR4 mRNA level measured at 8 h in the presence of 5-AzaD was significantly different from all other time points (p , .001).The methylation status of the CXCR4 promoter was evaluated after a 24 h of exposure to 5-AzaD using both MSP (F) and MSS (G) (filled circlesindicate M cytosine, and empty circles indicate u cytosine). Abbreviations: 5-AzaD, 5-Aza-29-deoxycytidine; Ctr, control; h, hours; M, methylated;MFI, mean fluorescence intensity; u, unmethylated.
1926 CXCR4 Promoter Hypermethylation in Myelofibrosis

29]; accordingly, CXCR4 was one of the mostly downregulatedgenes in transcriptome analysis of PMF CD341 cells [29].Overall, these findings suggested that abnormal CD341 cellcirculation in PMF is facilitated not only by increased proteol-ysis of target molecules, including SDF-1 and CXCR4, but alsoby defective regulation of CXCR4.
Understanding of the molecular mechanisms underlyingPMF has been facilitated by the recent discovery of recurrentmolecular abnormalities in MPDs [47, 48]. Sixty percent ofPMF patients present the JAK2V617F mutation [49–53],whereas 8% of JAK2 wild-type harbors genetic abnormalities inMPL [33, 54, 55]. However, these mutations are also displayedby patients with other MPDs, suggesting that additional eventsare probably involved in the pathogenesis of disease [56]. Inrecent years, evidence has accumulated for a critical role ofepigenetics in cell transformation toward the neoplastic pheno-type through aberrant gene transcription [57]. Epigenetics maybe defined as the interplay of DNA methylation, histone mod-ifications, and expression of noncoding RNAs [58], which to-gether regulate gene expression [59] according to tissue- andcell-specific patterns [60]. A common epigenetic change incancer is represented by aberrant hypermethylation of CpGislands in gene promoters, with reduced or absent transcriptionof the genes [57]. Transcriptional silencing of hypermethylatedgenes also depends on synergy between methylation and activityof histone deacetylases (HDAC) [61]. The presumptive role ofgene silencing in oncogenesis [62, 63] and the availability ofdrugs capable of modifying methylation status and/or histoneacetylation level [64] have fostered efforts to identify suchhypermethylated loci in cancer cells [65, 66]. However, knowl-edge about epigenetic abnormalities in PMF, and more in gen-erally in MPDs, is still scanty. No hypermethylation of thepromoters of several cell cycle control genes was found in PMFpatients [67], whereas hypermethylation of p15ARF andp16INK4A accompanied leukemic transformation in a few cases[68]. Similarly, reduced expression of the receptor RII forTGF-b was not attributed to abnormal methylation of genepromoter [69, 70]. On the other hand, evidence of hypermeth-ylation of RARb2 promoter-2 was found in 89% of 18 patientswith PMF who presented reduced expression of RARb2, a
candidate tumor suppressor gene [71], although this was notconfirmed in another study [72]. Hypermethylation of SOCS-1
and of SOCS-3 has been described recently [72, 73].In the experiments presented herein, we have identified
CXCR4 as a target of epigenetic regulation because of abnormalmethylation in PMF cells. First, we extended a previous obser-vation that reduced expression of CXCR4 in PMF CD341 cellsdepends on the level of CXCR4 transcription. Second, we pro-vided evidence that CXCR4 promoter is hypermethylated in exvivo-purified PMF CD341 cells from patients and that treat-ment with 5-AzaD reverted such abnormal hypermethylation,promoting gene transcription and enhancing CXCR4 expres-sion, resulting overall in improved migration of CD341 cells inresponse to an SDF-1 gradient. Although definite proof thatincreased CXCR4 expression in 5-AzaD-exposed PMF CD341
cells might result in their enhanced retention in the BM wouldrequire in vivo experiments in immunodeficient mice, we inter-pret the results of the in vitro migration assay as supportive ofthat possibility.
Results of this study might have relevance for PMF fromtwo perspectives. First, they identified abnormalities of CXCR4
as a protease-independent mechanism for the constitutive mo-bilization of HSCs/HPCs. Second, observed effects of 5-AzaDin the culture of CD341 cells forecast therapeutic relevance oftargeting gene methylation in the therapeutic approach to PMF.Additional evidence that abnormal epigenetic regulation is con-current with pathophysiology of PMF has recently been pro-vided by Shi et al., who observed profound changes in PMFCD341 cells exposed to chromatin-modifying agents, including5-AzaD and trichostatin [74]. In a semisolid assay, the propor-tion of clonogenic HPCs harboring JAK2V617F was signifi-cantly reduced when CD341 cells had been exposed to theagents. Furthermore, the number of cells expressing CXCR4that appeared after 9 days in cultures established with treatedCD341 cells was significantly higher than that in control cul-tures [74]. The designs of the above study and our own aredifferent, but the information is compellingly complementary.The long-term culture design used by Shi et al. [74] afterexposure of CD341 cells to the chromatin-modifying agentslikely resulted in preferential elimination of mutant cells and
Figure 5. Analysis of methylation status ofCXCR4 promoter in CD341 cells from PMFpatients and healthy controls (mPB or BM).In (A), MSP was performed using primersspecific for the M or u sequence of each ofthe five CpG islands located in the CXCR4
promoter; in (B), MSS was performed on a230-base pair region of CpG island 1. Filledcircles indicate M cytosine, and empty cir-cles indicate u cytosine. Representative pic-tures of one of four normal controls each forBM and mPB and of 8 of 18 PMF patientsanalyzed are shown. Abbreviations: BM,bone marrow; M, methylated; mPB, granu-locyte colony-stimulating factor-mobilizedperipheral blood; PMF, primary myelofibro-sis; u, unmethylated.
1927Bogani, Ponziani, Guglielmelli et al.
www.StemCells.com
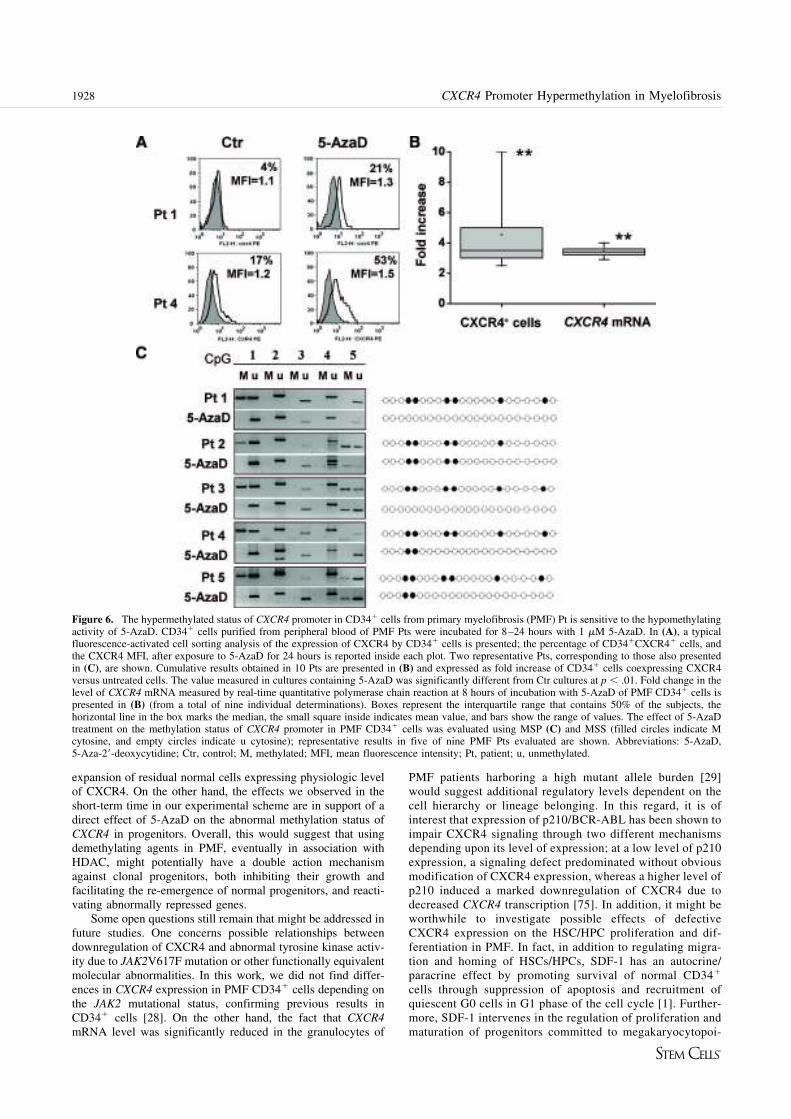
expansion of residual normal cells expressing physiologic levelof CXCR4. On the other hand, the effects we observed in theshort-term time in our experimental scheme are in support of adirect effect of 5-AzaD on the abnormal methylation status ofCXCR4 in progenitors. Overall, this would suggest that usingdemethylating agents in PMF, eventually in association withHDAC, might potentially have a double action mechanismagainst clonal progenitors, both inhibiting their growth andfacilitating the re-emergence of normal progenitors, and reacti-vating abnormally repressed genes.
Some open questions still remain that might be addressed infuture studies. One concerns possible relationships betweendownregulation of CXCR4 and abnormal tyrosine kinase activ-ity due to JAK2V617F mutation or other functionally equivalentmolecular abnormalities. In this work, we did not find differ-ences in CXCR4 expression in PMF CD341 cells depending onthe JAK2 mutational status, confirming previous results inCD341 cells [28]. On the other hand, the fact that CXCR4
mRNA level was significantly reduced in the granulocytes of
PMF patients harboring a high mutant allele burden [29]would suggest additional regulatory levels dependent on thecell hierarchy or lineage belonging. In this regard, it is ofinterest that expression of p210/BCR-ABL has been shown toimpair CXCR4 signaling through two different mechanismsdepending upon its level of expression; at a low level of p210expression, a signaling defect predominated without obviousmodification of CXCR4 expression, whereas a higher level ofp210 induced a marked downregulation of CXCR4 due todecreased CXCR4 transcription [75]. In addition, it might beworthwhile to investigate possible effects of defectiveCXCR4 expression on the HSC/HPC proliferation and dif-ferentiation in PMF. In fact, in addition to regulating migra-tion and homing of HSCs/HPCs, SDF-1 has an autocrine/paracrine effect by promoting survival of normal CD341
cells through suppression of apoptosis and recruitment ofquiescent G0 cells in G1 phase of the cell cycle [1]. Further-more, SDF-1 intervenes in the regulation of proliferation andmaturation of progenitors committed to megakaryocytopoi-
Figure 6. The hypermethylated status of CXCR4 promoter in CD341 cells from primary myelofibrosis (PMF) Pt is sensitive to the hypomethylatingactivity of 5-AzaD. CD341 cells purified from peripheral blood of PMF Pts were incubated for 8–24 hours with 1 mM 5-AzaD. In (A), a typicalfluorescence-activated cell sorting analysis of the expression of CXCR4 by CD341 cells is presented; the percentage of CD341CXCR41 cells, andthe CXCR4 MFI, after exposure to 5-AzaD for 24 hours is reported inside each plot. Two representative Pts, corresponding to those also presentedin (C), are shown. Cumulative results obtained in 10 Pts are presented in (B) and expressed as fold increase of CD341 cells coexpressing CXCR4versus untreated cells. The value measured in cultures containing 5-AzaD was significantly different from Ctr cultures at p , .01. Fold change in thelevel of CXCR4 mRNA measured by real-time quantitative polymerase chain reaction at 8 hours of incubation with 5-AzaD of PMF CD341 cells ispresented in (B) (from a total of nine individual determinations). Boxes represent the interquartile range that contains 50% of the subjects, thehorizontal line in the box marks the median, the small square inside indicates mean value, and bars show the range of values. The effect of 5-AzaDtreatment on the methylation status of CXCR4 promoter in PMF CD341 cells was evaluated using MSP (C) and MSS (filled circles indicate Mcytosine, and empty circles indicate u cytosine); representative results in five of nine PMF Pts evaluated are shown. Abbreviations: 5-AzaD,5-Aza-29-deoxycytidine; Ctr, control; M, methylated; MFI, mean fluorescence intensity; Pt, patient; u, unmethylated.
1928 CXCR4 Promoter Hypermethylation in Myelofibrosis

esis [76 –79]; these progenitors are the most obviously in-volved hematopoietic cell lineage in PMF.
CONCLUSION
Overall, our data indicate that an abnormal degree of methyl-ation of the CXCR4 promoter might contribute to the constitu-tive migration of CD341 cells in PMF patients. However, itmight also be anticipated that defective expression of CXCR4 inPMF CD341 cells might also influence other functional aspectsof the cells in addition to their unique migration and homingproperties.
ACKNOWLEDGMENTS
We thank all physicians who referred patients for this study, andpatients for their willingness to collaborate. This study was
supported by Associazione Italiana per la Ricerca sul Cancro,Milano, Italy; Ente Cassa di Risparmio di Firenze; and Minis-tero Italiano della Universita e Ricerca (Progetti di RicercaCofinanziati 2006067001_003) (to A.M.V.). The project wasalso supported by mobility grant Progetto Galileo-2006, Uni-versita Italo-Francese (to A.M.V. and M.-C.L.B.-K.) and grantsfrom Istituto Toscano Tumori (ITT), Florence. A research travelgrant (to P.G.) was supported by ITT. The project describedherein was supported in part by Grant Number P01-CA108671from the National Cancer Institute. The content is solely theresponsibility of the authors and does not necessarily representthe official views of the National Cancer Institute or the NIH.
DISCLOSURE OF POTENTIAL CONFLICTS
OF INTEREST
The authors indicate no potential conflicts of interest.
REFERENCES
1 Lataillade JJ, Clay D, Bourin P et al. Stromal cell-derived factor 1regulates primitive hematopoiesis by suppressing apoptosis and by pro-moting G(0)/G(1) transition in CD34(1) cells: Evidence for an auto-crine/paracrine mechanism. Blood 2002;99:1117–1129.
2 Zou YR, Kottmann AH, Kuroda M et al. Function of the chemokinereceptor CXCR4 in haematopoiesis and in cerebellar development. Na-ture 1998;393:595–599.
3 Tachibana K, Hirota S, Iizasa H et al. The chemokine receptor CXCR4is essential for vascularization of the gastrointestinal tract. Nature 1998;393:591–594.
4 Nagasawa T, Hirota S, Tachibana K et al. Defects of B-cell lymphopoi-esis and bone-marrow myelopoiesis in mice lacking the CXC chemokinePBSF/SDF-1. Nature 1996;382:635–638.
5 Peled A, Petit I, Kollet O et al. Dependence of human stem cell engraft-ment and repopulation of NOD/SCID mice on CXCR4. Science 1999;283:845–848.
6 Muller A, Homey B, Soto H et al. Involvement of chemokine receptorsin breast cancer metastasis. Nature 2001;410:50–56.
7 Sun YX, Wang J, Shelburne CE et al. Expression of CXCR4 andCXCL12 (SDF-1) in human prostate cancers (PCa) in vivo. J CellBiochem 2003;89:462–473.
8 Voermans C, van Heese WP, de Jong I et al. Migratory behavior ofleukemic cells from acute myeloid leukemia patients. Leukemia 2002;16:650–657.
9 Tavor S, Petit I, Porozov S et al. CXCR4 regulates migration anddevelopment of human acute myelogenous leukemia stem cells in trans-planted NOD/SCID mice. Cancer Res 2004;64:2817–2824.
10 Peled A, Kollet O, Ponomaryov T et al. The chemokine SDF-1 activatesthe integrins LFA-1, VLA-4, and VLA-5 on immature human CD34(1)cells: Role in transendothelial/stromal migration and engraftment ofNOD/SCID mice. Blood 2000;95:3289–3296.
11 Hattori K, Heissig B, Tashiro K et al. Plasma elevation of stromalcell-derived factor-1 induces mobilization of mature and immature he-matopoietic progenitor and stem cells. Blood 2001;97:3354–3360.
12 Petit I, Szyper-Kravitz M, Nagler A et al. G-CSF induces stem cellmobilization by decreasing bone marrow SDF-1 and up-regulatingCXCR4. Nature Immunology 2002;3:687–694.
13 Levesque JP, Hendy J, Takamatsu Y et al. Disruption of the CXCR4/CXCL12 chemotactic interaction during hematopoietic stem cell mobi-lization induced by GCSF or cyclophosphamide. J Clin Invest 2003;111:187–196.
14 Voermans C, Kooi ML, Rodenhuis S et al. In vitro migratory capacity ofCD341 cells is related to hematopoietic recovery after autologous stemcell transplantation. Blood 2001;97:799–804.
15 Dlubek D, Drabczak-Skrzypek D, Lange A. Low CXCR4 membraneexpression on CD34(1) cells characterizes cells mobilized to blood.Bone Marrow Transplant 2006;37:19–23.
16 Shen H, Cheng T, Olszak I et al. CXCR-4 desensitization is associatedwith tissue localization of hemopoietic progenitor cells. J Immunol2001;166:5027–5033.
17 Kim HK, De La Luz Sierra M, Williams CK et al. G-CSF down-regulation of CXCR4 expression identified as a mechanism for mobili-zation of myeloid cells. Blood 2006;108:812–820.
18 De La Luz Sierra M, Gasperini P, McCormick PJ et al. Transcriptionfactor Gfi-1 induced by G-CSF is a negative regulator of CXCR4 inmyeloid cells. Blood 2007;110:2276–2285.
19 Bruhl H, Cohen CD, Linder S et al. Post-translational and cell type-specific regulation of CXCR4 expression by cytokines. Eur J Immunol2003;33:3028–3037.
20 Wynn RF, Hart CA, Corradi-Perini C et al. A small proportion ofmesenchymal stem cells strongly expresses functionally active CXCR4receptor capable of promoting migration to bone marrow. Blood 2004;104:2643–2645.
21 Busillo JM, Benovic JL. Regulation of CXCR4 signaling. BiochimBiophys Acta 2007;1768:952–963.
22 Tefferi A. Pathogenesis of myelofibrosis with myeloid metaplasia. J ClinOncol 2005;23:8520–8530.
23 Barosi G, Viarengo G, Pecci A et al. Diagnostic and clinical relevance ofthe number of circulating CD34(1) cells in myelofibrosis with myeloidmetaplasia. Blood 2001;98:3249–3255.
24 Massa M, Rosti V, Ramajoli I et al. Circulating CD341, CD1331, andvascular endothelial growth factor receptor 2-positive endothelial pro-genitor cells in myelofibrosis with myeloid metaplasia. J Clin Oncol2005;23:5688–5695.
25 Yoder MC, Mead LE, Prater D et al. Redefining endothelial progenitorcells via clonal analysis and hematopoietic stem/progenitor cell princi-pals. Blood 2007;109:1801–1809.
26 Xu M, Bruno E, Chao J et al. Constitutive mobilization of CD341 cellsinto the peripheral blood in idiopathic myelofibrosis may be due to theaction of a number of proteases. Blood 2005;105:4508–4515.
27 Xu M, Bruno E, Chao J et al. The constitutive mobilization of bonemarrow-repopulating cells into the peripheral blood in idiopathic myelo-fibrosis. Blood 2005;105:1699–1705.
28 Rosti V, Massa M, Vannucchi AM et al. The expression of CXCR4 isdown-regulated on the CD341 cells of patients with myelofibrosis withmyeloid metaplasia. Blood Cells Mol Dis 2007;38:280–286.
29 Guglielmelli P, Zini R, Bogani C et al. Molecular profiling of CD341
cells in idiopathic myelofibrosis identifies a set of disease-associatedgenes and reveals the clinical significance of Wilms’ tumor gene 1(WT1). STEM CELLS 2007;25:165–173.
30 Barosi G, Ambrosetti A, Finelli C et al. The Italian Consensus Confer-ence on Diagnostic Criteria for Myelofibrosis with Myeloid Metaplasia.Br J Haematol 1999;104:730–737.
31 Vardiman JW, Harris NL, Brunning RD. The World Health Organi-zation (WHO) classification of the myeloid neoplasms. Blood 2002;100:2292–2302.
32 Vannucchi AM, Pancrazzi A, Bogani C et al. A quantitative assay forJAK2(V617F) mutation in myeloproliferative disorders by ARMS-PCRand capillary electrophoresis. Leukemia 2006;20:1055–1060.
33 Guglielmelli P, Pancrazzi A, Bergamaschi G et al. Anaemia characterisespatients with myelofibrosis harbouring Mpl mutation. Br J Haematol2007;137:244–247.
34 Dupriez B, Morel P, Demory JL et al. Prognostic factors in agnogenicmyeloid metaplasia: A report on 195 cases with a new scoring system.Blood 1996;88:1013–1018.
35 Keeney M, Chin-Yee I, Weir K et al. Single platform flow cytometricabsolute CD341 cell counts based on the ISHAGE guidelines. Interna-tional Society of Hematotherapy and Graft Engineering. Cytometry1998;34:61–70.
1929Bogani, Ponziani, Guglielmelli et al.
www.StemCells.com

36 Vannucchi AM, Pancrazzi A, Guglielmelli P et al. Abnormalities ofGATA-1 in megakaryocytes from patients with idiopathic myelofibrosis.Am J Pathol 2005;167:849–858.
37 van der Velden VH, Hochhaus A, Cazzaniga G et al. Detection ofminimal residual disease in hematologic malignancies by real-time quan-titative PCR: Principles, approaches, and laboratory aspects. Leukemia2003;17:1013–1034.
38 Migliaccio AR, Martelli F, Verrucci M et al. Altered SDF-1/CXCR4 axisin patients with primary myelofibrosis and in the GATA1 low mousemodel of the disease. Exp Hematol 2008;36:158–171.
39 Martyre MC, Romquin N, Le Bousse-Kerdiles MC et al. Transforminggrowth factor-beta and megakaryocytes in the pathogenesis of idiopathicmyelofibrosis. Br J Haematol 1994;88:9–16.
40 Chagraoui H, Komura E, Tulliez M et al. Prominent role of TGF-beta1 in thrombopoietin-induced myelofibrosis in mice. Blood 2002;100:3495–3503.
41 Vannucchi AM, Bianchi L, Paoletti F et al. A pathobiologic pathwaylinking thrombopoietin, GATA-1, and TGF-beta1 in the development ofmyelofibrosis. Blood 2005;105:3493–3501.
42 Nagase H, Miyamasu M, Yamaguchi M et al. Cytokine-mediated regu-lation of CXCR4 expression in human neutrophils. J Leukoc Biol 2002;71:711–717.
43 Shirazi Y, Pitha PM. Interferon downregulates CXCR4 (fusin) geneexpression in peripheral blood mononuclear cells. J Hum Virol 1998;1:69–76.
44 Sato N, Matsubayashi H, Fukushima N et al. The chemokine receptorCXCR4 is regulated by DNA methylation in pancreatic cancer. CancerBiol Ther 2005;4:70–76.
45 Mori T, Kim J, Yamano T et al. Epigenetic up-regulation of C-Cchemokine receptor 7 and C-X-C chemokine receptor 4 expression inmelanoma cells. Cancer Res 2005;65:1800–1807.
46 Kubarek L, Jagodzinski PP. Epigenetic up-regulation of CXCR4 andCXCL12 expression by 17 beta-estradiol and tamoxifen is associatedwith formation of DNA methyltransferase 3B4 splice variant in Ishikawaendometrial adenocarcinoma cells. FEBS Lett 2007;581:1441–1448.
47 Levine RL, Pardanani A, Tefferi A et al. Role of JAK2 in the pathogen-esis and therapy of myeloproliferative disorders. Nat Rev Cancer 2007;7:673–683.
48 Campbell PJ, Green AR. The myeloproliferative disorders. N Engl J Med2006;355:2452–2466.
49 Levine RL, Wadleigh M, Cools J et al. Activating mutation in thetyrosine kinase JAK2 in polycythemia vera, essential thrombocythe-mia, and myeloid metaplasia with myelofibrosis. Cancer Cell 2005;7:387–397.
50 Campbell PJ, Griesshammer M, Dohner K et al. V617F mutation inJAK2 is associated with poorer survival in idiopathic myelofibrosis.Blood 2006;107:2098–2100.
51 Barosi G, Bergamaschi G, Marchetti M et al. JAK2 V617F mutationalstatus predicts progression to large splenomegaly and leukemic transfor-mation in primary myelofibrosis. Blood 2007;110:4030–4036.
52 Kralovics R, Passamonti F, Buser AS et al. A gain-of-function mu-tation of JAK2 in myeloproliferative disorders. N Engl J Med 2005;352:1779 –1790.
53 Baxter EJ, Scott LM, Campbell PJ et al. Acquired mutation of thetyrosine kinase JAK2 in human myeloproliferative disorders. Lancet2005;365:1054–1061.
54 Pardanani AD, Levine RL, Lasho T et al. MPL515 mutations in myelo-proliferative and other myeloid disorders: A study of 1182 patients.Blood 2006;108:3472–3476.
55 Pikman Y, Lee BH, Mercher T et al. MPLW515L is a novel somaticactivating mutation in myelofibrosis with myeloid metaplasia. PLoS Med2006;3:e270.
56 Skoda R. The genetic basis of myeloproliferative disorders. HematologyAm Soc Hematol Educ Program 2007;2007:1–10.
57 Baylin SB, Herman JG. DNA hypermethylation in tumorigenesis: Epi-genetics joins genetics. Trends Genet 2000;16:168–174.
58 Guglielmelli P, Tozzi L, Pancrazzi A et al. MicroRNA expression profilein granulocytes from primary myelofibrosis patients. Exp Hematol 2007;35:1708–1718.
59 Shilatifard A. Chromatin modifications by methylation and ubiquitina-tion: Implications in the regulation of gene expression. Annu Rev Bio-chem 2006;75:243–269.
60 Eckhardt F, Lewin J, Cortese R et al. DNA methylation profiling ofhuman chromosomes 6, 20 and 22. Nat Genet 2006;38:1378–1385.
61 Cameron EE, Bachman KE, Myohanen S et al. Synergy of demethylationand histone deacetylase inhibition in the re-expression of genes silencedin cancer. Nat Genet 1999;21:103–107.
62 Herman JG, Baylin SB. Gene silencing in cancer in association withpromoter hypermethylation. New Engl J Med 2003;349:2042–2054.
63 Jones PA, Baylin SB. The fundamental role of epigenetic events incancer. Nature Reviews 2002;3:415–428.
64 Minucci S, Pelicci PG. Histone deacetylase inhibitors and the promise ofepigenetic (and more) treatments for cancer. Nat Rev Cancer 2006;6:38–51.
65 Costello JF, Fruhwald MC, Smiraglia DJ et al. Aberrant CpG-islandmethylation has non-random and tumour-type-specific patterns. NatGenet 2000;24:132–138.
66 Rakyan VK, Hildmann T, Novik KL et al. DNA methylation profiling ofthe human major histocompatibility complex: A pilot study for thehuman epigenome project. PLoS Biology 2004;2:e405.
67 Kumagai T, Tefferi A, Jones L et al. Methylation analysis of the cellcycle control genes in myelofibrosis with myeloid metaplasia. Leuk Res2005;29:511–515.
68 Wang JC, Chen W, Nallusamy S et al. Hypermethylation of theP15INK4b and P16INK4a in agnogenic myeloid metaplasia (AMM) andAMM in leukaemic transformation. Br J Haematol 2002;116:582–586.
69 Hemavathy KC, Chang TH, Zhang H et al. Reduced expression of TGFbeta1RII in agnogenic myeloid metaplasia is not due to mutation ormethylation. Leuk Res 2006;30:47–53.
70 Li J, Bench AJ, Huntly BJ et al. Mutation and methylation analysis of thetransforming growth factor beta receptor II gene in polycythaemia vera.Br J Haematol 2001;115:872–880.
71 Jones LC, Tefferi A, Idos GE et al. RARbeta2 is a candidate tumorsuppressor gene in myelofibrosis with myeloid metaplasia. Oncogene2004;23:7846–7853.
72 Jost E, do ON, Dahl E et al. Epigenetic alterations complement mutationof JAK2 tyrosine kinase in patients with BCR/ABL-negative myelopro-liferative disorders. Leukemia 2007;21:505–510.
73 Capello D, Deambrogi C, Rossi D et al. Epigenetic inactivation ofsuppressors of cytokine signalling in Philadelphia-negative chronic my-eloproliferative disorders. Br J Haematol 2008;141:504–511.
74 Shi J, Zhao Y, Ishii T et al. Effects of chromatin-modifying agents onCD341 cells from patients with idiopathic myelofibrosis. Cancer Res2007;67:6417–6424.
75 Geay JF, Buet D, Zhang Y et al. p210BCR-ABL inhibits SDF-1 chemo-tactic response via alteration of CXCR4 signaling and down-regulationof CXCR4 expression. Cancer Res 2005;65:2676–2683.
76 Wang JF, Liu ZY, Groopman JE. The alpha-chemokine receptor CXCR4is expressed on the megakaryocytic lineage from progenitor to plateletsand modulates migration and adhesion. Blood 1998;92:756–764.
77 Majka M, Janowska-Wieczorek A, Ratajczak J et al. Stromal-derivedfactor 1 and thrombopoietin regulate distinct aspects of humanmegakaryopoiesis. Blood 2000;96:4142–4151.
78 Hodohara K, Fujii N, Yamamoto N et al. Stromal cell-derived fac-tor-1 (SDF-1) acts together with thrombopoietin to enhance the de-velopment of megakaryocytic progenitor cells (CFU-MK). Blood2000;95:769 –775.
79 Kaushansky K. The molecular mechanisms that control thrombopoiesis.J Clin Invest 2005;115:3339–3347.
See www.StemCells.com for supplemental material available online.
1930 CXCR4 Promoter Hypermethylation in Myelofibrosis


6/ L’adaptateur LNK se lie différentiellement à Jak2V617F et modifie la régulation de la signalisation JAK/STAT chez les patients atteints de néoplasmes myéloprolifératifs.
« Expression level and differential JAK2-V617F-binding of the adaptor protein Lnk
regulates JAK2-mediated signals in myeloproliferative neoplasms ».
Baran-Marszak F, Magdoud H, Desterke C, Alvarado A, Roger C, Harel S, Mazoyer E,
Cassinat B, Chevret S, Tonetti C, Giraudier S, Fenaux P, Cymbalista F, Varin-Blank N,
Le Bousse-Kerdilès MC, Kiladjian JJ, Velazquez L.
Blood. 2010 Dec 23;116(26):5961-71.
LNK est un adaptateur intracellulaire qui peut se lier à Jak2 et transmettre des signaux
de signalisation.
Au cours de cette étude réalisée par le groupe de Laura Velasquez, nous avons montré
que l’expression de LNK est modulée dans les cellules hématopoïétiques de patients atteints
de NMP. LNK se lie différentiellement à Jak2V617F avec, pour conséquence, une modulation
de la signalisation intracellulaire. Enfin, nous avons pu identifier la présence d’une nouvelle
mutation de LNK chez un patient atteint de NMP.
235


MYELOID NEOPLASIA
Expression level and differential JAK2-V617F–binding of the adaptor protein Lnkregulates JAK2-mediated signals in myeloproliferative neoplasms
Fanny Baran-Marszak,1,2 Hajer Magdoud,2,3 Christophe Desterke,4 Anabell Alvarado,2,3 Claudine Roger,1 Stephanie Harel,5
Elizabeth Mazoyer,1 Bruno Cassinat,6 Sylvie Chevret,7 Carole Tonetti,8 Stephane Giraudier,8 Pierre Fenaux,5
Florence Cymbalista,1 Nadine Varin-Blank,2,3 Marie-Caroline Le Bousse-Kerdiles,4 Jean-Jacques Kiladjian,2,3,9 and
Laura Velazquez2,3
1Hopital Avicenne, Assistance Publique–Hopitaux de Paris (AP-HP), Service d’Hematologie Biologique, Bobigny, France; 2Inserm U978, Laboratoire des
Adaptateurs de Signalisation en Hematologie, Bobigny, France; 3Universite Paris 13, UFR SMBH, Bobigny, France; 4Inserm U972, Institut Andre Lwoff,
Univeriste Paris XI, Hopital Paul Brousse, Villejuif, France; 5Hopital Avicenne, AP-HP, Service d’Hematologie Clinique, Bobigny, France; 6Hopital Saint-Louis,
Unite de Biologie Cellulaire, Paris, France; 7Hopital Saint-Louis, Departement de Biostatistique et Informatique Medicale, Paris, France; 8Laboratoire
d’Hematologie, Hopital Henri Mondor, Creteil, France; and 9Hopital Saint-Louis, Clinical Investigation Center and French Intergroup of Myeloproliferative
Disorders (FIM), Paris, France
Activating mutations in signaling mol-
ecules, such as JAK2-V617F, have been
associated with myeloproliferative neo-
plasms (MPNs). Mice lacking the inhibi-
tory adaptor protein Lnk display deregula-
tion of thrombopoietin/thrombopoietin
receptor signaling pathways and exhibit
similar myeloproliferative characteristics
to those found in MPN patients, suggest-
ing a role for Lnk in the molecular patho-
genesis of these diseases. Here, we
showed that LNK levels are up-regulated
and correlate with an increase in the
JAK2-V617F mutant allele burden in MPN
patients. Using megakaryocytic cells, we
demonstrated that Lnk expression is regu-
lated by the TPO-signaling pathway, thus
indicatingan importantnegativecontrol loop
in these cells. Analysis of platelets derived
from MPN patients and megakaryocytic cell
lines showed that Lnk can interact with
JAK2-WT and V617F through its SH2 do-
main, but also through an unrevealed JAK2-
binding site within its N-terminal region. In
addition, the presence of the V617F muta-
tion causes a tighter association with Lnk.
Finally, we found that the expression level of
the Lnk protein can modulate JAK2-V617F–
dependent cell proliferation and that its dif-
ferent domains contribute to the inhibition
of multilineage and megakaryocytic progeni-
tor cell growth in vitro. Together, our results
indicate that changes in Lnk expression and
JAK2-V617F–binding regulate JAK2-medi-
ated signals in MPNs. (Blood. 2010;116(26):
5961-5971)
Introduction
Philadelphia-negative myeloproliferative neoplasms (MPN) are
clonal hematopoietic stem cell (HSC) diseases characterized by
deregulated proliferation of one or several myeloid lineages. These
heterogeneous and phenotypically related disorders include chronic
myeloid leukemia, polycythemia vera (PV), essential thrombocy-
themia (ET), and primary myelofibrosis (PMF).1 The molecular
pathogenesis of MPNs was poorly understood until the identifica-
tion of the JAK2-V617F mutant allele. This acquired somatic
mutation (valine to phenylalanine substitution at position 617,
V617F) renders the kinase constitutively active, confers cytokine
hypersensitivity, independent growth to hematopoietic cells, and
reproduces an MPN phenotype in murine bone marrow transplanta-
tion assays.2-6 The JAK2-V617F mutant protein has been identified
in approximately 95% of PV, 60% of ET, and 50% of PMF
patients.2,7 Recently, gain-of-function point mutations were identi-
fied in the cytoplasmic domain of the myeloproliferative leukemia
virus oncogene (MPL), the receptor for thrombopoietin (TPO), in
2% to 5% of ET and PMF patients, respectively. These mutations
(MPL-W515L) were shown to induce MPN with marked thrombo-
cytosis in a mouse model.8,9 These findings therefore show that
abnormal activation of signaling molecules plays an important role
in the pathogenesis of MPNs. However, how defects in these
molecules can lead to myeloproliferation in patients remains
unknown.
Lnk [also known as Src homology 2 (SH2) B3] is a member of
the adaptor protein family composed of SH2-B (SH2B1) and APS
(SH2B2). These proteins share common protein-protein interaction
domains and motifs: a dimerization domain and proline-rich motifs
at the N terminus, a pleckstrin homology (PH) and SH2 domains,
and a conserved tyrosine at the C terminus.10 Lnk-deficient mice
have demonstrated the importance of this adaptor as a negative
regulator of cytokine signaling during hematopoiesis. Analysis of
Lnk2/2-derived HSC and myeloid progenitors has shown that Lnk
controls TPO-induced self-renewal, quiescence and proliferation of
these cells.11-14 Moreover, Lnk2/2 animals displayed not only
disrupted B lymphopoiesis, but also abnormal megakaryopoiesis
and erythropoiesis, as a result of the absence of negative regulation
of TPO and erythropoietin (EPO) signaling pathways, respec-
tively.15-17 Indeed, Lnk, through its SH2 domain, negatively
modulates MPL, and EPO receptor (EPOR) signaling by attenuat-
ing JAK2 activation. Recently, Lnk was also shown to bind and
regulate MPL-W515L and JAK2-V617F forms when expressed in
hematopoietic cell lines.11,18,19 These results suggest that these
mutant proteins can still undergo Lnk negative regulation.
Submitted December 4, 2009; accepted September 12, 2010. Prepublished
online as Blood First Edition paper, September 24, 2010; DOI 10.1182/blood-
2009-12-256768.
The online version of this article contains a data supplement.
The publication costs of this article were defrayed in part by page charge
payment. Therefore, and solely to indicate this fact, this article is hereby
marked ‘‘advertisement’’ in accordance with 18 USC section 1734.
© 2010 by The American Society of Hematology
5961BLOOD, 23 DECEMBER 2010 z VOLUME 116, NUMBER 26
For personal use only. at INSERM DISC on February 23, 2011. www.bloodjournal.orgFrom
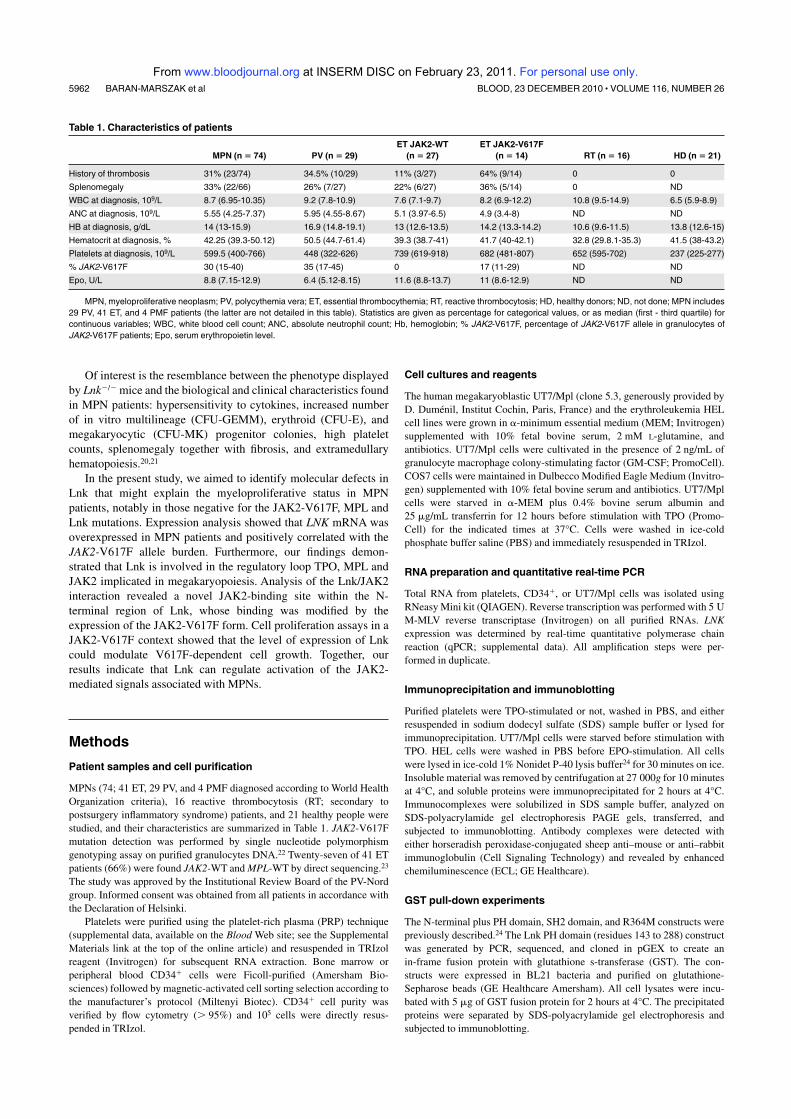
Of interest is the resemblance between the phenotype displayed
by Lnk2/2 mice and the biological and clinical characteristics found
in MPN patients: hypersensitivity to cytokines, increased number
of in vitro multilineage (CFU-GEMM), erythroid (CFU-E), and
megakaryocytic (CFU-MK) progenitor colonies, high platelet
counts, splenomegaly together with fibrosis, and extramedullary
hematopoiesis.20,21
In the present study, we aimed to identify molecular defects in
Lnk that might explain the myeloproliferative status in MPN
patients, notably in those negative for the JAK2-V617F, MPL and
Lnk mutations. Expression analysis showed that LNK mRNA was
overexpressed in MPN patients and positively correlated with the
JAK2-V617F allele burden. Furthermore, our findings demon-
strated that Lnk is involved in the regulatory loop TPO, MPL and
JAK2 implicated in megakaryopoiesis. Analysis of the Lnk/JAK2
interaction revealed a novel JAK2-binding site within the N-
terminal region of Lnk, whose binding was modified by the
expression of the JAK2-V617F form. Cell proliferation assays in a
JAK2-V617F context showed that the level of expression of Lnk
could modulate V617F-dependent cell growth. Together, our
results indicate that Lnk can regulate activation of the JAK2-
mediated signals associated with MPNs.
Methods
Patient samples and cell purification
MPNs (74; 41 ET, 29 PV, and 4 PMF diagnosed according to World Health
Organization criteria), 16 reactive thrombocytosis (RT; secondary to
postsurgery inflammatory syndrome) patients, and 21 healthy people were
studied, and their characteristics are summarized in Table 1. JAK2-V617F
mutation detection was performed by single nucleotide polymorphism
genotyping assay on purified granulocytes DNA.22 Twenty-seven of 41 ET
patients (66%) were found JAK2-WT and MPL-WT by direct sequencing.23
The study was approved by the Institutional Review Board of the PV-Nord
group. Informed consent was obtained from all patients in accordance with
the Declaration of Helsinki.
Platelets were purified using the platelet-rich plasma (PRP) technique
(supplemental data, available on the Blood Web site; see the Supplemental
Materials link at the top of the online article) and resuspended in TRIzol
reagent (Invitrogen) for subsequent RNA extraction. Bone marrow or
peripheral blood CD341 cells were Ficoll-purified (Amersham Bio-
sciences) followed by magnetic-activated cell sorting selection according to
the manufacturer’s protocol (Miltenyi Biotec). CD341 cell purity was
verified by flow cytometry (. 95%) and 105 cells were directly resus-
pended in TRIzol.
Cell cultures and reagents
The human megakaryoblastic UT7/Mpl (clone 5.3, generously provided by
D. Dumenil, Institut Cochin, Paris, France) and the erythroleukemia HEL
cell lines were grown in a-minimum essential medium (MEM; Invitrogen)
supplemented with 10% fetal bovine serum, 2 mM L-glutamine, and
antibiotics. UT7/Mpl cells were cultivated in the presence of 2 ng/mL of
granulocyte macrophage colony-stimulating factor (GM-CSF; PromoCell).
COS7 cells were maintained in Dulbecco Modified Eagle Medium (Invitro-
gen) supplemented with 10% fetal bovine serum and antibiotics. UT7/Mpl
cells were starved in a-MEM plus 0.4% bovine serum albumin and
25 mg/mL transferrin for 12 hours before stimulation with TPO (Promo-
Cell) for the indicated times at 37°C. Cells were washed in ice-cold
phosphate buffer saline (PBS) and immediately resuspended in TRIzol.
RNA preparation and quantitative real-time PCR
Total RNA from platelets, CD341, or UT7/Mpl cells was isolated using
RNeasy Mini kit (QIAGEN). Reverse transcription was performed with 5 U
M-MLV reverse transcriptase (Invitrogen) on all purified RNAs. LNK
expression was determined by real-time quantitative polymerase chain
reaction (qPCR; supplemental data). All amplification steps were per-
formed in duplicate.
Immunoprecipitation and immunoblotting
Purified platelets were TPO-stimulated or not, washed in PBS, and either
resuspended in sodium dodecyl sulfate (SDS) sample buffer or lysed for
immunoprecipitation. UT7/Mpl cells were starved before stimulation with
TPO. HEL cells were washed in PBS before EPO-stimulation. All cells
were lysed in ice-cold 1% Nonidet P-40 lysis buffer24 for 30 minutes on ice.
Insoluble material was removed by centrifugation at 27 000g for 10 minutes
at 4°C, and soluble proteins were immunoprecipitated for 2 hours at 4°C.
Immunocomplexes were solubilized in SDS sample buffer, analyzed on
SDS-polyacrylamide gel electrophoresis PAGE gels, transferred, and
subjected to immunoblotting. Antibody complexes were detected with
either horseradish peroxidase-conjugated sheep anti–mouse or anti–rabbit
immunoglobulin (Cell Signaling Technology) and revealed by enhanced
chemiluminescence (ECL; GE Healthcare).
GST pull-down experiments
The N-terminal plus PH domain, SH2 domain, and R364M constructs were
previously described.24 The Lnk PH domain (residues 143 to 288) construct
was generated by PCR, sequenced, and cloned in pGEX to create an
in-frame fusion protein with glutathione s-transferase (GST). The con-
structs were expressed in BL21 bacteria and purified on glutathione-
Sepharose beads (GE Healthcare Amersham). All cell lysates were incu-
bated with 5 mg of GST fusion protein for 2 hours at 4°C. The precipitated
proteins were separated by SDS-polyacrylamide gel electrophoresis and
subjected to immunoblotting.
Table 1. Characteristics of patients
MPN (n 5 74) PV (n 5 29)
ET JAK2-WT
(n 5 27)
ET JAK2-V617F
(n 5 14) RT (n 5 16) HD (n 5 21)
History of thrombosis 31% (23/74) 34.5% (10/29) 11% (3/27) 64% (9/14) 0 0
Splenomegaly 33% (22/66) 26% (7/27) 22% (6/27) 36% (5/14) 0 ND
WBC at diagnosis, 109/L 8.7 (6.95-10.35) 9.2 (7.8-10.9) 7.6 (7.1-9.7) 8.2 (6.9-12.2) 10.8 (9.5-14.9) 6.5 (5.9-8.9)
ANC at diagnosis, 109/L 5.55 (4.25-7.37) 5.95 (4.55-8.67) 5.1 (3.97-6.5) 4.9 (3.4-8) ND ND
HB at diagnosis, g/dL 14 (13-15.9) 16.9 (14.8-19.1) 13 (12.6-13.5) 14.2 (13.3-14.2) 10.6 (9.6-11.5) 13.8 (12.6-15)
Hematocrit at diagnosis, % 42.25 (39.3-50.12) 50.5 (44.7-61.4) 39.3 (38.7-41) 41.7 (40-42.1) 32.8 (29.8.1-35.3) 41.5 (38-43.2)
Platelets at diagnosis, 109/L 599.5 (400-766) 448 (322-626) 739 (619-918) 682 (481-807) 652 (595-702) 237 (225-277)
% JAK2-V617F 30 (15-40) 35 (17-45) 0 17 (11-29) ND ND
Epo, U/L 8.8 (7.15-12.9) 6.4 (5.12-8.15) 11.6 (8.8-13.7) 11 (8.6-12.9) ND ND
MPN, myeloproliferative neoplasm; PV, polycythemia vera; ET, essential thrombocythemia; RT, reactive thrombocytosis; HD, healthy donors; ND, not done; MPN includes
29 PV, 41 ET, and 4 PMF patients (the latter are not detailed in this table). Statistics are given as percentage for categorical values, or as median (first - third quartile) for
continuous variables; WBC, white blood cell count; ANC, absolute neutrophil count; Hb, hemoglobin; % JAK2-V617F, percentage of JAK2-V617F allele in granulocytes of
JAK2-V617F patients; Epo, serum erythropoietin level.
5962 BARAN-MARSZAK et al BLOOD, 23 DECEMBER 2010 z VOLUME 116, NUMBER 26
For personal use only. at INSERM DISC on February 23, 2011. www.bloodjournal.orgFrom

Lin2 progenitor cells purification, retroviral transduction, and
in vitro colony assays
Lnk point mutations and retroviral supernatant preparation were previously
described.24 APS cDNA was subcloned into the MSCV-IRES-GFP (MIG)
retroviral vector. Lin2 progenitor cells from wild-type (WT), Lnk2/2 mice21
or hematopoietic cell lines were retrovirally infected and GFP1 sorted.24
Expression of the transduced genes was verified by reverse transcription
PCR (RT-PCR). Triplicate samples of 103 cells (for CFU-GEMM) or
5 3 103 cells (for CFU-Meg) were seeded in methylcellulose media
(MethoCult M3434; Stem Cell Technologies) or in collagen-based media
(MegaCult-C), respectively, and incubated at 37°C, 5% CO2. CFU-GEMMs
were counted at 8 days after benzidine (Sigma-Aldrich) staining. CFU-
Megs were stained for acetylcholinesterase activity (Sigma-Aldrich) and
counted after 6 days of incubation.
Statistical analysis
Statistical analysis was performed on R package (http://www.R-projec-
t.org). Summary statistics were computed, namely percentages for qualita-
tive variables and median with interquartile range for continuous variables.
Wilcoxon rank sum tests were used to compare distribution function of Lnk
according to subsets of patients.
Results
Rare Lnk mutations are associated with MPNs
Activating point mutations in signaling molecules have been
associated with MPNs. This has raised the question whether
aberrant expression/function of molecules in cytokine receptor
signaling can explain MPN clinical phenotypes. Because loss of
Lnk in mice results in similar characteristics to those found in MPN
patients, we initially searched for mutations in the LNK gene.
Recently, 2 different mutations in the PH domain of Lnk were
described in 2 of 33 (6%) ET and PMF patients studied.25 We have
found one mutation (not reported in public single-nucleotide
polymorphism databases) in the N-terminal region of Lnk (G152R)
in 1 of 73 (1.4%) ET (JAK2-WT and MPL-WT) patients by
granulocyte DNA analysis. Our result combined with those previ-
ously published, confirm that Lnk mutations are very rare events,
probably less than 5%, and therefore, their role in the pathogenesis
of MPNs has to be confirmed by functional assays. Consequently,
we aimed in this study to search for molecular defects, other than
mutations, that could play a role in the pathogenesis of MPNs.
Lnk expression is up-regulated in MPN patients
We first examined the expression level of LNK in MPNs and
whether this could correlate with the percentage of JAK2-V617F
mutant allele. LNK mRNA expression was measured by real-time
qPCR analysis in platelets from 74 MPNs, 16 RT patients, and
21 healthy people. MPN patients (JAK2-WT and V617F) showed
significantly higher expression of LNK transcripts than healthy
controls (Figure 1A). Among these patients, no difference in LNK
expression was observed between ET and PV samples (P 5 .74).
However, LNK expression was significantly higher in JAK2-V617F-
positive patients compared with controls (median [Q1-Q3]:
69 [27-135] vs. 15 [10-38]). Moreover, a positive correlation
between the percentage of JAK2-V617F mutant allele and LNK
mRNA expression was observed in MPN platelets (supplemental
Figure 1). Furthermore, LNK mRNA expression in platelets derived
from RT patients was also significantly higher (82 [43-112]) than
healthy controls, but relatively similar to JAK2-V617F MPN
patients (P 5 .09). Because RT patients often exhibit elevated
serum TPO levels, our findings suggest that LNK overexpression in
these patients is caused by an activation of the TPO signaling
pathway.26
We next examined the expression of LNK mRNA in CD341
cells isolated from peripheral blood of PMF patients (JAK2-V617F,
n 5 26 and JAK2-WT, n 5 17) by real-time qPCR. Figure 1B
showed that LNK expression was significantly increased in CD341
cells from JAK2-V617F PMF patients (1.56 6 1.19) compared
with cells from healthy donors (bone marrow and peripheral blood
controls: 1.03 6 0.29; n 5 16). In contrast, there was no significant
difference between JAK2-WT PMF and healthy controls. Markedly
increased expression of LNK was also found in 2 of 5 CD341 cells
derived from JAK2-V617F PV bone marrow (Figure 1B), suggest-
ing that LNK overexpression can be found in a proportion of MPN
immature progenitors.
No correlation was found between LNK mRNA levels and most
of the clinical and biological parameters examined, including
history of thrombosis, splenomegaly, WBC, ANC, hemoglobin,
platelet counts, and EPO level (Table 1). However, cytoreductive
treatment seemed to affect LNK mRNA levels; MPN patients
treated with interferon-a (IFN-a) displayed significantly lower
levels of LNK mRNA (39 6 36; n 5 18) than those treated with
Figure 1. Lnk is overexpressed in MPNs. (A-B) Relative expression of total LNK
mRNA was determined by real-time PCR using either the TaqMan method on purified
platelets (A) or the SYB Green method on sorted CD341 cells (B). Relative LNK
mRNA levels are expressed in arbitrary units (A) or log2 (B) of ratios obtained using
housekeeping genes for normalization. The horizontal line in the box marks the
median and bars indicate the range of values. All P values were 2-sided with
P # .05 denoting statistical significance: *P 5 .0076; **P , .0001; ***P 5 .004. All
patients were studied in duplicate. RT, reactive thrombocytosis; PV, polycythemia
vera; PMF, primary myelofibrosis.
Lnk MODULATES MPN-ASSOCIATED JAK2 FORMS 5963BLOOD, 23 DECEMBER 2010 z VOLUME 116, NUMBER 26
For personal use only. at INSERM DISC on February 23, 2011. www.bloodjournal.orgFrom
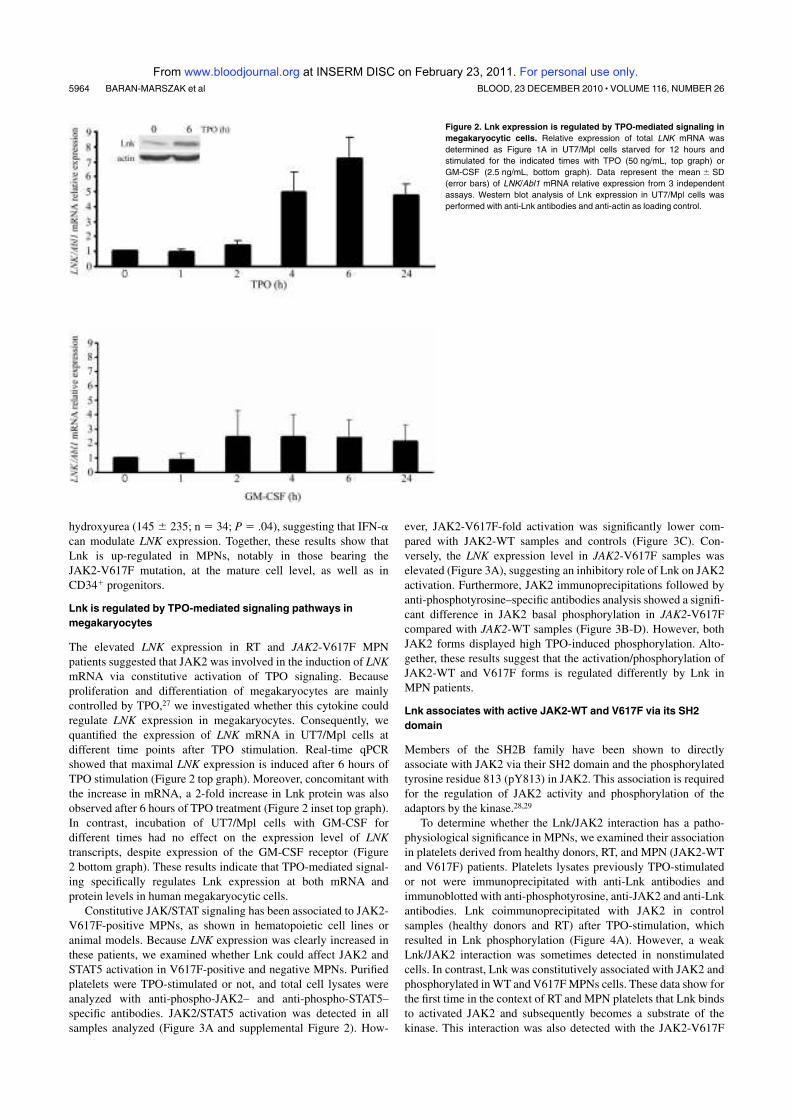
hydroxyurea (145 6 235; n 5 34; P 5 .04), suggesting that IFN-a
can modulate LNK expression. Together, these results show that
Lnk is up-regulated in MPNs, notably in those bearing the
JAK2-V617F mutation, at the mature cell level, as well as in
CD341 progenitors.
Lnk is regulated by TPO-mediated signaling pathways in
megakaryocytes
The elevated LNK expression in RT and JAK2-V617F MPN
patients suggested that JAK2 was involved in the induction of LNK
mRNA via constitutive activation of TPO signaling. Because
proliferation and differentiation of megakaryocytes are mainly
controlled by TPO,27 we investigated whether this cytokine could
regulate LNK expression in megakaryocytes. Consequently, we
quantified the expression of LNK mRNA in UT7/Mpl cells at
different time points after TPO stimulation. Real-time qPCR
showed that maximal LNK expression is induced after 6 hours of
TPO stimulation (Figure 2 top graph). Moreover, concomitant with
the increase in mRNA, a 2-fold increase in Lnk protein was also
observed after 6 hours of TPO treatment (Figure 2 inset top graph).
In contrast, incubation of UT7/Mpl cells with GM-CSF for
different times had no effect on the expression level of LNK
transcripts, despite expression of the GM-CSF receptor (Figure
2 bottom graph). These results indicate that TPO-mediated signal-
ing specifically regulates Lnk expression at both mRNA and
protein levels in human megakaryocytic cells.
Constitutive JAK/STAT signaling has been associated to JAK2-
V617F-positive MPNs, as shown in hematopoietic cell lines or
animal models. Because LNK expression was clearly increased in
these patients, we examined whether Lnk could affect JAK2 and
STAT5 activation in V617F-positive and negative MPNs. Purified
platelets were TPO-stimulated or not, and total cell lysates were
analyzed with anti-phospho-JAK2– and anti-phospho-STAT5–
specific antibodies. JAK2/STAT5 activation was detected in all
samples analyzed (Figure 3A and supplemental Figure 2). How-
ever, JAK2-V617F-fold activation was significantly lower com-
pared with JAK2-WT samples and controls (Figure 3C). Con-
versely, the LNK expression level in JAK2-V617F samples was
elevated (Figure 3A), suggesting an inhibitory role of Lnk on JAK2
activation. Furthermore, JAK2 immunoprecipitations followed by
anti-phosphotyrosine–specific antibodies analysis showed a signifi-
cant difference in JAK2 basal phosphorylation in JAK2-V617F
compared with JAK2-WT samples (Figure 3B-D). However, both
JAK2 forms displayed high TPO-induced phosphorylation. Alto-
gether, these results suggest that the activation/phosphorylation of
JAK2-WT and V617F forms is regulated differently by Lnk in
MPN patients.
Lnk associates with active JAK2-WT and V617F via its SH2
domain
Members of the SH2B family have been shown to directly
associate with JAK2 via their SH2 domain and the phosphorylated
tyrosine residue 813 (pY813) in JAK2. This association is required
for the regulation of JAK2 activity and phosphorylation of the
adaptors by the kinase.28,29
To determine whether the Lnk/JAK2 interaction has a patho-
physiological significance in MPNs, we examined their association
in platelets derived from healthy donors, RT, and MPN (JAK2-WT
and V617F) patients. Platelets lysates previously TPO-stimulated
or not were immunoprecipitated with anti-Lnk antibodies and
immunoblotted with anti-phosphotyrosine, anti-JAK2 and anti-Lnk
antibodies. Lnk coimmunoprecipitated with JAK2 in control
samples (healthy donors and RT) after TPO-stimulation, which
resulted in Lnk phosphorylation (Figure 4A). However, a weak
Lnk/JAK2 interaction was sometimes detected in nonstimulated
cells. In contrast, Lnk was constitutively associated with JAK2 and
phosphorylated in WT and V617F MPNs cells. These data show for
the first time in the context of RT and MPN platelets that Lnk binds
to activated JAK2 and subsequently becomes a substrate of the
kinase. This interaction was also detected with the JAK2-V617F
Figure 2. Lnk expression is regulated by TPO-mediated signaling in
megakaryocytic cells. Relative expression of total LNK mRNA was
determined as Figure 1A in UT7/Mpl cells starved for 12 hours and
stimulated for the indicated times with TPO (50 ng/mL, top graph) or
GM-CSF (2.5 ng/mL, bottom graph). Data represent the mean 6 SD
(error bars) of LNK/Abl1 mRNA relative expression from 3 independent
assays. Western blot analysis of Lnk expression in UT7/Mpl cells was
performed with anti-Lnk antibodies and anti-actin as loading control.
5964 BARAN-MARSZAK et al BLOOD, 23 DECEMBER 2010 z VOLUME 116, NUMBER 26
For personal use only. at INSERM DISC on February 23, 2011. www.bloodjournal.orgFrom

mutant form demonstrating that this mutation does not affect the
Lnk/JAK2 association.
Lnk was recently reported to interact with JAK2 through its
SH2 domain in response to TPO stimulation. We examined whether
this domain was necessary for Lnk/JAK2 association in a JAK2-WT
and V617F context. First, we infected UT7/Mpl (JAK2-WT) cells
with retroviral supernatants expressing control vector, WT, or
SH2-inactive Lnk mutant (R364M) form. Lnk immunoprecipita-
tion analysis on UT7/Mpl infected cells showed that only WT Lnk
associated with activated JAK2-WT, this interaction resulting in
Lnk phosphorylation (Figure 4B first and third left panels). In
contrast, the R364M mutation highly diminished Lnk association
with activated JAK2-WT and abolished Lnk phosphorylation.
Interestingly, we could detect an interaction between WT or
R364M Lnk and nonphosphorylated JAK2 (Figure 4B second left
panel), which suggests that Lnk can bind to inactive JAK2 through
another domain.
We next analyzed Lnk/JAK2 interaction in a V617F context.
HEL (JAK2-V617F) cells infected with the different Lnk forms, as
described above, were stimulated with EPO and immunoprecipi-
tated with anti-Lnk antibodies. Our data confirmed that Lnk also
binds JAK2-V617F form via its SH2 domain, resulting in constitu-
tive Lnk phosphorylation (Figure 4B right panels). Moreover, an
interaction with R364M Lnk could now be observed with this
JAK2 active form, suggesting a change in the Lnk/JAK2 interac-
tion in the presence of the V617F mutation (Figure 4B third right
panel). This result also supports the implication of a second Lnk
domain in its association with JAK2.
A second JAK2-binding site within Lnk N-terminal region
To identify other domains of Lnk involved in its interaction with
JAK2, we performed GST pull-down experiments using GST
fusion proteins expressing either the Lnk SH2 domain (SH2), the
SH2 inactive form (R364M), the PH domain alone (PH) or together
with the N-terminal region (NPH; Figure 5A). UT7/Mpl cells
treated with or without TPO were incubated with equal amounts of
the different Lnk GST fusion proteins (Figure 5B, bottom panel),
and bound proteins were analyzed with anti-phosphotyrosine and
anti-JAK2 specific antibodies. Only WT Lnk SH2 domain was able
to bind to phosphorylated JAK2 (Figure 5B). Neither the R364M,
nor the NPH protein could associate with the activated kinase.
However, weak binding between the NPH fusion protein and JAK2
was observed in untreated cells when probed with anti-JAK2
Figure 3. Activation of JAK/STAT signaling pathways in MPN platelets. (A) Total platelet lysates from MPN patients (JAK2-WT and V617F) and healthy donors (N) were
stimulated (1) or not (2) for 10 minutes with TPO (100 ng/mL) and then subjected to immunoblot analysis with anti-phospho-JAK2 (p-JAK2) and anti-phospho-STAT5
(p-STAT5) antibodies. Total JAK2 and STAT5 levels were analyzed with anti-JAK2 and anti-STAT5 antibodies. Blot quantification was performed with multi Gauge software
(Fujifilm). Numbers under the phospho-JAK2 blots show the ratios (arbitrary units) of phospho-JAK2/total JAK2. Actin blot is shown as loading control; numbers under this blot
denote the mRNA expression level of LNK for each patient. (B) Platelet lysates from healthy donors (N), JAK2-WT and V617F MPN patients were stimulated with or without
TPO for 10 minutes and immunoprecipitated with anti-JAK2 antibodies. Western blot analysis with anti-phosphotyrosine (anti-p-Tyr) antibodies allowed identification of
phosphorylated JAK2 protein (top panel). Total JAK2 protein expression is shown (bottom panel). Numbers under the p-Tyr blots show the ratios (arbitrary units) of
phospho-JAK2/total JAK2. ET, essential thrombocythemia; PV, polycythemia vera; n.d., not done. (C) Graphic representation of JAK2-fold activation. Data represent the
normalized ratios of TPO-induced phospho-JAK2/nonstimulated phospho-JAK2 from (A). Statistical significance was determined using the Student t test: *P 5 .0025;
**P 5 .0386. (D) Graphic representation of JAK2 phosphorylation status, data represent the normalized ratios of p-TyrJAK2/total JAK2 (arbitrary units) from panel B,
***P 5 .047.
Lnk MODULATES MPN-ASSOCIATED JAK2 FORMS 5965BLOOD, 23 DECEMBER 2010 z VOLUME 116, NUMBER 26
For personal use only. at INSERM DISC on February 23, 2011. www.bloodjournal.orgFrom
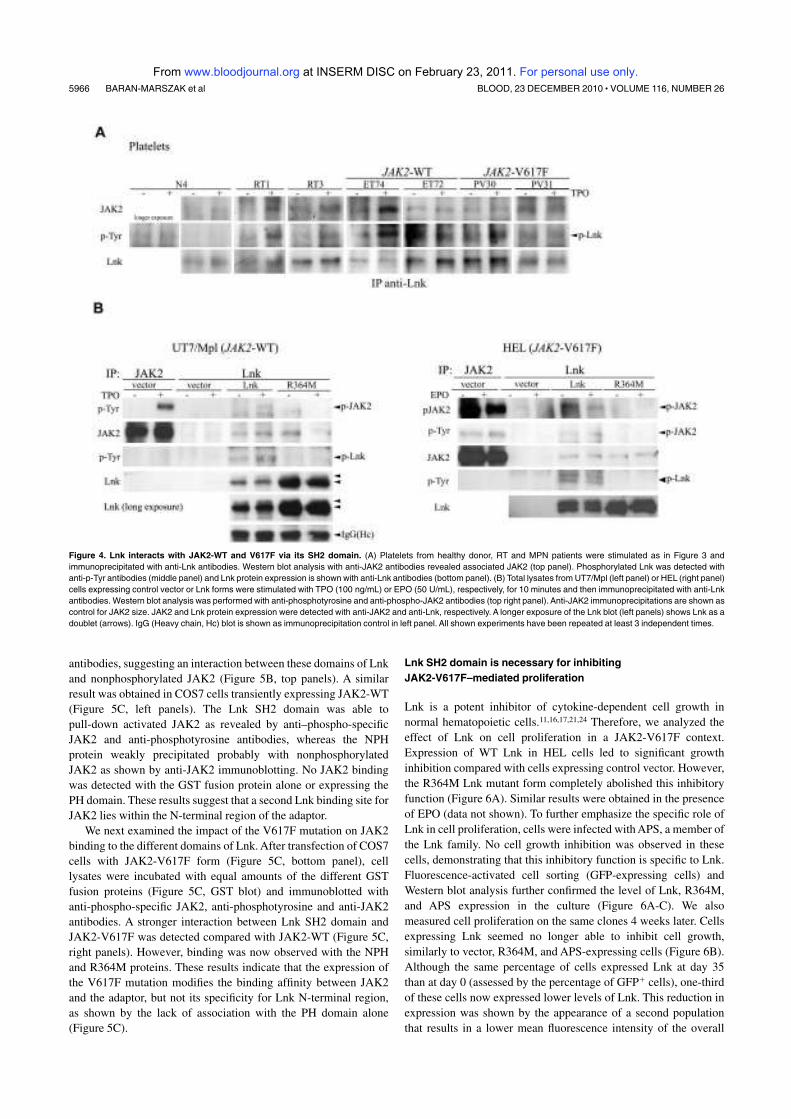
antibodies, suggesting an interaction between these domains of Lnk
and nonphosphorylated JAK2 (Figure 5B, top panels). A similar
result was obtained in COS7 cells transiently expressing JAK2-WT
(Figure 5C, left panels). The Lnk SH2 domain was able to
pull-down activated JAK2 as revealed by anti–phospho-specific
JAK2 and anti-phosphotyrosine antibodies, whereas the NPH
protein weakly precipitated probably with nonphosphorylated
JAK2 as shown by anti-JAK2 immunoblotting. No JAK2 binding
was detected with the GST fusion protein alone or expressing the
PH domain. These results suggest that a second Lnk binding site for
JAK2 lies within the N-terminal region of the adaptor.
We next examined the impact of the V617F mutation on JAK2
binding to the different domains of Lnk. After transfection of COS7
cells with JAK2-V617F form (Figure 5C, bottom panel), cell
lysates were incubated with equal amounts of the different GST
fusion proteins (Figure 5C, GST blot) and immunoblotted with
anti-phospho-specific JAK2, anti-phosphotyrosine and anti-JAK2
antibodies. A stronger interaction between Lnk SH2 domain and
JAK2-V617F was detected compared with JAK2-WT (Figure 5C,
right panels). However, binding was now observed with the NPH
and R364M proteins. These results indicate that the expression of
the V617F mutation modifies the binding affinity between JAK2
and the adaptor, but not its specificity for Lnk N-terminal region,
as shown by the lack of association with the PH domain alone
(Figure 5C).
Lnk SH2 domain is necessary for inhibiting
JAK2-V617F–mediated proliferation
Lnk is a potent inhibitor of cytokine-dependent cell growth in
normal hematopoietic cells.11,16,17,21,24 Therefore, we analyzed the
effect of Lnk on cell proliferation in a JAK2-V617F context.
Expression of WT Lnk in HEL cells led to significant growth
inhibition compared with cells expressing control vector. However,
the R364M Lnk mutant form completely abolished this inhibitory
function (Figure 6A). Similar results were obtained in the presence
of EPO (data not shown). To further emphasize the specific role of
Lnk in cell proliferation, cells were infected with APS, a member of
the Lnk family. No cell growth inhibition was observed in these
cells, demonstrating that this inhibitory function is specific to Lnk.
Fluorescence-activated cell sorting (GFP-expressing cells) and
Western blot analysis further confirmed the level of Lnk, R364M,
and APS expression in the culture (Figure 6A-C). We also
measured cell proliferation on the same clones 4 weeks later. Cells
expressing Lnk seemed no longer able to inhibit cell growth,
similarly to vector, R364M, and APS-expressing cells (Figure 6B).
Although the same percentage of cells expressed Lnk at day 35
than at day 0 (assessed by the percentage of GFP1 cells), one-third
of these cells now expressed lower levels of Lnk. This reduction in
expression was shown by the appearance of a second population
that results in a lower mean fluorescence intensity of the overall
Figure 4. Lnk interacts with JAK2-WT and V617F via its SH2 domain. (A) Platelets from healthy donor, RT and MPN patients were stimulated as in Figure 3 and
immunoprecipitated with anti-Lnk antibodies. Western blot analysis with anti-JAK2 antibodies revealed associated JAK2 (top panel). Phosphorylated Lnk was detected with
anti-p-Tyr antibodies (middle panel) and Lnk protein expression is shown with anti-Lnk antibodies (bottom panel). (B) Total lysates from UT7/Mpl (left panel) or HEL (right panel)
cells expressing control vector or Lnk forms were stimulated with TPO (100 ng/mL) or EPO (50 U/mL), respectively, for 10 minutes and then immunoprecipitated with anti-Lnk
antibodies. Western blot analysis was performed with anti-phosphotyrosine and anti-phospho-JAK2 antibodies (top right panel). Anti-JAK2 immunoprecipitations are shown as
control for JAK2 size. JAK2 and Lnk protein expression were detected with anti-JAK2 and anti-Lnk, respectively. A longer exposure of the Lnk blot (left panels) shows Lnk as a
doublet (arrows). IgG (Heavy chain, Hc) blot is shown as immunoprecipitation control in left panel. All shown experiments have been repeated at least 3 independent times.
5966 BARAN-MARSZAK et al BLOOD, 23 DECEMBER 2010 z VOLUME 116, NUMBER 26
For personal use only. at INSERM DISC on February 23, 2011. www.bloodjournal.orgFrom
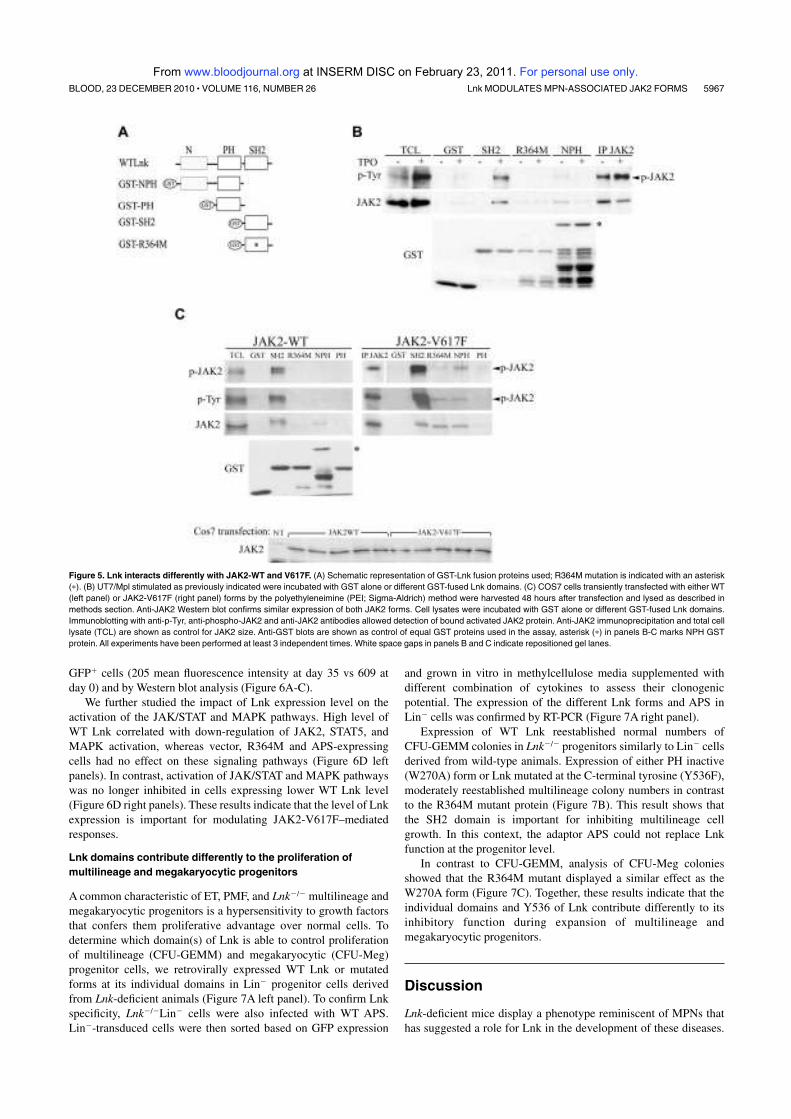
GFP1 cells (205 mean fluorescence intensity at day 35 vs 609 at
day 0) and by Western blot analysis (Figure 6A-C).
We further studied the impact of Lnk expression level on the
activation of the JAK/STAT and MAPK pathways. High level of
WT Lnk correlated with down-regulation of JAK2, STAT5, and
MAPK activation, whereas vector, R364M and APS-expressing
cells had no effect on these signaling pathways (Figure 6D left
panels). In contrast, activation of JAK/STAT and MAPK pathways
was no longer inhibited in cells expressing lower WT Lnk level
(Figure 6D right panels). These results indicate that the level of Lnk
expression is important for modulating JAK2-V617F–mediated
responses.
Lnk domains contribute differently to the proliferation of
multilineage and megakaryocytic progenitors
A common characteristic of ET, PMF, and Lnk2/2 multilineage and
megakaryocytic progenitors is a hypersensitivity to growth factors
that confers them proliferative advantage over normal cells. To
determine which domain(s) of Lnk is able to control proliferation
of multilineage (CFU-GEMM) and megakaryocytic (CFU-Meg)
progenitor cells, we retrovirally expressed WT Lnk or mutated
forms at its individual domains in Lin2 progenitor cells derived
from Lnk-deficient animals (Figure 7A left panel). To confirm Lnk
specificity, Lnk2/2Lin2 cells were also infected with WT APS.
Lin2-transduced cells were then sorted based on GFP expression
and grown in vitro in methylcellulose media supplemented with
different combination of cytokines to assess their clonogenic
potential. The expression of the different Lnk forms and APS in
Lin2 cells was confirmed by RT-PCR (Figure 7A right panel).
Expression of WT Lnk reestablished normal numbers of
CFU-GEMM colonies in Lnk2/2 progenitors similarly to Lin2 cells
derived from wild-type animals. Expression of either PH inactive
(W270A) form or Lnk mutated at the C-terminal tyrosine (Y536F),
moderately reestablished multilineage colony numbers in contrast
to the R364M mutant protein (Figure 7B). This result shows that
the SH2 domain is important for inhibiting multilineage cell
growth. In this context, the adaptor APS could not replace Lnk
function at the progenitor level.
In contrast to CFU-GEMM, analysis of CFU-Meg colonies
showed that the R364M mutant displayed a similar effect as the
W270A form (Figure 7C). Together, these results indicate that the
individual domains and Y536 of Lnk contribute differently to its
inhibitory function during expansion of multilineage and
megakaryocytic progenitors.
Discussion
Lnk-deficient mice display a phenotype reminiscent of MPNs that
has suggested a role for Lnk in the development of these diseases.
Figure 5. Lnk interacts differently with JAK2-WT and V617F. (A) Schematic representation of GST-Lnk fusion proteins used; R364M mutation is indicated with an asterisk
(p). (B) UT7/Mpl stimulated as previously indicated were incubated with GST alone or different GST-fused Lnk domains. (C) COS7 cells transiently transfected with either WT
(left panel) or JAK2-V617F (right panel) forms by the polyethyleneimine (PEI; Sigma-Aldrich) method were harvested 48 hours after transfection and lysed as described in
methods section. Anti-JAK2 Western blot confirms similar expression of both JAK2 forms. Cell lysates were incubated with GST alone or different GST-fused Lnk domains.
Immunoblotting with anti-p-Tyr, anti-phospho-JAK2 and anti-JAK2 antibodies allowed detection of bound activated JAK2 protein. Anti-JAK2 immunoprecipitation and total cell
lysate (TCL) are shown as control for JAK2 size. Anti-GST blots are shown as control of equal GST proteins used in the assay, asterisk (p) in panels B-C marks NPH GST
protein. All experiments have been performed at least 3 independent times. White space gaps in panels B and C indicate repositioned gel lanes.
Lnk MODULATES MPN-ASSOCIATED JAK2 FORMS 5967BLOOD, 23 DECEMBER 2010 z VOLUME 116, NUMBER 26
For personal use only. at INSERM DISC on February 23, 2011. www.bloodjournal.orgFrom

Recently, the first Lnk mutations in ET and PMF patients have been
identified.25 We confirm that the prevalence of such mutations is
rare (5% or less) in JAK2-WT ET patients and therefore, the
significance of Lnk mutations in MPN pathogenesis remains
unclear. In this study, we have addressed the question of other
mechanisms accounting for abnormal Lnk function by analyzing
cells derived from MPN patients, Lnk2/2 progenitors and hemato-
poietic cell lines expressing WT or mutated forms of either JAK2
or Lnk. Our results show that Lnk expression is up-regulated by the
TPO/MPL/JAK2 pathway in megakaryocytic and MPN primary
cells. Furthermore, we demonstrate that changes in the level of Lnk
expression and in its binding to JAK2-V617F can modulate the
responses mediated by the JAK2 forms expressed in these diseases.
Our previous analyses of Lnk2/2 mice suggested tight regula-
tion of Lnk during hematopoiesis.21 In the present work, we found
that Lnk mRNA and protein expression were regulated by TPO-
activated signaling pathways in megakaryocytic cells. This was
further confirmed in platelets isolated from RT patients, which are
often associated with elevated TPO levels.26 Consistent with our
results, recent studies have demonstrated that LNK expression is
regulated by early-acting (Stem Cell Factor and TPO) and lineage-
specific (EPO) growth factors, cytokine receptors (MPL) and JAK2
signaling pathways in HSC, bone marrow cells and hematopoietic
cell lines.12,18,19,30,31 Furthermore, the Lnk protein was shown to
down-regulate MPL, EPO receptor, and JAK2 kinase signaling
after TPO and EPO stimulation, respectively.16,17 Altogether, these
results place Lnk as part of an important negative regulatory loop
(cytokine receptor/JAK2 kinase/Lnk regulator) in hematopoiesis.
Similarly, the SOCS family of negative regulators is induced by the
JAK/STAT pathway upon cytokine receptor stimulation. It thereaf-
ter acts within a classical negative feedback loop both to suppress
activation of the receptor and JAK2 and to target them for
proteasomal degradation.32 These parallels indicate that hematopoi-
etic negative regulators exert their function through finely con-
trolled processes that allow precise modulation of the cell’s
intrinsic sensitivity to cytokines.
Some of the cytokine signaling pathways that regulate Lnk are
also deregulated in MPNs, suggesting that the expression and
function of Lnk could be affected in these disorders. Indeed, we
found that LNK mRNA expression was significantly increased in
all MPNs examined (ET, PV, PMF) and notably in JAK2-V617F
patients, where LNK overexpression correlated with a higher
JAK2-V617F allele burden and JAK2 activity. However, how
JAK2 expressed in MPN cells can surmount Lnk inhibition is still
unclear. Moreover, this observation seems to contrast with the Lnk
inhibition of JAK2-V617F–dependent signaling and proliferation,
we and others have shown in hematopoietic cell lines (this work
and19,30). This apparent paradox can be explained by the fact that
the ratio of expression level of JAK2-V617F in respect to Lnk may
be different between MPN cells and hematopoietic cell lines, thus
modulating Lnk inhibitory function. In the initial phase of MPNs, a
low ratio of mutant JAK2/Lnk may be present (JAK2-V617F
heterozygous state). In this context, low signaling through JAK2-
V617F would induce Lnk, which would then down-regulate
Figure 6. Lnk inhibits cell growth and signaling in HEL cells. (A-B) HEL cells (5 3 105) expressing different Lnk forms or WT APS were cultured in complete media, and
viable cell numbers were determined by trypan blue exclusion at the indicated times with 4 weeks interval (B). Data represent the mean counts 6 SD (error bars) of viable cells
from triplicate determinations and are representative of at least 3 independent experiments. GFP expression level in all clones was determined by fluorescence-activated cell
sorting; (C) WT and R364M Lnk forms and APS protein expression was assessed with anti-Lnk and anti-APS antibodies, respectively. Actin blot is shown as equal loading
control. Vector, l; R364M, M; APS, F; Lnk, D. (D) Total lysates from HEL cells expressing different Lnk forms or WT APS were prepared as in Figure 4B at day 4 (left panels)
and day 35 (right panels) of culture. JAK2, STAT5, and MAPK activation was assessed by immunoblotting with anti-phospho-JAK2 (p-JAK2), anti-phospho-STAT5 (p-STAT5) or
anti-phospho-Erk1/2 (p-Erk) antibodies, respectively. Total JAK2, STAT5, and Erk levels were analyzed by immunoblotting. White space gaps indicate repositioned gel lanes.
5968 BARAN-MARSZAK et al BLOOD, 23 DECEMBER 2010 z VOLUME 116, NUMBER 26
For personal use only. at INSERM DISC on February 23, 2011. www.bloodjournal.orgFrom
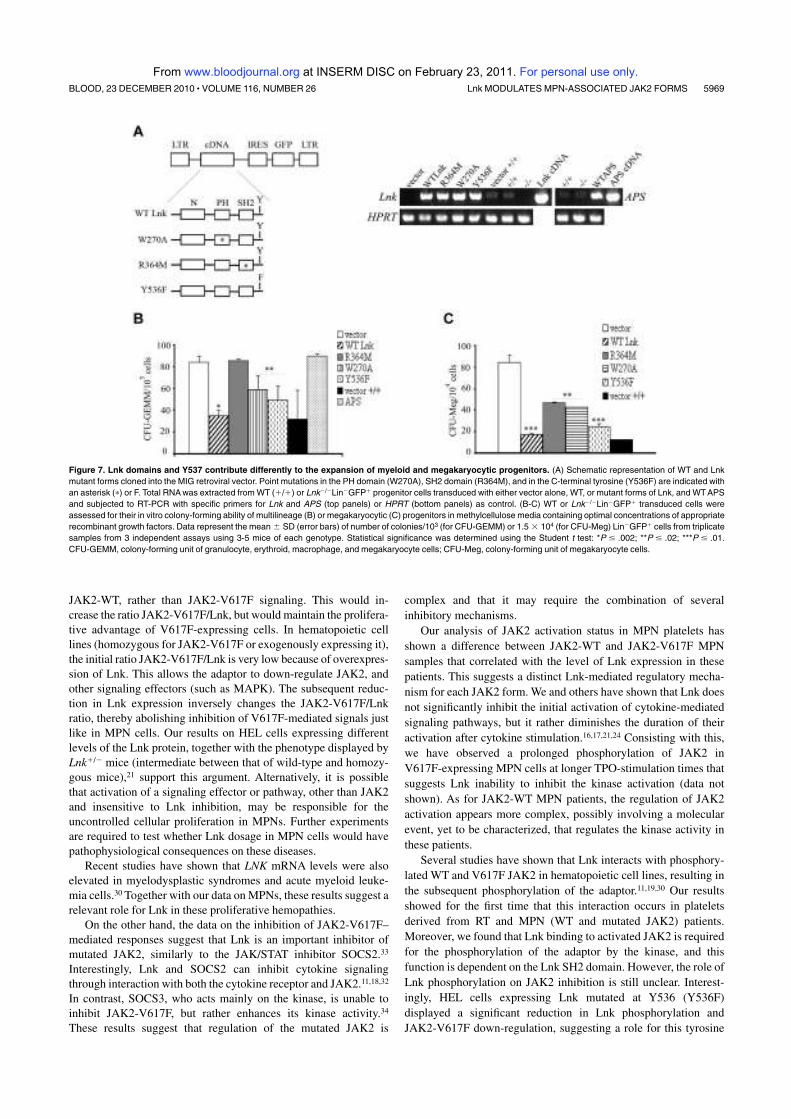
JAK2-WT, rather than JAK2-V617F signaling. This would in-
crease the ratio JAK2-V617F/Lnk, but would maintain the prolifera-
tive advantage of V617F-expressing cells. In hematopoietic cell
lines (homozygous for JAK2-V617F or exogenously expressing it),
the initial ratio JAK2-V617F/Lnk is very low because of overexpres-
sion of Lnk. This allows the adaptor to down-regulate JAK2, and
other signaling effectors (such as MAPK). The subsequent reduc-
tion in Lnk expression inversely changes the JAK2-V617F/Lnk
ratio, thereby abolishing inhibition of V617F-mediated signals just
like in MPN cells. Our results on HEL cells expressing different
levels of the Lnk protein, together with the phenotype displayed by
Lnk1/2 mice (intermediate between that of wild-type and homozy-
gous mice),21 support this argument. Alternatively, it is possible
that activation of a signaling effector or pathway, other than JAK2
and insensitive to Lnk inhibition, may be responsible for the
uncontrolled cellular proliferation in MPNs. Further experiments
are required to test whether Lnk dosage in MPN cells would have
pathophysiological consequences on these diseases.
Recent studies have shown that LNK mRNA levels were also
elevated in myelodysplastic syndromes and acute myeloid leuke-
mia cells.30 Together with our data on MPNs, these results suggest a
relevant role for Lnk in these proliferative hemopathies.
On the other hand, the data on the inhibition of JAK2-V617F–
mediated responses suggest that Lnk is an important inhibitor of
mutated JAK2, similarly to the JAK/STAT inhibitor SOCS2.33
Interestingly, Lnk and SOCS2 can inhibit cytokine signaling
through interaction with both the cytokine receptor and JAK2.11,18,32
In contrast, SOCS3, who acts mainly on the kinase, is unable to
inhibit JAK2-V617F, but rather enhances its kinase activity.34
These results suggest that regulation of the mutated JAK2 is
complex and that it may require the combination of several
inhibitory mechanisms.
Our analysis of JAK2 activation status in MPN platelets has
shown a difference between JAK2-WT and JAK2-V617F MPN
samples that correlated with the level of Lnk expression in these
patients. This suggests a distinct Lnk-mediated regulatory mecha-
nism for each JAK2 form. We and others have shown that Lnk does
not significantly inhibit the initial activation of cytokine-mediated
signaling pathways, but it rather diminishes the duration of their
activation after cytokine stimulation.16,17,21,24 Consisting with this,
we have observed a prolonged phosphorylation of JAK2 in
V617F-expressing MPN cells at longer TPO-stimulation times that
suggests Lnk inability to inhibit the kinase activation (data not
shown). As for JAK2-WT MPN patients, the regulation of JAK2
activation appears more complex, possibly involving a molecular
event, yet to be characterized, that regulates the kinase activity in
these patients.
Several studies have shown that Lnk interacts with phosphory-
lated WT and V617F JAK2 in hematopoietic cell lines, resulting in
the subsequent phosphorylation of the adaptor.11,19,30 Our results
showed for the first time that this interaction occurs in platelets
derived from RT and MPN (WT and mutated JAK2) patients.
Moreover, we found that Lnk binding to activated JAK2 is required
for the phosphorylation of the adaptor by the kinase, and this
function is dependent on the Lnk SH2 domain. However, the role of
Lnk phosphorylation on JAK2 inhibition is still unclear. Interest-
ingly, HEL cells expressing Lnk mutated at Y536 (Y536F)
displayed a significant reduction in Lnk phosphorylation and
JAK2-V617F down-regulation, suggesting a role for this tyrosine
Figure 7. Lnk domains and Y537 contribute differently to the expansion of myeloid and megakaryocytic progenitors. (A) Schematic representation of WT and Lnk
mutant forms cloned into the MIG retroviral vector. Point mutations in the PH domain (W270A), SH2 domain (R364M), and in the C-terminal tyrosine (Y536F) are indicated with
an asterisk (p) or F. Total RNA was extracted from WT (1/1) or Lnk2/2Lin2GFP1 progenitor cells transduced with either vector alone, WT, or mutant forms of Lnk, and WT APS
and subjected to RT-PCR with specific primers for Lnk and APS (top panels) or HPRT (bottom panels) as control. (B-C) WT or Lnk2/2Lin2GFP1 transduced cells were
assessed for their in vitro colony-forming ability of multilineage (B) or megakaryocytic (C) progenitors in methylcellulose media containing optimal concentrations of appropriate
recombinant growth factors. Data represent the mean 6 SD (error bars) of number of colonies/103 (for CFU-GEMM) or 1.5 3 104 (for CFU-Meg) Lin2GFP1 cells from triplicate
samples from 3 independent assays using 3-5 mice of each genotype. Statistical significance was determined using the Student t test: *P # .002; **P # .02; ***P # .01.
CFU-GEMM, colony-forming unit of granulocyte, erythroid, macrophage, and megakaryocyte cells; CFU-Meg, colony-forming unit of megakaryocyte cells.
Lnk MODULATES MPN-ASSOCIATED JAK2 FORMS 5969BLOOD, 23 DECEMBER 2010 z VOLUME 116, NUMBER 26
For personal use only. at INSERM DISC on February 23, 2011. www.bloodjournal.orgFrom

in both JAK2-mediated Lnk phosphorylation and inhibitory func-
tion (A.A. and L.V., unpublished data). In addition, our GST
pull-down experiments revealed a novel moderate interaction
involving the N-terminal region of Lnk that enables it to associate
with inactive JAK2. A similar binding site has been reported for
SH2-B and APS, the other members of the Lnk family. In these
proteins, the second JAK2-binding site includes the PH domain and
the PH-SH2 domain linker region and appears to be inhibitory in
nature.28,29,35 For the Lnk protein, we showed that this site does not
involve the PH domain, contrary to the recent report by Gery et al.19
This discrepancy might be a result of the length of the PH domain
fragment used in each study. Furthermore, we observed that in the
presence of the V617F mutation, JAK2 binds stronger to this
second Lnk site, suggesting that the mutant kinase displays a
different affinity for the adaptor than the WT form. It is then
conceivable that the change in JAK2 binding affinity for this site
may allow a stronger Lnk inhibition of JAK2 at the basal level.
However, it will also affect the kinase subsequent interaction with
Lnk SH2 domain, resulting in failure to inhibit JAK2-V617F
cytokine-mediated activation. Our recent identification of an Lnk
mutation in this region further supports this model. Detailed
analysis of the amino acids involved in this Lnk/JAK2 interaction
may shed light into the molecular mechanism implicated in
Lnk-mediated JAK2 inhibition.
Recent studies have suggested that in MPNs, other genetic
modifications, like the TET2 gene mutations36 and the newly
identified rare mutations in Lnk (this work and25), could confer a
proliferative advantage to hematopoietic progenitors.37 Interest-
ingly, expression of the JAK2-V617F form in Lnk2/2 progenitors
increased the number of cytokine-independent colonies in these
cells compared with wild-type cells expressing JAK2-V617F and
accelerates oncogenic JAK2-induced MPNs in mice.19,38 Together
with our data obtained in PMF and PV CD341 and mature
(platelets) cells from MPN patients, these results indicate that Lnk
regulation is important during all stages of myeloid differentiation
and can contribute to the development of MPNs and probably of
other human hematopoietic malignancies.
The studies presented here on Lnk2/2Lin2 progenitors express-
ing either WT or mutant forms of Lnk have helped to better define
its inhibitory role in the expansion of hematopoietic progenitors.
Indeed, we showed that the SH2 domain contributes mainly to inhibition
of the proliferation of multilineage progenitors. In contrast, analysis of
megakaryocytic progenitors indicated that both SH2 and PH domains
are important for Lnk-mediated growth inhibition of these cells. This
function is specific to Lnk because expression of Aps in these cells does
not compensate for the lack of Lnk.
In summary, this is the first comprehensive study of the role of
Lnk in a representative cohort of MPN patients showing that Lnk
levels and JAK2-binding can modulate the cellular responses
mediated by the JAK2 forms present in these diseases. In addition,
our findings provide evidence that Lnk participates, together with
the Mpl receptor and the JAK2 kinase, in a finely controlled
feedback mechanism essential for the regulation of TPO-mediated
megakaryopoiesis and consequently, thrombopoiesis. Finally, we
identified a novel interaction site between Lnk and JAK2, which
together with the SH2 domain may play a major role in the
down-regulation of both normal and MPN-derived hematopoiesis.
Defining the signaling pathways and effectors, other than JAK2,
regulated by Lnk will help to better understand the role of this
adaptor in the pathogenesis of MPNs and determine its potentially
therapeutic value.
Acknowledgments
We thank the patients who donated their cells to support this
research, the PV-Nord group, Nicole Boggetto for assistance with
flow cytometry sorting, Francois Delhommeau for providing
CD341 cells from PV patients, and the sequencing device of
Hopital Henri Mondor (Creteil).
This work was supported by grants from the Institut National de
la Sante et la Recherche Medicale (Inserm)–Avenir, the Ligue
Nationale contre le Cancer (LNCC)–Comite St. Denis, the Associa-
tion pour la Recherche contre le Cancer (ARC), the Association
Laurette Fugain, and the Association Nouvelles recherches Biomedi-
cales (NRB). H.M. is the recipient of a PhD scholarship from the
Groupe d’Etude sur l’Hemostase et la Thrombose (GEHT). A.A.
was supported by a postdoctoral fellowship from the Universidad
de Guadalajara (Mexico).
Authorship
Contribution: F.B.M. designed the research, analyzed and inter-
preted the data, and contributed to writing the manuscript; H.M.,
C.D., C.R., and A.A. performed experiments; S.H. collected
clinical characteristics from all the patients; E.M. contributed to
cellular experiments; S.C. performed statistical analysis; B.C.
contributed genotyping analysis; S.G. and C.T. contributed MPL
and Lnk sequencing; P.F., F.C., and N.V.B. contributed scientific
discussion and reviewed the manuscript; M.C.L.B.K. contributed
to the recruitment of patients, interpretation of the data, and writing
the paper; J.J.K. contributed to the recruitment of patients, analyz-
ing the data, designing the research and writing the manuscript; and
L.V. designed and performed research, analyzed the data, and wrote
the paper.
Conflict-of-interest disclosure: The authors declare no compet-
ing financial interests.
The current affiliation for A.A. is Centro Universitario de
Ciencias de la Salud, Universidad de Guadalajara, Guadalajara,
Mexico.
Correspondance: Laura Velazquez, UMR U978 Inserm/
Universite Paris 13, Adaptateurs de Signalisation en Hematologie,
UFR SMBH, 74 rue Marcel Cachin, 93 017 Bobigny Cedex,
France; e-mail: [email protected]; and Jean-Jacques Kiladjian,
Clinical Investigation Center, Hopital Saint-Louis and French Inter-
group of Myeloproliferative Disorders, 1 Avenue Claude Vellefaux,
Paris 75010, France; e-mail: [email protected]
References
1. Campbell PJ, Green AR. The myeloproliferative
disorders. N Engl J Med. 2008;355(23):2452-
2466.
2. Baxter JE, Scott LM, Campbell PJ, et al. Acquired
mutation of the tyrosine kinase JAK2 in human
myeloproliferative disorders. Lancet. 2005;
365(9464):1054-1061.
3. James C, Ugo V, Le Couedic J-P, et al. A unique
clonal JAK2 mutation leading to constitutive sig-
nalling causes polycythaemia vera. Nature. 2005;
434(7037):1144-1148.
4. Kralovics R, Passamonti F, Buser AS, et al. A
gain-of-function mutation of JAK2 in myeloprolif-
erative disorders. N Engl J Med. 2005;352(17):
1779-1790.
5. Levine RL, Wadleigh M, Cools J, et al. Activating
mutation in the tyrosine kinase JAK2 in polycy-
themia vera, essential thrombocythemia, and my-
eloid metaplasia with myelofibrosis. Cancer Cell.
2005;7(4):387-397.
6. Zhao R, Xing S, Li Z, et al. Identification of an ac-
quired JAK2 mutation in polycythemia vera. J Biol
Chem. 2005;280(24):22788-22792.
7. Cazzola M, Skoda RC. Gain of function, loss of
5970 BARAN-MARSZAK et al BLOOD, 23 DECEMBER 2010 z VOLUME 116, NUMBER 26
For personal use only. at INSERM DISC on February 23, 2011. www.bloodjournal.orgFrom

control—a molecular basis for chronic myelopro-
liferative disorders. Haematologica. 2005;90(7):
871-874.
8. Pardanani AD, Levine RL, Lasho T, et al. MPL515
mutations in myeloproliferative and other myeloid
disorders: a study of 1182 patients. Blood. 2006;
108(10):3472-3476.
9. Pikman Y, Lee BH, Mercher T, et al. MPLW515L
is a novel somatic activating mutation in myelofi-
brosis with myeloid metaplasia. PLoS Med. 2006;
3(7):e270.
10. Rudd EC. Lnk adaptor: novel negative regulator
of B cell lymphopoiesis. Science STKE. 2001;
PE1.
11. Bersenev A, Wu C, Balcerek J, Tong W. Lnk con-
trols mouse hematopoietic stem cell self-renewal
and quiescence through direct interactions with
JAK2. J Clin Invest. 2008;118(8):2832-2844.
12. Buza-Vidas N, Antonchuk J, Qian H, et al. Cyto-
kines regulate postnatal hematopoietic stem cell
expansion: opposing roles of thrombopoietin and
LNK. Genes Dev. 2006;20(15):2018-2023.
13. Ema H, Sudo K, Seita J, et al. Quantification of
self-renewal capacity in single hematopoietic
stem cells from normal and Lnk-deficient mice.
Develop Cell. 2005;8(6):907-914.
14. Seita J, Ema H, Ooehara J, et al. Lnk negatively
regulates self-renewal of hematopoietic stem
cells by modifying thrombopoietin-mediated sig-
nal transduction. Proc Natl Acad Sci U S A. 2007;
104(7):2349-2354.
15. Takizawa H, Eto K, Yoshikawa A, Nakauchi H,
Takatsu K, Takaki S. Growth and maturation of
megakaryocytes is regulated by Lnk/Sh2b3 adap-
tor protein through crosstalk between cytokine-
and integrin-mediated signals. Exp Hematol.
2008;36(7):897-906.
16. Tong W, Lodish FH. Lnk inhibits Tpo-mpl signal-
ing and Tpo-mediated megakaryocytopoiesis.
J Exp Med. 2004;200(5):569-580.
17. Tong W, Lodish FH. Lnk inhibits erythropoiesis
and Epo-dependent JAK2 activation and down-
stream signaling pathways. Blood. 2005;105(12):
4604-4612.
18. Gery S, Gueller S, Chumakova K, Kawamata N,
Liu L, Koeffler HP. Adaptor protein Lnk negatively
regulates the mutant MPL, MPLW515L associ-
ated with myeloproliferative disorders. Blood.
2007;110(9):3360-3364.
19. Gery S, Qi C, Gueller S, Hongtao X, Tefferi A,
Koeffler HP. Lnk inhibits myeloproliferative disor-
der-associated JAK2 mutant, JAK2V617F. J Leuk
Biol. 2009;85(6):957-965.
20. Takaki S, Morita H, Tezuka Y, Takatsu K. En-
hanced hematopoiesis by hematopoietic progeni-
tor cells lacking intracellular adaptor protein, Lnk.
J Exp Med. 2002;195(2):151-160.
21. Velazquez L, Cheng MA, Fleming EH, et al. Cyto-
kine signaling and hematopoietic homeostasis
are disrupted in Lnk-deficient mice. J Exp Med.
2002;195(12):1599-1611.
22. Kiladjian JJ, Cassinat B, Turlure P, et al. High mo-
lecular response rate of polycythemia vera pa-
tients treated with pegylated interferon a-2a.
Blood. 2006;108(6):2037-2040.
23. Chaligne R, James C, Tonetti C, et al. Evidence
for MPL W515L/K mutations in hematopoietic
stem cells in primitive myelofibrosis. Blood. 2007;
110(10):3735-3743.
24. Simon C, Dondi E, Chaix A, et al. Lnk adaptor
protein down-regulates specific Kit-induced sig-
naling pathways in primary mast cells. Blood.
2008;112(10):4039-4047.
25. Oh ST, Simonds EF, Jones C, et al. Novel muta-
tions in the inhibitory adaptor protein LNK drive
JAK-STAT signaling in patients with myeloprolif-
erative neoplasms. Blood. 2010;116(6):988-992.
26. Ishiguro A, Suzuki Y, Mito M, et al. Elevation of
serum thrombopoietin precedes thrombocytosis
in acute infections. Br J Haematol. 2002;116(3):
612-618.
27. Kaushansky K. The molecular mechanisms that
control thrombopoiesis. J Clin Invest. 2005;
115(12):3339-3347.
28. Kurzer JH, Saharinen P, Silvennoinen O,
Carter-Su C. Binding of SH2-B family members
within a potential regulatory region maintains
JAK2 in an active state. Mol Cell Biol. 2006;
26(17):6381-6394.
29. Maures TJ, Kurzer JH, Carter-Su C. SH2B1
(SH2-B) and JAK2: a multifunctional adaptor pro-
tein and kinase made for each other. Trends En-
docrinol Metab. 2006;18(1):38-45.
30. Gery S, Gueller S, Nowak V, Sohn J, Hofman
WK, Koeffler HP. Expression of the adaptor pro-
tein Lnk in leukemia cells. Exp Hematol. 2009;
37(5):585-592.
31. Kent DG, Dykstra BJ, Cheyne J, Ma E, Eaves CJ.
Steel factor coordinately regulates the molecular
signature and biologic function of hematopoietic
stem cells. Blood. 2008;112(3):560-567.
32. Croker BA, Kiu H, Nicholson SE. SOCS regula-
tion of the JAK/STAT signalling pathway. Semin
Cell Develop Biol. 2008;19(4):414-422.
33. Quentmeier H, Geffers R, Jost E, et al. SOCS2:
inhibitor of JAK2V617F-mediated signal trans-
duction. Leukemia. 2008;22(12):2169-2175.
34. Hookham MB, Elliott J, Suessmuth Y, et al. The
myeloproliferative disorder-associated JAK2
V617F mutant escapes negative regulation by
suppressor of cytokine signaling 3. Blood. 2007;
109(11):4924-4929.
35. Rui L, Gunter DR, Herrington J, Carter-Su C. Dif-
ferential binding to and regulation of JAK2 by the
SH2 domain and N-terminal region of SH2-Bbeta.
Mol Cell Biol. 2000;20(9):3168-3177.
36. Delhommeau F, DuPont S, Della Valle V, et al.
Mutation in TET2 in myeloid cancers. N Engl
J Med. 2009;360(22):2289-2301.
37. Delhommeau F, DuPont S, Tonetti C, et al. Evi-
dence that the JAK2 G1849T (V617) mutation
occurs in a lymphomyeloid progenitor in polycy-
themia vera and idiopathic myelofibrosis. Blood.
2007;109(1):71-77.
38. Bersenev A, Wu C, Balcerek J, et al. Lnk con-
strains myeloproliferative diseases in mice. J Clin
Invest. 2010;120(6):2058-22069.
Lnk MODULATES MPN-ASSOCIATED JAK2 FORMS 5971BLOOD, 23 DECEMBER 2010 z VOLUME 116, NUMBER 26
For personal use only. at INSERM DISC on February 23, 2011. www.bloodjournal.orgFrom

236

237

RESUMELa myélofibrose primitive (MFP) est un néoplasme myéloprolifératif (NMP)
chronique BCR-ABL1-négatif associant une dérégulation de l’hématopoïèse (myéloprolifération, dysmégacaryopoïèse et migration des cellules souches et progéniteurs hématopoïétiques (CSH/PH)) à une altération du stroma médullaire et splénique (fibrose ostéomyélosclérose, néoangiogenèse). Le mégacaryocyte (MK) est un acteur majeur de sa pathogenèse, via la production de cytokines et facteurs fibrosants, dans un contexte inflammatoire. Plusieurs arguments suggèrent que les mutations JAK2V617F et MPL515L/K qui caractérisent les NMP ne sont pas les événements initiaux de la MFP car elles ne sont retrouvées que chez la moitié des patients. L’objectif de mon travail a été de rechercher si d’autres anomalies, géniques ou non, pouvaient expliquer la pathogenèse de la MFP. Pour cela, parallèlement à une démarche génomique (transcriptome et CGH array), nous avons développé une approche de biologie cellulaire ciblée sur le rôle du stroma hématopoïétique.
Bien que n’ayant pas identifié d’autres anomalies génomiques que celles décrites dans la littérature et en particulier, la délétion 13q, les approches génomiques que nous avons développées nous ont permis de préciser les bornes de cette délétion dans les PH CD34+ et les polynucléaires des patients. Cette délétion (région chromosomique minimale 13q14-13q21) est située à 2 mégabases (télomérique) du cluster FLT où est localisé le gène FLT3. Plusieurs arguments nous ont ensuite conduits à rechercher si le couple Flt3-ligand/Flt3 était impliqué dans la dérégulation de l’hématopoïèse et plus particulièrement dans la dysmégacaryopoïèse observée chez les patients. Parmi ceux-ci, citons : 1) l’existence d’une modulation d’expression de gènes inclus dans la zone de délétion 13q et dans le cluster FLT, dont le gène FLT3 et 2) le fait que Flt3, un récepteur clé de la régulation de l’hématopoïèse primitive, soit souvent impliqué dans la pathogenèse d’hémopathies malignes et que son ligand, Flt3-ligand, soit majoritairement produit par le stroma hématopoïétique.
Notre étude montre une dérégulation de Flt3 et des MAPKs p38 dans les PH CD34+ et les MK des patients atteints de MFP et ceci, quelque soit leur statut mutationnel Jak2. Elle démontre également que la persistance de la stimulation de l’axe Flt3/p38 en réponse à une production accrue de Flt3 ligand, participe à la dysmégacaryopoïèse qui caractérise la maladie. En effet, nous avons mis en évidence : 1) une augmentation du taux sérique de Flt3 ligand et de son expression par les cellules du stroma médullaire et splénique ainsi que par les PH des patients atteints de MFP, 2) une surexpression spécifique de son récepteur Flt3 et de sa phosphorylation dans les CSH/PH CD34+ et les progéniteurs mégacaryocytaires (MK), qui persistent au cours de la différenciation MK, quelque soit le statut mutationnel de Jak2 des patients, 3) une activation de Flt3 dans les progéniteurs MK en réponse au Flt3 ligand conduisant à la phosphorylation en cascade de la voie de signalisation des MAPKs p38 et à l’expression de ses gènes cibles tels que AP-1, p53, NFATc4, ATF2, IL-8, 4) une restauration de la mégacaryopoïèse et une inhibition de la migration (Flt3-ligand)-dépendante des progéniteurs MK des patients après inhibition de Flt3 ou de p38.
Nos résultats confirment l’importance d’une altération des MAPKs dans une dérégulation de l’hématopoïèse et soulignent le rôle d’une activation persistante de la voie p38, via le couple Flt3-ligand/Flt3, dans la dysmégacaryopoïèse qui caractérise la myélofibrose primitive. Ils suggèrent également que cette dérégulation participe au processus inflammatoire à l’origine de la réaction stromale et « lit » d’une transformation leucémique potentielle. Ce dialogue altéré entre les cellules hématopoïétiques pathologiques (Bad seeds), en particulier mégacaryocytaires et les cellules stromales (Bad soil), conforte notre concept « Bad seeds in Bad soil ». Ce travail pourrait contribuer à l’amélioration de ce dialogue par des approches thérapeutiques ciblées sur l’axe Flt3-ligand/Flt3 médié par l’activation de p38 qui, en réduisant le processus inflammatoire, rétablirait un lien entre le « Seed » et le « Soil ».
238