roject overview ensor enabled modeling of future
TRANSCRIPT

PROJECT OVERVIEW
SENSOR ENABLED MODELING OF FUTURE DISTRIBUTION
SYSTEMS WITH DISTRIBUTED ENERGY RESOURCES
PI: Vijay Vittal, ASU
Raja Ayyanar, Anamitra Pal, Mojdeh Hedman, Yang Weng
Narsi Vempati, John Dirkman - Nexant
Daniel Haughton, Cynthia Rojas - APS

Project Team
1
‣ Arizona State University Professors
– Vijay Vittal - Regents’ Professor, Ira A. Fulton Chair Professor
– Raja Ayyanar - Professor
– Anamitra Pal - Assistant Professor
– Mojdeh Khorsand Hedman - Assistant Professor
– Yang Weng - Assistant Professor
‣ Arizona State University Students
– Behrouz Azimian
– Carl Morgenstern
– Karen Montano-Martinez
– Mengxi Chen
– Mingyue He
– Reetam Sen Biswas
– Shanshan Ma
– Zahra Soltani

Project Team
2
‣ DOE ARPA-E
– Richard O’Neill - Distinguished Senior Fellow
– Mirjana Marden - Science and Engineering Technical Assistance
– Richard Wilson - Tech-to-Market Advisor
‣ Arizona Public Service (APS)
– Daniel Haughton - Manager of Distribution Engineering
– Cynthia Rojas - Engineer, Distributed Resources Engineering
‣ Nexant
– Narsi Vempati - Senior Vice President, Grid Management
– John Dirkman - Vice President, Product Management
– Fernando Magnago - Principal Application Manager
– Guanji Hou - Senior Power Systems Engineer
– Roozbeh Emami - Senior Power Systems Engineer
– Suresh Argi - Principal Solution Architect

Publications
‣ R. S. Biswas, B. Azimian and A. Pal, A Micro-PMU Placement Scheme for Distribution Systems Considering Practical Constraints, 2020 IEEE Power & Energy Society General Meeting (PESGM), Virtual 1-5 (2020) (Milestone 9: Render and enhance DSSE algorithm)
‣ B. Azimian, R. S. Biswas, A. Pal, and L. Tong, Time Synchronized State Estimation for Incompletely Observed Distribution Systems Using Deep Learning Considering Realistic Measurement Noise, 2021 IEEE Power & Energy Society General Meeting (PESGM), , Virtual 1-5 (2021) (Milestone 9: Render and enhance DSSE algorithm)
‣ Karen Montano-Martinez, Sushrut Thakar, Vijay Vittal, Raja Ayyanar and Cynthia Rojas, Detailed Primary and Secondary Distribution System Feeder Modeling Based on AMI Data, " 2020 North American Power Symposium (NAPS), Tempe, AZ 1-7 (2021)
3

4
Key Components of the Project

Project Milestones
5
MS Task/Milestone Title Task/Milestone Description
M1 Refine project tasks, milestones, T2M plan All project tasks and subtasks detailed in Gantt charts showing task leads, dependencies, and timelines.
M2Use utility GIS data to formulate and obtain feeder
impedance data
Develop appropriate interface to collect and merge feeder data from multiple GIS databases at APS and integrate data to provide
input to OpenDSS software and successfully solve a three-phase power flow. Power flow results for a representative feeder shown to
match within 5% of corresponding results from APS’s existing distribution analysis tool.
M3Completion of detailed feeder model and verification
of power flow results with available field data
Detailed models for about 3 representative feeders from APS Solar partners study program completed in OpenDSS and/or a
commercial distribution system simulation tool; power flow results from the feeder model shown to match available field
measurements with error less than 5%.
M4 First iteration of T2M Plan and IAB Develop the first iteration of the T2M Plan contact potential members and form the IAB
M5
System control strategies for voltage control using
dispatchable resourcesDevelop system control strategies for controlling voltage along the feeder using the dispatchable resources and verify approaches
using APS feeder model and OpenDSS tool to maintain feeder voltages between 0.95 p.u. and 1.05 p.u. under the extreme
combinations of highest PV / light load and lowest PV / heavy load conditions.
M6Demonstrate success of the proposed primary
topology processorTest and evaluate primary distribution topology processor on APS data. Achieve interconnection structure accuracy to capture at
minimum 90% of feeder structure.
M7Demonstrate success of the proposed secondary
topology processorTest and evaluate secondary distribution topology processor on APS data. Achieve interconnection structure accuracy to capture at
minimum 90% of feeder structure.
M8Demonstrate success of the proposed topology
processorTest and evaluate model using APS data. Achieve interconnection structure accuracy to capture at minimum 90% of feeder load;
M9 Render and enhance DSSE algorithmThe success of the micro-PMU based DSSE will be demonstrated on the APS system data. Specifically, estimation errors lower than
2% in voltage magnitude and less than 0.5 degree in phase angle will be achieved.
M10 Final iteration of T2M Plan Develop and finalize the T2M
M11Demonstrate efficiency of dispatchable resource
scheduling toolTest and evaluate model on APS data. Achieve 5% cost savings.
M12Field tuning of dispatchable resources including DER,
storage, capacitor banks and voltage regulatorsTest design of system level control strategies for dispatchable resources on the model developed for the APS feeder, and using smart
inverters, storage, capacitor banks and regulators, control voltage magnitude along the feeder within a 5% bound on nominal voltage
M13Demonstration of topology processor and DSSE
algorithms on APS feederAttain 95% accuracy in topology estimation for the APS system. DSSE on APS feeder will be performed in 36 seconds*.
M14
Demonstration of the performance of the proposed
control of DER, storage, capacitor banks and voltage
regulators on the APS feeder with high DER
penetration
Field implementation of over 500 dispatchable resources with at least 50 PV with smart inverters in a large APS feeder; smart inverter
and feeder responses to a minimum of 200 events (various dispatchable resource command changes under different operating
conditions, faults, cap bank operations) captured; identical events and operating conditions simulated in high fidelity, dynamic model
but with the proposed controllers; performance in terms of steady-state error between commanded and actual P and Q values,
response time to command changes, quantitative impact on the feeder voltage profile, demonstrated to improve by at least 25% with
the new controller compared to field measurements.

Milestone 1
‣ Milestone 1: Refine project tasks, milestones, T2M plan
‣ Requirement: All project tasks and subtasks detailed in Gantt charts showing task leads,
dependencies, and timelines.
‣ Task Lead: Vijay Vital (ASU)
‣ Findings: Key task for project planning
6

Milestone 2
‣ Milestone 2: Use utility GIS data to formulate and obtain
feeder impedance data
‣ Requirement: Develop appropriate interface to collect and
merge feeder data from multiple GIS databases at APS and
integrate data to provide input to OpenDSS software and
successfully solve a three-phase power flow. Power flow
results for a representative feeder shown to match within 5%
of corresponding results from APS’s existing distribution
analysis tool.
‣ Task Lead: Vijay Vittal (ASU)
‣ Findings: Please see Milestone 3; Milestones 2 and 3 are
closely related.
7

Milestone 3
‣ Milestone 3: Completion of detailed feeder model and
verification of power flow results with available field data
‣ Requirement: Detailed models for about 3 representative
feeders from APS Solar partners study program completed
in OpenDSS and/or a commercial distribution system
simulation tool; power flow results from the feeder model
shown to match available field measurements with error less
than 5%.
‣ Task Lead: Vijay Vittal (ASU)
‣ Challenges: See following slides.
‣ Methods: See following slides.
‣ Findings: See following slides.
8

M3: Completion of Detailed Feeder Model and
Verification of Power Flow
9
‣ The time-series load and PV profiles of the OpenDSS model
as well as the utility AMI system data for each day studied
(24 hours per day) are used by the optimization algorithm.

M3: Completion of Detailed Feeder Model and
Verification of Power Flow
10
‣ Three independent single phase voltage sources are
implemented in OpenDSS to obtain a more accurate model.
‣ OpenDSS requires the actual per unit voltage at which the
source is operating (before the substation impedance
voltage drop): the source impedance and the feeder head
measurements are used to determine the substation voltage.

M3: Completion of Detailed Feeder Model and
Verification of Power Flow-Results
11
‣ New load file as well as a new load profile file are generated
for each day using the optimization algorithm output.
‣ Two days were chosen for the analysis:
– Actual historical feeder load peak on 07/15/2019 (high
load and relatively low PV), which is also the base case
day.
– Maximum generation condition on 03/15/2019 (light load
and high PV).
‣ The Open-DSS model is compared with the corresponding
AMI measurements.

M3: Completion of Detailed Feeder Model and
Verification of Power Flow-Results
12
• Note that the reactive power is completely calculated by the optimization
technique and there are no measurements available at any point of the
feeder aside from the feeder-head values.
‣ Active and reactive power feeder-head comparison
(Historical feeder load peak (07/15/2019))

M3: Completion of Detailed Feeder Model and
Verification of Power Flow-Results
13
‣ Active and reactive power feeder-head comparison
(Maximum generation condition (03/15/2019))

M3: Completion of Detailed Feeder Model and
Verification of Power Flow-Results
14
• The PV production significantly impacts the net load of the system.
‣ Net load, gross load and PV production (Historical feeder
load peak (07/15/2019))

M3: Completion of Detailed Feeder Model and
Verification of Power Flow- Results
15
‣ Due to the significant reduction of load consumption, the net load is negative for
most of the PV production hours.
‣ Due this behavior, the feeder experiences large overvoltages during this time.
‣ Net load, gross load and PV production (Maximum
generation condition (03/15/2019))

M3: Completion of Detailed Feeder Model and
Verification of Power Flow- Results
16
‣ Voltage comparison results for all the meters in the feeder
(Maximum generation condition (03/15/2019))
• Average RMS error along the feeder length is around ~0.25%.
• Maximum RMS error is <1.2%.
Milestones 4 & 10
‣ Milestones 4 & 10: First/Final iteration of Technology to Market (T2M) Plan and Industry Advisory Board (IAB)
‣ Requirement: Develop the first iteration of the T2M Plan, contact potential members and form the IAB/Develop and finalize the T2M
‣ Task Lead: John Dirkman and Narsi Vempati (Nexant)
‣ Challenges: Locating IAB members, determining best ways to integrate developed components with existing systems.
‣ Methods: Team meetings and strategy sessions.
‣ Findings: Additional discussions were held to conduct further work on the T2M plan. The second IAB meeting was held on February 26, 2021. Project to be presented at CIRED 2021. Continuing to develop strategy for integration of applications with ADMS and DERMS. Planning deployment of the suite of applications at the partner utility.
17
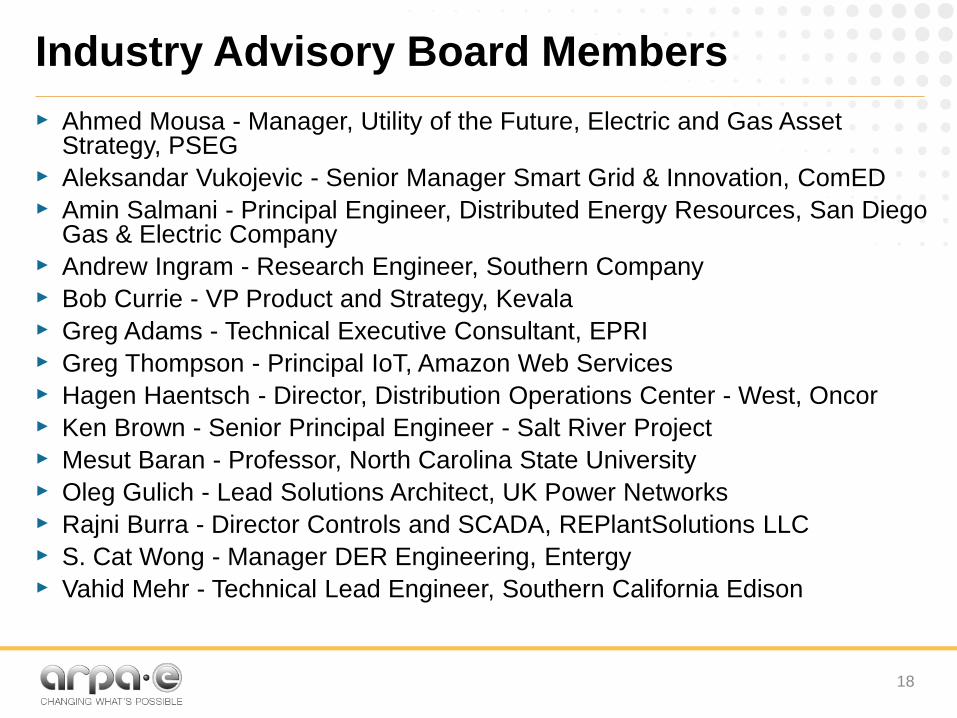
Industry Advisory Board Members
‣ Ahmed Mousa - Manager, Utility of the Future, Electric and Gas Asset Strategy, PSEG
‣ Aleksandar Vukojevic - Senior Manager Smart Grid & Innovation, ComED
‣ Amin Salmani - Principal Engineer, Distributed Energy Resources, San Diego Gas & Electric Company
‣ Andrew Ingram - Research Engineer, Southern Company
‣ Bob Currie - VP Product and Strategy, Kevala
‣ Greg Adams - Technical Executive Consultant, EPRI
‣ Greg Thompson - Principal IoT, Amazon Web Services
‣ Hagen Haentsch - Director, Distribution Operations Center - West, Oncor
‣ Ken Brown - Senior Principal Engineer - Salt River Project
‣ Mesut Baran - Professor, North Carolina State University
‣ Oleg Gulich - Lead Solutions Architect, UK Power Networks
‣ Rajni Burra - Director Controls and SCADA, REPlantSolutions LLC
‣ S. Cat Wong - Manager DER Engineering, Entergy
‣ Vahid Mehr - Technical Lead Engineer, Southern California Edison
18

M4: Network Analysis Workflow - Option 1
19
1. Build Connected Network Model
2. Build Operational Network Model
3. Estimate State of Network
4. Assess Security of Network and
Optimize Dispatch5. Control DERs
ADMS/DERMS
CYME Network Model
AMI Data
SCADA/PMU Measurements
Switch Status
DER Dispatch
SchedulePV Generation Forecast
Dispatch Status
DER Costs
DER Devices/Inverters
DER Network Analyzer Components
DER Network Analyzer components function in parallel with ADMS/DERMS

M4: Network Analysis Workflow - Option 2
20
1. Build Connected Network Model
2. Build Operational Network Model
3. Estimate State of Network
4. Assess Security of Network and
Optimize Dispatch5. Control DERs
ADMS/DERMS
Network Model
AMI Data
Connected Network Model
AMI Data
SCADA/PMU Measurements
Switch Status
Improved Operational
Network Model
DER Status
DER Costs
Revised DER
Dispatch Schedule
Connected Network
Model
Operational
Network Model
Operational Network Model
AMI Data
SCADA/PMU Measurements
Switch Status
Improved Operational
Network Model
Violated Constraints
DER Dispatch
Schedule
Improved Operational
Network Model
Dispatch Status
DER Costs
Each DER Network Analyzer component is integrated with ADMS/DERMS
DER
Grid Devices
DER Network Analyzer Components

Milestone 5
‣ Milestone 5: System control strategies for voltage control using dispatchable
resources
‣ Requirement: Develop system control strategies for controlling voltage along the
feeder using the dispatchable resources and verify approaches using APS feeder
model and OpenDSS tool to maintain feeder voltages between 0.95 p.u. and 1.05
p.u. under the extreme combinations of highest PV / light load and lowest PV /
heavy load conditions.
‣ Task Leads: Raja Ayyanar, Vijay Vittal, Mengxi Chen, Shanshan Ma (ASU)
‣ Challenges: See following slides.
‣ Methods: Represent PV inverter with conventional and adaptive controllers by a
set of differential equations using dynamic phasors. Add Newton-Raphson method
to the trapezoidal integration in DLL to improve numerical stability. Implement
adaptive volt-var controller to selected PV locations in utility partner’s feeder.
‣ Findings: See following slides.
21

22
M5: MRAC Implementation in Dynamic-Link
Library (DLL)
Dynamic Phasor
TransformationPV MRAC Inverter Dynamic model in
Dynamic-Link Library
(DLL)
Time domain Frequency domain
‣ The dynamics of the power electronic devices like the PV inverter with Model Reference Adaptive Control (MRAC) are usually modeled using real valued signals. However, OpenDSS is a phasor-based simulation tool. Phasors are used to represent the magnitude and the phase angle of the fundamental frequency components of the variables in the power system simulations where fast transients can be neglected.
‣ We cannot directly integrate the inverter model with the phasor network model in dynamic studies. So, the transformation from the real-valued inverter model (time domain) to the phasor-based model (frequency domain) is necessary.
‣ After the transformation, the phasor-based inverter model can be numerically implemented into the Dynamic-Link Library (DLL) for dynamic study in OpenDSS.
OpenDSS

23
M5: Verification of MRAC Implementation in DLL
(a) MRAC with volt-var enabled
‣ The developed DLL for the PV inverters with proposed MRAC are implemented into a small system with one distribution transformer and 7 PVs in OpenDSS.
‣ Same small system simulation is also conducted in PLECS to validate the results.
‣ At time 0.04s, the grid voltage is reduced from 1 p.u. to 0.88 p.u. with both volt-varenabled (a) and disabled (b).
‣ The initial states and the final steady states match between the results from the two software packages, which validates the effectiveness of the developed DLL model. The instantaneous voltage magnitude from PLECS also matches the peak voltage result from OpenDSS.
‣ P and Q from PLECS are obtained by an averaging algorithm from the instantaneous real valued signal, which explains the differences between PLECS and DLL results during the transients.
(b) MRAC with volt-var disabled
Comparison of results using PLECS and OpenDSS with DLL

24
M5: New Optimization Tool to Place the Minimum
Number of Advanced PV volt-var controllers
‣ The objective is to minimize the
number and active power
curtailment of advanced PV volt-
var controllers while maintaining a
certain level of substation voltage.
‣ The Q-V curve characteristics of
the volt-var control is implemented
as the new advanced volt-var
constraints in the formulation.
‣ The linearized IV-based ACOPF
constraints from Task 1 are used
in the formulation.
PV output constraints
𝑃𝑝𝑣,𝑔,𝑝,𝑡 = 𝑃𝑝𝑣,𝑔,𝑝,𝑡
𝑄𝑝𝑣,𝑔,𝑝,𝑡 = 0
PV inverter with volt-
var capability or not ?
Yes
NoIs volt-var
enabled?
Yes
No
PV output constraints
0 ≤ 𝑃𝑝𝑣,𝑔,𝑝,𝑡 ≤ 𝑃𝑝𝑣,𝑔,𝑝,𝑡
𝑄𝑝𝑣,𝑔,𝑝,𝑡 = 𝑄𝑣,𝑔,𝑝,𝑡
𝑄𝑝𝑣,𝑔,𝑝,𝑡2 + 𝑃𝑝𝑣,𝑔,𝑝,𝑡
2 ≤ 𝑆𝑝𝑣,𝑔,𝑝2
PV voltage magnitude constraints
𝑉𝑔,𝑝,𝑡2= 𝑉𝑔,𝑝,𝑡
𝑟 2+ 𝑉𝑔,𝑝,𝑡
𝑖𝑚 2
𝑉𝑚𝑚𝑖𝑛 ≤ 𝑉𝑔,𝑝,𝑡 ≤ 𝑉𝑚
𝑚𝑎𝑥
PV candidate for selection

25
M5: Case Study Results
‣ Using the proposed PV location optimization tool, 120 optimal locations that require advanced control are selected as shown in the GIS map in figure (a).
‣ The voltage profile improvement is shown in Figure (b) after the selective volt-var control is enabled. Voltages along the feeder can be maintained within the required range of 0.95 to 1.05 p.u.
(a) The locations of the 120 volt-var controllers in the GIS map
((b) Improved voltage profile along the feeder with the selective volt-var control

Milestone 6
‣ Milestone 6: Demonstrate success of the proposed primary topology processor
‣ Requirement: Test and evaluate primary distribution topology processor on APS data. Achieve interconnection structure accuracy to capture at minimum 90% of feeder structure.
‣ Task Lead: Mojdeh Khorsand Hedman (ASU)
‣ Challenges:
– Real-time knowledge of distribution network topology and system states are crucial for real-time operation, control and outage management: voltage control, DER scheduling, and system restoration.
– Single, two, and three-phase feeders and laterals
– Only limited number of sensors and telecommunication with switches
– Highly unbalanced systems
‣ Methods: A novel mixed-integer quadratic programming (MIQP) formulation based on a rectangular current-voltage is proposed, with binary variables associated with statuses of breakers and nonlinear AC power flow equations.
‣ Findings: See following slide.
26

27
M6: Simultaneous Distribution Topology
Processor and State Estimation- Results• Case 1: Modeling missing data (AMI data missing in 250 out of 346 primary load nodes) &
integration different sensor data (smart meter & μPMU)
• Case 2: Two small simultaneous outages (83 nodes with outage)
• Case 3: A case of large outage (381 nodes with outage)
• Case 4: Bad data modeling (60% error in 40 AMI measurements connected to the largest loads)
Case 1 2 3 4
Wrong statuses (connected to presently no-load
region)12 12 12 12
Undetectable statuses 0 1 1 0
Accuracy without considering status of switches
connected to presently no-load region (%)100 99.88 99.88 100
Accuracy considering status of switches
connected to presently no-load region (%)98.60 98.49 98.49 98.60
Captured feeder load (%) 100 100 100 100
Max absolute voltage magnitude error (pu) 0.0054 0.0053 0.0073 0.0087
Max voltage angle error (radian) 0.0043 0.0045 0.0037 0.007
Average simulation time (s) 20 20 20 20
Test system: Utility partner system, 2100 buses, 1790 lines, and 859 switches

Milestone 7
‣ Milestone 7: Demonstrate success of the proposed secondary topology processor
‣ Requirement: Test and evaluate secondary distribution topology processor on APS data. Achieve interconnection structure accuracy to capture at minimum 90% of feeder structure.
‣ Task Lead: Yang Weng (ASU)
‣ Challenges: See following slides.
‣ Methods: Multiview spectral clustering uses both voltage and geographic information. If the average distance is greater than a threshold, use multiview spectral clustering. If the average distance is lesser than a threshold, use regular spectral clustering.
‣ Findings: For the combined regular and multi-view spectral clustering algorithm, the accuracy is improved from 94.63% to 95.58%
28

M7: Previous Work and New Ideas
‣ Initially used regular spectral clustering, using either voltage or
geographic data, but not both at the same time
‣ This will improve accuracy, but there is no confidence metric and limited
adaptivity to new grids
‣ Changed to use multiview spectral clustering, using both voltage and
geographic information
‣ If the average distance is greater than a threshold, use multiview spectral
clustering
‣ If the average distance is lesser than a threshold, use regular spectral
clustering
29

M7: Extensive Validation
Large
distance
between
xfmrs
Large
distance
between
xfmrs
Simple Spectral
Clustering
Multiview Spectral
Clustering
Large
distance
between
xfmrs
Large
distance
between
xfmrs
Simple Spectral
Clustering
Multiview Spectral
Clustering
Large
distance
between
xfmrs
Large
distance
between
xfmrs
Simple Spectral
Clustering
Multiview Spectral
Clustering
Large
distance
between
xfmrs
Large
distance
between
xfmrs
Simple Spectral
Clustering
Multiview Spectral
Clustering
Ground TruthIncorrect Connection
Correct Connection

M7: Multiview Spectral Clustering Results
Distance threshold = 85, Accuracy = 92.55%
31
Errors can be corrected by
increasing distance threshold

M7: Multiview Spectral Clustering Results
Distance threshold = 115, Accuracy = 93.87%
32
Errors corrected by increasing
distance threshold
Errors still left behind

M7: Multiview Spectral Clustering Results
Distance threshold = 170, Accuracy = 94.82%
33
Errors corrected by increasing
distance threshold
Errors still left behind

M7: Multiview Spectral Clustering Results
Distance threshold = 215, Accuracy 95.58%
34

M7: Data Generation for the Model – Dividing the
utility partner’s feeder into multiple segments‣ To automatically divide the utility partner’s feeder into many
segments, one idea is to use k-means on the service transformers’ GPS coordinates based on the Haversine metric.
‣ k-means has the advantage that the clusters formed tend to have regular polygon shapes.
‣ By using k-means, the segments will contain transformers that are nearer to each other but may belong to different laterals of the primary feeder. However, such an approach will be of little drawback for secondary distribution.
‣ For each segment, we optimize the distance threshold to obtain the maximum accuracy for each segment.
35

M7: The Combined Regular and Multiview Spectral
Clustering Algorithm Result: Accuracy 95.58%
36
Correct Connection
Incorrect Connection
Ground Truth
‣ For the combined regular
and multi-view spectral
clustering algorithm, the
accuracy is improved from
94.63 to 95.58%

Milestone 8
‣ Milestone 8: Demonstrate success of the proposed topology
processor
‣ Requirement: Test and evaluate model using APS data.
Achieve interconnection structure accuracy to capture at
minimum 90% of feeder load.
‣ Task Leads: Mojdeh Khorsand Hedman and Yang Weng
(ASU)
‣ Findings: Please see Milestone 6; Milestones 6 and 8 are
closely related.
37

Milestone 9
‣ Milestone 9: Render and enhance distribution system state estimation (DSSE) algorithm
‣ Requirement: The success of the micro-PMU based DSSE will be demonstrated on the
Arizona Public Service (APS) system data. Specifically, estimation errors lower than 2% in
voltage magnitude and less than 0.5 degree in phase angle will be achieved.
‣ Task Lead: Anamitra Pal (ASU) and Yang Weng (ASU)
‣ Challenges: Lack of observability for distribution systems due to limited number of
measurement devices
‣ Methods: The team has conducted a comparative study of the results of linear state
estimation (LSE), which requires complete observability by micro-PMUs, with the proposed
deep neural network (DNN)-based DSSE, which does not have the complete observability
requirement. The performance of DNN-based DSSE has been tested for the IEEE 34-node
distribution feeder, a 240-node distribution feeder in the U.S. Midwest, and a real utility
feeder owned by APS in Phoenix.
‣ Findings: Simulation results show that the proposed DNN-based DSSE can overcome the
main obstacle of lack of observability in performing high-speed DSSE for distribution
networks. We have been able to achieve the DSSE error requirement for APS system with
one micro-PMU at feeder head.
38
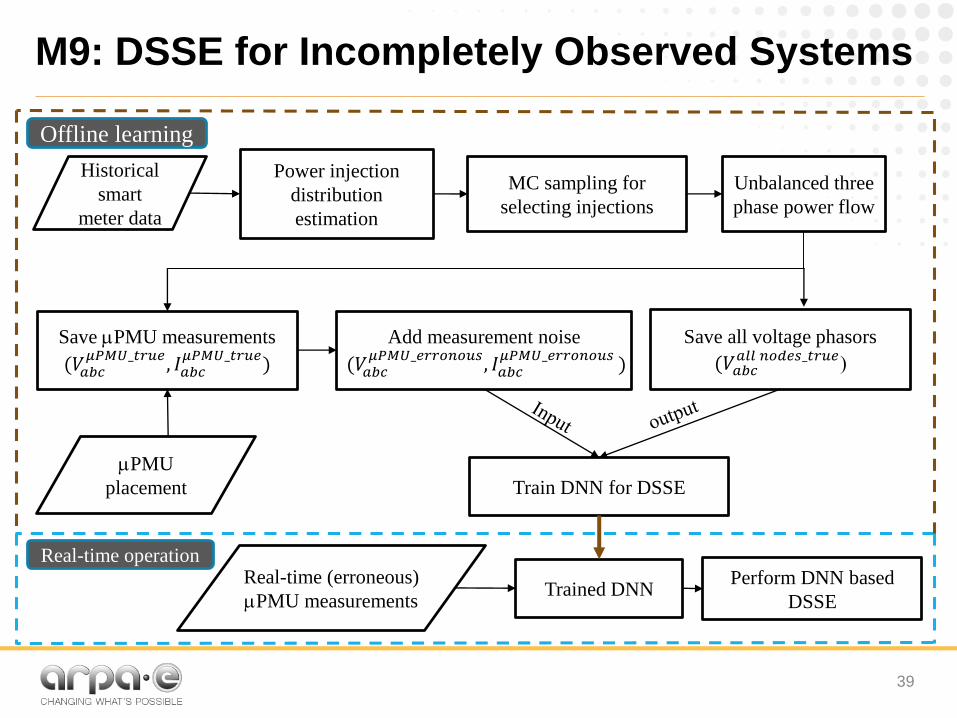
M9: DSSE for Incompletely Observed Systems
39
Power injection
distribution
estimation
MC sampling for
selecting injections
Historical
smart
meter data
Unbalanced three
phase power flow
Save PMU measurements
(𝑉𝑎𝑏𝑐𝜇𝑃𝑀𝑈_𝑡𝑟𝑢𝑒
, 𝐼𝑎𝑏𝑐𝜇𝑃𝑀𝑈_𝑡𝑟𝑢𝑒
)
Add measurement noise
(𝑉𝑎𝑏𝑐𝜇𝑃𝑀𝑈_𝑒𝑟𝑟𝑜𝑛𝑜𝑢𝑠
, 𝐼𝑎𝑏𝑐𝜇𝑃𝑀𝑈_𝑒𝑟𝑟𝑜𝑛𝑜𝑢𝑠
)
Save all voltage phasors
(𝑉𝑎𝑏𝑐𝑎𝑙𝑙 𝑛𝑜𝑑𝑒𝑠_𝑡𝑟𝑢𝑒
)
Train DNN for DSSE
Offline learning
Real-time operationReal-time (erroneous)
PMU measurements
Perform DNN based
DSSETrained DNN
PMU
placement

M9: DNN-Based DSSE for APS System
(Secondary)
40
• 9494 state variables (4747 voltage magnitude + 4747 voltage angle)
• 1 micro-PMU at feeder head (12 measurements)
• Non-Gaussian noise incorporated in micro-PMU measurements
• Realistic historical smart meter data is integrated with DNN-based DSSE
Micro-PMU

M9: DNN Based DSSE for APS System
(Secondary)
41
Based on APS secondary network OpenDSS model on July 15th at 5:00 PM
MAE* [degrees]Tolerance interval –
upper bound [degrees]MAPE** [%]
Tolerance interval –
upper bound [%]
0.06 0.145 0.13 0.35
ARPAE-E SOPO
requirement
Voltage magnitude error: 2%
Angle error: 0.5 degree
* Mean absolute error (MAE) in phase angles
** Mean absolute percentage error (MAPE) in voltage magnitudes
Ph
ase
MA
E
Ma
gn
itu
de
MA
PE
Node number Node number

Milestone 11
‣ Milestone 11: Demonstrate efficiency of dispatchable resource scheduling tool
‣ Requirement: Test and evaluate model on APS data. Achieve 5% cost savings.
‣ Task Lead: Mojdeh Khorsand Hedman (ASU)
‣ Challenges: See following slides.
‣ Methods: The team proposed convex second-order cone programming AC optimal power flow (SOCP/ACOPF) and tested it on the utility partner feeder. Furthermore, in order to more accurately schedule the PV units with volt-var control capability, the two-stage convex ACOPF tool was extended to include the Q-V characteristics of these PV units and was tested on two snap shots of the utility partner feeder.
‣ Findings: See following slides.
42

M11: Dispatchable Resource Scheduling
‣ ACOPF model based on second order cone programming (SOCP) for distribution
resources scheduling:
– Mutual Impedances
– PV resources equipped with smart inverters
– Controllable capacitors
– Storage
– Demand response (advanced aggregation and uncertainty modeling)
43

44
M11: Dispatchable Resource Scheduling –Results
• Chance-constrained ACOPF: limits risk of unacceptable voltage
• IEEE 33-bus distribution test system.
Violation Probability
Scheduled Solar
Generation Socially-
aware (kWh)
Scheduled Solar
Generation Non-
socially-aware (kWh)
% of Increased
Scheduled Solar
Generation
% of Cost Saving
during Sunny Hours
3% 12,584 8,392 50% 7%
5% 12,769 9,374 36% 5%
8% 13,072 10,428 25% 4%

Milestone 12
‣ Milestone 12: Field tuning of dispatchable resources including DER, storage, capacitor banks and voltage regulators
‣ Requirement: Test design of system level control strategies for dispatchable resources on the model developed for the APS feeder, and using smart inverters, storage, capacitor banks and regulators, control voltage magnitude along the feeder within a +/-5% bound on nominal voltage
‣ Task Leads: Raja Ayyanar, Vijay Vittal, Mengxi Chen, Shanshan Ma (ASU)
‣ Challenges: See following slides.
‣ Methods: A new optimization tool was developed to place the minimum number of advanced PV volt-var controllers in the feeder to meet the voltage requirements and mitigate under/over-voltage conditions. The problem is formulated as a mixed-integer nonlinear problem based on the Current-Voltage (IV) AC optimal power flow (ACOPF). The optimization results are also validated in OpenDSS with the developed DLL model of volt-var controller.
‣ Findings: See following slides.
45

M12: Settings for dispatchable resources
including DER, storage, capacitor banks
‣ High resolution time series data on capacitor bank voltages
and status obtained from utility partner, to be used in design
of settings for advanced inverters
‣ Impedance characteristics at point of interconnection derived
from feeder model
‣ Though no energy storage is present in the feeder under
study, we plan to model and simulate storage at strategic
locations
‣ Optimization framework for integrated voltage management
under development
46

M12: Upcoming Work
‣ Optimize volt-var settings and location of advanced inverters
to minimize power curtailment
‣ Enhance DLL model to include different optimal settings for
volt-var for advanced inverters at different locations and
considering other utility control devices (such as capacitor
banks)
‣ Test the results of the optimization in OpenDSS using the
DLL developed.
47

Milestone 13
‣ Milestone 13: Demonstration of topology processor and
DSSE algorithms on APS feeder
‣ Requirement: Attain 95% accuracy in topology estimation for
the APS system. DSSE on APS feeder will be performed in
36 seconds.
‣ Task Lead: upcoming task
‣ Challenges: upcoming task
‣ Methods: upcoming task
‣ Findings: upcoming task
48

Milestone 14
‣ Milestone 14: Demonstration of the performance of the proposed control of DER, storage, capacitor banks and voltage regulators on the APS feeder with high DER penetration
‣ Requirement: Field implementation of over 500 dispatchable resources with at least 50 PV with smart inverters in a large APS feeder; smart inverter and feeder responses to a minimum of 200 events (various dispatchable resource command changes under different operating conditions, faults, cap bank operations) captured; identical events and operating conditions simulated in high fidelity, dynamic model but with the proposed controllers; performance in terms of steady-state error between commanded and actual P and Q values, response time to command changes, quantitative impact on the feeder voltage profile, demonstrated to improve by at least 25% with the new controller compared to field measurements.
‣ Task Lead: upcoming task
‣ Challenges: upcoming task
‣ Methods: upcoming task
‣ Findings: upcoming task
49

Thank you!
50