rocketdyne division environmental monitoring · rocketdyne division environmental monitoring and...
TRANSCRIPT

ROCKETDYNE DIVISION ENVIRONMENTAL MONITORING
AND FACILITY EFFLUENT
ANNUAL REPORT DE SOT0 AND
SANTA SUSANA FIELD LABORATORIES SITES 1985
Rockwell International R&eLdm Mrhlon 6633 Caioga Avenue Canoga Park. CA. USA. 91303
ROCKETDYNE DIVISION ENVIRONMENTAL MONITORING
AND FACILITY EFFLUENT
ANNUAL REPORT DE SOT0 AND
SANTA SUSANA FIELD LABORATORIES SITES
1985
BY J. D. Moore
APPROVED: CphLadr Manager Radiation and Nuckar Safety
)IJII ~ o c k w e i ~ International Roclntdym DlvlGon 6633CanogaAvenue Canoga Par,. Cal~forn~a 91303
ISSUED: APRIL 1986
CONTENTS
Page
...................................................... I . Introduction 1
........ I1 . Sumnary and Evaluation of Environmental Monitoring Results 11 .................................. I I I . Environmental Monitoring Results 15 ................................... A . Radioactive Material s-.I985 15
. ................................ B . Nonradioactive Materials.. 1985 27 IV . Environmental Monitoring Program .................................. 29
................................................... A . Description 29
............................... B . Sampling and Sample Preparation 29
1 . Soil ...................................................... 29 2 . Vegetation ................................................ 37 . ..................................................... 3 iiater 38
4 . Ambient Air ............................................... 38
...................................... C . Counting and Calibration 40 U . onr radioactive Materials ...................................... 42
V . Effluent Monitoring Program ................................. 45 w . Treatment and Handling ........................................ 45
B . Faci l i ty descriptions ......................................... 47
1 . ue Soto S i t e .............................................. 47 ...................... 2 . Santa Susana Field Laboratories S i t e 47
C . Estimation of General Population Dose Attributable t o ...................................... Nuclear Operations.. 1985 48
Appendices
A . Comparison of Environmental Radioactivity Data f o r 1985 ............................................... With Previous Years 57
B . Environmental Monitoring Program Qua1 i t y Control .................. 65
C . California Regional Water Quali ty Control Board Cr i te r ia f o r D i scnargi ng Nonradioactive Constituents from Rocketdyne Division. SSFL ......................................... 67
........................................................ D . References 69 ............................................. E . External Distribution 71
F . Alternative h i t s f o r Radiological Data ........................... 73
RI/RD86-140
i i i
TABLES
Soi 1 Plutonium Radioact iv i ty Data.. 1985 ........................... Soi 1 Radioact iv i ty Data.. 1985 ..................................... Vegetation Radioact iv i ty Data.. 1985 ............................... Supply Water Radioact iv i ty Data.. 1985 ............................. Be l l Creek and Retention Pond Radioact iv i ty Data.. 1985 ............ Ambient A i r Radioact iv i ty Data- 1985 .............................. De Soto and SSFL Sites.. Pmbient Radiation Dosimetry Data..1985 .... De Soto and SSFL.. State o f Ca l i fo rn ia h b i e n t Radiation Dosimetry Data.. 1985 ..............................................
Page
16
18
18
20
22
24
25
9 . Nonradioactive Constituents i n Wastewater Discharged t o Unrestr icted Areas.. 1485 .......................................... 28
10 . Sampling Location Descript ion ..................................... 33
11 . Minimum Radioact iv i ty Detection ieve l s (ADLs) ..................... 41
................. 12 . Atmospheric hi ssions t o Unrestr icted Areas.. 1985 46
13 . Maximum Uownwlnd Plume Centerl ine Concentrations o f Atrnospneric hi ssions..l985 ....................................... 53
14 . hposure t o the Public i n the V i c i n i t y o f Rocketane Fac i l ities..1985 .................................................. 54
15 . Population Dose Estimates f o r Atmospheric Gnissions from SSFL Facilities..1985 ............................................. 56 .
FIGURES
1 . Rocketdyne Division- De Soto S i t e ................................. 3
......... 2 . Rocketdyne Division-Santa Susana F i e l d Laboratories S i t e 4
............ 3 . Map o f Santa Susana F i e l d Laboratories S i t e F a c i l i t i e s 5 4 . Map o f General Los Angeles Area ................................... 7 5 . Map o f Canoga Park . Simi Valley . Agoura. and Calabasas ................................................. Sampling Stations 30
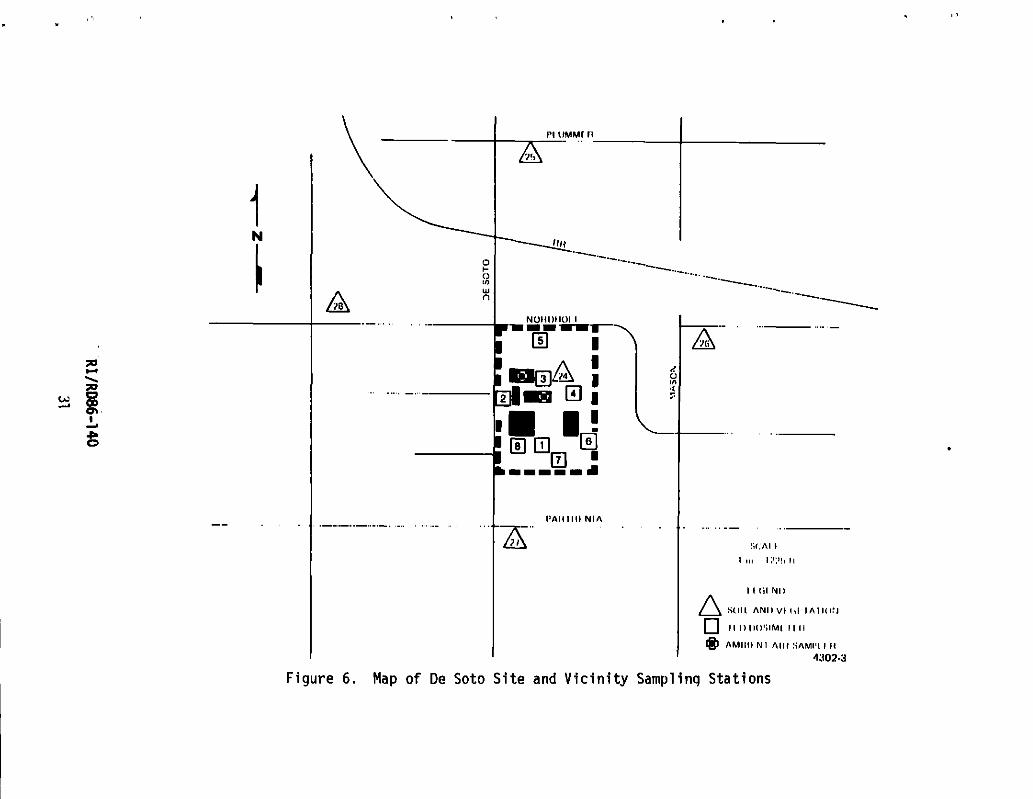
6 . Map o f De Soto S i t e and V i c i n i t y Sampling Stat ions ................ 31
..... 7 . Map o f Santa Susana F i e l d Laboratories S i t e Sampling Stations 32

FIGURES
Page
8. i leekly, Montnly, and Annual Averaged Long-i ived Ai rborne R a d i o a c t i v i t y a t t h e De Soto and Santa Susana F i e l d ........................................ ~ a b o r a t o r i e s s i tes--1985.. 29
9. Santa Susana F i e l d i a b o r a t o r i e s Site-Centered Demography t o 8 Km Distance..................................................... 50
- 10. Santa Susana F i e l d Labora tor ies Site-Centered Demography t o 16 km Distance.. .................................................. 51
11. Santa Susana F i e l d Labora tor ies Site-Centered Demography t o 80 Km Distance.................................................... 52

I . INTRODUCTION
In a Rockwell International Corporation organizational realignment, ef- fect ive on 1 October 1984. the Energy Systems Group was merged w i t h Rocketdyne
Division and i s no longer a separate organization. Annual reports will here-
a f t e r r e f l e c t t h i s change.
- Environmental and f a c i l i t y e f f luen t radioactivity monitoring a t the Rocketdyne Division of Rockwell International (California operations) i s per-
formed by the Radiation and Nuclear Safety Group of the Health, Safety, and Environment Department. So i l , vegetation, and surface water a r e routinely
sampled t o a distance of 10 miles from Division s i t e s . Ground water from s i t e supply water wells and other t e s t wells i s periodically sampled t o measure
radioactivity i n these waters. Continuous ambient a i r sampling and d i r ec t
radiation monitoring by them01 umi nescent dosimetry a r e performed a t several on-site and of f - s i te locations f o r measuring a i r ~ o r n e radioactivity concentra-
t ions and s i t e ambient radiation levels. Radioactivity i n emissions dis-
cnarged t o the atmosphere from nuclear f a c i l i t i e s i s continuously sampled and monitored t o ensure t ha t amounts released t o unrestricted areas' a r e ~ e i o w
appropriate 1 imi ts and t o identify processes t ha t may require additional
engineering safeguards t o m i n imi r e radioactivity i n such discharges. In adai- - t ion, selected nonradioactive chemical consti tuent concentrations in surface
wacer aiscnargea t o urlrestricted areas a r e detenninea.
Tne environmental radioactivity reported herein i s a t t r ibu ted t o natural
sources and t o residual fa1 lou t of radioactive material from past atmospneric
tes t ing of nuclear devices.
Work i n nuclear energy research and development i n what has become the
Rocitetdyne Division of Rockwell International Corporation began i n 1946. Rocketdyne i s currently working on the design, development, fabrication, and
tes t ing of components and systems for central s ta t ion power plants, on the

decladding o f i r r ad ia ted nuclear fuel, and on tne decontamination and disposi-
t i o n (OBD) o f f a c i l i t i e s program i n addi t ion t o a broad spectrum o f conven-
t iona l programs i n rocket propulsion, u t i l i z a t i o n o f space, and national
defense.
The administrat ive and s c i e n t i f i c research f a c i l i t i e s associated w i th
tnese e f f o r t s are located a t several major f a c i l i t i e s i n Canoga Park,
Cal i fornia, inc lud ing the De Soto s i te , (Figure 11, approximately 23 mi les
northwest o f downtown Los Angeles and i n the Simi H i l l s . The De Soto s i t e i s
t yp ica l o f the San Fernando Valley f loor , a t an a l t i t u d e o f 875 f t above sea
leve l . Several nuclear research programs, l icensed by the State o f Cal i -
fornia, are conducted here. These include Bui ld ing 104 analy t ica l chemistry and applied nuclear research laborator ies and the Gama I r r a d i a t i o n F a c i l i t y
containing approximately 35 kCi o f %o.
Tne 290-acre Santa Susana F i e l d Laboratories (SSFL) s i t e (Figure 2) i s
located i n the Simi H i l l s o f Ventura County, approximately 30 mi les northwest
of aowntown Los Angeles. The SSfL s i te , s i tuated i n rugged t e r r a i n typ ica l o f
mountain areas o f recent geological age, i s underlain by a sandstone bearock
u n i t ca l l ed the upper cretaceous Chatsworth formation. The s i t e may be de-
scribed as an i r r egu la r plateau spr inkled w i th outcroppings above the more >
leve l patches and w i th peripheral eroded ravines. Elevations o f the s i t e vary
from 1650 t o 2250 f t above sea level . The surface mantle consists o f uncon-
sol idated gravel, sand, s i l t , and clay. Both Department o f Energy (DOE) and
Rockwell In ternat ional owned f a c i l i t i e s , shown i n Figure 3, share-the Area I V
por t ion o f t h i s s i te. The SSFL s i t e also contains f a c i l i t i e s i n which nuclear
operations l icensed by the U.S. Nuclear Regulatory Colmission and the State
are conducted. The 1 icensed f a c i l i t i e s include ( 1 ) the Rockwell Interna-
t i ona l Hot Laboratory (RIHL) (Bui ld ing 020). (2) the Nuclear Mater ia ls Devel-
opment F a c i l i t y (NMDF) (Bui ld ing 0551, ( 3 ) a former neutron radiography f a c i l -
i ty containing the defueled L-85 nuclear examination and research reactor
(au i 1 ding 093). (4) several X-ray and radioisotope i ndus t r i a l radiography i n -
spection f a c i l i t i e s , and (5) a nuclear instrument ca l i b ra t i on laboratory.
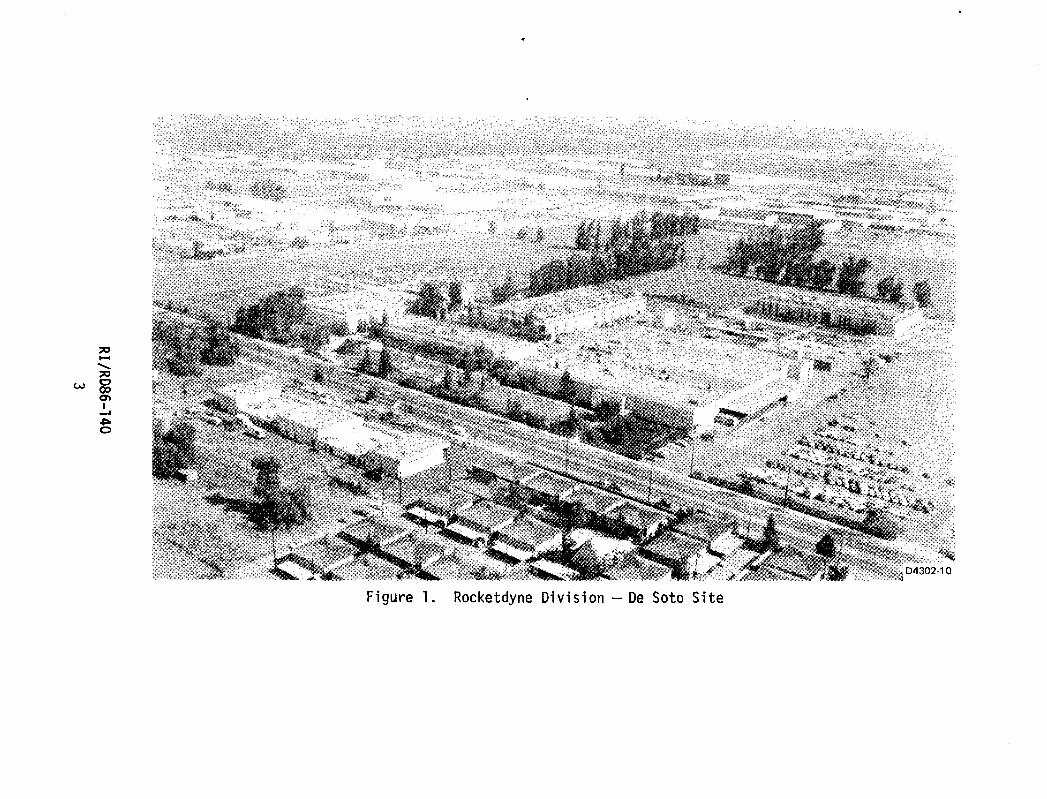
Figure 1. Rocketdyne Div is ion - De Soto S i t e

F i gure 2. Rocketdyne D iv is ion- Santa Susana Field Labora tor ies S i t e

MAY 4987

The loca t ion o f these s i t e s i n r e l a t i o n t o nearby comnunities i s shown i n
Figure 4. Much o f the land surrounding the De Soto s i t e i s used f o r l i g h t
industry and other conrnercial uses and for res ident ia l apartments and single-
family dwellings. Most o f the land surrounding the SSFL s i t e i s barren, w i th
some minor c a t t l e grazing on the southern por t ion and some orchard farming a t
the eastern boundary. A t greater distances, residences and some l i g h t indus-
t r i e s become prevalent. Y i t h i n 30 Km o f the SSFL s i te , there i s no s i g n i f i -
cant agr icu l tu ra l land use and, except f o r the Pac i f i c Ocean about 20 km south,
there i s no s ign i f i can t body o f water reserved f o r recreational use. There are
four major reservoirs w i t h i n 50 km o f the s i te , which provide domestic water t o
the greater Los Angeles area. The nearest o f these i s more than 16 km distant.
Included w i th in the SSFL s i t e i s an 82-acre government-optioned area
where DOE contract a c t i v i t i e s are conducted, p r imar i l y by the nonnuclear Ener-
gy Techno1 ogy Engineering Center ( ETEC). The major operational nuclear i n -
s ta l l a t i o n w i t h in the DOE-optioned area i s the Radioactive Mater ia l Disposal
F a c i l i t y (RMDF). This f a c i l i t y i s used f o r storage o f i r r ad ia ted fue l and f o r
packaging radioact ive wastes generated as a r e s u l t o f the DSD program and fue l
decl addi ng operations. Several deactivated nuclear reactor and support
f a c i l i t i e s , a l l w i t h i n the optioned area, are af fected by the DSD program.
Licensed programs conducted during 1985 included (1 ) the operation o f
the RIHL f o r nuclear reactor fue l decladding and reactor system component
examination and the fabr ica t ion o f sealed rad ia t ion sources and (2 ) the dis-
mantling o f the previously defueled L-85 nuclear examination and research
reactor.
The basic po l i cy f o r the control o f rad io log ica l and chemical hazards
requires that, through engineering controls, adequate containment o f such
mater ia ls be provided and that, through r i g i d operational controls, f a c i l i t y
e f f l u e n t releases and external rad ia t ion l eve l s be reduced t o a minimum. The
environmental monitoring program provides a measure o f the effectiveness o f
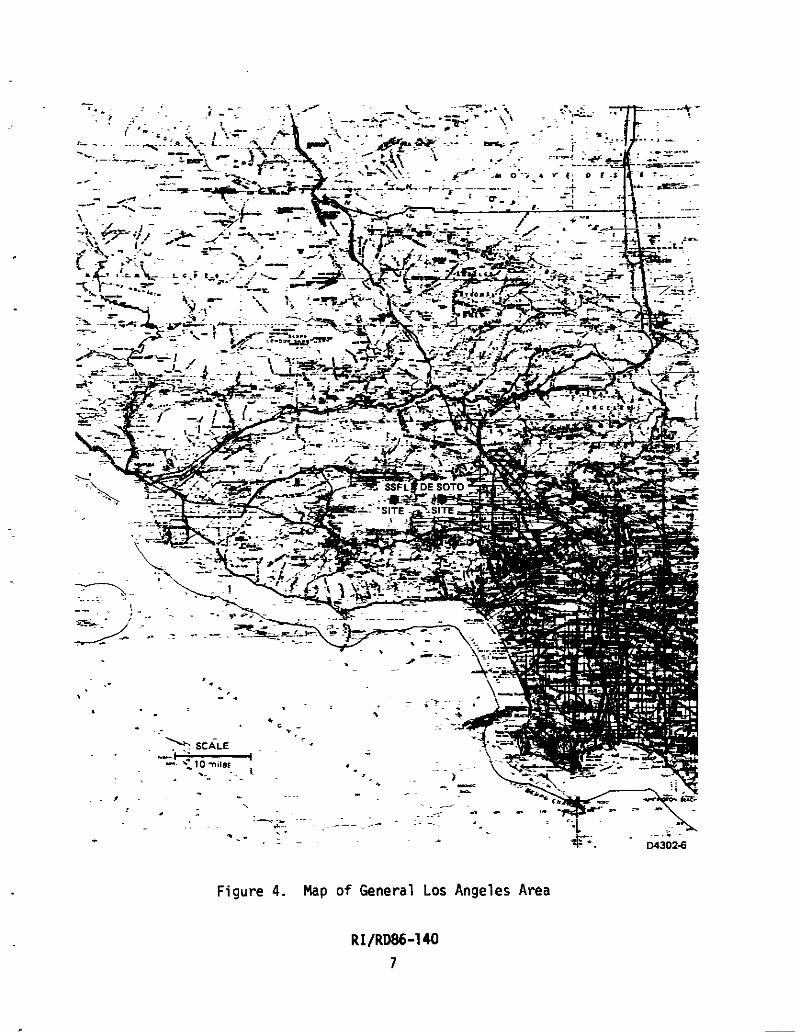
Figure 4. Map o f General Los Angeles Area
safety procedures and o f the engineering safeguards incorporated i n t o f a c i 1 i t y
designs. spec i f i c radionucl ides i n f a c i l i t y e f f l u e n t o r environmental samples are not rou t ine ly i d e n t i f i e d because o f the extremely low rad ioac t i v i t y l eve l s
normally detected, bu t they would be i d e n t i f i e d by analy t ica l o r radiochemis-
try tecnni ques i f s i gn i f i can t l y increased rad ioac t i v i t y 1 eve1 s were observed.
Re1 a t i vely few d i f f e r e n t radionucl i des are involved i n these operations.
Occasional garma-spectral analyses o f bulk samples such as s o i l , water,
and a i r confirm t h a t the major radionucl ides present are those o f the natural-
l y occurring thorium and uranium decay chains, p lus other natural radionu- 7 c l i des such as the primordial 4 0 ~ , and Be, produced by cosmic ray i n t e r -
actions i n the atmosphere.
I n addi t ion t o e n v i r o m n t a l monitoring, work area a i r and atmospheric
emissions are continuously monitored o r sampled, as appropriate. This pro-
vides a d i r e c t measure o f the effectiveness o f engineering control s and allows
remedial act ion t o be taken before a s i gn i f i can t release o f hazardous mater ia l
can occur.
Environmental sampling stat ions 1 ocated w i th in the Doundaries o f the De
Soto and SSFL s i t e s are re fer red t o as "on-site" stat ions; those located out-
side these boundaries, o r r e l a t i v e l y d i s tan t from any nuclear f a c i l i t i e s , are
re fer red t o as "o f f -s i te " stations. The De Soto and SSFL s i t e s are sampled
monthly t o determine the concentration o f rad ioac t i v i ty i n typ ica l surface
so i l , nat ive vegetation, and water. So i l i s sampled on-si te (SSL) and o f f -
s i t e semiannually f o r plutonium analysis. S imi la r o f f - s i t e environmental sam-
ples, except f o r plutonium analysis, are obtained quarterly. Continuous ambi-
e n t a i r sampling provides informat ion concern1 ng long-1 i ved airborne par t icu-
1 a te rad ioac t i v i t y . On-si t e ambient rad ia t ion monitoring using t h e m 1 umi nes-
cent dosimetry (TLD) measures environmental rad ia t ion leve ls a t the De Soto and SSFL s i t es and also a t several o f f - s i t e locations.

Nonradioact ive wastes discnarged t o u n r e s t r i c t e d areas are l i m i t e d t o
1 i q u i d s released t o san i ta ry sewage systems and t o sur face water drainage sys-
tems. No i n t e n t i o n a l re leases o f any l i q u i d p o l l u t a n t s a re made t o unre-
s t r i c t e d areas. Sani tary sewage from a l l DOE and Rocketdyne f a c i l i t i e s a t t he
SSFL s i t e i s t r e a t e d a t an on-s i te sewage p lan t . The p l a n t o u t f a l l d ra ins
i n t o r e t e n t i o n pond R-2A, l oca ted toward the southern p o r t i o n o f SSFL. The
surface water drainage system o f SSFL, which i s composed o f ca tch ponds and
open drainage d i tches, a l so d ra ins t o r e t e n t i o n pond R-2A. Water from the
pond may be reclaimed as i n d u s t r i a l process water o r released, as necessary,
o f f - s i t e i n t o B e l l Creek, a t r i b u t a r y o f t he 10s Angeles River. The pond i s
p e r i o d i c a l l y sampled f o r r a d i o a c t i v i t y and sampled a t discharge f o r bo th ra-
d i o a c t i v e and nonradioact ive p o l l u t a n t s as requ i red by the discharge pe rm i t
issued t o Rocketdyne D i v i s i o n by the C a l i f o r n i a Regional Water Qua1 i ty Control
Board.
Th is r e p o r t summarizes environmental mon i to r ing r e s u l t s f o r 1985, which
are presented i n Sect ion 111. The sampling and a n a l y t i c a l methoas used i n the
environmental mon i to r ing program f o r rad ioac t i ve ma te r ia l s are described i n
Sect ion I V . A comparison o f 1985 r a d i o a c t i v i t y r e s u l t s w i t h the r e s u l t s from
previous years appears i n Appendix A, w i t n a sunmary o f t he Environmental Mon-
i t o r i n g Program Q u a l i t y Control i n Appendix B. Appendix C shows regu la tory
l i m i t s on nonradioact ive p o l l u t a n t s i n water released from the s i t e . Refer-
ences a re l i s t e d i n Appendix D. The ex terna l d i s t r i b u t i o n o f t h i s r e p o r t i s
shown i n Appendix E, and a t a b l e o f a l t e r n a t i v e u n i t s f o r r a d i o l o g i c a l data i s
shown i n Appendix F. The gross alpna and beta r a d i o a c t i v i t y i s repo r ted as
r e s u l t s o f t h e moni to r ing program. Estimates o f rad ionuc l ide components i n
e f f l u e n t s prov ide the bas is f o r dose comnitment ca l cu la t i ons .

I i . SUMMARY AND EVALUATION OF ENVIRONMENTAL MONTORING RESULTS
A1 1 raa ioact i v i ty leve ls observed i n environmental samples f o r 1985 show
close agreement w i th rad ioac t i v i t y l eve l s measured during recent years and re-
ported i n t i e previous issues o f t h i s report. Local environmental radioact iv-
i t y levels, which r e s u l t from 00th natural and man-made radionucl ides and
snowed the presence o f f a l l o u t from past atmospheric tes t ing o f nuclear de-
vices, have aecreased t o generally constant leve ls during the past several
years. These leve ls are now due mainly t o the primordial radionuclides. The
loca l e f fec ts o f fore ign atmospheric nuclear tests, wnicn had been read i l y oo-
servable i n da i l y ambient airborne rad ioac t i v i t y levels, were not evident i n
1985. The long-term e f f e c t o f airborne rad ioac t i v i t y on surface sample radio-
a c t i v i t y leve ls also has no t been discernable i n recent years. The continuing
r e l a t i v e constancy i n environmental r ad ioac t i v i t y l eve l s i s p r imar i l y due t o
the dominance o f natural 1y occurring radionucl ides i n the environment.
The resu l ts o f t h i s environmental monitoring ind icate t h a t there are no
s ign i f i can t sources o f unnatural radioact ive material i n the v i c i n i t y o f the
Rocketdyne si tes. Addit ionally, iden t i ca l resu l ts obtained f o r on-si te and
o f f - s i t e samples fu r tner ind icate t h a t there i s no cont r ibut ion t o general en-
v i ronmental r ad ioac t i v i t y a t t r i bu tab le t o nuclear operations a t Rocketdyne.
Po ten t ia l l y s i gn i f i can t exposure patnways t o the general pub1 i c resu l t ing from
Rocketdyne nuclear operations are l i m i t e d t o the atmospheric discharge of r a - d ioact ive mater ia ls f o r which the only exposure pathways t o people r e s u l t from
wnol e oody external exposure and from inha la t ion exposure t o released materi - als, and t o d i r e c t rad ia t ion exposure o f ind iv iduals and the general p i lb l ic
oeyona the s i t e boundary. No discharge o f l i q u i d radioact ive wastes i s made
t o tne environment. A l l such mater ia ls are processed f o r disposal a t regu-
l a ted disposal sites.
The maximum ind iv idual annual exposures estimated f o r persons a t the s i t e
boundary and also a t the residence nearest the SSFL s i t e are small when com-
pared w i th natural rad ia t ion and w i th a l l applicable guidelines. The e s t i -
mates of exposure due t o inha la t ion a t the boundary and the nearest residence
were derived from the AIRDOS-EPA calculated concentrations a t those locat ions
and incorporated the dose conversion factors appropriate f o r radionucl ides i n
process a t each nuclear f a c i l i t y . This inha la t ion exposure estimate i s the
sum o f contr ibut ions calculated f o r the measured releases from each f a c i l i t y .
The external rad ia t ion exposure estimates a t the maximum exposed boundary
loca t ion and a t the nearest residence are based on resu l ts f o r s i t e ambient
rad ia t ion dosimeters and also f o r several f a c i l i t y workplace rad ia t ion dosime-
ters. The unattenuated external annual exposure due t o operations conducted a t tire RMDF i s estimated t o be 80 mrem a t the nearest boundary-line loca t ion
and less than 0.1 mrem f o r the nearest residence f o r operations conducted a t
tne RMDF. The boundary-line exposure i s conservative i n t h a t the rugged te r -
r a i n a t the s i t e boundary nearest the RMDF precludes anything more .than the
occasional and temporary presence o f any person a t t h a t location. These
values were determined by ca lcu la t ing the unattenuated exposure expected a t
the Doundary and nearest residence on the basis o f the highest annual r e s u l t
for area dosimeters i n place around the f a c i l i t y . For the nearest residence,
rad ia t ion at tenuat ion due t o a i r absorption and also t o the intervening rock
formations w i l l lower d i r e c t rad ia t ion t o p r a c t i c a l l y nonexistent l eve l s w i th
only natural bacKground rad ia t ion innerent t o the residence loca t ion being
present. Boundary-1 ine d i r e c t rad ia t ion exposures f o r the State o f Ca l i fo rn ia
and U.S. NilC-licensed operations a t other Rocketayne nuclear f a c i l i t i e s were
very much below 10 mrem f o r the year. The topograpny o f the SSFL s i t e sur-
rounding the nuclear f a c i l i t i e s and ou t t o the s i t e boundary i s extremely ir-
regular. H i l l s and rock outcroppings sh ie ld the o f f - s i t e areas, s i gn i f i can t l y
reducing o f f -s i t e exposures from on-si t e sources. . ~
S im i la r l y f o r the De Soto s i te , i n te rna l dose estimates a t the boundary and a t the nearest residence are no t s i g n i f i c a n t l y d i f ferent from zero. Est i - mates o f the external rad ia t ion exposure a t the De Soto boundary ( 4 + 10 mrem) - and a t the nearest residence (0.01 - + 0.01 a r m ) are based on the di f ference
between the s ing le highest on-sl t e TLD measurement and the average o f o f f - s i t e
measurements. The di f ference i s more l i k e l y the r e s u l t o f random v a r i a b i l i t y
i n the measurements than from actual rad ia t ion exposure.

Supply water a t the SSFL s i t e i s monitored a t two locations. T h i s water consis ts of ground water from deep wells on the s i t e blended w i t h potable wa-
t e r from the Ventura County Water D i s t r i c t 17. In addit ion, shallow ground water i s periodically sampled a t a standpipe adjacent t o the basement level of
a deactivated systems fo r nuclear auxi l iary power (SNAP) reactor t e s t f a c i l i t y (Building 059). These samples a r e evaluated t o detect the t rans fe r of activa-
t ion product radioact ivi ty from the underground reactor t e s t vault containment and in to the surrounding s o i l . None nas been detected. Therefore, these
analyses serve a s a measure of radioact ivi ty naturally present i n the ground
water.
Qual i t y assurance measures incorporated i n to the environmental m n i toring
program include par t ic ipat ion in DOE-sponsored programs such a s the Environ-
mental Dosimeter Intercomparison Program and the DOE Environmental Measure- ments Laboratory Qual i t y Assessment Program ( ML-QAP) . Participation i n two
EML-QAP sample analysis s e t s (QAP XXIII and XXIV) was done in 1985. Analysis of the r e su l t s indicates t h a t accuracy i n measuring radioact ivi ty i n the sam-
pl e media provided f o r the i ntercompari son improved; however, additional work i s required t o develop counting standards t h a t a r e more representative of the
types of samples and analyses addressed in the quali ty assessment program. In
addition t o par t ic ipat ion i n these programs, 1 aboratory analyses of s p l i t and
rep1 i ca t e samples a r e routinely used t o evaluate the reproducibil i ty of sample
radioact ivi ty measurements of water and so i l gross radioactivity. Control
char ts of counting system radiation response a re maintained. These data a re periodically evaluated t o determine the correla- t ion between sample s e t s and
trends in background.
111. ENVIRONMENTAL MONITORING RESULTS
A. RADIOACTIVE MATERIALS--1 985
The average rad ioac t i v i t y concentrations i n 1 ocal soi 1 , veget : a t i on,
face water, and ambient a i r f o r 1985 are presented i n Tables 1 through 6.
sur-
The
data snown f o r gross alpha a c t i v i t y i n samples t n a t are general ly t h i ck com-
pared w i t h tne range o f t i e alpha pa r t i c l es represent a marked change i n the
manner o f ca lcu la t ing and repor t ing them, compared wf t h p r i o r reports. This
change r e f l ects the gradual red i rec t ion o f the monitoring program from moni-
t o r i ng t o measurement. Previously, alpha count r a t e data had been converted
t o alpha a c t i v i t y concentrations by using an e f f i c iency fac to r f o r a t h i n .
electroplated source, and the resu l ts were monitored f o r changes from p r i o r
values. This resu l ted i n a r t i f i c i a l l y low numerical values f o r the alpha
a c t i v i t y i n several sample media. S ta r t ing w i th the 1984 report , the alpha
a c t i v i t y concentrations f o r these media are reported based on an e f f i c iency
fac to r derived from a sample w i t h d is t r ibu ted alpha a c t i v i t y t h a t i s t h i ck
r e l a t i v e t o tne alpha p a r t i c l e range. For monitoring purposes, t h i s has no
ef fect . However, the values reported more closely represent the actual a1 pha
a c t i v i t y ex is t ing i n the environment. I n ca lcu la t ing the average concentra-
t i o n values, a1 1 val ues, inc lud ing negative values, are included. This method
o f noncensorea data averaging. reconmended by DOE Order 5484.1, a f fords a bet-
t e r estimate o f the central value and dispersion o f the data. A l l l i m i t s o f
e r ro r reported i n the tables are f o r one standard deviat ion (1 sigma). Usual-
l y , tnese show the dispersion o f the measured values about the mean. These
two changes i n data in te rp re ta t ion resul r i n noticeable di f ferences i n the
data snown i n the h i s t o r i c a l comparisons. It must be recognized t h a t these
dif ferences do not r e f l ec t changes i n environmental r ad ioac t i v i t y bu t are
merely consequences o f the evolut ion o f the monitoring program.
The presentation o f data i n the tables includes the annually averaged
data f o r each sample type and the maximum rad ioac t i v i t y leve l detected f o r a
s ingle sample from the annual set, which i s reported because o f i t s s i g n i f i -
cance i n ind ica t ing the occurrence o f a major episode or an area-wide inc ident
o f radioact ive material deposition. None o f the maximum observed values,
which (as the tables show) occurred randomly during the year, shows a great
increase over the average values beyond inherent v a r i a b i l i t y . The ambient a i r
sampling data show no great ly increasing o r decreasing trends f o r most o f the
year and can be described as general ly constant, w i t h some increase i n loca l
airborne rad ioac t i v i t y l eve l s occurring during the second and four th quarters.
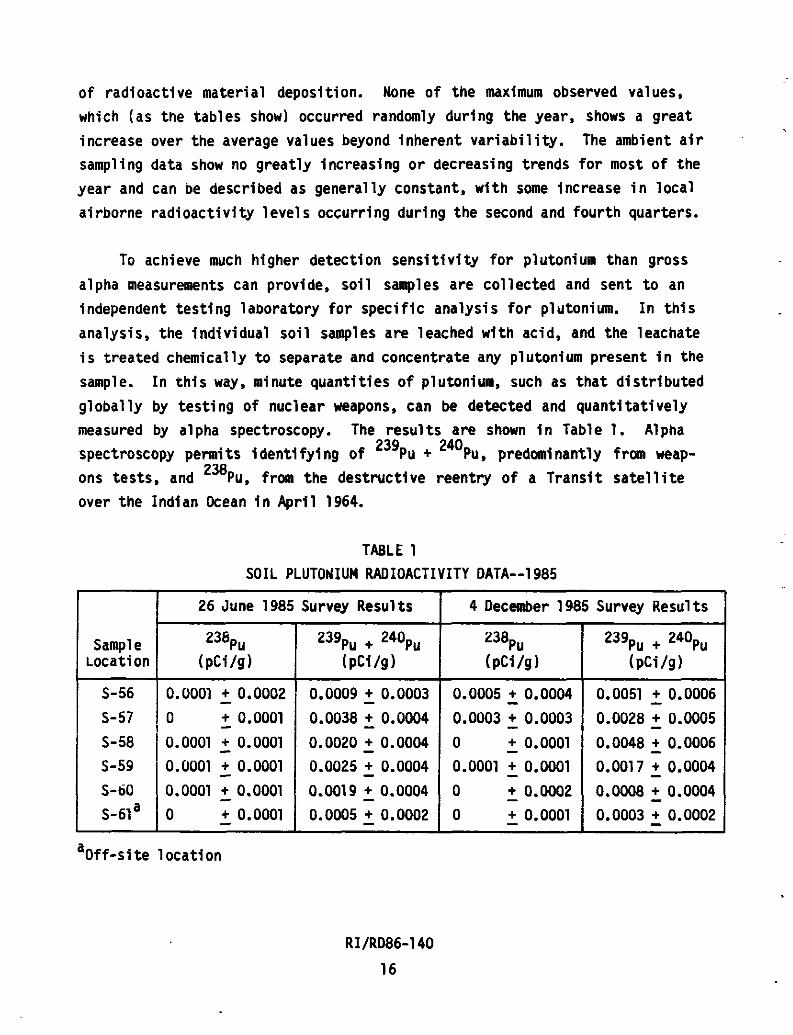
To achieve much higher detection s e n s i t i v i t y f o r plutonium than gross
alpha measurements can provide, s o i l samples are co l lec ted and sent t o an
independent tes t ing laboratory f o r spec i f i c analysis f o r plutonium. I n t h i s
analysis, the ind iv idua l s o i l samples are leached w i th acid, and the leachate
i s t reated chemically t o separate and concentrate any plutonium present i n the
sample. I n t h i s way, minute quant i t ies o f plutonium, such as t h a t d is t r ibu ted
g lobal ly by t es t i ng o f nuclear weapons, can be detected and quant i ta t i ve ly
measured by alpha spectroscopy. The resu l t s are shown i n Table 1. Alpha
spectroscopy permits i denti f y i ng o f 2 3 9 ~ ~ + 2 4 0 ~ ~ , predomi nant l y from weap-
ons tests, and 2 3 8 ~ ~ , from the destruct ive reentry o f a Trans i t s a t e l l i t e
over the Indian Ocean i n Ap r i l 1964.
TABLE 1
SOIL PLUTOUIUM RADIOACTIVITY DATA--1985
'o f f -s i te loca t ion
Sarnpl e ~ o c a t i o n
26 June 1985 Survey Results
2 3 6 ~ u (pCi/g)
4 December 1985 Survey Results
239pu + 240pu ( pCi /g
238~u (pCi/g)
239pu + Z4Opu (pCi/g)
For comparison ~ i t n the plutonium present a s a r e su l t of f a l l ou t from
nuclear weapons t e s t s and f a i l u re a t launch of a radioisotope-powered sa te l -
1 i t e , put11 isned data from soi l t e s t s i n nearoy durbank. California, i n 1970-71 show a plutonium concentration of approximately 2 x lo-' uCi/g f o r 2 3 9 ~ u +
2 4 0 ~ u and approximately 0.06 x lo-' X i / g f o r 238~u. The data i n Table 1 show no s ignif icant increases i n on-site soi l plutonium re la t ive t o the Bur-
bank values.
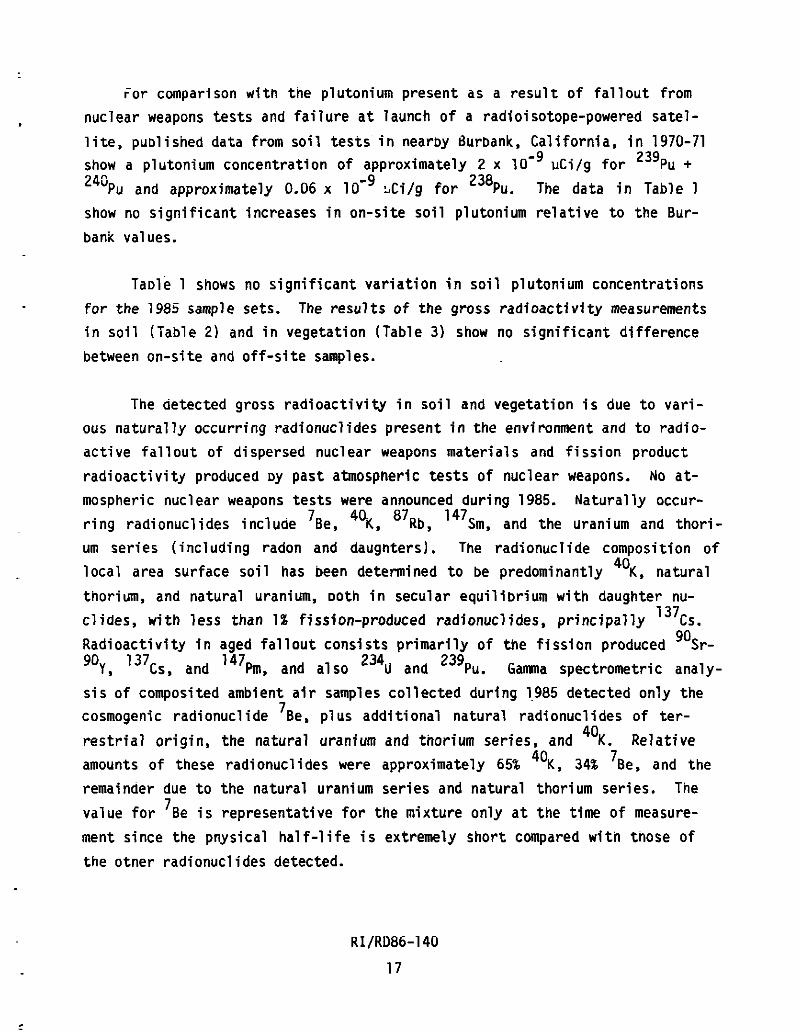
Taole 1 shows no s ignif icant variation i n soi l plutonium concentrations
for the 1985 sample sets . The resu l t s of the gross radioactivity measurements in soi l (Table 2) and i n vegetation (Table 3) show no s ignif icant difference
between on-si t e and off-si t e samples.
The detected gross radioactivity i n soi l and vegetation i s due t o vari-
ous naturally occurring radionucl ides present in the environment and t o radio- act ive fa1 lou t of dispersed nuclear weapons material s and f i s s ion product
radioactivity produced oy past atmospneric t e s t s of nuclear weapons. No a t -
mospheric nuclear weapons t e s t s were announced during 1985. Naturally occur-
ring radionucl ides include 7 ~ e , 40K , 8 7 ~ b , 1 4 7 ~ m , and the uranium and thori-
um s e r i e s (including radon and daugnters) . The radionucl ide composition of local area surface soil has been determined t o be predominantly 40K., natural
thorium, and natural uranium, ~ 0 t h i n secular e q ~ i l i b r i ~ m w i t h daughter nu- c l ides, w i t h l e s s than 1"aission-produced radionucl ides, principally ' 3 7 ~ s .
Radioactivity i n aged f a l l o u t consis ts primarily of the f i s s ion produced ''5,- "Y, 1 3 7 ~ s , and 1 4 7 ~ m , and also 2 3 4 ~ and 239~u . Gamma spectrometric analy-
s i s of composi ted ambient a i r samples collected during 1.985 detected only the cosmogenic radionucl ide 7 ~ e , pl us additional natural radionucl ides of t e r -
r e s t r i a l or igin , the natural uranium and thorium ser ies , and 4 0 ~ . Relative 7 amounts of these radionuclides were approximately 6 5 " a 0 ~ , 34% Be, and the
remainder due t o the natural uranium se r i e s and natural thorium ser ies . The 7 value f o r Be i s representative f o r the mixture only a t the time of measure-
ment since the pnysical ha l f - l i fe i s extremely short compared w i t h those of
the otner radionuclides detected.
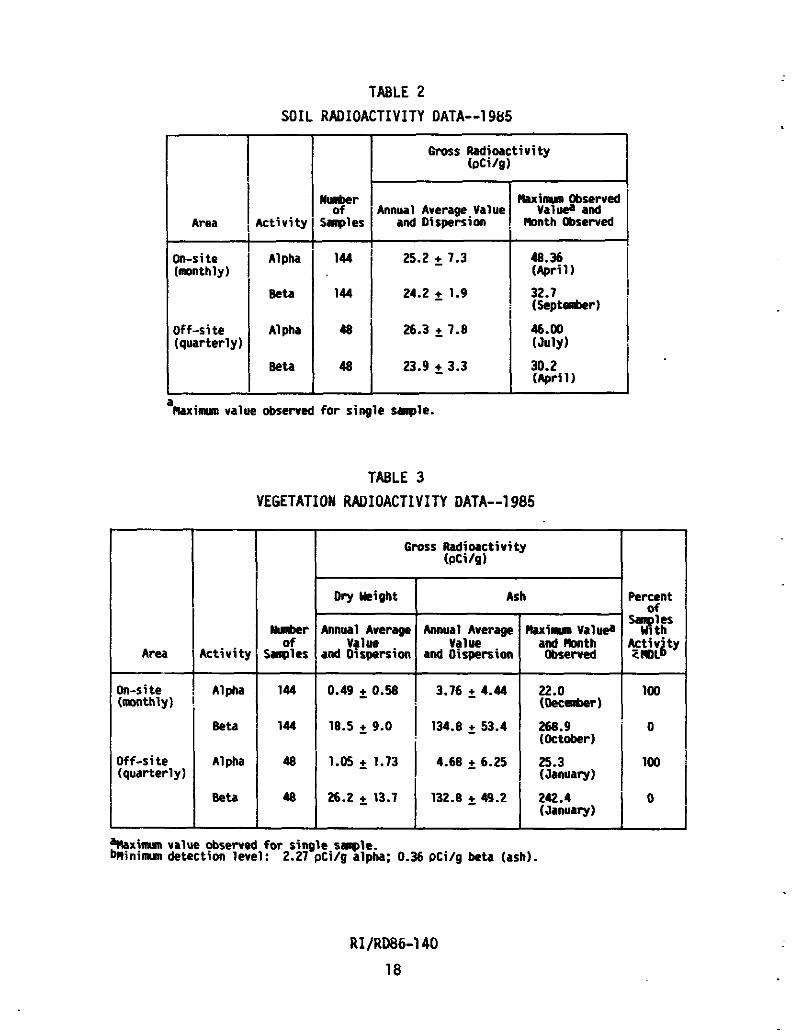
TABLE 2 SOIL RADIOACTIVITY DATA--1985
I 1 1 Area , Act iv i ty [ !
I Gross Radjoactivity (oC1/g) I
M-r I of Annual Average Value
Saples I and Dispersion
M a x i m Observed Val& and
: Month Observed I on-si t e i AIPN (monthly)
I Off-site (quarterly)
I NPN I I I
a Mximm value observed for single saple.
Area
n-si t e r n t h l y )
bf-site quarterly
TABLE 3 VEGETATION RADIOACT1 VITY DATA--1 985
I Of k t i v i t y , Sagles
A1 pha I 48 Beta 1 48
Gross Radjoactivity (PClI0)
Dry Ycight I Ash I h u r l Areracw 1 Annual Averaae I Maxi- Yalu$ I
Value Val w and M t h ud Dlspersik I and O i s p e r s i i 1 Observed I
Percent
&tivdty <IOL
100
1.05 + 1.73 I 4.68 + 6.25 I 25.3
I (January)
I
26.2 + 13.7 132.8 + 49.2 242.4 I 0 (January) 1
%xinun value observed for single saple. h i n i n u n detection level: 2.27 pCi/g alpha; 0.36 DCi/g beta (ash).

Supply water i s sampled montnly a t De Soto and a t two widely separated
SSFL s i t e locations. The average supply water rad ioac t i v i t y concentration f o r
each s i t e i s presented i n Table 4. Supply water used a t the Oe Soto s i t e i s
supplied by tne Los Angeles Department o f Water and Power. Supply water used
a t the SSFL s i t e i s ootained p a r t l y from the Ventura County Water D i s t r i c t
No. 17, wnicn also supplies nearby comnunities, and from loca l well water and
i s d is t r ibu ted on the s i t e by tne same p ip ing system previously used when a l l
f a c i l i t y supply water was obtained from on-site wells. Two on-site water wel ls
(wel ls 5 and 13) were operated during 1985 t o reduce the consumption o f the
Ventura County water. The well water proport ion i n the blend averaged about 5 3 512 f o r the year, f o r a t o t a l wel l water consumption o f about 2.8 x 10 m
7 (7.4 x 10 gal ). Pressure f o r the water system i s provided by elevated
storage tanks.
A shallow standpipe, connected t o a French dra in a t foundation level ,
placed during construction o f a modif icat ion t o a now deactivated SNAP reactor
t e s t f a c i l i t y , i s being used f o r sampling o f ground water adjacent t o the un-
derground reactor t e s t vault. Tne wel l i s per iod ica l l y sampled f o r the pur-
pose o f aetect ing any t ransfer o f ac t i va t ion product rad ioac t i v i t y from the
containment t o the s o i l bed. Radioact iv i ty i n samples taken during 1985 aver-
aged 3.7 x lo-' ~ C i / m l beta wi th no alpha a c t i v i t y detected. Gamna spectro-
metr ic analysis, w i t " a minimum detection l i m i t f o r 6 0 ~ o o f about 5 x
;Ci/ml, nas not i d e n t i f i e d any spec i f i c unnatural radionucl ides i n the water;
thus, tinis a c t i v i t y i s a t t r i bu ted t o dissolved radioelements o f natural o r i g i n
i n the s o i l bed.
A recent hydrogeologic study a t SSFL describes two ground water systems
a t the s i te : a shallow, unconfined system o f a l l u v i a l surface mantle on the
Burro F la t s area and along the major drainage channels, and a deeper ground
water system i n the f ractured Chatsworth sandstone. Alluvium along the major
surface drainage systems may store and transmit ground water t o the underlying
Cilatsworth Formation through fractures. Water 1 eve1 s i n the a1 1 uvi um respond
t o recharge resu l t ing from surface flows and may vary considerably between wet
and dry periods. The alluvium, composed o f a heterogeneous mixture o f gravel,

Area
De Soto -(monthly)
SSFL (monthly 1
TABLE 4
SUPPLY WATER RADIOACTIVITY DATA--1 985
A c t i v i t y
A1 pha
Beta
A1 pha
Beta
I Gross Radioact iv i ty (1 0-9 uCi /ml )
Number Average Value
Samples and Dispersion
Maximum valuea and Month Observed
5.73 ( November 1 4.60 (March)
8.63 (December 1 3.95 (October)
a~aximum value observed f o r s ing le sample.
sand, s i l t , and clay, has an estimated hydraulic conduct iv i ty ranging from 0.1
t o 1000 gal /day/ft2.
The Chatsworth Formation i s composed o f we1 1-consol idated, massively
bedded sandstones w i th interbedded 1 ayers o f s i l tstone and claystone. The
layer may be as t h i ck as 6,000 f t a t the SSFL s i te . The d i rec t i on o f ground
water f low i n the fonnation i s probably r a d i a l l y o f f - s i t e toward the surround-
i n g lowlands and i s probably con t ro l led by f rac tu re zones.
The hydrogeologic environment a t the SSFL s i t e i s a dynamic system.
Ground water i s recharged a t the s i te , moves through the aquifers, and dis-
charges t o the surface o r t o other aqui fers down-gradient o f the s i te. The
ground water system i s recharged by p rec ip i t a t i on and by unl ined ponds and
drainage channels. Because o f the meager r a i n f a l l i n the area and the re la-
t i v e l y 1 arge v a r i a b i l i t y i n annual prec ip i ta t ion, ground water recharge may
vary great ly from year t o year. Specif ic pathways o f possible contaminant

t r a n s p o r t a re d i f f i c u l t t o p r e d i c t on t h e oas i s o f on -s i t e w e l l data. The most l i k e l y pathways are along f r a c t u r e zones t h a t t r e n d o f f - s i t e .
As discussed e a r l i e r , sur face waters discnarged from SSFL f a c i l i t i e s and
tine sewage p l a n t o u t f a l l d r a i n southward i n t o Rocketdyne r e t e n t i o n pond R-2A.
Nnen f u l l , the pond may oe dra ined i n t o B e l l Creek, a t r i b u t a r y o f t h e Los
Angeles R ive r i n t n e San Fernando Val ley, Los Angeles County. Pursuant t o the
requirements o f i o s Angeles Regional Warer Qua1 i ty Contro l Board Reso lu t ion
60-49 o f 21 September 1966, a sampling s t a t i o n f o r eva lua t ing environmental
r a d i o a c t i v i t y i n d e l l Canyon was es tab l ished i n 1966. It i s l oca ted approxi -
mately 2.5 m i l e s downstream from t h e southern Rockwell I n t e r n a t i o n a l Corpora-
t i o n ooundary. Samples, obta ined and analyzed monthly, i nc lude stream bed
mud, vegetat ion, and water. Average r a d i o a c t i v i t y concentrat ions i n Retent ion
Pond %-LA ana B e l l Creek samples a r e presented i n Table 5.
Comparison o f t h e r a d i o a c t i v i t y concentrat ions i n water from t h e ponds
and from B e l l Creek w i t h t h a t o f t h e supply water shows no s i g n i f i c a n t d i f f e r -
ences i n e i t h e r alpha o r be ta a c t i v i t y . S i m i l a r comparisons between on -s i t e
and o f f - s i t e s o i l and vegeta t ion samples and those o f B e l l Creek show no s i g -
n i f i c a n t d i f fe rences.
The SSFL s i t e sur face water and t h e ambient a i r r a d i o a c t i v i t y concentra-
t i o n guide values se lec ted f o r each s i t e a r e t h e most r e s t r i c t i v e l i m i t s f o r
tinose rad ionuc l ides c u r r e n t l y i n use a t Rocketdyne f a c i l i t i e s and should n o t
oe taken t o i n d i c a t e t h e i d e n t i f i c a t i o n o f these rad ionuc l i des i n t h e sam-
p l es. R a d i o a c t i v i t y concent ra t ion guide values a r e those concent ra t ion 1 i m i t s
adopted oy DOE. Nuclear Regulatory Comnission (IJRC), and t h e S ta te o f C a l i -
f o r n i a as maximum permiss ib le concent ra t ions (MPCsl f o r u n r e s t r i c t e d areas.
The MPC values are dependent on t h e rad ionuc l i de and i t s benavior as a so lub le
o r an i n s o l u b l e ma te r i a l . For ccinparison w i t h r e s u l t s o f environmental and
e f f l u e n t moni tor ing, t h e s i n g l e lowest MPC value f o r t h e var ious rad ionuc l i d e s
present i s se lec ted r a t h e r than a de r i ved MPC f o r the mixture. Accordingly,
f o r SSFi s i t e sur face water, t h e guide values o f 5 x 1~~~ uCi/ml alpha ac-
t i v i ty corresponding t o 2 3 9 ~ u and 3 x lo- ' zCi/ml be ta a c t i v i t y corresponding
TABLE 5
BELL CREEK AND RETENTION POND RADIOACTIVITY DATA--1985 1 1 I ~ m s s Radioactivity concentrations
k 1 1 c n * I* I Alpha 1 12 no. 54 (pCi/g)
Annual Average value
and Dispersion
21.9 6.5
kimm Val& and Honth msewed
31.9 (January)
kll Creek v . ~ e - tat ion no. 54 (pCi/g-ash)
Bell Creek vege- tat ion no. 54 (@/e dry ueight)
Fmd w t r no. 6 ( Alpha 1 12 ( 10-9 p C i /ml )
Alpha
k t a
Beta 12
Alpha
Beta
%aximun value observed for single s bnininun detection level: Apy-ox lma~~6 . . i . 9 x 10⁻⁹ p C i h l alpha; 0.64 i 10-9 pCihl beta for wter : appmximte y 2.3 pCi/g alpha; 0.23 pCi/g f o r soi l : approximately 2.3 pCi/g alpha; 0.36 pCi/e fw v-tation ash.
12
12
2.49 2 0.75 3.79 ( D c e r k r )
SSFL pond R-2A ware no. 12 (10-6 p C i h l )
12
12
0
1.34 t 1.25
137.1 2 28.6
Alpha
Beta
0.23 +_0.20
22.4 2 6.1
2.82 (January)
178.8 (August)
12
12
100
0
0.49 (September)
32.94 (sept-r)
100
0
3.07 2 1.94
3.49 2 0.76
6.61 (Wri 1 )
5.56 (October)
H)O
0
. t o "Sr a re appropr iate. These values a r e es tab l ished i n 10 CFR 20,
C a l i f o r n i a Admin is t ra t i ve Code T i t l e 17, and DOE Order 5480.1A.
Ambient a i r sampling f o r long-1 i v e d p a r t i c u l a t e alpha and beta r a d i o a c t i -
v i t y i s performed cont inuously by automatic sequential samplers l oca ted a t the
De Soto and SSFL s i t e s . A i r i s drawn through Type A g lass f i b e r f i l t e r media,
wnicn are analyzed f o r r e t a i n e d long-1 i v e d r a d i o a c t i v i t y a f t e r a minimum 120-h
decay p e r i o d t h a t e l im ina tes n a t u r a l l y occu r r i ng short-1 i v e d p a r t i c u l a t e ra -
d i o a c t i v i t y (most raaon daugnters). Tne average concentrat ions o f ambient a i r
alpna and beta r a d i o a c t i v i t y f o r 1985 are presented f o r t h e var ious sampler
l o c a t i o n s i n Table 6.
The guide value o f 6 x uCi/ml f o r SSFL s i t e ambient a i r alpha
a c t i v i t y i s due t o work w i t h unencapsulated plutonium. The value o f 3 x 10-I
~ C i / m l f o r be ta a c t i v i t y i s due t o t h e presence o f "Sr i n f i s s i o n products
i n i r r a d i a t e d nuclear f u e l a t t h e SSFL s i t e . The guide value o f 3 x 10- l2
l jC i im l f o r De Soto ambient a i r alpha a c t i v i t y i s due t o work w i t h unencapsu-
l a t e d uranium ( i n c l u d i n g depleted uranium). The guide value o f 3 x 10- lo
pCi/ml i s f o r 6 0 ~ ~ , f o r which t h e ambient a i r beta a c t i v i t y guide i s appro-
p r i a t e s ince i t i s t h e most r e s t r i c t i v e l i m i t f o r any be ta-emi t t ing rad io -
nuc l i de i n use a t t h e De Soto s i t e . Guide value percentages are n o t presented
f o r s o i l o r vegeta t ion data s ince none have been establ ished.
Mon i to r ing o f ambient r a d i a t i o n i s performed w i t h TLDs. Each dosimeter
s e t uses two ca lc ium f l u o r i d e (CaF2:Mn) low background, bulb-type c h i p do-
simeters. The dosimeter se ts a r e p laced a t l o c a t i o n s on o r near t n e perime-
t e r s o f t h e ile Soto and SSFi s i t es . Each dosimeter, sealed i n a l i g n t - p r o o f
energy compensation sh ie ld , i s i n s t a l l e d i n a sealed p l a s t i c con ta ine r mounted
about 1 m above ground a t each loca t ion . The dosimeters a r e exchanged and
eval uated qua r te r l y . Dur ing t h e year, 18 on-si t e TLD mon i to r i ng 1 ocat ions
were used. F i v e a d d i t i o n a l dosimeter sets, p laced a t l o c a t i o n s up t o 10 m i les
from t h e s i t e s , a re s i m i l a r l y evaluated t o determine t h e l o c a l area o f f - s i t e
amoient r a d i a t i o n l e v e l , wnich averaged 11 jrem/h f o r 1985. The q u a r t e r l y and
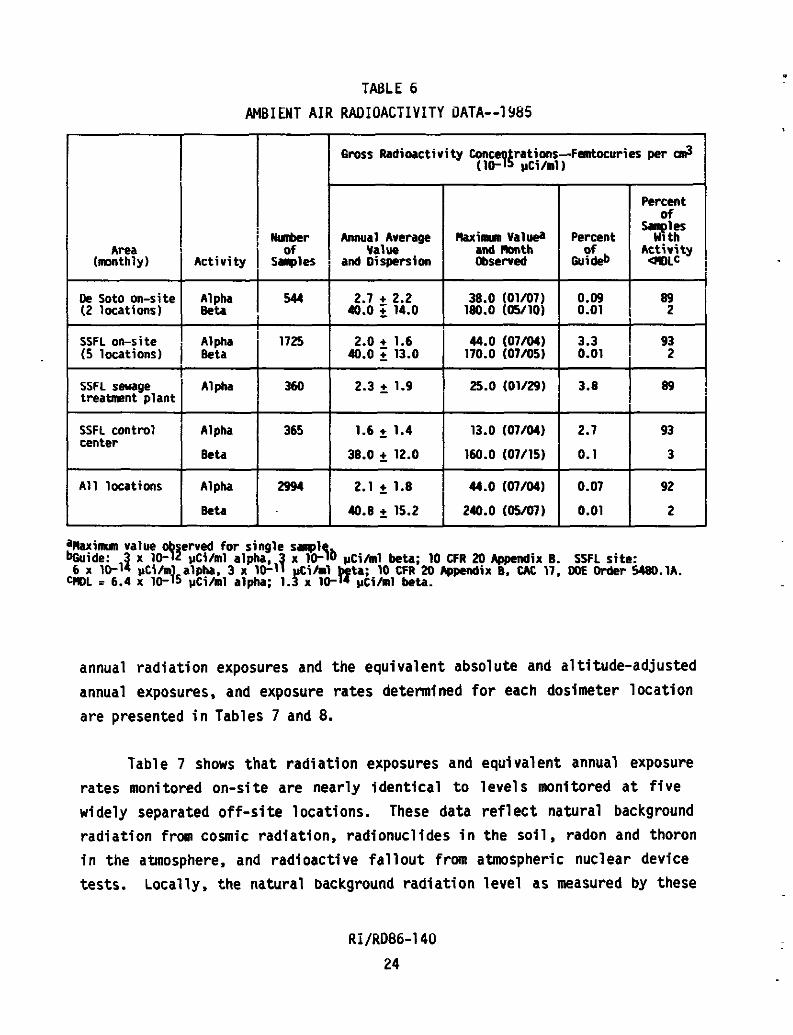
TABLE 6
AMBIENT A I R RADIOACTIVITY DATA--1985
Area (mnthly)
De Soto on-si t e (2 locations)
SSFL on-site (5 locations)
SSFL s w g e treatnrnt plant
SSFL control center
A l l locations
Act iv i ty
Alpha Beta
Alpha Beta
Alpha
Alpha
Beta
Alpha
Beta
Gross Radioactivity Conce rations-Femtocuries per cd (10-94 r C i / d )
percent of
Snples llumcr Annual Average Wimm V a l 4 Percent W l t h of Value and m t h
b% Act iv i ty
Srrples and Oispersion Observed *LC i
aRaxinun value erved for single s n p l h i d e : 3 x 1 8 j pCi/rnl alpha, 1 x 10⁻⁷) Sihl beta; 10 CFR 20 Qpmdix B. ISFL site: 6 x 10⁻¹ pCiY alpha, 3 x 10⁻¹ C i h l p . 1 0 CFR 20 Appendix B, CAC 17. CNX Order 5480.1A.
W L = 6.4 x 10- 5 pC~/ml alpha; I.! x 10- p C i h l beta.
annual rad ia t ion exposures and the equivalent absolute and al t i tude-adjusted
annual exposures, and exposure ra tes detennined f o r each dosimeter loca t ion
are presented i n Tables 7 and 8.
Tab1 e 7 shows t h a t rad ia t ion exposures and equivalent annual exposure
ra tes monitored on-si t e are nearly iden t i ca l t o l eve l s monitored a t f i v e
widely separated o f f - s i t e locations. These data r e f l e c t natural background
rad ia t ion from cosmic radiat ion, radionucl ides i n the s o i l , radon and thoron
i n the atmosphere, and radioact ive fa1 1 out f rm atmospheric nuclear device
tests. Locally, the natural background rad ia t ion leve l as measured by these
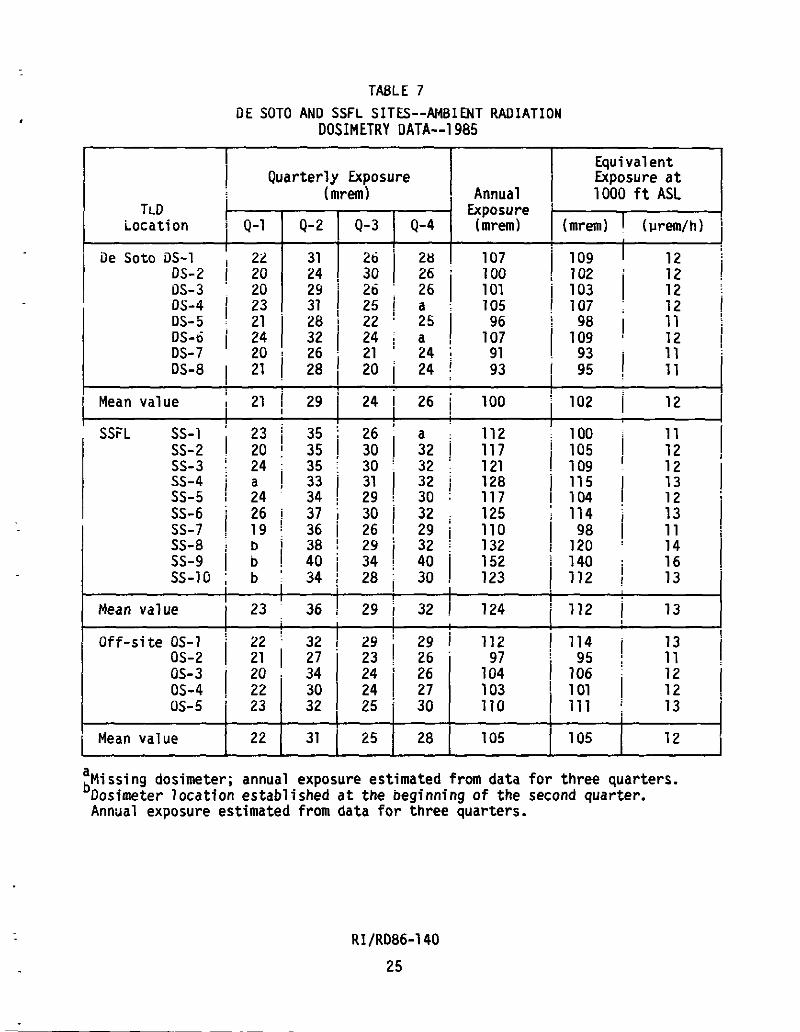
TABLE 7
OE SOT0 AN0 SSFL SITES--AMBIENT RADIATION DOSIMETRY DATA--1 985
Equivalent Exposure a t 1 000 f t ASL
Quar ter ly Exposure (mrem) Annual
Exposure ( mrem)
I Location
t-
I ile Soto DS-1 22 DS-2 i 20
/ Mean value 21 ( 29 I
I SSFL SS-1 23 i 35
I
Mean value j 23 36
05-5 j 23 i 32
I Mean value 1 2 2 1 31
a ~ i s s i n g dosimeter; annual exposure estimated from data f o r three quarters. b~os imeter locat ion established a t the beginning o f the second quarter. Annual exposure estimated from data f o r three quarters.

dosimeters i s about 100 mrem/year. The ma1 1 v a r i a b i l i t y observed i n tne data
i s a t t r i bu ted t o di f ferences i n elevat ion and geologic condit ions a t the var i -
ous dosimeter locations. The a l t i t u d e range f o r the dosimeter locat ions i s
from about 875 f t ASL (above sea leve l ) a t the De Soto s i t e t o a maximum o f about 1900 f t ASL f o r one o f the SSFL dosimeters. When normalized t o a spe-
c i f i c a l t i t u d e by adjust ing the measured value by an a l t i t u d e adjustment fac-
t o r equal t o 15 mrem/1000 f t e levat ion dif ference, derived rad ia t ion exposures
, f o r a l l locat ions are essent ia l ly iden t i ca l . The 1985 averaged exposure val-
ues adjusted t o 1000 f t ASL are 102 - + 6 mrem f o r the De Soto s i te , 112 - + 12
mrem f o r the SSFL s i te , and 105 - + 8 mrem f o r the o f f - s i t e cont ro l dosimeters.
During the 4-year per iod o f 1977 through 1980, a steady increase was
observed i n the TLD readings f o r a l l locations. Although the increases were
var iable from year t o year and between locations, averaged over 4 years, the
increases were i n the range o f 14 t o 17 mrem/year. The values f o r 1985 show a
s l i g h t increase from the previous year 's resu l t s when adjusted t o a comon
a1 ti tude.
Supplementary measurements o f ambient rad ia t ion l eve l s w i th high-pres-
sure i o n chamber (HPIC) monitors are made a t two locat ions a t the SSFL s i te .
The HPIC values f o r 1985 were equivalent t o annual exposures o f 111 mrem f o r
the Bui ld ing 207 m n i t o r and 120 mrem f o r the Bui ld ing 363 monitor. These
values are i n good agreement w i t h resu l ts f o r nearby TLD locat ions f o r the
year.
For independent monitoring o f rad ia t ion leve ls i n t h i s area, the Radio-
l o g i c Health Section o f the State o f Ca l i fo rn ia Department o f Health Services
provides packages containing l i t h i u m f l uo r i de (L iF) ch ip dosimeters f o r place-
ment w i t h the packets used f o r the bulb dosimeters. The State dosimeters are
returned t o the Radiologic Health Section i n Sacramento f o r evaluation. Data f o r tnese TLDs, placed a t e igh t Rocketdyne dosimeter locations, both on-si te
and o f f - s i t e , are presented i n Table 8 f o r 1985. Considering the t o t a l inde-
pendence o f these measurements and the use o f d i f f e r e n t t h e m 1 umi nescent mate-
r i a l s , tne agreement i s reasonably good; however, the State resu l ts are some-
wnat lower f o r each loca t ion j o i n t l y mni tored.
RI/RD86-140
26

TABLE 8
I i : ! I 1 9 DS-8 1 a i 16 20 1 1 9 1 73b j 75 I i I
I I I
Mean value , 24 16 1 19 [ 19 / ! i 1 81 i SSFL SS-3 1 27 20 1 24 22 '
I 93
! I 55-6 27 ' 24 , 21 3 0 ; 102 i 91 ' 10 I ! I I
I SS-7 I 2 1 : 2 l 1 2 4 i a 1 88b i 7 6 ; 9
D E SOT0 AND SSFL SITES--STATE OF CALIFORNIA AMBI ENT RADIATION DOSIMETRY DATA--] 985
TLD Location
a ~ i s s i n g dosimeter; annual exposure estimated from data f o r the three quarters. b~nnual ized value.
- -- -- - . -- 1 25 1 22 23 1 26 ' 96 ! Mean value i 83 . 9 1 I
off -s i te OS-1 22 I 20 21 26 89 pi 1 10
05-5 1 2 6 1 1 9 ! , 18 1 2 6 89 I 10 j
Processed wastewater and most collected surface runoff discharged from
the SSFi s i t e flows t o Rocketdyne retention pond R-2A. Yater samples from the
pond a re analyzed f o r various consti tuents, a s required by the Regional Water
Quali ty Control Board, f o r each discharge t o Bell Canyon. Such discharges are
normally done only a s a r e su l t of excessive ra infa l l runoff; however, during
1485, only four of f - s i te discharges occurred due t o a dry year. The r e su l t s
of analyses f o r each discharge f o r 1985 are presented i n Table 9.
Mean value I 24 i
Equivalent
Annual Exposure
I mrem)
Quarterly Exposure (mrem)
I 23 12
I
Q-4 I
71 1 73 ' 8 !
Q-1 1 9-2
20
DS-6 ! 24 I PO 1 87b ! 89 1 10 i
4-3
26 20 89 91 10

TABLE 9
NONRADlOACTlVL CONSTITUENTS IN WASTEWATLR DISCHARGED 10 UNRLSTRIC1F.D AREAS--1985 (Analysis Results f o r Wastewater Discharged from Pond R-2A t o
B e l l Creek on Date Indicated - Sample S ta t ion W-12)
Total d issolved so l ids (mg/l)
Chloride (mg/l)
Su l fa te (mg/l)
Suspended so l i ds (mg/l)
Set t leab le so l i ds (mg/l)
BOD5 (mg/l) O i l and grease (mg/l)
Tu rb id i t y (TU)
F luor ide (mg/l)
Boron (mg/l)
Residual ch l o r i ne (mg/l)
Fecal c o l i f o r m (MPN/100 ml)
Surfactants (MEAS)
pH
Ra in fa l l (cm)
Estimated r a i n f a l l runo f f (m3)
Releasenvolume (m3)
March 7a January 2ga
Result
480
52
124
17
<0.1
3
<5
4
0.4
0.3
<O. 04
(2
0.08
lesu l t
340
40
110
24
0.1
7
1 .6
14
0.4
0.3
<0.04
(2
0.03
8.6
-- o f
Guide
50.5
34.7
41.3 - -
30.0
-33.3 -
40.0
30.0
<4O. 0
<8.7
16.0
o f Gulde
35.8
26.7
36.7 - -
23.3,
10.7
40.0
30.0
(40.0
(8.7
6.0
March 2Ba
1.4
47,250
Result
380
40
108
20
<0.1
4
<5
11
0.5
0.2
<O. 04
<2
0.03
o f Guide
40.0
26.7
36.0 - -
13.3
(33.3 -
50.0
20.0
(40.0
<8.7
6.0
November 25"
Result
224
21
52
39.4
<0.1
4.3
2.6
51
0.1
0.2
<O .O4
<2
0.04
- of
Guide - 23.6
14.0
17.3 - -
14.3
17.3 -
10.0
20.0
<4O. 0
(8.7
26.7
a ~ a i n f a l l - r e l a t e d discharge
0003Y/slw
I V . ENVIRONMENTAL MONITORiNG PROGRAM
14 program o f s o i l and vegetation sample co l l ec t i on and analysis f o r ra-
d i o a c t i v i t y was ~ e g u n i n 1952 i n the Downey, Ca l i fo rn ia area wnere tne nuclear
research and development worK o f the predecessor company t o Rocketdyne was
i n i t i a l l y located. Environmental sampling was suDsequently extended t o the
men proposed Sodium Reactor Experiment (SRE) s i t e i n the S i m i H i l l s i n May
1954. I n addit ion, sampling was begun i n the Burro F la t s area, southwest o f
SRE, where otner nuclear i ns ta l l a t i ons were planned and are current ly i n oper-
ation. Tne Downey area survey was terminated when nuclear a c t i v i t i e s were re-
located t o Canoga Park i n 1955. The primary purpose o f the environmental mon-
i t o r i ng program i s t o adequately survey environmental r ad ioac t i v i t y t o ensure
tha t Rocketdyne nuclear operations do no t cont r ibute s i gn i f i can t l y t o environ-
mental rad ioac t i v i t y . The locat ions o f sampling s ta t ions are shown i n Fig-
ures 5 tnrougn 7 and l i s t e d i n Table 10.
0. SAMPLING AtKI SAMPLE PREPARATION
1. So i l -
Soi l i s analyzed f o r rad ioac t i v i t y t o monitor f o r any s ign i f i can t i n -
crease i n radioact ive deposi ti on by fa1 l o u t from airborne rad ioac t i v i t y . Since s o i l i s na tu ra l l y radioact ive and has been contaminated oy atmospheric
tes t ing o f nuclear weapons, a general background leve l o f r ad ioac t i v i t y exists.
The data are monitored f o r increases beyond the natural v a r i a b i l i t y o f t n i s
background. For most radionuclides, gross alpha and beta rad ioac t i v i t y meas-
urements are adequate f o r t h i s purpose. Chemical l y spec i f ic analyses are
performed f o r plutonium t o provide improved sens i t i v i t y .

T A P 0 CANYON \ \ \ \ \
SIMI VALLEY \ \
/ / SCALE
0 / 0 1 2 3 4 5 MILES
0 / 1
/
I LEGEND I
TLO 4302-1
F i g u r e 5 . Map o f Canoga Park , S imi V a l l e y , Agoura, and Calabassas Sampling S t a t i o n s
I 'AI I I I I I NIA , . , , .
I 1 l i l N l l
A !%Ill A N I I V I , , I I A I I O : ~
0 1 1 l ~ I l l W M 1 1 1 1 1
@ AMIIII N I Alll !iAM181 I 11
'1302-3
Figure 6 . Map o f De Soto S i t e and V i c i n i t y Samplinq Sta t ions

I - - - , - 1
Figure 7 . Map o f Santa Susana F i e l d ~aborator ie 's S i t e Sampling Stations

TABLE 10
SAMPLING LOCATION DESCRIPTION (Sheet 1 o f 4)
Stat ion I ioca t ion
I Frequency
Sampl i nga I Of I I
SV-1 ) SSFL Si te, Bui ld ing 143, southeast side
SV-2 I SSFL Site, Bui ld ing 143, a t perimeter drainage system , / 9 - 3 1 SS~L Si te, Bui ld ing 0b4, nortn parking l o t area
I SV-4 : SSFL Site, Bui ld ing 020, a t west fence 1
I SSFL Si te, Bui ld ing 363, east parking l o t area
SSFL S i t e In te r im Retention Pond, south side
SSFL S i t e Access Road, a t upper mobile home park entranct
SSFL Site, au i ld ing 093, a t reactor bu i ld ing driveway
SSFL Si te, between SRE Water Retention Pond and former sodium cleaning f a c i l i t y
SSFL Si te, Bui ld ing 028, upper parking l o t area
SSFL S i t e Entrance, i o o l sey Canyon
De Soto Si te, Bui ld ing 104, east side
Oe Soto Avenue and Plumner Street, southeast corner
Mason Avenue and Nordhoff Street, southeast corner
De Soto Avenue and Parthenia Street, northeast corner
Canoga Avenue and Nordhoff Street, northwest corner
Simi Valley, Alamo Avenue and Sycamore Road, southeast corner
Agoura - Kanan Road and Ventura Freeway a t Frontage Road
Calabasas - Parkway Calabasas and Ventura Freeway a t Frontage Road
SSiL Si te, Bui ld ing 686, a t o l d sodium disposal f a c i l i t y gate
Chatswortn Reservoir S i t e North Boundary a t north gate
SSFi Si te, Bui ld ing 025, a t driveway
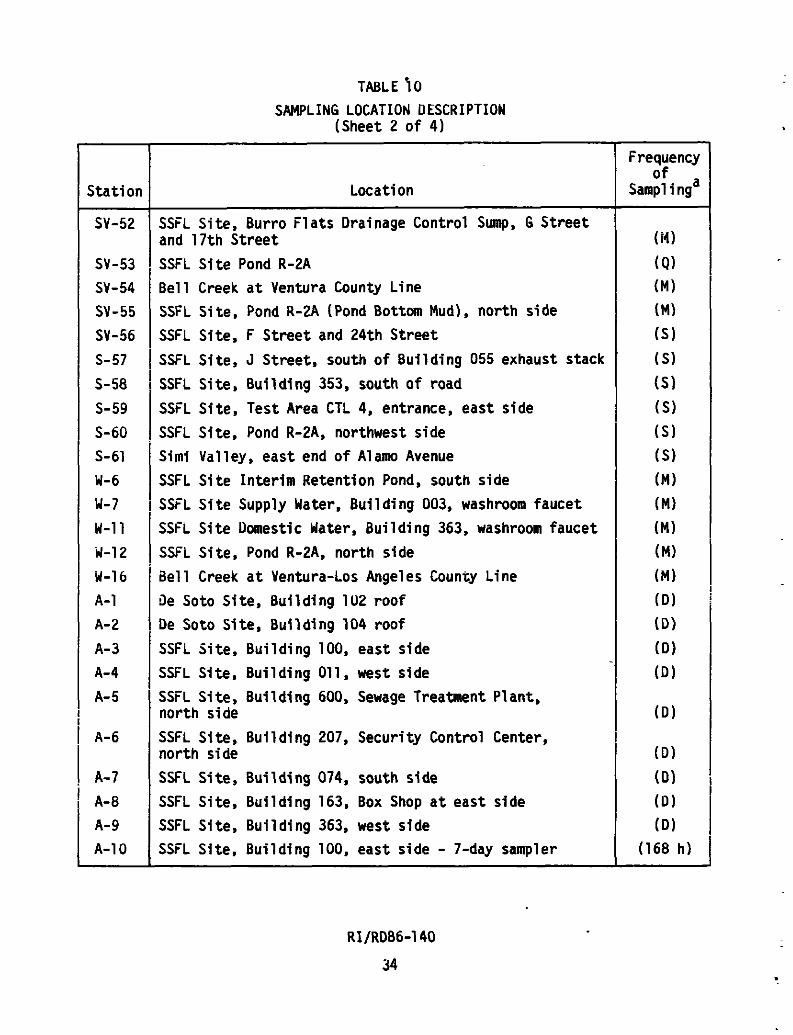
TABLE \ 0
SAMPLING LOCATION DESCRIPTION (Sheet 2 o f 4)
Stat ion
SV-52
sv-53
sv-54
sv-55
SV-56
5-57
S- 58
S-59
S-60
S-61
W-6
U-7
W-11
id-12
id-16
A-1
A-2
A-3
A-4
A- 5 I
/ A-6
I A-7 I A-8
A-9
A-1 0
Location
SSFL Site, Burro F l a t s Drainage Control Sump, G St reet and 17th St reet
SSFL S i t e Pond R-2A
Be l l Creek a t Ventura County Line
SSFL Si te, Pond R-2A (Pond Bottom Mud), nor th side
SSFL Site, F St reet and 24th Street
SSFL Site, J Street, south o f Bui ld ing 055 exhaust stack
SSFL S i t e . Bu i ld ing 353, south o f road
SSFL Site, Test Area CTL 4, entrance, east side
SSFL Site, Pond R-2A. northwest side
Sirni Valley, east end o f A lam Avenue
SSFL S i t e In te r im Retention Pond, south side
SSFL S i t e Supply Water. Bui ld ing 003, washroom faucet
SSFL S i t e Domestic Water, Bui ld ing 363, washroom faucet
SSFi Site. Pond R-2A. north side
Be l l Creek a t Ventura-Los Angeles County Line
Je Soto Site, Bui ld ing 102 roo f
De Soto Si te, Bui ld ing 104 roo f
SSFi Site. Bui ld ing 100, east side
SSFL Site. Bui ld ing 011, west side
SSFL Site, Bui ld ing 600, Sewage Treatment Plant, north side
SSFL Site, Bui 1 ding 207, Security Control Center, north side
SSFL Site, Bui ld ing 074, south side
SSFL Site. Bui ld ing 163. Box Shop a t east side
SSFL Si te. Bui ld ing 363, west side
SSFL Site. Bui ld ing 100, east side - 7-day sampler
Frequency o f
Sampl i nga

On-Site--De Soto - Pmbient Radiation Dosimeter Locations (TLD)
DS-1 De Soto Site, south o f Bui ld ing 102 I 0s-2 i De Soto Site, west bounaary ins ide water supply enclosur
(State o f Ca l i fo rn ia TLD Location rjumDer 2)
DS-3 1 De Soto Si te, Guard Post 1, Bui ld ing 102
DS-4 1 De Soto Si te, northeast corner of storage yard fence
DS-5 ! De Soto Site, nor th OOUndary a t parking l o t entry
TABLE 10
SAMPLING LOCATION DESCRIPTION (Sheet 3 o f 4)
0.5-6 i De Soto Site, east boundary, southeast corner o f fence I ' (State o f Ca l i fo rn ia TLD Location Number 1 ) i !
Stat ion
0s-7 De Soto Site, soutn boundary i n parking 1 o t telephone I I pole stay j
15-8 1 De Soto S i t e Guard Por t 4, southwest corner o f Bui ld ing 1 101 (State o f Ca l i fo rn ia TLD Location Number 7) i
I I
Location
On-Si te--SSFL (TLO)
SS-1 I SSFL Site, Bui ld ing 114 on telepnone pole
Frequency o f
Sampl i nga ,
1 SSFi Site. SRE Retention Pond on pump motor control panel
SSFL Site, E lec t r i c Substation 719 on boundary fence (State o f Ca l i fo rn ia TLD Location Number 3)
SSFL Si te, west boundary on H St reet
SSFL Site, southwest boundary a t property l i n e gate
SSFL Si te, Bui ld ing 854 (State o f Ca l i fo rn ia TLD Location Number 4)
SS-7 i SSFL Si te, Bui ld ing 363, north side on HPIC monitor I i
(State o f Ca l i fo rn ia TLD Location Number 8) !
SSFL Si te, Sodi um Disposal Faci 1 i t y north boundary
SSFL Site, Radioactive Materials Disposal Fac i l i ty, northeast boundary
SSFL Site, Bui ld ing 600, Sewage Treatment Plant

TABLE 10
SAMPLING LOCATl ON DESCRl PTION (Sheet 4 o f 4)
'code - sv s W A TLD D M V s C
-
Stat ion
off-si t i (TLO)
Descript ion
Soi l and vegetation sample s ta t ion Soi l sample s ta t ion Water sample s ta t ion A i r sampler s ta t ion T n e m l minescent dosimeter Dai ly sample Monthly sampl e Quarter1 y sample Semi annual sampl e Continuous
Location
0s-1
05-2
05-3
Frequency of
Sampl i nga
O f f - s i te, Northridge, approximately Oakdale Avenue and Lassen Street (State of Ca l i fo rn ia TLD Location Number 5)
Off-s i te. S i m i Valley, approximately Tapo Canyon and Walnut Streets
O f f - s i te, San Fernando Val 1 ey, Northridge, approximately Plumner Street and Vanalden Avenue
O S - l I Off-s i te. Simi Valley, approximately Tapo Canyon and Walnut Streets
0S-5 I O f f - s i te, Simi Val 1 ey, approximately Erringer Road and Highway 118 (State o f Ca l i fo rn ia TLD Location Number 6)
HPI-I i High-Pressure Ion Chudcrs (HPIC) M b i e n t Radiation
HPI-2
Monitor a t Bui ld ing 207. nor th side
HPIC Ambient Radiation Monitor a t Bui ld jng 363. . nor th side

Surface soi 1 types available fo r sampl?ng range from decomposed grani te t o clay and loam. Samples a r e taken from the upper 1 cm of undisturbed ground
surface fo r gross radioact ivi ty analysis and t o a depth of 5 cm f o r plutonium analysis. Tne so i l samples a r e packaged i n p las t ic containers and returned t o
the 1 aboratory fo r analysis.
Sample preparation of so i l f o r gross radioact ivi ty determination consis ts
of t ransferr ing the s o i l s t o Pyrex beakers and drying them i n a muffle furnace a t about 500•‹C f o r 8 h. After cooling, the so i l i s sieved t o obtain uniform
pa r t i c l e size. Two-gram al iquots of the sieved so i l a r e weighed in to copper planchets. The so i l i s wetted i n the planchet w i t h alcohol, evenly d i s t r i b -
uted t o ootain uniform sample tnickness, dried, and counted f o r alpha and beta radiation.
Soil plutonium analysis i s performed using a chemically spec i f ic method by a c e r t i f i e d independent t es t ing laboratory according t o the guide1 i nes
specified in the U.S. NRC Regulatory Guide 4.5 t i t l e d "Measurements of Radio-
nuclides i n the Environment--Sampli ng and Analysi s of Plutonium i n Soil . "
2. Vegetation
The analysis of vegetation, performed a s an adjunct t o the so i l analysis,
i s done t o determine the uptake of radioact ivi ty by plants. Tnese plants do
not contribute t o the human food chain, and there i s no s ign i f ican t agricul-
tu re or grazing i n the imnediate neighborhood of e i t h e r s i t e .
Vegetation samples obtained i n the f i e l d a re of the same perennial p lant
types, wnerever possible; these a r e usually sunflower o r w i l d tobacco. Vege-
t a t ion leaves a re str ipped from plants and placed i n waxed cardboard contain-
ers fo r t rans fe r t o the laboratory f o r analysis. Ordinarily, p lant root sys-
tems a re not analyzed.
Since the analysis i s done t o determine uptake only, and not f a l l o u t
deposition, vegetation i s f i r s t washed with tap water t o remove s o i l , dust ,
and otner foreign matter and tnen tnoroughly rinsed w i t h d i s t i l l e d water.

Washed vegetation i s vacuum-dried i n tared beakers a t 100•‹C f o r -24 h f o r dry
weight determination, then ashed i n a muf f le furnace a t about 500•‹C f o r 8 h,
producing a completely burned ash. One-gram a l iquo ts o f pulver ized ash from
each beaker are weighed i n t o copper planchets. The vegetation ash i s wetted
i n the planchet w i th alcohol, evenly d i s t r i bu ted t o obtain uniform sample
tnicitness, dried, and counted f o r alpha and beta radiat ion. The dry/ash
weight r a t i o i s used f o r determining the equivalent dry weight gross radio-
a c t i v i t y concentration value. The moisture content o f the vegetation i s about
80$ o f the t o t a l p l an t weight.
3. Uater - Surface and supply water samples are obtained monthly a t the De Soto and
SSFL s i t e s and from Be1 1 Creek. The water i s drawn i n t o 1 - l i t e r po l ye tb lene
bo t t l es and transferred t o the laboratory.
Five-hundred41 1 il i t e r volumes o f water are evaporated t o dryness i n
c r y s t a l l i z i n g dishes a t about 90•‹C. The residual sa l t s are redissolved i n t o
d i s t i l l e d water, t ransfer red t o planchets, d r ied under heat lamps, and counted
f o r alpha and beta radiat ion.
4. h b i e n t A i r
A i r sampling i s performed continuously a t the Oe Soto and SSFL s i t es w i th
continuous a i r samplers operating on 24-h sampling cycles. Airborne par t icu-
l a t e rad ioac t i v i t y i s co l lec ted on Type A glass f i b e r filter media, which are
automatical ly changed d a i l y a t the end o f each sampling per iod (midnight).
The samples are counted f o r alpha and beta rad ia t ion fo l lowing a minimum 120-h 3 decay period. The volume o f a typ ica l d a i l y ambient a i r sample i s about 25 m .
Figure 8 i s a graph o f the weekly averaged long- l ived alpha and beta
ambient a i r r ad ioac t i v i t y concentrations f o r the De Soto and SSFL s i t e s during
1985. The d a i l y data were mathematically smoothed i n a moving weekly average

10 1 - I I I I I ln-1 I I O C A L Anl-A nNNl ALL OCClJnnFl) O N l',lAYS INnl(;A I I:r) I IY DO1 - . . . . ../' . . . - -
Figure 8. Week1 y , Month1 y , and Annual Averaged Long-Li ved Airborne Radioactivity a t the De Soto and Santa Susana F ie ld Laboratories S i tes--1985

o f d a i l y data f o r the year. The average alpha and beta rad ioac t i v i t y concen-
t r a t i ons f o r each month are indicated by horizontal bars. The graph shows
small decreasing trends i n airborne rad ioac t i v i t y during the f i r s t and t h i r d
quarters, w i t h a small increase i n the sumner and again l a t e i n the year; how-
ever, overa l l l eve ls were general ly constant f o r the year. Several t rans ient
peak concentration 1 eve1 s were observed w i th in the general trend. This ac t i v -
i ty i s a t t r i bu ted t o na tu ra l l y occurring airborne radioact ive materi a1 s and.
t o a minor degree, t o residual aged f a l l o u t from past foreign atmospheric
tes ts o f nuclear devices. Nuclides i d e n t i f i e d i n a i r samples co l lec ted during 7 1985 include Be, and 4 0 ~ , plus several o f the na tu ra l l y occurring radio-
nuclides from the uranium and thorium series. While the data f o r airborne
alpha a c t i v i t y are nearly a l l below the minimum detect ion leve l f o r a s ingle
sample, averaging values frm 9 d a i l y a i r samples over 7 consecutive days and
over calendar months reveals the long-term behavior o f t h i s a c t i v i t y , which
f o r 1985 shows r e l a t i v e l y constant l eve l s w i th the exception o f depressed a i r -
borne alpha rad ioac t i v i t y coincident w i t h periods o f r a i n f a l l .
C. COUNTING AND CALIBRATION
Environrnental so i l , vegetation, water, and ambient a i r samples are
counted f o r alpha and beta rad ia t ion w i th a low-background gas f low propor-
t i ona l counting system. The system i s capable o f simultaneously counting both
a1 pha and beta radiat ion. The sampl e-detector conf igurat ion provides a nearly
27 geometry. The t h i n-wi ndow detector i s cont inual ly purged w i t h methane
counting gas. A preset time mode o f operation i s used f o r a l l samples. The
minimum detect ion l eve l s shown i n Table 11 are those f o r a s ing le sample de-
termined by using typ ica l values f o r counting time, system e f f i c i enc ies f o r
detect ing alpha and beta radiat ion, background count rates (approximately
0.05 cpm alpha and 1.0 c p beta), and sample size. For the table, the minimum
s t a t i s t i c a l l y s i gn i f i can t amount o f rad ioac t i v i t y , i r respect ive o f sample con-
f igurat ion, i s taken as t h a t amount equal i n count r a t e t o three times the
standard deviat ion o f the system background count rate. The minimum detection
leve l (MDL) i s t h a t value t h a t would be s t a t i s t i c a l l y expected t o be exceeded
by random va r i a t i on i n background i n only 0.135% o f the measurements.

TABLE 11
MINiMUM RADIOACTIVITY DETECTION LEVELS (MDLs)
Sample I A c t i v i t y ( Minimum Detection Level
Soi 1
Vegetatf on
Water
A i r
Counting system e f f i c ienc ies are determined rou t ine ly w i t h Ra-D+E+F (w i th
alpha absorber), 3 6 ~ 1 , 230~h, 2 3 5 ~ , and 2 3 9 ~ ~ standard sources and wi th 40i(,
i n tne form o f standard reagent-grade KC1, which i s used t o simulate s o i l and
vegetation samples, and w i th s o i l containing known amounts o f f u l l y enriched
uranium.
Se l f -a~sorp t ion standards f o r beta counting are made by d iv id ing sieved
LC1 i n t o samples t ha t increase i n mass by 200-mg increments, from 100 t o
3030 mg. Tne samples are placed i n planchets o f the type used for environ-
mental samples and are counted. The r a t i o o f sample a c t i v i t y t o the observed
net count ra te f o r each sample i s p lo t t ed as a funct ion o f sample mass and a
smooth curve i s drawn tnrough these points. Tne correct ion fac to r ( r a t i o )
corresponding t o tne mass o f environmental samples i s then obtained from the
graph. Tne product o f the correct ion fac to r and the net sample count ra te
y i e l a s the sample a c t i v i t y (dpm). Tnis method has been proven usable by
applying i t t o various-sized a1 i quots o f uniformly mixed environmental samples
and observing t n a t the resu l tant spec i f ic a c t i v i t i e s f e l l w i t h i n the expected
s t a t i s t i c a l counting error, showing the absence o f any systematic bias.
Alpha / (2.3 2 1.4) 1W6 uCi/g
Beta (2.3 - + 1.2) l o - 7 ~ C i / g
Alpha / (2.3 - + 1.3) & i / g ash
Beta i (3.6 - + 1.8) 10-7 L i / g ash
Alpna (6.4 - + 3.9) 10-9 uCi/ml
Beta 1 (6.4 - + 3.2) 10- lo uCi/ml
A1 pha ' (6.4 - + 3.8) 10-l5 uCi/ml
Beta (1.3 - + 0.6) lo-14 uCi/ml

Since the observed rad ioac t i v i t y i n environmental samples i s p r imar i l y
the r e s u l t o f natural sources and weapons tes t ing and i s a t such low concen-
t ra t ions, no i d e n t i f i c a t i o n o f const i tuent radionucl ides i s done f o r each
sample; however, co l lec ted samples are composited f o r gamna spectrometry o f
accumulated sample materials. The detect ion o f s i gn i f i can t l eve l s o f radio-
a c t i v i t y would lead t o an invest igat ion o f the radioact ive mater ia l involved,
the sources, and the possible causes.
D. NOlJRADIOACTIVE MATERIALS
The Rocketdyne D iv is ion o f Rockwell In ternat ional Corporation nas f i l e d
a Report of Waste Discharge w i t h the Ca l i fo rn ia Regional Water Qua l i t y Control
Board and has been granted a National Po l lu tan t Discharge El iminat ion System
permit to discharge wastewater, pursuant t o Section 402 o f the Federal Water
Po l l u t i on Control Act. The permit, NPDES No. CA0001309, which became effec-
t i v e 27 September 1976, was renewed w i th minor changes e f f ec t i ve 17 September
1984. This permit covers discharge o f overflow and storm runo f f from water
rec l amation re tent ion ponds i n t o Be1 1 Creek. Discharge general ly occurs only
during and i m e d i a t e l y a f t e r periods o f heavy r a i n f a l l o r during extended
periods o f rocket engine tes t i ng t h a t release large amounts o f cool ing water
t o the ponds.
Only one o f the re tent ion ponds receives i n f l u e n t from the nuclear oper-
a t i ng areas o f the SSFL s i te . It i s i d e n t i f i e d as re tent ion pond R-2A, Water
Sample Stat ion W-12 i n Table 10.
The i n f l u e n t includes sewage treatment p lan t o u t f a l l and surface runof f water. Grab-type water samples taken a t the re ten t ion pond p r i o r t o a d is -
charge are analyzed by a Ca l i fo rn ia State c e r t i f i e d analy t ica l t es t i ng labor- atory f o r nonradioactive chemical const i tu tents and f o r rad ioac t i v i t y . The
spec i f i c const i tuents analyzed for , and t h e i r respective 1 i m i ta t ions i n dis-
charged wastewater, are presented i n Appendix C. Wastewater o r ig ina t ing from
f a c i l i r i e s located throughout the SSFL s i t e i s co l lec ted a t the re ten t ion pond.

The po in t o f o r i g i n o f small amounts o f most nonradioactive const i tuents nor-
mally found i n wastewater i s d i f f i c u l t t o determine; however, i n the event o f
excessive amounts o f any o f these mater ia ls i n wastewater, the o r i g i n could be
determined from the knowledge o f f a c i l i t y operations invo lv ing t h e i r use.
Four o f f - s i t e discharges o f wastewater from pond R-2A occurred during 1985.
I n addi t ion t o the wastewater discharge l im i ta t ions , atmospheric po l lu -
r a n t d i scnarge 1 im i ta t ions were imposed by the Ventura County A i r Pol 1 u t i on
Control D i s t r i c t (APCD) Permit 0271 on two na tu ra l -gado i l - f i r ed sodium heat-
ers operated by ETEC. The l im i t a t i ons are 0.12 tons/year f o r react ive organic
compounds, 79.63 tonslyear f o r oxides o f nitrogen, 1.87 tons/year f o r part icu-
lates, 1 tons/year f o r oxide o f sul fur , and 3.2 tons/year f o r carbon diox-
ide. Based on fue l consumption records f o r t h i s f a c i l i t y during 1985, there
was essent ia l ly no discharge t o the atmosphere i n comparison w i th the d i s-
charge l i m i t s . During 1985, the APCD permit was renegotiated w i th Ventura
County resul ti ng i n the more r e s t r i c t i v e pol 1 u tant discharge 1 im i ta t ions
described above as compared t o 1984.
V. EFFLUENT MONITORING PROGRAM
E f f l u e n t s t h a t may conta in rad ioac t i ve ma te r ia l are generated a t t he
Rocketdyne D i v i s i o n f a c i l i t i e s as the r e s u l t o f operat ions performed under c o n t r a c t t o DOE, under NRC Special Nuclear Ma te r ia l s License SNM-21, and under
the S ta te o f C a l i f o r n i a Radioact ive Ma te r ia l License 001 5-70. The s p e c i f i c
f a c i l i t i e s are i d e n t i f i e d as Bu i l d ings 020, 021-022, and 055 a t t he Santa
Susana s i t e , SSFL, and B u i l d i n g 104 (prev ious ly i d e n t i f i e d as 004) a t t he
De Soto F a c i l i t y .
A. iRWTMilJT AN^ hAdDLiNG
Waste streams released t o u n r e s t r i c t e d areas are always l i m i t e d t o atmos-
pher ic emissions. NO contaminated l i q u i d s a re discharged t o u n r e s t r i c t e d areas.
The l e v e l o f r a d i o a c t i v i t y contained i n a l l atmospheric emissions i s
reduced t o the lowest value by passing the emissions through c e r t i f i e d , nigh-
e f f i c i e n c y p a r t i c u l a t e a i r (HEPA) f i l t e r s . These emissions are sampled f o r
p a r t i c u l a t e rad ioac t i ve ma te r ia l s b9 means o f cont inuously opera t ing stack
exhaust samplers a t t he p o i n t s o f release. I n addi t ion, stack moni tors i n -
s t a l l e d a t Bu i l d ings 020, 021-022, and 055 prov ide automatic alarm capab i l -
i t y i n the event o f t h e re lease o f gaseous o r p a r t i c u l a t e a c t i v i t y from Bu i ld -
i n g 020 and p a r t i c u l a t e a c t i v i t y from Bu i l d ings 021-022 and 055. The HEPA
f i l t e r s used f o r f i l t e r i n g atmospheric emissions are a t l e a s t 99.972 e f f i c i e n t
f o r p a r t i c l e s 0.3 urn i n diameter. P a r t i c l e f i l t r a t i o n e f f i c i e n c y increases
f o r p a r t i c l e s above and below t h i s s ize.
The average concent ra t ion and t o t a l r a d i o a c t i v i t y i n atmospheric emi s-
s ions t o u n r e s t r i c t e d areas are shown i n Table 12. The e f fec t iveness o f t he
a i r c lean ing systems i s ev ident from t h e f a c t t h a t i n most cases t h e atmos-
pher i c emissions a re l e s s rad ioac t i ve than i s amoient a i r . The t o t a l shows
t n a r no s i g n i f i c a n t q u a n t i t i e s o f r a d i o a c t i v i t y were re leased i n 1985.
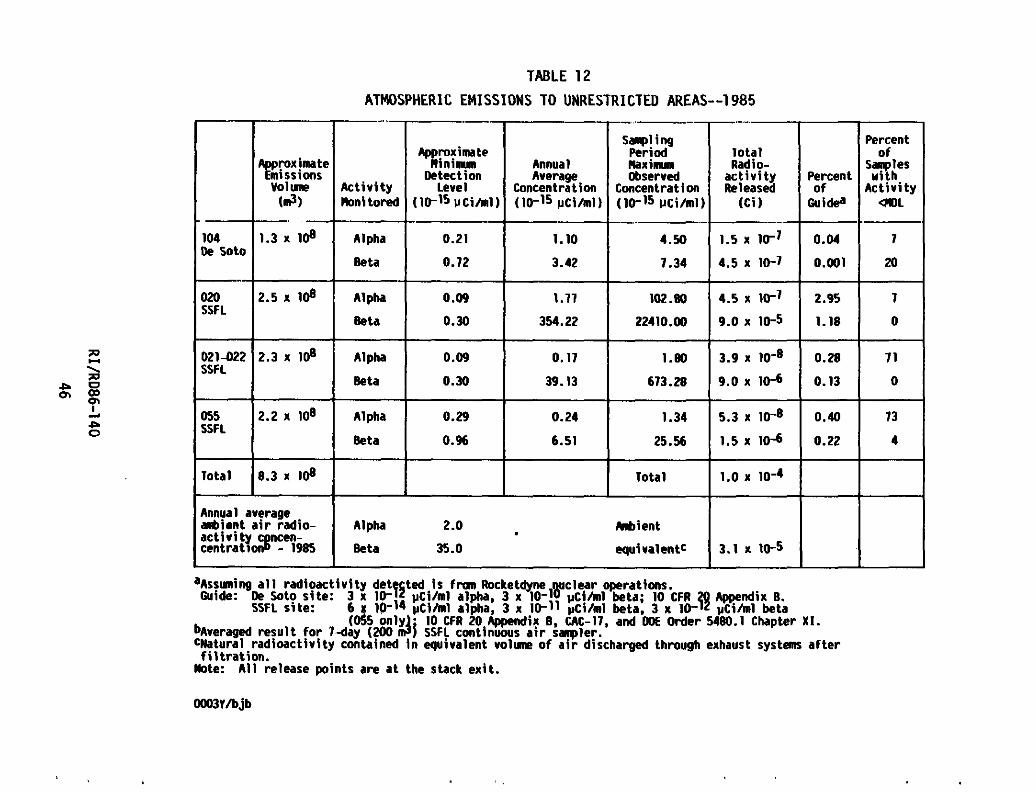
TABLE 12 ATMOSPHERIC EMISSIONS TO UNRESTRICTED AREAS--1985
0.09 SSFL
Beta 0.30
IPOnF 2.3 x 1" Alpha Beta 0.09
0.30
Beta 0.96
Annual Average
Concentration (10-15 pCi/ml)
Sap1 ing Period Mxinun Observed
Concentration (10-15 irci/ml
lot91 Radio- I
ac t i v i t y Percent Released I Of
Percent
Saples with
Actrvity
73
aAssuning a1 1 radioactivi ty det ted i s fm Rocketdyne uclear operations. tS ~ u i d e : De soto site: 3 x 10- uci lml alpha, 3 x 10-18 uCi/ml beta; 10 CFR @ W n d i x 8 SSFL srte: 6 10-14 l ~ C i l n l alpha, 3 x 10-11 p C i h l beta. 3 x 10- uCi/ml beid
( 4 5 only& I0 CFR 20 Appendix B. Uc-17, and OoE Order 5480.1 Chapter X I . b~veraged resul t fo r lday (200 SSFL continuous a i r sap ler . CNatural radioactivi ty contained i n equivalent volune of a i r discharged through exhaust system af ter f i l t r a t i on .
Note: A l l release points are a t the stack exit .
00031/bjb
Total -
8.3 x I"
Annual average anbient a i r radio- ac t iv i ty cgncen- centratlon - 1985
I Alpha 2.0 h b i e n t
Beta 35.0 equivalentc 3.1 x 10⁻⁵
rota1 1.0 x 10⁻⁴

B. FACILITY DESCRIPTIONS
1. De Soto S i t e
a. Building 104--gal i fo rn ia S ta te Licensed Activities
Operations a t Building 104 t h a t may generate radioactive e f f luen ts con-
s i s t of research s tudies i n applied physics and physical chemistry. Only atmospheric emissions a r e released from the building t o uncontroll ed areas. Major quant i t ies of radionuclides present i n encapsulated form a re l imited t o
'%o. Small amounts of i r radia ted metallurgical samples and depleted uranium are used f o r research purposes.
2. Santa Susana Field Laboratories S i t e
a. Building 020--MRC and California S ta te iicensed Act iv i t i es
Operations a t auilding 020 tha t may generate radioactive e f f luen ts con- s i s t of il6t c e l l examination and decladding of i r rad ia ted nuclear fue l s and
examination of reactor components. Only atmospneric emissions a re released from the building t o uncontrolled areas. The discharge may contain particu-
l a t e material , a s well a s radioactive gases, depending on the operations being performed and the history of tne i r rad ia ted fuel o r other material. No radio-
ac t ive 1 iquid waste i s released from the f a c i l i t y . Radioactive material
handled i n unencapsulated form i n t h i s f a c i l i t y includes the following radio-
nuclides: Th, U , P u , a s const i tuents i n the various fuel materials; and
137~s , 9 D ~ r , 8 5 ~ r , and 147Pm a s mixed f i s s ion products.
D. Buildings 021 and 022--DOE Contract Act ivi t ies
Operations a t Buildings 021 and 022 t h a t may generate radioactive e f f lu -
en t s cons i s t o f the processing, packaging, and temporary storage of 1 iquia and
dry radioactive waste material f o r disposal. Only atmospheric emissions a re
released from the bu i ld ing t o uncontrol led areas. No radioact ive 1 i q u i d waste
i s released from the f a c i l i t y . Nuclear fue l material handled i n encapsulated
o r unencapsulated form contai ns uranium and plutonium plus 13'Cs. 90~r. 85~r.
and 1 4 7 ~ m as mixed f i s s i o n products.
c. du i ld ing 055--NRC and Ca l i fo rn ia State Licensed A c t i v i t i e s
Operations a t Bui ld ing 055 t h a t may generate radioact ive e f f luen ts con-
s i s t o f decomni ssioni ng and decontamination o f the f a c i l i t y and equipment
pending release f o r unrest r ic ted use. Only atmospheric emissions are released
from the f a c i l i t y t o uncontrol led areas. No radioact ive l i q u i d waste i s
released from the f a c i l i t y .
The various fue l mater ia ls t h a t have been used a t the f a c i l i t y (depleted
and enriched uranium and plutonium) contained the fo l lowing radionucl ides: U
p lus 238~u, 239~u, 240~u, and 241Am. No i r r ad ia ted fue l mater ia ls have
been processed a t the f a c i l i t y .
C. ESTIMATION OF GENERAL POPULATION DOSE ATTRIBUTABLE TO NUCLEAR OPERATIONS--1 985
The Los Angeles basin i s a semiarid region whose cl imate i s cont ro l led
p r imar i l y by the semipermanent Pac i f i c high-pressure c e l l t h a t extends from
Hawaii t o the southern Ca l i fo rn ia coast. The seasonal changes i n the pos i t i on
o f t h i s c e l l great ly inf luence the weather condit ions i n t h i s area. During the sumer months, the high-pressure c e l l i s displaced t o the north. This
resu l ts i n mostly c lear skies w i t h l i t t l e prec ip i ta t ion. During the winter,
the c e l l moves s u f f i c i e n t l y southward t o al low s o w Pac i f i c lows w i th t h e i r
associated f ron ta l systems t o move i n t o the area. This produces l i g h t t o
moderate p rec ip i t a t i on w i th nor ther ly and northwesterly winds.
The release o f airborne mater ia l a t the De Soto s i t e f o r s m e r season
weather condit ions would general ly be under a subsidence inversion i n t o an

atmosphere t h a t i s t y p i c a l o f s l i g n t neu t ra l t o lapse cond i t ions . Nocturnal
c o o l i n g invers ions, a1 though present, a re r e l a t i v e l y s h a l l ow i n extent . Dur-
i n g t h e sumner, a subsidence i n v e r s i o n i s present almost every day. Tne base
and t o p o f t h i s i n v e r s i o n u s u a l l y l i e below t h e e l e v a t i o n o f t h e SSFL s i t e .
Thus, any atmospheric re lease f rom t h e SSFL s i t e under t h i s c o n d i t i o n would
r e s u l t i n Pasqu i l l Type D l o f t i n g d i f f u s i o n cond i t i ons above t h e i n v e r s i o n and
considerable atmospheric d ispers ion, p r i o r t o any d i f f u s i o n through t n e i n v e r -
s i o n i n t o t h e Simi o r San Fernando Valleys. I n t h e w i n t e r season, t h e P a c i f i c
nigh-pressure c e l l s n i f t s t o t h e south and t h e subsidence i n v e r s i o n i s u s u a l l y
absent. The sur face a i r f l o w i s tnen dominated by f r o n t a l a c t i v i t y moving
e a s t e r l y through t h e area, r e s u l t i n g i n high-pressure systems i n t i re g rea t
bas in region. F ron ta l passages through t h e area du r ing w i n t e r a r e genera l l y
accompanied by r a i n f a l l . D i f f u s i o n c h a r a c t e r i s t i c s a r e h i g h l y v a r i a b l e de-
pending on t h e l o c a t i o n o f t h e f r o n t . Generally, a l i g h t t o moderate south-
wester ly wind precedes these f r o n t a l passages, i n t r o d u c i n g a s t rong onshore
f l o w o f marine a i r and producing lapse r a t e s t h a t a r e s l i g h t l y unstable. Mind
speeds increase as t h e f r o n t a l systems approach, enhancing d i f f u s i o n . The
d i f f u s i o n c h a r a c t e r i s t i c s o f t h e f r o n t a l passage are 1 apse cond i t i ons w i t h
l i g h t t o moderate n o r t h e r l y winds. Loca l ly , average wind speeds f o r t h e var-
i o u s s t a b i l i t y ca tegor ies range from 0 t o about 4.4 m/s w i t h t h e g rea tes t f r e -
quency occur r ing f o r winds from t h e n o r t h t o northwest sectors. Local popula-
t i o n d i s t r i b u t i o n est imates p ro jec ted f o r 1986, based on t h e 1980 federa l cen-
sus and on d i r e c t observat ion o f nearby residences, f o r areas surrounding t h e
SSFL s i t e and o u t t o 80 itm f o r 16 sectors a r e shown i n F igures 9 through 11.
The downwind concent ra t ion o f r a d i o a c t i v e ma te r ia l emissions t o t h e
atmosphere dur ing 1985 f rom each o f t h e t h r e e major Rocketdyne nuclear f a c i l -
i ti es has been c a l c u l a t e d w i t h t h e AIRDOS-EPA computer code us ing s i te-spe-
c i f i c i n p u t data i n c l u d i n g 1 ocal area windspeed, d i r e c t i o n a l frequency, and
s t a b i l i t y p l u s f a c i l i t y - s p e c i f i c data such as stack he igh ts and exhaust a i r
v e l o c i t y .

Figure 9. Santa Susana F i e l d Laboratories S i t e Centered Demography t o 8 km Distance
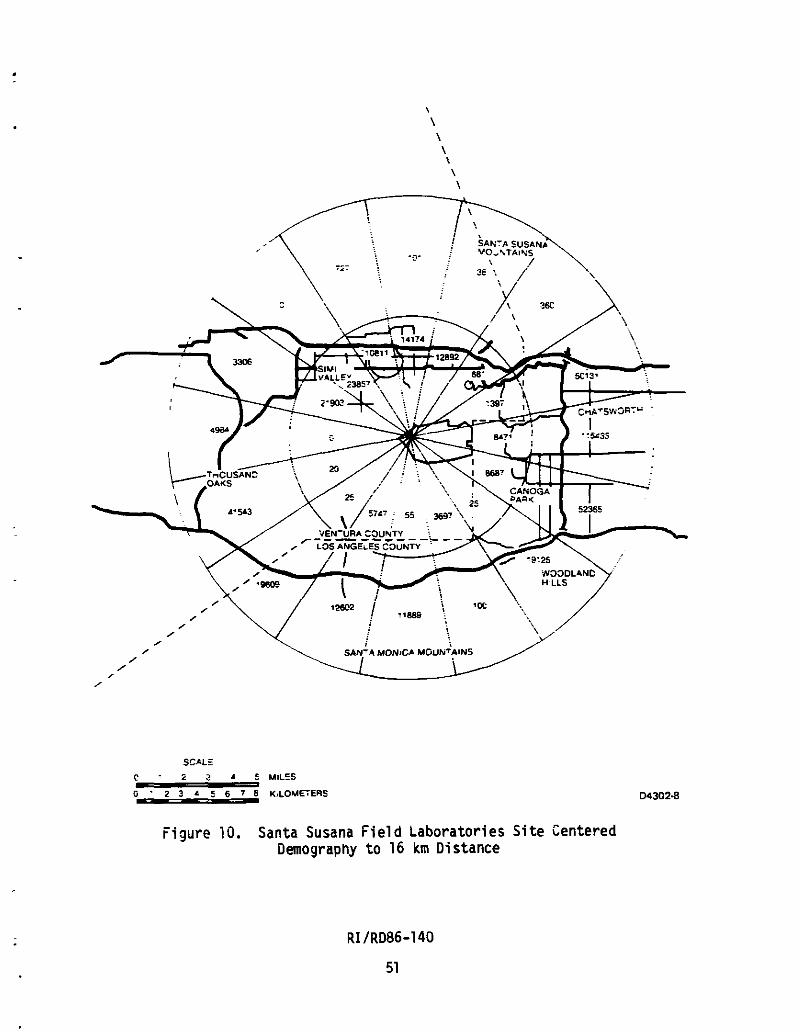
Figure 10. Santa Susana Field iaboratories S i t e Centered Demography to 16 km Distance

Figure 11. Santa Susana F ie ld Laboratories Si te Centered b g r a p h y to 80 h Distance
(heavi 1 y populated areas are shown by shad1 ng 1
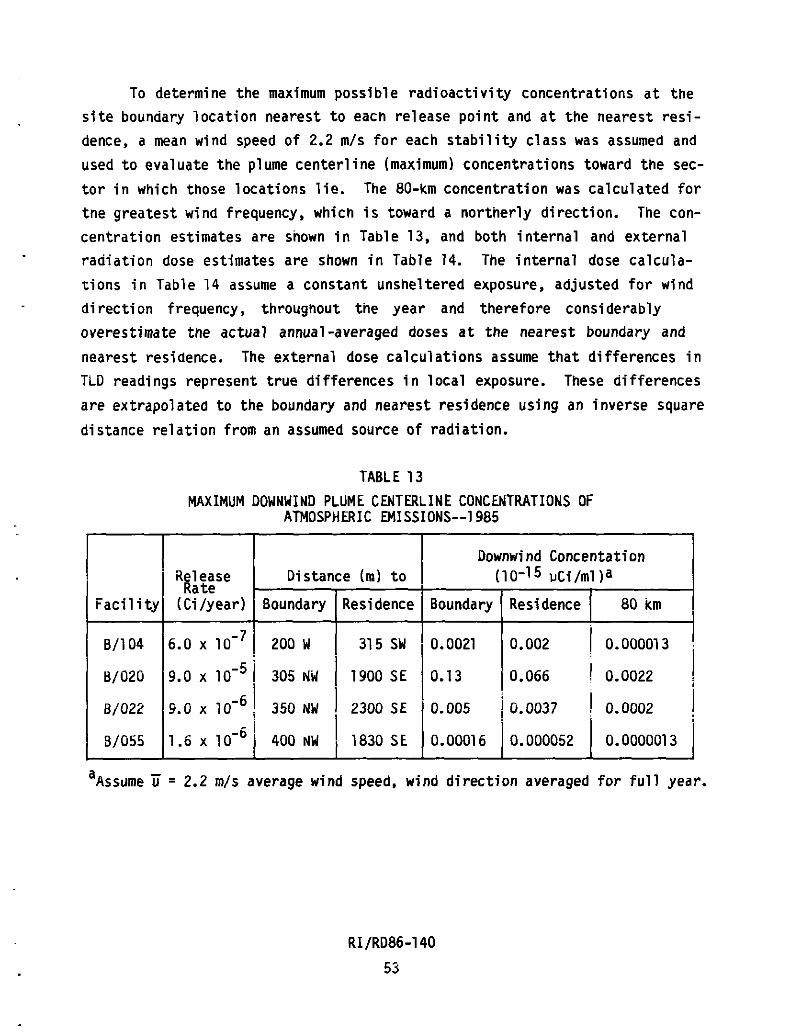
To determine the maximum possible radioactivity concentrations a t the s i t e boundary location nearest t o each release point and a t the nearest res i -
dence, a mean w i n d speed of 2.2 m/s f o r each s t a b i l i t y c l a s s was assumed and
used t o evaluate the plume center l ine (maximum) concentrations toward the sec-
t o r i n which those locations l i e . The 80-km concentration was calculated f o r
tne grea tes t wind frequency, which i s toward a nortnerly direction. The con-
centration estimates are snown i n Table 13, and both internal and external radiation dose estimates a r e shown i n Table 14. The internal dose calcula-
t ions i n Table 14 assume a constant unsheltered exposure, adjusted f o r wind
direction frequency, througnout the year and therefore considerably
overestimate the actual annual-averaged doses a t the nearest boundary and
nearest residence. The external dose calculations assume t h a t differences i n
T i D readings represent t rue differences i n local exposure. These differences
a r e extrapolated t o the boundary and nearest residence using an inverse square
distance re la t ion from an assumed source of radiation.
TABLE 13
MAXIMUM DOWNWIND PLUME CENTERLINE CONCENTRATIONS OF ATMOSPHERIC EMISSIONS--1 985
gel ease Distance ( m ) t o Rate
Downwind Concentation (10-15 uCi/ml )a
Boundary Residence 80 icm ,
a~sscrme ii = 2.2 m/s average wind speed, wind direction averaged f o r fu l l year.
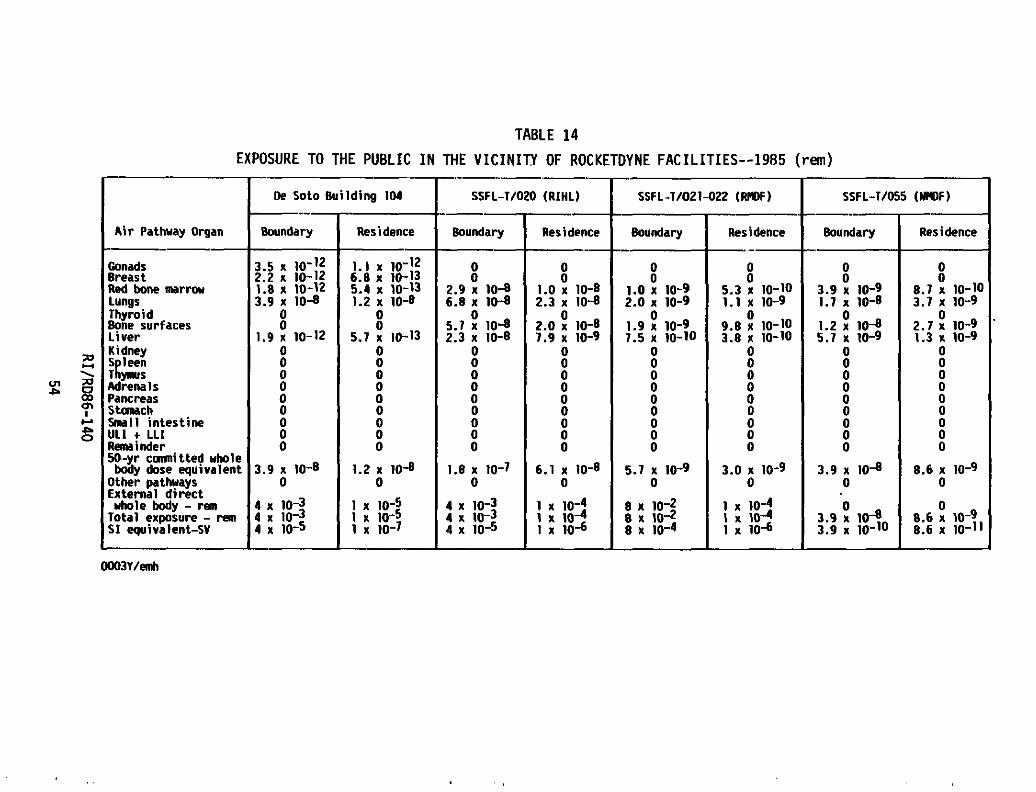
TABLE 14 EXPOSURE TO THE PUBLIC I N THE VICINITY OF ROCKETDYNE FACILITIES--1985 (rem)
I I De Soto Building 104 1 SSFL-T/020 (RIHL)
I Air Pathway Organ I---- Boundary
I Gonads I 3.5 x 10⁻¹² Breast 2.2 x 10⁻¹² Red bone mrrw 1.8 x 10⁻¹²
Mrenals
I . . . . - . - Pancreas 0 Stanach h a 1 1 intestine I : I ULI t LLI
Remainder 50-yr cornitted whole
body dose wuivalent
Residence Residence
--
SSFL -7/021-022 (RHIF)
Boundary Residence
SSFL-T/O55 (MF)
Residence
The general population person-rem dose estimates a re calculated from the demographic d i s t r ibu t ion and the sector t o t a l inhalation intake (person-pCi /
year ) generated by AIRDOS-EPA, wh ich uses release ra te , wind speed, wind d i - rection and frequency, inversion, lapse, and e f fec t ive stack height parameters a s i n p u t data. Population dose estimates centered on the SSFL s i t e a re pre-
sented i n Table 15. Inhalation i s the only s ign i f ican t exposure pathway l ike-
l y t o ex i s t , w i t h the lung the c r i t i c a l organ f o r Pu , and bone f o r Sr. The
doses reported f o r SSFL s i t e emissions a r e sumned f o r a l l release points and
nuclides.
The estimated o f f - s i t e doses a r e extremely low compared t o the maximum
permissible exposures recomnended f o r the general population i n the v ic in i ty
of D O E f a c i l i t i e s . The e f fec t ive dose equivalent fo r any member of the
puolic, f o r a l l pathways, shall not exceed 500 mrem/year f o r occasional
exposures, and 100 mrem/year fo r prolonged periods of exposure. For the a i r
patnway only, tne l imi t s a re 25 mrem/year fo r wnole body dose, and
73 mrem/year f o r any organ. The maximum estimated internal and external
exposures t o an individual f o r 1985 a t the De Soto and SSFL s i t e boundaries
and a l so a t the nearest residence a r e shown i n Table 14. Estimated internal radiation doses due t o atmospheric emission of radioactive materials from De Soto and the SSFL nuclear f a c i l i t i e s a r e several orders of magnitude below
the radiation standards and a r e f a r below doses due t o internal exposure t o
natural radioact ivi ty i n a i r .
The external exposures, above background, a re based on the grea tes t exposure adjusted t o a constant a l t i t u d e (1000 f t ASL) measured by a s ingle
dosimeter compared w i t h average adjusted of f - s i t e measurements. The mean adjusted value fo r f i v e o f f - s i t e dosimeters was 105 mrem w i t h a maximum
observea value of 114 mrem. Boundary dose estimates assume 100% occupancy,
wnereas tne actual presence of persons a t the ooundary i s r a r e o r nonexist-
ent . Review of the data indicates t h a t these derived values, except f o r the
R M X , are not s t a t i s t i c a l l y d i f f e r en t from zero, a s snown by tne uncer ta int ies
being near the reported value, but r e su l t from assumptions i n the analysis.

TABLE 15
- 22. so Sector
N
Nw
m
YIW
W
WSW
SW
S w
5
SSE
SE
ESE
E
ENE
NE
WE - Total
POPULATION DOSE ESTIMATES FOR ATMOSPHERIC EMISSIONS FROM SSFL FACILITIES--1 985
Total
5.8 x 10 -4
2.9 x 10 -4
6.0 x 10 -4
-3 1.0 x 10 .~ 4.8 x 10
-4
3.7 x 10 -4
7.2
1.3 x 10 -4
1.2 x 10 -4
1.0 x 10 -4
2.3 x 10 -3
6.3 x 10 -3
3.6
6.3 x 10 -4
1.4 x 10 -4
4.1 x 10 -4
-9 Average individual dose = 2.1 x 10 nn for the 80-101 radius area total population.

APPENDIX A
COMPARISON OF ENVIRONMENTAL RADIOACTIVITY DATA FOR 1985 NTH PREVIOUS YEARS
Tnis section compares environmental monitoring resu l ts f o r the calendar
year 1985 w i tn previous annual data.
Tne data presented i n Tables A-1 through A-5 sunmarize past annual aver-
age rad ioac t i v i t y concentrations. These data show t i e e f fects o f both the
short-1 i ved and long-1 i ved radioact ive fa1 l o u t from nuclear weapons tes ts
superimposed on the natural r ad ioac t i v i t y inherent i n the various sample types.
Over the considerable per iod o f time t h a t the environmental program has
oeen i n operation, evolut ionary changes have been made i n order t o provide
more e f f ec t i ve data. I n some cases, t h i s i s read i l y apparent i n the data.
For example, i n Table A-1, a small bu t abrupt increase i n tne alpha a c t i v i t y
reported f o r s o i l occurs i n 1971. This increase, which i s observed i n both
the on-si te and the o f f - s i t e samples, resul ted from use o f an improved count-
i n g system wi th a th inner sample configuration. The thinner sample increases
the s e n s i t i v i t y o f the detector t o alpha-emitting radionucl ides i n the sample,
thus producing a higher measured spec i f i c sample a c t i v i t y .
S imi lar ly , p r i o r t o 1971, gross a c t i v i t y i n ambient a i r was measured,
inc lud ing both alpha and beta a c t i v i t y . I n 1971, measurements were begun t h a t
allowed separate i d e n t i f i c a t i o n o f these two types o f radiat ion.
I n 1984, reca l ib ra t ion o f the alpha counting method f o r t h i ck samples
was acnieved, resu l t ing i n determination o f tne aosolute alpha a c t i v i t y i n
tnese samples ra ther than the r e l a t i v e values previously used f o r monitoring
purposes. Comparison o f the values f o r 1985 as determined by the r e l a t i v e
metnod w i t n tnose f o r p r i o r years shows no s ign i f i can t difference.

Tne amoient rad ia t ion monitoring resu l ts show a continuing long-term
va r i a t i on t h a t had been apparant i n previous years bu t i s unrelated t o opera-
ti ons on-si te. Independent measurements and i ntercmpar i sons support the values measured by the bulb-type dosimeters. With the exception o f apparent
changes resu l t ing from improvements i n analy t ica l methods and in te rp re ta t ion
o f tne data, the s o i l , vegetation, water, and a i r r ad ioac t i v i t y resu l t s are
notaoly constant over the past 20 years. I n par t icu lar , environmental radio-
a c t i v i t y data f o r the De Soto s i t e show no reduction i n the measured leve ls
below those t h a t had been observed during tne fue l fabr ica t ion operations t h a t
were d i sconti nued i n 1982 con f i mi ng t h a t those 1 eve1 s represent natural
r ad ioac t i v i t y . For a1 1 types o f samples, the data ind ica te t h a t there i s no concentrated
loca l source o f unnatural r ad ioac t i v i t y i n the e n v i r o m n t . Also, the simi-
1 a r i ty between on-si t e and o f f - s i t e resu l t s f u r t he r indicates t h a t Rocketdyne
operations cont r ibute essenti a1 l y nothing t o general envi rormental radio-
a c t i v i t y .
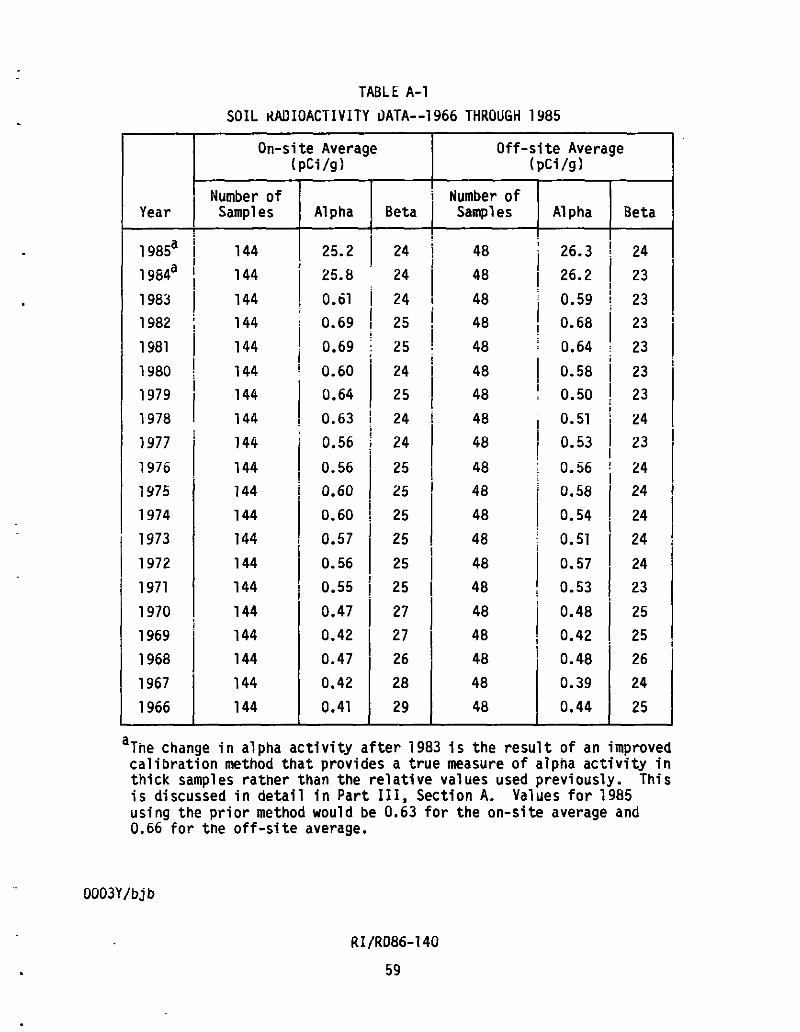
Year
1 98sa
1 9 ~ 4 ~
1963
1982
1981
1980
1979
1978
1977
1976
1975
1974
1973
1972
1971
1970
1969
1968
1967
1966
TABLE A-1
SOIL P.ADIOACTIVITY OATA--1966 THROUGH 1985
On-si t e Average ( pCi /g 1
Number o f Samples Alpha Beta
O f f - s i t e Average ( pCi /g 1
Number o f Sampl es Alpha
- Beta
a ~ " e change i n alpha a c t i v i t y a f t e r 1983 i s t h e r e s u l t o f an improved c a l i b r a t i o n method t h a t provides a t r u e measure o f alpna a c t i v i t y i n t h i c k samples r a t h e r than the r e l a t i v e values used previously. Th is i s discussed i n d e t a i l i n P a r t 111, Sect ion A. Values f o r 1985 us ing the p r i o r method would be 0.63 f o r t h e on -s i te average and 0.66 f o r t ne o f f - s i t e average.

Year
TABLE A-2
VEGETATION RADIOACTIVITY DATA--1966 THROUGH 1985
On-si te Average (pCi/g-ash)
Number o f Samples A1 pha
-
Beta
Of f -s i te Average (pCi/g-ash)
Number o f Sarnpl es Alpha
- Beta
a ~ h e change i n alpha a c t i v i t y a f t e r 1983 i s the r e s u l t o f an improved ca l i b ra t i on method t h a t provides a t r ue measure o f alpha a c t i v i t y i n t h i ck samples ra ther than the r e l a t i v e values used previously. This i s discussed i n d e t a i l i n Par t 111, Section A. Values f o r 1985 using the p r i o r method would be 0.19 f o r the on-site average and 0.23 f o r the o f f - s i t e average.

TABLE A-3
SSFL SITE SUPPiY HATER RADIOACTIVITY DATA-- 1966 THROUGH 1985
Year
a ~ h e change i n alpha a c t i v i t y a f t e r 1983 i s the r e s u l t of an improved ca l i b ra t i on method t h a t provides a t rue measure o f alpha a c t i v i t y i n t h i ck samples ra ther than the r e l a t i v e values used previously. This i s discussed i n de ta i l i n Par t 111, Section A. The value f o r 1985 using the p r i o r method would be 0.09.
Average Beta (1 0-9 uCi /ml I
Number o f Samples
I i i 1 i
Aver ge Alpha (10-3 vCi/mlI

--
Year
TABLE A 4
BELL CREEK AN0 ROCKETOYNE OlV lS lOW RETENIIOW POMI RAOIMCTIV ITY MTA-1966 THROW 1985
Bell Creek Mud Bell Creek Vegetation Be1 l Creek Udter 54 I 54 1 16
Average I lael - Alpha -
1.38 4.15 0.08 0.03
a.23 (0.22 a.23 a.24 41.24 Q.25 a.22 a.21 a.21 0.20 0.15 0. I5 0.04 0.05 0.07 0.75 -
Interim Retention Final Retention Pond b n d h t e r R-24 Udter
12
A era e 10 -4 ,,C?hl) 1
i n alpha act iv i ty af ter 1983 i s the result of m ilproved calibration method that provides a true measure of $%%vity i n thick saplef rather than the relative valuer used pnv iwsly . This i s discussed i n detai l i n Part 111. Section A. Values for 1985 using the pr ior method would be as fol lws:
Bel l credc mud: 0.55 Interim r e t e ~ t i o n pond: 0.09 Bell Creek v Bell Creek wa%:ftion
: 0.01 Final retention pond: 0. I5 0.03
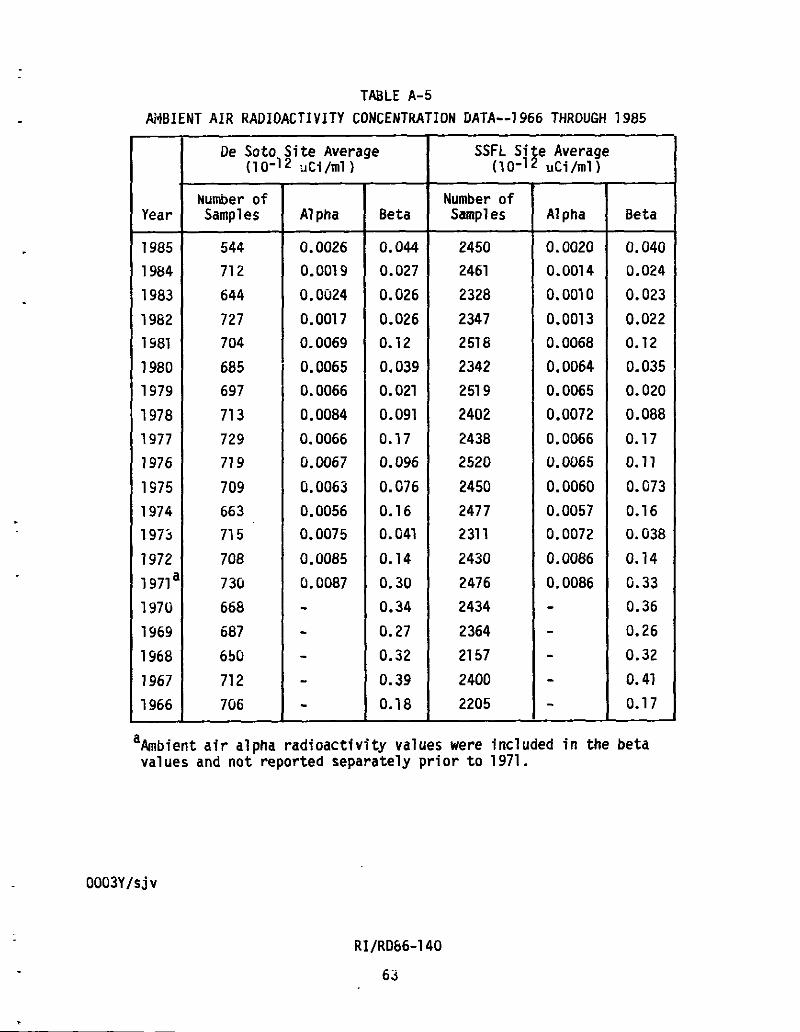
TABLE A-5 AWIENT A I R RADIOACTIVITY CONCENTRATION DATA--1966 THROUGH 1985 -
Year
Oe Soto S i t e Average I SSFL S i t e Average ( 1 0-1 2 uci /ml ) (10-12 - d i / m l )
kumber o f Samples A1 pha -l-- Number o f
Samples A1 pha Beta
'Ambient a i r alpha r a d i o a c t i v i t y values were included i n the beta values and n o t reported separately p r i o r t o 1971.

APPENDiX B
ENVIRONMEMTAL MONITORING PROGRAM QUALITY CONTROL
Th is appendix describes the q u a l i t y assurance (QA) elements t h a t are
incorporatea i n t o the Rocketdyne program t o ensure t h a t data produced a re as
meaningful as possib le.
PROCEDURES
Procedures fo l lowed inc lude sample select ion; sample c o l l e c t i o n ; packag-
ing, shipment and handl ing o f samples f o r o f f - s i t e analys is ; prepar ing and
analyz ing samples; us ing rad ioac t i ve reference standards; c a l i b r a t i o n meth-
ods and inst rument QA; and eva lua t ing and r e p o r t i n g data.
RECORDS
Records genera l ly cover the f o l l o w i n g processes: f i e 1 d sample c o l l ec -
t i o n and labora tory i d e n t i f i c a t i o n coding; sample prepara t ion method; rad io -
a c t i v i t y measurements (count ing) o f samples, inst rument backgrounds, and ana-
l y t i c a l blanks; and data reduct ion and v e r i f i c a t i o n .
Qua1 i ty c o n t r o l records f o r 1 aboratory count ing systems i ncl ude the
r e s u l t s o f measurements o f rad ioac t i ve check sources, c a l i b r a t i o n sources,
backgrounds, and ~ l a n k s , as w e l l as a complete record o f a l l maintenance and
service.
Records re1 a t i ng t o o v e r a l l 1 aboratory performance inc lude the r e s u l t s o f
ana lys is o f q u a l i t y c o n t r o l samples such as a n a l y t i c a l dupl icates, i n t e r -
1 aboratory cross-cneck samples and o ther qua1 i ty c o n t r o l analyses; use o f
standard ( rad ioac t i ve ) reference rnateri a1 s t o prepare working standards; and
c a l i o r a t i o n o f a n a l y t i c a l balances.
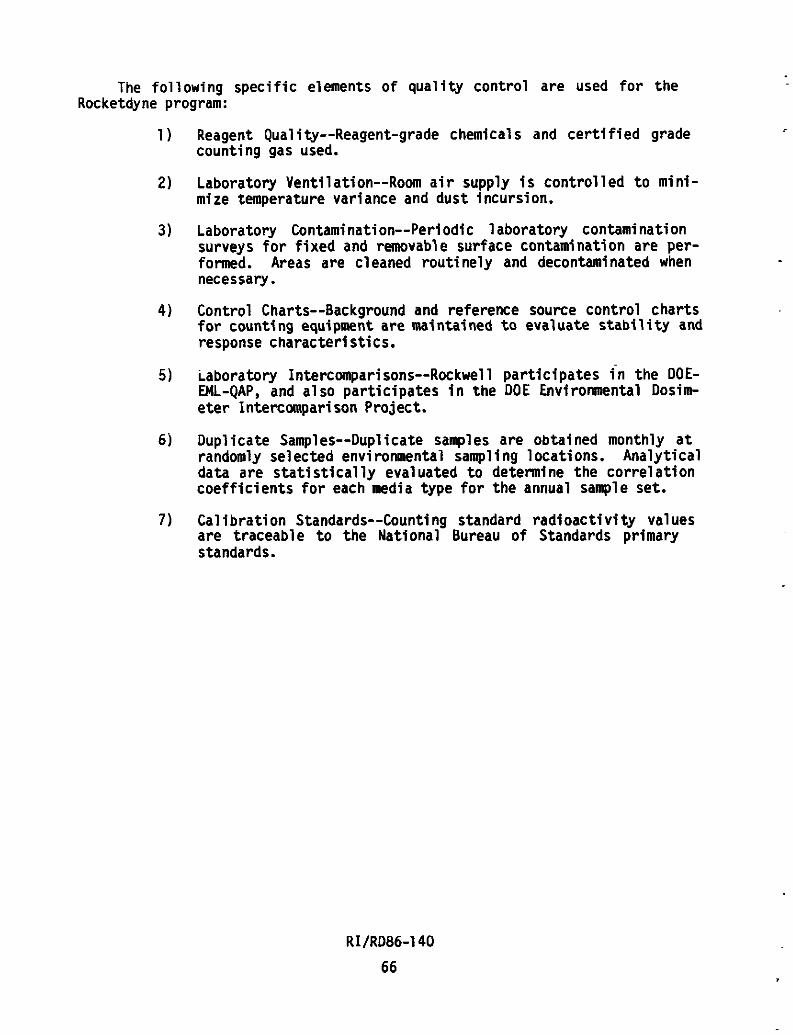
The fo l lowing spec i f ic elements o f qua l i t y cont ro l are used f o r the Rocketdyne program:
Reagent Quality--Reagent-grade chemicals and c e r t i f i e d grade counting gas used.
Laboratory Venti 1 ation--Room a i r supply i s cont ro l 1 ed t o mini- mize temperature variance and dust incursion.
Laboratory Contami nation--Peri odic 1 aboratory contamination surveys f o r f i x e d and removable surface contarni na t i on are per- formed. Areas are cleaned rou t ine ly and decontaminated when necessary.
Control Charts--Background and reference source control charts f o r counting equipment are maintained t o evaluate s t a b i l i t y and response character ist ics.
iaboratory lnterco~nparisons--Rockwell par t i c ipa tes i n the DOE- EML-QAP, and also par t ic ipates i n the DOE E n v i r o ~ l e n t . 1 Dosim- e te r Intercanparison Project.
Duplicate Samples--Dupl i ca te samples are obtained monthly a t randomly selected environmental sampling 1 ocations. Analyt ical data are s t a t i s t i c a l l y evaluated t o determine the cor re la t ion coe f f i c i en t s f o r each media type f o r the annual sample set.
Cal i bra t ion Standards-Counti ng standard rad ioac t i v i t y values are traceable t o the National Bureau o f Standards primary standards.
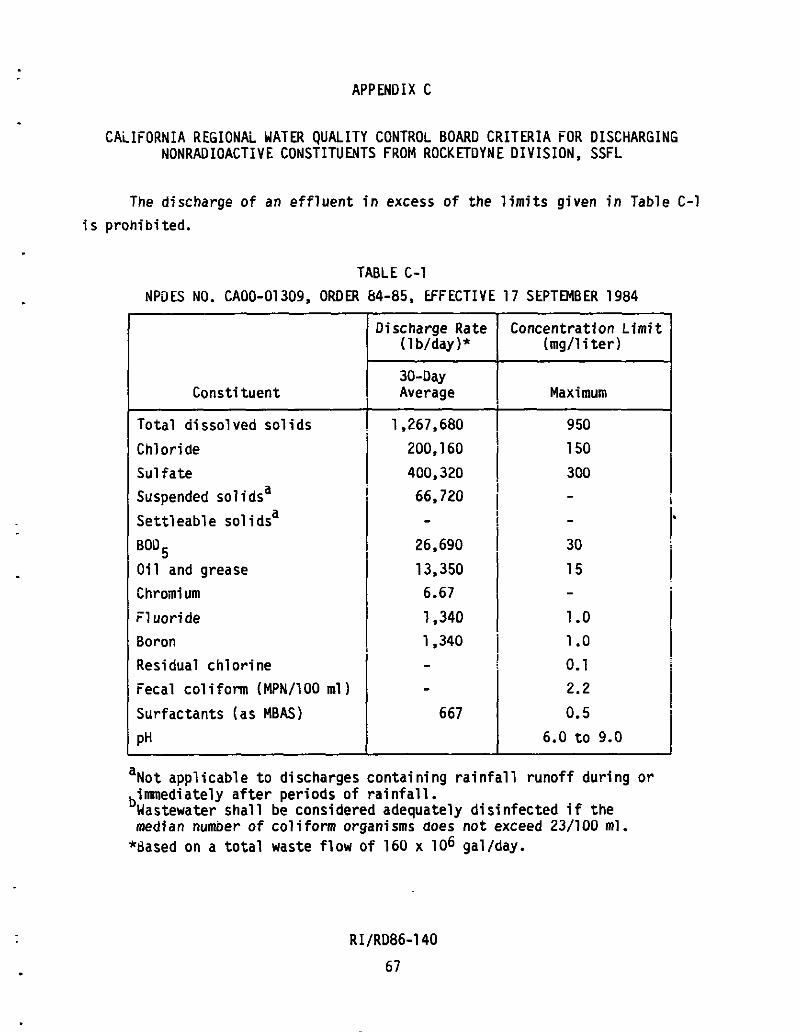
APPENDIX C
CALIFORNIA REGIONAL WATER QiUALiTY CONTROL BOARD CRITERIA FOR DISCHARGING NONRADIOACTIVE CONSTITUENTS FROM ROCKETDYNE DIVISION, SSFL
The discharge o f an e f f l uen t i n excess o f the l i m i t s given i n Table C-1
i s prohibited.
TABLE C-1
rJPDES NO. CA00-01309, ORDER 84-85. EFECTIVE 17 SEPTWBER 1984
Constituent
Total a i ssol ved sol i d s
Chloride
Sul fate
Suspended sol idsa
Sett leable sol idsa
aoD5 O i l and grease
Chromi um
il uoride
Boron
Residual ch lor ine
Fecal co l i fo rm (MPN/100 ml )
Surfactants (as MBAS)
pH
Discharge Rate (1 b/day )*
Concentration L i m i t (mg/l i t e r )
30-Day Average
1,267,680
200,160
Maximum
950
150
300 - - 30
15 - 1 .o 1 .o 0.1
2.2
0.5
a ~ o t applicable t o discharges containing r a i n f a l l runof f during o r imnediately a f t e r periods o f r a i n f a l l .
b~astewater shal l be considered adequately d is in fected i f the median numDer o f co l i fo rm organisms does not exceed 23/100 ml .
*dased on a t o t a l waste f low o f 160 x 106 gal/day.
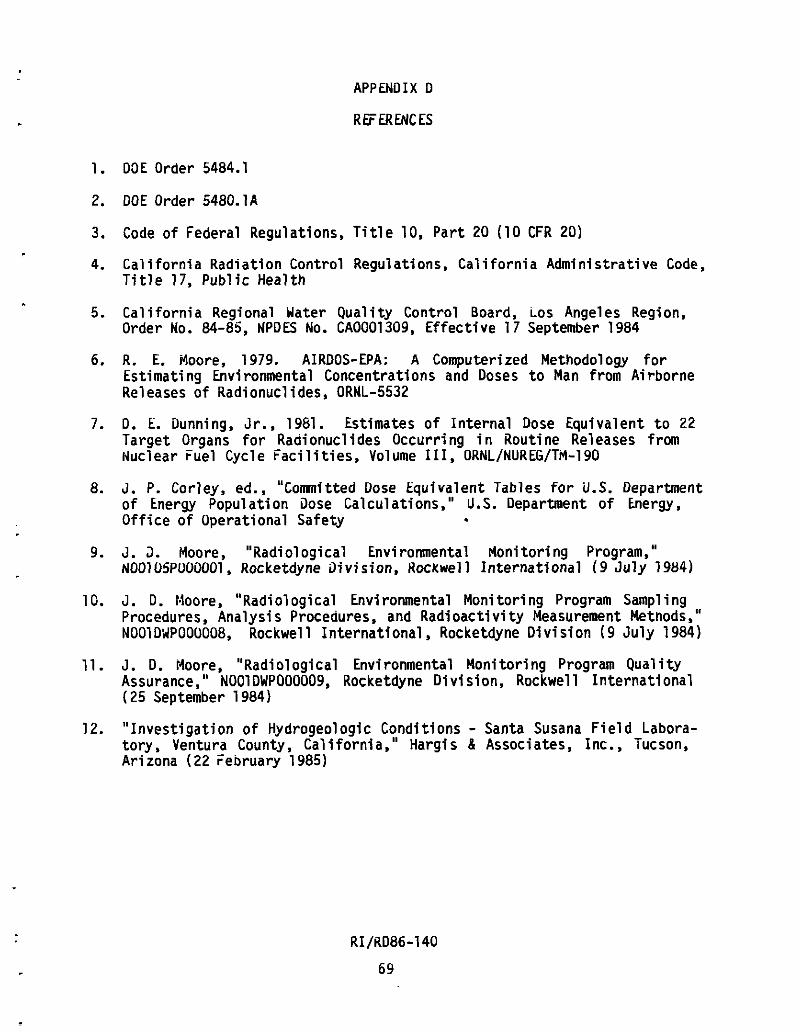
APPENDIX D
RGERWCES
1. 03E Order 5484.1
2. DOE Order 5480.1A
3. Code o f Federal Regulations, T i t l e
4. Ca l i fo rn ia Radiation Control Regula T i t l e 17, Public Health
10, Par t 20 (10 CFR 20)
~ t i o n s . Ca l i fo rn ia Administrat ive Code,
Ca l i fo rn ia Regional Water Qual i t y Control Board, i o s Angel es Region, Order No. 84-85, NPDES No. CA0001309, Ef fect ive 17 September 1984
R. E. Moore, 1979. AIRDOS-EPA: A Computerized Methodology f o r Estimating Environmental Concentrations and Doses t o Man from Airborne Re1 eases o f Radi onucl ides, ORNL-5532
0. E. Dunning, Jr., 1981. Estimates o f In terna l Dose Equivalent t o 22 Target Organs f o r Radionucl ides Occurring i n Routine Releases from Nuclear Fuel Cycle Fac i l i t i es , Volume 111, ORNL/NUREG/TM-190
J. P. Corley, ed., "Comnitted Dose Equivalent Tables f o r U.S. Department o f Energy Population Dose Calculations," U.S. Department o f Energy, Of f i ce o f Operational Safety
J. 3. Moore, "Radio1 ogical Environmental Monitoring Program," N00105P00~001, Hocketdyne a i v i sion, Hockwell Internat ional ( 9 Ju ly 1984)
J. D. :doore, "Radi 01 ogical Envi rotmental Monitoring Program Sampling Procedures, Analysis Procedures, and Radioact iv i ty Measurement Metnods," NOOlDWP000008, aockwell Internat ional , Rocketdyne Div is ion (9 July 1984)
J. D. Moore, "Radiological Environmental Monitoring Program Qual i t y Assurance," N001DWP000009, Rocketdyne Division, Rockwell Internat ional (25 September 1984)
" Invest igat ion o f Hydrogeol ogic Conditions - Santa Susana Fie1 d - Labora- tory, Ventura County, Cali fornia," Hargis A Associates, Inc., lucson, Arizona (22 February 1985)

APPENDIX E
EXTERNAL i)ISTRIBIITION
1. Hadiologic Healtn Branch. Department o f Healtn Services, Ca l i fo rn ia
2. Occupational Health and Radiation Management, Los Angeles County Health Department, Ca l i fo rn ia
3. ilesoilrces Management Agency, County o f Ventura. Ca l i fo rn ia
4. U.S. Nuclear Regulatory Comnission, Region V, dalnut Creek, Ca l i fo rn ia
5. U.S. Nuclear Regulatory Comnission, Of f i ce o f Inspection and Enforcement. Washington, D.C.
6. U.S. Department o f Energy. Environment, Safety and Qua l i t y Assurance D iv i - sion, San Francisco Operations Office, Cal i forn ia
7. U.S. Department o f Energy, Of f ice o f Operational Safety, EP-32, Technical Information Center. Washington, D.C.
8. Rocky F la t s Plant, Health, Safety, and Environment. Colorado
9. Rockwell Hdnford Operations, Safety and Qua l i t y Assurance, irlashington

APPENDIX F
ALTERNATIVE ilNiTS FOR RA9IOLOGICAL DATA
Activity concentrations ( Envi ronmental )
Airoorne par t iculates and gas Liquids (water, miln, e tc . )
Sol ids ( s o i l , sediment, vegetation, foodstuff, e tc . )
Activity concentrations ( e f f luen t )
Gas ( a i r1 Liquid
Exposure r a t e (environment)
Absorbea dose Dose equivalent 3ose equivalent r a t e (comni tment)
In Non-SI I In SI Units Units -+-
Conversion Factor From I
Non-Si t o SI Unitsa I
a ~ o convert non-SI uni ts t o SI uni ts , multiply the non-SI u n i t s by the conversion factor.
b~aopted oecause of established convention and use i n maximum permissible concentration (MPC) tabulations.