robert d. carpenter faqs on iris - · pdf filebasic reading inventory (bri) burns/roe informal...
TRANSCRIPT

FAQs on IRIs
Robert D. Carpenter
University of Michigan

Thank You!
� CIERA Researchers� Scott Paris� P. David Pearson� Alison Paris� Denise Larabell� Amy Smith� Gina Cervetti� Sharman Siebenthal� Brigette Laier
� Teachers andAdministrators in:� Ann Arbor Public
Schools� Milan Area Schools� Monroe Public Schools� Willow Run Public
Schools

General questions addressed
� Why should I use an IRI?
� Which IRI do I use?
� When should I administer an IRI?
� How do I administer an IRI?
� What can I do with the data?
� What are some limitations of using an IRI?

Why should I use an IRI?� Authentic text� Individualized assessment on:
� Oral reading accuracy/student miscues� Story recall� Comprehension
� Results informative for instructional decisions� Can be used as a diagnostic and summative
assessment tool� Blur the distinction between assessment and
instruction

Which IRI do I use?
� Analytic Reading Inventory (ARI)
� Basic Reading Inventory (BRI)� Burns/Roe Informal Reading Inventory (BRIRI)
� Developmental Reading Assessment (DRA)
� Ekwall/Shanker Reading Inventory (ESRI)
� Qualitative Reading Inventory (QRI)

When should I administer an IRI?� Before school year
� Before school day
� After school day
� Teach release time
� Instructional assistants
� During instruction

How do I administer an IRI?
� How do I select a level to administer?
� What should I score?
� When should I stop testing?
� When should I record the information?
� How should I record the information?

How do I select passage level?
� Use word lists to identify an instructionallevel
� Use previous IRI performance as anindicator
� Use other classroom information to selectan instructional level of reading

What should I score?
� Miscues
� Reading time
� Prosody
� Retelling
� Comprehension questions
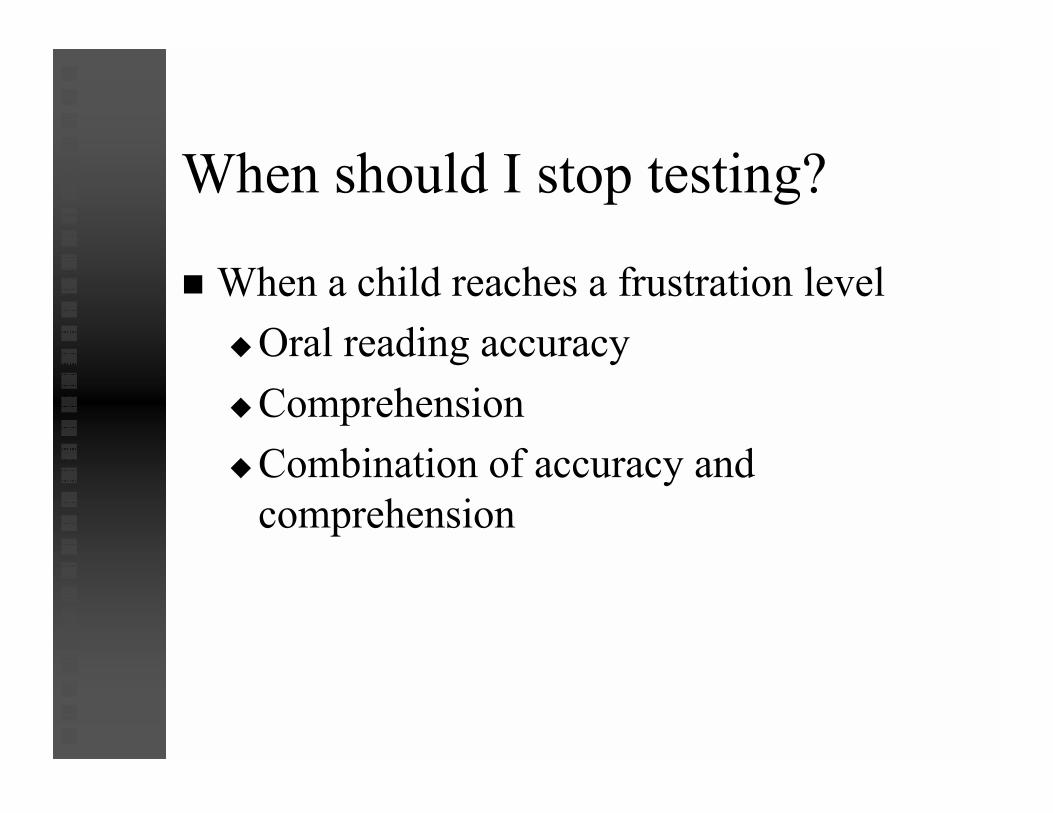
When should I stop testing?
� When a child reaches a frustration level
�Oral reading accuracy
�Comprehension
�Combination of accuracy andcomprehension

When should I record information?
�During the administration
�After the session by recording the reading

How should I record information?
�Paper
�Palm Pilot

PaperQRI Summary Sheet:
Name:__________________________________ Teacher:_______________________________ Grade:__________
Student ID Number: ________________
Fall Testing Date: _________________ Fall Data Entry Date:__________________
Word List Information Passage Information Passage Information Time Fluency Miscue Analysis Retelling Comprehension Questions Ind, Ins, Fru
Passage Level
Automatic Identified
Identified
Total Correct
Reading Time
Reading Fluency
Total Miscues
Meaning Changing
Self-Corrected
Propositions
Explicit
Implicit
Total
Proficiency Level
PP P 1 2 3 4 5 6
JH
Spring Testing Date: _________________ Spring Data Entry Date:__________________
Word List Information Passage Information Passage Information
Time Fluency Miscue Analysis Retelling Comprehension Questions Ind, Ins, Fru
Passage Level
Automatic Identified
Identified
Total Correct
Reading Time
Reading Fluency
Total Miscues
Meaning Changing
Self-Corrected
Propositions
Explicit
Implicit
Total
Proficiency Level
PP P 1 2 3 4 5 6
JH
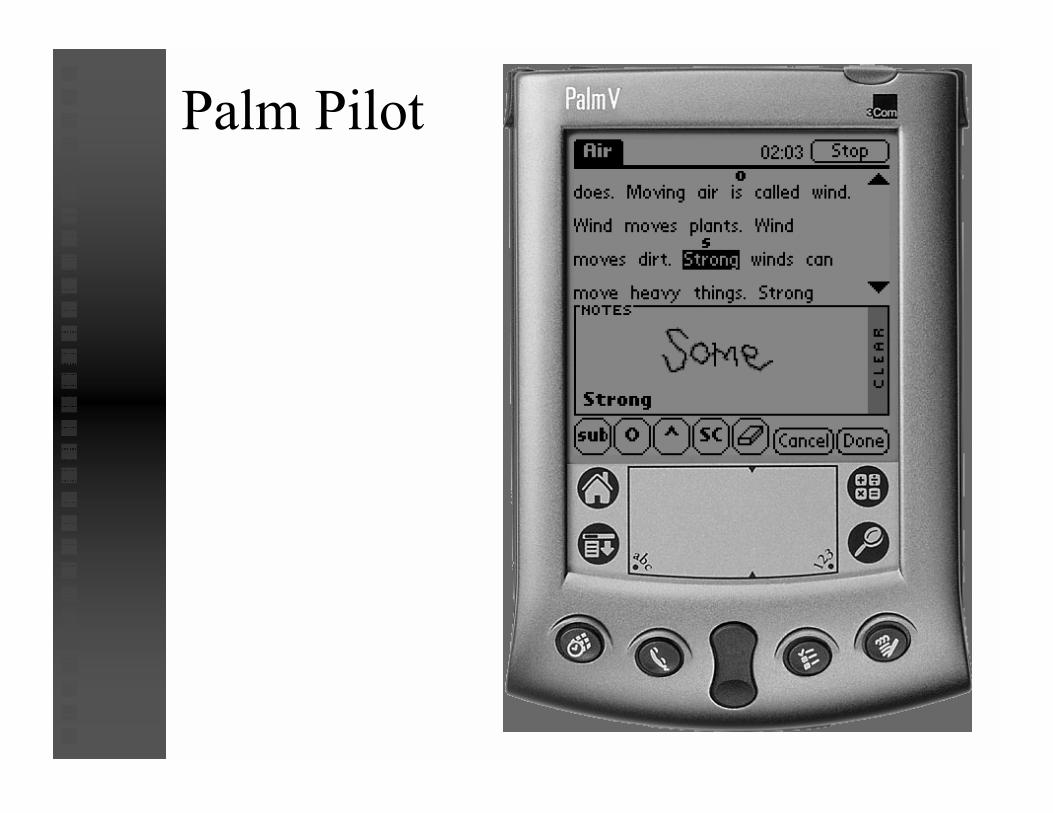
Palm Pilot

What can I do with the data?
� What data do I have?
� How do I score the data?
� How can I use the data?
� How reliable is the data?

What data do I have?
� Miscues
� Reading time
� Prosody
� Propositions
� Comprehension questions

How do I score the data?
� Miscues
�Total number of miscues
�Number of meaning changing miscues
�Percent accurate
�Words correct per minute
� Prosody
�Rubric

Scoring Data, cont.� Propositions
� Total number recalled� Percent recalled� Number of key elements recalled� Percent key elements recalled� Rubric
� Comprehension questions� Total number correct� Percent questions correct� Type of questions correct

How can I use the data?
� Make instructional decisions
� Whole group for common issues
� Mini lessons
� Individualize instruction
� Professional development
� Learning about reading development
� Creating a community of teacher-researchers
Data use, cont.
� Summative measure of student progress
�Administer same passage
�Administer different passage but samelevel
�Highest instructional level
� IRT scaling

Data use, cont.
� Administrative Reports
�Create student reports for teachers andparents

StudentReport
Fall Student Report
Name: Student 1 Grade: 2 Test: Qualitative Reading Inventory Teacher: Teacher 1 Date of Reading Assessment: Aug/Sept, 2001
Oral Reading Measures for Informational Text
First Passage Second Passage Third Passage Grade Level Passage Read
1
2
Oral Reading Comprehension
83% 38%
Com
preh
ensi
on
Oral Reading Retelling
10% 5%
Oral Reading Accuracy
97%
95%
Flu
ency
Oral Reading Rate 93 Words/Minute
88 Words/Minute
Word Recognition Score: 129 Words
Scoring Key
Oral Reading Progress Profile
Frustration Instructional Independent Below Average Average Above Average Comprehension Below 50% 50-74% 75-100% Retelling Below 10% 10-25% 25-100% Accuracy Below 90% 90-94% 95-100% Rate Below 60 WPM 60-98 WPM Above 98 WPM
Word Recognition Score
Below Average Average Above Average First Grade 0-39 40-60 Above 60 Second Grade 0-59 60-80 Above 80 Third Grade 0-79 80-100 Above 100 Fourth Grade 0-99 100-120 Above 120

Data use, cont.
� Administrative Reports
�Create student reports for teachers andparents
�Create classroom reports for teachers andprincipals

Classroom reportQRI Summary Information
Last Name
First Name
ID Number
Fall WL
Spring WL
Fall QRI
Spring QRI
Fall WPM
Spring WPM
Fall Fluent
Spring Fluent
Fall %Acc
Spring %Acc
Fall %Prop
Spring %Prop
Fall %Comp
Spring %Comp
88 105 3 3 64.71 75.29 2 2 94.64 98.47 8.51 23.40 62.50 37.50 131 147 5 5 72.23 65.13 2 4 96.06 98.43 31.48 25.93 62.50 75.00 33 PP 8.91 1 89.80 23.53 50.00 92 147 3 3 61.17 93.21 2 3 98.08 100.00 29.79 53.19 37.50 87.50 124 157 4 4 103.44 81.84 3 4 94.66 97.86 6.12 24.49 75.00 87.50 98 136 4 4 98.02 80.29 2 3 94.31 97.51 14.29 16.33 87.50 75.00 150 159 6 6 69.27 61.95 3 4 98.43 98.82 17.31 34.62 75.00 50.00 140 152 4 4 77.95 95.41 2 3 96.91 98.63 8.16 28.57 50.00 75.00 112 151 4 4 71.44 67.17 3 4 95.73 98.22 4.08 18.37 37.50 75.00 108 148 3 3 103.03 108.00 2 3 98.47 98.85 25.53 38.30 75.00 100.00 65 1 16.19 1 89.13 15.00 83.33 102 2 80.41 2 0.00 91.88 0.00 36.73 50.00 73 101 1 1 84.92 134.63 2 3 97.83 100.00 25.00 35.00 50.00 83.33 119 152 4 4 67.98 101.57 1 3 98.58 98.58 40.82 36.73 75.00 75.00 89 119 1 1 60.66 75.62 3 3 97.83 100.00 20.00 20.00 50.00 50.00 71 104 1 1 110.40 134.63 3 3 100.00 98.91 50.00 30.00 16.67 66.67 137 154 4 4 117.90 133.81 4 3 97.51 98.93 22.45 20.41 62.50 62.50 68 104 P P 43.26 93.00 2 3 91.94 100.00 44.44 44.44 50.00 100.00 110 150 2 2 87.56 125.74 3 4 96.95 97.97 38.78 46.94 25.00 75.00 155 156 3 3 105.10 118.64 3 3 98.47 98.85 17.02 25.53 62.50 75.00 86 143 2 2 60.93 91.63 2 3 99.49 99.49 28.57 38.78 50.00 62.50 93 125 2 2 67.93 71.20 2 2 97.97 99.49 30.61 16.33 87.50 75.00 108 154 2 2 83.24 111.51 2 3 98.98 97.46 22.45 26.53 37.50 62.50

Data use, cont.
� How can I use the data?
�Administrative Reports
�Create student reports for teachers andparents
�Create classroom reports for teachersand principals
�Create building reports for principals

Building Report Word List Accuracy Comprehension WPM Propositions Grade Teacher Fall Spring Fall Spring Fall Spring Fall Spring Fall Spring Second Overall Average 65.45 101.55 47.86 58.84 46.86 56.31 48.83 59.39 47.47 57.18 Teacher 1 61.35 110.60 52.78 64.10 47.99 63.12 50.75 66.09 47.17 57.66 Teacher 2 56.06 87.48 49.51 56.25 46.95 56.43 49.71 54.52 44.00 54.91 Teacher 3 55.18 85.74 47.70 55.77 47.76 53.92 49.32 57.88 51.61 59.81 Teacher 4 73.00 103.13 48.78 58.47 48.08 55.66 46.28 60.84 46.09 54.98 Teacher 5 60.12 94.48 52.52 58.62 47.29 55.72 48.63 57.52 49.98 57.31 Teacher 6 55.29 105.00 36.95 59.86 37.44 51.19 46.36 57.57 41.82 57.39 Third Overall Average 105.46 131.06 51.25 55.46 51.13 56.60 51.20 56.14 52.49 58.82 Teacher 1 96.55 119.26 55.31 58.17 49.20 55.21 51.78 59.48 54.13 52.81 Teacher 2 107.43 133.92 54.19 55.42 49.52 55.75 51.71 59.95 54.91 66.63 Teacher 3 106.04 131.63 50.70 54.57 53.18 54.31 59.08 64.10 53.70 55.92 Teacher 4 97.21 127.13 46.63 56.76 46.88 58.28 46.29 52.77 48.75 60.91 Teacher 5 109.09 126.92 52.57 53.77 52.87 58.83 47.25 52.43 54.03 59.52 Teacher 6 108.09 137.87 48.55 54.88 52.77 56.54 47.92 42.44 53.81 56.65 Fourth Overall Average 130.47 146.20 50.29 53.55 51.11 57.73 49.61 55.87 49.47 56.08 Teacher 1 135.61 145.56 50.89 53.97 55.51 61.27 47.79 56.08 54.67 62.57 Teacher 2 140.58 157.08 55.27 54.26 55.05 59.45 51.80 57.72 45.36 55.91 Teacher 3 144.58 161.27 52.94 55.38 55.40 59.66 54.76 63.88 56.87 52.80 Teacher 4 125.50 139.78 43.67 52.96 50.19 55.52 46.79 54.81 49.74 56.11 Teacher 5 115.39 135.81 53.02 51.55 48.17 61.38 44.85 49.25 43.93 57.76 Teacher 6 125.67 136.40 50.77 55.31 47.60 56.25 49.17 54.01 48.99 52.43 Teacher 7 121.13 141.46 49.88 52.53 44.75 50.88 51.90 54.42 46.58 53.56

What can I do with the data?
� How can I use the data?�Administrative Reports
�Create student reports for teachers andparents
�Create classroom reports for teachersand principals
�Create building reports for principals�Create district reports

District Report
� Insert example of district level reportsQRI District Report for Fall 2001 Date:
Fall Spring % above
Grade Level % at Grade
Level % below
Grade Level % above
Grade Level % at Grade
Level % below
Grade Level % Students Up
1 or more Passage Levels
Grade 1 2 24.7 13.5 61.9 3 27.5 35.8 36.8 4 33.8 26.2 40.1 5 31.9 19.9 48.2 Overall 29.0 22.7 48.2 Key:
1. Columns include the percentage of students whose highest instructional level passage is above, at, or below grade level on QRI testing in the fall or spring. Grade level passages were the QRI levels for all grades (e.g. QRI level 2 is considered the second grade passage) except first grade, where both the level 1 and primer passages were considered at grade level.
2. Percent of students showing improvement is the percentage of students who have demonstrated one or more passage level improvement from fall to spring, regardless of whether they are reading above, at, or below grade level.

Data use, cont.
� Communicating with parents

Teacher Responses� “I used the test result reports at my conferences and I
thought they were very helpful. I could show theparents exactly what their child needed and tell themhow we were addressing that in the classroom.Thanks for providing them.” Teacher 1
� “I just wanted to give you some feedback on the QRIsheet. I used them for all conferences, and I'm reallyglad we had them. It said it all. Parents reallyenjoyed seeing it and really liked the idea that we'ddo it again at the end and would get to see thegrowth… I definitely would like to use them againnext year.” Teacher 2

Palm Pilot www.wgen.net

How reliable is the data?Task QRI MLPP/DRA Word List
.66*** .78***
Word Scale
.94*** .98***
Accuracy .51*** .46***
Fluency .54**
Rate .78***
Comprehension .35*
Retelling .53*** .10

QRI Reading Accuracy
Researcher Administration
1101009080706050
Tea
cher
Adm
inis
trat
ion
110
100
90
80
70
60
50
Grade
Third Grade
Second Grade

QRI Reading Comprehension
Researcher Administration
1109070503010-10
Tea
cher
Adm
inis
trat
ion
110
90
70
50
30
10
-10
Grade
Third Grade
Second Grade
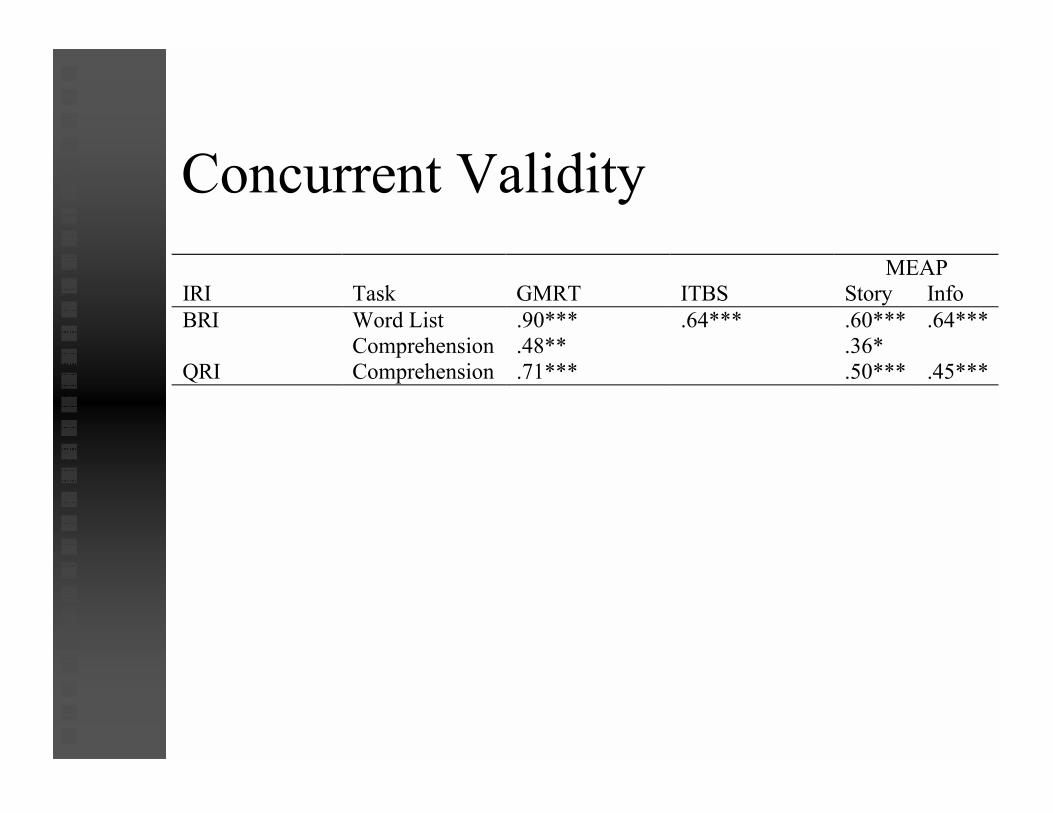
Concurrent Validity
MEAP IRI Task GMRT ITBS Story Info BRI Word List .90*** .64*** .60*** .64*** Comprehension .48** .36* QRI Comprehension .71*** .50*** .45***

Consequential Validity
� Teacher Response:� “I think probably the most positive experience
with that would be just seeing how useful it isin tailoring my instruction for certain children.I think it shows the growth that they’re makingthroughout the year and I can share that withparents, with teams of people that are workingwith these children. But most importantly, itreally does help me see what I need to work onwith individual students.”

Consequential Validity
� Principal Response:
�“For me, the best was seeing teachers soexcited about assessment results. Thathad never happened before. I mean, theywere genuinely excited. Withoutsolicitation, they would come to me andshow me the gains kids would make.”

Consequential Validity
� Central Administrator Response:
�“Well, it provides us with information,more information than we ever hadbefore on individual students and abilities,progress. It gives us information so thatwe can compare how students are doingin reading from year to year, unlike theMEAP.”

What are some limitations?
� Text Issues
�Leveling
�Topics covered
�Passage variability
� Comprehension Issues
�Recall with length variability
�Quality of questions

Limitations, cont.
� Administration
�Time
� Individual administration
� Developmental Issue
�Growing disassociation between oralreading and comprehension

QRI Accuracy and Comprehension
Figure 3. Posttest Correlations Between Oral Reading Factor and Comprehension Factor
-1
-0.5
0
0.5
1
PrePrimer
Primer Grade 1 Grade 2 Grade 3 Grade 4
Passage Level
Cor
rela
tion
Factor Correlations

BRI Accuracy and Comprehension
Figure 14. Posttest Correlations Between Oral Reading Factor and Comprehension Factor
-1
-0.5
0
0.5
1
PrePrimer
Primer Grade 1 Grade 2 Grade 3 Grade 4 Grade 5 Grade 6
Passage Level
Cor
rela
tion
FactorCorrelations

Conclusions
� Provides multiple indicators of readingproficiency
� Is both diagnostic and summative
� IRIs blur the distinction between assessmentand instruction