risk shocks, uncertainty shocks, and corporate policies
TRANSCRIPT
RiskShocks,UncertaintyShocks,andCorporatePolicies�
Doron Avramov Minwen Li Hao Wang*
ABSTRACT
We originate risk and uncertainty shock measures through textual analysis of corporate annual reports and assess their implications for corporate policies. Risk shocks are followed by long-lasting diminishing leverage, investment, employment, dividend payouts, stock repurchases, and increasing cash holdings, with small, high credit risk, and non-profitable firms displaying stronger effects. As risk diminishes, firms need not reverse cash holdings and payouts. Uncertainty shocks are followed by a short-term reduction in leverage, while other corporate policies remain unchanged. Overall, risk shocks trigger persistent policy adjustments, while managers adopt a "wait-and-see" strategy until uncertainty resolves. The evidence is robust to various considerations.
* Hebrew University of Jerusalem, Tsinghua University, and Tsinghua University, respectively. Avramov can be reached at [email protected], Li can be reached at [email protected], and Wang can be reached at [email protected]. We thank Jeawon Choi, Ran Duchin, Campbell Harvey, Gerald Hoberg, Si Li, Nagpurnanand Prabhala, Gordon Phillips, Yongxiang Wang, Xuan Tian, Jianfeng Yu, Lihong Zhang, Hao Zhou, and seminar participants at Tsinghua Finance Group Workshop 2013, PBC School of Finance at Tsinghua University, Xiamen University, and Peking University for their comments. Hao Wang acknowledges financial support from the National Science Foundation of China (Grant No. 71272023). Minwen Li acknowledges financial support from the National Science Foundation of China (Grant No. 71402078).
1
1. Introduction
Corporate environment dynamically, and often unexpectedly, evolves with business conditions.
In response, financial economists have studied the impact of changing risk on corporate policy
using return volatility, earnings volatility, or cash flow volatility as the ultimate measure of risk.
The empirical evidence is often mixed possibly due to different risk measures employed and
empirical formulations applied. See, for example, the review of Harris and Raviv (1991) on
capital structure.1 This paper originates a new risk measure based on managerial perception of
risk as reflected through corporate 10-K reports. The proposed measure is forward-looking and
less prone to data mining, investors' biases, and estimation errors. Using that measure, we are
able to study, in a unified framework, the adjustment of multiple corporate decisions, including
capital structure, investment, employment, cash holdings, dividend payouts, and stock
repurchases, to changing risk.
We also develop a new uncertainty measure from 10-K reports and study its implications for
corporate policies. While risk is associated with undesirable outcomes with convincing
probability assignment, uncertainty pertains to corporate or macro events whose likelihood of
occurrence and ultimate implications are unknown or unpredictable. Implications of uncertainty
for asset prices and optimal portfolio policy have been studied in past work.2 However,
uncertainty has been an overlooked territory in studies of corporate decisions.
Risk and uncertainty measures are based on keywords characterizing managerial perception
as reflected in 10-K reports. We define risk level as the ratio of risk-relevant keywords to total
meaningful words in those reports. Risk shock is the annual change in the risk level. Uncertainty
and uncertainty shock are defined similarly. Risk and uncertainty shocks are employed to predict
1 Past work typically focuses on each type of corporate policy in isolation. See, for example, firm leverage (Harris and Raviv (1991); Frank and Goyal (2009)), investment (Panousi and Papanikolaou (2012)), dividend payouts and corporate cash holdings (Hoberg and Prabhala (2009); Hoberg, Phillips, and Prabhala (2014); Gao, Hartford, and Li (2014)). 2 Uncertainty here refers to the concept of ambiguity in Knight (1921). Uncertainty and asset prices have been studied by Anderson et al. (2009), Epstein and Wang (1994), Epstein and Schneider (2008), and Ju and Miao (2012), among others.
2
adjustments in corporate decisions. The use of changes rather than levels helps control for
unobservable factors and potential endogeneity.
We state three testable hypotheses. First, firms comprehensively adjust their policies in
response to risk shocks, but adopt the "wait-and-see" strategy following uncertainty shocks. Risk
shocks typically convey convincing information on fundamental conditions and the economic
environment. Hence, managers persistently respond with broad-scale policy adjustments. In
contrast, uncertainty shocks reveal ambiguous information that creates a blur and incomplete
outlook. Managers are thus inclined to wait for the resolution of uncertainty or, at most,
temporarily adjust their policy.
Second, we hypothesize that small, non-profitable, and high credit risk firms display higher
sensitivity to risk and uncertainty shocks. For one, it is relatively easier for large and low credit
risk firms to raise external capital even when their risk or uncertainty level rises. Moreover,
profitable firms can generate capital internally, making them more capable of weathering
through shocks.
Our third hypothesis is that positive (rising) risk and uncertainty shocks could exert stronger
effects on corporate policies than negative (resolving) shocks. Positive shock emerges when a
firm experiences increasing risk or uncertainty in a magnitude larger than the sample median.
Indeed, rising shocks reveal the down side possibilities of deteriorating rating quality, migration
of customers and vendors, and even bankruptcy costs. Thus, firms would actively respond to
rising shocks to mitigate upcoming financial losses and operating costs. As risk diminishes,
cautious managers would consider the possibility of reappearing shocks. Thus, adjustment costs
could exceed the expected value of benefits from broad-scale policy changes.
The empirical evidence is largely supportive of the above stated hypotheses. For one, risk
shocks are indeed followed by persistent diminishing leverage, investment, employment, and
dividend payouts and stocks repurchases, along with increasing cash holdings. The economic
significance is striking. Controlling for previously identified determinants, we show that about
26.69%, 43.71%, 41.02%, and 7.25% of the annual median changes in the book leverage ratio,
capital expenditure, cash holdings, and employment, respectively, emerge following a median
3
risk shock. In comparison, only 1.29%, 8.67%, and 21.6% of the annual median changes in book
leverage ratio, capital expenditure, and cash holdings are explained by a median change in the
return volatility measure, while the relation between the change in volatility and employment is
insignificant. Further, as the risk shock exceeds the sample median by one standard deviation,
the likelihood of dividend omission advances by 50%, and the likelihood of large stock
repurchases (over 1% of total assets) diminishes by 8.94%. The overall implications of risk
shocks for corporate policy are persistent. Policy adjustments could last over three years
following the shocks, complementing the findings in Bloom (2009) that risk shocks have
long-lasting impact on economy-wide investment and employment.
In contrast, uncertainty shocks are not associated with significant policy changes. There is a
single exception - capital structure. The effect of uncertainty shocks on capital structure is
significant but short lasting, and is largely attributable to debt reduction by non-investment grade
firms. Indeed, capital structure is subject to supply side influence (Faulkender and Peterson
(2006)). Therefore, credit supply might be tightened up as uncertainty arises, leading to leverage
reduction. The overall evidence here, again, complements Bloom (2009), who shows that
uncertainty shocks do not affect aggregate investment and hiring decisions beyond a
several-month horizon.
Next, firms often respond asymmetrically to positive versus negative shocks. For example,
firms substantially increase cash holdings and diminish dividend payouts and stock repurchases
following positive risk shocks, but keep such policies virtually unchanged as risk shocks resolve.
That asymmetric effect is consistent with the notion that cash holdings are mainly for
precautionary purpose (Hoberg, Phillips, and Prabhala, 2014). Leverage and investment
decisions, on the other hand, are largely symmetric.
As hypothesized, firm characteristics play a remarkable role in shaping the relationships
between risk shocks, uncertainty shocks, and corporate policies. Essentially, small,
non-profitable, and low credit rating firms are more responsive to risk and uncertainty shocks.
Small firms respond to risk shocks with higher reduction of leverage and employment than large
firms. The presence of a median risk shock explains 55.61% (11.76%) of the median change in
4
leverage (employment) for small firms, but only 6.42% (5.56%) for large firms. High credit risk
firms adjust leverage and payouts more prominently than low credit risk firms, and negative
earnings firms adjust employment and payouts to a larger extent than positive earnings firms.
Our evidence is robust to a comprehensive battery of robustness checks. First, following
Campbell et al. (2014) and Hoberg, Prabhala, and Phillips (2014), we consider alternative risk
and uncertainty measures based on different sections of 10-K texts, and based on different
definitions of risk and uncertainty-related keywords. Second, we account for potential effects of
CEO traits on their risk and uncertainty perceptions, as Graham, Harvey, and Puri (2013) show
that such traits affect corporate decisions. Third, we account for potential implications of
hedging activities for the relation between risk shocks and corporate decisions. We show that
while hedging activities affect a wide range of decisions, such as leverage, investment, and
payouts, both hedging and non-hedging firms significantly respond to risk shocks. Fourth, we
make sure that our risk measure does not merely capture the negative sentiment characterizing
firms which undergo deteriorating profitability.
To our knowledge, our paper is the first to examine the dynamic relation between
uncertainty and corporate decisions. Bloom (2009) illustrates theoretically how uncertainty
shocks affect aggregate investment, employment, and productivity. Our paper provides
comprehensive micro-level evidence on the implications of uncertainty shocks from firms’
operational perspectives. We also propose a new approach to quantify firm-level risk. Our
measure yields strikingly consistent, robust, and long lasting implications for all corporate
policies examined than existing risk measures.
Several papers using text analysis are closely related to ours. Hoberg, Phillips, and Prabhala
(2014) develop a textual measure of product market fluidity as a proxy for product market risk,
and relate it to dividend payouts, share repurchases, and cash holdings. Li (2006) and Kravet and
Muslu (2013) develop textual measures of corporate risk, respectively, and show that change in
risk exposure predicts future stock return, volatility, and trading volume. Tetlock (2007) and
Tetlock, Saar-Tsechansky, and Macskassy (2008) employ Harvard psychosocial dictionary to
characterize the tone of Wall Street Journal articles and corporate 10-K filings, and find that the
5
tones of these texts predict future stock returns and earnings. Loughran and McDonald (2011)
construct their own dictionary of negative tone words, and relate them to stock returns, trading
volume, and unexpected earnings. Relative to past work, our study focuses on the analysis of
distinct implications of risk and uncertainty for an ecosystem of corporate policies. Examining
simultaneously various polices helps one identify the intra-dependence and priority order of
corporate decision-making in response to changing business conditions.
The paper proceeds as follows. Section 2 introduces our text-based risk and uncertainty
measures. Section 3 describes the data and variable construction. Section 4 presents empirical
results on the relations between risk and uncertainty shocks and subsequent adjustments in
corporate policies. Section 5 runs a battery of robustness checks. Section 6 concludes.
2.MeasuringRiskandUncertainty
2.1.TextualAnalysis
We develop a web crawling program to collect 10-K corporate filings from the Security and
Exchange Commission’s EDGAR website. Our sample spans the January 2001 through
December 2010 period. Merging the corporate filings with CRSP and COMPUSTAT databases
leaves us with 35,596 filings corresponding to 7,371 distinct firms. The percentage of filings in
any year in the sample to total filings ranges between 9.17% and 11.26%. To analyze the textual
content of the filings, we delete numbers, tables, graphs, propositions, articles, and pronouns. We
further decompose the texts into word stems, hence, our analysis is based on the underlying
meaning of words regardless of their different tenses or formats.
We employ the text analysis methodology to create dictionaries of keywords characterizing
managerial perception of risk and uncertainty. Dictionaries are composed of 29 risk-related and
eight uncertainty-related keywords (see Appendix 1). The risk based dictionary includes various
formats of the word "risk" (e.g., risky, risks) as well as other words characterizing downside
possibilities (e.g., loss, adverse, and pressure) and specific types of firm’s risk (e.g., competition).
We consider those other words since the word "risk" itself is subject to the criticism of being
6
boilerplate (Kravet and Muslu (2013)). Our risk-related keywords are consistent with the
Merriam-Webster dictionary’s definition of risk: "Risk is the possibility that something bad or
unpleasant (such as an injury or a loss) will happen". The uncertainty dictionary consists of
different formats of “uncertainty” (e.g., uncertain, uncertainty) and keywords that convey the
meaning of "unknown" or "uncertain" (e.g., unclear, unpredictable). Such keywords are
consistent with the Merriam-Webster dictionary’s definition of uncertainty: “Something that is
doubtful or unknown, something that is uncertain.”
We define risk level as the ratio of risk-relevant keywords to total meaningful words in those
reports. Risk shock is the annual change in the risk level. Uncertainty and uncertainty shock are
defined similarly. Studying the relation between changes, rather than levels, in risk and
uncertainty and subsequent changes in corporate policy alleviates concerns about latent factors
and reverse causality (see, e.g., Li (2010))since it controls for time-invariant observable firm
characteristics, such as industry classification, and unobservable firm characteristics, such as
corporate culture and business strategy. It also helps mitigate the effects of persistent differences
in writing styles (for example, some firms tend to use more cautionary tone or write relatively
longer section on risk).
Our text-based risk measure is forward-looking in capturing future business outlook unlike
earnings-based measures such as earnings volatility and cash flow volatility. It is also less prone
to investors' behavioral biases, data mining, and estimation errors, as descriptions in 10-K reports
must be representative, significant, and meaningful in order to meet the regulatory standards and
avoid legal consequences such as class-action lawsuits.
Our uncertainty measure is less prone to various interpretations and endogeneity concerns
than existing measures in the asset pricing literature (uncertainty has been overlooked in studies
of corporate policies). 3 For instance, firm age, market-to-book, and tangibility are directly
linked to firm growth, an important determinant of leverage, investment, and payout policy. In
3 See Pastor and Veronesi (2003) who consider firm age and market-to-book as proxies for uncertainty.
7
addition, dispersion in analysts’ earnings forecasts and earnings response coefficient (ERC)4
could also capture information asymmetry, which may affect leverage, payouts, and other
corporate decisions. Our text-based uncertainty measure reflects the inability of managers to act
upon vague information. Therefore, it is less likely that corporate decisions affect that
uncertainty measure (reverse causality), or that unobserved firm level characteristics
simultaneously drive uncertainty and corporate decisions (omitted variables).
The correlation between the text-based risk shock measure and change in return volatility,
earnings volatility, and cash flow volatility is 6%, 3%, and 4%, respectively. The correlation
between the uncertainty shock measure and change in VIX and ERC is 9% and 3.8%,
respectively. All these correlations are statistically significant at the 1% level. Overall, the
text-based measures contain a significant amount of new information not embedded in existing
measures.
2.2.DistributionbyIndustryandFirmCharacteristics
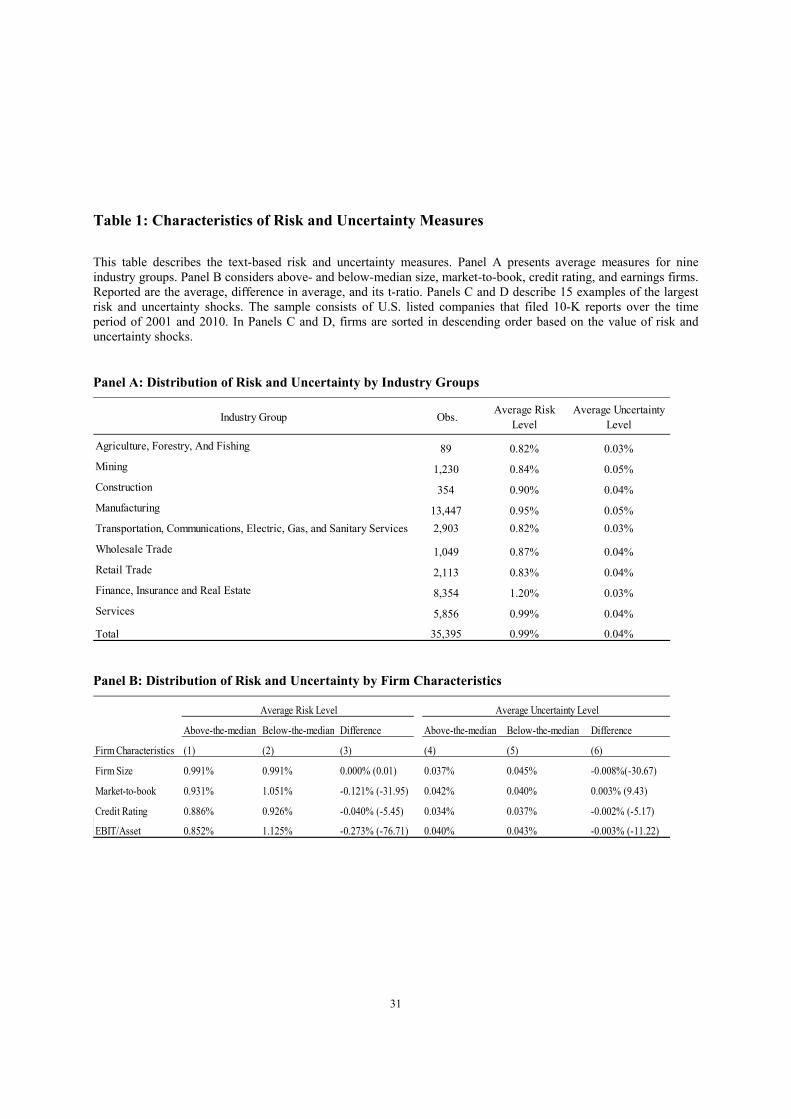
Panel A of Table 1 presents the distribution of average risk and uncertainty levels by
industry groups. We divide the sample into nine broad industry groups based on SIC codes and
compute the average risk and uncertainty for all groups. Risk and uncertainty shocks are
typically different across industries. Finance, insurance, and real estate groups exhibit the highest
risk along with relatively low uncertainty, consistent with the notion that the financial sector
plays a crucial role in consolidating and managing risks emerging from real activities. Firms in
the mining industry are associated with a median level of risk but the highest level of uncertainty,
as they face considerable uncertainties related to domestic and international exploration,
domestic government environmental, tax, health and safety regulation and legislation, and
currency controls and nationalization in foreign countries.
Insert Table 1
4 ERC is the average of a firm’s previous 12 stock price reactions to quarterly earnings surprises. ERC is used as a proxy for firm-level uncertainty since investors who are more uncertain about firms’ future outcomes are likely to respond more strongly to earnings surprises. See Pastor et al. (2009) and He el al. (2013) for detailed discussions.
8
Panel B of Table 1 presents the distribution of risk and uncertainty by firm size, growth
opportunity (market-to-book ratio), credit rating, and profitability (EBIT/Asset). We find that
less profitable firms with low credit ratings face higher risk and uncertainty levels, consistent
with the notion that such firms are financially constrained and thus are prone to liquidity risk and
uncertainties related to external financing. In addition, small firms with high market-to-book
ratio have higher level of uncertainty, suggesting that small and growth firms generally possess
less experience, information, and resources in dealing with circumstances such as economic
downturns. Such firms also face considerable uncertainties regarding their future prospects.
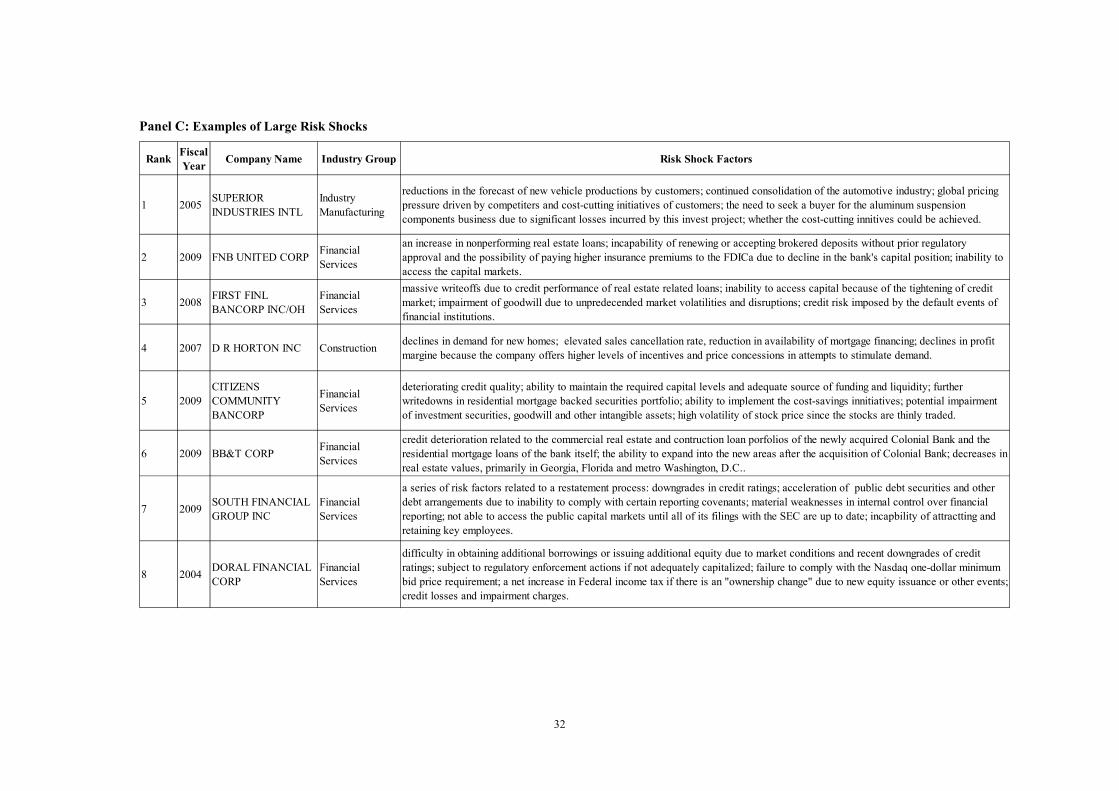
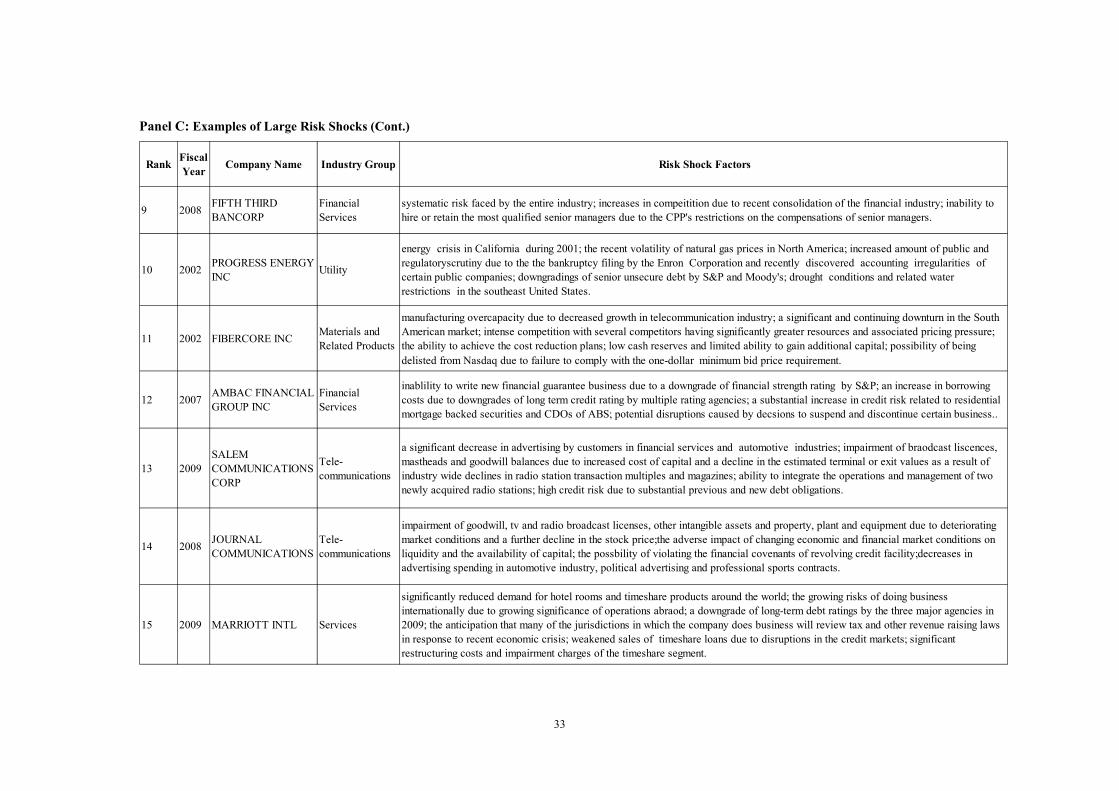
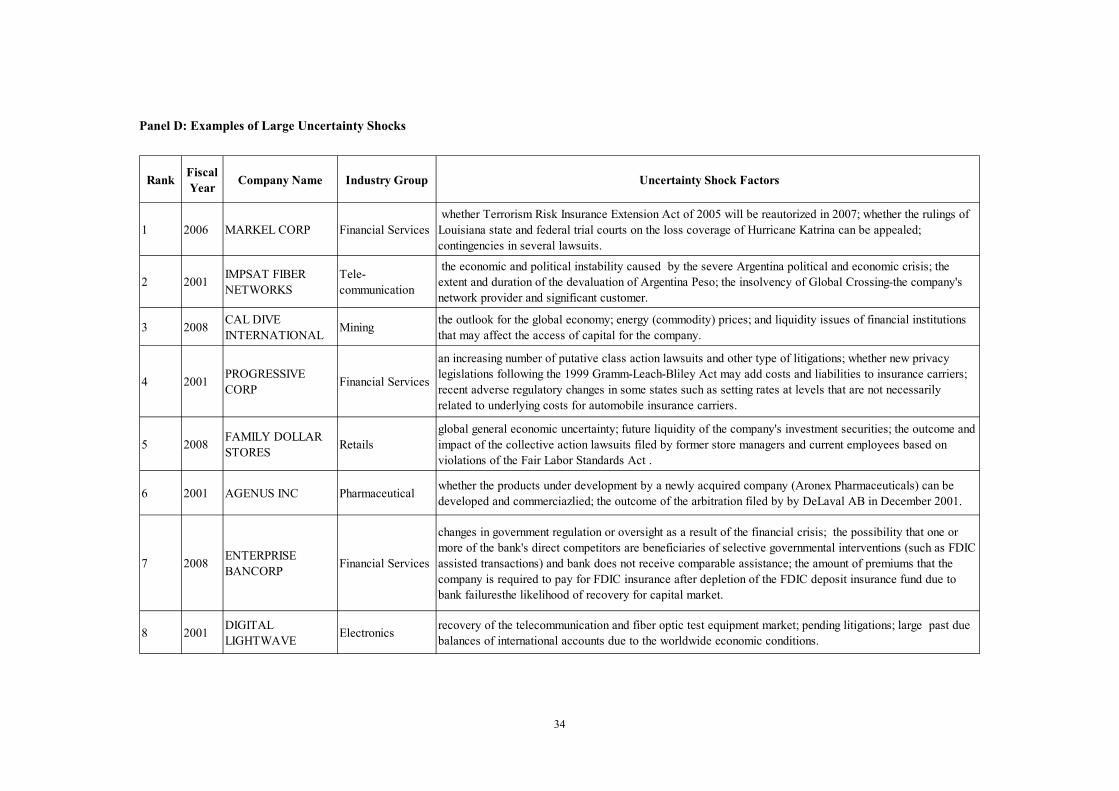
2.3.ExamplesofLargeRiskandUncertaintyShocks
To better comprehend the proposed risk and uncertainty measures, Panel C and D of Table
1 list examples of firms with the largest risk and uncertainty shocks, respectively. Panel C
highlights the severe impact of the 2007-2008 global financial crisis, as11 out of the 15 extreme
risk shocks are attributable to that period. In particular, seven commercial banks and insurance
companies (e.g., First Financial and BB&T) faced substantial increases in credit risk and
liquidity risk. Construction, TV and radio broadcast, and hotel industries were also challenged by
severe liquidity concerns, in addition to sharp drop in their product demand (e.g., the broadcast
companies were hurt by diminishing advertising expenses, especially by the financial sector).
Other sources of large risk shocks include demand shocks from upstream industry, industry
consolidation, manufacturing overcapacity, and increasing volatility in product and raw material
prices.
Large uncertainty shocks feature both macroeconomic conditions (such as the 2007-2008
Financial Crisis, the Argentina Peso Crisis, the 9-11 terrorist attack, the U.S. Farm Bill) and
firm-level factors (such as an ongoing financial restructuring, a litigation or class-action lawsuit,
and the development of new technologies via acquisitions). Unlike factors underlying risk shocks,
uncertainty shock factors are less controllable by the firm as it is hard to predict, assess the
consequence, and ultimately hedge. For example, after the global financial crisis, both risk and
9
uncertainty levels considerably advanced. Banks were hit hard by credit risk shocks,
counterparty risk shocks, and liquidity risk shocks, all of which can reasonably be assessed.
Furthermore, uncertainty enhances regarding whether a bank's direct competitors will be
beneficiaries of selective governmental interventions (such as FDIC assisted transactions), and
whether there will be changes in government regulations or oversight.
3. DataandVariableConstruction
Our sample consists of 35,596 observations of risk and uncertainty shocks, involving 7,371
distinct firms spanning 67 two-digit SIC industries. Policy variables, i.e., leverage, capital
expenditure, employment, R&D, cash holdings, dividend payouts, and stock repurchases, are
from COMPUSTAT. Firm-level control variables, such as stock returns, credit ratings, and sales
growth, are from CRSP and COMPUSTAT. The macro control variables VIX, Industrial
Productivity Index growth, and swap rates are from the website of the Federal Reserve Bank of
St. Louis.
The descriptive statistics of key variables are reported in Table 2. The mean and standard
deviation of book leverage are 55.36% and 28.37%, respectively. The average change in book
leverage is -0.17%. The average annual percentage changes in capital expenditure and
employment are 23.68% and 3.76%, respectively, suggesting that American corporations have
evolved to be more capital-dependent than labor-intensive.
Insert Table 2 here
The average change in the ratio of cash to assets is 0.03%, with a standard deviation of
8.08%. About 1% of the sample firms initiate or omit dividends, while 27% of the firms increase
dividends and 9% of the firms shrink dividends. Further, 36% of the firms are engaged in stock
repurchase whose value exceeds 1% of total assets, consistent with the recognition that stock
repurchases have become the most popular form of payouts since 1997. Overall, statistics of our
key variables are similar to those reported in past work.
10
Below we describe the construction of data, both corporate policy and control variables at the
firm and economy wide levels. More detailed descriptions are in Appendix 2. We use the book
leverage ratio, measured by the ratio of total liabilities to total assets, as a proxy for capital
structure. Our control variables in capital structure regressions include (i) lagged book leverage
ratio; (2) change in stock return volatility; (3) log of sales as a proxy for size; (4) stock return; (5)
tangibility measured by the ratio of gross properties, plant, and equipment (PPE) to total assets;
(6) market-to-book ratio as a proxy for growth; (7) return on assets (ROA) as a proxy for
profitability; (8) effective corporate tax rate; (9) short-term solvency measured by the ratio of
cash to interest expenses; (10) dividend yield measured by the ratio of common equity dividend
to the market value of common equity; (11) external financing, measured by financial deficit
normalized by sales. 5 We also control for macro conditions including the annual S&P 500
value-weighted return, one year swap rate, default risk premium, measured by the yield
difference between the Moody’s Baa and Aaa rated corporate bonds, option-implied volatility
(VIX), and Industrial Production Index growth.
Next, we compute the percentage change in capital expenditure, %dcapx i,t+1, as the primary
policy variable in investment regressions. We also compute %dempt+1 as the percentage change
in employment from previous year to proxy for firms’ investment in human capital. Firm-level
R&D data are from COMPUSTAT. The percentage change in R&D expenses establishes the
R&D investment measure. The following control variables are considered in assessing capital
investment, employment, and R&D policies: (1) ratio of earnings before extraordinary items plus
depreciation to PPE; (2) Tobin’s Q computed as the ratio of market and book value of assets; (3)
change in return volatility; (4) market leverage, measured as total liabilities divided by the sum
of total liabilities and market value of equity; (5) log of sales; and (6) ROA.
We define cash holdings, dcashi,t+1, as the change in the ratio of the sum of cash and
short-term investments to total assets. Following previous literature (e.g., Bates, Kahle, and Stulz
5 We follow Chen, Wang, and Zhou (2014) to compute financial deficit as the difference between cash outflow and internally generated cash flow. In particular, cash outflow includes investment in PPE and intangible assets, and increase in working capital. Internally generated cash flow is the summation of net income, depreciation and amortization, and deferred tax minus dividend payouts.
11
(2009); Hoberg, Phillips, and Prabhala (2014); and Gao, Harford, and Li (2014)), we incorporate
the following control variables: (1) lagged cash as the sum of cash and short-term investments
(cashi,t); (2) lagged change in the cash ratio (dcashi,t); (3) ratio of working capital (measured as
net working capital minus cash and short-term investments) to total assets; (4) Dividend Dummy,
which equals one if common dividends are paid and zero otherwise; (5) ratio of R&D expenses
to sales; (6) ratio of capital expenditure to total assets; (7) log of sales; and (8) and change in
stock return volatility.
As in Hoberg, Phillips, and Prabhala (2014), we develop four measures to examine changes
in dividend payout policy: (i) Dividend Initiation i,t+1, which equals one if a firm initiates
dividend payments and zero otherwise; (ii) Dividend Omission i,t+1, which equals one if a firm
terminates dividends and zero otherwise; (iii) Dividend Increase i,t+1, which equals one if a firm
increases dividend payments and zero otherwise; (iv) Dividend Decrease i,t+1, which equals one
if a firm decreases dividend payments and zero otherwise. The first two measures capture abrupt
changes in dividend policy, while the follow ups reflect moderate adjustment in payouts.
We construct an indicator variable, Repurchase More than 1% Asset Dummy, which equals
one if the value of net stock repurchases is over 1% of total assets, and zero otherwise. Following
Hoberg, Prabhala, and Phillips (2014), we define the value of net repurchases as purchase of
common and preferred stocks less the reduction in the value of outstanding preferred stocks. We
consider the following control variables in dividend policy regressions: (1) firm age since the
date of IPO; (2) sales growth as percentage change in net sales; (3) Negative Earnings Dummy
equals one if net income is negative and zero otherwise; (4) ratio of retained earnings to total
assets as a proxy for firm maturity; (5) log of sales; (6) ratio of R&D to sales; (7) market-to-book
ratio; (8) change in stock return volatility, and (9) ROA.
4.TheEmpiricalEvidence:Risk,Uncertainty,andCorporatePolicies
This section examines adjustments in leverage, investment, employment, cash holdings, and
payout policies in response to risk and uncertainty shocks. For leverage, investment, employment,
and cash holdings, we apply the OLS panel regression analysis. We apply logistic panel
12
regression for dividend payouts and repurchases, as such policies are characterized by dummy
variables, as noted in the data section. The policy regression is formulated as
△POLICYi,t+1 = α + β1RISKSHOCKi,t +β2UNCERTAINTYSHOCKi,t + βjCONTROLi,j,t + εi,t,(1)
where i is a firm-specific subscript, △POLICY i,t+1 represents future annual change in various
corporate policies, and RISKSHOCK i,t and UNCERTAINTYSHOCK i,t denote, respectively,
risk and uncertainty shocks. Control variables for each distinct policy are listed in the data
section. We further control for year and industry fixed effects. As noted earlier, our
“change-on-lagged change” regression setup allows one to examine the impact of risk and
uncertainty shocks, simultaneously controlling for omitted unobservable factors and potential
endogeneity.
4.1.CapitalStructure
The trade-off theory (Modigliani and Miller (1958); Merton (1974)) asserts that firms choose
capital structure to balance the benefits of debt financing and the direct and indirect costs
associated with financial distress. Risk shocks essentially lead to higher default probability and
thus to increasing borrowing costs, which could induce corporations to reduce debt. Thus, risk
shocks are likely to exert an adverse effect on leverage. On the other hand, there is no clear
prediction regarding the relation between uncertainty shocks and capital structure.
Table 3 reports the results. We examine the impact of risk and uncertainty shocks on the
book leverage ratio (Panel A), debt adjustment (Panel B), and equity adjustment (Panel C). Risk
shocks are followed by a significant downward adjustment in leverage, consistent with the
trade-off theory. The impact of risk shocks on leverage is economically significant, as 26.69% of
the median absolute change in leverage can be explained by the presence of a median risk shock.
Likewise, uncertainty shocks negatively affect changes in the leverage ratio, with 24.3% of the
median absolute change in leverage is attributable to the presence of a median uncertainty shock.
Further, the impact of risk and uncertainty shocks on leverage is symmetric. The absolute values
of coefficient estimates and significance level are similar, and the economic impact of negative
and positive shocks is similar.
13
Insert Table 3 here
The statistical and economic power of our text-based risk and uncertainty measures in
predicting leverage adjustments is considerably stronger than that of change in stock return
volatility. First, none of the coefficient estimates of Change in Volatility are statistically
significant in the presence of risk and/or uncertainty shocks. Moreover, the presence of a median
change in stock return volatility only explains 1.29% of the median absolute change in leverage,
while, as noted earlier, a median risk (uncertainty) shock explains 26.69% (24.3%) of the median
change.
Risk and uncertainty shocks remain significant explanatory variables of leverage when both
measures are simultaneously included in the regression. While the statistical significance of both
variables somewhat diminishes in the joint specification, the economic significance is still
substantial. In particular, a median-level risk shock and uncertainty shock separately explains
16.83% and 16.90% of the median absolute change in the book leverage ratio.
The coefficient estimates of firm characteristics, such as leverage, size, ROA, are consistent
with past work. Large firms are more likely to increase their leverage (e.g., Graham and Leary
(2011); Frank and Goyal (2009); Faulkender and Petersen (2006)). In addition, firms with higher
equity returns are associated with reducing leverage (e.g., Welch (2004); Faulkender and
Petersen (2006)). The leverage ratio is negatively correlated with future change in leverage,
confirming that leverage ratios are mean-reverting (Fama and French (2002); Baker and Wurgler
(2002); Leary and Roberts (2005)) .
We then decompose the change in the book leverage ratio into change in debt and change in
equity, and analyze the individual effects of risk and uncertainty shocks on these two
components. Panel B and C of Table 3 report the results. Risk shocks significantly and
negatively affect subsequent changes in debt. Furthermore, such changes are symmetric in
response to positive versus negative risk shocks. Similarly, uncertainty shocks lead to symmetric
and significant adjustments in the total debt. However, when risk and uncertainty shocks are both
present, uncertainty shocks are largely subsumed by risk shocks. On the other hand, risk and
14
uncertainty shocks are not significantly correlated with subsequent change in equity, suggesting
that their impact on leverage is attributable to the debt channel.
In sum, firms substantially reduce debt and leverage when risk and uncertainty increase, and
correspondingly increase debt and leverage ratio when risk and uncertainty resolve. Meanwhile,
firms tend not to significantly change their equity level when they face risk and uncertainty
shocks. Our evidence here is largely consistent with the trade-off theory. Further, the negative
relation between uncertainty shocks and firm debt is due to supply-side factors, while the effect
of risk shocks is driven by both supply and demand side factors. That argument is established
based on analysis reported in Table 9. In particular, the negative effect of uncertainty shocks on
debt only exists among high credit risk firms, while firms adjust their capital structure in
response to risk shocks among all credit rating groups.
4.2.InvestmentandEmployment
Table 4 reports the relation between risk and uncertainty shocks and adjustments in capital
expenditure. Risk shocks are negatively correlated with future changes in capital expenditure.
The reduction in capital expenditure due to a median risk shock accounts for 43.71% of the
median percentage change in capital expenditure, while a median change in the conventional
volatility-based risk measure can only explain 8.67%. The overall negative relation between risk
shocks and capital expenditure displays symmetric response for positive versus negative shocks.
Insert Table 4 here
In contrast, uncertainty shocks are not significantly correlated with subsequent changes in
capital expenditure. Bloom, Bond, and VanReenen (2007) theoretically show that uncertainty
shocks freeze investment within a few months, followed by overshooting investment. Detecting
no significant impact of uncertainty shocks within the one-year horizon is consistent with that
prediction. Our results highlight the importance of conceptually distinguishing risk and
uncertainty in assessing the impact of economic shocks on investment policy at the firm level.
Employment can be regarded as investment in human capital. Table 5 reports adjustments of
employment decisions. Experiencing risk shocks, firms lower not only their capital expenditure
15
but also employment. A median level of risk shock leads to a 7.54% median annual change in
employment. In comparison, the volatility-based measure (i.e., Change in Volatility) is
insignificant economically or statistically across the board. The overall impact of our risk
measure on employment is symmetric along positive versus negative shocks. Uncertainty shocks
are significant on their own, but become insignificant in the presence of risk shocks. In addition,
focusing on either negative or positive shocks, uncertainty no longer displays impact on changes
in employment.
Insert Table 5 here
While R&D expenses may not yield immediate profitability, they are crucial for innovation
and long-term growth prospects. R&D projects exhibit higher probability of failure and their
ultimate outcome is largely uncertain. To obtain a more complete outlook of corporate
investment, we examine the impact of risk and uncertainty shocks on R&D expenses. In
untabulated analysis, we find that firms significantly reduce R&D upon experiencing risk and
uncertainty shocks. Firms also respond symmetrically to positive versus negative shocks. They
increase their R&D expenses when risk or uncertainty rises, and diminish their R&D expenses
when risk or uncertainty falls. For robustness, we use percentage change in advertising expense
and obtain similar results.
4.3.CashHoldings
Past works shows that firms primarily hold cash for precautionary motives to hedge against
adverse risk shocks. For instance, Bates, Kahle, and Stulz (2009) attribute the rising cash
holdings of US manufacturing firms to increasing cash flow risk. Table 6 reports the effect of
risk and uncertainty shocks on cash holdings. A median risk shock explains almost 41.2% of the
median annual change in cash-to-assets ratio during the sample period. That is consistent with
Opler et al. (1999) and Bates, Kahle, and Stulz (2009), who show that the ratio of cash to total
non-cash assets is higher for firms with riskier cash flows. In contrast, uncertainty shocks do not
significantly affect cash holdings.
Insert Table 6 here
16
Economic implications of change in volatility on cash holdings are smaller even when the
relation between change in volatility and cash holdings is statistically significant. To illustrate, a
median risk shock and a median increase in volatility explain 41.2% and 21.6%, respectively, of
the median change in the cash-to-asset ratio. Consistent with previous studies, large firms with
more net working capital tend to increase their cash holdings. In contrast, firms with higher level
of cash or with large increase in cash-to-asset ratio are more likely to reduce subsequent cash
holdings. Analyzing positive versus negative shocks reveals asymmetric response. Increasing
risk leads to increasing cash holdings whereas there is no significant relation in the presence of
diminishing risk.
4.4.PayoutPolicy
Empirical evidence shows that risk is an important factor explaining dividend payments (e.g.,
Hoberg and Prabhala (2009); Hoberg, Phillips, and Prabhala (2014)). The field survey of
financial executives by Brav, Graham, Harvey, and Michaely (2005) also indicates that
perceived stability of future earnings is an important consideration in making payout policies. In
this section, we comprehensively examine dividend payout policies, including dividend
initiations, omissions, increases, and decreases, as well as share repurchases.
Table 7 reports the results on dividends, while Table 8 focuses on repurchase decisions.
Panel A of Table 7 presents the logistic regression where the dependent variable is a dummy
variable reflecting dividend initiation, dividend omission, dividend increase, and dividend
decrease. The evidence shows that risk shocks are positively and significantly correlated with
dividend omission. As the risk shock increases by one standard deviation above the sample mean,
there is 50% increase in the likelihood of dividend omission. On the contrary, across all
specifications, uncertainty shocks convey no significant influence on dividend policy adjustment.
It should be noted that the change in volatility is statistically significant in predicting dividend
omission, and it is of similar economic magnitude to our text-based measure. Increasing the
annual stock return volatility by one standard deviation above the sample mean leads to a 48%
increase in the propensity of dividend omission.
17
Insert Table 7 here
Panels B and C of Table 7 examine whether positive and negative shocks affect dividend
policy in the same manner. Our results show that firms respond to positive risk shocks by
substantially adjusting dividend policy along multiple dimensions. In particular, no-dividend
firms are likely to postpone dividend initiation. Some dividend-paying firms may choose to
moderately reduce dividend payouts, while others dramatically terminate dividend payouts. In
contrast, negative risk shocks exert no significant impact on dividend policy, suggesting that
managers are reluctant to increase dividend as risk resolves. Consistent with the results reported
in Panel A, there is no evidence that firms adjust their dividend payouts to either positive or
negative uncertainty shocks.
Share repurchases is as an alternative way to pay dividends. Jagannathan, Stephens, and
Weisbach (2000) and Guay and Harford (2000) find that dividend changes follow cash flow
shocks with a relatively large permanent component, while repurchases is used to distribute
shocks that are primarily transient. Table 8 reports the results on stock repurchases.
Insert Table 8 here
The impact of risk and uncertainty shocks on share repurchases is quite similar to that on
dividend payouts. First, risk shocks are followed by a significant reduction in the propensity of
large stock repurchases, while uncertainty shocks do not significantly affect stock repurchase
policies. Particularly, a one standard deviation increase in the risk shock leads to an 8.94%
decrease in the probability of large stock repurchases. Moreover, the presence of uncertainty can
reinforce the influence of the risk component in affecting share repurchase decision. In particular,
risk shocks are more significant, both statistically and economically, in the presence of
uncertainty shocks.
Similar to dividend payout policies, firms' repurchase policies adjust to positive risk shocks,
but are insensitive to negative risk shocks. A positive risk shock is followed by a significant
reduction in the likelihood of stock repurchases. That effect is stronger if the risk shocks is
further accompanied by a contemporary uncertainty shock. In contrast, negative risk and
uncertainty shocks do not significantly affect subsequent stock repurchases.
18
4.5.InteractionswithFirmCharacteristics
We employ OLS and logit regression models to examine how firm size, profitability, and
credit conditions interact with the impact of risk and uncertainty shocks on the various corporate
policies examined earlier. We use the following specifications
△POLICYi,t+1 = α +β1RISKSHOCKi,t +β2 RISKSHOCKi,t x FIRM DUMMY i,t +
βjCONTROLi,j,t + εi,t (2.1)
△POLICYi,t+1 = α + β1 UNCERTAINTYSHOCKi,t +β2 UNCERTAINTYSHOCKi,t x FIRM
DUMMY i,t + βjCONTROLi,j,t + εi,t (2.2)
The additional explanatory variables here are the interaction terms between risk (uncertainty)
shocks and dummy versions of firm size, profitability, and credit ratings. In particular,
FIRMDUMMY equals one if the firm's assets are larger than the sample median, if the firm's
earning (EBIT) is negative, or if the firm's S&P long term bond rating is higher than or equal to
BBB. That dummy variable equals zero otherwise.
Table 9 reports the results. The dependent variables are change in the book leverage ratio
(Panel A), percentage change in capital expenditure (Panel B), percentage change in employment
(Panel C), change in cash-to-asset ratio (Panel D), dividend payout dummy (Panel E), and
repurchase dummy variable (Panel F). For each policy examined, we use the same control
variables as in previous analyses.
Insert Table 9 here
Size Effects. We find that small firms reduce leverage to a greater degree in the presence of
risk shocks. The coefficient of the interaction term between risk shock and Large Firms Dummy
is 1.915, with a t-statistics of 2.44, indicating that the presence of a median risk shock explains
55.61% of the median absolute change in leverage for small firms, but only 6.42% for large
firms. Smaller firms are also associated with larger reductions in employment as risk increases.
The coefficient of the interaction term between risk shock and Large Firms Dummy is 2.792,
with a t-statistics of 1.80. The presence of a median risk shock explains 11.76% of the median
percentage change in employment for small firms, but only 5.56% of the median percentage
19
change in employment for large firms. There are no significant differences between large and
small firms with respect to all other corporate decisions, i.e., capital expenditure, cash holdings,
and payout policies.
Upon experiencing uncertainty shocks, small firms reduce leverage to a greater degree than
large firms. The coefficient of the interaction term between uncertainty shock and Large Firms
Dummy is 19.26, with a t-statistics of 2.21. This suggest that the presence of a median
uncertainty shock explains 40.77% of the median change in leverage for small firms, but only
7.79% of the median change in leverage for large firms. In addition, firms of different size adjust
their investment, employment, cash holdings, and payout policies similarly upon experiencing
uncertainty shocks.
Profitability Effects. We show that profitability plays an important role in affecting
employment policy in response to both risk and uncertainty shocks. Firms with negative earnings
react more prominently to the presence of risk and uncertainty shocks with employment
reduction. The coefficient of the interaction term between risk shock and Negative Earning
Dummy is -4.417, significant at the 1% level, indicating that the presence of a median risk shock
explains 14.61% (4.81%) of the median change in leverage for negative (positive) earnings
firms.
While, as shown earlier, the average firm does not adjust its employment policy following
uncertainty shocks, here we show that firms with negative earnings lay off more employees upon
experiencing uncertainty shocks. The coefficient estimate of the interaction term between
uncertainty shock and Negative Earning Dummy is statistically significant at the 10% level, with
a meaningful economic impact. In particular, the presence of a median uncertainty shock
explains about 74.14% (9.08%) of the median percentage change in employment for negative
(positive) earnings firms.
Negative earnings firm are also more responsive to risk and uncertainty shocks through
reducing dividend and repurchase payouts. Such firms are more likely to terminate or reduce
divide payouts after experiencing risk and uncertainty shocks, are less likely to increase
dividends when risk shocks resolve, and are less likely to engage in stock repurchases as
20
uncertainty shocks resolve. Since profitable firms have greater financing independence and
flexibility, our results suggest that financial constraints play significant roles in shaping up both
investment and payout policies.
Credit Rating Effects. It is evident that non-investment grade firms respond to uncertainty
shocks with a substantial reduction in leverage. The coefficient estimate of the interaction term
between uncertainty shock and Investment Grade Dummy is 26.310, significant at the 1% level.
The coefficient estimate of uncertainty shock is 9.33 for investment grade firms and -16.98 for
non-investment grade firms, indicating that there exists a negative relation between uncertainty
shocks and change in leverage solely for non-investment grade firms. Credit ratings also play an
important role in affecting payout policies upon experiencing risk and uncertainty shocks. High
credit risk firms are more likely to terminate dividends and are less likely to repurchase stocks
after experiencing risk shocks. In addition, uncertainty shocks lead to a lower probability of
dividend increases for high credit risk firms.
4.6.DurationoftheImpactofRiskandUncertaintyShocks
We examine the duration of the impact of risk and uncertainty shocks on corporate policies
by including lagged terms of each type of shocks measured at time t, t-1, and t-2, while keeping
the control variables observed at time t. More specifically, we use the following specifications
△POLICYi,t+1 = α + β1RISKSHOCKi,t +β2 RISKSHOCKi,t-1 +β3RISKSHOCKi,t-2 +
βjCONTROLi,j,t + εi,t (3.1)
△POLICYi,t+1 = α + β1UNCERTAINTYSHOCKi,t +β2 UNCERTAINTYSHOCKi,t-1
+β3UNCERTAINTYSHOCKi,t-2 + βjCONTROLi,j,t + εi,t (3.2)
Table 10 reports the results for risk shocks. Panels A through F present the results on
leverage, capital expenditure, employment, cash holdings, dividend payouts, and stock
repurchases, respectively. The evidence shows that the impact of risk shocks on leverage, capital
expenditure, and dividend payouts persists for two years, while the impact on employment, cash
21
holdings, and repurchase policies lasts for at least three years after the introduction of risk
shocks.
Insert Table 10 here
We find that risk shocks have stronger effects on cash holdings and repurchase policies than
on other policies. Generally, the statistical and economic significance of risk shocks diminish
over time. However, focusing on corporate cash holdings, the coefficient estimates of risk shocks
at times t, t-1, and t-2 are 1.017, 1.903, and 1.216, respectively. Furthermore, the coefficients
(t-statistics) of risk shocks at times t, t-1, and t-2 are -32.54 (-1.76), -45.74 (-1.91), and -51.28
(-2.14), respectively, in the share repurchase regression. That indicates that the impact of risk
shocks on repurchases becomes more significant three years after the introduction of these
shocks.
Table 11 reports the duration of the impact of uncertainty shocks. While both risk and
uncertainty shocks significantly affect capital structure, the negative impact of uncertainty
shocks lasts for one year only. As shown in Panels B, D, E, and F, uncertainty shocks do not
affect capital expenditure, cash holdings, dividend payouts, and repurchases either in the short
run (one-year horizon) or in the longer term (two-year and three-year horizon).
Insert Table 11 here
Taking together the findings exhibited in Tables 10 and 11, we show that the differential
impact of risk and uncertainty shocks on corporate policies exists not only in terms of scale and
strength, but also in terms of duration. The impact of risk shocks is persistent as they create clear
expectations on long-term business prospects. In contrast, uncertainty shocks contain vague
information that is due to resolve in a relatively short period. Overall, the impact of uncertainty
shocks on corporate decisions is limited in scale and lasts only for the short run.
5.RobustnessChecks
We consider a comprehensive battery of robustness checks. First, we examine alternative risk
and uncertainty measures based on different sections of 10-K texts. In particular, Item 7 and 7a
(Managerial Discussions & Analysis) in 10-K filings contain comprehensive managerial
22
discussions on corporate risk profile and business prospects. Using risk and uncertainty shock
measures derived solely from Item 7 and 7a texts, our results remain unchanged. Moreover,
Hoberg, Prabhala, and Phillips (2014) find that product market risk information extracted from
Item 1 (Business) can predict future cash holdings and payout policies. Here, we find that risk
and uncertainty shock measures based on Item 1 yield similar results as our benchmark measures.
Finally, since listed companies are mandated by SEC to include Item 1a to discuss "the most
significant factors that make the company speculative or risky" after 2005 December, we analyze
risk and uncertainty information embedded in Item 1a separately. Our overall evidence remains
unchanged, supporting the finding in Campbell et al. (2014) that risk disclosure in Item 1a is
firm-specific, meaningful, and relevant to different types of risks (i.e., systematic and
idiosyncratic risks).
Our results are also robust to alternative definitions of risk and uncertainty-related keywords.
Including only various formats of “uncertainty” (uncertain, uncertainty, uncertainties) in the
uncertainty dictionary yields consistent results with the benchmark uncertainty measure.
Including only different formats of “risk” (“risk”, “risks”, “risky”, “riskiness”, “risked”, and
“risking”) in the risk dictionary generates qualitatively similar yet often weaker results. That
could support the view that the word "risk" itself is subject to the "boilerplate" concern (Kravet
and Muslu (2013)). It also highlights the need to develop a broader risk-based dictionary.
We consider the possibility that our text-based uncertainty measure may, to some extent,
capture risk and vice versa. Therefore, we construct orthogonalized measures of risk and
uncertainty. In particular, Orthogonalized Uncertainty Shock is defined as the time-series change
in the residuals estimated from regressing the text-based uncertainty level on the text-based risk
level. We perform similar procedure to orthogonalize the benchmark risk measure. Using the
orthogonalized risk and uncertainty shock measures leaves our results unchanged.
Risk shocks remain significant also when we include in policy regressions changes in the
following alternative risk measures: (1) realized individual stock return volatility; (2) implied
volatility of individual stock options; (3) earnings volatility; (4) realized S&P 500 index return
volatility. Additionally, the relation between uncertainty shocks and corporate policies is
23
unchanged controlling for changes in the following alternative uncertainty measures: (1)
firm-level proxies including analyst earnings forecast dispersion, ERC, log firm age,
market-to-book ratio, tangibility, and (2) aggregate-level proxies such as implied volatility of
SP500 index options.
Next, our results are robust to using market leverage and adjusted book and market leverage
as the proxy for capital structure decision. We also derive similar results using the absolute
change in capital expenditure and employment, rather than the percentage change in these
measures, as dependent variables. Regarding payout policies, we also investigate the impact of
risk and uncertainty shocks on the percentage increase or decrease in dividend and repurchase
payouts. We find similar results upon using these continuous measures, rather than the dummy
variables.
Notice that we construct our risk and uncertainty measures based on the assumption that
managers objectively evaluate and truthfully report firm risk and uncertainty in the annual
reports. Graham, Harvey, and Puri (2013) document that CEOs and CFOs around the world
possess different personal traits such as risk aversion and optimism, which could affect corporate
leverage and investment decisions. In our context, there is a possibility that risk averse managers
overestimate a firm’s risk level and in the meantime undertake less debt. Therefore, risk aversion
or other CEO personal traits, rather than risk per se, may affect corporate leverage among other
decisions. Our change-on-change approach (i.e., studying the effect of change in risk and
uncertainty on change in corporate policies) mitigates such concerns, as long as CEO traits are
time-invariant, or CEO traits lead to systematic under or over-evaluation of corporate risk.
We further account for potential effects of CEO characteristics by adding controls for CEO
gender, age, education, and experience. Younger and male CEOs, and CEOs with MBA degrees
and longer financial industry experience may adopt more aggressive financial policies (see, for
example, Graham, Harvey, and Puri (2013)). We measure CEO education from a variety of
dimensions, including whether the CEO has a bachelor, master, or PhD degree, whether the CEO
graduates from an Ivy-league college, whether the CEO obtains an MBA degree, whether the
CEO obtains an MBA degree from the “US News (2010)” top 20 MBA programs, and whether
24
the CEO obtains a Master of Finance degree. We also account for CEO prior experience by
examining the number of years the CEO has worked in the finance industry, the number of years
the CEO has worked for the same industry as the current firm, the number of years the CEO has
worked in the same firm, and the number of working years in general. Our results are essentially
the same after controlling for all the above noted CEO characteristics.
Our next robustness check accounts for potential effects of hedging activities on the relation
between risk shocks and corporate decisions. Past work shows that some corporations manage
their risk by implementing hedging to stabilize their earnings and cash flows, lower their
bankruptcy costs, and ease their credit and financial constraints (see, for example, Campello, Lin,
Ma, and Zou (2011)). Managerial risk tolerance may also play a role in corporate hedging
decisions ((Bodnar, Giambona, Graham, and Harvey (2014)). Depending on hedging activities,
mangers facing risk shocks may adjust corporate policies differently.
We construct a text-based measure of corporate hedging by counting the frequency of
hedge-related word stems, including different forms of the word “hedge” and “derivative”, in the
10-K reports. Our main variable, Hedge, is then computed as the frequency of hedge-related
word stems divided by the total number of word stems in the 10-K reports. To examine the effect
of hedging activities, we first add the change in the variable Hedge (i.e., dHedge) as a control in
our baseline regressions. We also construct an interaction term between dHedge and Risk Shock
to test whether the relation between risk shocks and corporate decisions differs for hedging
corporations.
Hedging activities indeed affect a wide range of corporate decisions, such as leverage,
investment, and payout policies. Specifically, an increase in hedging activities is associated with
an increase in leverage and employment, and a decrease in cash holdings and dividend payouts.
Ultimately, however, the documented relation between risk shocks and corporate decisions is
robust to considering hedging. Both hedging and non-hedging firms significantly adjust their
corporate policies subsequent to risk shocks, yet hedging firms adjust their corporate policies
more mildly.
25
Our text-based measure of risk shocks could merely capture deteriorating profitability.
Managers tend to use more negative and cautionary words in annual reports when profitability
diminishes (Li (2006)). A plausible story is that profitability drop, rather than rising risk, leads to
the reduction in leverage, investment, dividend payouts, and the increase in cash holdings. To
alleviate such concerns, we add controls for change in earnings (i.e., EBIT/Assets) or change in
earnings volatility in all regressions. Controlling for these variables, risk shocks still significantly
predict changes in leverage, investment, employment, cash holdings, and dividend and
repurchase policies.
6.Conclusion
This paper develops a novel methodology to measure firm-level risk and uncertainty through
analyzing the textual contents of corporate 10-K reports. It then examines adjustments of various
corporate policies in response to shocks to the surrounding uncertainty and risk environments.
Based on 35,596 filings corresponding to 7,371 distinct firms over the 2001 to 2010 sample
period, we show that risk shocks are followed by persistent and economically significant
reductions in leverage, investment, employment, dividend payouts, and stock repurchases, along
with increases in cash holdings. Small, non-profitable, and high credit risk firms are more
responsive to risk shocks compared to big, profitable, and low credit risk firms. Managers could
respond asymmetrically to rising versus resolving risks. While they simultaneously adjust cash
holdings and payout policies following positive risk shocks, they need not reverse their decisions
as the risk resolves. Possibly, managers remain concerned about the potential reappearance of
risk shocks. Uncertainty shocks, on the other hand, are only followed by a short-term reduction
in leverage, while other corporate policies remain virtually unchanged. Moreover, uncertainty
shocks often substantially amplify the influence of risk shocks on corporate policies when both
shocks emerge.
The findings imply that risk shocks are based on clear information about firm business
conditions, and are thus followed by broad-scale policy adjustments. In contrast, uncertainty
26
shocks are based on ambiguous information, thereby making managers wait for their resolution.
At most, managers undertake limited actions on selected policies for temporary resolution.
Examining simultaneously various polices helps one identify the intra-dependence and
priority order of corporate decision-making in response to changing business conditions. Indeed,
our findings highlight the importance of studying corporate policies in a unified framework as
well as distinguishing between risk and uncertainty in corporate finance research.
27
Reference
Anderson, Evan W., Eric Ghysels, and Jenifer L. Juergens, 2009, The impact of risk and
uncertainty on expected returns, Journal of Financial Economics 94, 233-63.
Baker, Malcolm, and Jeffrey Wurgler, 2002, Market timing and capital structure, Journal of
Finance 57, 1–30.
Bates, Thomas, Kathleen Kahle, and Rene Stulz, 2009, Why do U.S. firms hold so much more
cash than they used to?, Journal of Finance 64, 1985–2021.
Bloom, Nick, 2009, The impact of uncertainty shocks, Econometrica 77, 623–685.
Bloom, Nick, Stephen Bond, and John VanReenen, 2007, Uncertainty and investment dynamics,
Review of Economics Studies 74, 391–415.
Bodnar, Gordon M., Erasmo Giambona, John R. Graham, and Campbell R. Harvey, 2014, A
view inside corporate risk management, Duke University, Working paper.
Brav, A., John R. Graham, Campbell R. Harvey, and Roni Michaely, 2005, Payout policy in the
21st century, Journal of Financial Economics 77, 483-527.
Campbell, John L., Hsinchun Chen, Dan S. Dhaliwal, Hsin-min Lu, and Logan B. Steele, 2014,
The information content of mandatory risk factor disclosure in corporate filings, Review of
Accounting Studies 19,396-455.
Campello, Murillo, Chen Lin, Yue Ma, and Hong Zou, 2011, The real and financial
implications of corporate hedging, Journal of Finance 66, 1615-1647.
Chen, Hui, Hao Wang, and Hao Zhou, 2014, Stock return volatility and capital structure
decisions, Massachusset Institute of Technology, Working Paper.
Epstein, Larry, and Martin Schneider, 2008, Ambiguity, information quality and asset pricing,
Journal of Finance 63, 197-228.
Epstein, Larry, and Tan Wang, 1994, Intertemporal asset pricing under knightain uncertainty,
Econometrica 62, 283-322.
28
Fama, Eugene F., and Kenneth R. French, 2002, Testing tradoff and pecking order predictions
about dividends and debt, Review of Financial Studies 15, 1–33.
Faulkender, Michael, and Mitchell A. Peterson, 2006, Does the source of capital affect capital
structure, Review of Financial Studies 19, 45-79.
Frank, Murray Z., and Vidhan K. Goyal, 2009, Capital decisions: which factors are reliably
important? Financial Management 38, 1-37.
Gao, Huangsheng, Jarrad Harford, and Kai Li, 2014, Determinants of corporate cash policy:
Insights from private firms, Journal of Financial Economics 109, 623-639.
Graham, John R., and Campbell R. Harvey, 2001, The theory and practice of corporate finance:
evidence from the field, Journal of Financial Economics Vol.60,187-243
Graham, John R., and Mark T. Leary, 2011, A review of empirical capital structure research and
directions for the future, Annual Review of Financial Economics 3, 309-345.
Graham, John R., Campbell R. Harvey, and Manju Puri, 2013, Managerial attitudes and
corporate actions, Journal of Financial Economics 109, 103-21.
Guay, Wayne, and Jarrad Harford, 2000, The cash flow permanence and information content of
dividend increases vs. repurchases, Journal of Financial Economics 57, 385-415.
Harris, Milton, and Arthur Raviv, 1991, The theory of capital structure, Journal of Finance 46,
297–355.
He, Zhiguo, Si Li, Bin Wei, and Jianfeng Yu, 2014, Uncertainty, risk, and incentives: theory and
evidence, Management Science 60: 206-226.
Hoberg, Gerard, and Prabhala Nagpurnanand, 2009, Disappearing Dividends, Catering, and Risk,
Review of Financial Studies 22, 79-116.
Hoberg, Gerard, Gordon Phillips, and Prabhala Nagpurnanand, 2014, Product market threats,
payouts, and financial flexibility, Journal of Finance 69, 297-324.
Jagannathan, M., C. P. Stephens and M. S. Weisbach, 2000, Financial flexibility and the choice
between dividends and stock repurchases, Journal of Financial Economics, 57, 355–384.
Ju, Nengjiu, and Jianjun Miao, 2012, Ambiguity, learning, and asset return, Econometrica 80,
559-591.
29
Knight, Frank, 1921, Risk, uncertainty, and profit, Boston: Houghton Mifflinn.
Kravet, Todd, and Volkan Muslu, 2013, Textual risk disclosures and investors’ risk perceptions,
Review of Accounting Studies 18, 1088-1122.
Leary, Mark T., and Michael R. Roberts, 2005, Do firms rebalance their capital structure,
Journal of Finance 60, 2575–2619.
Lemmon, Michael L., Roberts, Michael R., and Zender, Jaime F., 2008, Back to the beginning:
Persistence and the cross-section of corporate capital structure, Journal Of Finance 63,
1575-1608.
Li, Feng, 2006, Do stock market investors understand the risk sentiment of corporate annual
reports?, University of Michigan, Working Paper.
Li, Feng, 2010, Textual analysis of corporate disclosures: A survey of literature, Journal of
Accounting Literature 29, 143–165.
Loughran, Tim, and Bill McDonald, 2011, When is a liability not a liability? Textual analysis,
dictionaries, and 10-Ks, Journal of Finance 66, 35–65.
Merton, Robert, 1974, On the pricing of corporate debt: The risk structure of interest rates,
Journal of Finance 29, 449–479.
Modigliani, Franco, and Merton Miller, 1958, The cost of capital, corporation finance and the
theory of investment, American Economic Review 48, 261-297.
Opler, Tim, Lee Pinkowitz, Rene Stulz, and Rohan Williamson, 1999, The determinants and
implications of corporate cash holdings, Journal of Financial Economics 52, 3–46.
Panousi, Vasia, and Dimitris Papanikolaou, 2012, Investment, idiosyncratic risk and ownership,
Journal of Finance 67, 1113–1148.
Pastor, Lubos, and Pietro Veronesi, 2003, Stock valuation and learning about profitability,
Journal
of Finance 58, 1749-90.
Pastor, Lubos, and Pietro Veronesi, 2009, Technological revolutions and stock prices, American
Economic Review 99, 1451–1483.

30
Tetlock, Paul C., 2007, Giving content to investor sentiment: The role of media in the stock
market, Journal of Finance 62, 1139–1168.
Tetlock, Paul, Maytal Saar-Tsechanksy, and Sofus Macskassy, 2008, More than words:
Quantifying language to measure firms’ fundamentals, Journal of Finance 63, 1437–1467.
31
Table 1: Characteristics of Risk and Uncertainty Measures
This table describes the text-based risk and uncertainty measures. Panel A presents average measures for nine industry groups. Panel B considers above- and below-median size, market-to-book, credit rating, and earnings firms. Reported are the average, difference in average, and its t-ratio. Panels C and D describe 15 examples of the largest risk and uncertainty shocks. The sample consists of U.S. listed companies that filed 10-K reports over the time period of 2001 and 2010. In Panels C and D, firms are sorted in descending order based on the value of risk and uncertainty shocks.
Panel A: Distribution of Risk and Uncertainty by Industry Groups
Industry Group Obs.Average Risk
LevelAverage Uncertainty
Level
Agriculture, Forestry, And Fishing 89 0.82% 0.03%
Mining 1,230 0.84% 0.05%
Construction 354 0.90% 0.04%
Manufacturing 13,447 0.95% 0.05%
Transportation, Communications, Electric, Gas, and Sanitary Services 2,903 0.82% 0.03%
Wholesale Trade 1,049 0.87% 0.04%
Retail Trade 2,113 0.83% 0.04%
Finance, Insurance and Real Estate 8,354 1.20% 0.03%
Services 5,856 0.99% 0.04%
Total 35,395 0.99% 0.04%
Panel B: Distribution of Risk and Uncertainty by Firm Characteristics
Above-the-median Below-the-median Difference Above-the-median Below-the-median Difference
Firm Characteristics (1) (2) (3) (4) (5) (6)
Firm Size 0.991% 0.991% 0.000% (0.01) 0.037% 0.045% -0.008%(-30.67)
Market-to-book 0.931% 1.051% -0.121% (-31.95) 0.042% 0.040% 0.003% (9.43)
Credit Rating 0.886% 0.926% -0.040% (-5.45) 0.034% 0.037% -0.002% (-5.17)
EBIT/Asset 0.852% 1.125% -0.273% (-76.71) 0.040% 0.043% -0.003% (-11.22)
Average Risk Level Average Uncertainty Level
32
Panel C: Examples of Large Risk Shocks
RankFiscalYear
Company Name Industry Group Risk Shock Factors
1 2005SUPERIORINDUSTRIES INTL
IndustryManufacturing
reductions in the forecast of new vehicle productions by customers; continued consolidation of the automotive industry; global pricingpressure driven by competiters and cost-cutting initiatives of customers; the need to seek a buyer for the aluminum suspensioncomponents business due to significant losses incurred by this invest project; whether the cost-cutting innitives could be achieved.
2 2009 FNB UNITED CORPFinancialServices
an increase in nonperforming real estate loans; incapability of renewing or accepting brokered deposits without prior regulatoryapproval and the possibility of paying higher insurance premiums to the FDICa due to decline in the bank's capital position; inability toaccess the capital markets.
3 2008FIRST FINLBANCORP INC/OH
FinancialServices
massive writeoffs due to credit performance of real estate related loans; inability to access capital because of the tightening of creditmarket; impairment of goodwill due to unpredecended market volatilities and disruptions; credit risk imposed by the default events offinancial institutions.
4 2007 D R HORTON INC Constructiondeclines in demand for new homes; elevated sales cancellation rate, reduction in availability of mortgage financing; declines in profitmargine because the company offers higher levels of incentives and price concessions in attempts to stimulate demand.
5 2009CITIZENSCOMMUNITYBANCORP
FinancialServices
deteriorating credit quality; ability to maintain the required capital levels and adequate source of funding and liquidity; furtherwritedowns in residential mortgage backed securities portfolio; ability to implement the cost-savings innitiatives; potential impairmentof investment securities, goodwill and other intangible assets; high volatility of stock price since the stocks are thinly traded.
6 2009 BB&T CORPFinancialServices
credit deterioration related to the commercial real estate and contruction loan porfolios of the newly acquired Colonial Bank and theresidential mortgage loans of the bank itself; the ability to expand into the new areas after the acquisition of Colonial Bank; decreases inreal estate values, primarily in Georgia, Florida and metro Washington, D.C..
7 2009SOUTH FINANCIALGROUP INC
FinancialServices
a series of risk factors related to a restatement process: downgrades in credit ratings; acceleration of public debt securities and otherdebt arrangements due to inability to comply with certain reporting covenants; material weaknesses in internal control over financialreporting; not able to access the public capital markets until all of its filings with the SEC are up to date; incapbility of attractting andretaining key employees.
8 2004DORAL FINANCIALCORP
FinancialServices
difficulty in obtaining additional borrowings or issuing additional equity due to market conditions and recent downgrades of creditratings; subject to regulatory enforcement actions if not adequately capitalized; failure to comply with the Nasdaq one-dollar minimumbid price requirement; a net increase in Federal income tax if there is an "ownership change" due to new equity issuance or other events;credit losses and impairment charges.
33
Panel C: Examples of Large Risk Shocks (Cont.)
RankFiscalYear
Company Name Industry Group Risk Shock Factors
9 2008FIFTH THIRDBANCORP
FinancialServices
systematic risk faced by the entire industry; increases in compeitition due to recent consolidation of the financial industry; inability tohire or retain the most qualified senior managers due to the CPP's restrictions on the compensations of senior managers.
10 2002PROGRESS ENERGYINC
Utility
energy crisis in California during 2001; the recent volatility of natural gas prices in North America; increased amount of public andregulatoryscrutiny due to the the bankruptcy filing by the Enron Corporation and recently discovered accounting irregularities ofcertain public companies; downgradings of senior unsecure debt by S&P and Moody's; drought conditions and related waterrestrictions in the southeast United States.
11 2002 FIBERCORE INCMaterials andRelated Products
manufacturing overcapacity due to decreased growth in telecommunication industry; a significant and continuing downturn in the SouthAmerican market; intense competition with several competitors having significantly greater resources and associated pricing pressure;the ability to achieve the cost reduction plans; low cash reserves and limited ability to gain additional capital; possibility of beingdelisted from Nasdaq due to failure to comply with the one-dollar minimum bid price requirement.
12 2007AMBAC FINANCIALGROUP INC
FinancialServices
inablility to write new financial guarantee business due to a downgrade of financial strength rating by S&P; an increase in borrowingcosts due to downgrades of long term credit rating by multiple rating agencies; a substantial increase in credit risk related to residentialmortgage backed securities and CDOs of ABS; potential disruptions caused by decsions to suspend and discontinue certain business..
13 2009SALEMCOMMUNICATIONSCORP
Tele-communications
a significant decrease in advertising by customers in financial services and automotive industries; impairment of braodcast liscences,mastheads and goodwill balances due to increased cost of capital and a decline in the estimated terminal or exit values as a result ofindustry wide declines in radio station transaction multiples and magazines; ability to integrate the operations and management of twonewly acquired radio stations; high credit risk due to substantial previous and new debt obligations.
14 2008JOURNALCOMMUNICATIONS
Tele-communications
impairment of goodwill, tv and radio broadcast licenses, other intangible assets and property, plant and equipment due to deterioratingmarket conditions and a further decline in the stock price;the adverse impact of changing economic and financial market conditions onliquidity and the availability of capital; the possbility of violating the financial covenants of revolving credit facility;decreases inadvertising spending in automotive industry, political advertising and professional sports contracts.
15 2009 MARRIOTT INTL Services
significantly reduced demand for hotel rooms and timeshare products around the world; the growing risks of doing businessinternationally due to growing significance of operations abraod; a downgrade of long-term debt ratings by the three major agencies in2009; the anticipation that many of the jurisdictions in which the company does business will review tax and other revenue raising lawsin response to recent economic crisis; weakened sales of timeshare loans due to disruptions in the credit markets; significantrestructuring costs and impairment charges of the timeshare segment.
34
Panel D: Examples of Large Uncertainty Shocks
RankFiscalYear
Company Name Industry Group Uncertainty Shock Factors
1 2006 MARKEL CORP Financial Services whether Terrorism Risk Insurance Extension Act of 2005 will be reautorized in 2007; whether the rulings ofLouisiana state and federal trial courts on the loss coverage of Hurricane Katrina can be appealed;contingencies in several lawsuits.
2 2001IMPSAT FIBERNETWORKS
Tele-communication
the economic and political instability caused by the severe Argentina political and economic crisis; theextent and duration of the devaluation of Argentina Peso; the insolvency of Global Crossing-the company'snetwork provider and significant customer.
3 2008CAL DIVEINTERNATIONAL
Miningthe outlook for the global economy; energy (commodity) prices; and liquidity issues of financial institutionsthat may affect the access of capital for the company.
4 2001PROGRESSIVECORP
Financial Services
an increasing number of putative class action lawsuits and other type of litigations; whether new privacylegislations following the 1999 Gramm-Leach-Bliley Act may add costs and liabilities to insurance carriers;recent adverse regulatory changes in some states such as setting rates at levels that are not necessarilyrelated to underlying costs for automobile insurance carriers.
5 2008FAMILY DOLLARSTORES
Retailsglobal general economic uncertainty; future liquidity of the company's investment securities; the outcome andimpact of the collective action lawsuits filed by former store managers and current employees based onviolations of the Fair Labor Standards Act .
6 2001 AGENUS INC Pharmaceuticalwhether the products under development by a newly acquired company (Aronex Pharmaceuticals) can bedeveloped and commerciazlied; the outcome of the arbitration filed by by DeLaval AB in December 2001.
7 2008ENTERPRISEBANCORP
Financial Services
changes in government regulation or oversight as a result of the financial crisis; the possibility that one ormore of the bank's direct competitors are beneficiaries of selective governmental interventions (such as FDICassisted transactions) and bank does not receive comparable assistance; the amount of premiums that thecompany is required to pay for FDIC insurance after depletion of the FDIC deposit insurance fund due tobank failuresthe likelihood of recovery for capital market.
8 2001DIGITALLIGHTWAVE
Electronicsrecovery of the telecommunication and fiber optic test equipment market; pending litigations; large past duebalances of international accounts due to the worldwide economic conditions.
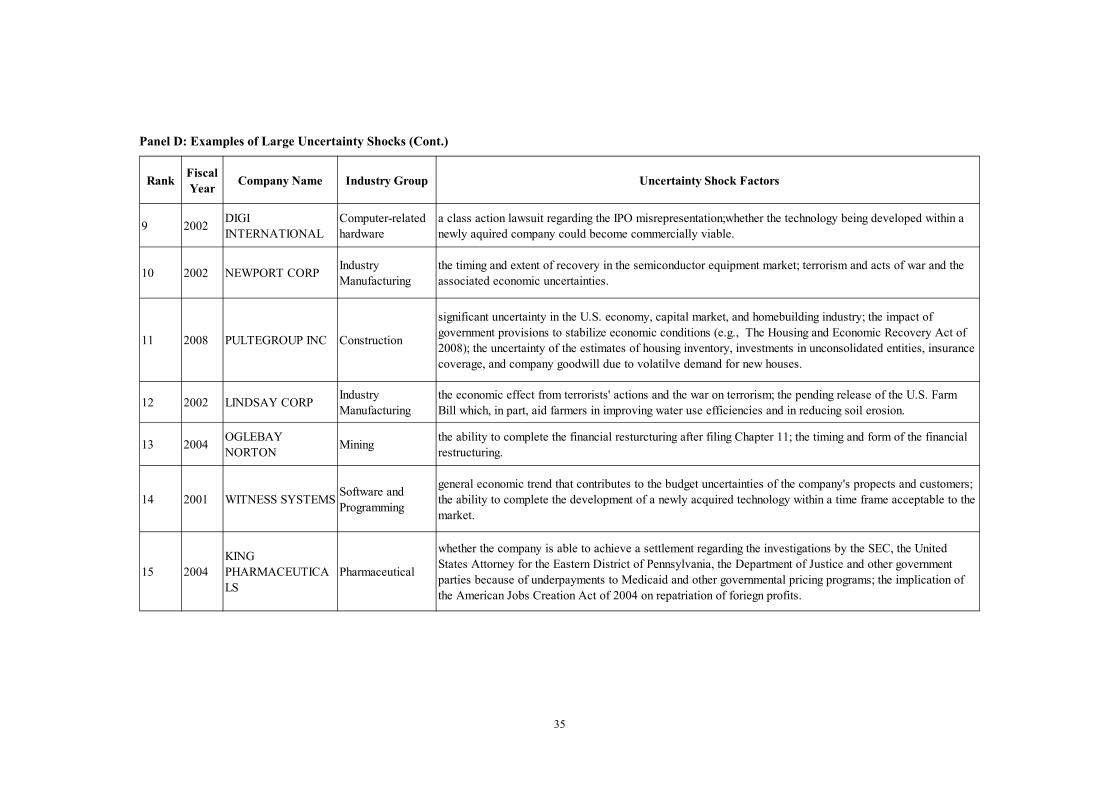
35
Panel D: Examples of Large Uncertainty Shocks (Cont.)
RankFiscalYear
Company Name Industry Group Uncertainty Shock Factors
9 2002DIGIINTERNATIONAL
Computer-relatedhardware
a class action lawsuit regarding the IPO misrepresentation;whether the technology being developed within anewly aquired company could become commercially viable.
10 2002 NEWPORT CORPIndustryManufacturing
the timing and extent of recovery in the semiconductor equipment market; terrorism and acts of war and theassociated economic uncertainties.
11 2008 PULTEGROUP INC Construction
significant uncertainty in the U.S. economy, capital market, and homebuilding industry; the impact ofgovernment provisions to stabilize economic conditions (e.g., The Housing and Economic Recovery Act of2008); the uncertainty of the estimates of housing inventory, investments in unconsolidated entities, insurancecoverage, and company goodwill due to volatilve demand for new houses.
12 2002 LINDSAY CORPIndustryManufacturing
the economic effect from terrorists' actions and the war on terrorism; the pending release of the U.S. FarmBill which, in part, aid farmers in improving water use efficiencies and in reducing soil erosion.
13 2004OGLEBAYNORTON
Miningthe ability to complete the financial resturcturing after filing Chapter 11; the timing and form of the financialrestructuring.
14 2001 WITNESS SYSTEMSSoftware andProgramming
general economic trend that contributes to the budget uncertainties of the company's propects and customers;the ability to complete the development of a newly acquired technology within a time frame acceptable to themarket.
15 2004KINGPHARMACEUTICALS
Pharmaceutical
whether the company is able to achieve a settlement regarding the investigations by the SEC, the UnitedStates Attorney for the Eastern District of Pennsylvania, the Department of Justice and other governmentparties because of underpayments to Medicaid and other governmental pricing programs; the implication ofthe American Jobs Creation Act of 2004 on repatriation of foriegn profits.
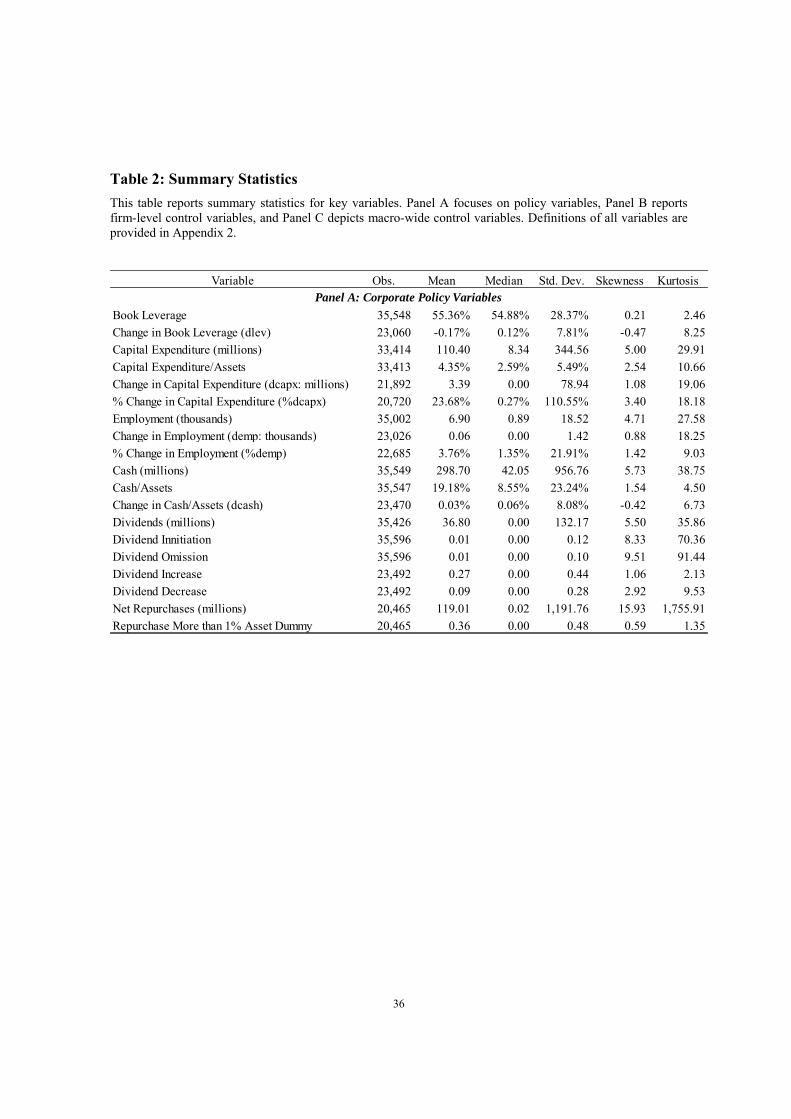
36
Table 2: Summary Statistics
This table reports summary statistics for key variables. Panel A focuses on policy variables, Panel B reports firm-level control variables, and Panel C depicts macro-wide control variables. Definitions of all variables are provided in Appendix 2.
Variable Obs. Mean Median Std. Dev. Skewness Kurtosis
Book Leverage 35,548 55.36% 54.88% 28.37% 0.21 2.46
Change in Book Leverage (dlev) 23,060 -0.17% 0.12% 7.81% -0.47 8.25
Capital Expenditure (millions) 33,414 110.40 8.34 344.56 5.00 29.91
Capital Expenditure/Assets 33,413 4.35% 2.59% 5.49% 2.54 10.66
Change in Capital Expenditure (dcapx: millions) 21,892 3.39 0.00 78.94 1.08 19.06
% Change in Capital Expenditure (%dcapx) 20,720 23.68% 0.27% 110.55% 3.40 18.18
Employment (thousands) 35,002 6.90 0.89 18.52 4.71 27.58
Change in Employment (demp: thousands) 23,026 0.06 0.00 1.42 0.88 18.25
% Change in Employment (%demp) 22,685 3.76% 1.35% 21.91% 1.42 9.03
Cash (millions) 35,549 298.70 42.05 956.76 5.73 38.75
Cash/Assets 35,547 19.18% 8.55% 23.24% 1.54 4.50
Change in Cash/Assets (dcash) 23,470 0.03% 0.06% 8.08% -0.42 6.73
Dividends (millions) 35,426 36.80 0.00 132.17 5.50 35.86
Dividend Innitiation 35,596 0.01 0.00 0.12 8.33 70.36
Dividend Omission 35,596 0.01 0.00 0.10 9.51 91.44
Dividend Increase 23,492 0.27 0.00 0.44 1.06 2.13
Dividend Decrease 23,492 0.09 0.00 0.28 2.92 9.53
Net Repurchases (millions) 20,465 119.01 0.02 1,191.76 15.93 1,755.91
Repurchase More than 1% Asset Dummy 20,465 0.36 0.00 0.48 0.59 1.35
Panel A: Corporate Policy Variables
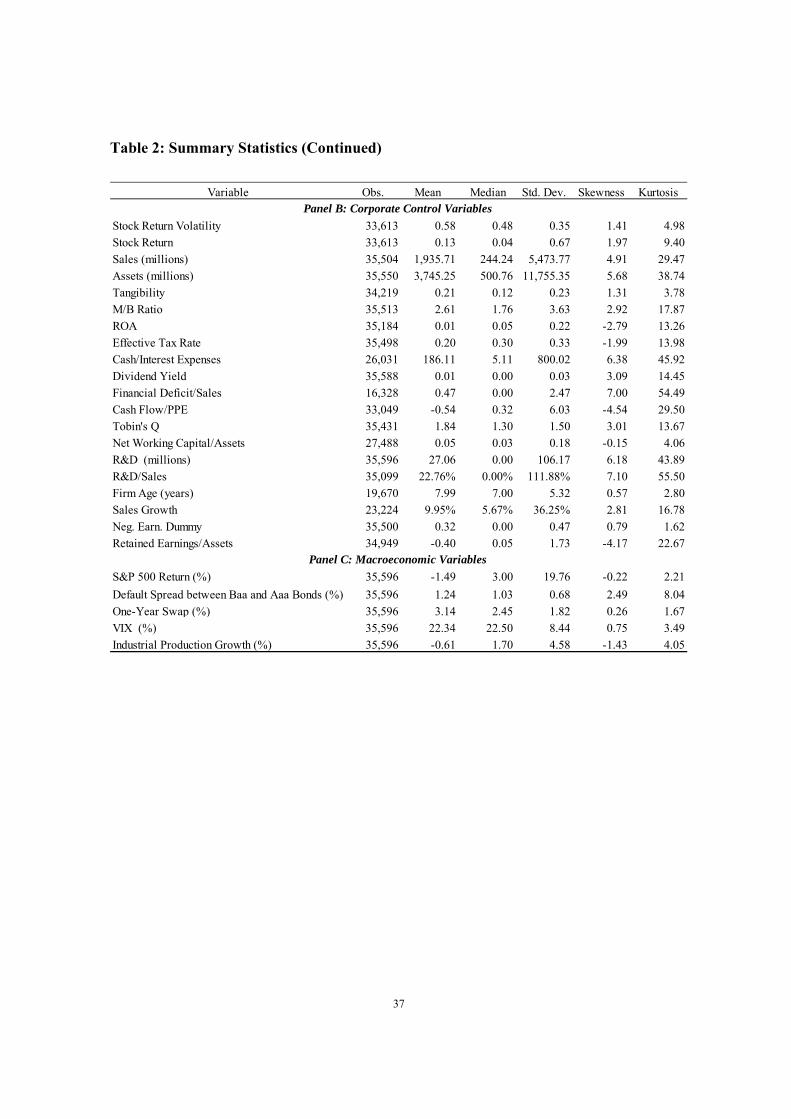
37
Table 2: Summary Statistics (Continued)
Variable Obs. Mean Median Std. Dev. Skewness Kurtosis
Stock Return Volatility 33,613 0.58 0.48 0.35 1.41 4.98
Stock Return 33,613 0.13 0.04 0.67 1.97 9.40
Sales (millions) 35,504 1,935.71 244.24 5,473.77 4.91 29.47
Assets (millions) 35,550 3,745.25 500.76 11,755.35 5.68 38.74
Tangibility 34,219 0.21 0.12 0.23 1.31 3.78
M/B Ratio 35,513 2.61 1.76 3.63 2.92 17.87
ROA 35,184 0.01 0.05 0.22 -2.79 13.26
Effective Tax Rate 35,498 0.20 0.30 0.33 -1.99 13.98
Cash/Interest Expenses 26,031 186.11 5.11 800.02 6.38 45.92
Dividend Yield 35,588 0.01 0.00 0.03 3.09 14.45
Financial Deficit/Sales 16,328 0.47 0.00 2.47 7.00 54.49
Cash Flow/PPE 33,049 -0.54 0.32 6.03 -4.54 29.50
Tobin's Q 35,431 1.84 1.30 1.50 3.01 13.67
Net Working Capital/Assets 27,488 0.05 0.03 0.18 -0.15 4.06
R&D (millions) 35,596 27.06 0.00 106.17 6.18 43.89
R&D/Sales 35,099 22.76% 0.00% 111.88% 7.10 55.50
Firm Age (years) 19,670 7.99 7.00 5.32 0.57 2.80
Sales Growth 23,224 9.95% 5.67% 36.25% 2.81 16.78
Neg. Earn. Dummy 35,500 0.32 0.00 0.47 0.79 1.62
Retained Earnings/Assets 34,949 -0.40 0.05 1.73 -4.17 22.67
S&P 500 Return (%) 35,596 -1.49 3.00 19.76 -0.22 2.21
Default Spread between Baa and Aaa Bonds (%) 35,596 1.24 1.03 0.68 2.49 8.04
One-Year Swap (%) 35,596 3.14 2.45 1.82 0.26 1.67
VIX (%) 35,596 22.34 22.50 8.44 0.75 3.49
Industrial Production Growth (%) 35,596 -0.61 1.70 4.58 -1.43 4.05
Panel B: Corporate Control Variables
Panel C: Macroeconomic Variables
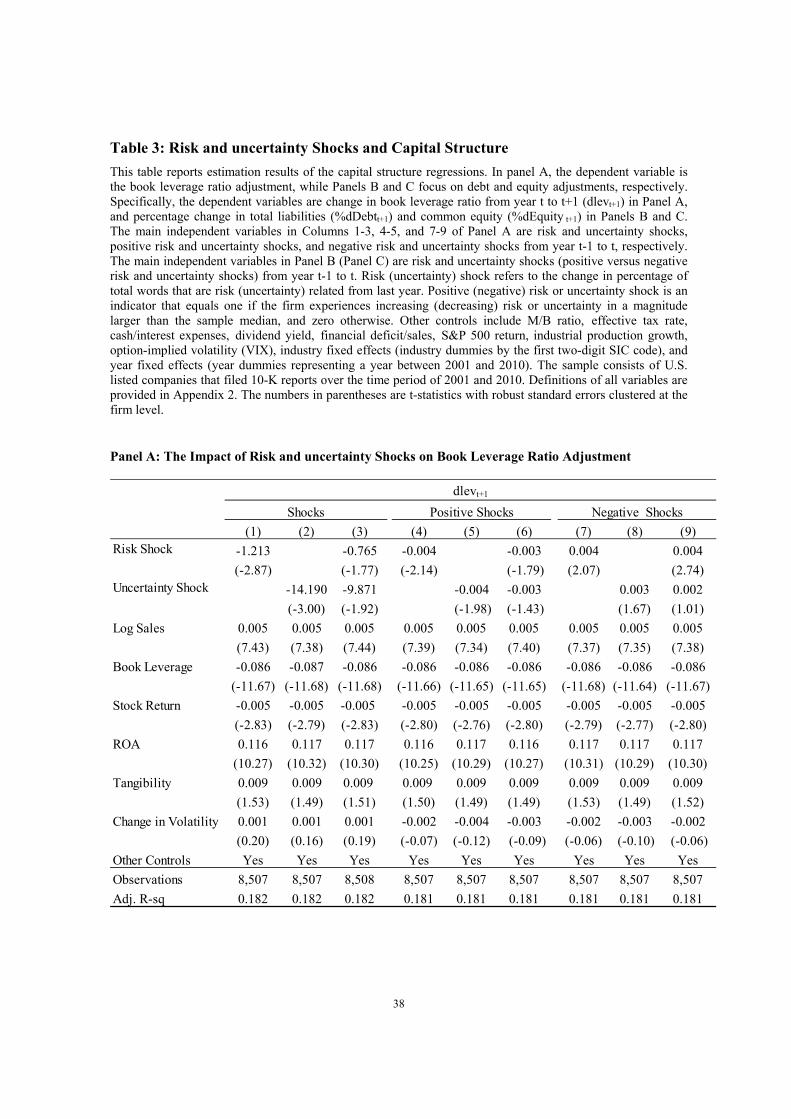
38
Table 3: Risk and uncertainty Shocks and Capital Structure
This table reports estimation results of the capital structure regressions. In panel A, the dependent variable is the book leverage ratio adjustment, while Panels B and C focus on debt and equity adjustments, respectively. Specifically, the dependent variables are change in book leverage ratio from year t to t+1 (dlevt+1) in Panel A, and percentage change in total liabilities (%dDebtt+1) and common equity (%dEquity t+1) in Panels B and C. The main independent variables in Columns 1-3, 4-5, and 7-9 of Panel A are risk and uncertainty shocks, positive risk and uncertainty shocks, and negative risk and uncertainty shocks from year t-1 to t, respectively. The main independent variables in Panel B (Panel C) are risk and uncertainty shocks (positive versus negative risk and uncertainty shocks) from year t-1 to t. Risk (uncertainty) shock refers to the change in percentage of total words that are risk (uncertainty) related from last year. Positive (negative) risk or uncertainty shock is an indicator that equals one if the firm experiences increasing (decreasing) risk or uncertainty in a magnitude larger than the sample median, and zero otherwise. Other controls include M/B ratio, effective tax rate, cash/interest expenses, dividend yield, financial deficit/sales, S&P 500 return, industrial production growth, option-implied volatility (VIX), industry fixed effects (industry dummies by the first two-digit SIC code), and year fixed effects (year dummies representing a year between 2001 and 2010). The sample consists of U.S. listed companies that filed 10-K reports over the time period of 2001 and 2010. Definitions of all variables are provided in Appendix 2. The numbers in parentheses are t-statistics with robust standard errors clustered at the firm level.
Panel A: The Impact of Risk and uncertainty Shocks on Book Leverage Ratio Adjustment
(1) (2) (3) (4) (5) (6) (7) (8) (9)
-1.213 -0.765 -0.004 -0.003 0.004 0.004
(-2.87) (-1.77) (-2.14) (-1.79) (2.07) (2.74)
-14.190 -9.871 -0.004 -0.003 0.003 0.002
(-3.00) (-1.92) (-1.98) (-1.43) (1.67) (1.01)
Log Sales 0.005 0.005 0.005 0.005 0.005 0.005 0.005 0.005 0.005
(7.43) (7.38) (7.44) (7.39) (7.34) (7.40) (7.37) (7.35) (7.38)
Book Leverage -0.086 -0.087 -0.086 -0.086 -0.086 -0.086 -0.086 -0.086 -0.086
(-11.67) (-11.68) (-11.68) (-11.66) (-11.65) (-11.65) (-11.68) (-11.64) (-11.67)
Stock Return -0.005 -0.005 -0.005 -0.005 -0.005 -0.005 -0.005 -0.005 -0.005
(-2.83) (-2.79) (-2.83) (-2.80) (-2.76) (-2.80) (-2.79) (-2.77) (-2.80)
ROA 0.116 0.117 0.117 0.116 0.117 0.116 0.117 0.117 0.117
(10.27) (10.32) (10.30) (10.25) (10.29) (10.27) (10.31) (10.29) (10.30)
Tangibility 0.009 0.009 0.009 0.009 0.009 0.009 0.009 0.009 0.009
(1.53) (1.49) (1.51) (1.50) (1.49) (1.49) (1.53) (1.49) (1.52)
Change in Volatility 0.001 0.001 0.001 -0.002 -0.004 -0.003 -0.002 -0.003 -0.002
(0.20) (0.16) (0.19) (-0.07) (-0.12) (-0.09) (-0.06) (-0.10) (-0.06)
Other Controls Yes Yes Yes Yes Yes Yes Yes Yes Yes
Observations 8,507 8,507 8,508 8,507 8,507 8,507 8,507 8,507 8,507
Adj. R-sq 0.182 0.182 0.182 0.181 0.181 0.181 0.181 0.181 0.181
Uncertainty Shock
dlevt+1
Shocks Positive Shocks Negative Shocks
Risk Shock
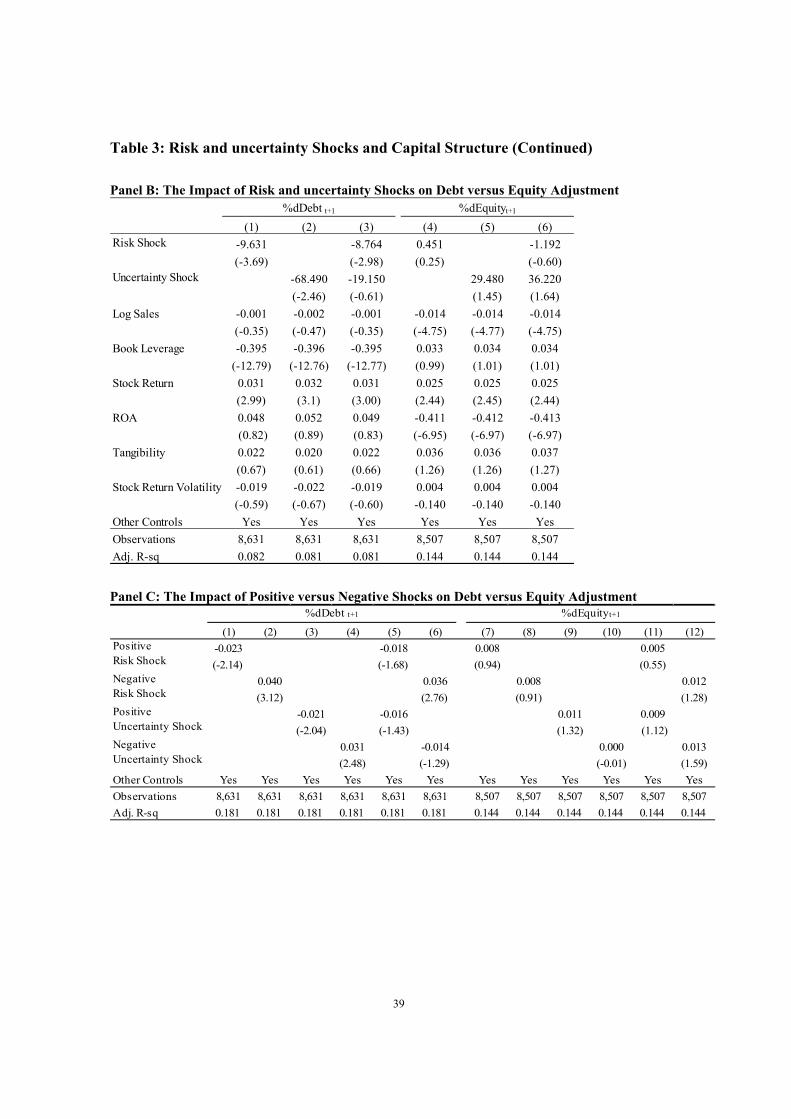
39
Table 3: Risk and uncertainty Shocks and Capital Structure (Continued)
Panel B: The Impact of Risk and uncertainty Shocks on Debt versus Equity Adjustment
(1) (2) (3) (4) (5) (6)
-9.631 -8.764 0.451 -1.192
(-3.69) (-2.98) (0.25) (-0.60)
-68.490 -19.150 29.480 36.220
(-2.46) (-0.61) (1.45) (1.64)
Log Sales -0.001 -0.002 -0.001 -0.014 -0.014 -0.014
(-0.35) (-0.47) (-0.35) (-4.75) (-4.77) (-4.75)
Book Leverage -0.395 -0.396 -0.395 0.033 0.034 0.034
(-12.79) (-12.76) (-12.77) (0.99) (1.01) (1.01)
Stock Return 0.031 0.032 0.031 0.025 0.025 0.025
(2.99) (3.1) (3.00) (2.44) (2.45) (2.44)
ROA 0.048 0.052 0.049 -0.411 -0.412 -0.413
(0.82) (0.89) (0.83) (-6.95) (-6.97) (-6.97)
Tangibility 0.022 0.020 0.022 0.036 0.036 0.037
(0.67) (0.61) (0.66) (1.26) (1.26) (1.27)
Stock Return Volatility -0.019 -0.022 -0.019 0.004 0.004 0.004
(-0.59) (-0.67) (-0.60) -0.140 -0.140 -0.140
Other Controls Yes Yes Yes Yes Yes Yes
Observations 8,631 8,631 8,631 8,507 8,507 8,507
Adj. R-sq 0.082 0.081 0.081 0.144 0.144 0.144
%dDebt t+1 %dEquityt+1
Risk Shock
Uncertainty Shock
Panel C: The Impact of Positive versus Negative Shocks on Debt versus Equity Adjustment
(1) (2) (3) (4) (5) (6) (7) (8) (9) (10) (11) (12)
-0.023 -0.018 0.008 0.005
(-2.14) (-1.68) (0.94) (0.55)
0.040 0.036 0.008 0.012
(3.12) (2.76) (0.91) (1.28)
-0.021 -0.016 0.011 0.009
(-2.04) (-1.43) (1.32) (1.12)
0.031 -0.014 0.000 0.013
(2.48) (-1.29) (-0.01) (1.59)
Other Controls Yes Yes Yes Yes Yes Yes Yes Yes Yes Yes Yes Yes
Observations 8,631 8,631 8,631 8,631 8,631 8,631 8,507 8,507 8,507 8,507 8,507 8,507
Adj. R-sq 0.181 0.181 0.181 0.181 0.181 0.181 0.144 0.144 0.144 0.144 0.144 0.144
NegativeUncertainty Shock
%dEquityt+1%dDebt t+1
PositiveRisk Shock
NegativeRisk Shock
PositiveUncertainty Shock
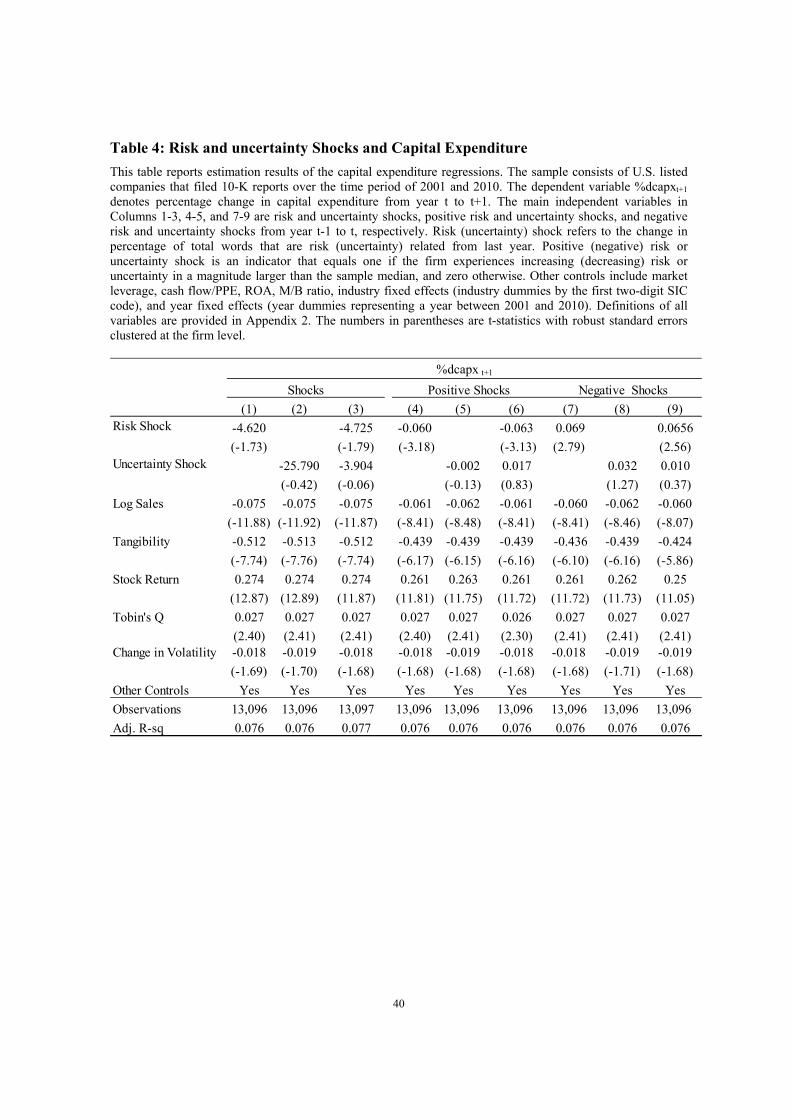
40
Table 4: Risk and uncertainty Shocks and Capital Expenditure
This table reports estimation results of the capital expenditure regressions. The sample consists of U.S. listed companies that filed 10-K reports over the time period of 2001 and 2010. The dependent variable %dcapxt+1 denotes percentage change in capital expenditure from year t to t+1. The main independent variables in Columns 1-3, 4-5, and 7-9 are risk and uncertainty shocks, positive risk and uncertainty shocks, and negative risk and uncertainty shocks from year t-1 to t, respectively. Risk (uncertainty) shock refers to the change in percentage of total words that are risk (uncertainty) related from last year. Positive (negative) risk or uncertainty shock is an indicator that equals one if the firm experiences increasing (decreasing) risk or uncertainty in a magnitude larger than the sample median, and zero otherwise. Other controls include market leverage, cash flow/PPE, ROA, M/B ratio, industry fixed effects (industry dummies by the first two-digit SIC code), and year fixed effects (year dummies representing a year between 2001 and 2010). Definitions of all variables are provided in Appendix 2. The numbers in parentheses are t-statistics with robust standard errors clustered at the firm level.
(1) (2) (3) (4) (5) (6) (7) (8) (9)
-4.620 -4.725 -0.060 -0.063 0.069 0.0656
(-1.73) (-1.79) (-3.18) (-3.13) (2.79) (2.56)Uncertainty Shock -25.790 -3.904 -0.002 0.017 0.032 0.010
(-0.42) (-0.06) (-0.13) (0.83) (1.27) (0.37)
Log Sales -0.075 -0.075 -0.075 -0.061 -0.062 -0.061 -0.060 -0.062 -0.060
(-11.88) (-11.92) (-11.87) (-8.41) (-8.48) (-8.41) (-8.41) (-8.46) (-8.07)
Tangibility -0.512 -0.513 -0.512 -0.439 -0.439 -0.439 -0.436 -0.439 -0.424
(-7.74) (-7.76) (-7.74) (-6.17) (-6.15) (-6.16) (-6.10) (-6.16) (-5.86)
Stock Return 0.274 0.274 0.274 0.261 0.263 0.261 0.261 0.262 0.25
(12.87) (12.89) (11.87) (11.81) (11.75) (11.72) (11.72) (11.73) (11.05)
Tobin's Q 0.027 0.027 0.027 0.027 0.027 0.026 0.027 0.027 0.027
(2.40) (2.41) (2.41) (2.40) (2.41) (2.30) (2.41) (2.41) (2.41)Change in Volatility -0.018 -0.019 -0.018 -0.018 -0.019 -0.018 -0.018 -0.019 -0.019
(-1.69) (-1.70) (-1.68) (-1.68) (-1.68) (-1.68) (-1.68) (-1.71) (-1.68)
Other Controls Yes Yes Yes Yes Yes Yes Yes Yes Yes
Observations 13,096 13,096 13,097 13,096 13,096 13,096 13,096 13,096 13,096
Adj. R-sq 0.076 0.076 0.077 0.076 0.076 0.076 0.076 0.076 0.076
%dcapx t+1
Shocks Positive Shocks Negative Shocks
Risk Shock
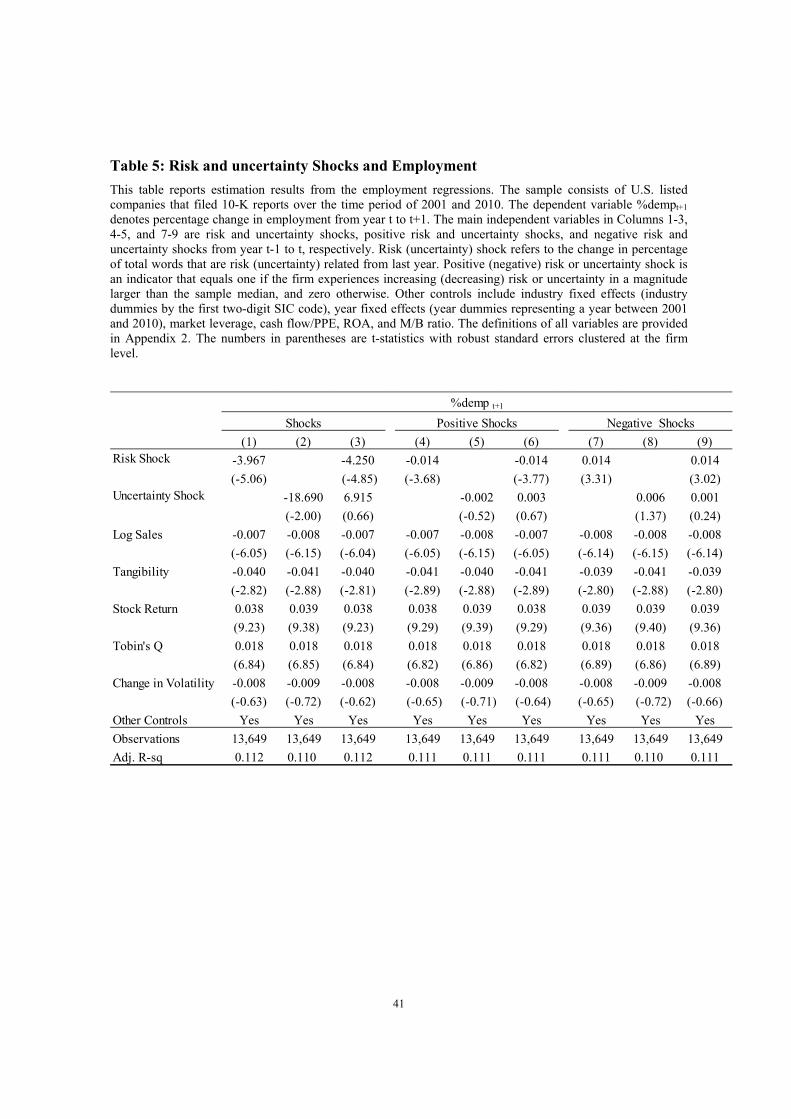
41
Table 5: Risk and uncertainty Shocks and Employment
This table reports estimation results from the employment regressions. The sample consists of U.S. listed companies that filed 10-K reports over the time period of 2001 and 2010. The dependent variable %dempt+1 denotes percentage change in employment from year t to t+1. The main independent variables in Columns 1-3, 4-5, and 7-9 are risk and uncertainty shocks, positive risk and uncertainty shocks, and negative risk and uncertainty shocks from year t-1 to t, respectively. Risk (uncertainty) shock refers to the change in percentage of total words that are risk (uncertainty) related from last year. Positive (negative) risk or uncertainty shock is an indicator that equals one if the firm experiences increasing (decreasing) risk or uncertainty in a magnitude larger than the sample median, and zero otherwise. Other controls include industry fixed effects (industry dummies by the first two-digit SIC code), year fixed effects (year dummies representing a year between 2001 and 2010), market leverage, cash flow/PPE, ROA, and M/B ratio. The definitions of all variables are provided in Appendix 2. The numbers in parentheses are t-statistics with robust standard errors clustered at the firm level.
(1) (2) (3) (4) (5) (6) (7) (8) (9)
-3.967 -4.250 -0.014 -0.014 0.014 0.014
(-5.06) (-4.85) (-3.68) (-3.77) (3.31) (3.02)
-18.690 6.915 -0.002 0.003 0.006 0.001
(-2.00) (0.66) (-0.52) (0.67) (1.37) (0.24)
Log Sales -0.007 -0.008 -0.007 -0.007 -0.008 -0.007 -0.008 -0.008 -0.008
(-6.05) (-6.15) (-6.04) (-6.05) (-6.15) (-6.05) (-6.14) (-6.15) (-6.14)
Tangibility -0.040 -0.041 -0.040 -0.041 -0.040 -0.041 -0.039 -0.041 -0.039
(-2.82) (-2.88) (-2.81) (-2.89) (-2.88) (-2.89) (-2.80) (-2.88) (-2.80)
Stock Return 0.038 0.039 0.038 0.038 0.039 0.038 0.039 0.039 0.039
(9.23) (9.38) (9.23) (9.29) (9.39) (9.29) (9.36) (9.40) (9.36)
Tobin's Q 0.018 0.018 0.018 0.018 0.018 0.018 0.018 0.018 0.018
(6.84) (6.85) (6.84) (6.82) (6.86) (6.82) (6.89) (6.86) (6.89)
Change in Volatility -0.008 -0.009 -0.008 -0.008 -0.009 -0.008 -0.008 -0.009 -0.008
(-0.63) (-0.72) (-0.62) (-0.65) (-0.71) (-0.64) (-0.65) (-0.72) (-0.66)
Other Controls Yes Yes Yes Yes Yes Yes Yes Yes Yes
Observations 13,649 13,649 13,649 13,649 13,649 13,649 13,649 13,649 13,649
Adj. R-sq 0.112 0.110 0.112 0.111 0.111 0.111 0.111 0.110 0.111
Uncertainty Shock
%demp t+1
Shocks Positive Shocks Negative Shocks
Risk Shock
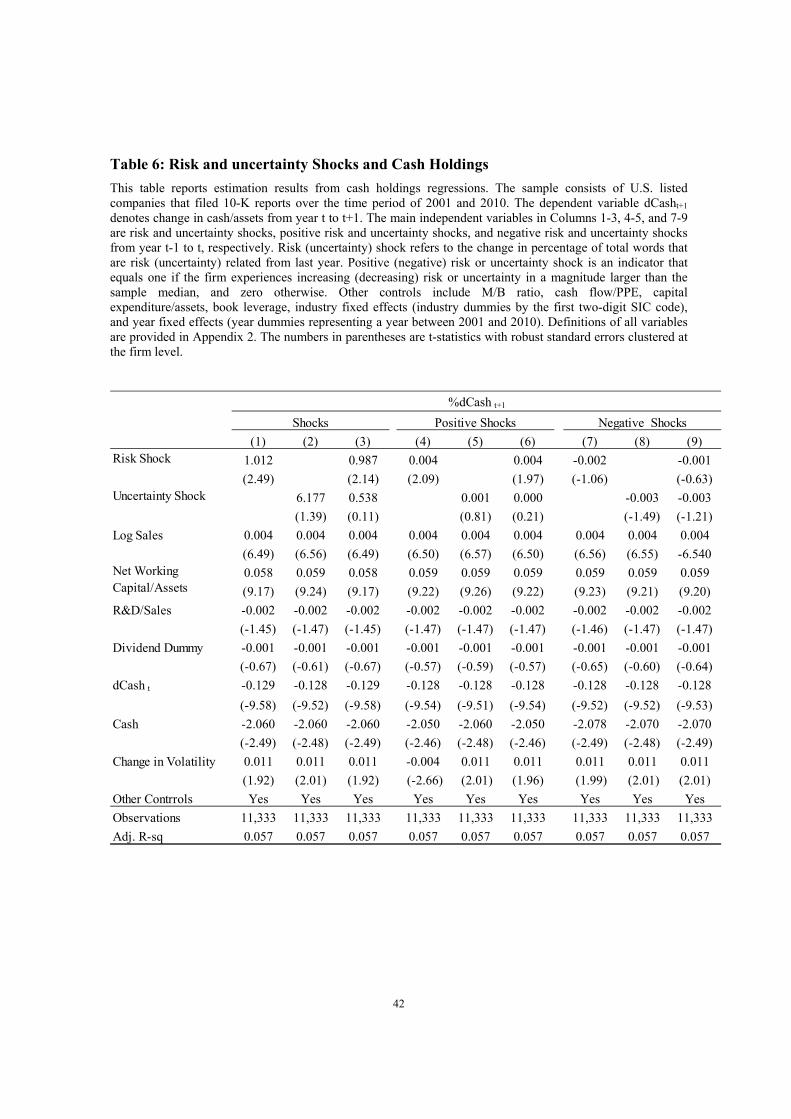
42
Table 6: Risk and uncertainty Shocks and Cash Holdings
This table reports estimation results from cash holdings regressions. The sample consists of U.S. listed companies that filed 10-K reports over the time period of 2001 and 2010. The dependent variable dCasht+1 denotes change in cash/assets from year t to t+1. The main independent variables in Columns 1-3, 4-5, and 7-9 are risk and uncertainty shocks, positive risk and uncertainty shocks, and negative risk and uncertainty shocks from year t-1 to t, respectively. Risk (uncertainty) shock refers to the change in percentage of total words that are risk (uncertainty) related from last year. Positive (negative) risk or uncertainty shock is an indicator that equals one if the firm experiences increasing (decreasing) risk or uncertainty in a magnitude larger than the sample median, and zero otherwise. Other controls include M/B ratio, cash flow/PPE, capital expenditure/assets, book leverage, industry fixed effects (industry dummies by the first two-digit SIC code), and year fixed effects (year dummies representing a year between 2001 and 2010). Definitions of all variables are provided in Appendix 2. The numbers in parentheses are t-statistics with robust standard errors clustered at the firm level.
(1) (2) (3) (4) (5) (6) (7) (8) (9)
1.012 0.987 0.004 0.004 -0.002 -0.001
(2.49) (2.14) (2.09) (1.97) (-1.06) (-0.63)Uncertainty Shock 6.177 0.538 0.001 0.000 -0.003 -0.003
(1.39) (0.11) (0.81) (0.21) (-1.49) (-1.21)
Log Sales 0.004 0.004 0.004 0.004 0.004 0.004 0.004 0.004 0.004
(6.49) (6.56) (6.49) (6.50) (6.57) (6.50) (6.56) (6.55) -6.540
0.058 0.059 0.058 0.059 0.059 0.059 0.059 0.059 0.059
(9.17) (9.24) (9.17) (9.22) (9.26) (9.22) (9.23) (9.21) (9.20)
R&D/Sales -0.002 -0.002 -0.002 -0.002 -0.002 -0.002 -0.002 -0.002 -0.002
(-1.45) (-1.47) (-1.45) (-1.47) (-1.47) (-1.47) (-1.46) (-1.47) (-1.47)
Dividend Dummy -0.001 -0.001 -0.001 -0.001 -0.001 -0.001 -0.001 -0.001 -0.001
(-0.67) (-0.61) (-0.67) (-0.57) (-0.59) (-0.57) (-0.65) (-0.60) (-0.64)
dCash t -0.129 -0.128 -0.129 -0.128 -0.128 -0.128 -0.128 -0.128 -0.128
(-9.58) (-9.52) (-9.58) (-9.54) (-9.51) (-9.54) (-9.52) (-9.52) (-9.53)
Cash -2.060 -2.060 -2.060 -2.050 -2.060 -2.050 -2.078 -2.070 -2.070
(-2.49) (-2.48) (-2.49) (-2.46) (-2.48) (-2.46) (-2.49) (-2.48) (-2.49)
Change in Volatility 0.011 0.011 0.011 -0.004 0.011 0.011 0.011 0.011 0.011
(1.92) (2.01) (1.92) (-2.66) (2.01) (1.96) (1.99) (2.01) (2.01)
Other Contrrols Yes Yes Yes Yes Yes Yes Yes Yes Yes
Observations 11,333 11,333 11,333 11,333 11,333 11,333 11,333 11,333 11,333
Adj. R-sq 0.057 0.057 0.057 0.057 0.057 0.057 0.057 0.057 0.057
Risk Shock
Net WorkingCapital/Assets
%dCash t+1
Shocks Positive Shocks Negative Shocks
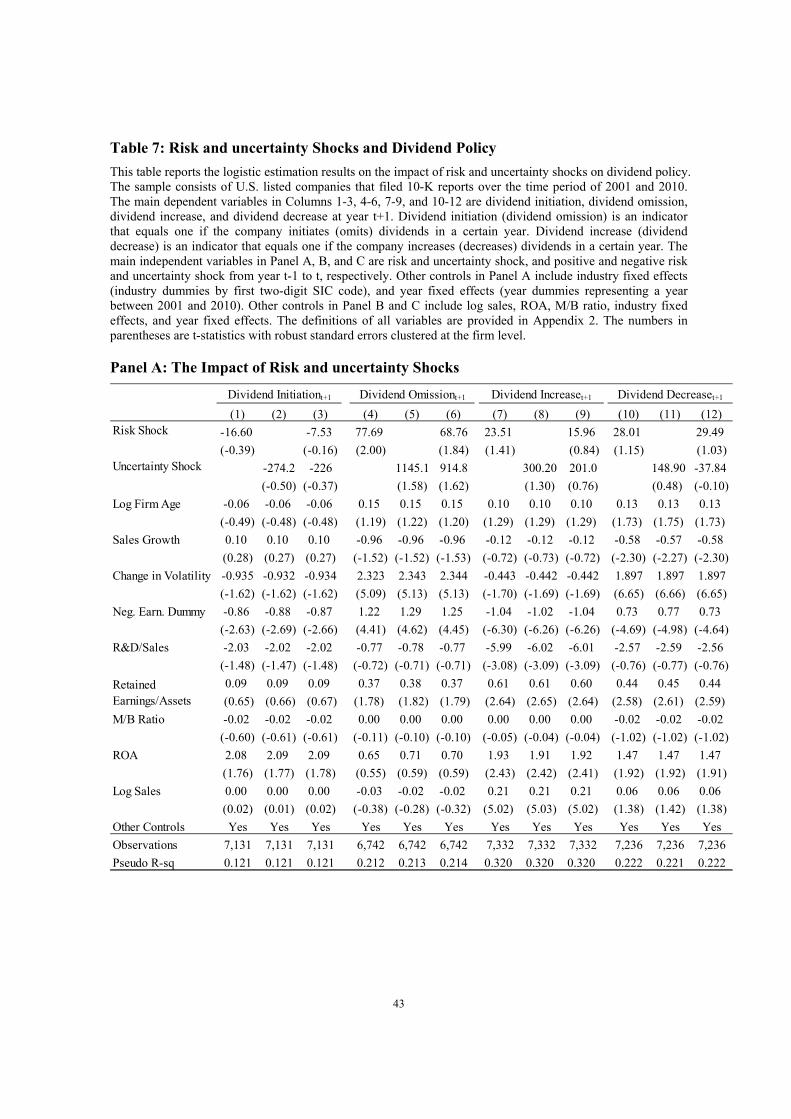
43
Table 7: Risk and uncertainty Shocks and Dividend Policy
This table reports the logistic estimation results on the impact of risk and uncertainty shocks on dividend policy. The sample consists of U.S. listed companies that filed 10-K reports over the time period of 2001 and 2010. The main dependent variables in Columns 1-3, 4-6, 7-9, and 10-12 are dividend initiation, dividend omission, dividend increase, and dividend decrease at year t+1. Dividend initiation (dividend omission) is an indicator that equals one if the company initiates (omits) dividends in a certain year. Dividend increase (dividend decrease) is an indicator that equals one if the company increases (decreases) dividends in a certain year. The main independent variables in Panel A, B, and C are risk and uncertainty shock, and positive and negative risk and uncertainty shock from year t-1 to t, respectively. Other controls in Panel A include industry fixed effects (industry dummies by first two-digit SIC code), and year fixed effects (year dummies representing a year between 2001 and 2010). Other controls in Panel B and C include log sales, ROA, M/B ratio, industry fixed effects, and year fixed effects. The definitions of all variables are provided in Appendix 2. The numbers in parentheses are t-statistics with robust standard errors clustered at the firm level.
Panel A: The Impact of Risk and uncertainty Shocks
(1) (2) (3) (4) (5) (6) (7) (8) (9) (10) (11) (12)
-16.60 -7.53 77.69 68.76 23.51 15.96 28.01 29.49
(-0.39) (-0.16) (2.00) (1.84) (1.41) (0.84) (1.15) (1.03)Uncertainty Shock -274.2 -226 1145.1 914.8 300.20 201.0 148.90 -37.84
(-0.50) (-0.37) (1.58) (1.62) (1.30) (0.76) (0.48) (-0.10)
Log Firm Age -0.06 -0.06 -0.06 0.15 0.15 0.15 0.10 0.10 0.10 0.13 0.13 0.13
(-0.49) (-0.48) (-0.48) (1.19) (1.22) (1.20) (1.29) (1.29) (1.29) (1.73) (1.75) (1.73)
Sales Growth 0.10 0.10 0.10 -0.96 -0.96 -0.96 -0.12 -0.12 -0.12 -0.58 -0.57 -0.58
(0.28) (0.27) (0.27) (-1.52) (-1.52) (-1.53) (-0.72) (-0.73) (-0.72) (-2.30) (-2.27) (-2.30)
Change in Volatility -0.935 -0.932 -0.934 2.323 2.343 2.344 -0.443 -0.442 -0.442 1.897 1.897 1.897
(-1.62) (-1.62) (-1.62) (5.09) (5.13) (5.13) (-1.70) (-1.69) (-1.69) (6.65) (6.66) (6.65)
Neg. Earn. Dummy -0.86 -0.88 -0.87 1.22 1.29 1.25 -1.04 -1.02 -1.04 0.73 0.77 0.73
(-2.63) (-2.69) (-2.66) (4.41) (4.62) (4.45) (-6.30) (-6.26) (-6.26) (-4.69) (-4.98) (-4.64)
R&D/Sales -2.03 -2.02 -2.02 -0.77 -0.78 -0.77 -5.99 -6.02 -6.01 -2.57 -2.59 -2.56
(-1.48) (-1.47) (-1.48) (-0.72) (-0.71) (-0.71) (-3.08) (-3.09) (-3.09) (-0.76) (-0.77) (-0.76)
0.09 0.09 0.09 0.37 0.38 0.37 0.61 0.61 0.60 0.44 0.45 0.44
(0.65) (0.66) (0.67) (1.78) (1.82) (1.79) (2.64) (2.65) (2.64) (2.58) (2.61) (2.59)
M/B Ratio -0.02 -0.02 -0.02 0.00 0.00 0.00 0.00 0.00 0.00 -0.02 -0.02 -0.02
(-0.60) (-0.61) (-0.61) (-0.11) (-0.10) (-0.10) (-0.05) (-0.04) (-0.04) (-1.02) (-1.02) (-1.02)
ROA 2.08 2.09 2.09 0.65 0.71 0.70 1.93 1.91 1.92 1.47 1.47 1.47
(1.76) (1.77) (1.78) (0.55) (0.59) (0.59) (2.43) (2.42) (2.41) (1.92) (1.92) (1.91)
Log Sales 0.00 0.00 0.00 -0.03 -0.02 -0.02 0.21 0.21 0.21 0.06 0.06 0.06
(0.02) (0.01) (0.02) (-0.38) (-0.28) (-0.32) (5.02) (5.03) (5.02) (1.38) (1.42) (1.38)
Other Controls Yes Yes Yes Yes Yes Yes Yes Yes Yes Yes Yes Yes
Observations 7,131 7,131 7,131 6,742 6,742 6,742 7,332 7,332 7,332 7,236 7,236 7,236
Pseudo R-sq 0.121 0.121 0.121 0.212 0.213 0.214 0.320 0.320 0.320 0.222 0.221 0.222
Risk Shock
RetainedEarnings/Assets
Dividend Initiationt+1 Dividend Omissiont+1 Dividend Increaset+1 Dividend Decreaset+1
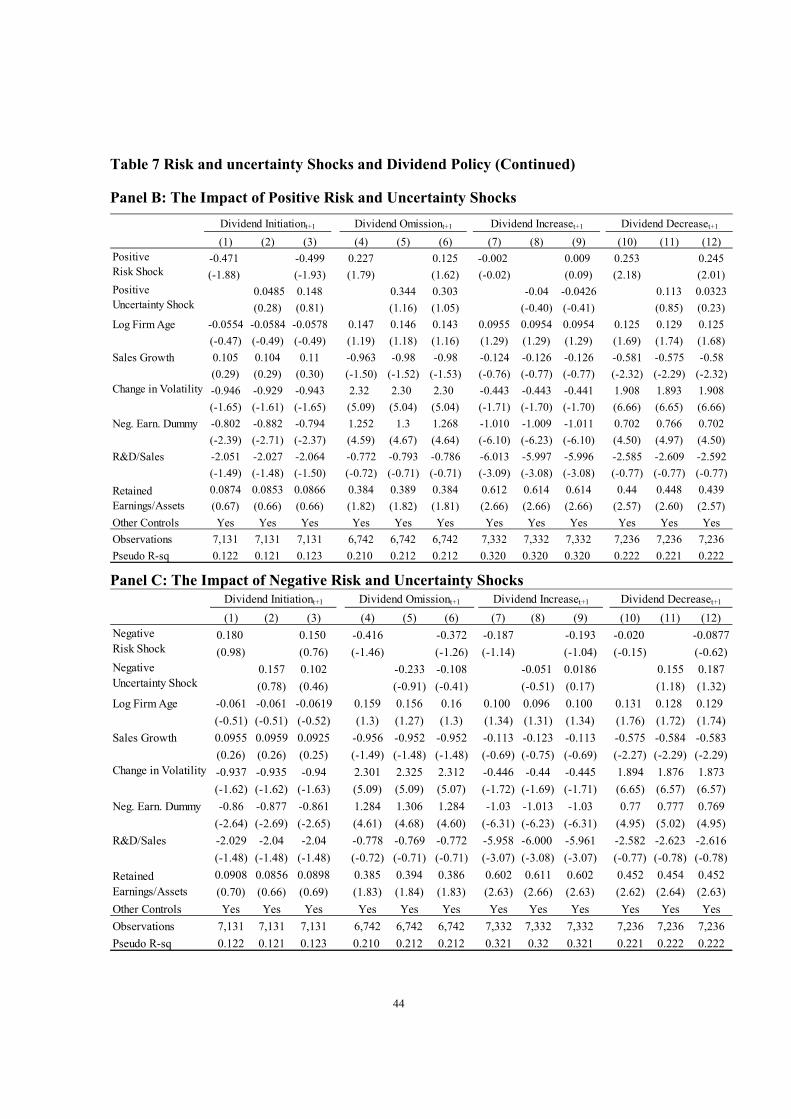
44
Table 7 Risk and uncertainty Shocks and Dividend Policy (Continued)
Panel B: The Impact of Positive Risk and Uncertainty Shocks
(1) (2) (3) (4) (5) (6) (7) (8) (9) (10) (11) (12)
-0.471 -0.499 0.227 0.125 -0.002 0.009 0.253 0.245
(-1.88) (-1.93) (1.79) (1.62) (-0.02) (0.09) (2.18) (2.01)
0.0485 0.148 0.344 0.303 -0.04 -0.0426 0.113 0.0323
(0.28) (0.81) (1.16) (1.05) (-0.40) (-0.41) (0.85) (0.23)
Log Firm Age -0.0554 -0.0584 -0.0578 0.147 0.146 0.143 0.0955 0.0954 0.0954 0.125 0.129 0.125
(-0.47) (-0.49) (-0.49) (1.19) (1.18) (1.16) (1.29) (1.29) (1.29) (1.69) (1.74) (1.68)
Sales Growth 0.105 0.104 0.11 -0.963 -0.98 -0.98 -0.124 -0.126 -0.126 -0.581 -0.575 -0.58
(0.29) (0.29) (0.30) (-1.50) (-1.52) (-1.53) (-0.76) (-0.77) (-0.77) (-2.32) (-2.29) (-2.32)
-0.946 -0.929 -0.943 2.32 2.30 2.30 -0.443 -0.443 -0.441 1.908 1.893 1.908
(-1.65) (-1.61) (-1.65) (5.09) (5.04) (5.04) (-1.71) (-1.70) (-1.70) (6.66) (6.65) (6.66)
Neg. Earn. Dummy -0.802 -0.882 -0.794 1.252 1.3 1.268 -1.010 -1.009 -1.011 0.702 0.766 0.702
(-2.39) (-2.71) (-2.37) (4.59) (4.67) (4.64) (-6.10) (-6.23) (-6.10) (4.50) (4.97) (4.50)
R&D/Sales -2.051 -2.027 -2.064 -0.772 -0.793 -0.786 -6.013 -5.997 -5.996 -2.585 -2.609 -2.592
(-1.49) (-1.48) (-1.50) (-0.72) (-0.71) (-0.71) (-3.09) (-3.08) (-3.08) (-0.77) (-0.77) (-0.77)
0.0874 0.0853 0.0866 0.384 0.389 0.384 0.612 0.614 0.614 0.44 0.448 0.439
(0.67) (0.66) (0.66) (1.82) (1.82) (1.81) (2.66) (2.66) (2.66) (2.57) (2.60) (2.57)
Other Controls Yes Yes Yes Yes Yes Yes Yes Yes Yes Yes Yes Yes
Observations 7,131 7,131 7,131 6,742 6,742 6,742 7,332 7,332 7,332 7,236 7,236 7,236
Pseudo R-sq 0.122 0.121 0.123 0.210 0.212 0.212 0.320 0.320 0.320 0.222 0.221 0.222
PositiveRisk Shock
PositiveUncertainty Shock
Change in Volatility
RetainedEarnings/Assets
Dividend Initiationt+1 Dividend Omissiont+1 Dividend Increaset+1 Dividend Decreaset+1
Panel C: The Impact of Negative Risk and Uncertainty Shocks
(1) (2) (3) (4) (5) (6) (7) (8) (9) (10) (11) (12)
0.180 0.150 -0.416 -0.372 -0.187 -0.193 -0.020 -0.0877
(0.98) (0.76) (-1.46) (-1.26) (-1.14) (-1.04) (-0.15) (-0.62)
0.157 0.102 -0.233 -0.108 -0.051 0.0186 0.155 0.187
(0.78) (0.46) (-0.91) (-0.41) (-0.51) (0.17) (1.18) (1.32)
Log Firm Age -0.061 -0.061 -0.0619 0.159 0.156 0.16 0.100 0.096 0.100 0.131 0.128 0.129
(-0.51) (-0.51) (-0.52) (1.3) (1.27) (1.3) (1.34) (1.31) (1.34) (1.76) (1.72) (1.74)
Sales Growth 0.0955 0.0959 0.0925 -0.956 -0.952 -0.952 -0.113 -0.123 -0.113 -0.575 -0.584 -0.583
(0.26) (0.26) (0.25) (-1.49) (-1.48) (-1.48) (-0.69) (-0.75) (-0.69) (-2.27) (-2.29) (-2.29)
-0.937 -0.935 -0.94 2.301 2.325 2.312 -0.446 -0.44 -0.445 1.894 1.876 1.873
(-1.62) (-1.62) (-1.63) (5.09) (5.09) (5.07) (-1.72) (-1.69) (-1.71) (6.65) (6.57) (6.57)
Neg. Earn. Dummy -0.86 -0.877 -0.861 1.284 1.306 1.284 -1.03 -1.013 -1.03 0.77 0.777 0.769
(-2.64) (-2.69) (-2.65) (4.61) (4.68) (4.60) (-6.31) (-6.23) (-6.31) (4.95) (5.02) (4.95)
R&D/Sales -2.029 -2.04 -2.04 -0.778 -0.769 -0.772 -5.958 -6.000 -5.961 -2.582 -2.623 -2.616
(-1.48) (-1.48) (-1.48) (-0.72) (-0.71) (-0.71) (-3.07) (-3.08) (-3.07) (-0.77) (-0.78) (-0.78)
0.0908 0.0856 0.0898 0.385 0.394 0.386 0.602 0.611 0.602 0.452 0.454 0.452
(0.70) (0.66) (0.69) (1.83) (1.84) (1.83) (2.63) (2.66) (2.63) (2.62) (2.64) (2.63)
Other Controls Yes Yes Yes Yes Yes Yes Yes Yes Yes Yes Yes Yes
Observations 7,131 7,131 7,131 6,742 6,742 6,742 7,332 7,332 7,332 7,236 7,236 7,236
Pseudo R-sq 0.122 0.121 0.123 0.210 0.212 0.212 0.321 0.32 0.321 0.221 0.222 0.222
NegativeRisk Shock
NegativeUncertainty Shock
Change in Volatility
RetainedEarnings/Assets
Dividend Initiationt+1 Dividend Omissiont+1 Dividend Increaset+1 Dividend Decreaset+1
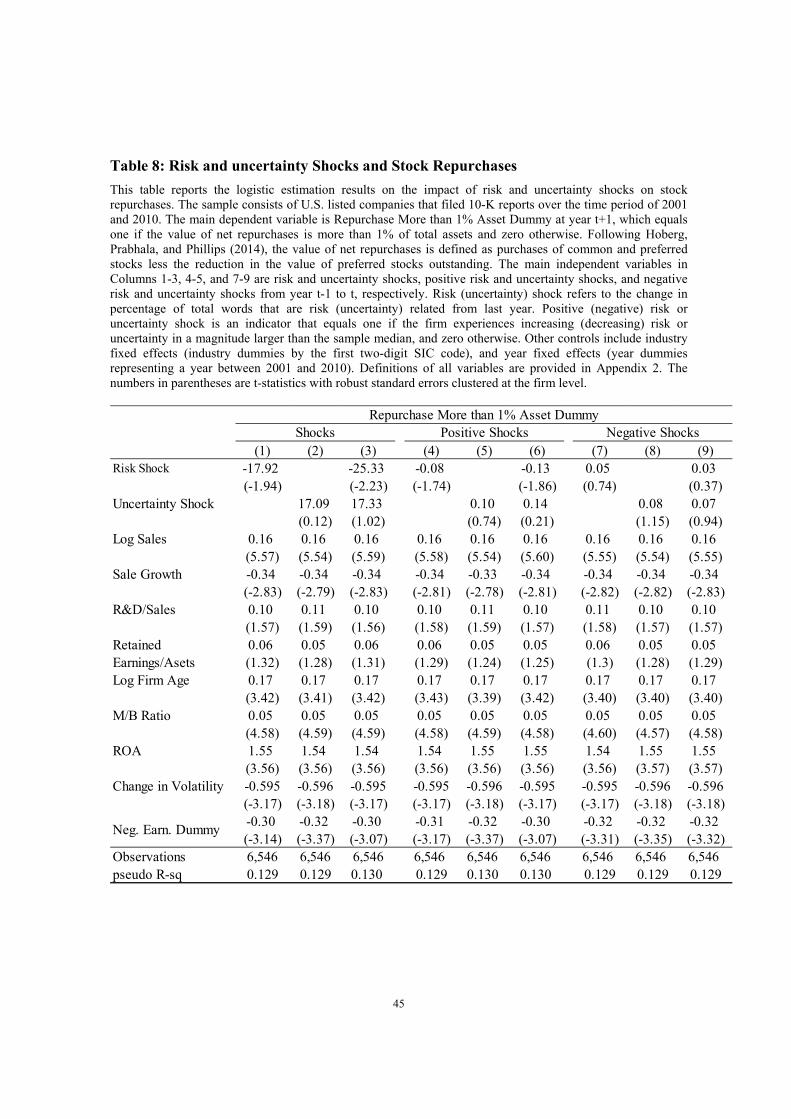
45
Table 8: Risk and uncertainty Shocks and Stock Repurchases
This table reports the logistic estimation results on the impact of risk and uncertainty shocks on stock repurchases. The sample consists of U.S. listed companies that filed 10-K reports over the time period of 2001 and 2010. The main dependent variable is Repurchase More than 1% Asset Dummy at year t+1, which equals one if the value of net repurchases is more than 1% of total assets and zero otherwise. Following Hoberg, Prabhala, and Phillips (2014), the value of net repurchases is defined as purchases of common and preferred stocks less the reduction in the value of preferred stocks outstanding. The main independent variables in Columns 1-3, 4-5, and 7-9 are risk and uncertainty shocks, positive risk and uncertainty shocks, and negative risk and uncertainty shocks from year t-1 to t, respectively. Risk (uncertainty) shock refers to the change in percentage of total words that are risk (uncertainty) related from last year. Positive (negative) risk or uncertainty shock is an indicator that equals one if the firm experiences increasing (decreasing) risk or uncertainty in a magnitude larger than the sample median, and zero otherwise. Other controls include industry fixed effects (industry dummies by the first two-digit SIC code), and year fixed effects (year dummies representing a year between 2001 and 2010). Definitions of all variables are provided in Appendix 2. The numbers in parentheses are t-statistics with robust standard errors clustered at the firm level.
(1) (2) (3) (4) (5) (6) (7) (8) (9)-17.92 -25.33 -0.08 -0.13 0.05 0.03(-1.94) (-2.23) (-1.74) (-1.86) (0.74) (0.37)
Uncertainty Shock 17.09 17.33 0.10 0.14 0.08 0.07(0.12) (1.02) (0.74) (0.21) (1.15) (0.94)
Log Sales 0.16 0.16 0.16 0.16 0.16 0.16 0.16 0.16 0.16(5.57) (5.54) (5.59) (5.58) (5.54) (5.60) (5.55) (5.54) (5.55)
Sale Growth -0.34 -0.34 -0.34 -0.34 -0.33 -0.34 -0.34 -0.34 -0.34(-2.83) (-2.79) (-2.83) (-2.81) (-2.78) (-2.81) (-2.82) (-2.82) (-2.83)
R&D/Sales 0.10 0.11 0.10 0.10 0.11 0.10 0.11 0.10 0.10(1.57) (1.59) (1.56) (1.58) (1.59) (1.57) (1.58) (1.57) (1.57)0.06 0.05 0.06 0.06 0.05 0.05 0.06 0.05 0.05(1.32) (1.28) (1.31) (1.29) (1.24) (1.25) (1.3) (1.28) (1.29)
Log Firm Age 0.17 0.17 0.17 0.17 0.17 0.17 0.17 0.17 0.17(3.42) (3.41) (3.42) (3.43) (3.39) (3.42) (3.40) (3.40) (3.40)
M/B Ratio 0.05 0.05 0.05 0.05 0.05 0.05 0.05 0.05 0.05(4.58) (4.59) (4.59) (4.58) (4.59) (4.58) (4.60) (4.57) (4.58)
ROA 1.55 1.54 1.54 1.54 1.55 1.55 1.54 1.55 1.55(3.56) (3.56) (3.56) (3.56) (3.56) (3.56) (3.56) (3.57) (3.57)
Change in Volatility -0.595 -0.596 -0.595 -0.595 -0.596 -0.595 -0.595 -0.596 -0.596(-3.17) (-3.18) (-3.17) (-3.17) (-3.18) (-3.17) (-3.17) (-3.18) (-3.18)-0.30 -0.32 -0.30 -0.31 -0.32 -0.30 -0.32 -0.32 -0.32(-3.14) (-3.37) (-3.07) (-3.17) (-3.37) (-3.07) (-3.31) (-3.35) (-3.32)
Observations 6,546 6,546 6,546 6,546 6,546 6,546 6,546 6,546 6,546pseudo R-sq 0.129 0.129 0.130 0.129 0.130 0.130 0.129 0.129 0.129
RetainedEarnings/Asets
Neg. Earn. Dummy
Repurchase More than 1% Asset DummyShocks Positive Shocks Negative Shocks
Risk Shock
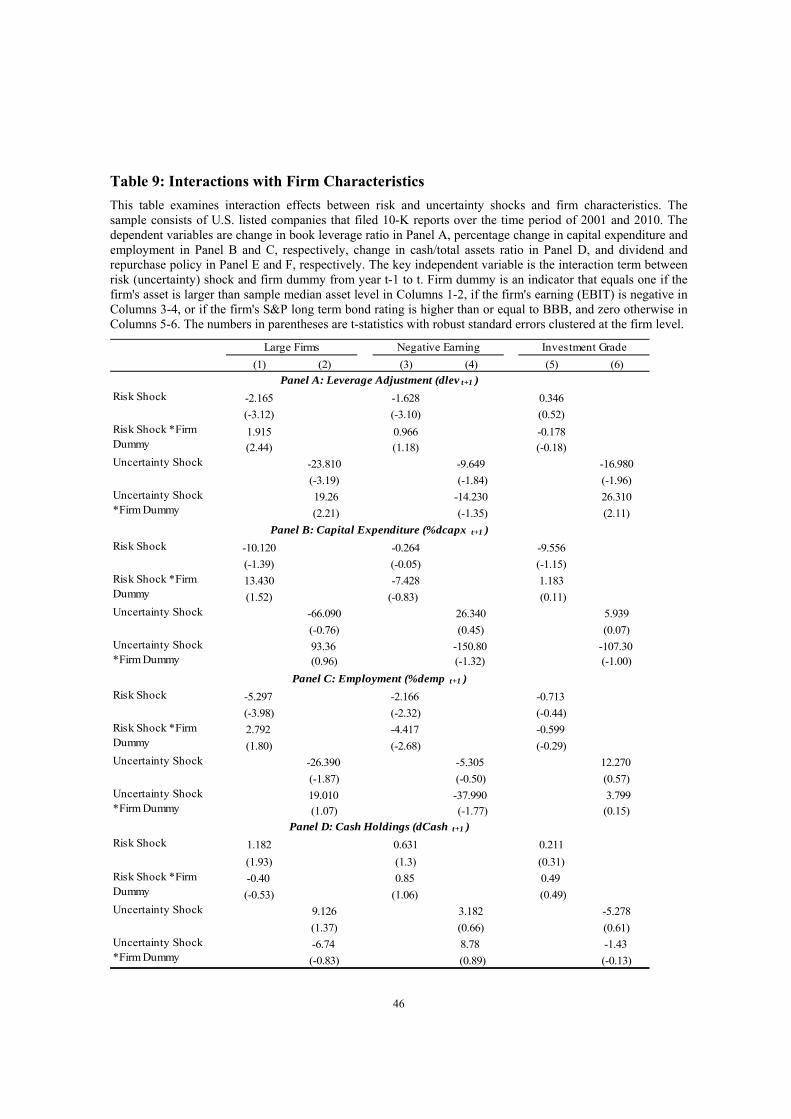
46
Table 9: Interactions with Firm Characteristics
This table examines interaction effects between risk and uncertainty shocks and firm characteristics. The sample consists of U.S. listed companies that filed 10-K reports over the time period of 2001 and 2010. The dependent variables are change in book leverage ratio in Panel A, percentage change in capital expenditure and employment in Panel B and C, respectively, change in cash/total assets ratio in Panel D, and dividend and repurchase policy in Panel E and F, respectively. The key independent variable is the interaction term between risk (uncertainty) shock and firm dummy from year t-1 to t. Firm dummy is an indicator that equals one if the firm's asset is larger than sample median asset level in Columns 1-2, if the firm's earning (EBIT) is negative in Columns 3-4, or if the firm's S&P long term bond rating is higher than or equal to BBB, and zero otherwise in Columns 5-6. The numbers in parentheses are t-statistics with robust standard errors clustered at the firm level.
(1) (2) (3) (4) (5) (6)
Risk Shock -2.165 -1.628 0.346
(-3.12) (-3.10) (0.52)
1.915 0.966 -0.178
(2.44) (1.18) (-0.18)Uncertainty Shock -23.810 -9.649 -16.980
(-3.19) (-1.84) (-1.96)
19.26 -14.230 26.310
(2.21) (-1.35) (2.11)
Risk Shock -10.120 -0.264 -9.556
(-1.39) (-0.05) (-1.15)
13.430 -7.428 1.183
(1.52) (-0.83) (0.11)Uncertainty Shock -66.090 26.340 5.939
(-0.76) (0.45) (0.07)
93.36 -150.80 -107.30(0.96) (-1.32) (-1.00)
Risk Shock -5.297 -2.166 -0.713
(-3.98) (-2.32) (-0.44)
2.792 -4.417 -0.599
(1.80) (-2.68) (-0.29)Uncertainty Shock -26.390 -5.305 12.270
(-1.87) (-0.50) (0.57)
19.010 -37.990 3.799 (1.07) (-1.77) (0.15)
Risk Shock 1.182 0.631 0.211
(1.93) (1.3) (0.31)
-0.40 0.85 0.49
(-0.53) (1.06) (0.49)Uncertainty Shock 9.126 3.182 -5.278
(1.37) (0.66) (0.61)
-6.74 8.78 -1.43
(-0.83) (0.89) (-0.13)
Risk Shock *FirmDummy
Uncertainty Shock*Firm Dummy
Negative Earning Investment GradeLarge Firms
Panel D: Cash Holdings (dCash t+1 )
Panel A: Leverage Adjustment (dlev t+1 )
Panel C: Employment (%demp t+1 )
Panel B: Capital Expenditure (%dcapx t+1 )
Risk Shock *FirmDummy
Uncertainty Shock*Firm Dummy
Risk Shock *FirmDummy
Uncertainty Shock*Firm Dummy
Risk Shock *FirmDummy
Uncertainty Shock*Firm Dummy
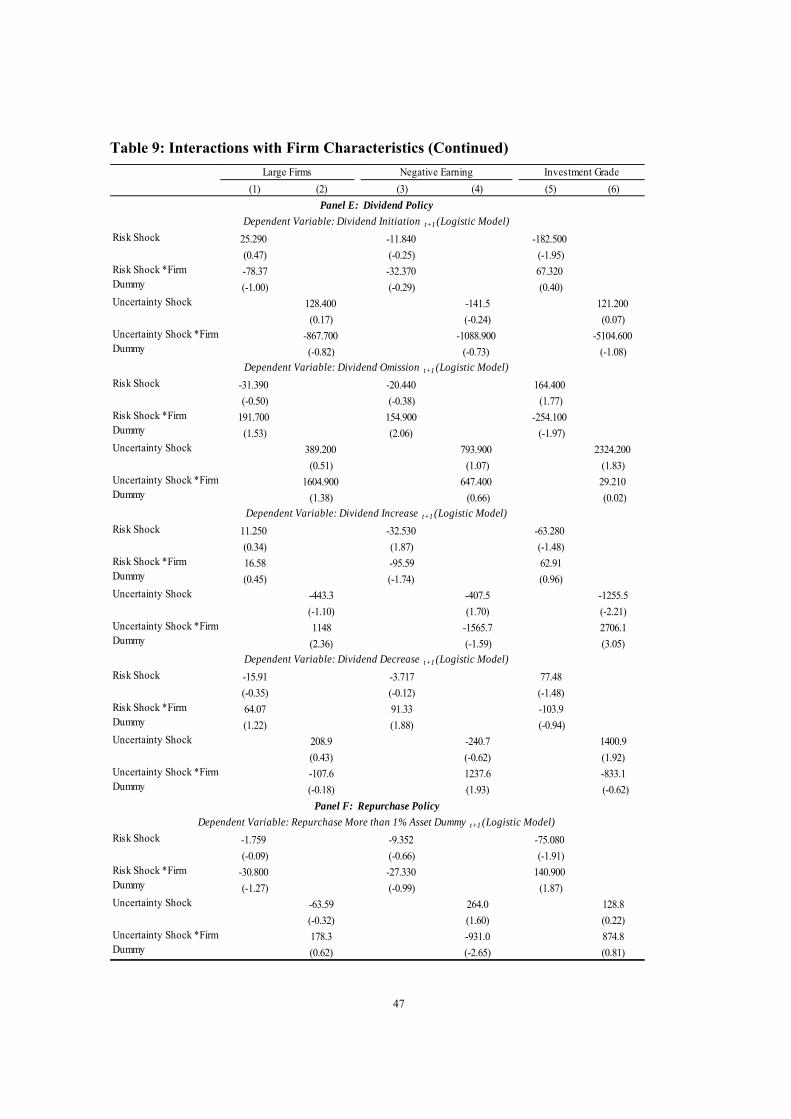
47
Table 9: Interactions with Firm Characteristics (Continued)
(1) (2) (3) (4) (5) (6)
Risk Shock 25.290 -11.840 -182.500
(0.47) (-0.25) (-1.95)
-78.37 -32.370 67.320
(-1.00) (-0.29) (0.40)Uncertainty Shock 128.400 -141.5 121.200
(0.17) (-0.24) (0.07)
-867.700 -1088.900 -5104.600
(-0.82) (-0.73) (-1.08)
Risk Shock -31.390 -20.440 164.400
(-0.50) (-0.38) (1.77)
191.700 154.900 -254.100
(1.53) (2.06) (-1.97)Uncertainty Shock 389.200 793.900 2324.200
(0.51) (1.07) (1.83)
1604.900 647.400 29.210
(1.38) (0.66) (0.02)
Risk Shock 11.250 -32.530 -63.280
(0.34) (1.87) (-1.48)
16.58 -95.59 62.91
(0.45) (-1.74) (0.96)Uncertainty Shock -443.3 -407.5 -1255.5
(-1.10) (1.70) (-2.21)
1148 -1565.7 2706.1
(2.36) (-1.59) (3.05)
Risk Shock -15.91 -3.717 77.48
(-0.35) (-0.12) (-1.48)
64.07 91.33 -103.9
(1.22) (1.88) (-0.94)Uncertainty Shock 208.9 -240.7 1400.9
(0.43) (-0.62) (1.92)
-107.6 1237.6 -833.1
(-0.18) (1.93) (-0.62)
Risk Shock -1.759 -9.352 -75.080
(-0.09) (-0.66) (-1.91)
-30.800 -27.330 140.900
(-1.27) (-0.99) (1.87)
-63.59 264.0 128.8
(-0.32) (1.60) (0.22)
178.3 -931.0 874.8
(0.62) (-2.65) (0.81)
Large Firms Negative Earning Investment Grade
Uncertainty Shock *FirmDummy
Dependent Variable: Dividend Initiation t+1 (Logistic Model)
Risk Shock *FirmDummy
Uncertainty Shock *FirmDummy
Dependent Variable: Dividend Omission t+1 (Logistic Model)
Panel E: Dividend Policy
Risk Shock *FirmDummy
Dependent Variable: Dividend Increase t+1 (Logistic Model)
Risk Shock *FirmDummy
Uncertainty Shock *FirmDummy
Dependent Variable: Dividend Decrease t+1 (Logistic Model)
Risk Shock *FirmDummy
Uncertainty Shock *FirmDummy
Uncertainty Shock *FirmDummy
Panel F: Repurchase Policy
Dependent Variable: Repurchase More than 1% Asset Dummy t+1 (Logistic Model)
Risk Shock *FirmDummy
Uncertainty Shock
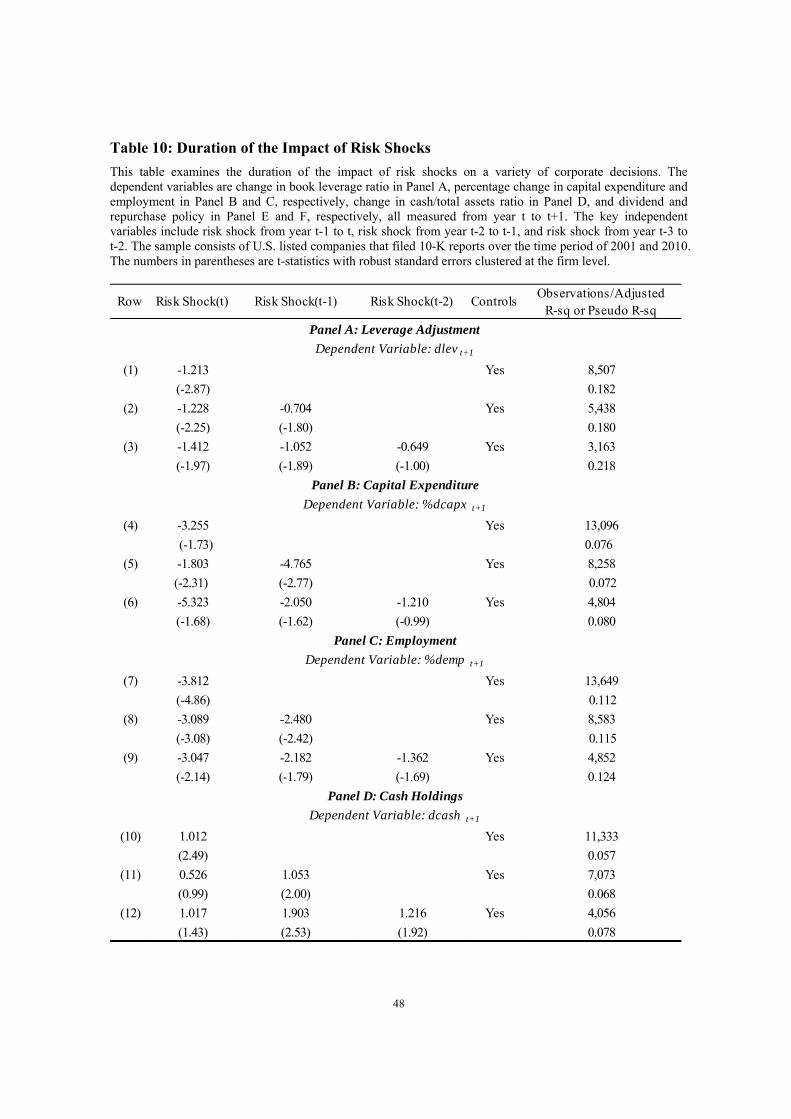
48
Table 10: Duration of the Impact of Risk Shocks
This table examines the duration of the impact of risk shocks on a variety of corporate decisions. The dependent variables are change in book leverage ratio in Panel A, percentage change in capital expenditure and employment in Panel B and C, respectively, change in cash/total assets ratio in Panel D, and dividend and repurchase policy in Panel E and F, respectively, all measured from year t to t+1. The key independent variables include risk shock from year t-1 to t, risk shock from year t-2 to t-1, and risk shock from year t-3 to t-2. The sample consists of U.S. listed companies that filed 10-K reports over the time period of 2001 and 2010. The numbers in parentheses are t-statistics with robust standard errors clustered at the firm level.
Row Risk Shock(t) Risk Shock(t-1) Risk Shock(t-2) ControlsObservations/Adjusted
R-sq or Pseudo R-sq
(1) -1.213 Yes 8,507
(-2.87) 0.182
(2) -1.228 -0.704 Yes 5,438
(-2.25) (-1.80) 0.180
(3) -1.412 -1.052 -0.649 Yes 3,163
(-1.97) (-1.89) (-1.00) 0.218
(4) -3.255 Yes 13,096
(-1.73) 0.076
(5) -1.803 -4.765 Yes 8,258
(-2.31) (-2.77) 0.072
(6) -5.323 -2.050 -1.210 Yes 4,804
(-1.68) (-1.62) (-0.99) 0.080
(7) -3.812 Yes 13,649
(-4.86) 0.112
(8) -3.089 -2.480 Yes 8,583
(-3.08) (-2.42) 0.115
(9) -3.047 -2.182 -1.362 Yes 4,852
(-2.14) (-1.79) (-1.69) 0.124
(10) 1.012 Yes 11,333
(2.49) 0.057
(11) 0.526 1.053 Yes 7,073
(0.99) (2.00) 0.068
(12) 1.017 1.903 1.216 Yes 4,056
(1.43) (2.53) (1.92) 0.078
Dependent Variable: %demp t+1
Panel D: Cash Holdings
Dependent Variable: dcash t+1
Panel A: Leverage Adjustment
Dependent Variable: dlev t+1
Panel B: Capital Expenditure
Dependent Variable: %dcapx t+1
Panel C: Employment
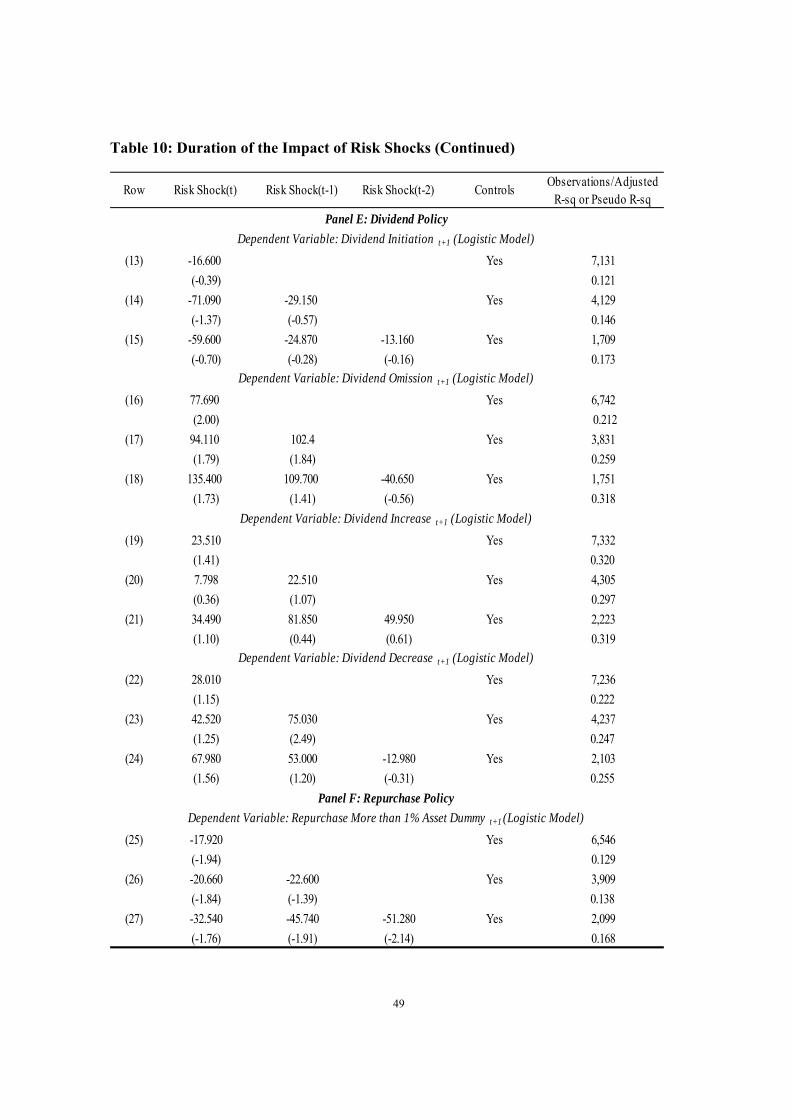
49
Table 10: Duration of the Impact of Risk Shocks (Continued)
Row Risk Shock(t) Risk Shock(t-1) Risk Shock(t-2) ControlsObservations/Adjusted
R-sq or Pseudo R-sq
(13) -16.600 Yes 7,131
(-0.39) 0.121
(14) -71.090 -29.150 Yes 4,129
(-1.37) (-0.57) 0.146
(15) -59.600 -24.870 -13.160 Yes 1,709
(-0.70) (-0.28) (-0.16) 0.173
(16) 77.690 Yes 6,742
(2.00) 0.212
(17) 94.110 102.4 Yes 3,831
(1.79) (1.84) 0.259
(18) 135.400 109.700 -40.650 Yes 1,751
(1.73) (1.41) (-0.56) 0.318
(19) 23.510 Yes 7,332
(1.41) 0.320
(20) 7.798 22.510 Yes 4,305
(0.36) (1.07) 0.297
(21) 34.490 81.850 49.950 Yes 2,223
(1.10) (0.44) (0.61) 0.319
(22) 28.010 Yes 7,236
(1.15) 0.222
(23) 42.520 75.030 Yes 4,237
(1.25) (2.49) 0.247
(24) 67.980 53.000 -12.980 Yes 2,103
(1.56) (1.20) (-0.31) 0.255
(25) -17.920 Yes 6,546
(-1.94) 0.129
(26) -20.660 -22.600 Yes 3,909
(-1.84) (-1.39) 0.138
(27) -32.540 -45.740 -51.280 Yes 2,099
(-1.76) (-1.91) (-2.14) 0.168
Panel E: Dividend Policy
Dependent Variable: Dividend Omission t+1 (Logistic Model)
Panel F: Repurchase Policy
Dependent Variable: Repurchase More than 1% Asset Dummy t+1 (Logistic Model)
Dependent Variable: Dividend Initiation t+1 (Logistic Model)
Dependent Variable: Dividend Decrease t+1 (Logistic Model)
Dependent Variable: Dividend Increase t+1 (Logistic Model)
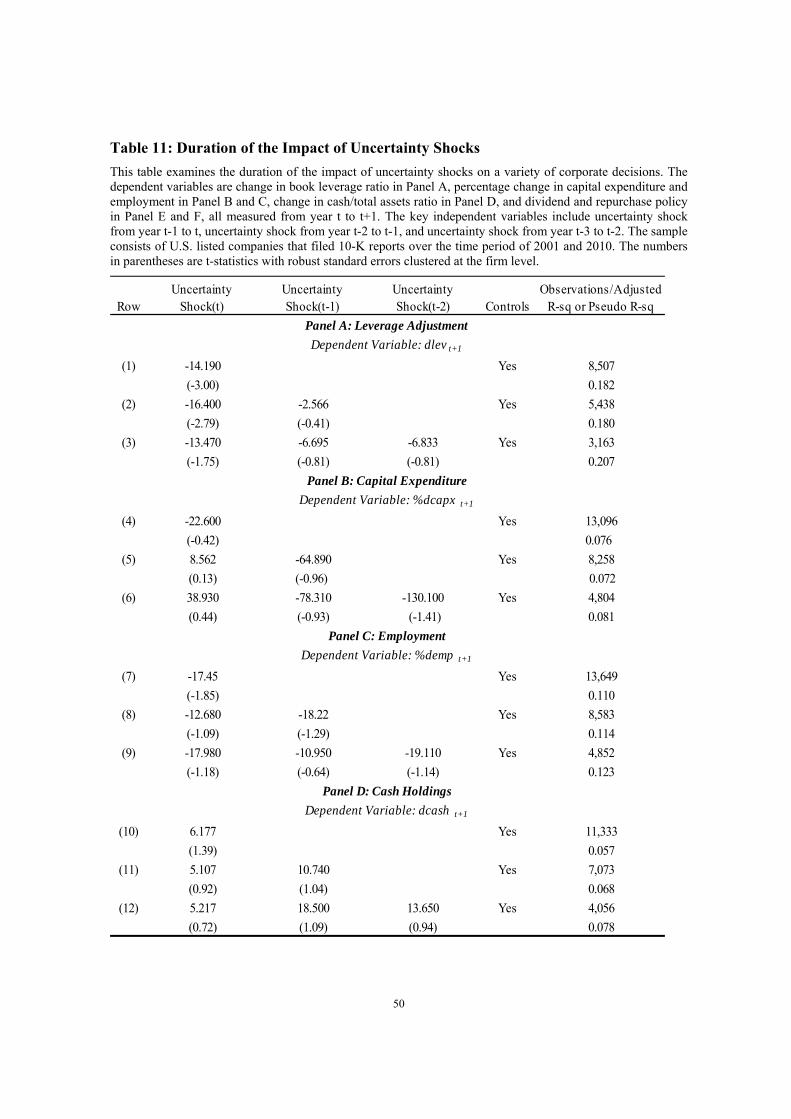
50
Table 11: Duration of the Impact of Uncertainty Shocks
This table examines the duration of the impact of uncertainty shocks on a variety of corporate decisions. The dependent variables are change in book leverage ratio in Panel A, percentage change in capital expenditure and employment in Panel B and C, change in cash/total assets ratio in Panel D, and dividend and repurchase policy in Panel E and F, all measured from year t to t+1. The key independent variables include uncertainty shock from year t-1 to t, uncertainty shock from year t-2 to t-1, and uncertainty shock from year t-3 to t-2. The sample consists of U.S. listed companies that filed 10-K reports over the time period of 2001 and 2010. The numbers in parentheses are t-statistics with robust standard errors clustered at the firm level.
RowUncertainty
Shock(t)UncertaintyShock(t-1)
UncertaintyShock(t-2) Controls
Observations/AdjustedR-sq or Pseudo R-sq
(1) -14.190 Yes 8,507
(-3.00) 0.182
(2) -16.400 -2.566 Yes 5,438
(-2.79) (-0.41) 0.180
(3) -13.470 -6.695 -6.833 Yes 3,163
(-1.75) (-0.81) (-0.81) 0.207
(4) -22.600 Yes 13,096
(-0.42) 0.076
(5) 8.562 -64.890 Yes 8,258
(0.13) (-0.96) 0.072
(6) 38.930 -78.310 -130.100 Yes 4,804
(0.44) (-0.93) (-1.41) 0.081
(7) -17.45 Yes 13,649
(-1.85) 0.110
(8) -12.680 -18.22 Yes 8,583
(-1.09) (-1.29) 0.114
(9) -17.980 -10.950 -19.110 Yes 4,852
(-1.18) (-0.64) (-1.14) 0.123
(10) 6.177 Yes 11,333
(1.39) 0.057
(11) 5.107 10.740 Yes 7,073
(0.92) (1.04) 0.068
(12) 5.217 18.500 13.650 Yes 4,056
(0.72) (1.09) (0.94) 0.078
Dependent Variable: %demp t+1
Panel D: Cash Holdings
Dependent Variable: dcash t+1
Panel A: Leverage Adjustment
Dependent Variable: dlev t+1
Panel B: Capital Expenditure
Dependent Variable: %dcapx t+1
Panel C: Employment
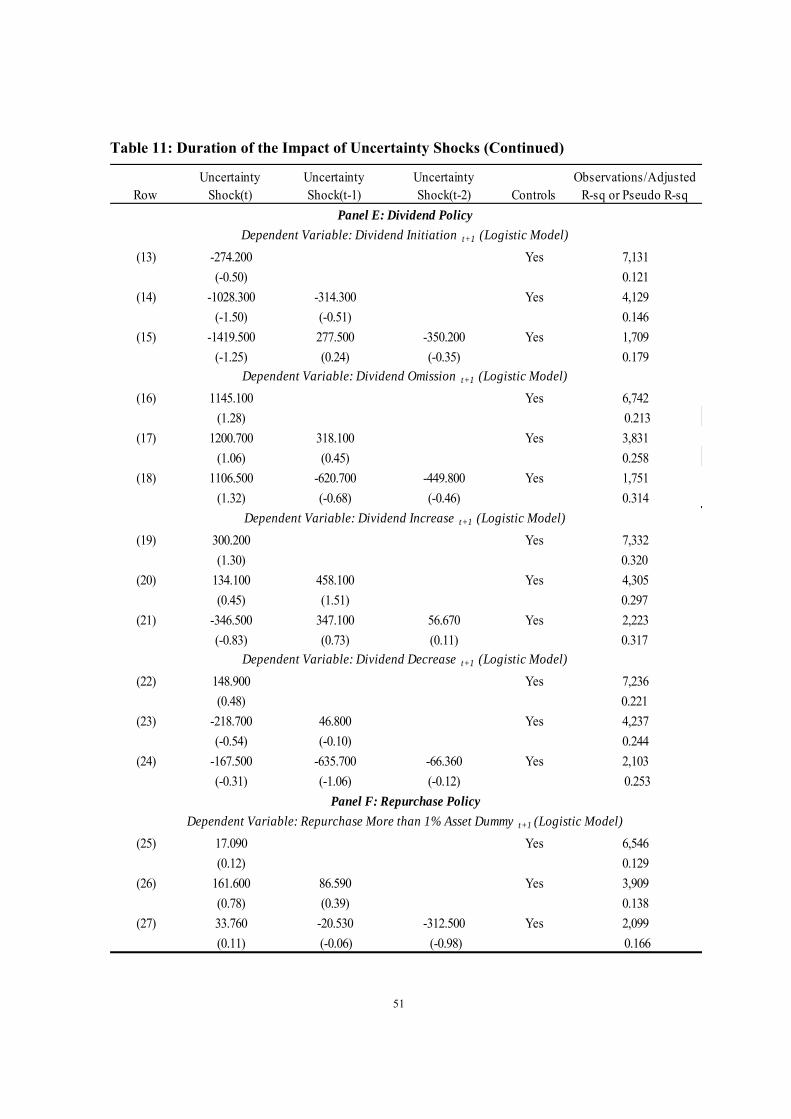
51
Table 11: Duration of the Impact of Uncertainty Shocks (Continued)
RowUncertainty
Shock(t)UncertaintyShock(t-1)
UncertaintyShock(t-2) Controls
Observations/AdjustedR-sq or Pseudo R-sq
(13) -274.200 Yes 7,131
(-0.50) 0.121
(14) -1028.300 -314.300 Yes 4,129
(-1.50) (-0.51) 0.146
(15) -1419.500 277.500 -350.200 Yes 1,709
(-1.25) (0.24) (-0.35) 0.179
(16) 1145.100 Yes 6,742
(1.28) 0.213
(17) 1200.700 318.100 Yes 3,831
(1.06) (0.45) 0.258
(18) 1106.500 -620.700 -449.800 Yes 1,751
(1.32) (-0.68) (-0.46) 0.314
(19) 300.200 Yes 7,332
(1.30) 0.320
(20) 134.100 458.100 Yes 4,305
(0.45) (1.51) 0.297
(21) -346.500 347.100 56.670 Yes 2,223
(-0.83) (0.73) (0.11) 0.317
(22) 148.900 Yes 7,236
(0.48) 0.221
(23) -218.700 46.800 Yes 4,237
(-0.54) (-0.10) 0.244
(24) -167.500 -635.700 -66.360 Yes 2,103
(-0.31) (-1.06) (-0.12) 0.253
(25) 17.090 Yes 6,546
(0.12) 0.129
(26) 161.600 86.590 Yes 3,909
(0.78) (0.39) 0.138
(27) 33.760 -20.530 -312.500 Yes 2,099
(0.11) (-0.06) (-0.98) 0.166
Panel E: Dividend Policy
Dependent Variable: Dividend Decrease t+1 (Logistic Model)
Panel F: Repurchase Policy
Dependent Variable: Repurchase More than 1% Asset Dummy t+1 (Logistic Model)
Dependent Variable: Dividend Omission t+1 (Logistic Model)
Dependent Variable: Dividend Increase t+1 (Logistic Model)
Dependent Variable: Dividend Initiation t+1 (Logistic Model)

52
Appendix 1: List of Risk and Uncertainty-Related Keywords
Panels A and B of this table present the list of key word stem and corresponding key words for constructing risk and uncertainty measures, respectively.
Key Word Stem Key Wordsaccid accident accidents
advers adverse adversely adversity adversities
compet compete competent competing competes competencies competence competency competed competently
competi competition competitions
competit competitive competitiveness competitively
competitor competitors competitor
crisis crisis
difficult difficult
difficulti difficulties difficulty
downgrad downgrade downgraded downgrades downgrading
downturn downturn downturns
downward downward
fail fail fails failed failing
failur failure failures
impair impairment impaired impair impairments impairing impairs
inconsist inconsistent inconsistency inconsistencies inconsistently
lose lose losing loses
loss loss losses
lost lost
neg negative negatively negatives
nonperform nonperforming nonperformance
pressur pressure pressures pressured pressurized pressurization pressuring pressurizer pressurize
risk risk risks risked risking
riski risky riskiness
slowdown slowdown slowdowns
unabl unable
weaken weakening weakened weaken weakens
weaker weaker
weak weaknesses weakness
Key Word Stem Key Words
unanticipated unanticipateduncertain uncertain
uncertainti uncertainties uncertainty
unclear unclear
unexpect unexpected
unexpectedli unexpectedly
unforeseen unforeseen
unpredict unpredictable unpredictability unpredictably unpredicted
Panel A. List of Keywords for Managerial Risk Perception
Panel B. List of Keywords for Managerial Uncertainty Perception
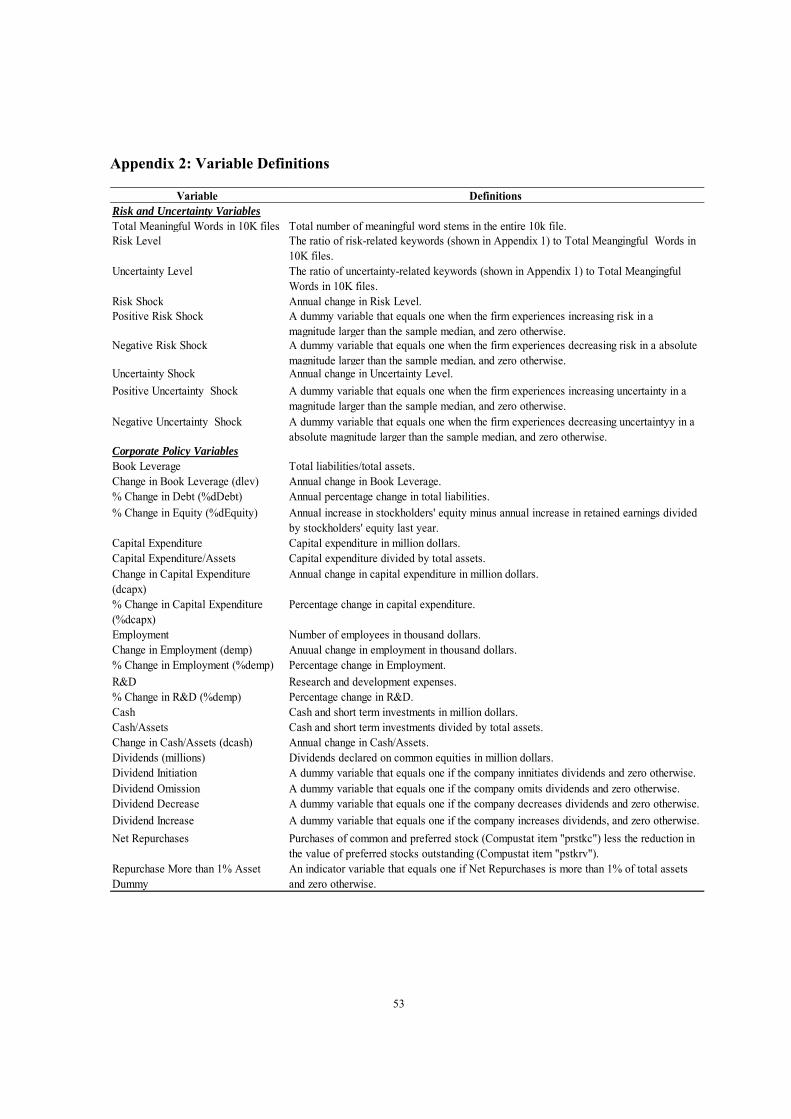
53
Appendix 2: Variable Definitions
Variable DefinitionsRisk and Uncertainty VariablesTotal Meaningful Words in 10K files Total number of meaningful word stems in the entire 10k file.Risk Level The ratio of risk-related keywords (shown in Appendix 1) to Total Meangingful Words in
10K files.Uncertainty Level The ratio of uncertainty-related keywords (shown in Appendix 1) to Total Meangingful
Words in 10K files.Risk Shock Annual change in Risk Level.Positive Risk Shock A dummy variable that equals one when the firm experiences increasing risk in a
magnitude larger than the sample median, and zero otherwise.Negative Risk Shock A dummy variable that equals one when the firm experiences decreasing risk in a absolute
magnitude larger than the sample median, and zero otherwise.Uncertainty Shock Annual change in Uncertainty Level.
Positive Uncertainty Shock A dummy variable that equals one when the firm experiences increasing uncertainty in amagnitude larger than the sample median, and zero otherwise.
Negative Uncertainty Shock A dummy variable that equals one when the firm experiences decreasing uncertaintyy in aabsolute magnitude larger than the sample median, and zero otherwise.
Corporate Policy VariablesBook Leverage Total liabilities/total assets.Change in Book Leverage (dlev) Annual change in Book Leverage.% Change in Debt (%dDebt) Annual percentage change in total liabilities.% Change in Equity (%dEquity) Annual increase in stockholders' equity minus annual increase in retained earnings divided
by stockholders' equity last year.Capital Expenditure Capital expenditure in million dollars.Capital Expenditure/Assets Capital expenditure divided by total assets.Change in Capital Expenditure(dcapx)
Annual change in capital expenditure in million dollars.
% Change in Capital Expenditure(%dcapx)
Percentage change in capital expenditure.
Employment Number of employees in thousand dollars.Change in Employment (demp) Anuual change in employment in thousand dollars.% Change in Employment (%demp) Percentage change in Employment.
R&D Research and development expenses.% Change in R&D (%demp) Percentage change in R&D.Cash Cash and short term investments in million dollars.Cash/Assets Cash and short term investments divided by total assets.Change in Cash/Assets (dcash) Annual change in Cash/Assets.Dividends (millions) Dividends declared on common equities in million dollars.Dividend Initiation A dummy variable that equals one if the company innitiates dividends and zero otherwise.Dividend Omission A dummy variable that equals one if the company omits dividends and zero otherwise.Dividend Decrease A dummy variable that equals one if the company decreases dividends and zero otherwise.
Dividend Increase A dummy variable that equals one if the company increases dividends, and zero otherwise.
Net Repurchases Purchases of common and preferred stock (Compustat item "prstkc") less the reduction inthe value of preferred stocks outstanding (Compustat item "pstkrv").
Repurchase More than 1% AssetDummy
An indicator variable that equals one if Net Repurchases is more than 1% of total assetsand zero otherwise.
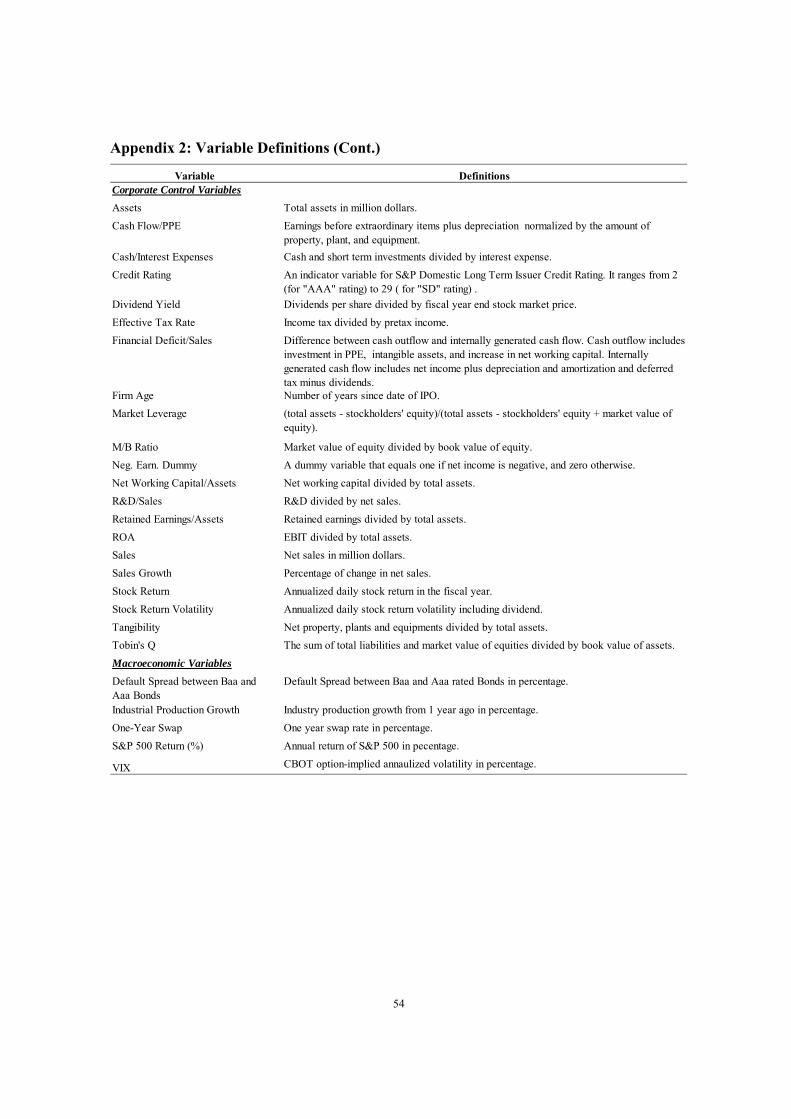
54
Appendix 2: Variable Definitions (Cont.)
Variable DefinitionsCorporate Control Variables
Assets Total assets in million dollars.
Cash Flow/PPE Earnings before extraordinary items plus depreciation normalized by the amount ofproperty, plant, and equipment.
Cash/Interest Expenses Cash and short term investments divided by interest expense.
Credit Rating An indicator variable for S&P Domestic Long Term Issuer Credit Rating. It ranges from 2(for "AAA" rating) to 29 ( for "SD" rating) .
Dividend Yield Dividends per share divided by fiscal year end stock market price.
Effective Tax Rate Income tax divided by pretax income.
Financial Deficit/Sales Difference between cash outflow and internally generated cash flow. Cash outflow includesinvestment in PPE, intangible assets, and increase in net working capital. Internallygenerated cash flow includes net income plus depreciation and amortization and deferredtax minus dividends.
Firm Age Number of years since date of IPO.
Market Leverage (total assets - stockholders' equity)/(total assets - stockholders' equity + market value ofequity).
M/B Ratio Market value of equity divided by book value of equity.
Neg. Earn. Dummy A dummy variable that equals one if net income is negative, and zero otherwise.
Net Working Capital/Assets Net working capital divided by total assets.
R&D/Sales R&D divided by net sales.
Retained Earnings/Assets Retained earnings divided by total assets.
ROA EBIT divided by total assets.
Sales Net sales in million dollars.
Sales Growth Percentage of change in net sales.
Stock Return Annualized daily stock return in the fiscal year.
Stock Return Volatility Annualized daily stock return volatility including dividend.
Tangibility Net property, plants and equipments divided by total assets.
Tobin's Q The sum of total liabilities and market value of equities divided by book value of assets.
Macroeconomic Variables
Default Spread between Baa andAaa Bonds
Default Spread between Baa and Aaa rated Bonds in percentage.
Industrial Production Growth Industry production growth from 1 year ago in percentage.
One-Year Swap One year swap rate in percentage.
S&P 500 Return (%) Annual return of S&P 500 in pecentage.
VIX CBOT option-implied annaulized volatility in percentage.