risk reporting & key risk indicators - erm · pdf filerisk reporting & key risk...
TRANSCRIPT
Stephen R. Boyd | Johannes A. Moolman | Nkemjika J. Nwosu
Risk Reporting & Key Risk Indicators
A Case Study Analysis

Table of Contents
Introduction___ ____________________________________________________________ 1
Case Illustration #1: Midwestern Utility Company, Inc. ______________________________ 2
Case Illustration #2: Wimbledon Investments ____________________________________ 13
Case Illustration #3: Discovery Health Group _____________________________________ 23
Conclusion ________________________________________________________________ 31
About the Authors _________________________________________________________ 32

RISK REPORTING & KEY RISK INDICATORS
1
Introduction
The main purpose of this case study is to take a closer look at risk reporting metrics and key risk
indicators (KRIs). KRIs are metrics used to provide an early signal of increasing risk exposure in various
areas of the organization. This study is based on three different companies in different industries
illustrating the overall Enterprise Risk Management (ERM) process and the role that risk reporting and
KRIs play in that process. For each company, the study provides examples of how risk metrics can be
developed, monitored, and reported. The main goal of the research is to provide examples that could
be used as a guideline to help other organizations implement risk metrics and indicators to effectively
monitor major risks. In addition, this case study may also provide insights on the structure of the ERM
function and the operation of the ERM process at the three different companies.
RISK REPORTING & KEY RISK INDICATORS
2
Case Illustration #1: Midwestern Utilities, Inc.
OVERVIEW & COMPANY BACKGROUND
Midwestern Utilities, Inc., (The Company) is a utility holding company with approximately $20 billion in
total assets, $5 billion in annual revenues, and a workforce of approximately 10,000 employees. Its
principal business operations are regulated electric and gas delivery businesses. The Company provides
electric services to over 1 million customers in rural and urban areas and delivers gas services to over
100,000 customers in a few large metropolitan areas. The majority of the Company’s business
operations are subject to regulation.
ERM PROCESS
The Company has always had a strong focus on risk management given the nature of its business and
the fact that it faces extensive regulation. However, it had not taken a structured enterprise-wide
approach to managing risks until it began a formal Enterprise Risk Management (ERM) program after
the Sarbanes-Oxley Act of 2002 was passed. The CFO of the Company initiated the process by selecting
a director of ERM. The newly appointed director of ERM consulted two other utility companies that had
more mature ERM processes to identify best practices that are important for a successful ERM launch.
The ERM director began the ERM process by going to each of the senior vice presidents of the major
departments of the Company to request participation in the development of the initial inventory of
risks. Each senior vice president then selected one individual at the director or general manager level to
represent them in the ERM function. After collecting all of the key people from each department, the
ERM director organized a series of brainstorming workshops. Starting at the enterprise level and
working down into the department level, the workshops focused on the major corporate risks. The
workshop started with the scenarios that would be the most severe if they were to occur. Next, the
workshop determined which scenarios would have the greatest likelihood of occurring. Finally, the
workshop determined which scenarios would be more controllable by the Company. When this process
was completed, the ERM director had a list of 14 major corporate risks that were spread out among all
of the departments in the Company. For each of these risks, a person within the responsible
department was named the risk owner and was given the responsibility of managing the risk. The risk
owners continued to work under the senior vice presidents in their departments while also working
with the ERM director to manage the risks. All of the risk owners collectively constitute the corporate
risk committee, and each serve the ERM function in addition to the current position they hold in their
respective departments.
RISK REPORTING & KEY RISK INDICATORS
3
DEVELOPING KEY RISK INDICATORS
The Company began developing KRIs as the ERM function matured and became more integrated with
the operations of the Company. The goal was to develop metrics that would provide signals to alert
management to increasing risk exposures or trends that could either present opportunities or threaten
the achievement of corporate goals. The Company relied on data driven analysis to support its
conclusions throughout this process, and organized its thinking by using a technique referred to as a
“bowtie analysis” to identify the metrics that would be most helpful in predicting risk events.
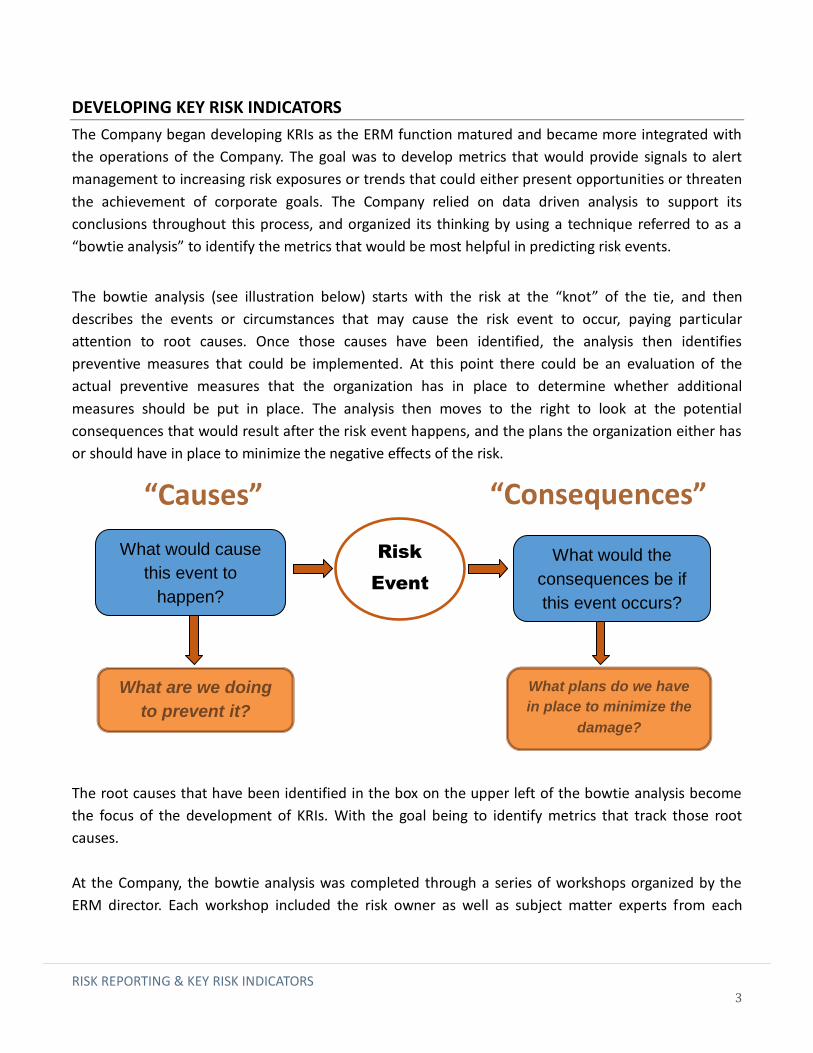
The bowtie analysis (see illustration below) starts with the risk at the “knot” of the tie, and then
describes the events or circumstances that may cause the risk event to occur, paying particular
attention to root causes. Once those causes have been identified, the analysis then identifies
preventive measures that could be implemented. At this point there could be an evaluation of the
actual preventive measures that the organization has in place to determine whether additional
measures should be put in place. The analysis then moves to the right to look at the potential
consequences that would result after the risk event happens, and the plans the organization either has
or should have in place to minimize the negative effects of the risk.
The root causes that have been identified in the box on the upper left of the bowtie analysis become
the focus of the development of KRIs. With the goal being to identify metrics that track those root
causes.
At the Company, the bowtie analysis was completed through a series of workshops organized by the
ERM director. Each workshop included the risk owner as well as subject matter experts from each
“Consequences” “Causes”
Risk
Event
What would cause
this event to
happen?
What would the
consequences be if
this event occurs?
What are we doing
to prevent it?
What plans do we have
in place to minimize the
damage?

RISK REPORTING & KEY RISK INDICATORS
4
department. These subject matter experts usually worked within the organization at the department
level but also had experience dealing with issues affecting the Company at the enterprise level. The
ERM director included subject matter experts to help create a setting which encouraged debate, but
limited the number of subject matter experts to between 6 and 8 in order to keep the discussion
focused. The ERM director believed that with the right combination of people and the appropriate level
of preparation he could create the kind of atmosphere that would drive the creativity needed to
identify the relevant root causes of the major corporate risks of the organization. Each workshop would
last two to four hours, and depending upon the complexity of the risk the number of workshops
needed to vet each risk could range from two to four. The ERM director found that these workshops
had to be broken down into a series of meetings in order to be more effective due to the exhaustive
nature of the approach.
Each risk owner was asked to pull together information on their risk in advance of the meeting in order
to optimize time in the workshop. Once the cause events are identified, subject matter experts help the
group by providing relevant information for each cause event. With that information in hand, the group
can look more closely at potential cause events and discuss differences of, all of which sharpens the
group’s focus. The risk owners worked together to decode the root causes of the identified risks by
discussing what combination of events would lead to the occurrence of each risk. Then, they seek to
understand the issues which cause the event to occur. This requires the involvement of subject matter
experts who are well versed in the fields relating to each identified risk. Next, they consider the
potential consequences of the event. Then the Company reviews mitigation strategies that are either in
place or need to be developed for each cause.
RISK REPORTING & KEY RISK INDICATORS
5
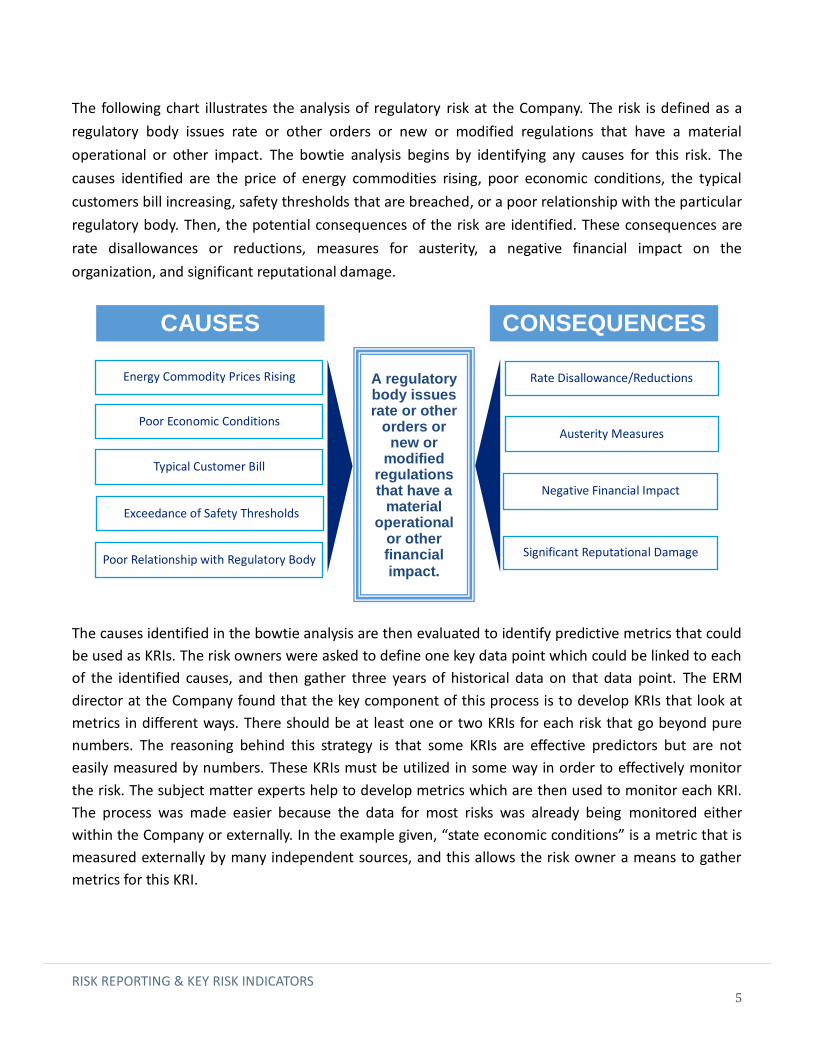
The following chart illustrates the analysis of regulatory risk at the Company. The risk is defined as a
regulatory body issues rate or other orders or new or modified regulations that have a material
operational or other impact. The bowtie analysis begins by identifying any causes for this risk. The
causes identified are the price of energy commodities rising, poor economic conditions, the typical
customers bill increasing, safety thresholds that are breached, or a poor relationship with the particular
regulatory body. Then, the potential consequences of the risk are identified. These consequences are
rate disallowances or reductions, measures for austerity, a negative financial impact on the
organization, and significant reputational damage.
The causes identified in the bowtie analysis are then evaluated to identify predictive metrics that could
be used as KRIs. The risk owners were asked to define one key data point which could be linked to each
of the identified causes, and then gather three years of historical data on that data point. The ERM
director at the Company found that the key component of this process is to develop KRIs that look at
metrics in different ways. There should be at least one or two KRIs for each risk that go beyond pure
numbers. The reasoning behind this strategy is that some KRIs are effective predictors but are not
easily measured by numbers. These KRIs must be utilized in some way in order to effectively monitor
the risk. The subject matter experts help to develop metrics which are then used to monitor each KRI.
The process was made easier because the data for most risks was already being monitored either
within the Company or externally. In the example given, “state economic conditions” is a metric that is
measured externally by many independent sources, and this allows the risk owner a means to gather
metrics for this KRI.
CONSEQUENCES
Rate Disallowance/Reductions
Austerity Measures
Negative Financial Impact
Significant Reputational Damage
CAUSES
Energy Commodity Prices Rising
Typical Customer Bill
Poor Economic Conditions
Poor Relationship with Regulatory Body
A regulatory body issues rate or other
orders or new or
modified regulations that have a
material operational
or other financial impact.
Exceedance of Safety Thresholds

RISK REPORTING & KEY RISK INDICATORS
6
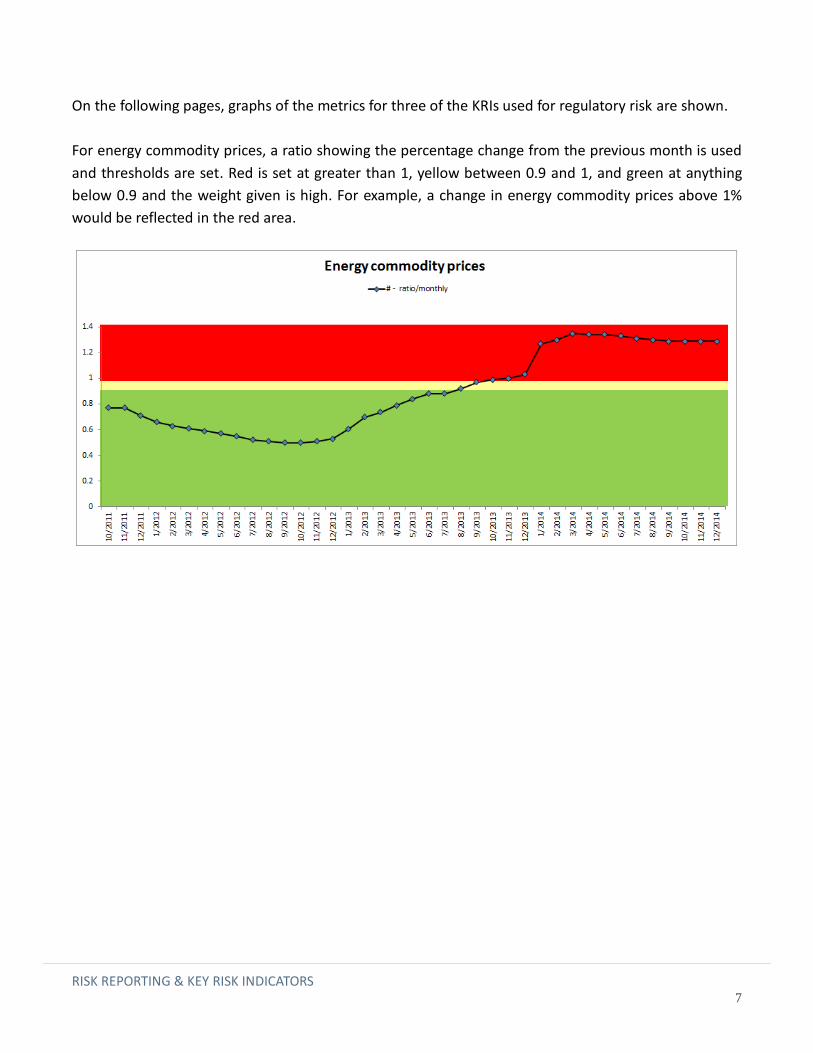
The ERM director then worked with the risk owners to set thresholds for each KRI. This often involved
the finance department as their knowledge of risk management was critical. After viewing the historical
information, thresholds were determined by the risk owners by selecting the data points where the KRI
had moved into an area of more or less influence upon the risk. The thresholds are represented by
three colors: red, yellow, and green. The green threshold represents an area where the KRI being
measured is at an acceptable level, and no action is necessary in regards to the risk it represents. In the
example given, the green threshold for “energy commodity prices” would be anytime the monthly ratio
is below 0.9. When the KRI’s data point moves into the yellow threshold, it has moved into a cautionary
area. This means that the KRI is communicating to the risk owner to look closer into the risk that the
KRI represents. In the example “energy commodity prices”, this would be when the monthly ratio
moves in between 0.9 and 1. When the KRI’s data point moves into the red threshold, the risk owner
must consider action in regards to the mitigation strategies in place for that particular risk. For “energy
commodity prices”, the red threshold represents when the monthly ratio moves above 1.
Next, the subject matter experts determine a weight for each KRI, and this is a scale of high, medium,
or low. The process of determining the weighting is subjective based on the subject matter experts’
opinion of the influence of that factor on the likelihood of the risk occurring. The weighting of KRIs
brings a more specific approach to monitoring the risk associated with them. Each KRI represents a
trigger event which has a proportional impact on the likelihood of the identified risk occurring. For
example, if a KRI like “energy commodity prices” with a high weighting, moves above the red threshold,
it would make regulatory risk more likely to occur than if a KRI like “state regulatory success rate for
prior 12 months” with a low weighting moved above the red threshold.
The result of this process for regulatory risk at the Company is illustrated in the table below.
Description Measure Goal Thresholds Weighting
Energy commodity prices # - Ratio / monthly N/A
Red: x>=1 Yellow: 0.9<x<1 Green: x<=0.9
High
Typical customer bill Ratio of 12-month average to 5 yr.
average / monthly N/A
R: x>=1 Y: 0.9<x<1 G: x<=0.9
High
State economic conditions Unemployment % rate / monthly N/A
R: x>=9 Y: 7<x<9 G: x<=7
Medium
Exceedance of performance thresholds
# per every 3 years / monthly N/A
R: x>=4 Y: 1<=x<=3
G: x=0 Medium
State regulatory success rate for prior 12 months
% of success rate / monthly 70% R: <25%
Y: 25-70% G: >=70%
Low
RISK REPORTING & KEY RISK INDICATORS
7
On the following pages, graphs of the metrics for three of the KRIs used for regulatory risk are shown.
For energy commodity prices, a ratio showing the percentage change from the previous month is used
and thresholds are set. Red is set at greater than 1, yellow between 0.9 and 1, and green at anything
below 0.9 and the weight given is high. For example, a change in energy commodity prices above 1%
would be reflected in the red area.

RISK REPORTING & KEY RISK INDICATORS
8
The typical customer bill shown below is tracked using a ratio of the average customer bill for the last
12 months compared to the average customer bill over the last 5 years. Thresholds are set for red at
greater than 1 (12 month average has exceeded the 5 year average), yellow between 0.9 and 1 (12
month average is 90-100% of the 5 year average, and green at anything below 0.9 (12 month average is
below the 5 year average by 10% or more). When compiling the overall status of Regulatory risk, the
weight given to customer bills is high. The example shows that the 12 month average for the typical
customer bill is between 95 and 100% of the 5 year average at December 2014. While this is still in the
yellow or caution area, the trend is positive.
RISK REPORTING & KEY RISK INDICATORS
9
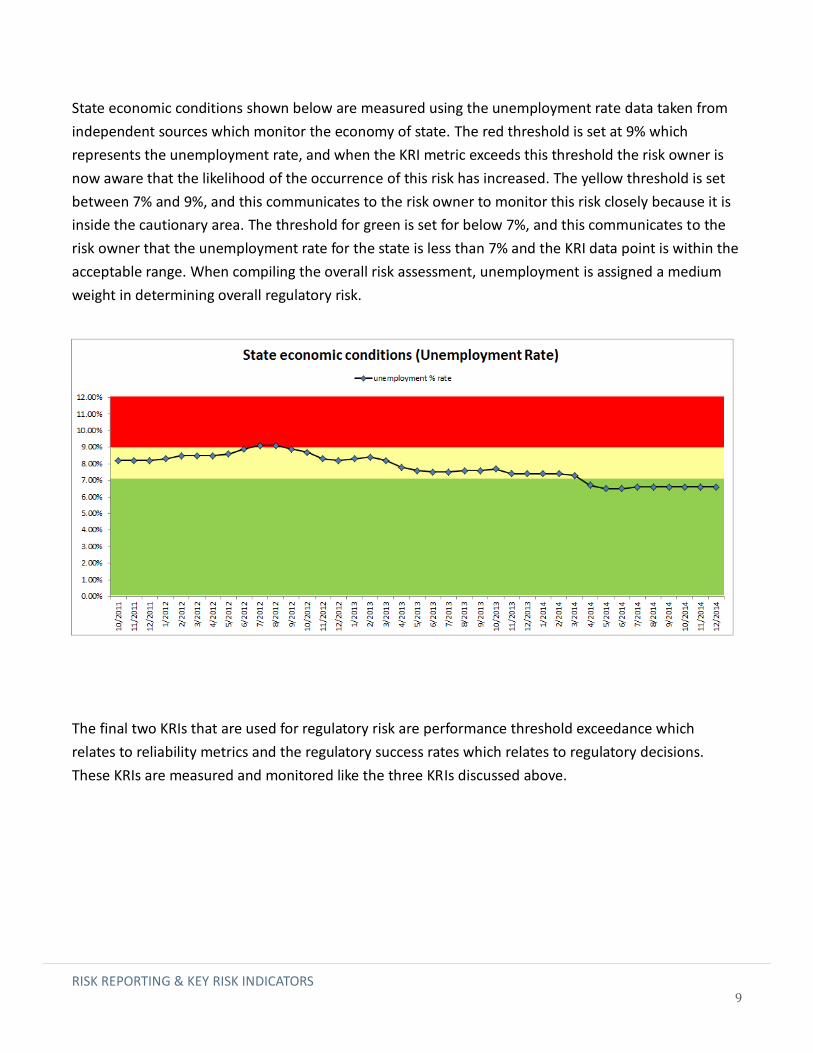
State economic conditions shown below are measured using the unemployment rate data taken from
independent sources which monitor the economy of state. The red threshold is set at 9% which
represents the unemployment rate, and when the KRI metric exceeds this threshold the risk owner is
now aware that the likelihood of the occurrence of this risk has increased. The yellow threshold is set
between 7% and 9%, and this communicates to the risk owner to monitor this risk closely because it is
inside the cautionary area. The threshold for green is set for below 7%, and this communicates to the
risk owner that the unemployment rate for the state is less than 7% and the KRI data point is within the
acceptable range. When compiling the overall risk assessment, unemployment is assigned a medium
weight in determining overall regulatory risk.
The final two KRIs that are used for regulatory risk are performance threshold exceedance which
relates to reliability metrics and the regulatory success rates which relates to regulatory decisions.
These KRIs are measured and monitored like the three KRIs discussed above.

RISK REPORTING & KEY RISK INDICATORS
10
MONITORING & REPORTING KRIS
After the development process has been completed, each risk owner has the responsibility of
monitoring the risks belonging to the department in which he or she works. The monitoring process
involves a continuous gathering of metrics relating to each KRI. While gathering these metrics, the risk
owner must keep an open line of communication with the senior officer of the department in regards
to how the risk is being managed. This dialogue includes mitigation strategies that are being
implemented, the status of the mitigation strategies, and any plans for developing new mitigation
strategies.
At the end of each quarter, the ERM director works with each risk owner individually and compiles a
KRI summary dashboard for the risk in that risk owner’s department. A comprehensive KRI report is
prepared by compiling the KRI summary dashboards for all the 14 major corporate risks facing the
Company. This report is distributed to the 45 senior officers of the Company, and provides a high level
overview of each risk and the current status of the KRIs in relation to the risk. The report is organized in
such a way as to allow each senior officer easy access to the KRI summary dashboards which directly
relate to the department he or she manages.
The KRI summary dashboard contains metrics comparing the current quarter measurements against
the previous quarter as well as the previous years’ matching quarter. The metrics show the changes
between the current quarter and the other two quarters in order to give the senior officers an idea of
the direction in which the KRI is heading. The dashboard is organized as a chart that lists the risk owner,
the risk, and each KRI along the top portion. Measurements for the three quarters are listed
underneath each KRI for easy reference. The dashboard also includes a KRI overall color assessment,
which is taken from the risk owner’s KRI graph for that particular KRI. Underneath each KRI summary
dashboard, a short narrative is provided that describes any changes in the colors of the KRIs. This
summary describes the change, what specifically occurred to cause the change, and whether this
change was an improvement or a setback. This narrative gives the senior officer enough information to
be able to have a discussion with the risk owner in regards to any actions which may need to be taken
to address the status of the KRI. These discussions occur regularly between the risk owner and the
senior officer, so if there is any unexpected change the narrative will be descriptive enough to inform
the senior officer of why it occurred.
RISK REPORTING & KEY RISK INDICATORS
11
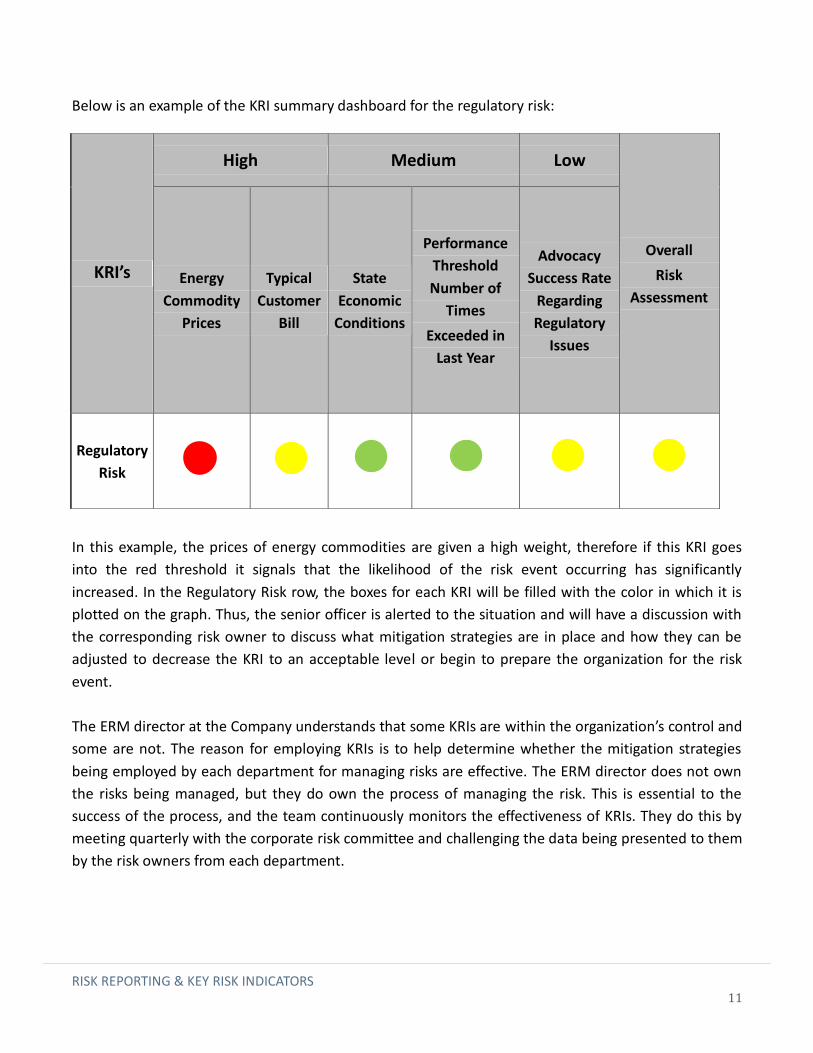
Below is an example of the KRI summary dashboard for the regulatory risk:
In this example, the prices of energy commodities are given a high weight, therefore if this KRI goes
into the red threshold it signals that the likelihood of the risk event occurring has significantly
increased. In the Regulatory Risk row, the boxes for each KRI will be filled with the color in which it is
plotted on the graph. Thus, the senior officer is alerted to the situation and will have a discussion with
the corresponding risk owner to discuss what mitigation strategies are in place and how they can be
adjusted to decrease the KRI to an acceptable level or begin to prepare the organization for the risk
event.
The ERM director at the Company understands that some KRIs are within the organization’s control and
some are not. The reason for employing KRIs is to help determine whether the mitigation strategies
being employed by each department for managing risks are effective. The ERM director does not own
the risks being managed, but they do own the process of managing the risk. This is essential to the
success of the process, and the team continuously monitors the effectiveness of KRIs. They do this by
meeting quarterly with the corporate risk committee and challenging the data being presented to them
by the risk owners from each department.
KRI’s
High Medium Low
Overall
Risk
Assessment Energy
Commodity
Prices
Typical
Customer
Bill
State
Economic
Conditions
Performance
Threshold
Number of
Times
Exceeded in
Last Year
Advocacy
Success Rate
Regarding
Regulatory
Issues
Regulatory
Risk

RISK REPORTING & KEY RISK INDICATORS
12
SUMMARY
The Company effectively uses Key Risk Indicators to monitor the 14 major corporate risks that face the
organization. The process started by identifying the causes to these major risks by using a bowtie
analysis. The ERM director then employed an efficient process that enables the risk owners from each
department to apply measurable metrics to each of these KRIs. Each KRI was then monitored quarterly
using graphs to display those metrics in an easy to follow way. A good analogy to use for the monitoring
function is like a “check engine” light on a car. When the light comes on, the driver is notified that there
is a problem that must be tended to. These graphs which monitor the KRIs work in a similar way at the
Company: they allow the risk owners to see if there is a problem that needs tending to in regards to the
major corporate risks. The role of the ERM function with regards to KRIs at the Company is that they
are facilitators of this process, while it is the responsibility of the risk owners to manage the risks in
their respective departments. The reporting process actively engages senior executives by providing
key information on KRIs which trigger a review and may lead to potential change to current mitigation
strategies. The Company has a robust ERM function in place, and the development, monitoring, and
reporting of KRIs has given them a valuable tool in managing their key corporate risks.

RISK REPORTING & KEY RISK INDICATORS
13
Case Illustration #2: Wimbledon Investments
OVERVIEW
This case study investigates an investment company with divisions all over the world. Over the past
several years, the company has benefitted from utilizing key risk indicators (KRIs) to manage its risk.
The enterprise-level risk committee has worked with the Chief Executive Officer (CEO) to identify three
key strategic principles. Risk events to those principles were identified by the enterprise-level risk
committee and the root-cause analysis was used to develop KRIs for the events. The company also
relies heavily on data and predictive modeling to plan for future business performance. This study
found that the company benefitted most from the use of KRIs when the risks were uncontrollable and
when the KRIs were directed towards the risks from new investments the company was considering
on-boarding.
COMPANY BACKGROUND
Wimbledon Investments (WI) is a leading investment and financial services company based in the
United States with investments across the globe, but focused primarily in the United States, Canada,
and Europe. WI has been in business for over 50 years and has survived numerous market downturns
including the most recent global financial crisis. The Company had assets valued at approximately
US$100 billion at December 31, 2015.
A significant portion of WI’s business consists of investments in mortgage loans. The company focuses
on maintaining a diversified portfolio of mortgage investments and tries to be forward-looking when
assessing the risks of investing in particular markets. One of the challenges for any international
company is to design an effective Enterprise Risk Management (ERM) program that is common across
all of its global businesses, yet is flexible enough to work in different environments. The markets in
these different areas around the world may act and are regulated differently, which is why an ERM
program cannot be too rigid. WI’s strategy for making investments in new markets has been to look for
areas with growing home ownership, a solid legal and regulatory framework for mortgage lending, and
people who are home ready. It believes that this strategy has contributed to the company’s successful
growth and performance.

RISK REPORTING & KEY RISK INDICATORS
14
ERM PROCESS The ERM process at Wimbledon Investments is relatively mature. The majority of the ERM process is
implemented by the Executive Management Risk Committee, which consists of the heads of each
business as well as several executives. This committee identifies the company’s core drivers and what
risks may affect those drivers. One of the ways the committee achieves this step is by relying heavily on
analytics. It then assesses the risks by taking into consideration the likelihood and impact of those risks.
The committee then classifies the risks as high, medium or low and responds accordingly by reducing
the risks to within the company’s risk appetite.
Another key component of the ERM process is monitoring and communication, which is performed on
a continuous basis throughout the organization. In addition, risks are also reassessed as a part of the
company’s annual business planning process. During the business planning process, the Executive
Management Risk Committee assesses its investment portfolio and prepares three to four year
forecasts of changes expected in its portfolio and in the markets in which it invests. The committee
then creates three to four scenarios with increasing stress to evaluate the events that may happen and
how the portfolio would be affected. The committee also assesses the probability of these events
happening. To understand how the business will be affected by deeper levels of stress, the committee
will run a deep downside scenario analysis looking at economic capital along the probability
continuum. The Executive Management Risk Committee will then present its findings to the Board Risk
Committee and gain approval over its risk appetite and tolerances. Wimbledon Investments’ ERM
process helps to ensure that the company remains vigilant as risks are constantly changing. Below is an
illustration of WI’s ERM process:
Core Drivers
Identifying Risks to Core Drivers
Assessing the Risks
Responding to the Risks
Monitoring & Communitcating
RISK REPORTING & KEY RISK INDICATORS
15
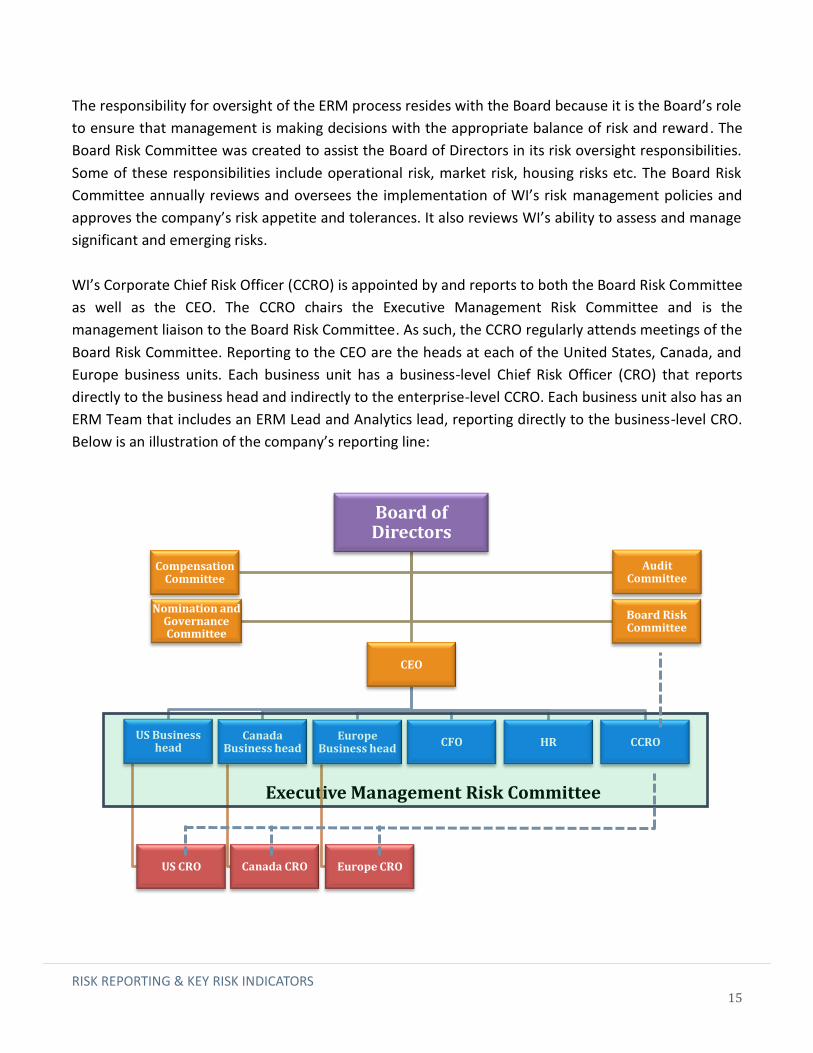
Executive Management Risk Committee
The responsibility for oversight of the ERM process resides with the Board because it is the Board’s role
to ensure that management is making decisions with the appropriate balance of risk and reward. The
Board Risk Committee was created to assist the Board of Directors in its risk oversight responsibilities.
Some of these responsibilities include operational risk, market risk, housing risks etc. The Board Risk
Committee annually reviews and oversees the implementation of WI’s risk management policies and
approves the company’s risk appetite and tolerances. It also reviews WI’s ability to assess and manage
significant and emerging risks.
WI’s Corporate Chief Risk Officer (CCRO) is appointed by and reports to both the Board Risk Committee
as well as the CEO. The CCRO chairs the Executive Management Risk Committee and is the
management liaison to the Board Risk Committee. As such, the CCRO regularly attends meetings of the
Board Risk Committee. Reporting to the CEO are the heads at each of the United States, Canada, and
Europe business units. Each business unit has a business-level Chief Risk Officer (CRO) that reports
directly to the business head and indirectly to the enterprise-level CCRO. Each business unit also has an
ERM Team that includes an ERM Lead and Analytics lead, reporting directly to the business-level CRO.
Below is an illustration of the company’s reporting line:
Board of Directors
CEO
CCRO US Business
head
US CRO
Canada Business head
Canada CRO
Europe Business head
Europe CRO
CFO HR
Board Risk Committee
Compensation Committee
Audit Committee
Nomination and Governance Committee

RISK REPORTING & KEY RISK INDICATORS
16
DEVELOPING KEY RISK INDICATORS
The Foundation for Developing KRIs - 3Cs Principles
As a starting point in developing KRIs you must first look at the fundamentals of the business model
and how that affects risks. When evaluating the source of risk in a loan, there are three fundamental
principles that must be observed. Some businesses call them the 3Cs, and WI has incorporated them
into its ERM program. These underwriting principles are a good way to think about the risks to an
organization that invests in mortgage securities.
Capacity: The first hurdle for WI is the capacity of the borrower and ultimately the company’s
portfolio. This principle can be expressed through the question “Does the borrower have the ability to
pay back the loan?” If the borrower makes $900 per month and the mortgage is for $1000 per month,
the company knows that the borrower does not have capacity. But if the borrower makes $2000 per
month, the transaction may be possible. Therefore, the company evaluates potential mortgage
investments for sufficient capacity. One metric that WI uses to monitor the capacity of the borrowers
in its portfolio of mortgage securities is Debt to Income (DTI). Therefore, the question for developing a
KRI could be, “What event(s) could have a significant impact on the Debt to Income ratio across my
portfolio?” and “What is the earliest indicator that such an event or events is starting to occur?”
Credit: Once the first condition is met, the next step for WI is to look at credit. This principle asks, “Is
the borrower willing to pay back the loan?” Some borrowers may satisfy the first principle and have
the capacity to pay, but they don’t pay their bills on time or they don’t manage their finances very well.
These types of habits can be reflected in a borrower’s credit score, and ultimately in the company’s
investment portfolio. Credit scores are easy to obtain and the company has found them to be very
predictive of default. The scores may also show the company if the borrower has any liabilities that
have not been disclosed, because most loans in most mature markets will show up on a borrower’s
credit report. The company’s portfolio risk increases as its borrowers’ credit scores decrease.
Therefore, WI may develop a KRI by asking the question, “What event(s) may decrease borrowers’
credit scores?” and “What indicator will precede such an event?”
Collateral: After WI has confirmed the borrower’s credit position it will assess its collateral. If the
borrower defaults on the loan, the first step would be to work with the borrower to try to remedy the
situation through a loan workout process. If this process is unsuccessful, the property securing the
mortgage would likely be sold to recover the value to pay off the loan. One of the key measures of
involving collateral is the Loan-to-Value (LTV) ratio. The LTV ratio is a key measure that banks and
mortgage lenders use that describes the relationship between the loan amount and the value of the
property. A higher LTV will mean that there is less equity in the loan, which makes it riskier. Some loans
may have a 95% LTV, which means that the borrower only made a 5% down payment. These loans are

RISK REPORTING & KEY RISK INDICATORS
17
viewed as highly risky in WI’s portfolio. The hazard with a high LTV loan is that a borrower’s equity may
quickly erode if payments are missed and in that case, the borrower may face a high likelihood of
losing the home to foreclosure. When the borrower finds himself in this situation, there is little
incentive to invest time and resources into the maintenance of the property. As a result, the value of
the property may go down potentially increasing the loss on the mortgage loan. However, a mortgage
with an 85% LTV allows the company to have a 15% cushion. If the borrower does not make his
payments, WI will have more cushion to recover the value needed to pay off the loan. Therefore, WI
would use LTV to develop a KRI by asking, “What would increase our portfolio’s LTV?” and “What
indicator could show when LTV is about to increase?”
Documentation may also be added to these principles. Although it does not relate to KRIs, all of the
three above steps rely on good documentation by the company and by the loan originators. The 3Cs
underwriting principles have been used for many years and were implemented long before the global
financial crisis of 2007. Even so, one can easily map deficiencies that resulted in the crises to one of
these three key principles. For example, some mortgage investors had purchased 100% LTV loans,
which were very vulnerable to potential losses in the event of a market decline. If WI can develop KRIs
that are tied to these 3Cs, the company might mitigate its exposure to a risk event in the future. Below
is an illustration of how Wimbledon Investments linked its objective to strategies to risks and
ultimately KRIs:
“When evaluating the source of risk in a loan, there
are three fundamental principles that must be
observed.”
Profitability
Capacity DTI Risky DTI KRIs
Credit Credit Score Risky Credit
Score KRIs
Collateral LTV Risky LTV KRIs

RISK REPORTING & KEY RISK INDICATORS
18
Credit Default Risks & Leading Indicators
As demonstrated, the risks to mortgages and credit default may all tie into the above 3Cs principles.
When WI asks itself, “What event might change one of the 3Cs?” it generally identifies several risk
events. These risk events may be divided into controllable and uncontrollable risks. Controllable risks
are managed differently than uncontrollable risks in that analytics and multiple dashboards are used to
evaluate the risks present in each new investment that the company is on-boarding. Uncontrollable
risks have a greater effect on loans that the company has already invested in, which is where KRIs can
be particularly effective.
Controllable risks: Controllable risks are managed on the front end of business decisions to decide
whether or not to take certain risks based upon limits that have been put in place.
1. For capacity, the lender can make sure that it has reasonable DTI by putting a cap on the
measure of, for example, 45%. The company can monitor and manage the loans that are
coming so that they don’t exceed this metric.
2. For credit, the company may look at its portfolio to see how many loans are coming in below a
certain threshold. It may also look at the average and see how it is moving up and down.
For collateral, the company may put a cap on LTV and say it wants 95% maximum and 90% average for
its portfolioTo monitor these controllable risks, the company uses multiple dashboards and analytical
data. When a measure is triggered, it forces a refreshing of the company’s analysis and an escalation to
higher committee levels. However, the company realizes that its geographical diversification allows it
to experience stress events without always having to create a
deviation from its business plan.
Uncontrollable risks: Even if WI has all three principles in place,
there are many factors in the mortgage industry that could influence
its risk position. The company cannot control macroeconomic shifts,
but it can prepare itself to be more agile and resilient when these
events do occur. This is where risk indicators can be very effective
and useful. To monitor the macroeconomic environment, WI may
look at indicators such as Gross Domestic Product (GDP) growth,
interest rates, unemployment, and inflation. To monitor the housing
environment, the company may look at mortgage originations, home
price appreciation, affordability, and housing supply and demand. All
these indicators may cause changes in a portfolio’s 3Cs principles.
Controllable risks of new
investments: High Debt-
to-Income, Low Credit
scores, and High Loan-to-
Value.
Uncontrollable risks
managed by KRIs: Low
GDP, Low Growth rates,
High Interest rates, High
Unemployment, and High
Inflation.

RISK REPORTING & KEY RISK INDICATORS
19
To manage collateral in the company’s portfolio, WI may look at leading indicators such as home
prices. With an 85% LTV, the company has a 15% cushion that could protect against losses. However, if
the value of properties depreciates by 20%, that cushion no longer exists. The company may still avoid
a loss if borrowers still have the ability to pay (capacity) and the willingness to pay (credit). But if two
out of the three principles change negatively, then the company will have to take action in managing
the risk. If the property appreciated since the company on-boarded the investment, and
unemployment increases, the company might still be safe because there’s plenty of cushion on that
loan’s collateral. Therefore, there is a constant interplay among these indicators, and WI carefully
monitors all three.
WI’s Risk Indicator Philosophy
The company continues to refine its process to identify those KRIs that best predict future
performance. WI periodically assesses the performance of its portfolio to identify variables that are
more predictive of future performance. In some cases, this may result in the development of KRIs, and
in other cases it provides information that will guide future decision-making around investments.
Analytics are critical to both monitoring existing risks as well as minimizing the risk profile of the
company in the future.
In the past, WI simply established trigger levels related to the key drivers of each significant risk, and if
the trigger level was reached the company would take action according to a defined action plan for
that risk. Over time, WI realized that this process was too mechanical and automated. It decided to
focus on creating a more proactive approach to risk oversight and management so that the process
shows a continuous evolution of approaches. For WI, the goal is to be able to show that the business
has been monitoring the risk before any metric was triggered. Negative trends should be talked about
and discussed at regularly scheduled risk review meetings, before it escalates to a trigger point. The
company still relies on the required action plans when metrics are triggered, but now it also has
incorporated qualitative measures into its ongoing risk oversight process. Every month, the CRO of
each business will review its portfolio and document some qualitative analysis which he communicates
to the business unit head and the enterprise level CRO. This step gives the business unit CRO an
opportunity to communicate the positives and negatives regarding the level of risk the business is
taking on. It also gives the CRO an opportunity to step away from the metrics and to voice his concerns
early, so that they are talked about long before any metrics are triggered. Therefore, WI includes these
qualitative measures as leading indicators for the company.

RISK REPORTING & KEY RISK INDICATORS
20
Examples of KRIs
The company has several supply and demand metrics that help predict the increasing risk that the
market is about to correct. WI looks at six specific indicators for the housing environment. If one
indicator is triggered, it doesn’t mean that the market is melting down, but it does force the company
to assess the risk. The company uses many statistics to indicate when there is a problem. In many
markets there will be one indicator going off, but if there’s two or three that trigger, then the company
will have higher escalations and reviews of the situation.
WI has built many sophisticated leading indicators for its uncontrollable risks. One of WI’s six leading
indicators for the mortgage industry is oil prices. The company identified this indicator when it asked
itself, “What uncontrollable event might affect the capacity of borrowers in the markets where we
have made investments?” It realized that when unemployment was high, borrowers may not have the
income to pay their mortgages, resulting in potential losses for WI. Therefore, the company asked
itself, “What is a leading indicator of when unemployment is about to rise in each of the markets
where we have made investments?” To evaluate unemployment, the company first identified the
largest employers or most significant industries in each area where it had investments. In one area, the
economy was very dependent on the oil and gas industry. WI realized that when oil prices decline, oil
companies may react by laying off employees which would affect not just the oil company’s employees
but also the broader economy in that area. These actions would not only affect the borrower’s ability
to pay but also could have cascading effects on the value of property in that area, increasing the LTV
ratios.
On the other hand, if the same area experiences an increase in oil prices, it could improve the
borrower’s capacity to repay as well as increase property values. The process is illustrated below:
Root Cause Event: Fall in Oil
Prices
Mortgage Delinquencies
Increase
Risk Event: Asset Quality
Declines
Unemployment Increases

RISK REPORTING & KEY RISK INDICATORS
21
Therefore, the company strives to get as far down as it can into the root-cause event that would
ultimately affect its three principles. In this example it was oil prices. The company focused on both
current and forecasted oil prices and considered the potential impacts on its existing portfolio as well
as its future investment strategy. The company went through a similar exercise for each area where
they had a concentration of mortgage investments to identify the largest employers and the industries
upon which those employers were dependent. The company found that the best way to discover such
leading indicators was to engage the people in its organization that were on the ground and had
detailed knowledge of the key economic drivers in each region. That is why each of the company’s
businesses has a CRO that understands and monitors the local market.
Some investors have searched for measures that would predict a decrease in new business for the area
because a decrease in new business could be an early warning sign of a decline in existing business and
employment. They discovered that by monitoring the number of shipments coming into the area, they
could predict business activity. If there was a decline in scheduled shipments coming into an area it
was a sign that business activity was slowing and therefore the workforce would no longer be growing,
thus there would be less demand for mortgages which would result in a potential decrease in the
capacity of existing borrowers to meet their loan obligations. On the other hand, this
leading indicator may also be turned around and used to predict future opportunity events by
monitoring an increase in number of shipments coming into an area.In another area where WI has a
concentration of mortgage investments the dominant industry is mining and the KRI is China’s
economy. Similar to the oil manufacturing example, the company recognized that the health of the
mining companies was crucial to the continued employment of the borrowers in this area. The
company then asked itself, “How can we predict when mining companies will experience a downturn?”
Going further down the chain, WI determined that mining companies in the area were highly
dependent on exports of raw materials to the Chinese market, and therefore it could predict a decline
in demand for raw materials when China’s building infrastructure slowed down. Therefore, WI began
monitoring the Chinese economy, which ultimately would affect WI’s mortgage investments in the
area.
“Therefore, the company strives to get as far down as it
can to the root-cause event of what will ultimately affect
its three principles.”

RISK REPORTING & KEY RISK INDICATORS
22
Supply and demand metrics within the housing markets is another indicator that the company may
use. Stockholm, Sweden is a very robust market and property values are high and on the rise. The
company believes that the area is landlocked meaning there is nowhere to build but up, which is why a
lot of condominium prices are going up. WI may do a lot of scenario analysis on an area like this looking
at several leading indicators. It may assess how many units are coming online and how many units will
be built in coming years. It may look at what the demand is now and what borrower income levels are
relative to condo prices. These indicators will help the company predict the risks of incurring losses on
investments in the area and ultimately in its portfolio.
SUMMARY WI uses a significant amount of data and predictive modeling in monitoring both controllable and
uncontrollable risks. It constantly analyzes data and trends looking for an edge on any variable that
may help the company predict business performance in the future. It may take months or even years
for WI to realize whether a certain mortgage investment was a good or bad decision. Therefore, the
company believes that the more important part of its business is to make sure that the quality and
profitability of new investments are sound. Where KRIs have been most helpful for the company is
when they are used to manage uncontrollable risks. WI uses the root-cause analysis to tie indicators of
risk events to the 3Cs principles that will ultimately determine the risk position of the company’s
existing portfolio as well as help to shape the strategy for making new investments. In this way, WI
seeks to use risk indicators not just for the risks in its existing portfolio but also to be more forward-
looking as it seeks out new investments.

RISK REPORTING & KEY RISK INDICATORS
23
Case Illustration #3: Discovery Health Group
OVERVIEW & COMPANY BACKGROUND
This case study examines the key metrics used by a health insurance company to monitor and report on
its key risks. Discovery Health Group (DHG) is a private healthcare insurance company, headquartered
in Dover, Delaware with offices around the eastern part of the United States. The company has been in
business for over 60 years, currently insures over 157 million people, and has reported revenue of over
$10 billion. The majority of their income is spent on claims and medical expenses, and the remainder is
spent on improving its technologies and customer service. Some of the company’s core product and
services it provides include Government Health Programs (GHPs) and Private Health Coverages (PHCs).
The company’s business core drivers include improving the well-being of its customers, trying to have
stellar customer service relationship, and being more of a consumer focused when it comes to solving
healthcare problems.
ERM PROCESS
The process of building out the ERM function at DHG began in 2008. Since then, the organization
believes their ERM process has gradually gained greater acceptance at all levels of the organization.
DHG believes that maintaining an ERM framework is critical for the long-term success and sustainability
of its ERM process.
According to the ERM Framework developed by DHG, the organization begins by developing and
deploying a risk strategy. The overall risk strategy is connected to individual risk objectives that pertain
to each area of the organization. The following defines the roles of each participant in the ERM process:
Risk Governance: Composed of the Audit Committee, the Board of Trustees and the Senior
Leadership Team (SLT).
Risk Oversight: Composed of the Enterprise Risk Committee (ERC) within Audit and Risk
Management (ARM). The ERC is responsible for ensuring the ERM process is effectively executed
across the organization. ARM collaborates across silos and communicates cross-departmentally to
ensure risk response plans have been implemented and are effectively operating.
Risk Infrastructure: Consists of competent individuals with proper training, effective risk
management procedures, and appropriate technology to analyze and communicate risk exposures.
Risk Management and Ownership: Consists of business unit leaders (risk owners) accepting
responsibility for managing risks within their control in the risk universe.
The objective of the ERM framework, depicted below, is to sustain and continuously improve the
effectiveness of the ERM function at DHG. The ERC is responsible for developing enterprise wide

RISK REPORTING & KEY RISK INDICATORS
24
standards to support the ERM framework. Additionally, the ERC ensures that risk is managed both
holistically and by the individual business units.
DHG’s ERM Framework
DHG employees are encouraged to follow certain key Enterprise Risk Management Steps. These steps
are typically communicated through ERM workshops. All individuals in leadership/management
positions are required to attend informal training on risk mitigation and ERM fundamentals. The
following steps are included in the organization’s ERM process:
Identify Risks: Understand what could prevent a department from achieving the corporate goals
Assess and Evaluate Risks: Understand the impact of risks and provide key information for cost-
effective decision-making
Respond to Risks: Understand and prepare for circumstances impacting risk response
Design and Test Risk Mitigation
Monitor, Assure, Escalate and Report: Provide management with a comprehensive view of
business unit risks
Each business unit has a risk owner responsible for ensuring that ERM plans are properly established
and operating as intended. Risk owners are accountable for developing relevant success measures,
RISK REPORTING & KEY RISK INDICATORS
25
strategies that mitigate, respond to, and track identified risks. The ERM team collaborates with the risk
owners through this process. The responsibility to identify risks resides with each business unit. To
identify risks, DHG holds routine brainstorming sessions which include individuals from cross-functional
areas of the company. These sessions start with business objectives and look at potential risk events
that would impact the achievement of objectives. Risks identified through these sessions are then
assessed based on the residual vulnerability and impact and categorized into common themes. Senior
management and certain employees below senior manager provide input into the risk assessment.
Using the input from the assessment process, DHG classifies risks into tiers with Tier 1 being the most
important. The company currently has 11 Tier 1 risks, 8 Tier 2 risks, and 37 other risks in its risk
inventory.
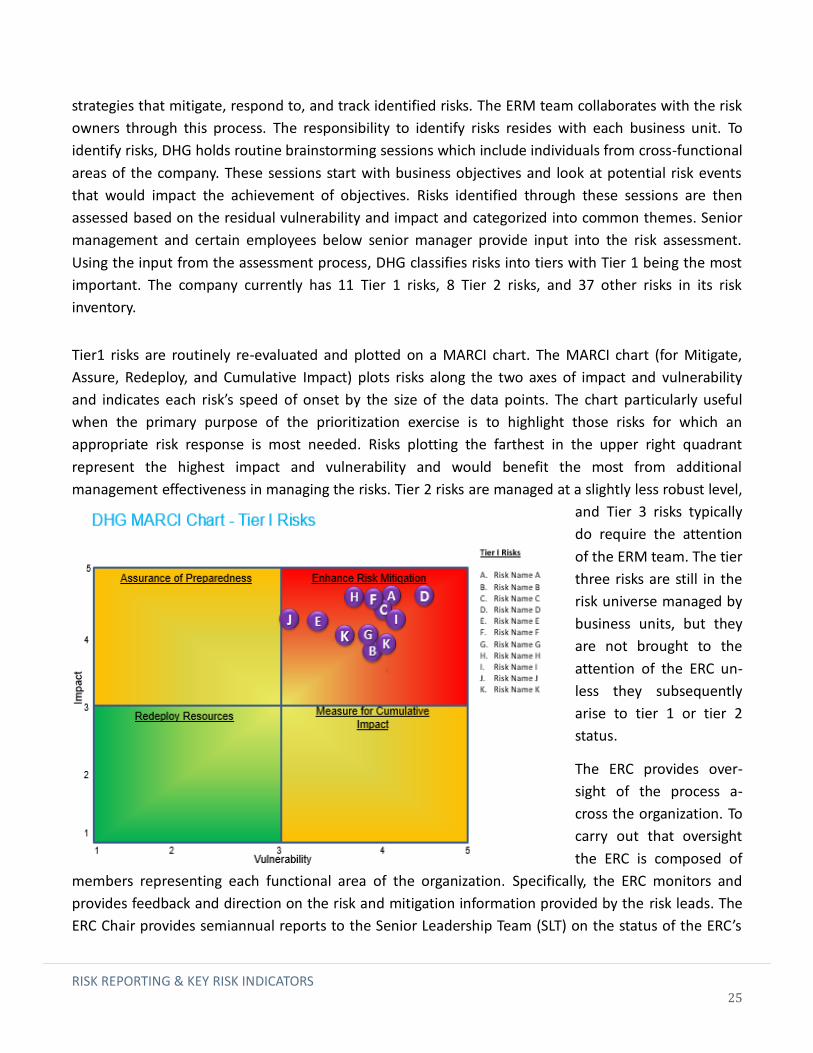
Tier1 risks are routinely re-evaluated and plotted on a MARCI chart. The MARCI chart (for Mitigate,
Assure, Redeploy, and Cumulative Impact) plots risks along the two axes of impact and vulnerability
and indicates each risk’s speed of onset by the size of the data points. The chart particularly useful
when the primary purpose of the prioritization exercise is to highlight those risks for which an
appropriate risk response is most needed. Risks plotting the farthest in the upper right quadrant
represent the highest impact and vulnerability and would benefit the most from additional
management effectiveness in managing the risks. Tier 2 risks are managed at a slightly less robust level,
and Tier 3 risks typically
do require the attention
of the ERM team. The tier
three risks are still in the
risk universe managed by
business units, but they
are not brought to the
attention of the ERC un-
less they subsequently
arise to tier 1 or tier 2
status.
The ERC provides over-
sight of the process a-
cross the organization. To
carry out that oversight
the ERC is composed of
members representing each functional area of the organization. Specifically, the ERC monitors and
provides feedback and direction on the risk and mitigation information provided by the risk leads. The
ERC Chair provides semiannual reports to the Senior Leadership Team (SLT) on the status of the ERC’s

RISK REPORTING & KEY RISK INDICATORS
26
activities and updates on significant /topical risks. A topical risk issue that the ERC can bring up to the
SLT could be the possibility to update or calibrate a risk from a tier 2 to tier 1 risk. The Senior
Leadership Team is comprised of Senior Vice Presidents from each division and is reported to by the
ERC two times annually. In this reporting process, the primary focus of the ERC is those tier 1 risks that
pose a potential enterprise-wide threat to the company.
The ERM function at the company is a part of the Audit and Risk Management Department along with
the company’s Internal Audit Function. The ERM team has found success in monitoring the risks facing
the organization through its association with the Internal Audit Team. This link allows the organization
to improve its assessment of mitigation strategies with regards to individual risks being managed by risk
leads. An example of this would be the outsourcing of certain functions of the operations of the
company to external vendors. Since the company needs to have the assurance that the risks inherent in
vendor outsourcing are managed effectively, the company uses its internal audit function to assess the
controls of those vendors. Also, the vendor management function is audited to determine the
effectiveness of overseeing the company’s managing of relationships with vendors. During this audit
process of vendor management, information received from the Internal Audit team by the ERM team
prompted the discovery that risk mitigation strategies needed to be reviewed and revised to better
handle the risks involved with outsourcing operational functions to vendors. The internal audit function
was able to communicate this to the ERM team, who in turn worked together with the risk leads and
the ERC to develop increased and improved risk mitigation activities to better manage the risk.
However, the ERM team is not always involved in the decision-making process from the beginning. In
some cases, after the decision has been made to launch a significant enterprise initiatives, the ERM
team may assist the business unit management in completing the ERM steps to increase the likelihood
of success in accomplishing the initiative’s objective.

RISK REPORTING & KEY RISK INDICATORS
27
RISK REPORTING & KEY RISK INDICATORS
When reporting on key risks, the company will identify risk owner, success measures, mitigation
strategies, a risk score, documentation of Key Risk Indicators (KRIs), and accumulation of any other
relevant information to manage risks. This process begins with individual business unit risk leads
identifying those significant risks.
The development of KRIs occurs in tandem with the reporting of key emerging risks expressed above.
The difference is the KRIs associated with those risks are developed, documented, and presented to the
ERC but are not reported on the company’s ERM Dashboard. What goes on the ERM Dashboard are
only the risk description, success measures, risk scores, and mitigation strategies. The success
measures are the high-level objectives and outcomes that would demonstrate that the risk is
satisfactorily mitigated and opportunity optimized.
These reports begin with a risk description which details the risk and what it involves. The next item is
the background of the risk, which discusses the root causes and consequences involved. The report also
includes success measures and the mitigation strategy.

RISK REPORTING & KEY RISK INDICATORS
28
For example, a health care company like DHG can face regulatory risks, which can change its business
environment. An increase in regulatory oversight and control could result in undesirable changes to
DHG’s business model, increased costs or otherwise adversely affect the company’s ability to conduct
business efficiently. When this risk is fully versed, discussed, and agreed on to be a tier 1 emerged risk,
the ERM team adds it on the Dashboard.
Secondly, the ERM team engages the risk lead in determining success measures for the optimal
management of the risk. The success measures are the high-level objectives and outcomes that would
demonstrate that the risk is being satisfactorily mitigated and the opportunity optimized. The ERM
Team seeks to have management define quantifiable success measure statements, but will allow
qualitative statements. With respect to regulatory risk, a simple qualitative success measure statement
could be: Regulatory requirements that could be problematic onto the company’s strategy, business
performance, or ability to implement are avoided or kept to a minimum. Essentially, the success
measures for all risks help establish and align the risk mitigation strategies in place or planned by DHG
to manage the risk exposures or opportunities they present.
The report next focuses on risk mitigation strategies being employed for the risk. The mitigation
strategies include current and proposed mitigation strategies. The strategies are listed in rank order
starting with the most impactful mitigation strategy. Each risk mitigation strategy has a detailed
description of the strategy, a high-level action item to implement the strategy, the status of the
strategy, and an impact statement that corresponds to the risk. The purpose of the status is to show
whether or not the strategy to combat a risk is actively being employed. When mitigation strategies
simply are not reducing the risk impact or likelihood, the risk lead informs the ERM Team and, at times
the ERC. In this situation the risk lead will typically be advised to develop additional or revised
mitigation strategies as well as facilitate reporting the risk exposure to the Risk Governance level (i.e.
Executive Risk Committee and Audit Committee).
While the company has developed Key Risk Indicators (KRIs) for its tier 1 risks, it has not yet
incorporated KRIs into its ERM dashboard reports. The ERM Team began developing the KRI concept for
usage in the DHG enterprise risk management processes in 2011. The ERM Team worked with the Tier
1 Risk leads to identify and incorporate KRIs into their ERC presentations beginning in 2012. The KRIs in
the ERC presentation are specific to each risk, however there is not a formal process surrounding their
development. The ERM Team facilitates consultative meetings with the Risk Lead and other subject
matter experts engaged by the Risk Lead to identify suitable KRIs. The ERM Team advises the Risk Lead
to self-report the available KRI information along with other factors/sources of information that
management may be using to intuitively ‘know’ when the risk is increasing/decreasing/holding steady
(i.e. the basis for management’s “gut” feeling). The majority of the KRIs used by the company are not
RISK REPORTING & KEY RISK INDICATORS
29
quantitative and are subject to the judgment of the risk lead in the impacted business areas. An
example of a KRI related to regulatory risk would be tracking key elections. This would include
monitoring the candidates running for influential positions of government at the state and federal
levels, each candidate’s stance on various health care issues, the candidates’ popularity among voters,
and viability to be elected to the office. Another KRI could be monitoring external surveys and
information sources that highlight consumers’ issues on health care consumption and needs as
compared to the company’s stance, policies, or procedures.
The reporting of KRIs to the ERC has been limited to the self-reporting done by the Risk leads. DHG is
working towards having a more formalized, transparent process to allow the ERM Team, the ERC, and
management beyond the Risk Lead’s business area to gauge the movement of the risk and the
effectiveness of the associated risk mitigation strategies.
Emerging Risks
Since the inception of an ERM framework in the company, DHG has been primarily focused on
developing robust reporting of tier 1 risks. The reporting on emerging risks and their associated KRIs
and risk mitigation strategies has lagged behind. However, the ERM team and the CRO are currently
developing robust emerging risk identification and reporting processes that should bring additional
value to the ERM process by ensuring that significant emerging risks are included in its risk inventory,
and that related KRIs have been identified to monitor these risks.
Emerging risks, similar to the other risks, are primarily managed by the risk leads with regular dialogue
with the ERM team. The Risk leads generally identify these emerging risks from a combination of
discussions with external parties, industry news, and review of internal information. When risk leads
identify these risks, they try to get as much information as possible to track the risk, particularly to
determine the velocity at which the risk is approaching. The risk leads and the ERM team meet every
six months to discuss and document those emerging risks that appear to be approaching the most
rapidly. An example of an emerging risk is biological and chemical terrorism. This is a risk that could
originate and play out in the company’s service area resulting in a large scale disaster response
impacting members, employees, business partners, and surrounding community. A key risk indicator
related to this risk could be to tracking threat levels from emergency management and federal
homeland security officials. Another KRI could be monitoring news reports of reported attempts that
involve the company, the health insurance industry, and the communities situated near the company.
RISK REPORTING & KEY RISK INDICATORS
30
SUMMARY
Discovery Health Group has a comprehensive enterprise risk management process that is fairly mature.
While the company’s risk reporting through its ERM Dashboard is fairly robust, it is still working to
develop formal KRIs that provide more of a leading indicator of risks. The company has effectively used
an informal process for monitoring risks by discussing leading indicators with risk owners and key
subject matter experts. These leading indicators, while predominantly qualitative, still provide insights
about the future direction of risks, and are proving to be a stepping stone towards developing more
formal, quantifiable KRI measures.
RISK REPORTING & KEY RISK INDICATORS
31
Conclusion
Looking at the three individual case studies, there are some important similarities among the three
companies. All three companies have a formal ERM process in place, as well as a governing body that
oversees the ERM function as a whole. All three companies operate in heavily regulated industries and
rely on detailed analytical data to support their ERM programs. Also, each company’s ERM program was
fairly mature before it began developing key risk indicators. An organization needs to have a good
understanding of the risks it faces before it can begin developing metrics to track those risks.
Each company has taken a slightly different path in the development of key risk indicators, tailoring the
approach to fit the needs and capabilities of each organization. Some companies use more analytical
data to monitor the major risks facing them, and some use more qualitative analyses in their approach.
Some are more focused on gathering data to develop their leading indicators, and others are focused
on maturing other areas of their ERM program before tackling more quantitative indicators. Even
though the companies have varying levels of developing KRIs, they all find value in the processes they
use. Although the development process may need to be different for different companies, the key steps
outlined in this report illustrate effective practices. The case studies in this report should serve as a tool
for ERM practitioners that are looking for guidance on risk reporting and the development of key risk
indicators.

RISK REPORTING & KEY RISK INDICATORS
32
About the Authors
Stephen R. Boyd is a graduate student in the Master of Accounting program at
NC State University where he has a concentration in Enterprise Risk
Management. After working in a number of industries, he majored in
accounting at Campbell University where he received his Bachelor’s Degree in
Business Administration. His professional interests lie in the field of auditing
and fraud prevention, as well as risk management. He plans to work for a
regional accounting firm in North Carolina upon graduation, and become a CPA.
Johannes A. Moolman is a graduate student in the Master of Accounting
program at NC State University where he is concentrating in Enterprise Risk
Management. After graduating from high school in South Africa he accepted a
scholarship to attend college and play tennis in the United States. In 2014, he
graduated with a Bachelor degree in Accounting and Management Information
Systems from the University of Mount Olive. Upon graduation from NC State,
he will work in the Risk Assessment function at PricewaterhouseCoopers in
Charlotte. He plans to become a CPA.
Nkemjika J. Nwosu is a graduate student in NC State’s Masters of Accounting
program with a concentration in Enterprise Risk Management. After moving
from Lagos, Nigeria to the United States, he attended high school in
Fayetteville, NC. While obtaining his bachelor’s degree in Accounting from
Fayetteville State University, he developed corporate experiences in retail, and
interned at both AXA Equitable Insurance Advisors and Duke Energy
Corporation. He is interested in the technology, health, and energy sector.
Upon graduation, he will work in the audit practice as a staff auditor at Deloitte
Touché Tohmatsu Limited and plans to obtain both CPA and CISA certifications.