risk management & insurance strategies for power generation · student intern project –...
TRANSCRIPT
STUDENT INTERN PROJECT – PRE-DECISIONAL – NOT A STATEMENT OF ADMINISTRATION POLICY
WPI Project Report to the United States Department of Energy
Risk Management & Insurance Strategies for Power Generation
This report represents the work of WPI undergraduate students submitted to the faculty as
evidence of completion of a degree requirement. WPI routinely publishes these reports on its
website without editorial or peer review.
Submitted by:
Mark DellaCroce
Austin Lindner
Andrea Rota
Cooper Wolanin
Submitted to:
Project Advisors:
Prof. Scott Jiusto, Ph.D.
Prof. James Hanlan, Ph.D.
Project Liaison:
Dr. Samuel Bockenhauer, Ph.D.

STUDENT INTERN PROJECT – PRE-DECISIONAL – NOT A STATEMENT OF ADMINISTRATION POLICY
ii
Abstract
Insurance can be an important risk mitigation strategy for power generation. The 2017
hurricane season, for example, highlighted the challenges faced by electric utilities in serving
their customers. This project focused on gathering data from power utility and insurance
companies to learn more about power sector risks and corresponding insurance industry
products. Interviews and case studies of power utility and insurance companies illuminated
connections between the two intertwined industries. Findings emerged including what the two
industries view as their largest risks and how nuclear power is covered through a cumulative
industry pool. The project provided the Department of Energy insights into both power sector
insurance issues and challenges of researching same.

STUDENT INTERN PROJECT – PRE-DECISIONAL – NOT A STATEMENT OF ADMINISTRATION POLICY
iii
Table of Contents
Table of Contents iii
Executive Summary vii
Chapter 1: Introduction 1
Chapter 2: Background 2
Section 2.1 Energy Sources 2
Section 2.1.1 Coal Plants 5
Section 2.1.2 Hydroelectric Energy 7
Section 2.1.3 Natural Gas 9
Section 2.1.4 Nuclear Energy 10
Section 2.1.5 Solar Energy 10
Section 2.1.6 Wind Energy 11
Section 2.1.7 Energy Transmission 12
Section 2.2 Disasters and Risks 13
Section 2.3.1 Natural Disasters/ Major Disasters/ Catastrophes 14
Section 2.3.2 Meteorological Impact 15
Section 2.3.3 Geophysical Impact 17
Section 2.3.4 Hydrological Impact 18
Section 2.3.5 Climatological Impact 19
Section 2.3.6 Cyber Security Risks 20
Section 2.3 Insurance 20
Section 2.3.1 How Risk Insurance Works 21
Section 2.3.2 Primary Insurance 22
Section 2.3.3 Reinsurance 24
Section 2.3.4 Potential for Government Last Resort 25
Section 2.3.5 Current Insurance Plans 26
Section 2.3.6 Price-Anderson Act 26
Section 2.4 Types of Power Utility CCompanies 27
Section 2.5 Literature Analysis 29
Chapter 3: Methodology 33

STUDENT INTERN PROJECT – PRE-DECISIONAL – NOT A STATEMENT OF ADMINISTRATION POLICY
iv
Section 3.1 Literature Review 35
Section 3.2 10-K Form Analysis 35
Section 3.3 Interviews 37
Chapter 4: Results 39
Section 4.1 Nuclear Company Products 39
Section 4.2 Non-Nuclear Energy Insurance Products 43
Section 4.3 Investor Owned Utilities 46
Section 4.4 Municipal Utility 52
Section 4.5 Cooperative Utility 54
Section 4.6 Merchant Generators 56
Section 4.7 Power Sector Case Study Chart 57
Chapter 5: Findings and Analysis 58
Section 5.1 Nuclear Findings 58
Section 5.2 Non-Nuclear Insurer Findings 61
Section 5.3 Power Utility FFindings 63
Chapter 6: Next Steps in Conclusion 70
Works Cited 72
Appendix A: Interview Plan 77
Appendix B: Threats of Natural Disasters on Power Generation Technologies 83

STUDENT INTERN PROJECT – PRE-DECISIONAL – NOT A STATEMENT OF ADMINISTRATION POLICY
v
Table of Figures
Figure 1: Generating Capacities and Additions of Energy Sources in the United States (13-14) 3
Figure 2: Environmental Carbon Emission by Energy Related Sources 4
Figure 3: Cumulative Investment in Nonrenewable and Renewable Sources from 2015-2025 5
Figure 4: Coal Powered Plant 6
Figure 5: Coal Transportation Routes Across the United States 7
Figure 6: Top Hydroelectric Power Generating States in the United States in 2009 8
Figure 7: Natural Gas Consumption per Energy Sector 9
Figure 8: Potential Causes of Power Blackouts 12
Figure 9: Hierarchy and Terminology of Natural Hazards 14
Figure 10: Amount of Electricity Produced by Various Types of Resources in New Jersey 16
Figure 11: Floodplain by State for the United States 19
Figure 12: Risk Insurance and Assessment Summary 21
Figure 13: Insurance Products Definitions and Coverage 24
Figure 14: Average Electric Power Service Interruptions Source: EIA, 2015 29
Figure 15: Relationship between Provided Data Sources and Key Project Questions 35
Figure 16: Insurer A Product Summaries 40
Figure 17: Insurer B Product Summaries 42
Figure 18: Insurer C Insurance Product Summaries 43
Figure 19: Insurer D Insurance Product Summaries 44
Figure 20: Insurer E Insurance Product Summaries 45
Figure 21: Power Utility AA Energy Generation Sources 47
Figure 22: Power Utility AA Generation Portfolio over Last Ten Years 48
Figure 23: Power Utility BB Generation Sources 50
Figure 24: Power Utility BB Portfolio over Last Ten Years 51
Figure 25: Location of Power Utility FF Managed Cooperative Utilities 55
Figure 26: Case Study- Power Sector Chart 57
Figure 27: Total Nuclear Insurer Coverage Mandated By the Price-Anderson Act 60
Figure 28: Total Nuclear Insurer Funds under the Price-Anderson Act 60
Figure 29: United States Vulnerability to Natural Hazards 66

STUDENT INTERN PROJECT – PRE-DECISIONAL – NOT A STATEMENT OF ADMINISTRATION POLICY
vi
Figure 30: Potential Threats to Nuclear Power Generation 84
Figure 31: Potential Threats to Natural Gas Power Generation 85
Figure 32: Potential Threats to Wind Turbines 86

STUDENT INTERN PROJECT – PRE-DECISIONAL – NOT A STATEMENT OF ADMINISTRATION POLICY
vii
Executive Summary Introduction
Insurance can be an important risk mitigation strategy for power generation. This report
contains information regarding the relationship between power utility and insurance companies,
including how these industries operate and mitigate their risks. Natural disasters, terrorist and
cyber-attacks, and water related issues including droughts and flooding, are constantly changing
risks causing the insurance industry to adapt to infrequent yet potentially catastrophic events.
The power sector faces these risks with the established forms of power generation including
natural gas, coal, nuclear, hydropower, wind, solar, and others. New forms of energy generation
technology bring new risks for the insurance industry to insure. Events such as Hurricane Irma,
Harvey, Jose and Maria also required a massive rebuilding process, of which insurance was an
important component.
Insurance companies offer products to power utility companies as a form of risk
mitigation. Some large companies self-insure as a large portion of their risk mitigation; however,
most invest in insurance products to cover potential liabilities. Insurance products offer
mitigation in the form of property, casualty, liability, or cyber coverage. Power utility companies
pay a premium to the insurance companies upfront which secures them coverage in the event of a
disaster or production interruption. The relationship between the risks power utility companies
face and the insurance products offered to them is examined through background research and by
conducting interviews.
Objectives and Methods
The ultimate goal of this project was to analyze electric power utility companies and
insurance companies to identify possible gaps with respect to the insurance coverage offered to
the electric power utility companies. Key accomplishments included:
1. Identifying the key risks that are faced by electric utilities related to power generation
with specific regards to various types of generation technology;
2. Analyzing the products insurers offered in reference to the identified physical risks;

STUDENT INTERN PROJECT – PRE-DECISIONAL – NOT A STATEMENT OF ADMINISTRATION POLICY
viii
3. Determining how power generation-based risks and the insurance plans that covered
them have adapted over time;
4. Researching key case studies of large disasters and the insurance claims that covered
them.
The first objective was completed through interviews of power utility and insurance
companies. Employees of these companies were contacted and questioned about the biggest risk
their companies face. The second objective involved preliminary online research and analysis of
the results of interviews with insurance companies. The companies which responded often
provided examples of their insurance products, and these products were documented and cross-
referenced to the risks faced by power utility companies. The third objective was achieved by
examining past insurance products and how they changed over time. The final objective involved
creating case studies based on the information discovered and documented through completing
the previous three objectives. Other important events were inspected and general findings are
discussed in Chapter 5.
Findings
Approximately fifty power utility companies and twenty insurance companies were
contacted from which five power utility companies and four insurance companies responded and
provided insights. The findings below were identified based on a small group of companies
including insurers who specialize in either nuclear, renewable energy power sources, or
distribution systems insurance. The findings with respect to nuclear power generation were
extracted from online resources rather than interviews because the information is public;
therefore the main points can be found below. Findings regarding insurance came from
interviews, case studies, and online research. The power utility company findings came from
interviews and case studies with the four categories of power utility companies; municipal,
cooperative, investor owned, and merchant generators. Findings are listed below, and further
explained in Chapter 5.
Nuclear power insurance:

STUDENT INTERN PROJECT – PRE-DECISIONAL – NOT A STATEMENT OF ADMINISTRATION POLICY
ix
• The Price-Anderson Act requires public compensation in case of nuclear accidents while
also limiting the liability of nuclear incidents.
• Nuclear insurers pool together their resources to one general fund in case of a nuclear
incident.
Non-nuclear power generation and cybersecurity insurance products:
• The biggest risks insurance companies cover are natural disasters.
• The power utility market with respect to renewable energy sources is relatively new and
growing compared to the power utility market for nonrenewable energy sources;
therefore the insurance industry is more competitive for the power utility market with
respect to renewable energy sources.
• Cyber protection is a continuous learning process for those generating protection
methods. Insurance company underwriters are constantly evolving their risk equations
and models in order to try and optimize cyber insurance products.
How power utility companies manage risk: • The biggest risks faced by most types of power utility companies are natural disasters and
terrorism (including cyber).
• Companies often invest in multiple insurance products to protect against all risks
associated with the company.
• Risk associated with power utilities varies by region. Weather and geographic location
cause this variation.
• Numerous companies’ generation portfolios show a decrease in coal plant electric power
generation with an increase in natural gas power generation.
Possible Next Steps
Our analysis suggests a number of possible next steps in this area. First, the post-
hurricane season is the most difficult time to receive answers regarding insurance questions. The
best time for this type of research is the spring or early summer because the number of claims
filed is lower. Another next step to take is to interview power utility companies first before

STUDENT INTERN PROJECT – PRE-DECISIONAL – NOT A STATEMENT OF ADMINISTRATION POLICY
x
trying to contact insurance companies because the power utility companies often are willing to
share their insurance carrier; however, insurance companies usually desire to keep their client
information private. Future research teams could benefit from more in-person interviews as there
was more success with talking face to face. Additional questions and answers were brought up in
person compared to over the phone.
Contacting additional insurance companies would be beneficial to gain insight into how
they adapt their products over time. Although the nuclear insurance market is stagnant, looking
into changes would provide benefits in comparing insurance products to risks faced. Additional
power utility companies could be contacted for information regarding transmission lines as that
area was not a major focus; however, great depth can be added in this segment.
There are also more ways to make 10-K form data gathering more efficient. 10-K forms
are cumbersome and a computer script could be written to analyze the important aspects of the
10-K rather than just browsing through them by hand. More detailed data gathering can be
performed of insurance products through examining the insurance modeling plans conducted by
company underwriters. Each of these steps would help further research to understand
connections between power utility and insurance companies.

STUDENT INTERN PROJECT – PRE-DECISIONAL – NOT A STATEMENT OF ADMINISTRATION POLICY
1
Chapter 1: Introduction The integrity of the United States electricity system is an important aspect of the
country’s everyday functionality. Disasters such as Hurricane Sandy demonstrated the impact
unexpected events can have on our nation’s electricity system. The destruction caused by events
such as Hurricane Sandy exposed how essential the insurance industry is in relation to electric
power utilities. An important goal for many different stakeholders is to ensure a resilient,
reliable, affordable electricity system.
This Interactive Qualifying Project team, in collaboration with the Department of Energy,
focused on understanding the role of insurance in addressing risks to power generation. Using
extensive research, interviews and case studies, and data analysis, information was gathered to
address key project questions including risks faced by power utility companies and how those
risks can be addressed through insurance strategies. The risks associated with various types of
power generation were analyzed and current insurance products offered to power utility
companies were summarized.
Research on the topic of insurance for power utility companies is limited. Interviews with
power utility companies and insurance companies were conducted to gain necessary information
regarding their relation to one another. Case studies were developed to generate and support
findings with regards to power generation and insurance companies. One goal of this project was
to analyze electric power utility companies and insurance companies to identify possible gaps
with respect to the insurance coverage offered to the electric power utility companies.

STUDENT INTERN PROJECT – PRE-DECISIONAL – NOT A STATEMENT OF ADMINISTRATION POLICY
2
Chapter 2: Background
The destruction or damage to a small part of the United States energy structure can
sometimes lead to significant delays and losses. Weather and climate variability are crucial
deciding factors in the production of electric power. Based on geographic location, specific
climate risks can alter the efficiency of certain power generation plants. “The rise and fall of
temperature influences electric power consumption, while the episodic and long-lasting regional
availability of water supply can constrain different forms of energy production” (United States
Department of Energy, 2017).
Different forms of power generation have different risks depending on the climate and
geographical location of the power generation plant. Types of energy sources such as solar,
wind, and hydroelectric constitute energy for the nation, but possess their own risks that can
decrease production rates. Nuclear, natural gas, and coal are responsible for generating a
significant amount of the nation’s energy, but come with a list of defined risks regarding
production. Natural gas power plants are currently the leading source of energy generation for
the United States.
“By the year 2050 the total world energy demand is estimated to increase at least 50%,
combined with an expected reduction in fossil fuel energy technologies” (Harte, 2013). Because
of high cost and high risk of energy sources and the expected demand for energy in the coming
years, the current power generating plants must be maintained while new solutions are
discovered (Harte, 2013). Adaptation of the current plants is another crucial element to
advancing the electric power system. “The adaptation of critical infrastructure to unexpected
weather variability is critical to maintaining infrastructure stability, adequate fuel supply, as well
as the grid and electricity delivery reliability” (United States Department of Energy, 2017).
Section 2.1 Energy Sources
The United States has one of the cleanest, most reliable, and affordable electricity
systems in the world. Figure 1 below shows the generating capacities and additions to energy
sources in the United States in 2013 and 2014. Between 2013 and 2014 there is a significant
increase in the capacities of the renewable sources. Both wind and solar doubled in capacities

STUDENT INTERN PROJECT – PRE-DECISIONAL – NOT A STATEMENT OF ADMINISTRATION POLICY
3
and additions between the two years as more construction was taking place. Natural gas
combined cycle plants have been increasing while coal plants are being decommissioned in part
because of changing markets, economics, and policy.
Figure 1: Generating Capacities and Additions of Energy Sources in the United States (13-14)
Source: Willis Power Market Review
Figure 2 below is a representation of the decrease of carbon emission by energy related
sources into the environment (United States Department of Energy, 2017). Over the ten-year
span carbon dioxide emission dropped 14 percent, which is approximately 800 million metric
tons of carbon dioxide emission.

STUDENT INTERN PROJECT – PRE-DECISIONAL – NOT A STATEMENT OF ADMINISTRATION POLICY
4
Figure 2: Environmental Carbon Emission by Energy Related Sources
Source: Transforming the Nation’s Electricity System: The Second Installment of the QER |
January 2017
The renewable energy sector is growing rapidly. Falling capital costs, combined with
federal and state incentives, is a prime factor spurring this investment pattern. The current
lifespan for renewable energy sources is approximately 20-35 years (Harte, 2013). Figure 3
below reflects the predicted decline in the rate of investment of most nonrenewable resources
and the growth of renewable sources by 2025. The largest sections are onshore and offshore
wind power, and the solar panel industry.

STUDENT INTERN PROJECT – PRE-DECISIONAL – NOT A STATEMENT OF ADMINISTRATION POLICY
5
Figure 3: Cumulative Investment in Nonrenewable and Renewable Sources from 2015-2025
Source: Bloomberg New Energy Finance 2030 Market Outlook
Section 2.1.1 Coal Plants
Coal plants account for a significant share of U.S. electricity generation, but some have
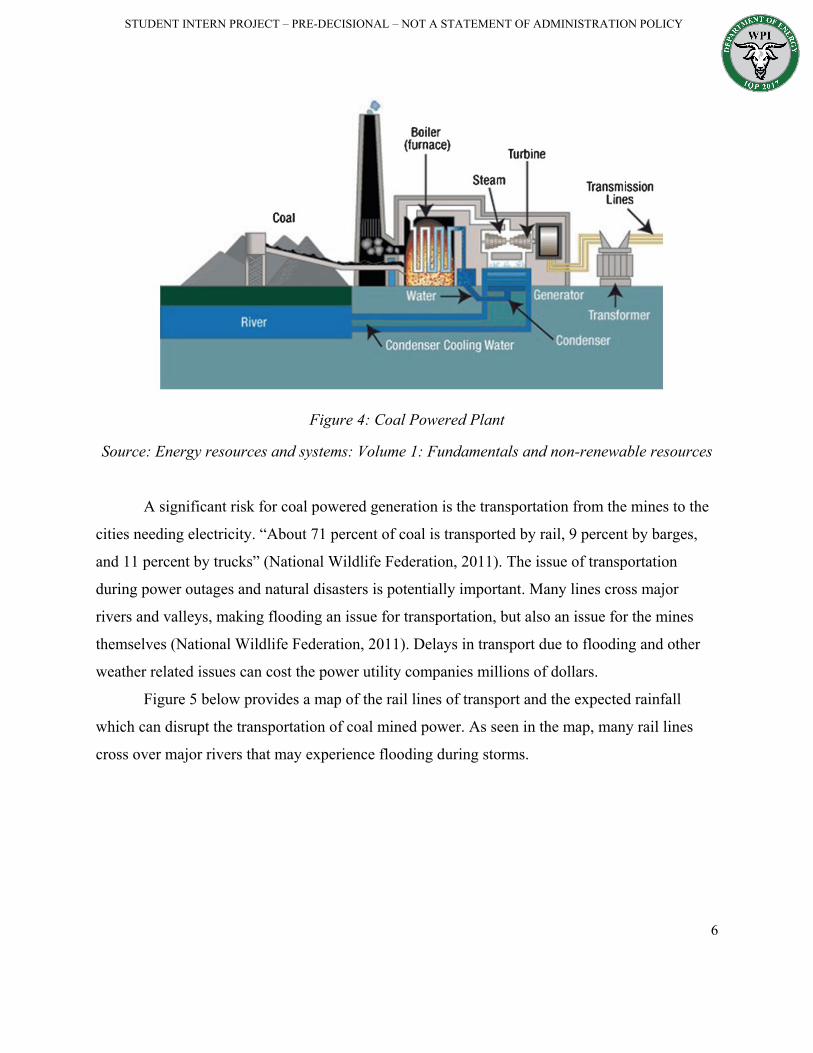
retired in recent years. Figure 4 below gives an illustration of a typical coal-fired powered plant.
As seen in the image, there are many aspects to operating a coal plant efficiently. An important
requirement to operate many coal-fired plants is the water source. In order to condense steam
from the turbine, a large amount of water is needed, often from a river or lake.
STUDENT INTERN PROJECT – PRE-DECISIONAL – NOT A STATEMENT OF ADMINISTRATION POLICY
6
Figure 4: Coal Powered Plant
Source: Energy resources and systems: Volume 1: Fundamentals and non-renewable resources
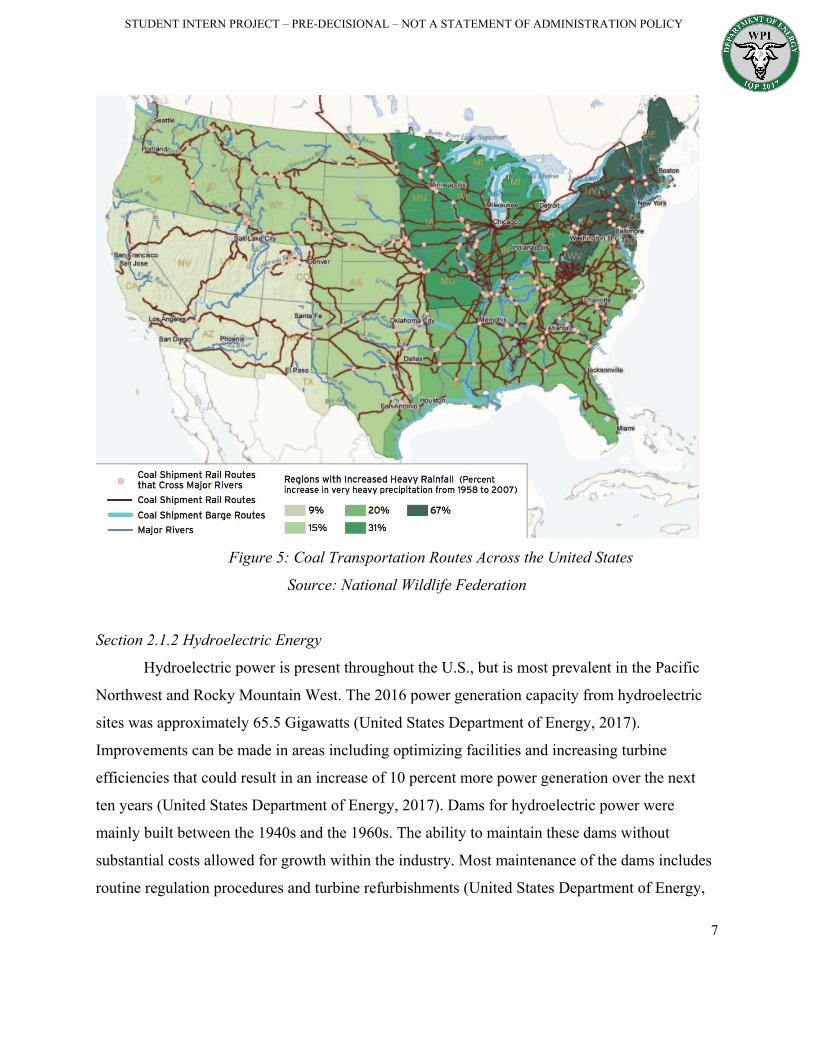
A significant risk for coal powered generation is the transportation from the mines to the
cities needing electricity. “About 71 percent of coal is transported by rail, 9 percent by barges,
and 11 percent by trucks” (National Wildlife Federation, 2011). The issue of transportation
during power outages and natural disasters is potentially important. Many lines cross major
rivers and valleys, making flooding an issue for transportation, but also an issue for the mines
themselves (National Wildlife Federation, 2011). Delays in transport due to flooding and other
weather related issues can cost the power utility companies millions of dollars.
Figure 5 below provides a map of the rail lines of transport and the expected rainfall
which can disrupt the transportation of coal mined power. As seen in the map, many rail lines
cross over major rivers that may experience flooding during storms.
STUDENT INTERN PROJECT – PRE-DECISIONAL – NOT A STATEMENT OF ADMINISTRATION POLICY
7
Figure 5: Coal Transportation Routes Across the United States
Source: National Wildlife Federation
Section 2.1.2 Hydroelectric Energy
Hydroelectric power is present throughout the U.S., but is most prevalent in the Pacific
Northwest and Rocky Mountain West. The 2016 power generation capacity from hydroelectric
sites was approximately 65.5 Gigawatts (United States Department of Energy, 2017).
Improvements can be made in areas including optimizing facilities and increasing turbine
efficiencies that could result in an increase of 10 percent more power generation over the next
ten years (United States Department of Energy, 2017). Dams for hydroelectric power were
mainly built between the 1940s and the 1960s. The ability to maintain these dams without
substantial costs allowed for growth within the industry. Most maintenance of the dams includes
routine regulation procedures and turbine refurbishments (United States Department of Energy,
STUDENT INTERN PROJECT – PRE-DECISIONAL – NOT A STATEMENT OF ADMINISTRATION POLICY
8
2017). Hydroelectric plants often have a lifespan of over 100 years (United States Department of
Energy, 2017).
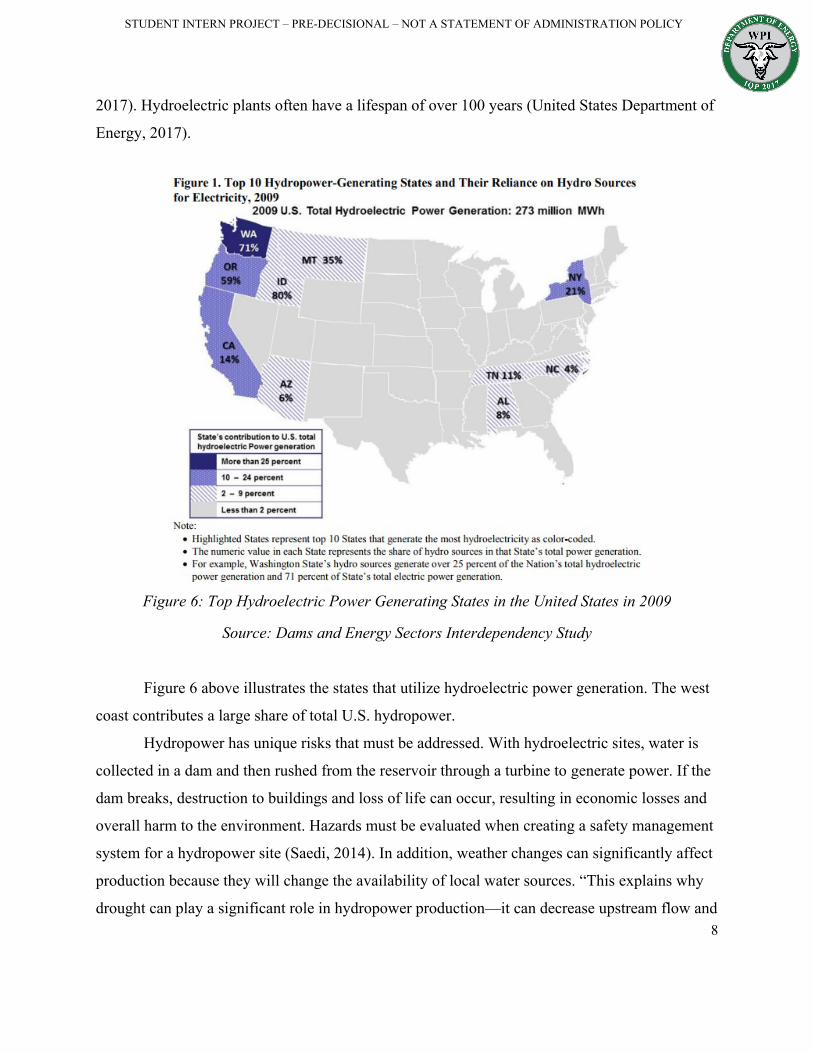
Figure 6: Top Hydroelectric Power Generating States in the United States in 2009
Source: Dams and Energy Sectors Interdependency Study
Figure 6 above illustrates the states that utilize hydroelectric power generation. The west
coast contributes a large share of total U.S. hydropower.
Hydropower has unique risks that must be addressed. With hydroelectric sites, water is
collected in a dam and then rushed from the reservoir through a turbine to generate power. If the
dam breaks, destruction to buildings and loss of life can occur, resulting in economic losses and
overall harm to the environment. Hazards must be evaluated when creating a safety management
system for a hydropower site (Saedi, 2014). In addition, weather changes can significantly affect
production because they will change the availability of local water sources. “This explains why
drought can play a significant role in hydropower production—it can decrease upstream flow and

STUDENT INTERN PROJECT – PRE-DECISIONAL – NOT A STATEMENT OF ADMINISTRATION POLICY
9
require the diversion or retention of water that would otherwise go to produce electricity or to
other water purposes during times of scarcity” (United States Department of Homeland Security,
2011).
Section 2.1.3 Natural Gas
Natural gas has proven to be a reliable source for power generation, as almost 33 percent
of the energy production for the United States in 2015 was from natural gas (United States
Department of Energy, 2017). Factors relating to the increase in the use of natural gas include:
low production cost, the availability of a domestic supply, low capital costs, and existing
infrastructure (United States Department of Energy, 2017). The increase in the use of natural gas
as an energy source allowed for 1,254 million metric tons of carbon dioxide to be avoided over
the ten-year span between 2005 and 2014 (United States Department of Energy, 2017).
Figure 7 below presents the natural gas consumption and prediction of the United States
in trillions cubic feet. The total amount consumed is projected to stay steady through 2025.
Figure 7: Natural Gas Consumption per Energy Sector
Source: Energy resources and systems: Volume 1: Fundamentals and non-renewable resources
An important risk that the natural gas industry faces is the ability to meet the demand
during peak times in the year. The winter season has been shown to diminish the total supply of
2005 2006 2007 2008 2010 2015 2020 2025Residential 4.83 4.37 4.73 4.83 4.81 5.01 5.15 5.19Commercial 3.00 2.83 3.02 3.05 2.96 3.20 3.37 3.53
Industrial 6.60 6.49 6.60 6.64 6.95 7.00 6.93 6.96Electric Power 5.87 6.24 6.78 6.83 6.70 6.56 5.92 5.30
Total 20.30 19.93 21.13 21.35 21.42 21.77 21.37 20.98
YearConsumption Sectors
Natural Gas Consumption per Energy Sector in Trillions of Cubic Feet

STUDENT INTERN PROJECT – PRE-DECISIONAL – NOT A STATEMENT OF ADMINISTRATION POLICY
10
natural gas. Industrial heating is in competition with commercial and residential heating for the
supply of natural gas fired electricity generation (Hibbard, 2012). Losses from major interstate
pipeline issues serve to be a significant risk in the generating capacity (Hibbard, 2012). Within
the pipelines a certain pressure must be maintained in order to maintain a constant flow of
natural gas. When a company exceeds their limit in gas usage, the pressure within the pipelines
decreases, resulting in losses in other areas (Hibbard, 2012). Power outages serve as a major
component in risk because the loss of electricity can result in no service to both branches and
loss in pipeline pressure starting at the pipeline compressor stations (Hibbard, 2012).
Section 2.1.4 Nuclear Energy
Nuclear energy is stored in the nucleus of an atom. When this energy is released, by
nuclear fission, heat is produced which can be used to generate energy. Each nuclear power plant
contains a reactor that controls the nuclear fission reactions. Due to the radioactivity being
created from nuclear fission, a protective shield is placed around the reactor.
The decrease in nuclear production continues to be prevalent as no new nuclear plants are
currently under construction. The United States is maintaining its nuclear plants, which are
responsible for producing 25 percent of the nation’s energy, but the investment required for new
plants is high (Larson, 2017). They supply the largest portion of the United States’ energy
without the emission of greenhouse gases, at 59 percent (Logan, 2017). The cost of construction
and overall size makes nuclear plants difficult to build and maintain (Larson, 2017).
Section 2.1.5 Solar Energy
Solar is changing the way the United States collects energy on the industrial and
residential level. With the introduction of Chinese panels into the global market, the price of
panels dropped by more than 75 percent between 2008 and 2013 (Willis, 2014). Insurance must
be implemented on these panels due to the variability that may be introduced by factors such as
grid reliability, power outages, and lack of sun (Willis, 2014). Improvements to installation
techniques allowed the price of insurance to decline. Although households receive insurance for
their personal panels, the insurance companies’ most active area is in utility scale photovoltaic
arrays (Willis 2014).

STUDENT INTERN PROJECT – PRE-DECISIONAL – NOT A STATEMENT OF ADMINISTRATION POLICY
11
The productivity of photovoltaic arrays is dependent on weather. This dependency on
weather makes it difficult to predict the output of energy produced. When the supply is low,
energy storage capacities are needed, which require a significant amount of money and years to
build (Harte, 2013). In contrast to solar photovoltaic power, the concentrated solar power
technology focuses on heating the water into vapor to power a turbine. Improvements to the
economics of this system must be made for concentrated solar power to become a major energy
source for the United States.
Section 2.1.6 Wind Energy
In 2015, the power generated from wind turbines accounted for 41 percent of the United
States’ electric generation capacity, and 4.7 percent of the overall generation of power for the
nation (United States Department of Energy, 2017). Wind turbines are large and are often times
difficult to construct. For these reasons, wind turbine insurance often begins when the
construction starts, lessening the risk of a loss in investment (Guerritore, 2013). Although
predicted to have a long lifespan, wind turbines often malfunction within the first twenty years
(Guerritore, 2013).
A benefit of wind turbines is that large amounts of water are not necessary for efficient
operations (Staudt, 2011). Onshore and offshore wind can be installed in areas across the
country. This severely cuts the risk of having flooding or power outages interrupt the
transportation of energy. The implementation of offshore wind shows promise for investors.
Offshore wind differs from onshore wind in the area of maintenance. It is more difficult to
maintain and fix damaged offshore wind turbines in a short amount of time. Damages often take
weeks to fix due to weather and locational factors. (National Wildlife Federation, 2011).
The wind industry has greatly benefitted from tax incentives in the form of Federal and
state policies. At the Federal level, the construction of these renewable sources has increased due
to the Investment Tax Credit and Production Tax Credit, both issued under the Energy Policy
Act of 1992 (United States Department of Energy, 2017). These incentives have accelerated the
deployment of renewable energy sources. These two policies are aimed at companies that are
required to pay federal taxes and can be beneficial to those who utilize these incentives (United
States Department of Energy, 2017). Solar companies often benefit more from the Investment
STUDENT INTERN PROJECT – PRE-DECISIONAL – NOT A STATEMENT OF ADMINISTRATION POLICY
12
Tax Credit while many wind power companies benefit more from the Production Tax Credit
(United States Department of Energy, 2017).
Section 2.1.7 Energy Transmission
The investment in new energy transmission systems has the potential to save money for
consumers while producing a more resilient and flexible system. State goals are in place to
facilitate the transmission upgrades, such as in New York where they are taking rurally generated
wind and hydropower and transmitting it to New York City (United States Department of
Energy, 2017).
When a power plant invests in an insurance plan, the representatives from the insurance
companies are often engineers trained to know how the electric grid operates. To make
improvements on grid performance, engineers can look at advances in high voltage and direct
current transmission, expand the use of existing corridors, develop communications and
information technologies, and evolving wholesale markets.
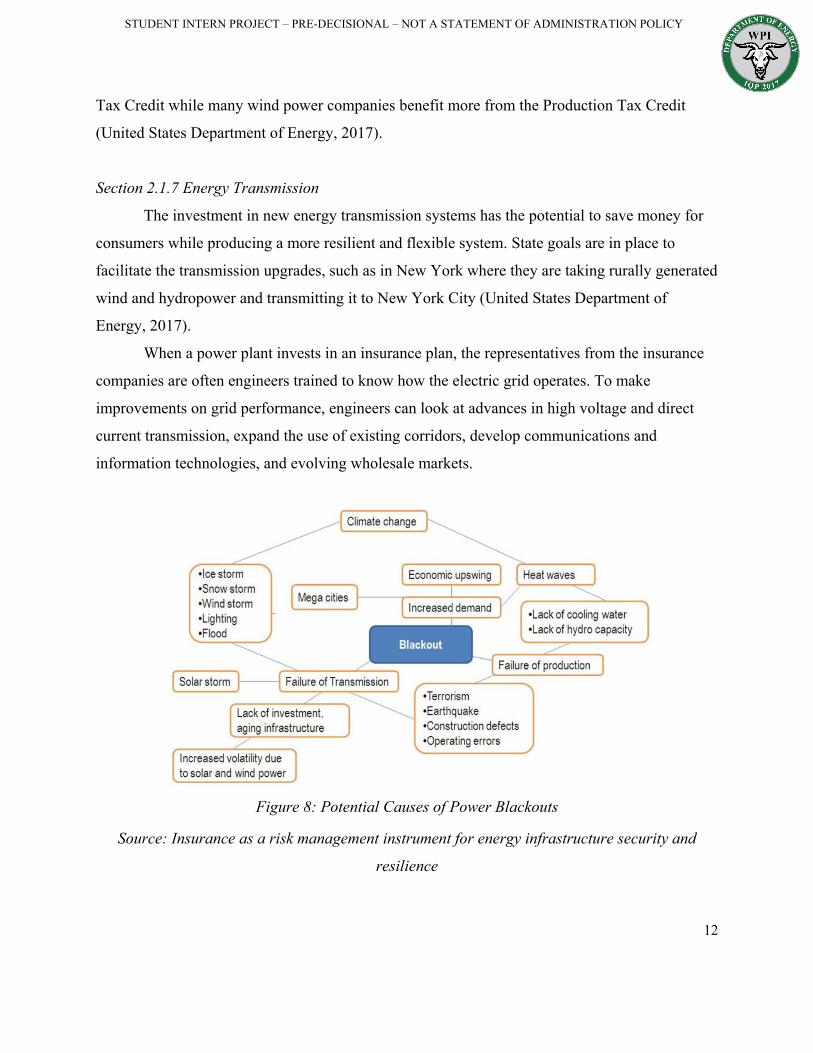
Figure 8: Potential Causes of Power Blackouts
Source: Insurance as a risk management instrument for energy infrastructure security and
resilience

STUDENT INTERN PROJECT – PRE-DECISIONAL – NOT A STATEMENT OF ADMINISTRATION POLICY
13
Figure 8 illustrates common causes of power outages in the United States. Failure of
transmission is one of the main parts to this diagram. Many events can take place that will affect
the transmission of power that include damage from natural disasters and failures in the
generation systems.
New renewable energy systems work in parallel with the grid to ensure a stable energy
distribution and storage system (Rangaraju, 2015). Distributed energy resource systems are
becoming more desirable with power utility companies because they can reduce inefficiencies,
costs, and interdependencies associated with the centralized grid systems (Rangaraju, 2015).
Grid Reliability and power transmission can cause significant issues when dealing with a
renewable energy source such as solar panels. Issues occur when the demand for energy is higher
than the supply. With the weather being unpredictable, surges of high demand and low power are
not easy to track. The intermittence of power to the generators can sometimes create more strain
(Willis, 2014).
Section 2.2 Disasters and Risks
Natural disasters and risks are classified as infrequently occurring events that have the
capability of catastrophe. These events are dangerous to power companies and damages from
these high-risk events can cause power companies tremendous financial losses. Natural disasters
and cyber security related risks keep power companies searching for improved ways to prevent
future damages. One key improvement is to learn from past disasters, as exemplified in Section
2.3, including natural disasters and cyber security related events that resulted in major economic
losses for the power companies.
Figure 9 below, Hierarchy and Terminology of Natural Hazards, shows the classification
of each natural disaster event. The chart shows simply four hazard groups broken down into a
main event classification where it is broken down further to represent the sub-event and specific
type of disaster.

STUDENT INTERN PROJECT – PRE-DECISIONAL – NOT A STATEMENT OF ADMINISTRATION POLICY
14
Figure 9: Hierarchy and Terminology of Natural Hazards
Source: Guerritore, 2013
Section 2.3.1 Natural Disasters/ Major Disasters/ Catastrophes
Natural disasters are broken down into three main groups: the degree of dreadfulness (i.e.
Scale or Category), the measure of the risk with how well it is understood, and the number of
people exposed to the event (Yergin, 2006). With advancements in technology and analyzing
past disasters, the United States can predict and prepare for catastrophic events (Yergin, 2006).
Natural disasters include a wide range of events including, hurricanes, earthquakes, flooding,
droughts, and water related issues. These catastrophic events cause severe destruction and result
in billions of dollars in damage. Data from past events help experts to prepare for future events.
Preparation for disasters will allow power companies to ensure their energy source will
be working in times of high demand. In 2011, any event was considered a catastrophe if it caused
damages totaling over $89.2 million or deaths of twenty or more people (Guerritore, 2013). In
1980, the categorization of a catastrophe was twenty-five million dollars and was raised to sixty-

STUDENT INTERN PROJECT – PRE-DECISIONAL – NOT A STATEMENT OF ADMINISTRATION POLICY
15
five million dollars by 2010 (Guerritore, 2013). The cost basis of a “catastrophe” is increasing
each year. The reason for the increase in the cost of classification, for disasters of catastrophic
levels, is because of the changing world. The world's population and economic activity continues
to gravitate towards disaster-prone areas. Within these areas, population continues to grow,
standards of living increase, and frequency of natural disasters are continually increasing. These
factors directly cause adjustment to the economic classification (Guerritore, 2013).
Section 2.3.2 Meteorological Impact
Storm related natural disasters are classified as meteorological hazards. During many of
these natural disasters, people are left without power. Hurricanes potentially cause the most
physical damage due to the intense wind conditions and heavy rainfall, but other storms include
cyclones, and tropical storms, which all result in floods and water damage. These conditions
sever power lines and cause drastic damage to utilities and power generators, leaving hospitals
and government buildings without power. Damage from disasters impact all stakeholders, and
the economic losses can force both utility and power generation companies into bankruptcy.
2005 was one of the worst years for economic losses in the United States in terms of
natural disasters, accounting for nearly $200 billion in losses. This is because of two powerful
hurricanes, Hurricane Katrina and Hurricane Rita, which landed in the Gulf of Mexico within
twenty-one days of each other. These vicious storms destroyed the surrounding areas of
Louisiana and Texas. The hurricanes caused energy shocks which disrupted the flows of oil,
natural gas, and electrical power (Guerritore, 2013). Along the Gulf Coast, refineries and
pipelines were unable to perform properly due to a lack of power being supplied to the sources
(Guerritore, 2013).
The hurricanes brought along damages from extreme winds, rain, and flooding which
affected power lines delivering energy to their customers. Mississippi Power sustained damage
to approximately “6,000 miles of power lines… and 263 substations” (N. N, 2017). During this
time, the 1,200-megawatt nuclear power plant, Waterford 3 Nuclear Plant, was responsible for
delivering power to Killona as well as areas all throughout Louisiana. The plant was surprisingly
out of operation for only four days (Nuclear Energy Institute, 2011). “The nuclear power plant
was cut from the offsite power grid on August 29, and continued to maintain power for reactor

STUDENT INTERN PROJECT – PRE-DECISIONAL – NOT A STATEMENT OF ADMINISTRATION POLICY
16
cooling and other functions until the lines were reconnected on September 2” (Nuclear Energy
Institute, 2011). Hurricane Katrina tested the reliability of nuclear power plants which prevailed
through the storm, because of their rigid infrastructure.
Hurricane Sandy landed in New Jersey and New York in 2011. Hurricane Sandy caused a
huge economic loss for power generation. Advancements in technology since Hurricane Katrina
and Hurricane Rita include renewable power generation sources such as solar panels, wind
turbines, and hydroelectric energy. Solar panels are infrequently exposed to hurricane conditions.
The popularity of solar panels in the affected areas put renewable energy sources at high risk.
Surprisingly, solar panels withstood damages with the exception of minor damages from strong
winds and flying debris. Solar panels that were damaged were disconnected from the grid and
replaced with new ones. Although solar panels are extremely expensive to repair, the energy
source proved its reliability and performed exceptionally well under catastrophic conditions. The
other major sources affected included natural gas-fired and nuclear power sources which took
damages from floods and other water-related damages. Damages to the power lines made
electricity transportation extremely limited to hospitality areas such as hospitals and businesses.
Figure 10: Amount of Electricity Produced by Various Types of Resources in New Jersey
Source: United States Energy Information Administration (2017)

STUDENT INTERN PROJECT – PRE-DECISIONAL – NOT A STATEMENT OF ADMINISTRATION POLICY
17
Figure 10 above shows the type of resource and the amount of electricity produced by
each resource during the time of Hurricane Sandy in 2011. The New Jersey and New York areas
are heavily reliant on nuclear and natural gas power generation but are not solely reliant on these
types. The change in technology towards renewable resources is evident and Hurricane Sandy
was one of the first major storms to have an effect on these renewable energy sources.
On August 25, 2017, Hurricane Harvey caused more damage to Texas than any previous
storm. Then on September 15, 2017, Hurricane Irma left its mark on Florida and contributed to
the worst economic loss from a natural disaster in the history of the United States. Early
estimates upwards to $290 billion have been accounted for. Hurricane Irma was deservedly
classified as a category four hurricane with winds up to ninety mph (N. N., 2017). The total
damages left 4.5 million people without power (N. N., 2017). Prior to the storm, Florida Power
Lines had invested $3 billion towards strengthening 700 power lines to critical facilities such as
police stations, hospitals and gas stations; burying sixty power lines underground; clearing
vegetation from 150,000 miles of lines; inspecting 150,000 poles per year; and installing 4.9
million “smart” meters that can help predict and prevent power outages (N. N., 2017). This
preparation helped with keeping energy sources running and distributing to areas in need.
Section 2.3.3 Geophysical Impact
Geophysical hazards include a wide range of disasters that similarly relate to the “physics
of the earth” (Willis Towers Watson, 2016). Categorized within geophysical hazards are most
popularly earthquakes and tsunamis but also landslides and volcanic activity. These risks
generate major damage to power sources and can create major economic losses. A major reason
for the severity of the consequences of these natural disasters is their unpredictability. Geological
natural disasters can be difficult to anticipate, and few experts are educated and trained in
geologic hazard mitigation (Guerritore, 2013).
Earthquakes are potential risks for power companies with any generation type. Nuclear
energy has also been designed to have an automatic shutdown system onset during “sudden
tremors and shockwaves” (World Nuclear, 2009). For wind energy, the damages sustained
during an earthquake cause destruction to the foundation of the structure. Finally, solar panels

STUDENT INTERN PROJECT – PRE-DECISIONAL – NOT A STATEMENT OF ADMINISTRATION POLICY
18
sustain damage to the unit which terminates the ability to convert photons from the sun into
usable energy.
Another instance of a geophysical hazard that caused severe damages was the Tōhoku
Tsunami in Japan. This earthquake caused a tsunami in 2011, which resulted in eleven operating
nuclear power plants to call an emergency shutdown (World Nuclear, 2016). Many of these
nuclear plants received damages including loss of power which caused “loss of cooling and
subsequent radioactive releases” (World Nuclear, 2016). Other problems that arose during this
tsunami were hydrogen explosions and the lack of water.
Section 2.3.4 Hydrological Impact
Perhaps one of the greatest issues for energy generation companies are hydroelectric
hazards. These natural disasters consist of all water and flood related issues. Floods are the most
widely destructive type of regularly occurring natural disaster (Saunders, 2012). Water related
damages can happen anywhere in the United States and for a variety of reasons. For instance, the
coastal states are prone to hurricanes, where heavy rainfall and elevated water levels cause
severe damage. Surprisingly, only 17 percent of the total land area, these coastal states account
for 54 percent of the total population of the United States. “The increase in population leads to
additional economic activities and infrastructure development to support the people and
businesses which, as a result, exposes the population, properties, and infrastructure to damage
from natural catastrophes,” (Guerritore, 2013). Not only are coastal states vulnerable to water
damages, but also, and possibly more vulnerable, are the Mid-Western states. Some of these
states, including Minnesota, South Dakota, and Nebraska, receive five to ten inches of rain in
one week.
STUDENT INTERN PROJECT – PRE-DECISIONAL – NOT A STATEMENT OF ADMINISTRATION POLICY
19
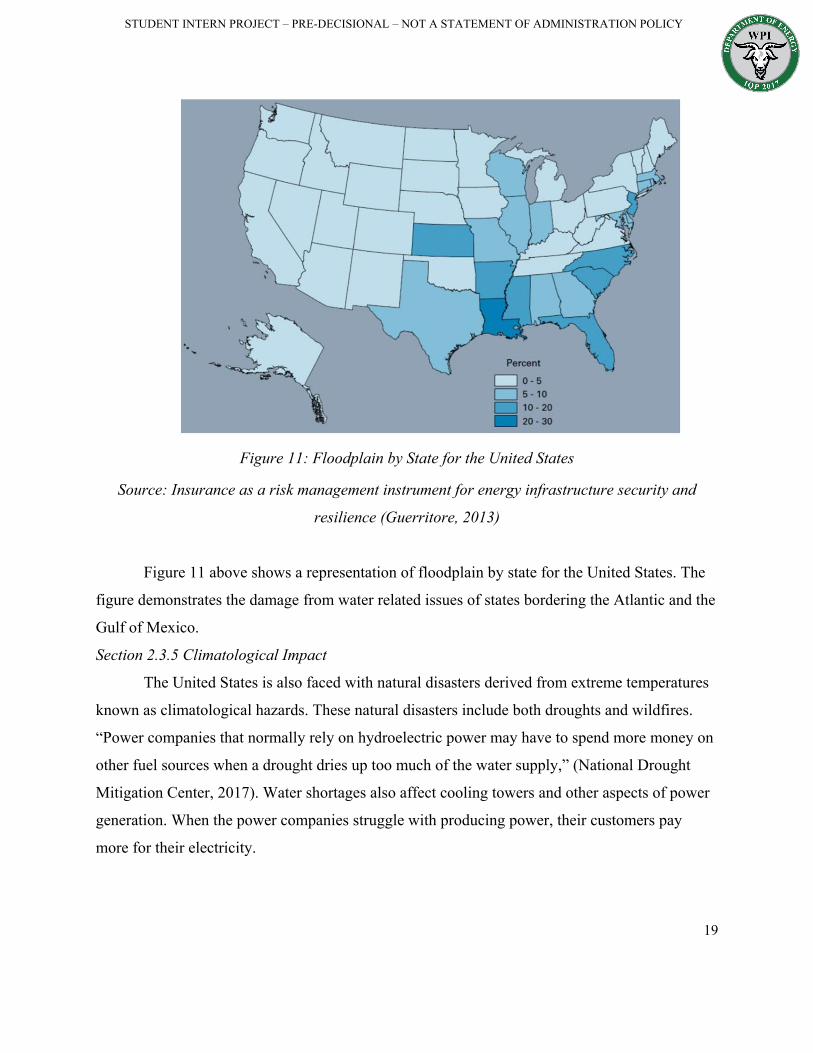
Figure 11: Floodplain by State for the United States
Source: Insurance as a risk management instrument for energy infrastructure security and
resilience (Guerritore, 2013)
Figure 11 above shows a representation of floodplain by state for the United States. The
figure demonstrates the damage from water related issues of states bordering the Atlantic and the
Gulf of Mexico.
Section 2.3.5 Climatological Impact
The United States is also faced with natural disasters derived from extreme temperatures
known as climatological hazards. These natural disasters include both droughts and wildfires.
“Power companies that normally rely on hydroelectric power may have to spend more money on
other fuel sources when a drought dries up too much of the water supply,” (National Drought
Mitigation Center, 2017). Water shortages also affect cooling towers and other aspects of power
generation. When the power companies struggle with producing power, their customers pay
more for their electricity.

STUDENT INTERN PROJECT – PRE-DECISIONAL – NOT A STATEMENT OF ADMINISTRATION POLICY
20
Section 2.3.6 Cyber Security Risks
Physical risks create huge impacts in various companies and energy sources that result in
huge losses in capital; however, they are not the only potential major risk. As most companies
move into digital based databases in order to operate as efficiently as possible, they are more
prone to cyber-attacks (National Association of Insurer Commissioners 2017). In 2013, a
terrorist managed to take out seventeen transformers with connections to Apple and Google. The
attackers knew exactly when to attack and where the precise lines to cut were located. Although
there was no major notice of the attack due to the existence of backup power sources, it served as
a wakeup call (Lewis 2017). In late 2014, the National Association of Insurer Commissioners
created the Cybersecurity Working Group in order to moderate various cybersecurity attacks and
potential threats. The group is looking into creating an Insurer Data Security Law, which would
involve greater customer interactions through continuous updates as well as regulations for
investigating data breaches. As a Group, they are trying their best to help aid the United States
Government in the prevention of cyber-attacks.
The United States isn’t the only country whose government is looking into the threat of
cyber security. In 2016, the UK Government discovered that two thirds of major businesses were
attacked (Kim 2017).
Section 2.3 Insurance
The following section lays out the full range of insurance that pertains to electric utilities
and merchant generators. The Department of Energy report entitled Insurance as a Risk
Management Instrument for Energy Infrastructure Security and Resilience details the current
challenges faced by the risk management industry. This document also showcases the limitations
of today’s insurance products for innovative technologies that can change the insurance needs.
This can directly affect current insurance policies. Figure 12 below demonstrates the path of risk
management from the business, to the primary insurer, then to the reinsurer, and finally to an
additional layer of reinsurance.

STUDENT INTERN PROJECT – PRE-DECISIONAL – NOT A STATEMENT OF ADMINISTRATION POLICY
21
Figure 12: Risk Insurance and Assessment Summary
Source: Insurance as a risk management instrument for energy infrastructure security and
resilience (2013)
Section 2.3.1 How Risk Insurance Works
Utility companies face a number of increasingly challenging risks which result in the
essential need for multiple types of quality insurance products that cover a broad span of
potential disasters and failures. In the insurance business, the insurance companies have realized
that most risks can be mitigated through insurance products. There are incentives to be well
insured for all parties involved including the insurer, the client, the employees, and the
infrastructure of the facilities. The insurer’s role is to offer products to the marketplace so that
potential clients seeking protection can purchase these products. These products offer coverage
for various risks. Insurance companies exist because they are willing to take on reasonable risks
in return for a premium upfront.
According to the insurance industry: “A risk … consists of three components—hazard,
vulnerability, and exposure—all of which can change over time” (Guerritore, 2013). Since
hazards, vulnerability, and exposure are not static, the insurance coverage needed is actively
broadening with growing uncertainties. For known risks such as natural disasters, which have an

STUDENT INTERN PROJECT – PRE-DECISIONAL – NOT A STATEMENT OF ADMINISTRATION POLICY
22
uncertain frequency but known damage potential, there exists three brackets of severity: natural
disaster, major disaster, and catastrophe. According to the Robert T. Stafford Disaster Relief and
Emergency Assistance Act, a natural disaster is defined as: “any hurricane, tornado, storm, flood,
high water, wind-driven water, tidal wave, tsunami, earthquake, volcanic eruption, landslide,
mudslide, snowstorm, drought, fire, or other catastrophe in any part of the United States which
causes, or which may cause, substantial damage or injury to civilian property or persons”
(Guerritore, 2013). A major disaster is categorized as when the: “President determines that the
severity and magnitude of the damages caused by the event are beyond the combined capabilities
of State and local governments to respond and warrant Federal disaster assistance” (Guerritore,
2013). Finally, the criteria for a catastrophe are defined as: “…any natural disaster, act of
terrorism, or other man-made disaster that results in extraordinary levels of casualties or damage
or disruption severely affecting the population” (Guerritore, 2013). The prior definitions are
essential to understanding how the insurance industry classifies risks from disasters and provides
for policy coverage.
Section 2.3.2 Primary Insurance
The steps leading up to obtaining an insurance contract involves the assessment of an
individual’s or organization’s risks. This assessment process, conducted by the insurers, involves
the best way to accept, transfer, or mitigate these risks. Accepting risks may involve setting aside
money in case something happens, by having a backup fund. This usually takes place when the
price of mitigating or transferring is too high compared to the likelihood of the risk taking place,
or the risk is not well understood; therefore, the best means of covering that risk are not clear
(Guerritore, 2013). Once a company or individual accepts the potential for major risks, they
work towards mitigating these risks. This could involve working with a risk manager to identify
what risks are worth covering financially and which can be prevented (Kim, 2017). For
companies, this involves knowing when to cut losses or recognize when revamping an older
system or work space would make production more efficient as a unit, while also lowering their
risks by having a more optimal system.
A primary insurance company is the first place to look when seeing risk mitigation. A
primary insurance company is the first company that reimburses a utility company when

STUDENT INTERN PROJECT – PRE-DECISIONAL – NOT A STATEMENT OF ADMINISTRATION POLICY
23
damages occur. They help make sure that financial disasters that occur will be shared by a larger
group of people, as opposed to a specific company or community. Primary insurers usually
provide major types of risk mitigation products known as property insurance, liability insurance,
builder’s risk insurance captive coverage insurance, and cyber insurance. Figure 13 below
demonstrates some of the widely accepted insurance product offerings, their definitions, and the
risks that they cover. The properties of these insurance products often differ between companies,
however most major insurance offer some form.
Category Definition Risks Covered
PropertyA policy that provides financial reimbursement to the owner or renter of a structure and its contents, in the event of damage or theft
*All property risks including boiler and machinery *Costs to repair or replace damaged equipment*Business income loss due to business interruption*Extra expenses to sustain normal operations*Electrical service interruptions
LiabilityA policy that provides financial reimbursement to the owner or renter of a structure and its contents, in the event of damage or theft
*Bodily injury and property damage claims*Personal and advertising injury*Contractual liability, manufacturer's errors and omissions, and product recall coverage *Blanket additional insured coverage*Primary non-contributory coverage
Builders Risk
Protects people or organizations insurable interest in materials, fixtures, equipment or structure should items sustain physical damage from a covered cause
*Physical damage and opening delays*Optional coverage based on clients needs*Contract penalty coverage*Loss control and engineering services
Captive Insurance
An alternative to self-insurance in which a parent group or groups creates a licensed insurance company to provide coverage for itself
*Personalized umbrella coverage
Cyber Coverage
Protect users from Internet-based risks, or information technology infrastructure risks
*Business interuption *Some property damage*Digital media liability and data breaches*Costs sustained by third parties due to unauthorized software or data use or access
Insurance Coverage Types and Options

STUDENT INTERN PROJECT – PRE-DECISIONAL – NOT A STATEMENT OF ADMINISTRATION POLICY
24
Figure 13: Insurance Products Definitions and Coverage Source: Multiple company insurance products
There are multiple major insurance companies all with a variety of risk management
offerings. Insurance companies, including Insurer A and Insurer B specialize in the nuclear
electric power generation insurance industry. Companies such as Insurer J, Insurer D, and Insurer
C offer a broad range of insurance products including property, liability, casualty, and cyber
coverage. Another insurance company such as Insurer E specializes in all forms of renewable
energy insurance coverage.
Although primary insurance companies can often cover large amounts of damage, they
can’t always cover everything. When the potential for large losses is high, insurance companies
transfer the risk to reinsurance companies. The teamwork behind reinsurance plans allows
insurance companies to secure against primary threats, while still keeping the primary plans
affordable (Swiss Re, 2017).
Section 2.3.3 Reinsurance
The purpose for reinsurance is to provide a way for the primary insurance company to
protect itself from disaster by passing along or spreading out the risk to other companies known
as the reinsurers (Investopia, 2015). Since the primary insurance has the backing from the
reinsurer, this in turn allows the primary insurer to have more flexibility when it comes to other
types of risks because, when the insurance is spread out, the risks the insurance can cover can
broaden out as well (Investopia, 2015). Two examples of large reinsurance companies are Swiss
Reinsurance and Munich Reinsurance. Swiss Reinsurance is the world’s second largest
reinsurance company with a total revenue of 33.23 billion dollars in 2016 with 3.558 billion
dollars in profit in the same year (Swiss Re Worldwide, 2017). This puts into perspective the
amount of money available for insurance coverage. Munich Reinsurance defines loss from a
disaster as: “…economic losses include direct losses of tangible goods, as well as separate
information on indirect economic losses—losses resulting from the physical destruction of
assets— where reliable information is available” (Guerritore, 2013). This definition is key
because it forms the foundation for what insurers are willing to cover.

STUDENT INTERN PROJECT – PRE-DECISIONAL – NOT A STATEMENT OF ADMINISTRATION POLICY
25
Reinsurers are willing to cover the same risks that the primary insurers are willing to
cover, and an example of how coverage can be split up between primary insurer and reinsurer is
as follows: “The ceding company retains 25 percent net and places 75 percent facultative
reinsurance on a pro rata basis. Reinsurance participation is expressed as $750,000 (75 percent)
part of $1,000,000” (Munich Re, 2017). The ceding company is the primary insurer; therefore,
the primary insurer is responsible for 25 percent of a claim while the reinsurer is responsible for
the other 75 percent of a claim. The other factor is the cost of the premium which power utilities
pay their primary insurer. The primary insurers pay the reinsurer a premium which is broken
down as follows: “The premium due the reinsurer is $7,500 (75 percent of 10,000) less the
ceding commission it pays to the ceding company to defray expenses and acquisition costs”
(Munich Re, 2017). Basically, if the primary insurance is collecting a ten thousand dollar
premium from the utility company, then 75 percent of that belongs to the reinsurance company.
Section 2.3.4 Potential for Government Last Resort
The Government is called upon when all other options are exhausted including both
primary insurance and reinsurance: “The federal government’s recovery aid after both Katrina
and Sandy have required tough new zoning and flood insurance requirements, including raising
living quarters above flood levels and prohibiting rebuilding in the most endangered areas”
(Guerritore, 2013). The Government’s effort here is to incentivize companies and citizens to
steer away from the highest risk areas. To mitigate risks to the public from natural disasters the
Government passed the Stafford Act.
The Stafford Act allows federal assistance to help states during declared major disasters
or emergencies. Some agencies, including the Federal Emergency Management Agency (FEMA,
2011), coordinate the resources and assistance given to the states. “All requests for a declaration
by the President that a major disaster exists shall be made by the governor of the affected state,”
(FEMA, 2011). There are two ways of declaring a disaster for the Stafford Act to be effective;
Emergency Declarations and Major Disaster Declarations. During an Emergency Declaration,
the President has determined that federal funding is required for emergency services such as
protection of lives, public health, and safety. During a Major Declaration, the President has the

STUDENT INTERN PROJECT – PRE-DECISIONAL – NOT A STATEMENT OF ADMINISTRATION POLICY
26
ability to declare a Major Disaster after any natural storm or event. This is only declared when
the damages from these storms or events go beyond the level of state funding.
Section 2.3.5 Current Insurance Plans
Usually insurance companies offer disaster relief products in case of major disasters or
catastrophes. Companies, like Insurer N or Insurer D, offer companies “claims” as a disaster
recovery option. These claims allow for people to report accidents that have happened;
furthermore, financial compensation can be obtained through these claims by the insurance
provider.
Insurer G, created by Zachariah Allen in 1835, was founded on the idea that all risks can
be mitigated through proactive action. Insurer G takes part in the mitigation phase by sending
engineers out to the field to assess a utilities risks, and determine how the utility company can
lower these risks by making structural changes to their power plants. A specialist at Insurer G
described his company as a, “property insurance company” mentioning that, “We do one thing
and we do it right. We address property exposures, and we help our clients reduce their exposure
to loss” (Larson, 2017). Multiple insurance companies, including those that work with power
utility companies, share this proactive mission by believing that most large losses can be
prevented.
Section 2.3.6 Price-Anderson Act
Nuclear power generation has many associated risks including the potential yet highly
unlikely nuclear meltdown. A single insurance company cannot cover this level of risk;
therefore, Congress passed legislation to require multiple company involvement in the event of a
nuclear disaster. This law, known as the Price-Anderson Act, was passed in 1957.
The scope of the Price-Anderson Act includes incidents at research and test reactors,
nuclear incidents with respect to power generation, transport of nuclear fuel, and radiological
facilities. Price-Anderson Act requires that: “Nuclear Regulatory Commission licensees and
Department of Energy contractors enter into agreements of indemnification to cover personal
injury and property damage to those harmed by a nuclear or radiological incident, including the
costs of incident response or precautionary evacuation and the costs of investigating and

STUDENT INTERN PROJECT – PRE-DECISIONAL – NOT A STATEMENT OF ADMINISTRATION POLICY
27
defending claims and settling suits for such damages” (NAIC, 2017). This requirement extends
to all involved in the design, construction, and operation of a nuclear power plant to limit the
liability to the individual workers. The nuclear power industry has over 12 billion dollars pooled
to compensate the public in the event of a nuclear disaster. The funds for this pool come from the
owners of the nuclear power reactors.
The coverage was mandated in 1979, when a nuclear accident occurred in Dauphin
County, Pennsylvania (NAIC, 2017). Although evacuation was deemed unnecessary for this
event, the families who decided they wanted to evacuate could, and had all living expenses
covered. Roughly $1.2 million was covered by insurance to 3,170 claimants during the incident
known as the Three Mile Island Accident (NAIC, 2017).
Section 2.4 Types of Power Utility CCompanies
The four main types of power utility companies researched are investor owned utilities,
municipal utilities, cooperative utilities, and merchant generators. Each serves a different
purpose in regard to power generation and electricity delivery.
An investor owned power utility company is a privately owned company that is
publically traded in the stock market (Power Utility BB Corporation, 2017). They have regulated
rates and are authorized by state public utility commissions to achieve a certain rate of return.
These business organizations offer services in the form of electric utilities to their customers.
Many of the investor owned utilities in the United States are broken down into subsidiaries, or
smaller electric utility companies that provide coverage to a specific area of customers. Many
subsidiaries distribute rather than generate power.
Investor owned utility companies are often self-insured for their power plants because
they put aside a specific amount of money per year that acts as a fund in case of emergencies.
The only type of generation that cannot be self-insured is nuclear. Their form of self-insurance
will cover property damages to their plants from operational implications or environmental risks.
These companies are required to file a 10-K form with the Securities and Exchange Commission
(SEC) to publicly disclose risk information to their shareholders.
A municipal utility is a district-organized power company set up by the local government
within the town or district in order to serve the citizens living in the district. These are often

STUDENT INTERN PROJECT – PRE-DECISIONAL – NOT A STATEMENT OF ADMINISTRATION POLICY
28
much smaller than investor owned utilities and established by the citizens themselves as a
publically owned company. These companies are often used to provide transmission and
distribution service to the people in the district and do not deal with the generation of energy
from plants. The utility itself is governed by the city council or through an elected board of
committee members. They can be located in much smaller towns but can also be organized in big
cities.
They are usually governed and regulated by the laws and regulations of the town and
state but also must follow federal regulations as well. Municipal utilities are often non-profit and
employ citizens within the town that may also be receiving the services. Municipal utilities are
not required to file 10-K Forms.
Cooperative utilities are the electric utilities owned by the customer. Each customer owns
shares in the company and is therefore an owner and member of the business. This means that
each member can vote and make decisions in the policy making process. Cooperative utilities are
a non-profit that are not required to file 10-K Forms and work towards providing a competitive
price for the consumers in the electricity market. Cooperative utilities focus on making sure there
is reliable electricity provided to their customers. They are tax-exempt, because they function as
a non-profit power utility (Sunshine, 2017).
Cooperative utilities have a wide range of generation portfolios, including nuclear,
natural gas, coal, and all renewables. The cooperative utility market is large, having a total of
900 cooperatives across 47 states.
Merchant generators are privately owned generation companies that were first created to
allow anyone to enter a field that was nearly a monopoly. Anyone could “build a facility and sell
to a wholesale power market,” (S&P Global, 2012) which would allow more companies to
compete in the wholesale power market. Many merchant generator companies have declared
bankruptcy and very few companies are thriving (Gilford, 2017). Specifically, Power Utility GG
and Power Utility HH, two merchants, have combined as one of the first large merchant firms to
exist in hopes of expanding their sources to new regions and new customers.
Figure 14 below represents the number of instances that a power outage has occurred and
how long the average occurrence is, organized by the type of power utility company. Co-op

STUDENT INTERN PROJECT – PRE-DECISIONAL – NOT A STATEMENT OF ADMINISTRATION POLICY
29
utilities are more likely to have a higher frequency because these are most abundant across the
nation.
Figure 14: Average Electric Power Service Interruptions
Source: EIA, 2015
Section 2.5 Literature Analysis
Provided Documents:
Insurance as a Risk Management Instrument for Energy Infrastructure Security and Resilience
Guerritore, W. B. (2013). Insurance as a risk management instrument for energy infrastructure
security and resilience. Hauppauge: Nova Science Publishers, Inc
This document was important due to its similarities in objectives, mission, and possible
methods of improvement. Provided in this document were details of background knowledge of
risks of natural disasters, cyber-security related issues, outer space issues and energy related
risks. Other key aspects were the insurance plans and their policies. This document contained
information regarding reinsurance and the process which the insurance companies follow when
dealing with economic disasters. Included in the document were effective figures and diagrams
which demonstrated the trends and comparisons of different risk situations.

STUDENT INTERN PROJECT – PRE-DECISIONAL – NOT A STATEMENT OF ADMINISTRATION POLICY
30
Taking Cover: How an Insurance Shortfall Leaves the Energy Sector Exposed
Willis Towers Watson. (2016). Taking Cover: How an Insurance Shortfall Leaves the Energy
Sector Exposed [PDF]. Willis Towers Watson.
This document highlighted the impacts of natural disasters on the supply chain. This
document analyzed the impact of the 2011 Earthquake in Japan and the effects it had on the
world. The impacts included the economic effect on the world’s supply of oil, significance of
technological advances towards preparation for future disasters, and awareness of climate change
and environmental care. The important part of the document was the proposed future
developments including making better use of data, more collaboration between insurance
companies and experts who have collected data on the matter, and more innovation.
New and Improved Insurance Offerings Provide Power Plants with More Options
Larson, A. (2017, March 14). New and Improved Insurance Offerings Provide Power Plants with
More Options. Retrieved September 05, 2017, from http://www.powermag.com/new-improved-
insurance-offerings-provide-power-plants-options/?printmode=1
This article, from “Power,” a business and technology data website, offered its
perspective on how insurance companies constantly adapt. The article explained that engineers
were going to the sites of the power utility companies and using specialized expertise to make
recommendations. An important part in finding the right insurance company and plan is the
ability to grow with the changing needs of the power utility companies. Overall, this document
offered information regarding the changing needs of power utility companies.
Willis – Power Market Review
Willis Power Market Review [PDF]. (2014). London, United Kingdom: Willis Limited

STUDENT INTERN PROJECT – PRE-DECISIONAL – NOT A STATEMENT OF ADMINISTRATION POLICY
31
This document provided a review of the insurance market updates of different types of
power generation along with updates from various countries. The increasing capacities of the
different types of power generation and the level of involvement the insurance companies must
take is discussed in the document. By improving technology, or scaling up to increase capacity,
utility companies were able to secure the best deals from the insurance companies. The different
types of energy sources were discussed along with updates from various countries. Risks were
evaluated as renewable technology becomes a major component to the overall power generation
of the United States. This document was used to identify key risks among energy sources and
assess how new technology affects these risks.
Insurance and the Nation’s Electrical Infrastructure
Frye, E. (2005). Insurance and the Nation’s Electrical Infrastructure: Mutual Understanding and
Maturing Relationships. [Pdf] Arlington, VA. [Accessed 2017].
This article was written in 2005 and, although some of the data is older, much of the
background information pertaining to current insurance policies are still relevant in the electric
industry. Analyzing the older policies provided within this document and comparing them to
today’s policies was useful. An important takeaway of this document was the role of the United
States Department of Energy, their collaboration with state and local governments, and the
private sector to protect against energy supply disruption.
Additional Sources:
In addition to using the provided sources, the works cited from accredited documents
were used to explore new reference sources. For example, some of the provided documents were
written by the United States Department of Energy. These documents were used to gather
additional information and more detail on specific case studies.

STUDENT INTERN PROJECT – PRE-DECISIONAL – NOT A STATEMENT OF ADMINISTRATION POLICY
32
Scholarly Resources:
With assistance from WPI librarian, Laura Robinson, documents on scholarly websites
were used to further background knowledge which continued to add value to the methodology.
Some of the websites used for finding new sources include Google Scholar, ABI/INFORM
Complete, Business Source Premier, EDGAR, and JSTOR.
Recent Events and News Articles:
Due to Hurricane Harvey and Hurricane Irma, close attention was given to the recent
events and impacts the natural disasters had on affected areas. Some important newspaper
sources included:
1. Miami Herald
2. New York Times
3. The Washington Post
4. Tampa Bay Times

STUDENT INTERN PROJECT – PRE-DECISIONAL – NOT A STATEMENT OF ADMINISTRATION POLICY
33
Chapter 3: Methodology
The ultimate goal of this project was to analyze electric power utility companies and
insurance companies to identify possible gaps with respect to the insurance coverage offered to
the electric power utility companies, by having completed the following list of objectives:
1. Identified the key physical risks that are faced by electric utilities related to power
generation with specific regards to various types of generation technology;
2. Analyzed the products insurers offered in reference to the identified physical risks;
3. Determined how power generation-based risks and the insurance plans that covered them
have adapted over time;
4. Researched key case studies of large disasters and the insurance claims that covered
them.
The following questions were provided by Dr. Samuel Bockenhauer, from the United
States Department of Energy as a basic outline for the project and methodologies that were
followed:
Key Project Questions:
1. What are the key physical risks currently faced by electric utilities related to power
generation, including for various types of generation technology, such as nuclear, coal,
natural gas, hydropower, wind, and solar? How significant are water-related risks (e.g.,
drought causing cooling water shortage) in the overall portfolio of risks faced by electric
utilities?
2. What insurance products do insurers currently offer to address these risks? Are any of
these specific to water-related risks?
3. Given that the electricity system in the United States is changing over time (e.g.,
increasing renewable generation such as solar and wind), how have risks faced by utilities
changed over time? What new risks have emerged due to changes in generation
technologies?

STUDENT INTERN PROJECT – PRE-DECISIONAL – NOT A STATEMENT OF ADMINISTRATION POLICY
34
4. How have insurance products offered by insurers evolved to address these risks? How
have premiums and claim amounts changed over time?
5. What are some key case studies of how large disasters and subsequent large insurance
claims have affected a utility (e.g., hurricanes, wildfires)?
6. How can insurance be designed and priced to encourage a more resilient, reliable,
affordable United States electricity system?
Methodology Process:
The chart below illustrates the approach of the project. The plan was to use the data
sources to answer key project questions. The organization of the methodology section was
crucial in developing answers to the objective questions.
A significant portion of the literature review was summarized in the background section.
The interviews with large electric utility companies, large insurance companies, and federal
experts provided expertise on questions that were difficult to find within the provided literature.
The interview plans were discussed later in the methodology section and were placed in the
appendix. Figure 15 below shows the processes followed to answer the key project questions.

STUDENT INTERN PROJECT – PRE-DECISIONAL – NOT A STATEMENT OF ADMINISTRATION POLICY
35
Figure 15: Relationship between Provided Data Sources and Key Project Questions
Section 3.1 Literature Review
The sources and references provided in the project description were analyzed before
conducting research. Five reference sources, six data sources, and some additional sources were
provided and used for research. All sources marked the starting point for the background section
and continued to provide information and data for the entirety of the project. The information
was summarized in background Section 2.5 Literature Analysis, and was used in the results and
findings chapters.
Section 3.2 10-K Form Analysis
“A Form 10-K is an annual report required by the United States Securities and Exchange
Commission (SEC) that gives a comprehensive summary of a company's financial performance.”
Publically traded companies must file an annual 10-K form to keep their shareholders informed
on yearly activities that may include losses, revenue, risk analysis and workers’ compensation.
Many companies file their 10-K forms with an introduction in the beginning of a letter to their
shareholders, and draft it in their website as an annual report. Investor owned utility companies
are often much larger than municipal, cooperative, and merchant generator companies but only
investor owned companies and some merchant generators are required to file 10-K forms
because they are publically traded companies. Smaller companies including municipal and
cooperative utility companies are primarily district and publicly owned, not traded, and therefore
not required to file a 10-K form.
Investor Owned companies, such as Power Utility BB and Power Utility AA, are spread
out among many states and their customers number in the millions. They provide most of their
information on their website and/ or in their 10-K Form regarding the type of power generation
they use and the amount of revenue they make each year. Each 10-K Form filed for a certain
company follows the same basic format because each company is required to file the same data
in correspondence to the regulations of the SEC.

STUDENT INTERN PROJECT – PRE-DECISIONAL – NOT A STATEMENT OF ADMINISTRATION POLICY
36
Information in the 10-K forms includes:
1. Companies that must file the 10-K must file for both the parent company and each
subsidiary.
2. The first important item of the 10-K is the business analysis of the company and what
their current status is in each of its sections including infrastructure, electric utilities,
competition, retail, energy capacity, inventory, environmental regulations, and federal
regulations. The form will break off into each of the different types of power generation
the company uses.
3. The next important item is the risk analysis section which is extremely important to the
company’s shareholders. In this section, the company explains the current risks faced in
all departments including business, operational, nuclear, stock risks, and investments.
With these risk analyses, the form includes the type of nuclear insurance used and the fact
that they are self-insured against most risks because the company has enough money to
put aside for potential losses.
4. The next item is an informative section on the properties of the types of power plants the
company owns and the data of how much they produce. Also included is the number of
transmission and distribution lines they own.
5. There is a short section on stock holder information and graphs of recent performance in
the stock market.
6. The company’s financial data is listed next with the analysis of their current management
strategies and things they have done that could possibly increase losses or otherwise
impact revenue. This section also lists the accomplishments of the year in regard to
financials. Many expenses are covered in this section, including operational costs,
decommissioning costs, and overall net profit. The risks involved in the financial market
are listed which include credit risks, interest rate risks, market security, and pension
plans.
7. The next section includes everything about their current market risks and the associated
data. This may include data sheets of blanket costs, cash flows, changes in equity,
operational income, and comprehensive income.

STUDENT INTERN PROJECT – PRE-DECISIONAL – NOT A STATEMENT OF ADMINISTRATION POLICY
37
8. A large portion of the document consists of charts and tables about every aspect in the
finance department of the company. Some of these charts include prices of
decommissioning of plants, cost of complying with certain regulations, storm costs,
electric grid costs, regulatory assets/liabilities, and certain aspects of each of its
subsidiaries.
Overall, the analysis of 10-K Forms was an important part of this project in order to gain
more information on companies that were more difficult to schedule interviews with. Investor
owned utility companies were more difficult to reach out to because they were much larger than
the other types of power generation companies and did not have as much business-to-consumer
interaction. 10-K forms were the primary source for power utility information and data in this
project.
Section 3.3 Interviews
In order to gather the data needed regarding the insurability of power utility companies,
interview plans were created to target power utility companies, insurance companies, and federal
experts. These three interview plans contained both a summary of the project and a brief
overview of the literature review. These interviews provided an in depth and first look into what
the insurance companies offer, what they are willing to cover, and how they deal with new types
of risks. This also provided a perspective as to what power companies have for insurance plans,
or the reason for why they have refused certain types of insurance. Federal expert insights
showed when and how often the federal government has had to step in with regard to disasters
overwhelming power utility companies. The interview plans were an essential method in the
search for information to provide to the Department of Energy.
Federal experts provided information on problems regarding the insurability of power
generation companies. Interviewing federal experts helped by making suggestions of other
companies, organizations, or individuals who should have been contacted.
Interview plans with power utility companies served as the starting point because people
in this position have the most knowledge of risks associated with their structures. All the data
gathered with regard to the outside environment can impact the way an insurance company looks

STUDENT INTERN PROJECT – PRE-DECISIONAL – NOT A STATEMENT OF ADMINISTRATION POLICY
38
at a power utility company. If an insurance company deemed something to be uninsurable the
goal was to find out why.

STUDENT INTERN PROJECT – PRE-DECISIONAL – NOT A STATEMENT OF ADMINISTRATION POLICY
39
Chapter 4: Results Section 4.1 Nuclear Company Products
As mentioned in Section 2.3.6, nuclear power generation plants are mandated to have
insurance coverage; however, there are additional insurance products offered to the companies
that own nuclear power plants in the private industry. Companies such as Insurer A offer
products that include coverage for: “damages to insured sites; decontamination expenses arising
from nuclear contamination; risks of direct physical loss at sites; premature decommissioning
costs; and the costs associated with long-term interruptions of electricity supply” (Bloomberg
2017). These listed coverages are consolidated in Insurer A’s products below. Insurer A Company Products:
Figure 16 below displays the insurance products offered by Insurer A. Insurer A provides
insurance products for all nuclear power reactors. They offer three main products which include:
The Accidental Outage Program, The Primary Property Program, and The Builders’ Risk
Program. These programs offer risk mitigation associated with companies owning/operating
nuclear power plants. The Accidental Outage Program covers any accidental outages for any one
given unit. The Primary Property Program provides coverage with regard to all property damages
including both nuclear and non-nuclear disasters. There are two products that utilities can
purchase in addition to the Primary Property Program which consist of the Excess Program and
the Captive Coverage Policy. The Excess Program is additional nuclear peril specific coverage.
For example, if a company owns a nuclear power plant, and wants insurance beyond the
coverage provided under the Primary Property Program, then the company can purchase the
Excess Program which allows for up to $1.25 billion in addition to the $1.5 billion covered in the
Primary Property Program (Insurer A, 2017). Insurer A set up a subsidiary company known as
Insurer A Specialty Insurer Company, or NSIC, an industrial insured captive insurer. Under
NSIC’s policy, a power producer can purchase Captive Coverage in addition to the Primary
Property Program. The captive coverage policy covers up to $700 million for non-nuclear perils
only, in addition to the $1.5 billion from the Primary Property Program (Insurer A, 2017). Lastly,

STUDENT INTERN PROJECT – PRE-DECISIONAL – NOT A STATEMENT OF ADMINISTRATION POLICY
40
The Builder’s Risk Program offered covers perils with regard to the process of construction.
Each of these products are crafted with conditions built in, as displayed by the table below.
Figure 16: Insurer A Product Summaries
Source: Insurer A Insurance Products
Product Title Product Coverage Product Conditions
The Accidental Outage ProgramCovers risks associated with the loss of
power to a given plant
Max weekly indemnity $4.5 million per one unit.
Loss Exposure 100% of weekly indemnity for 52 weeks 80% for
subsequent 110 weeks max of $490 milllion for any one occurrence
The Primary Property ProgramCovers perils with regard to property for
both nuclear and non-nuclear power generation
Coverage of $1.5 billion This is the coverage cap per any one occurrence
The Excess Program Policy in addition to the Primary
Property Program regarding nuclear perils only
Coverage of $1.25 billion
The $1.25 billion is in addition to the $1.5 billion per occurrence. Blanket limit structure allows for multiple nuclear sites
to share limits at reduced rates
Captive Coverage Policy in addition to the Primary
Property Program regarding non-nuclear perils only
Coverage of $750 million The $750 million is in addition to the $1.5 billion per occurrence
The Builders' Risk ProgramCovers all risks associated with process
of construction Coverage up to $2.75 billion Sublimit for delay in start-up,
natural hazards and other perils
Nuclear Electric Insurance Limited Insurer A

STUDENT INTERN PROJECT – PRE-DECISIONAL – NOT A STATEMENT OF ADMINISTRATION POLICY
41
Insurer B Products:
Insurer B is an insurance association, a company created by a group of insurers for the
same purpose, and is backed by larger reinsurance companies such as Munich Re, Zurich, and
Insurer D. Insurer B was created because of the Price-Anderson Act as explained in Section
4.2.1.
An interview with Insurer B’s Vice-President of Underwriting gave a general summary of
who they insure. Insurer B summarized their beliefs and general insurance product information
in a short paper entitled “The Need for Nuclear Liability Insurance.” They started with an
explanation of the Price-Anderson Act, as is necessary for all nuclear insurance discussions, and
then proceeded to the offered plans for Power Reactor Facilities in accordance with the Price-
Anderson Act. Through the provisions of Price-Anderson Act, Insurer B offers a primary policy
and a secondary backup policy. The primary policy, labeled “Facility Form Policy,” is the
standard insurance offering provided by Insurer B to their insured companies. This policy is
purchased by the facility owner, and insures everyone for whom the facility owner is legally
responsible. Anyone at risk to “nuclear energy hazard”, defined as radioactive, explosive, toxic
or other hazardous properties of nuclear material is covered through this policy. The companies
pay a yearly premium to Insurer B and, in the case of a nuclear disaster, the company receives
$450 million in compensation. In the event the costs exceed the primary value, a secondary
measure is also taken into account. All nuclear plant licensees would be required to pay an
additional $127 million to help compensate for the losses (The Need for Nuclear Liability
Insurance, 2013). If a more drastic disaster occurs, then Congress and the government would
have to take action in issuing the required additional capital. These policies cover all 104 nuclear
reactors in the United States as of October 2013, and are summarized in Figure 17 below.
The Vice-President of Underwriting also described how Insurer B vigorously defends
their client’s financial claims. They generate and retain records, constantly measure radiological
releases, and have capital set aside to defend claims. The vice-president of underwriting stated
that Insurer B’s biggest risk is the potential loss of coolant within the reactors. The plants are
built to withstand flooding, terrorist attacks, and even airplane crashes. The plants have the
ability to shut down in case of an emergency before any serious damage can occur. Insurer B has
specialized engineers they send to help protect the plant by making suggestions and
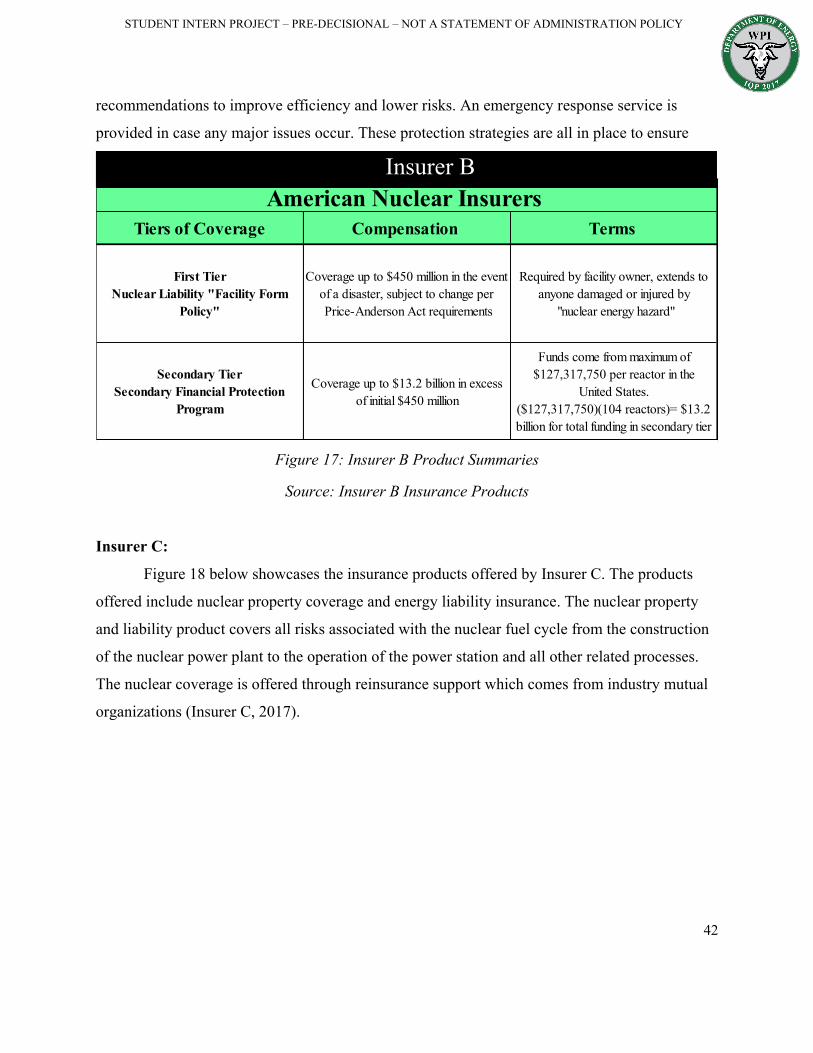
STUDENT INTERN PROJECT – PRE-DECISIONAL – NOT A STATEMENT OF ADMINISTRATION POLICY
42
recommendations to improve efficiency and lower risks. An emergency response service is
provided in case any major issues occur. These protection strategies are all in place to ensure
Insurer B’s relevance in the long run.
Figure 17: Insurer B Product Summaries
Source: Insurer B Insurance Products
Insurer C:
Figure 18 below showcases the insurance products offered by Insurer C. The products
offered include nuclear property coverage and energy liability insurance. The nuclear property
and liability product covers all risks associated with the nuclear fuel cycle from the construction
of the nuclear power plant to the operation of the power station and all other related processes.
The nuclear coverage is offered through reinsurance support which comes from industry mutual
organizations (Insurer C, 2017).
Tiers of Coverage Compensation Terms
First TierNuclear Liability "Facility Form
Policy"
Coverage up to $450 million in the event of a disaster, subject to change per Price-Anderson Act requirements
Required by facility owner, extends to anyone damaged or injured by
"nuclear energy hazard"
Secondary TierSecondary Financial Protection
Program
Coverage up to $13.2 billion in excess of initial $450 million
Funds come from maximum of $127,317,750 per reactor in the
United States. ($127,317,750)(104 reactors)= $13.2billion for total funding in secondary tier
American Nuclear Insurers Insurer B

STUDENT INTERN PROJECT – PRE-DECISIONAL – NOT A STATEMENT OF ADMINISTRATION POLICY
43
Figure 18: Insurer C Insurance Product Summaries
Source: Insurer C Insurance Products
Section 4.2 Non-Nuclear Energy Insurance Products
Insurer D Products:
Figure 19 below illustrates insurance products offered by Insurer D. Insurer D offers
energy, casualty, and property insurance products which broadly cover all risks associated with
construction, engineering losses such as necessary repairs, and costs for any replacement parts
deemed necessary. CyberEdge, as noted in Figure 18 covers all cyber security aspects including
physical losses and financial losses for example, property damage, data breaches, and digital
media liability.
Insurance Plans Product/Coverage Offered Product Conditions
Energy LiabilityGeneric energy liability for downstream
and upstream
Coverage of $150 MillionCoverage includes transmission,
distribution, power plants, and general energy utility risks
Can work for onshore or offshore, seperately or combined
requires operation description, policy terms, 5 year claim history
Nuclear Property & Liability Coverage of $250 MillionCovers all risks associated with the
nuclear fuel cycle from construction to operation of nuclear power stations
Offers participation in world-wide nuclear pooling system.
Also offers reinsurance support of mutual organisations
XL Catlin Product SummariesInsurer C

STUDENT INTERN PROJECT – PRE-DECISIONAL – NOT A STATEMENT OF ADMINISTRATION POLICY
44
Figure 19: Insurer D Insurance Product Summaries
Source: Insurer D Insurance Products
Insurer E Company Products:
Insurer E is a renewable energy focused insurance company that offers products which
include coverage for property and liability of electric utility projects from the development stage
to commercial implementation. Insurer E insures over 30,000 MW worth of wind turbines, 4,000
MW worth of solar panels, 30,000 MW worth of bio energy plants, 30,000 MW worth of hydro
power generators in addition to projects involving tidal energy, wave energy, and geothermal
energy (Insurer E, 2017).
Figure 20 below shows the insurance products offered by Insurer E for most types of
renewable power sources. Onshore wind refers to wind turbines that are constructed on land
whereas offshore wind refers to wind turbines that are constructed at sea. Insurer E’s solar
Product Title Product Coverage Product Conditions
Energy and Construction Casualty Insurance
Safeguard energy and construction clients
Risk engineering and loss prevention assistence, no numerical value
Client specific policy
Energy Property InsuranceCustomized coverage solutions and
engineering loss services
Up to $1.25 billion per occurrence worldwide
Customized coverage solutions, covers all risk property including repair or
replacement costs, business income lost through interruption, electrical service
Oil Rig® Coverage Oil specific property insurance
Up to $250 million on one single occurrence and location
Programs flexibleMisc. property, operator's expense,
physical damage
CyberEdge®General business cyber risk protection,
also offers various complementary services
Up to $100 million
Covers physical losses (such as business interruption and property damage) and financial losses (such as digital media
liability or data breaches)
American International GroupInsurer D
Oil Coverage
Cyber Coverage

STUDENT INTERN PROJECT – PRE-DECISIONAL – NOT A STATEMENT OF ADMINISTRATION POLICY
45
coverage offers coverage for a range of solar technologies including conventional photovoltaics,
concentrated photovoltaics, integrated photovoltaics, concentrated solar power, parabolic trough
systems, power tower dish systems, and Fresnel reflectors. The biofuel technologies that Insurer
E covers includes first generation corn ethanol, next generation cellulosic ethanol, alternative
fuels, bio refineries, and bio diesels. With respect to biomass technologies, Insurer E covers
direct combustion, aerobic digestion, anaerobic digestion, pyrolysis, and gasification. Insurer E
covers hydro technologies including run of river, pumped storage, diversion projects and small
impoundments In terms of geothermal projects, Insurer E covers three types of plants including
flash steam, binary cycle, and dry steam. Insurer E insures all projects testing applications of
wave energy harnessing as well as tidal technology projects (Insurer E, 2017).
Figure 20: Insurer E Insurance Product Summaries
Source: Insurer E Insurance Products
Product Title Product Coverage Onshore Wind
Any Onshore Wind Project or PhaseCoverage up to $500 Million
Offshore WindAny Offshore Wind Project or Phase
Coverage up to $300 Million
SolarAny Solar Project or Phase
Coverage up to $500 Million
BiofuelAny Biofuel Project or Phase
Coverage up to $300 Million
BioMassAny Biomass Project
Coverage up to $250 Million
Hydro Any Hydro Project or Phase
Coverage up to $300 Million
Geothermal Any Geothermal Project
Coverage up to $250 Million
Wave Any Wave Project or Phase
Coverage up to $300 Million
TidalAny Tidal Project or Phase
Coverage up to $300 Million
GCubeInsurer E
STUDENT INTERN PROJECT – PRE-DECISIONAL – NOT A STATEMENT OF ADMINISTRATION POLICY
46
Emerging Issues
The aftermath from storms like Hurricane Sandy had devastating effects not only on
homeowners but also on the utility companies that provide electricity. The Power Utility II is the
parent company of New Jersey’s largest utility. Power Utility II filed a lawsuit claiming that their
insurers had simply not covered enough in the aftermath of Hurricane Sandy (O’Neill, 2015). “A
state Superior Court judge in Essex County sided with Power Utility II in that case in March,
2015, finding that the company’s damages from storm surge were not subject to a limit for
flooding” (O’Neill, 2015). The insurance companies stated that: “…the company’s coverage was
limited to $250 million, because they said the losses were caused by flooding (Wichert, 2015).
The actual damages were in excess of $500 million and the total amount of coverage under the
policy was $1 billion. (Wichert, 2015). The insurer’s argument is based on a statement within the
policy that: “a storm surge is a type of flood under the policies and thus the $250 million limit
applies” (Wichert, 2015). The judge did end up siding with Power Utility II and the following
settlement has since been reached: “…total amount of insurance recovery is $264 million…$50
million was received in 2013 and the rest was recovered in the latest settlements” (O’Neill,
2015). A conclusion was met to ensure that losses were covered under the provided insurance
policies which stated the conditions of coverage.
Section 4.3 Investor Owned Utilities
Power Utility AA:
Power Utility AA is involved in every aspect of the energy business including power
generation, energy sales, and transmission/ delivery. Power Utility AA’s headquarters is in
Illinois and the company is currently providing energy to residents in 48 states. Not only are they
the largest owner of nuclear power plants in the United States, but they also own power
generation in the fields of natural gas, and oil, hydroelectricity, wind, oil, solar, and landfill gas.
Power Utility AA is one of the largest investor owned utility/generation companies, with 2016
revenues of nearly $31.4 billion.
The company’s overall generation capacity from their various power utilities is
approximately 40,000 MW each year. Their electricity portfolio includes 62% of power
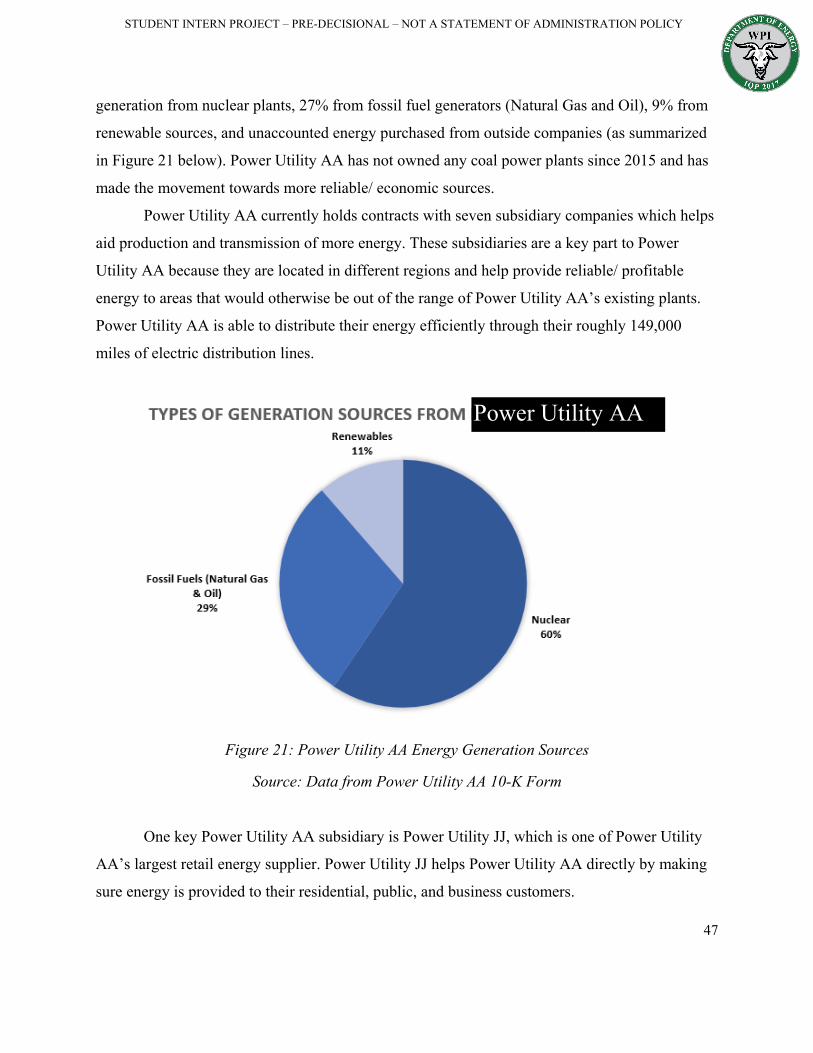
STUDENT INTERN PROJECT – PRE-DECISIONAL – NOT A STATEMENT OF ADMINISTRATION POLICY
47
generation from nuclear plants, 27% from fossil fuel generators (Natural Gas and Oil), 9% from
renewable sources, and unaccounted energy purchased from outside companies (as summarized
in Figure 21 below). Power Utility AA has not owned any coal power plants since 2015 and has
made the movement towards more reliable/ economic sources.
Power Utility AA currently holds contracts with seven subsidiary companies which helps
aid production and transmission of more energy. These subsidiaries are a key part to Power
Utility AA because they are located in different regions and help provide reliable/ profitable
energy to areas that would otherwise be out of the range of Power Utility AA’s existing plants.
Power Utility AA is able to distribute their energy efficiently through their roughly 149,000
miles of electric distribution lines.
Figure 21: Power Utility AA Energy Generation Sources
Source: Data from Power Utility AA 10-K Form
One key Power Utility AA subsidiary is Power Utility JJ, which is one of Power Utility
AA’s largest retail energy supplier. Power Utility JJ helps Power Utility AA directly by making
sure energy is provided to their residential, public, and business customers.
Power Utility AA
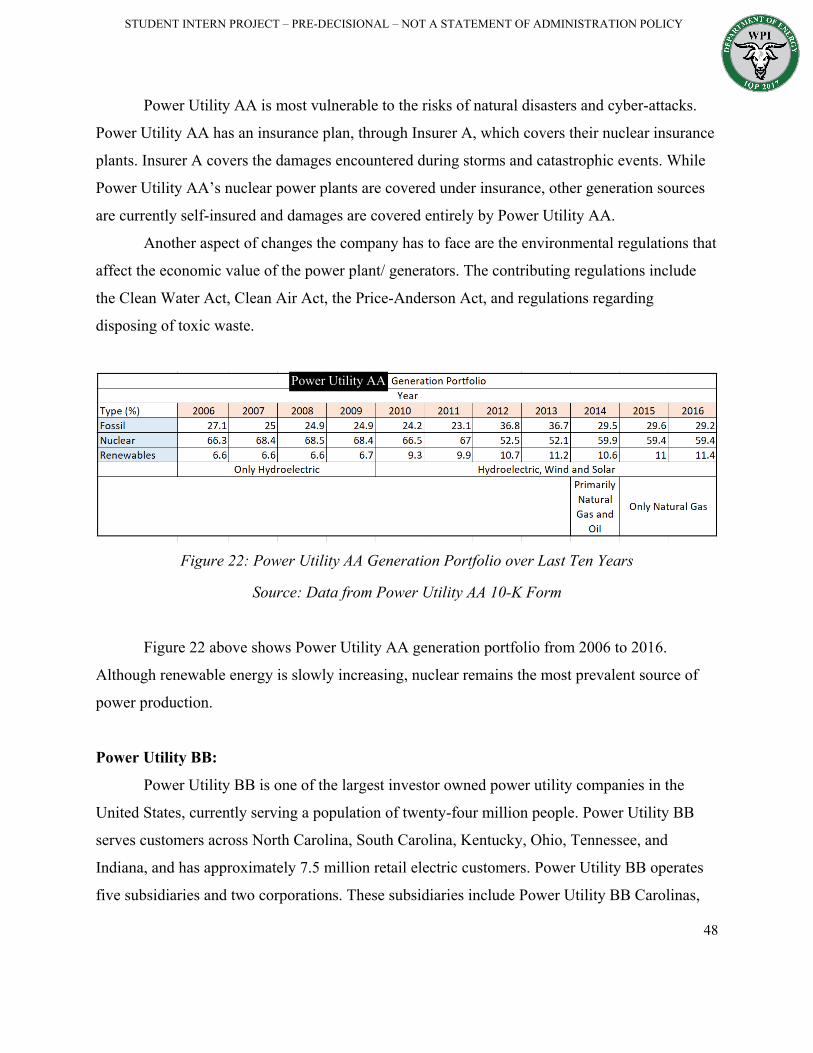
STUDENT INTERN PROJECT – PRE-DECISIONAL – NOT A STATEMENT OF ADMINISTRATION POLICY
48
Power Utility AA is most vulnerable to the risks of natural disasters and cyber-attacks.
Power Utility AA has an insurance plan, through Insurer A, which covers their nuclear insurance
plants. Insurer A covers the damages encountered during storms and catastrophic events. While
Power Utility AA’s nuclear power plants are covered under insurance, other generation sources
are currently self-insured and damages are covered entirely by Power Utility AA.
Another aspect of changes the company has to face are the environmental regulations that
affect the economic value of the power plant/ generators. The contributing regulations include
the Clean Water Act, Clean Air Act, the Price-Anderson Act, and regulations regarding
disposing of toxic waste.
Figure 22: Power Utility AA Generation Portfolio over Last Ten Years
Source: Data from Power Utility AA 10-K Form
Figure 22 above shows Power Utility AA generation portfolio from 2006 to 2016.
Although renewable energy is slowly increasing, nuclear remains the most prevalent source of
power production.
Power Utility BB:
Power Utility BB is one of the largest investor owned power utility companies in the
United States, currently serving a population of twenty-four million people. Power Utility BB
serves customers across North Carolina, South Carolina, Kentucky, Ohio, Tennessee, and
Indiana, and has approximately 7.5 million retail electric customers. Power Utility BB operates
five subsidiaries and two corporations. These subsidiaries include Power Utility BB Carolinas,
Power Utility AA

STUDENT INTERN PROJECT – PRE-DECISIONAL – NOT A STATEMENT OF ADMINISTRATION POLICY
49
Power Utility BB Progress, Power Utility BB Indiana, Power Utility BB Ohio/Kentucky, and
Power Utility BB Florida. These subsidiaries function as regulated public utilities engaged in the
generation, transmission, and distribution of electrical power in their designated areas.
Power Utility BB also owns Power Utility KK Natural Gas and Power Utility BB
Renewables. Power Utility KK Natural Gas, located in North Carolina, deals with the
distribution of natural gas to over one million customers. This recent purchase of Power Utility
KK was used to expand Power Utility BB’s relationship with natural gas power and establish a
broader foundation for natural gas infrastructure. Power Utility BB Renewables is focused on
developing and operating new renewable energy power generation infrastructure including wind
and solar assets have generating capacities totaling 2,900 MW of Power Utility BB’s energy
generation. Continuing Power Utility BB’s growth in the renewable department, the
advancements made within Power Utility BB Renewables serve the purpose of expanding its
investments in energy storage capacities and energy management solutions.
Power Utility BB is the owner of eleven nuclear reactors located in six different sites.
These eleven reactors contribute 18% of Power Utility BB’s total power generation. Nuclear
insurance is important to the business and operation of Power Utility BB. Power Utility BB’s
nuclear insurance, Insurer A provides “nuclear liability coverage; property, decontamination and
premature decommissioning coverage; and replacement power expense coverage” (Power Utility
BB Corporation, 2017). In agreement with the Price-Anderson Act, the owners of nuclear power
plants must provide for public nuclear liability claims, which can be up to $13.4 billion, but can
vary every five years due to inflation.
Figure 23 below shows a chart of Power Utility BB’s types of generation. This chart
includes purchased power that Power Utility BB buys from outside power producers.

STUDENT INTERN PROJECT – PRE-DECISIONAL – NOT A STATEMENT OF ADMINISTRATION POLICY
50
Figure 23: Power Utility BB Generation Sources
Source: Data from Power Utility BB 10-K Form 2017
Power Utility BB Carolinas, Power Utility BB Florida, and Power Utility BB Progress
have purchased the maximum amount of primary nuclear liability insurance. Over the past year,
these subsidiaries had a deductible increase from $375 million in January, 2016, to $450 million
in January, 2017. These subsidiaries are part of Insurer A, which provides coverage for property
damage, decontamination, and premature decommissioning. Insurer A requires its members to
maintain an investment grade credit rating to ensure liability coverage. The threat of terrorist
events are common in the industry with Insurer A protecting up to $1.83 Billion for non-nuclear
terrorist events and the full limit liability of $3.2 Billion.
Power Utility BB faces a series of operational risks, disclosed to shareholders that impact
not only the performance of the company, but also how Power Utility BB deals with coverage
during situations where large losses are involved. Weather conditions play a large role in
revenue. Abnormally warm winters and cool summers can cause losses in profit for natural gas
since not as much heating or cooling is needed. The supply and demand for energy plays a large
Power Utility BB

STUDENT INTERN PROJECT – PRE-DECISIONAL – NOT A STATEMENT OF ADMINISTRATION POLICY
51
role, in compliance with changing weather conditions, on the annual revenue. Disruption in the
transmission or transportation of energy or electric services due to key factors can result in losses
to customers but also impact production levels and their associated prices.
The Registrants, or subsidiaries, of Power Utility BB have insurance through Power
Utility BB’s fully owned insurance company, Insurer F insurance, or one of Power Utility BB’s
affiliates. Registrant insurance coverage includes general liability coverage for property damage,
worker’s compensation, and automobile liability. This policy does not cover the transmission or
distribution lines owned by Power Utility BB. These are self-insured by Power Utility BB
against natural disasters and damages from storms. Power Utility BB Florida maintains a reserve
for their distribution and electric transmission in response to storms on an expedited basis. The
cost paid by the Registrants for coverage can vary year to year based on natural disasters,
environmental conditions, and the history of claims from both the insurance and reinsurance
markets. When losses are too big to be covered by Insurer F and Power Utility BB, the
Registrants and subsidiaries are responsible for the exceeded limits of coverage and could have a
material effect on the subsidiaries.
Coal plants and natural gas pipelines that are owned by Power Utility BB are insured by a
means of self-insurance. Power Utility BB sets aside a fund each that is put towards operational
damages to their power plants. Nuclear plants cannot be self-insured because the liability from
them is too high and therefore insurance is purchased through Insurer A. The chart below shows
a decrease in the energy generated from coal plants and an increase in the energy generated from
natural gas.
Figure 24: Power Utility BB Portfolio over Last Ten Years
Source: Data from Power Utility BB 10-K Form
Power Utility BB

STUDENT INTERN PROJECT – PRE-DECISIONAL – NOT A STATEMENT OF ADMINISTRATION POLICY
52
Figure 24 above shows Power Utility BB’s generation portfolio from 2006 to 2016. Some
interesting aspects is the significant drop of coal from 2011 to 2013, and the corresponding
increase in natural gas.
Section 4.4 Municipal Utility
Power Utility CC:
Power Utility CC is a public power company which mainly focuses on power generation
and water systems. Power Utility CC is an integrated utility which provided the energy
generation, transmission, and distribution services to approximately one million customers
spanning over three Arizona counties. Their electricity portfolio includes coal, natural gas,
hydroelectric, renewable power plants and generators. The operational revenues of the company
were $3.08 billion for 2017, with an increase of 1.2% from the previous year. Operational
expenses for the year were $2.8 billion with an increase of 2.0% from the previous year.
Power Utility CC uses its resources to provide service to its retail customers, not the
wholesale market. With that being said, there are often times in the summer months where the
company cannot meet the demand of its customers and must rely on the wholesale market. The
district as a whole has an Energy Risk Management Program, which helps to limit the present
risks in the retail and wholesale energy markets. Power Utility CC utilizes its financial and
physical instruments such as forward contracts, future predictions, and other physical options to
cover damages. This Program is then monitored by the District’s Board of Directors which
approves the policies.
Besides dealing with operational risks of power plants and transmissions, the biggest
risks their company faces are the customer’s concern with safety and health. The customers want
cleaner sources and to know how their provider is adapting to environmental safety and health
concerns. Because Power Utility CC’s top priority is helping their customers, they are moving
away from coal plant power generation due to economic inefficiency. The company is moving
towards natural gas power generation and renewable sources because it lessens the degree of
their customers’ concerns.

STUDENT INTERN PROJECT – PRE-DECISIONAL – NOT A STATEMENT OF ADMINISTRATION POLICY
53
State regulations play a critical role in the building, decommissioning, and operational
risks faced by Power Utility CC. There are four impactful regulations Power Utility CC must
abide by in order to keep up with state and federal standards. The Arizona Department of
Environmental Quality focuses on public health and the environment in the state of Arizona.
They delegate federal programs to prevent air, water and land pollution and ensure cleanup.
Power Utility CC has operational plants that border the Navaho Nation tribal sites and there are
state regulations preventing the building and expansion on these lands. Similarly, Power Utility
CC cannot expand too close to the Grand Canyon, as it is a National Park area. The company
must follow all federal regulations but in some cases, the state has superiority.
Insurer G is the main insurance provider used by Power Utility CC to protect against
property damages. FM global provides insurance coverage to Power Utility CC with a high
deductible which does not vary between the different types of power generation. Power Utility
CC currently pays a two million dollar deductible to cover damages from operational liabilities
and natural disasters in Arizona. An emerging risk Power Utility CC is currently facing is cyber
security attacks to their operational systems. Insurer H is an insurance company that specializes
in this field and provides coverage for 1st and 3rd party breaches as well as supplying reliable
energy when needed.
Power Utility DD:
Power Utility DD is a public utility company that helps provide about 40,000 customers
with electricity. Power Utility DD does not have any generation technologies, but rather
purchases their power from the Power Utility EE. Power Utility DD’s major risks include natural
disasters and terrorism; although they are unpreventable, Power Utility DD has emergency
response procedures for each event. Terrorist attacks are a growing issue for the company and in
such events Power Utility DD has access to facilities with substations, as well as having the
ability to remotely monitor facility operations. Power Utility DD also has the ability to lock
down the facility to authorized personnel only, if necessary. For prevention of cyber-attacks,
Power Utility DD’s IT department has software in place to detect intrusions as well as hiring
independent contractors to audit their computer systems on a regular basis for internal and
external exposures. Cybersecurity and terrorism continues to be the top emerging risk and Power

STUDENT INTERN PROJECT – PRE-DECISIONAL – NOT A STATEMENT OF ADMINISTRATION POLICY
54
Utility DD has improved their security for access into the facilities and utilizes the “Insurer I
platform” for cybersecurity. Insurer I is a company which creates firewalls for prevention against
unauthorized access. Some of Insurer I’s products include Next-Generation Firewalls and SaaS
Security which control network traffic (Insurer I, 2017).
Power Utility DD is insured for their substation equipment but not their transmission and
distribution equipment. Power Utility DD’s substation equipment is also insured by Insurer G for
property liability, Insurer J for Boiler & Machinery coverage, Insurer K for umbrella liability,
Insurer L for pollution liability, and Insurer M for cyber liability. Although substations are
covered by many forms of insurance, Power Utility DD believes the area most vulnerable would
be the transmission and distribution resources such as utility poles, pole transformers and
distribution lines.
During the event of a natural disaster, only Insurer G and Insurer J would provide
coverage on property and casualty and boiler & machinery. Other insurance companies would
provide assistance remotely. The federal government will only intervene if a natural disaster has
a high enough magnitude, and only then will damages be covered.
Environmental laws have an impact on the company because their “Pollution Liability
coverage renewal is dependent upon Power Utility DD providing evidence of past environmental
inspections by various state and local agencies.” The passing of new environmental laws and
regulations that Power Utility DD would have to abide by would be incorporated as part of these
inspections. By having these inspections, Power Utility DD is making sure their company
follows the pollution liability coverage plan.
Section 4.5 Cooperative Utility
Power Utility FF:
While talking to a representative in the risk management department of Power Utility FF,
it was recognized that the Power Utility FF is the national association for all electric cooperatives
in America. They are an association that facilitates cooperative companies that own operating
power plants and generation facilities. Cooperative utilities operate as non-profits and are
“owned” by the customers because each customer owns shares in the company.
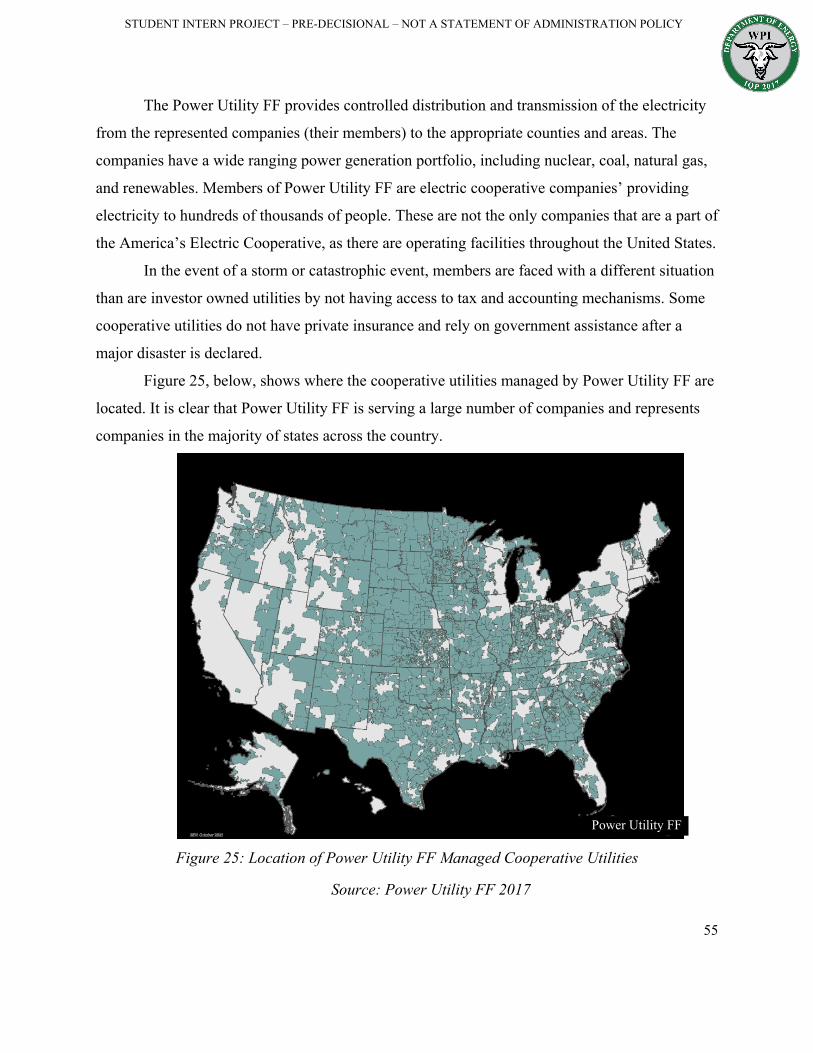
STUDENT INTERN PROJECT – PRE-DECISIONAL – NOT A STATEMENT OF ADMINISTRATION POLICY
55
The Power Utility FF provides controlled distribution and transmission of the electricity
from the represented companies (their members) to the appropriate counties and areas. The
companies have a wide ranging power generation portfolio, including nuclear, coal, natural gas,
and renewables. Members of Power Utility FF are electric cooperative companies’ providing
electricity to hundreds of thousands of people. These are not the only companies that are a part of
the America’s Electric Cooperative, as there are operating facilities throughout the United States.
In the event of a storm or catastrophic event, members are faced with a different situation
than are investor owned utilities by not having access to tax and accounting mechanisms. Some
cooperative utilities do not have private insurance and rely on government assistance after a
major disaster is declared.
Figure 25, below, shows where the cooperative utilities managed by Power Utility FF are
located. It is clear that Power Utility FF is serving a large number of companies and represents
companies in the majority of states across the country.
Figure 25: Location of Power Utility FF Managed Cooperative Utilities
Source: Power Utility FF 2017
Power Utility FF

STUDENT INTERN PROJECT – PRE-DECISIONAL – NOT A STATEMENT OF ADMINISTRATION POLICY
56
Section 4.6 Merchant Generators
Power Utility GG and Power Utility HH:
Some merchant generators, such as Power Utility GG and Power Utility HH, were
extremely difficult to contact and most of the information that was gained on these companies
was learned from their websites and 10-K filings. Power Utility GG has a large generation
portfolio which includes natural gas, coal, solar, wind, and nuclear power generation. Power
Utility GG is working towards completely eliminating the use of fossil fuels and switching
towards carbon reduction and renewable energy sources. Power Utility GG currently has a
generating capacity of approximately 30,000 MW and over 100 generation assets.
Power Utility GG has power plants located all throughout the United States and is
vulnerable to all types of risks. Natural disasters are one of the biggest issues faced by Power
Utility GG. They have an insurance plan to cover property damages. Power Utility GG’s
Cottonwood generating stations were damaged during the Cottonwood Flooding and due to
insurance coverage, Power Utility GG was able to spend just $2 million and be reimbursed for
$27.5 million in property damages. Another $10 million was covered for business interruption.
The insurance company was not specified, but having an insurance plan helped Power Utility
GG have coverage on possible major losses. Power Utility GG faces many operational risks such
as “conflicting laws and regulations that are subject to change, national/ international conflict
(terrorism), and political instability,” (Power Utility GG, 2017). As many companies similarly
face the challenge of laws and regulations towards environmental protection, Power Utility GG
is pushed away from power sources producing CO2 emissions and looking towards expanding in
clean energy generation.
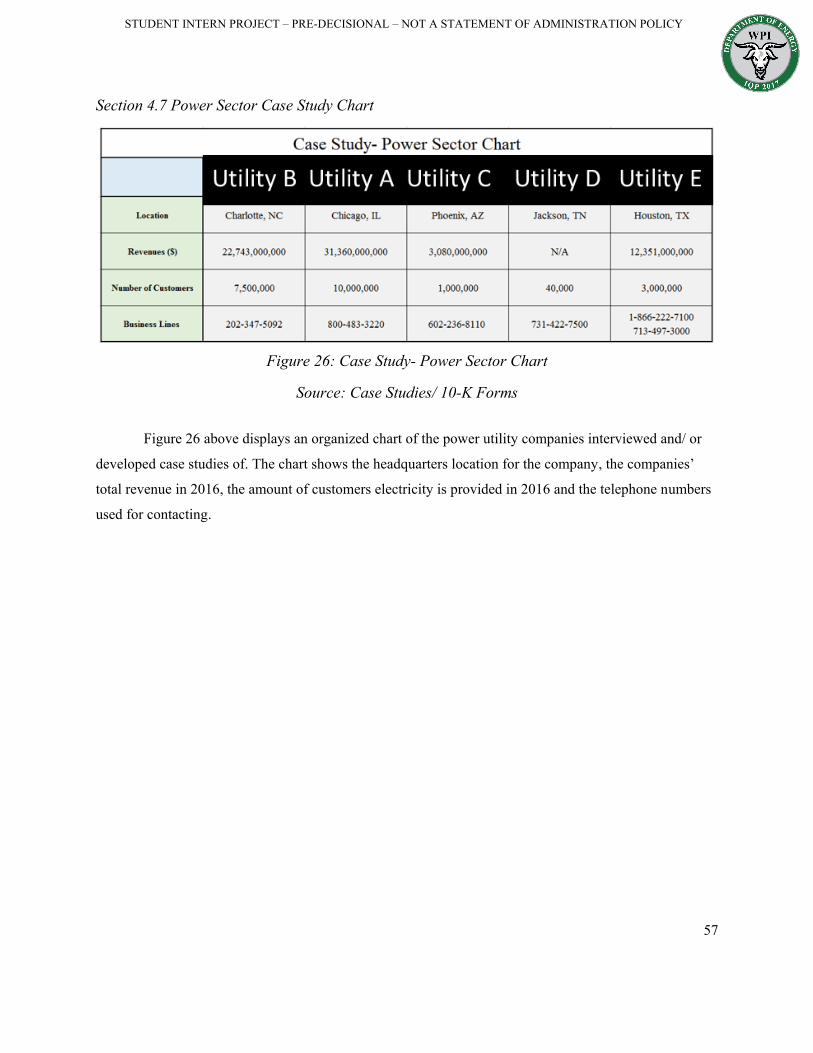
STUDENT INTERN PROJECT – PRE-DECISIONAL – NOT A STATEMENT OF ADMINISTRATION POLICY
57
Section 4.7 Power Sector Case Study Chart
Figure 26: Case Study- Power Sector Chart
Source: Case Studies/ 10-K Forms Figure 26 above displays an organized chart of the power utility companies interviewed and/ or
developed case studies of. The chart shows the headquarters location for the company, the companies’
total revenue in 2016, the amount of customers electricity is provided in 2016 and the telephone numbers
used for contacting.

STUDENT INTERN PROJECT – PRE-DECISIONAL – NOT A STATEMENT OF ADMINISTRATION POLICY
58
Chapter 5: Findings and Analysis Section 5.1 Nuclear Findings
Due to legal requirements, the findings regarding nuclear power insurance are extracted
from online research rather than interviews. Nuclear power is heavily regulated with little
competition in the insurance market. During an interview with Insurer O, they did not provide a
list of their clients since such information was private. A list of all insured companies for Insurer
A was provided on their website in the form of a financial report as was a list of the products
Insurer A offers. Insurer A is primarily the nuclear insurer used to protect all of the nuclear
power plants in the country through their primary property insurance program. The main
takeaway from these findings are that the public is insured through the Price-Anderson Act.
Since nuclear information regarding the Price-Anderson Act is available to the public, a
deeper analysis of the Price-Anderson Act was conducted. The following findings in this section
are the key aspects of how money is allocated through the Price-Anderson Act.
The Price-Anderson Act requires public compensation in case of nuclear accidents while
also limiting the liability of nuclear incidents.
The Price-Anderson Act limits the liability across the industry of nuclear power plant
insurance which encouraged the private market to cover nuclear plants instead of the government
alone. This liability limit came in the form of private industry self-insurance:
Nuclear insurers pool together their resources to one general fund in case of a nuclear
incident.
The association that oversees the nuclear insurance pool, Insurer B, acts on behalf of their
member companies, which are the licensees who own the nuclear power plants. The Price-
Anderson Act has been extended many times since its beginning in 1957. When the Price-
Anderson Act was put into effect, the owners of nuclear power plants were covered under a first
level tier of insurance for any one incident, costing up to 60 million dollars, for which coverage
each owner paid a premium.

STUDENT INTERN PROJECT – PRE-DECISIONAL – NOT A STATEMENT OF ADMINISTRATION POLICY
59
The Price-Anderson Act was extended several times because more coverage over time
was thought necessary. In 1966, the first revision of the Price-Anderson Act did not change
coverage amounts, but rather added a provision which prevented companies from offering
defense claims on the basis that the nuclear accident was due to no fault by them, while also
extending the act until 1976. The provision ensured that accountability was held paramount when
a nuclear incident occurs while maintaining the integrity to limit the liability to all parties
involved. The next extension came in 1975, and lasted until 1987, which increased the first level
tier of insurance for any single incident to $140 million. And again in 1988, the act was extended
until 2002, with an increase in first level tier insurance to $200 million. In 2003, the act was
extended again with another increase in first tier insurance to $300 million. The more recent
extension came in 2005, with an increase in first tier insurance to $375 million. The current
extension is in effect until 2025, and the current first tier insurance coverage was increased in
2017 to $450 million. The increase in coverage is because of inflation directly. $60 million is
equivalent to approximately $450 million in today’s value. Figure 27 below shows the trend of
the increase caused by inflation in insurance coverage per the requirement of the amendments to
the Price-Anderson Act.

STUDENT INTERN PROJECT – PRE-DECISIONAL – NOT A STATEMENT OF ADMINISTRATION POLICY
60
Figure 27: Total Nuclear Insurer Coverage Mandated By the Price-Anderson Act Source: Data gathered from NRC website 2017
With the current values, Figure 28 below shows the first and second tiers of coverage in
case of a nuclear incident. The first tier covers any nuclear incident, for any one nuclear power
reactor, up to $450 million. Second tier coverage takes effect when the first tier is not enough, in
which case the owners of the nuclear power plants pay up to $127,317,750 per reactor. This
serves as an excess of $13.2 billion in coverage in case of a catastrophic nuclear disaster. If these
funds are not enough it is up to the President of the United States and Congress to decide how to
allocate funding needing during a nuclear disaster if the incident causes more than $13.2 billion
in damage.
Figure 28: Total Nuclear Insurer Funds under the Price-Anderson Act
Source: Data gathered from NRC website 2017

STUDENT INTERN PROJECT – PRE-DECISIONAL – NOT A STATEMENT OF ADMINISTRATION POLICY
61
The only portion of a company’s generation portfolio that cannot be self-insured is the
nuclear portion.
Most companies incorporate large amounts of risk mitigation into their generation
portfolios in order to lower potential costs of coverage. Some larger companies have ample risk
mitigation procedures; therefore, they can entirely self-insure their power generation plants. As
seen in various large IOU 10-K forms, no company is allowed to self-insure their nuclear
section. The Price-Anderson Act requires all companies with nuclear plants to participate in the
insurance pooling system. Since nuclear plants are impossible for a single insurance company to
cover, nuclear portions of the power utility company would also be impossible to self-insure.
Even if a company set aside capital and performed all possible forms of risk mitigation, the
potential risks and losses from a nuclear accident are too great for a company to bear on its own.
The Price-Anderson Act was set into place originally because the “amount of insurance required
could not be underwritten at the time by any single or joint company effort" (Byrne and
Hoffman, 1996), and the continued updates on the act show that this reason is still in place.
Therefore all nuclear plant regulations go through the nuclear pool dedicated towards nuclear
liability mitigation. Section 5.2 Non-Nuclear Insurer Findings
The power utility market with respect to renewable energy sources is relatively new and growing compared to the power utility market for nonrenewable energy sources; therefore the insurance industry is more competitive for the power utility market with respect to renewable energy sources. Amongst the interviews conducted, topics regarding renewable energy types had very
diverse perspectives and opinions. As the renewable energy market grows companies are
offering additional products in order to remain competitive. This level of competition encourages
secrecy within the companies. This was seen in interviews with insurance companies. When
talking with nuclear focused companies most questions were answered; however, when
interviewing a renewable energy specifics were omitted because they did not want to give away
any competitive edge.
Companies usually don’t even share the same opinions regarding power sources to
insure. Some companies consider solar to be one of the only reliable renewable power sources.

STUDENT INTERN PROJECT – PRE-DECISIONAL – NOT A STATEMENT OF ADMINISTRATION POLICY
62
Other companies view wind power as a relevant power source because of recent technological
advancements. By raising the height of the wind turbine a new layer of wind energy can be
utilized which can make wind power more profitable which in turn could be more desirable for
insurance companies, as stated from one interview. These opposing thoughts demonstrate that
the renewable energy insurance industry is still evolving.
The biggest risk that insurance companies cover are natural disasters.
With respect to power utility companies, the biggest risk an insurer can cover is against
natural disasters. When interviewed about the biggest risks insurance companies face, the
interviewees often skipped over natural catastrophes to focus on emerging risks such as cyber
and third party liability, because a natural disaster is the obvious largest risk. The insurers
interviewed also noted that terrorist attacks are viewed on the same level as natural disasters.
Insurance companies offer disaster relief products to cover losses, and usually have backup
through reinsurance. When looking past natural disasters the other biggest risks companies face
vary based on regions and other factors. Some companies view work place injuries as the largest
risk they cover, others see third party liability as a major risk.
Cyber protection is a continuous learning process for those generating protection methods.
When dealing with cyber-attacks most companies look for multiple different insurance
plans and forms of risk mitigation in order to cover any potential risks. Some companies offer
direct cyber insurance, such as Insurer D, which offers coverage against physical losses (such as
business interruption) and financial losses (such as data breaches). Other companies have some
risk coverage as a secondary plan underneath other products, such as property or casualty
insurance. However companies such as Distributor’s and Insurer J still consider cyber risks to be
one of their biggest issues. Since the severity of cyber threats is constantly evolving as
technology evolves companies put into place cyber risk mitigation procedures for their plants
and their employees. Company managers make sure that all employees are updated on the
potential risks of cyber-attacks, and give brief lessons on how to stay best protected against these
attacks. Managers also update any old hardware or software so that the company runs as securely
and efficiently as possible. Some companies also have underwriters performing a key role in risk

STUDENT INTERN PROJECT – PRE-DECISIONAL – NOT A STATEMENT OF ADMINISTRATION POLICY
63
mitigation procedures by creating and updating risk models in order to predict any future issues
the company could face. Section 5.3 Power Utility FFindings
Companies often invest in multiple insurance products to protect against all risks
associated with the company.
Investor owned, cooperative, and municipal power utility companies have many different
aspects to their company that require insurance to operate properly. When analyzing the case
study with Power Utility CC, a municipal company, it was found that the company utilizes the
service of multiple insurance coverage for well-rounded protection of the company. For their
property insurance, an insurance company called Insurer G is used, while, for risks associated
with cyber security, another company called Insurer H is used. When looking at the case study
documented on Power Utility DD, a public utility company, they utilize services from a wide
variety of insurance companies, each specializing in a different form of insurance. For example,
Power Utility DD also pays for property insurance through Insurer G, cyber security coverage
through Beasley Insurance, and have umbrella liability insurance through Navigators Insurance.
Having a wide variety of companies, each offering a different form of coverage, allows the
power utility company to not rely on just one company in the case of an emergency. In the event
of a natural disaster, it is common for only one or two of the companies’ insurance companies to
employ direct help to the utility. As stated in the interview with Power Utility DD, it is more
likely that the insurance companies will provide help from their remote locations. In the event of
a natural disaster, the federal government will step in when the there is too much damage for the
insurance company to cover or if the disaster is declared as a state or national emergency.
Most investor owned utility companies are self-insured by setting aside capital in case of
incidents, essentially a ‘rainy day’ fund.
Many IOUs do not invest in insurance for power plants outside of the required insurance
for nuclear power plants. Power Utility BB and Power Utility AA use a self-insurance plan and
are faced with all expenses during a high risk event. Many other IOUs self-insure as well as a
form of risk mitigation. Each company dedicates an allotted amount of money each year towards

STUDENT INTERN PROJECT – PRE-DECISIONAL – NOT A STATEMENT OF ADMINISTRATION POLICY
64
funding damaged power plants. A certain amount of money is required to be directed into the
fund even if the money from the previous year was not used. Due to the nature of IOUs being
large-scale power utilities, each company owns power plants ranging through many regions.
When one power plant is damaged, the company continues to make revenue from the many other
power plants owned. Self-insurance is the primary method of risk mitigation for IOUs where it
would not be as efficient for smaller companies such as municipal, cooperative or merchant
generators.
Most power distributors do not have insurance for transmission lines.
Power distribution and transmission lines may be owned by power utility companies, but
insurance is generally not purchased to cover them in case of damages. When speaking to Power
Utility CC, a company which generates energy but also distributes it, they mentioned how their
power plants are covered by property insurance but the transmission lines are not covered. This
is similar to Power Utility DD, who does not purchase insurance for their transmission lines.
The biggest risks faced by most types of power utility companies are natural disasters and
terrorism (including cyber).
Companies can suffer major losses from natural disasters and all forms of terrorist
attacks. With the exception of most investor owned utility companies, most municipal utility
companies and cooperative utility companies which have insurance plans covering damages
from significant natural disasters. Both natural disasters and terrorist attacks can cause economic
losses that are unrecoverable by power utilities. Companies have been dealing with natural
disasters since the beginning of electricity generation, but the emerging risks for all power utility
companies are from cyber-attacks. According to the DOE document “Insurance as a Risk
Management Instrument for Energy Infrastructure Security and Resilience,” typical issues in the
cyber security field involve liability, property loss, theft, data damages, and loss of income from
network outages. Currently there are a few companies which have insurance plans that will limit
the expenses in the event of an attack. Power Utility CC has coverage for cybersecurity using the
insurance company Insurer H, which helps secure Power Utility CC’s power transmission, helps
prevent blackouts, helps cover the distribution of electricity to Power Utility CC’s providers, and

STUDENT INTERN PROJECT – PRE-DECISIONAL – NOT A STATEMENT OF ADMINISTRATION POLICY
65
helps prevent future attacks. Another company with a cybersecurity plan is Power Utility DD
which uses Insurer M for coverage on cyber-attacks. Many utility companies have a basic cyber
protection insurance plan, but companies are looking to invest in the plan with the best coverage
due to the possibility of large losses caused by cyber-attacks. Both Power Utility CC and Power
Utility DD power utility companies listed cyber security as a new emerging risk to look out for.
This caution means that the field of cyber security insurance has ample room to grow.
Risk associated with power utilities varies by region. Weather and geographic location
cause this variation.
Depending on the geographic region in which power utilities are located, generation
technologies are faced with different types of natural disasters and environmental factors. Power
Utility CC has a high deductible on their insurance plan and knows that they have a low risk of
major losses on their power plants. Power Utility DD is located in Tennessee and although not be
affected by hurricanes, Power Utility DD is still faced natural disasters such as fires and tornados
that cause economic losses. Some IOUs such as Power Utility BB and Power Utility AA have
power plants located in multiple regions and deal with all types of natural disasters. These larger
companies have to deal with natural disasters differently and have different strategies for dealing
with the damages. Some of the differences include a self-insurance plan in which money is added
to an account dedicated to relief after disasters.

STUDENT INTERN PROJECT – PRE-DECISIONAL – NOT A STATEMENT OF ADMINISTRATION POLICY
66
Figure 29: United States Vulnerability to Natural Hazards
Source: Insurance as a risk management instrument for energy infrastructure security and
resilience (Guerritore, 2013)
Figure 29 above shows regions of the United States vulnerable to natural disasters. This
chart shows areas affected by hurricanes, earthquakes, and tornados. These are only a few of the
natural disasters faced, but it is clear that the east coast of the United States was the most
exposed to hurricanes while the west coast was most exposed to earthquakes. Figure 29 above
aided in the narrowing down the natural disasters faced by each company analyzed. Companies
were forced to purchase different types of insurance products depending on the natural disasters
exposed to within their region of the United States.
Companies have a wide range of generation technologies; most companies interviewed
stated that they maintain a diverse generation portfolio to satisfy customer needs and avoid
blackouts.
With the changing climate concerns and consumer knowledge of greener forms of
technologies becoming available, power utility companies must be able to adapt to the changing
environmental concerns of their customers, which in return keeps the grid functioning properly.

STUDENT INTERN PROJECT – PRE-DECISIONAL – NOT A STATEMENT OF ADMINISTRATION POLICY
67
The municipal company Power Utility CC interpreted one of their biggest risks to be being able
to satisfy the growing needs of their customers. Power Utility CC’s customers are becoming
more educated and are interested and having their energy produced from greener sources. This is
one of the reasons that Power Utility CC is also moving towards more renewable sources and
decommissioning many of their coal plants. By having a variety of generating technologies, a
company is not dependent on one type of technology to produce the entire capacity for the
company. This helps the company during an extreme situation where one or more type of
technology is unable to operate effectively.
During a natural disaster spanning across a large geographic area, having many types of
generation technologies helps to prevent blackouts. While talking to DOE expert Alex Breckel, it
was discovered that the electricity grid in the United States is designed to have a maximum
cumulative 24 hour blackout period every ten years. Having a diverse portfolio of generating
technologies across the United States helps the industry to build a more resilient and reliant
energy grid. According to the DOE document “Insurance as a Risk Management Instrument for
Energy Infrastructure Security and Resilience,” power outages in the United States are expected
to increase as demonstrated in the past decade. Having companies expanding their generating
portfolios will help prevent aging infrastructure and could possibly reduce high economic losses
due to grid issues.
Numerous companies’ generation portfolios show a decrease in coal plant electric power
generation with an increase in natural gas power generation.
Many factors have contributed towards decommissioning coal plants, including
economics, market structures, environmental regulations, risks associated with coal plants, and
the changing views of consumers. Laws such as the Clean Air Act have impacted the operation
of coal plants.
One of Power Utility CC’s main goals is to meet the needs of their customers. As more
information is being released to the public about the reduced carbon emissions and cleaner
energy sources, consumers are becoming more educated about the changing environment and the
source their energy. Power Utility CC has decommissioned most coal plants because they are
STUDENT INTERN PROJECT – PRE-DECISIONAL – NOT A STATEMENT OF ADMINISTRATION POLICY
68
becoming less economically efficient and because their customers are requesting to have their
energy produced by cleaner energy sources.
When looking at the case study from the investor owned utility Power Utility BB, the
chart that explains their generation portfolio through the last ten years shows a decrease in
energy generated from coal plants starting in 2011. The Clean Air Act lists 187 hazardous
pollutants to look out for and coal plants emit many of them (EPA, 2017). When the Clean Air
Act was amended in 2011, Power Utility BB had the provided four year period to be able to
comply with the Mercury and Air Toxics Standards (EPA, 2017). Over these four years, their
energy portfolio changes from mainly coal based to having a variety of sources from coal,
nuclear, natural gas, and renewables. Federal laws and regulations required under legislation such as the Clean Air Act, Clean
Water Act, National Environmental Policy Act, Coal Ash Act, Resource Conservation and
Recovery Act, and Solid Waste Disposal Act have effects on various types of power
generation technologies and power utility companies.
Through the analysis of 10-K forms, it became evident that federal regulations have a
major impact in the world of power generation. The analysis of the effects of federal laws on
IOUs, merchant generators as well as other power generation companies were able to be found
through these filings. In the 10-K forms, companies disclose all environmental regulations which
they comply with. Analysis of the 10-K forms over the past ten years revealed a clear trend in
renewable resources becoming more popular while fossil fuels power generation is not growing.
Regulations highlighted in these 10-K forms include the Clean Air Act, Clean Water Act, and
Coal Ash Act.
Power Utility CC is faced with unique state laws and regulations for Arizona as well as
dealing with federal regulations. Power Utility CC deals with Arizona Department of
Environmental Quality (ADEQ) which focuses on pubic and health and the environment in the
state of Arizona and delegates federal programs to prevent air, water and land pollution and
ensure cleanup. Power Utility CC also deals with limited expansion to areas of Native American
land and near National Park areas, such as the Grand Canyon.

STUDENT INTERN PROJECT – PRE-DECISIONAL – NOT A STATEMENT OF ADMINISTRATION POLICY
69
Power Utility DD must also comply with changing environmental regulations and
employees involved in the areas that affected by the changes are updated on the changes. Power
Utility DD’s Pollution Liability coverage is dependent on providing evidence for past
environmental inspections performed by state and local agencies.
STUDENT INTERN PROJECT – PRE-DECISIONAL – NOT A STATEMENT OF ADMINISTRATION POLICY
70
Chapter 6: Next Steps in Conclusion
Timing of Contact
An interesting insight from the insurance company Insurer C was that post-hurricane
season is the most difficult time to contact insurance companies. A future recommendation for
continued insurance research would be to conduct interviews in the spring or summer time rather
than the fall.
Who to Interview
Power utility companies are more willing to state who their insurers are than insurance
companies are willing to state who their clients are because of confidentiality reasons. Therefore
power utility companies should be contacted first to find out who insures them. Multiple
insurance contacts were discovered based on interviews with power utility companies. Some
insurance companies such as Insurer A do list their members however this not true for the
majority of companies.
In-person interviews
Gathering data on power utility companies over the phone was difficult. It would be
easier to conduct interviews in person. Having in-person interviews could provide more time to
ask questions and perform a more conversational based interview strategy. Personal interviews
with employees of the Department of Energy were easier to conduct because the conversations
were more engaging and tended to last longer than over the phone interviews. The phone
interviews were very structured whereas the in-person interviews were conversationally based.
More efficient way to analyze 10-K forms
A more efficient data collection regarding 10-K forms could lead to more advanced data.
Each 10-K Form has multiple sections that provide accurate information about a company, but a
broader topic such as insurance may be introduced in multiple sections throughout the report. In
order to gather data on a particular section of the report from multiple years, using a program
such as Matlab or writing a script is recommended. The computer will be able to process

STUDENT INTERN PROJECT – PRE-DECISIONAL – NOT A STATEMENT OF ADMINISTRATION POLICY
71
multiple forms for certain information much faster than a person would be able to. Using a
program or script to process information would provide more results for the overall data
collection.
Understanding Insurer Modeling
One of the next step to further the understanding of insurance is examining the insurance
modeling plans conducted by the underwriter. The underwriter is responsible for developing and
enhancing risk models used to predict and help overcome potential future risks, as well as
determine premiums and finalize product details. The underwriter serves a crucial role in risk
mitigation, and the methods used to examine the information would add great depth in the
understanding of the insurance industry. The interviews and website analysis was a great start to
shape the understanding of what insurance companies offer; however, further research can be
conducted which would involve more interaction between the researcher and insurance company
underwriters. This opportunity is assumed to be limited because a majority of the insurance
companies contacted refused to answer any questions. The number of insurance companies that
would invite showing their modeling schematics would be extremely low, but if even one is
willing to share how they model, then a new angle would be recognized for the understanding of
the insurance industries evaluation of power utility companies.
STUDENT INTERN PROJECT – PRE-DECISIONAL – NOT A STATEMENT OF ADMINISTRATION POLICY
72
Works Cited
1. Insurer D. (2017). Individual Claims. Retrieved from
http://www.aig.com/individual/individual-claims
2. Insurer B. (2017). Insuring the Future of Nuclear Power Worldwide. Retrieved 2017, from http://www.amnucins.com/
3. AON. (2017). Energy & Mining. Retrieved 2017, from http://www.aon.com/industry-expertise/energy-mining.jsp
4. Birkland, T. A. (1997). After Disaster. Retrieved September 17, 2017, from
https://books.google.com/books?hl=en&lr=&id=dkvJTV0bzacC&oi=fnd&pg=PR7&dq=
hurricanes%2Bpower%2Bplants%2Bafter&ots=3AePvOg471&sig=zC4OlwYnShuzK62
X5iq7oCYsnRY#v=onepage&q&f=false
5. Carrino, A. J., & Jones, R. B. (2011). Coal Plants Challenged as Gas Plants Surge.
Power, 155(1), 47-49.
6. Insurer N. (2017). Help After a Hurricane. Retrieved from https://www2.chubb.com/us-
en/?gclid=Cj0KCQjwpMLOBRC9ARIsAPiGeZBvJzTH6chHf87P7JeOi--
pAwLWlLoThLqFqiWNLL_BC_pkEkS2HIoaAj1zEALw_wcB&dclid=CIiSpO7p0NYC
FZFCNwodzywKmA
7. Brahin, P., Chatagny, J., Haberstich, U., Lechner, R., & Schraft, A. (2010). The Essential
Guide to Reinsurance [PDF]. Zurich: Swiss Reinsurance Company.
8. Dams and Energy Sectors Interdependency Study [PDF]. (2011, September). Department
of Energy, Department of Homeland Security.
9. Power Utility BB Corporation. (2017). 2016 Form 10-K. Retrieved From https://www.sec.gov/Archives/edgar/data/17797/000132616017000016/duk-20161231x10k.htm
10. EIA. (n.d.). U.S. Energy Information Administration - EIA - Independent Statistics and Analysis. Retrieved November 16, 2017, from https://www.eia.gov
11. Electric Power Monthly [PDF]. (2017, September). United States Energy Information
Administration
12. EPA. (2017, June 12). Cleaner Power Plants. Retrieved 2017, from
https://www.epa.gov/mats/cleaner-power-plants
13. Power Utility AA. (2017). 2016 Form 10-K. Retrieved From https://www.sec.gov/Archives/edgar/data/8192/000119312517039639/d339405d10k.htm

STUDENT INTERN PROJECT – PRE-DECISIONAL – NOT A STATEMENT OF ADMINISTRATION POLICY
73
14. FEMA. (2011, May). Disaster Declaration process [PDF]. U.S. Department of homeland Security.
15. Frye, E. (2005). Insurance and the Nation’s Electrical Infrastructure: Mutual
Understanding and Maturing Relationships. [pdf] Arlington, VA. [Accessed 2017].
16. Insurer E. (2017). Insurer E Insurance Services. Retrieved 2017, from http://www.gcube-insurance.com/en/products/windpro/
17. Ghosh, T. K., & Prelas, M. A. (2009). Energy resources and systems: Volume 1:
Fundamentals and non-renewable resources. Dordrecht: Springer Netherlands.
doi:10.1007/978-90-481-2383-4
18. Gifford, R. L., Lunt, R. J., & Larson, M. S. (2017, June). The Breakdown of the
Merchant Generation Business Model [PDF]. Power Research Group
19. Guerritore, W. B. (2013). Insurance as a risk management instrument for energy
infrastructure security and resilience. Hauppauge: Nova Science Publishers, Inc
20. Harte, R., Höffer, R., Krätzig, W. B., Mark, P., & Niemann, H. (2013). Solar updraft
power plants: Engineering structures for sustainable energy generation. Engineering
Structures, 56, 1698-1706. doi:10.1016/j.engstruct.2013.07.033
21. Hibbard, P. J., & Schatzki, T. (2012). The interdependence of electricity and natural gas:
Current factors and future prospects doi://doi.org/10.1016/j.tej.2012.04.012
22. Investopedia. (2015, November 14). Reinsurance. Retrieved from
http://www.investopedia.com/terms/r/reinsurance.asp
23. Kearney, L. (2015, March 3). FEMA settles first wave of NY, NJ Sandy insurance
litigation. Retrieved from http://www.reuters.com/article/us-usa-sandy-insurance/fema-
settles-first-wave-of-ny-nj-sandy-insurance-litigation-idUSKBN0LZ2KM20150303
24. Kim, Joe. (2017, July). Cyber-security in government: reducing the risk. Computer Fraud
and Security, Issue 7, 8-11
25. Larson, A. (2017, March 14). New and Improved Insurance Offerings Provide Power
Plants with More Options. Retrieved September 05, 2017, from
http://www.powermag.com/new-improved-insurance-offerings-provide-power-plants-
options/?printmode=1
26. Lewis, Michael. (2017 September). WHY THE SCARIEST NUCLEAR THREAT MAY
BE COMING FROM INSIDE THE WHITE HOUSE. Hive
STUDENT INTERN PROJECT – PRE-DECISIONAL – NOT A STATEMENT OF ADMINISTRATION POLICY
74
27. Logan, J., Marcy, C., McCall, J., Flores-Espino, F., Bloom, A., Aabakken, J., ... &
Ganda, F. (2017). Electricity Generation Baseline Report–Executive Summary.
28. Munich Re NatCatSERVICE. (2017). Retrieved September, 2017, from
https://www.munichre.com/en/reinsurance/index.html
29. NAIC. (2017). Nuclear Liability Insurance. Retrieved November 16, 2017, from http://www.naic.org/cipr_topics/topic_nuclear_liability_insurance.htm
30. National Association of Insurer Commissioners. (2017). Cybersecurity. Retrieved from
http://www.naic.org/cipr_topics/topic_cyber_risk.htm
31. National Drought Mitigation Center. (n.d.). Types of Drought Impacts. Retrieved
September, 2017, from
http://drought.unl.edu/DroughtforKids/HowDoesDroughtAffectOurLives/TypesofDrough
tImpacts.aspx
32. Nbpuc. (n.d.). Municipal Utilities. Retrieved November 16, 2017, from http://www.nbpuc.com/what_is_a_municipal_utility.php#.Wg2xPP-nHcs 33. Insurer A. (2017, March 24). Annual Report 2016 [PDF]. Insurer A 34. Insurer A. (2017). Insurer A. Retrieved 2017, from https://www.nmlneil.com/ 35. Power Utility GG Inc. (2017). 2016 Form 10-K. Retrieved From
https://www.sec.gov/Archives/edgar/data/8192/000119312517039639/d339405d10k.htm 36. Nuclear Energy Institute. (2011). Waterford 3 Nuclear Plant Weathers Hurricane Katrina.
Retrieved September 17, 2017, from http://safetyfirst.nei.org/safety-and-
security/waterford-3-nuclear-plant-weathers-hurricane-katrina/
37. N. N. (2017, September 21). FPL spent $3 billion preparing for a storm. So why did Irma
knock out the lights? Retrieved from
http://www.miamiherald.com/news/weather/hurricane/article174521756.html
38. Nilsen, E. (2017, August 29). As Houston floods, many are worried about Texas’s
controversial new insurance law. Retrieved from https://www.vox.com/policy-and-
politics/2017/8/29/16219902/texas-insurance-law-harvey
39. O'Neill, E. (2015, May 05). Power Utility II's battle with insurers over Sandy claims ends
with large settlement. Retrieved from
http://www.nj.com/business/index.ssf/2015/05/psegs_battle_with_insurers_over_sandy_c
laims_ends_with_large_settlement.html
STUDENT INTERN PROJECT – PRE-DECISIONAL – NOT A STATEMENT OF ADMINISTRATION POLICY
75
40. Insurer I. (2017). Products. Retrieved 2017, from
https://www.paloaltonetworks.com/products
41. Pareto, Cathy. (2017). Intro to Insurance: What is Insurance. Retrieved from
http://www.investopedia.com/university/insurance/insurance1.asp?ad=dirN&qo=investop
ediaSiteSearch&qsrc=0&o=40186
42. Rangaraju, J. (2015). Technology advancements accelerate adoption of renewable
energy. Ecn, Retrieved from http://ezproxy.wpi.edu/login?url=https://search-proquest-
com.ezproxy.wpi.edu/docview/1756022384?accountid=29120
43. S&P Global. “The mad, mad world of merchant power, through the histories of Power
Utility GG and
Power Utility HH.” The Barrel Blog, 28 Aug. 2012,
blogs.platts.com/2012/07/24/the_mad_mad_wor/.
44. Saedi, A. M., Thambirajah, J. J., & Pariatamby, A. (2014). A HIRARC model for safety
and risk evaluation at a hydroelectric power generation plant
doi://dx.doi.org/10.1016/j.ssci.2014.05.013
45. Saunders, S. (2012). More midwestern extreme storms. Retrieved from
http://www.rockymountainclimate.org/images/DoubledTroubleHigh.pdf
46. Staudt, A., & Curry, R. (2011). More Extreme Weather and the U.S. Energy
Infrastructure [PDF]. National Wildlife Federation
47. Sunshine, Wendy Lyons. “Differences Between Electric Cooperatives and Commercial
Utilities.” The Balance, 18 Apr. 2017, www.thebalance.com/electric-cooperatives-vs-
utilities-1182700.
48. Swiss Re Worldwide. (2017). Retrieved September, 2017, from http://www.swissre.com/
49. United States Department of Energy. (2017). Retrieved September, 2017, from
https://energy.gov/mission
50. U.S. NRC. (2014, December 12). Backgrounder on Nuclear Insurance and Disaster Relief. Retrieved 2017, from https://www.nrc.gov/reading-rm/doc-collections/fact-sheets/nuclear-insurance.html
51. Verma, A. K., Ajit, S., Muruva, H. P., SpringerLink (Online service), & SpringerLINK
ebooks - Engineering. (2015). Risk management of non-renewable energy systems
(2015th ed.). Cham: Springer International Publishing. doi:10.1007/978-3-319-16062-7

STUDENT INTERN PROJECT – PRE-DECISIONAL – NOT A STATEMENT OF ADMINISTRATION POLICY
76
52. Willis Towers Watson. (2016). Taking Cover: How an Insurance Shortfall Leaves the
Energy Sector Exposed[PDF]. Willis Towers Watson.
53. Willis Power Market Review [PDF]. (2014). London, United Kingdom: Willis Limited
54. World Nuclear. (2016, December). Nuclear Power Plants and Earthquakes. Retrieved
from http://www.world-nuclear.org/information-library/safety-and-security/safety-of-
plants/nuclear-power-plants-and-earthquakes.aspx
55. Insurer C. (2017). Insurer C - Global Property and Casualty Insurance and Reinsurance. Retrieved 2017, from http://xlcatlin.com/
56. YERGIN, D. (2006). Ensuring energy security. Foreign Affairs, 85(2) Retrieved from
http://parlinfo.aph.gov.au/parlInfo/search/display/display.w3p;query=library/jrnart/RV0J
6

STUDENT INTERN PROJECT – PRE-DECISIONAL – NOT A STATEMENT OF ADMINISTRATION POLICY
77
Appendix A: Interview Plan Federal Expert Interview Plan
Hello, we are undergraduate students studying at Worcester Polytechnic Institute, located
in Massachusetts, and are currently working with the United States Department of Energy’s
Office of Energy Policy and Systems Analysis (EPSA) for seven weeks to complete a student
project this fall. Thank you for agreeing to let us interview you for this project.
The goal of this project is to better understand the connections between risks electric
utilities face and insurance products that insurers offer to address them, and how these have
changed over time as the electric grid has changed. Our project, “Risk Management and
Insurability Strategies for Power Generation”, looks into issues with respect to insurance for
power utility companies.
Topics being researched include: current risks faced by power utility companies,
insurance products being offered to electric utilities, risks changing overtime, the evolution of
insurance products over time, and how large claims (e.g. after a major disaster) affect utilities
and insurance companies.
This interview is being conducted to obtain background information for our project. Your
answers will remain anonymous. No names or personally identifying information will appear in
any of our project reports or publications. If interested, we can send you a copy of our results at
the conclusion of the study.
1. What is the description of your current position at (department)?
2. Does your work pertain to the relationship between insurance companies and power
utility companies?
3. What do you believe are the key physical risks currently faced by electric utilities related
to power generation, including for various types of generation technology?
4. Do you know what insurance products insurers currently offer to address these risks?
5. Given that the electricity system in the United States is changing over time (e.g.,
increasing renewable generation such as solar and wind), how have risks faced by utilities

STUDENT INTERN PROJECT – PRE-DECISIONAL – NOT A STATEMENT OF ADMINISTRATION POLICY
78
changed over time? What new risks have emerged due to changes in generation
technologies?
6. How have insurance products offered by insurers evolved to address these risks? How
have premiums and claim amounts changed over time?
7. Are there any large disconnects you have noticed between the insurance and the utility
companies? Are there gaps between risks utilities face and insurance products offered?
8. Do you have any thoughts about how insurance could be designed and priced to
encourage a more resilient, reliable, affordable electricity system?
9. Are there quantitative or qualitative data sources that we could access on insurance
claims over time, insurance products, etc., that you would recommend?
10. Do know of any other people we could contact with information regarding the topics of
this interview? Do you have any contacts with insurance companies that provide products
for electric utility companies? Do you have any contacts with electric utility companies
that we could look into?

STUDENT INTERN PROJECT – PRE-DECISIONAL – NOT A STATEMENT OF ADMINISTRATION POLICY
79
Power Utility CCompany Interview Plan
Hello, we are undergraduate students studying at Worcester Polytechnic Institute, located
in Massachusetts, and are currently working with the Department of Energy for seven weeks to
complete a student project this fall. Thank you for agreeing to let us interview you for this
project.
The goal of this project is to better understand the connections between risks electric
utilities face and insurance products that insurers offer to address them, and how these have
changed over time as the electric grid has changed. Our project, “Risk Management and
Insurability Strategies for Power Generation”, looks into issues with respect to insurance for
power utility companies.
Topics being researched include: current risks faced by power utility companies,
insurance products being offered to electric utilities, risks changing overtime, the evolution of
insurance products, and how large claims affect an insurance company.
This interview is being conducted to obtain background information for our project. Your
answers will remain anonymous. No names or personally identifying information will appear in
any of our project reports or publications. If interested, we can send you a copy of our results at
the conclusion of the study.
1. What is the biggest risk your company faces?
2. What does your company do to prevent this?
3. What does your generation portfolio look like?
4. What types of power generation does your company consider to have the most risks?
5. Are your power utilities/ power plants insured?
6. What insurance company or types of insurance is used/ needed by your company specific
to power generation?
7. Have your insurance policies changed over the past 5 years?
8. Does your insurance vary:
a. By Region?
b. Over time, particularly as the electricity system changes?
c. By Different Environmental Laws?

STUDENT INTERN PROJECT – PRE-DECISIONAL – NOT A STATEMENT OF ADMINISTRATION POLICY
80
d. The Aftermath of Natural Disasters?
9. Does your company ever rely on state or federal funding?
10. When is government intervention/ federal funding involved?
a. In the event of a Natural Disaster
b. Building/ retiring a power plant
11. Are there any state/environmental regulations your company needs to abide by in terms
of power generation?
a. Clean Air Act, Clean Water Act, waste disposal
12. If self-insurance is used, how much is put aside for that fund each year?
a. How much of the fund is used each year?
13. In your opinion, what geographical areas are more vulnerable/ not protected by your
insurance provider?
14. What emerging risks do you see that your utility or others may need to address?
15. Can you supply any documents or databases to provide more research information or
possibly other contacts with expertise in this topic?
Insurer Company Interview Plan
Hello, we are undergraduate students studying at Worcester Polytechnic Institute, located
in Massachusetts, and are currently working with the Department of Energy for seven weeks to
complete a student project this fall. Thank you for agreeing to let us interview you for this
project.
The goal of this project is to better understand the connections between risks electric
utilities face and insurance products that insurers offer to address them, and how these have
changed over time as the electric grid has changed. Our project, “Risk Management and
Insurability Strategies for Power Generation”, looks into issues with respect to insurance for
power utility companies.
Topics being researched include: current risks faced by power utility companies,
insurance products being offered to electric utilities, risks changing overtime, the evolution of
insurance products, and how large claims affect an insurance company.

STUDENT INTERN PROJECT – PRE-DECISIONAL – NOT A STATEMENT OF ADMINISTRATION POLICY
81
This interview is being conducted to obtain background information for our project. Your
answers will remain anonymous. No names or personally identifying information will appear in
any of our project reports or publications. If interested, we can send you a copy of our results at
the conclusion of the study.
1. What is your role at the company?
2. What is your companies’ connection to electric utilities?
3. What kinds of insurance products for electric utility companies do you currently offer?
a. What kind of thinking has informed your choices as to what policies you do and
do not currently offer?
4. What do you the insurer see as the major risks with regards to electric power utility
companies?
a. Are these risks the same as they were ten years ago or have they changed
overtime?
5. Have your electric utility insurance policies been changing overtime or are they
consistent over the years?
a. If policies change, then why do these changes occur? How often are changes
made?
b. Are these changes ever made because of new energy technologies?
c. How do you go about changing insurance products based on previous claims
made?
Have you acquired new clientele because of emerging risks?
d. Have you lost any cliental because the risk in need of coverage was deemed too
large?
6. How do utility companies vary with respect to their claims?
a. Where are they located and what does their generation portfolio look like?
7. Has the United States Government ever had to intervene with funding regarding a utility
with which you have a policy? If so, then why? How often has this occurred?
a. What is your companies approach to reinsurance?

STUDENT INTERN PROJECT – PRE-DECISIONAL – NOT A STATEMENT OF ADMINISTRATION POLICY
82
8. With regards to the risk of cyberattacks, do you deem this to be insurable? Why or why
not?
a. If so, do you have or will you have policies tailored to cybersecurity?
b. Is there a risk you would never consider covering?
9. Are there data sources that we could access on insurance claims over time, insurance
products, etc., that you would recommend?
10. Are there other people in your company or elsewhere that you would recommend we
should talk to about our project?

STUDENT INTERN PROJECT – PRE-DECISIONAL – NOT A STATEMENT OF ADMINISTRATION POLICY
83
Appendix B: Threats of Natural Disasters on Power Generation Technologies
Disasters and Risks have been covered in Section 2.3 but the severity of all disasters on
the specific power generation utility has not been covered. The following charts were created to
condense the different hazard types to show which ones pose potential threats to nuclear power
plants, natural gas power plants, and wind turbines. The three power generation technologies
chosen based on their popularity in the United States as well as the amount of electricity
produced each year. Equal disasters can pose different levels of threats of damage to the
technologies. The charts were filled out based on the extensive research into different power
generating technologies and from the information gathered about past disasters. These charts can
be used to show threat frequencies, threat severity, damage likelihood, regions most likely
affected by the disaster, and additional notes about damages encountered to the different
technologies. These charts will be utilizing and provide the ability to include additional
information by adding more columns as needed. Some of the possibilities for further details
include specific data sources, amount of electricity cut from residents when damaged, elapsed
time to full functionality depending on the hazard, and average economic costs for damages by
each disaster.

STUDENT INTERN PROJECT – PRE-DECISIONAL – NOT A STATEMENT OF ADMINISTRATION POLICY
84
Figure 30: Potential Threats to Nuclear Power Generation
Figure 34 above highlights the hazards that are most likely to affect a nuclear power
plant. The major risks faced by these plants include hydrological and climatological risks.
Nuclear power plants are severely affected by water damages. In the event of a flood or storm
surge, nuclear power plants are designed to have emergency shut down procedures where the
plants are fully cut from producing electricity. The next biggest risk faced are droughts and fires.
These risks can be dangerous because nuclear power plants are designed to have cooling towers
which are needed to ensure the plant has constant cool water and does not overheat. This is a
vital component to nuclear power plants and with extreme temperatures, such as droughts, it puts
the nuclear power plants at high risk of fire, which will completely destroy the power generating
utility.

STUDENT INTERN PROJECT – PRE-DECISIONAL – NOT A STATEMENT OF ADMINISTRATION POLICY
85
Figure 31: Potential Threats to Natural Gas Power Generation
Figure 35 above highlights the hazards that are most likely to affect a natural gas power
plant. This power generating technology is very vulnerable to damages from natural disasters.
Hurricanes, floods, earthquakes, and drought all play a huge risk factor with natural gas power
plants. Specifically, hurricanes can cause damages that will destroy these power plants for
months and possibly forever. Natural gas power plants cannot withstand high winds, water-
related damages, and all effects brought by a hurricane. Natural gas may be an affordable/ clean
technology as a replacement for other non-renewable energy sources, but can cause major
economic losses in the event of a major natural disaster.

STUDENT INTERN PROJECT – PRE-DECISIONAL – NOT A STATEMENT OF ADMINISTRATION POLICY
86
Figure 32: Potential Threats to Wind Turbines
Figure 36 above highlights the hazards that are most likely to affect a wind turbine. The
major risks faced by these turbines include meteorological risks, geophysical risks and fires.
Wind turbines are renewable energy sources growing in demand. Although a popular energy
source, wind turbines are vulnerable to damages from hurricanes and earthquakes due to the
technology’s structure, foundation, and overall design. Another risk faced are fires, which can
destroy wind turbines and create economic losses up to millions of dollars. Although vulnerable
to damages from certain natural disasters, wind turbines perform well in other hazards such as
droughts due to the lack of cooling towers compared to nuclear and natural gas power plants.