risk-informed, performance-based industrial fire...
TRANSCRIPT

Risk-Informed, Performance-Based Industrial Fire ProtectionAn Alternative to Prescriptive Codes
by Thomas F. Barry, P.E.
Chapter 1Program Objectives
Chapter Contents
1.1 Introduction 1–1
1.2 Risk-Based Decision Making 1–6
1.3 Methodology and Steps 1–9
1.4 Project Management Issues 1–19
1.5 Risk Communication 1–25
1.6 References 1–27
© TFBarry Publications

Loss Scenario Development
Fire Protection System (FPS) Performance Success Probability
6
Exposure Profile Modeling 5
Initiating Event Likelihood 4
3
Risk Tolerance Criteria
2
Program Objectives 1
APPRAISAL ANALYSIS PERFORMANCE
Risk Estimation & Comparison With Risk Tolerance
7
Cost/Benefit Analysis of Risk Reduction Alternatives
8
ASSESSMENT
PROGRAM OBJECTIVES
1.1 INTRODUCTION
Risk-informed, performance-based fire protection is an integration of decision analysis andquantitative risk assessment with a defined approach for quantifying the performance success offire protection systems (FPS).
Risk-informed involves the use of quantitative risk assessment (QRA) evaluation tools andtechniques (e.g., event trees, fault trees) in conjunction with traditional fire protectionengineering methods and deterministic fire modeling tools. This quantitative informationprovides input for making informed decisions regarding fire and explosion risk impacts and cost-effective strategies for risk reduction.
Performance-based fire protection is a quantitative, probabilistic measure of fire protectionsuccess based on functional performance requirements derived from specific scenario and risktolerance criteria. Performance is evaluated within an event tree risk model on a conditionalprobability basis that is equated by three primary factors:
• Response effectiveness• Online availability• Operational reliability
The process of evaluating risk and performance under a variety of scenarios requires eightsteps, which form the basis for the chapters of this book (Fig. 1.1). This chapter addressesprogram objectives (Step 1 in the risk-informed, performance-based decision making process).The benefits of risk-based decision making are addressed in Sect. 1.2. Risk-informedmethodology and steps are summarized in Sect. 1.3. Sect. 1.4 discusses project managementissues and Sect. 1.5 discusses risk communications.
Risk-informed programs assist management decision makers by providing a structured,consistent method to quantify risk, evaluate risk reduction alternatives, and perform cost/benefitanalysis. As a starting point the decision makers must understand the concept of risk, risk-basedprogram motivation, risk methodology, and project management issues.
Fig. 1.1: Risk-Informed, Performance-Based Fire Protection Steps
1

PROGRAM OBJECTIVES 1–2
1.1.1 Risk Defined
In risk-based decision making, RISK is understood in terms of the likelihood andconsequences of incidents that could expose people, property, and the environment to theharmful effects of fire or explosion hazards. Likelihood is determined in terms of eitherfrequency (how often can this happen) or probability (what are the chances this will happen).
RISK = Likelihood of an Event (F) x Expected Consequences (C)
Fire and explosion risk analysis is very scenario (Sn) specific. The risk associated withmultiple initiating event scenarios is the sum of the scenarios:
RISK = 3Sn F x C
The concept of RISK is sometimes difficult to grasp at first as many people use hazard relatedterms and risk terms interchangeably without regard to the differences between definitions.Table 1.1 provides some basic definitions.
Table 1.1: Some DefinitionsTERM DEFINITION KEY WORDS
Hazard Hazard is a chemical or physical condition that has thepotential for causing damage to people, property, or theenvironment. An example would be flammable liquidsor explosive gases or dusts used in process or in storage
“Potential for harm”
Severity Severity is a qualitative or quantitative estimate of thehazard intensity in terms of source intensity, time, anddistance; for example heat flux, temperature, toxic orcorrosive smoke concentrations, explosion over-pressureversus distance
“Intensity versus time and distance”
Consequences Consequences are expected effects from the realizationof the hazard and severity, usually measured in terms ofproperty damage, business interruption, life safetyexposure, environmental impact, company image, etc.
“Expected damage effects”
Risk Risk is a quantitative measure of fire or explosionincident loss potential in terms of both the eventlikelihood and aggregate consequences
“Likelihood and consequences”
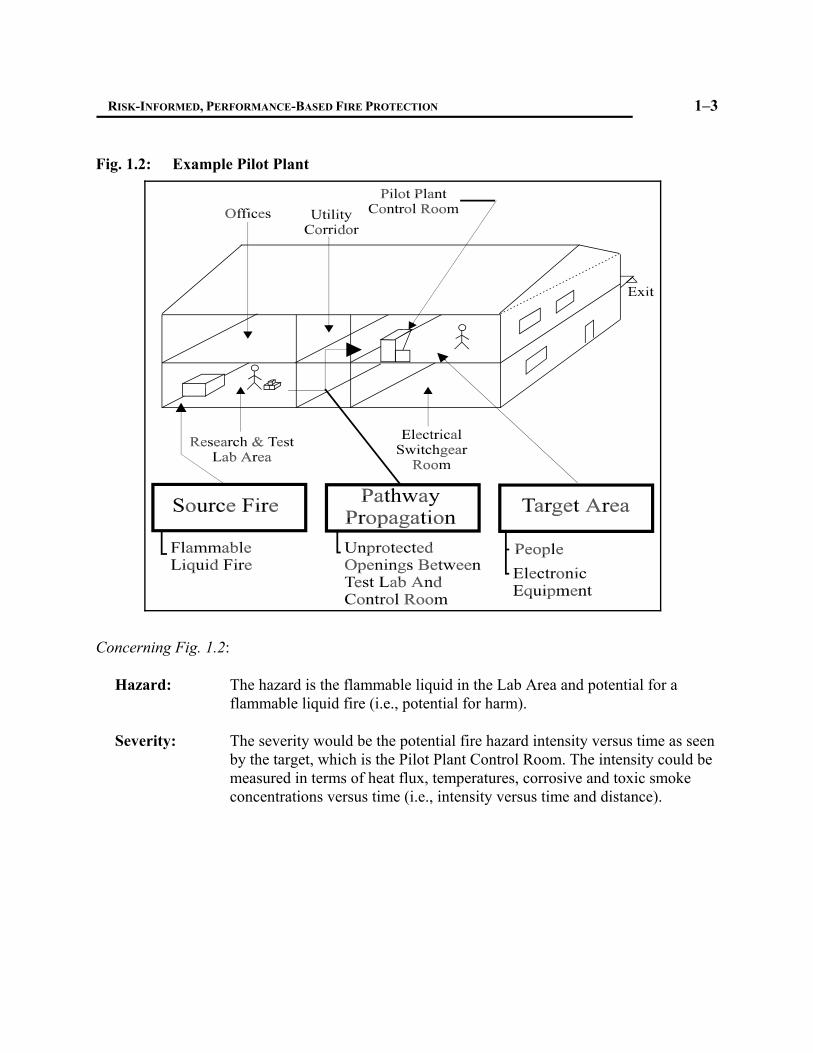
Figure 1.2 presents an example pilot plant building, which can be used to further illustrate thedifference between hazard and risk related terms.
RISK-INFORMED, PERFORMANCE-BASED FIRE PROTECTION 1–3
Fig. 1.2: Example Pilot Plant
Concerning Fig. 1.2:
Hazard: The hazard is the flammable liquid in the Lab Area and potential for aflammable liquid fire (i.e., potential for harm).
Severity: The severity would be the potential fire hazard intensity versus time as seenby the target, which is the Pilot Plant Control Room. The intensity could bemeasured in terms of heat flux, temperatures, corrosive and toxic smokeconcentrations versus time (i.e., intensity versus time and distance).
PROGRAM OBJECTIVES 1–4
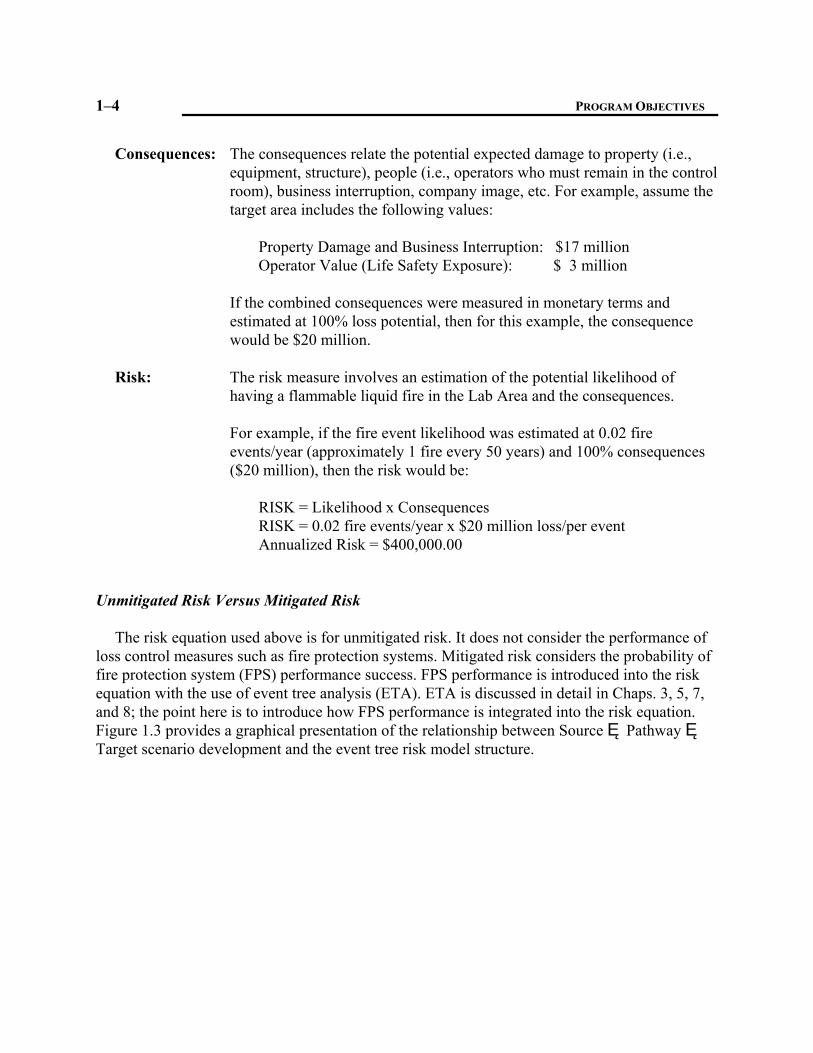
Consequences: The consequences relate the potential expected damage to property (i.e.,equipment, structure), people (i.e., operators who must remain in the controlroom), business interruption, company image, etc. For example, assume thetarget area includes the following values:
Property Damage and Business Interruption: $17 millionOperator Value (Life Safety Exposure): $ 3 million
If the combined consequences were measured in monetary terms andestimated at 100% loss potential, then for this example, the consequencewould be $20 million.
Risk: The risk measure involves an estimation of the potential likelihood ofhaving a flammable liquid fire in the Lab Area and the consequences.
For example, if the fire event likelihood was estimated at 0.02 fireevents/year (approximately 1 fire every 50 years) and 100% consequences($20 million), then the risk would be:
RISK = Likelihood x ConsequencesRISK = 0.02 fire events/year x $20 million loss/per eventAnnualized Risk = $400,000.00
Unmitigated Risk Versus Mitigated Risk
The risk equation used above is for unmitigated risk. It does not consider the performance ofloss control measures such as fire protection systems. Mitigated risk considers the probability offire protection system (FPS) performance success. FPS performance is introduced into the riskequation with the use of event tree analysis (ETA). ETA is discussed in detail in Chaps. 3, 5, 7,and 8; the point here is to introduce how FPS performance is integrated into the risk equation.Figure 1.3 provides a graphical presentation of the relationship between Source ÷ Pathway ÷Target scenario development and the event tree risk model structure.

RISK-INFORMED, PERFORMANCE-BASED FIRE PROTECTION 1–5
ConsequencesIncident
OutcomesFireSuppression
FireBarriersFire Detection
& EmergencyShutdown
SOURCE(S) PATHWAY (P) MODIFIERS
TARGET (T) VULNERABILITY
Exposure Profileat Target
Performance of FireProtection Systems
InitiatingFire EventOccurrence
=
AutomaticSuppressionSuccessful
InitiatingFire
Occurs
0.067
0.95YES
NO
0.80
0.20
0.30
0.05
Fires/Year
Time, minutes
BranchI.D.
BranchLine
ProbabilityConsequences
($)
1
2
3
4
0.0510.0095
0.0024
0.0027
$ 10,000.00
$ 50,000.00
$ 10,000,000.00
$ 20,000.00
0 1 - 3 3 - 10
Detectionand ESS
Successful
Plant FireBrigade
Successful
Fire BarriersSuccessful
0.80
0.20
$ 10,000.00
$ 20,000.00
$ 50,000.00
$ 20,000,000.00
0.0008
0.00047
0.00012
0.00008
5
6
7
8
0.70
0.25
0.75
0.75
0.25
0.60
0.40
10 - 20 20 - 60
(A) (B)
Risk Level($/Year)
(A x B)
$ 510.00
$ 190.00
$ 120.00
$ 8,000.00
$ 27.00
$ 9.40
$ 6.00
$ 1,600.00
$ 10,462.40Total AnnualizedRisk ($/Year)
FlammableLiquid FireIn Lab Area
Note: ESS = Emergency Shutdown System
Fig. 1.3: Relationship Among Source ÷ Pathway ÷ Target to Event Tree Analysis
Based on Fig. 1.3, the RISK equation for defined scenarios becomes:
RISK
InitiatingFire EventLikelihood
(F)
x
FPSPerformance SuccessProbability
(PFPS)
x Consequences(C)
Risk F xP x CSn FPS= ∑
Figure 1.4 provides an example of an event tree structure that could be used for evaluation ofthe Pilot Plant Building in Fig. 1.2.
Fig. 1.4: Example Event Tree Structure for Fig. 1.2
PROGRAM OBJECTIVES 1–6
The example event tree in Fig. 1.4 includes the performance success probability of thefollowing fire protection measures:
• Detection and emergency shutdown system (ESS) (i.e., shutdown of flammableliquid equipment)
• Automatic suppression (in the room of fire origin)• Plant fire brigade response• Fire barrier integrity between the lab and control room
The mitigated total annualized risk for this example is a little over $10,000, which is asignificant difference to the previous unmitigated annualized risk estimate of $400,000.
The intent of this discussion was to provide a brief introduction to some concepts anddefinitions with a focus on the differences between the terms hazard, consequences, unmitigatedrisk, and mitigated risk estimates. These concepts are explained in detail throughout this book.The concept of Source ÷ Pathway ÷ Target scenario development and event tree structuring isdiscussed in more detail in Chap. 3. The development of event likelihood estimates, consequencelevels, and FPS performance success probabilities are addressed in Chaps. 4, 5, and 6. Riskestimation and presentation are described in Chap. 7, and cost/benefit analysis of risk reductionalternatives is described in Chap. 8.
1.2 RISK-BASED DECISION MAKING
Risk-based programs can assist decision makers by providing a structured, consistent methodto quantify risk and risk reduction alternatives. Quantitative risk-based approaches provide manyadvantages. The following quote is extracted from reference [1] (underline added for emphasis).
“Quantitative risk analysis uses measured or estimated probabilities andconsequences. Although we concede that moving from qualitative to quantitativerisk analysis multiplies the cost, it exponentially increases the benefit. In additionto the benefits that risk-based methods provide at the qualitative level,quantitative methods calculate expected values for probability and consequence.If the consequence is measured in monetary terms, then the analyst can calculatea probable net present value (NPV) difference between existing conditions andfor any proposed change. In all calculations the analyst will naturally developexpected values and “spread” for all of the important parameters. In otherwords, fully quantitative risk-based methods bridge the gap between engineeringand finance. This is because expected value, defined by probability timesconsequence, is a term that is already used in the financial community.”
Decision making factors or decision characteristics that promote the use of a formal,structured, risk-based approach include the following:
• Decisions involve significant financial impacts.• Decision maker has many alternatives, both technical and financial, from which to
choose.
RISK-INFORMED, PERFORMANCE-BASED FIRE PROTECTION 1–7
DECISIONMAKING
TEAM
DECISIONS
Risk-Based Decision MakingFramework
ACTIONS
RISK TOLERANCECRITERIA
RISK FINANCINGOPTIONS
QUANTITATIVEINPUT
FIRE & EXPLOSION RISK ASSESSMENT
RISK REDUCTION
ALTERNATIVES
ACTION
PLAN
Action Plan Performance Feedback
• Decisions affect other company wide or corporate wide facilities and operations.• Decisions involve uncertain consequences with multiple dimensions of value.
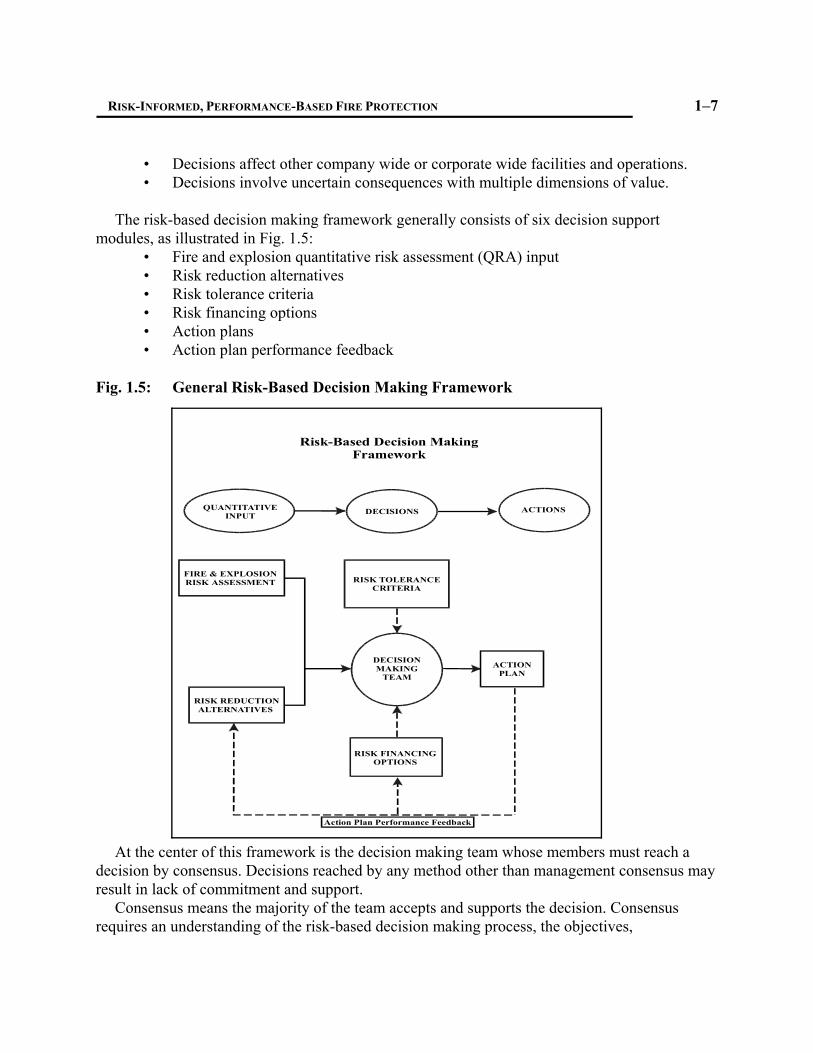
The risk-based decision making framework generally consists of six decision supportmodules, as illustrated in Fig. 1.5:
• Fire and explosion quantitative risk assessment (QRA) input• Risk reduction alternatives• Risk tolerance criteria• Risk financing options• Action plans• Action plan performance feedback
Fig. 1.5: General Risk-Based Decision Making Framework
At the center of this framework is the decision making team whose members must reach adecision by consensus. Decisions reached by any method other than management consensus mayresult in lack of commitment and support.
Consensus means the majority of the team accepts and supports the decision. Consensusrequires an understanding of the risk-based decision making process, the objectives,

PROGRAM OBJECTIVES 1–8
methodology, uncertainties, and all possible alternatives. Once understanding is gained, the teamcan proceed with the process of arriving at decision consensus.
General benefits of risk-informed, performance-based decision making as applied to fire andexplosion exposure include:
• Ability to support the cost-effective solution of complex fire and explosion problems• Ability to evaluate several different risk reduction strategies objectively• Greatly facilitated communication among managers• Increased management control over risk reduction strategies and expenditures• More consistent and objective decisions than those made intuitively and subjectively• Ability to assist in establishing the optimum balance between fire prevention,
protection, and emergency response based on cost/benefit analysis
Risk-based analysis and decision making is widely used by many agencies of the U.S.government, the chemical process industry, the telecommunications industry, the aviationindustry, the nuclear industry, and others. The application of fire and explosion risk andperformance-based decision analysis will certainly continue to gain widespread acceptance in thefuture as an alternative to prescriptive building and fire codes.
RISK-INFORMED, PERFORMANCE-BASED FIRE PROTECTION 1–9
Formulate theProblem
Interpret the Results
Construct theModel Logic
Quantify theModel Elements
Analyze theOptions
Select theBest Solution
Monitor Actions
Risk Appraisal
Risk Analysis
Risk Assessment
Risk Monitoring
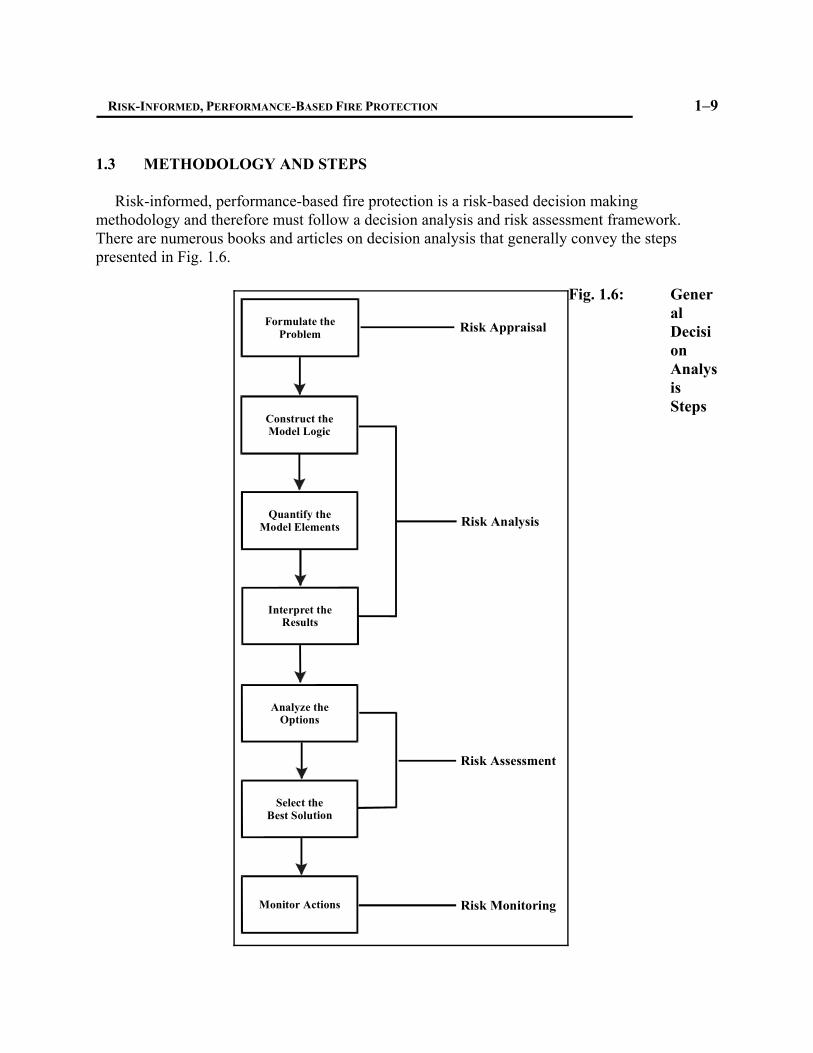
1.3 METHODOLOGY AND STEPS
Risk-informed, performance-based fire protection is a risk-based decision makingmethodology and therefore must follow a decision analysis and risk assessment framework.There are numerous books and articles on decision analysis that generally convey the stepspresented in Fig. 1.6.
Fig. 1.6: GeneralDecisionAnalysisSteps

PROGRAM OBJECTIVES 1–10
Risk-informed, performance-based decision analysis involves decomposition of the elementsof fire and explosion risk and FPS performance to allow detailed study of those elements. Thisapproach forces the risk assessment team to break down the problem in a structured, consistent“step-approach” manner.
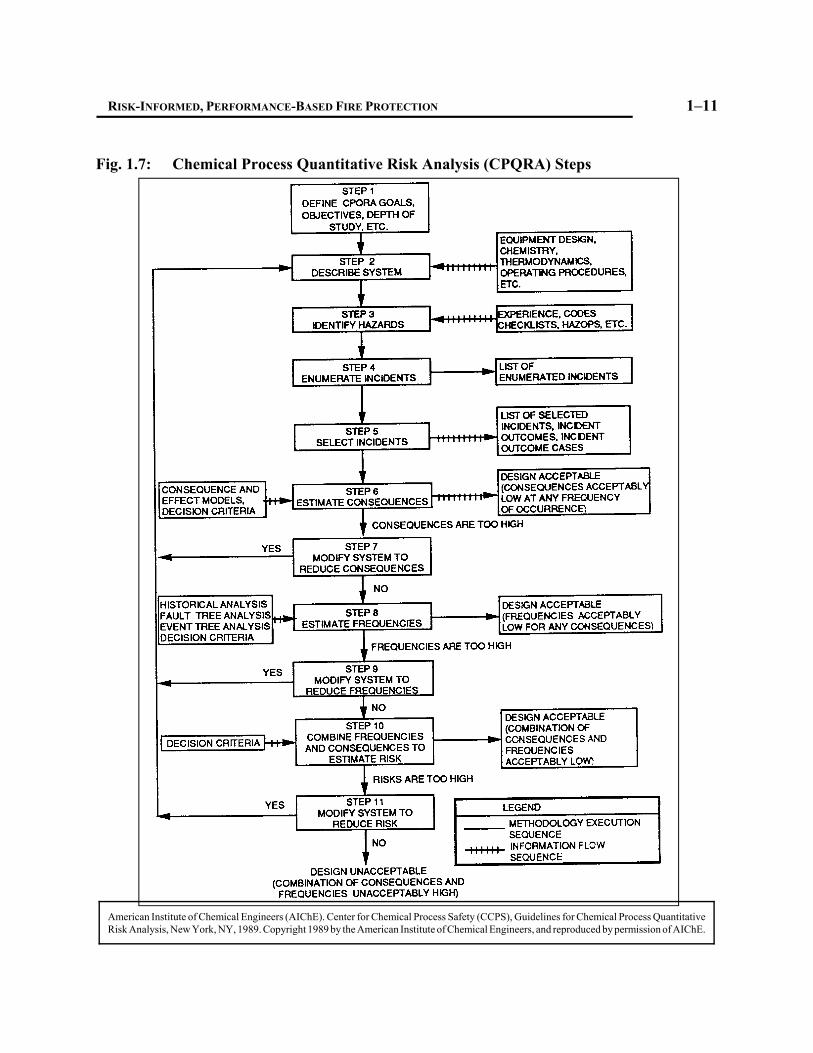
The steps described in this book are patterned after the QRA steps developed by the Centerfor Chemical Process Safety (CCPS), American Institute of Chemical Engineers (AIChE), anddescribed in their book, Guidelines for Chemical Process Quantitative Risk Analysis.2 Thisapproach has been accepted and adopted by U.S. chemical, oil, and gas industries performingQRA projects and is now being used in numerous other applications. These steps are presentedin Fig. 1.7 and consist of the following:
• Formulation: Define goals, establish scope, describe system and assemblebackground information.
• Hazard Identification: Identify hazards and potential incidents and select those to beconsidered in the study.
• Consequence Estimation: Estimate consequences of incidents considered in thestudy, including both the physical effects and the impact of those physical effects onpeople, property, and environment.
• Likelihood Estimation: Estimate the likelihood of the incidents considered in thestudy.
• Risk Estimation: Combine the estimates of consequences and likelihood intoappropriate measures of risk.
• Risk Modification: If the risks are too high, modify the system to reduce the risk
Risk-informed, performance-based fire protection is an integration of decision analysis andQRA with a defined step for quantifying FPS performance success. The steps in Fig. 1.6(Decision Analysis) and Fig. 1.7 (Chemical Process Quantitative Risk Analysis) can be groupedunder the following headings:
• Risk Appraisal• Risk Analysis• Risk Assessment
This grouping, along with the addition of FPS performance, forms the framework for the risk-informed, performance-based fire protection steps as described in this book.
RISK-INFORMED, PERFORMANCE-BASED FIRE PROTECTION 1–11
American Institute of Chemical Engineers (AIChE). Center for Chemical Process Safety (CCPS), Guidelines for Chemical Process QuantitativeRisk Analysis, New York, NY, 1989. Copyright 1989 by the American Institute of Chemical Engineers, and reproduced by permission of AIChE.
Fig. 1.7: Chemical Process Quantitative Risk Analysis (CPQRA) Steps
PROGRAM OBJECTIVES 1–12
APPRAISAL ANALYSIS PERFORMANCE ASSESSMENT
ProgramObjectives1
RiskToleranceCriteria
2
Loss ScenarioDevelopment
3
Initiating EventLikelihood
4
Exposure ProfileModeling
5
Fire ProtectionSystems PerformanceSuccess Probability
6
Risk Estimation& ComparisonWith Risk Tolerance
7
Cost/BenefitAnalysis of RiskReduction Alternatives
8
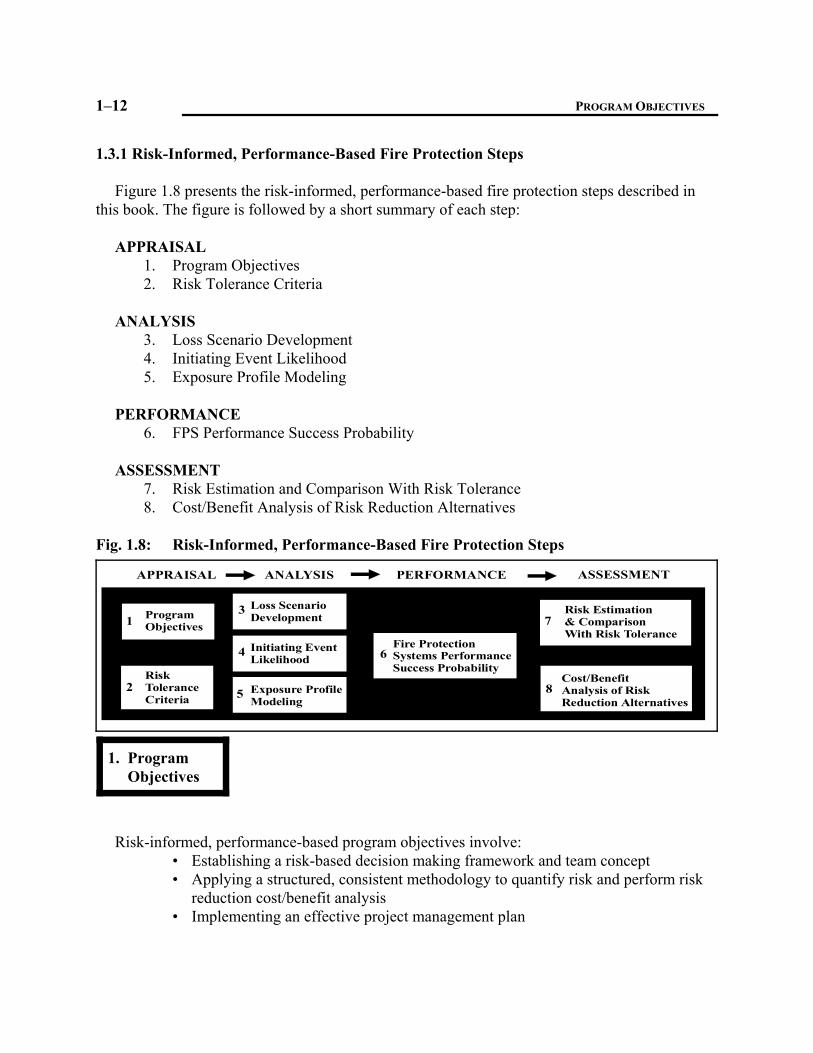
1.3.1 Risk-Informed, Performance-Based Fire Protection Steps
Figure 1.8 presents the risk-informed, performance-based fire protection steps described inthis book. The figure is followed by a short summary of each step:
APPRAISAL1. Program Objectives2. Risk Tolerance Criteria
ANALYSIS3. Loss Scenario Development4. Initiating Event Likelihood5. Exposure Profile Modeling
PERFORMANCE6. FPS Performance Success Probability
ASSESSMENT7. Risk Estimation and Comparison With Risk Tolerance8. Cost/Benefit Analysis of Risk Reduction Alternatives
Fig. 1.8: Risk-Informed, Performance-Based Fire Protection Steps
Risk-informed, performance-based program objectives involve:• Establishing a risk-based decision making framework and team concept• Applying a structured, consistent methodology to quantify risk and perform risk
reduction cost/benefit analysis• Implementing an effective project management plan
1. Program Objectives
RISK-INFORMED, PERFORMANCE-BASED FIRE PROTECTION 1–13
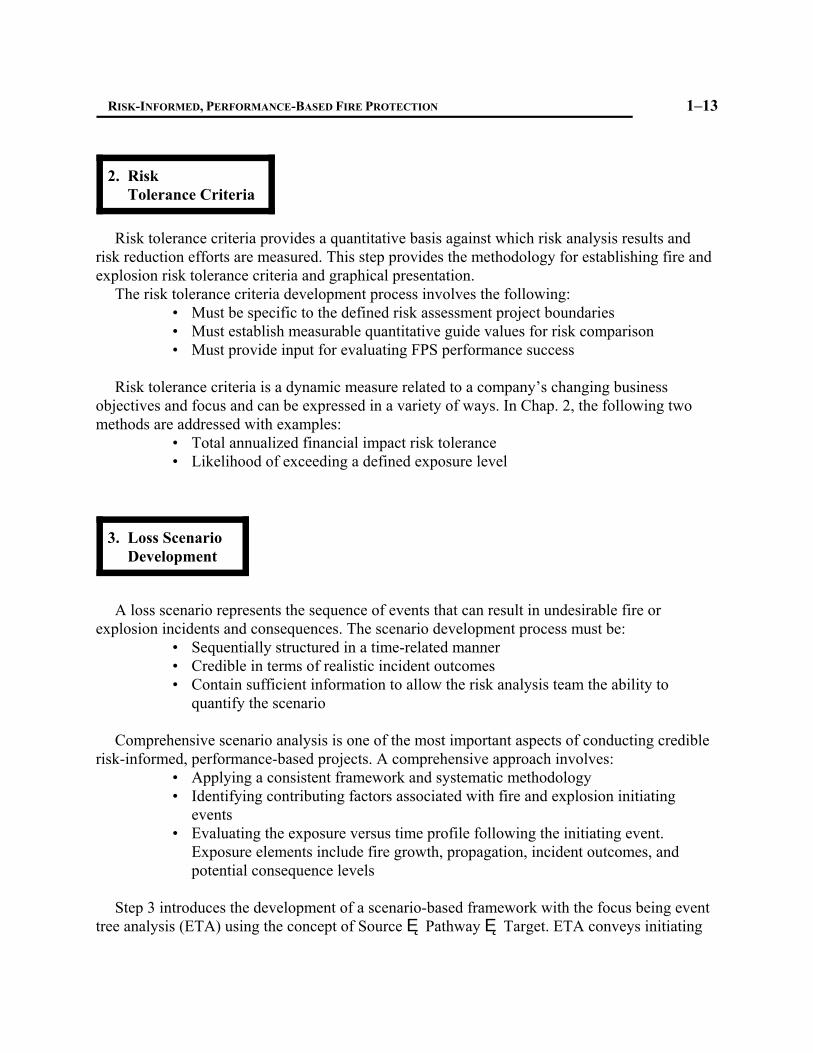
Risk tolerance criteria provides a quantitative basis against which risk analysis results andrisk reduction efforts are measured. This step provides the methodology for establishing fire andexplosion risk tolerance criteria and graphical presentation.
The risk tolerance criteria development process involves the following:• Must be specific to the defined risk assessment project boundaries• Must establish measurable quantitative guide values for risk comparison• Must provide input for evaluating FPS performance success
Risk tolerance criteria is a dynamic measure related to a company’s changing businessobjectives and focus and can be expressed in a variety of ways. In Chap. 2, the following twomethods are addressed with examples:
• Total annualized financial impact risk tolerance• Likelihood of exceeding a defined exposure level
A loss scenario represents the sequence of events that can result in undesirable fire orexplosion incidents and consequences. The scenario development process must be:
• Sequentially structured in a time-related manner• Credible in terms of realistic incident outcomes• Contain sufficient information to allow the risk analysis team the ability to
quantify the scenario
Comprehensive scenario analysis is one of the most important aspects of conducting crediblerisk-informed, performance-based projects. A comprehensive approach involves:
• Applying a consistent framework and systematic methodology• Identifying contributing factors associated with fire and explosion initiating
events• Evaluating the exposure versus time profile following the initiating event.
Exposure elements include fire growth, propagation, incident outcomes, andpotential consequence levels
Step 3 introduces the development of a scenario-based framework with the focus being eventtree analysis (ETA) using the concept of Source ÷ Pathway ÷ Target. ETA conveys initiating
2. Risk Tolerance Criteria
3. Loss Scenario Development
PROGRAM OBJECTIVES 1–14
events, FPS performance, incident outcomes, and consequences. Chapter 3 provides examples ofscenario development and event tree structuring.
The term “likelihood” is defined as a measure of the expected frequency or probability of adefined initiating fire or explosion event. The modeling methods in Step 4 used to quantify theinitiating event likelihoods include the use of:
• Historical data where there is experience from past fire loss incidents (i.e., plantspecific data) or from similar systems (i.e., industry specific or generic databases)
• Modeling techniques such as fault tree analysis (FTA), which is used to estimatethe likelihood of events where historical data is limited or is inadequate toaccurately estimate the likelihood of the fire events of concern
• Engineering judgment that quantifies an expert’s state of knowledge orperceptions of the likelihood of potential fire or explosion incidents. Thisknowledge may be based on historical data, insights gained from previous hazardor risk analysis projects, experience, plant specific information, or a combinationof these factors
FTA provides a structured method to quantify initiating fire occurrence events. The benefit ofFTA is that it provides a decomposition of the top initiating event into factors that contribute tofailure and ignition potentials. The frequencies and probabilities used in the FTA can include acombination of equipment and human failure rate data, plant specific data, probabilitiessupported by deterministic modeling, and subjective, expert opinion probabilities.
Failure data sources, examples, methods for modifying data using performance integritymeasures (PIMs) are described in Chap. 4. An entire section is devoted to ignition probabilitymodeling.
An exposure profile is a scenario-specific, graphical representation of what the risk target issubject to in terms of source intensity (e.g., heat, temperature, smoke, toxic, or corrosive gasconcentrations, explosion overpressures, etc.) versus time. The modeling approach in Step 5involves the following:
4. Initiating Event Likelihood
5. Exposure Profile Modeling
RISK-INFORMED, PERFORMANCE-BASED FIRE PROTECTION 1–15
• Determine the risk target value and vulnerability. Vulnerability is defined in termsof threshold damage limits (TDLs). TDLs are potential failure limits of the targetsubsystems (e.g., equipment, operators, structure) when exposed to fire orexplosion impacts.
• Characterize the source fire heat release rate (HRR). Developing and quantifyingthe initiating source HRR in a credible manner is a key consideration in the initialdevelopment of the exposure profile. The HRR is used to estimate flame height,radiant heat flux, and fire plume size and intensity, all of which affect theexposure at the target.
• Model the event tree scenario fire or explosion incident outcome. Pool fires, torchfires, unconfined spill fires, flash fires, boiling liquid expanding vapor explosion(BLEVE) fireballs, solid materials, and storage configurations can be modeled toevaluate radiant heat flux, temperatures, and smoke concentration intensities atthe target. Unconfined vapor cloud explosions and confined explosions can bemodeled to evaluate potential explosion overpressures at the target.
• Develop FPS response parameters. Based on the exposure profile, response timesfor detection systems, emergency shutdown systems (ESSs), and automatic andmanual suppression systems can be established and shown in the event tree timeline. These response times are then used in the FPS performance successprobability evaluation.
Threshold damage data, graphical exposure profile and event tree time line examples, and fireand explosion computer modeling are discussed in Chap. 5.
FPS performance represents one of the dominant factors in the estimation of potential risklevels. Step 6 includes methods to quantify the conditional probability of performance successfor a defined event scenario and established risk tolerance criteria. FPS of primary interest in firerisk-based evaluations include the following:
• Detection systems• Emergency control systems• Automatic suppression systems• Propagation limiting measures (i.e., fire barriers)• Manual loss control intervention
6. Fire Protection System (FPS) Performance Success Probability
PROGRAM OBJECTIVES 1–16
The methodology in Step 6, which centers around success tree analysis (STA) logic, can beused throughout the life cycle of fire protection systems to evaluate and quantify performancesuccess. This approach can be applied to:
• Evaluation of Existing SystemsThis quantifies expected performance success of existing FPS when subjected tospecific scenarios and risk tolerance criteria.
• Evaluation of New System Designs or ModificationsThis quantifies expected performance success of design options or alternatives tomeet scenario-based “Performance Design Targets.” For example, if the targetedperformance success probability for a specific scenario is 0.99 (i.e., 99 out of 100times it will be successful against this scenario), then design alternatives areevaluated in terms of response effectiveness, projected on-line availability, andestimated operational reliability to meet this performance target.
Step 6 involves the quantification of performance using three probabilistic measures:• Response effectiveness• On-line availability• Operational reliability
Performance quantification methods and examples, failure rate data sources, datamodification via the use of performance integrity measures, and integration of engineeringjudgement are discussed in Chap. 6.
Risk estimation and comparison provides the methodology for:• Estimating consequence levels associated with defined event tree loss scenarios in
terms of an equivalent monetary value and annualized risk basis• Comparing the estimated risk to risk tolerance criteria to determine if risk
reduction analysis is needed
Step 7 describes the risk estimation calculation steps using the ETA modeling framework. Aspart of the estimation process, the exposure levels developed in Step 5, Exposure ProfileModeling, are converted to equivalent monetary units. This provides a single measure ofconsequences, which allows risk to be calculated in terms of dollars at risk per year from fire orexplosion potentials. Using an equivalent monetary measure of risk allows cost/benefit analysisto be performed on risk reduction alternatives when the decision makers’ risk tolerance criteriaare exceeded. Examples of graphical profiles of risk comparison are presented in Chap. 7, along
7. Risk Estimation & Comparison With Risk Tolerance
RISK-INFORMED, PERFORMANCE-BASED FIRE PROTECTION 1–17
with an overview and short examples of computer-assisted simulation to quantify riskuncertainty.
Uncertainty must be accounted for in the communication of risk estimation to the decisionmakers. Uncertainty assessment is a measure, qualitative or quantitative, of the degree of doubtor lack of certainty associated with risk estimating inputs, variables, probability values,deterministic models, and equivalent monetary values.
A quantitative uncertainty analysis can be performed within a computer spreadsheet programsuch as Microsoft Excel using what-if analysis or Monte Carlo simulations. An example of usingMonte Carlo simulation is provided in Chap. 7.
The term “risk reduction” is defined as the application of technological or administrativemeasures to reduce fire or explosion risk to a tolerable level. Reduced fire risks mean fewer firelosses and claims, a more efficient operation, better employee morale, higher profits, betterpublic relations, and greater investor confidence. However, these are not obtained without cost.Decision makers must recognize and quantify the risks and assess cost-effective approaches forreducing them. This is done by conducting cost/benefit analyses for risk reduction strategies andalternatives.
Risk reduction options in Step 8 include• event likelihood reduction,• fire protection system improvement, and• consequence reduction.
The cost/benefit analysis process described in Chap. 8 consists of• quantification of risk reduction alternatives,• cost analysis for selected strategies,• ranking of strategies by risk reduction/cost ratios, and• decision analysis.
Chapter 8 provides an example of screening and quantifying risk reduction for alternative fireprotection design strategies using a computer spreadsheet model.
8. Cost/Benefit Analysis of Risk Reduction Alternatives
PROGRAM OBJECTIVES 1–18
Define Project Scope
Identify Goals
Define Objectives
Develop Performance Criteria
SFPE P -BF P A
ERFORMANCE ASEDIRE ROTECTION PPROACH
Develop Fire Scenarios
Develop Candidate Designs
Evaluate Candidate Designs
Select Final Design
Prepare Design Documentation
Define Program Objectives
Define Risk Tolerance Levels
Develop Loss Scenarios
Evaluate Likelihood
Evaluate Exposures
Evaluate Performance
Risk Estimation & Comparison
Cost-Benefit Analysis
R -I , P -BF P M
ISK NFORMED ERFORMANCE ASEDIRE ROTECTION ETHODNot Presently Developed in SFPE
Performance-Based Approach
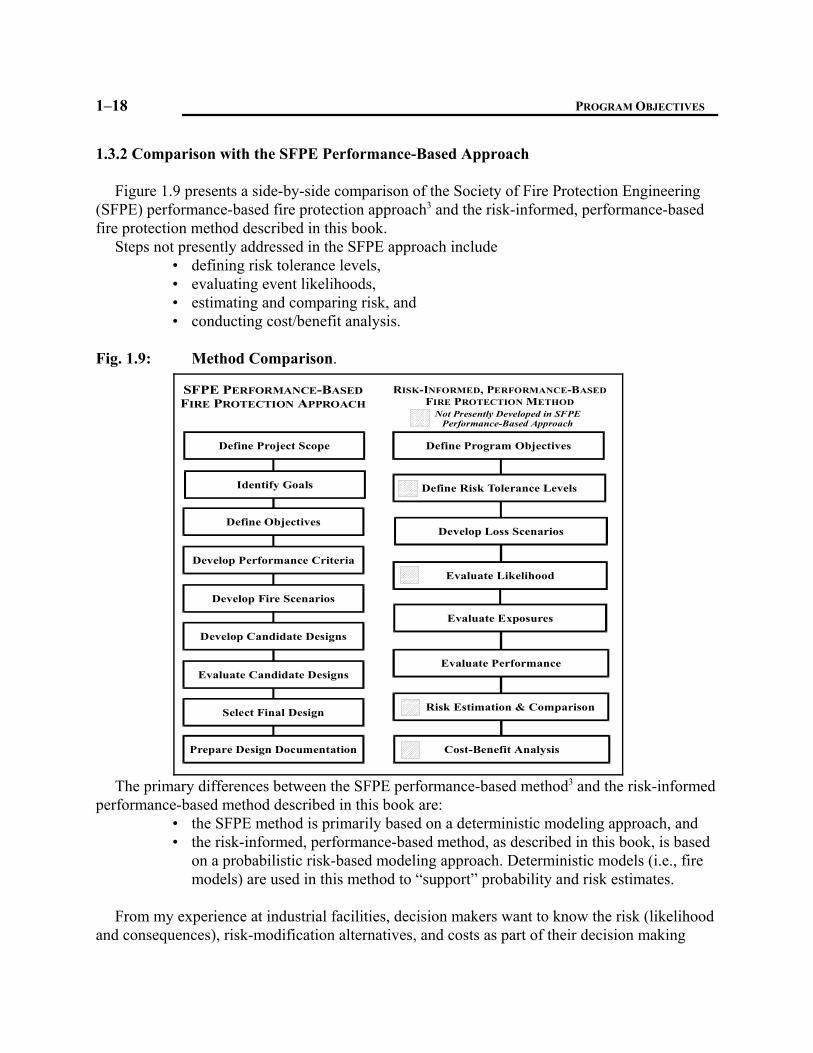
1.3.2 Comparison with the SFPE Performance-Based Approach
Figure 1.9 presents a side-by-side comparison of the Society of Fire Protection Engineering(SFPE) performance-based fire protection approach3 and the risk-informed, performance-basedfire protection method described in this book.
Steps not presently addressed in the SFPE approach include• defining risk tolerance levels,• evaluating event likelihoods,• estimating and comparing risk, and• conducting cost/benefit analysis.
Fig. 1.9: Method Comparison.
The primary differences between the SFPE performance-based method3 and the risk-informedperformance-based method described in this book are:
• the SFPE method is primarily based on a deterministic modeling approach, and• the risk-informed, performance-based method, as described in this book, is based
on a probabilistic risk-based modeling approach. Deterministic models (i.e., firemodels) are used in this method to “support” probability and risk estimates.
From my experience at industrial facilities, decision makers want to know the risk (likelihoodand consequences), risk-modification alternatives, and costs as part of their decision making

RISK-INFORMED, PERFORMANCE-BASED FIRE PROTECTION 1–19
process, thus the term “risk-informed.” FPS performance has numerous probabilistic variablesand therefore should be evaluated as a “conditional probability” following defined functionalrequirements based on the specific scenario and quantitative risk tolerance criteria.
The following was extracted from the Journal of Fire Protection Engineers4, an SFPEpublication (underlining added for emphasis).
Although the use of deterministic calculations provides a picture of what theconditions in a room may be at a given time, or what the performance ofindividual structural components is, it has limited ability in considering the entirebuilding with its fire protection systems, functions and occupants as a system.This limitation is significant as it does not allow the quantification of the overallsafety level in a building. A comparison of alternative designs is limited only tospecific elements. To obtain an overall assessment of building, deterministiccomputations must be combined with probabilistic analysis.
In contrast to deterministic calculations, probabilistic methods may be ableto consider the whole building (not element by element evaluation) and to providerisk estimates. In probabilistic evaluations, there are many factors that couldaffect the occurrence of a fire, its development and the egress of the occupants.The objective is to estimate risk levels using the likelihood of a fire incidentoccurring and its potential consequences (injury, death, etc.). The risk criteriacan be established through statistical data, however, in order to gain society’sacceptance, such an approach must become widely used. The risk levels,calculated using probabilistic risk assessment methods, are then compared to therisk criteria to determine whether the proposed designs are acceptable. Presently,the probabilistic approach is rarely used because of the lack of appropriate riskassessment tools and the unavailability of specific risk levels acceptable tosociety. However, with the introduction of performance-based codes, theavailability of risk assessment models and the establishment of risk levelsacceptable to society, the probabilistic approach will be the preferred method inperformance-based design as it quantifies the risk levels and allows theidentification of designs that will have acceptable risk levels at minimum cost.
1.4 PROJECT MANAGEMENT ISSUES
Implementation of an effective risk-informed, performance-based fire protection programrequires good project management. Development and delivery of information in a timely andcost-effective manner requires
• project definition,• project team selection,• resource allocation, and• risk communication.

PROGRAM OBJECTIVES 1–20
1.4.1 Project Definition
Table 1.2 provides a general worksheet for defining risk-informed project parameters. Ifdocumented project definition is not provided at the start, the risk quantification process canbecome resource intensive.
1.4.2 Project Team Selection
The risk estimation process must include a team consensus approach. Team members shouldinclude representatives from the plant knowledgeable in the specific facility hazards, operations,and maintenance practices; representatives from environmental, safety, fire protection; and riskmanagement and financial personnel.
Capabilities of the plant consensus team should include the features listed below.• Knowledge of the facility, operations, equipment, and safety features under
– normal operations and– abnormal emergency conditions;
• Experience with– plant loss incident history,– contributing factors to loss incidents, and– modifications and changes made following losses;
• Understanding of fault tree analysis (FTA) and event tree analysis (ETA) modelsincluding– a team leader with expertise in FTA and ETA and– team members with a rudimentary understanding of FTA and ETA concepts.

RISK-INFORMED, PERFORMANCE-BASED FIRE PROTECTION 1–21
Table 1.2: Example Project Definition WorksheetISSUES ANSWERS
1 What is the decision to be made?(Risk study goals)
2. What is the focus of the assessment?(Risk study objectives)
3. What are the system boundaries?(Scope of work, what’s included, what’s not)
4. What are the values exposed within the definedboundaries?(People, property, production)
5. What is the risk tolerance criteria?(Refer to Chap. 2 in this book)
6. What is the level of detail?
7. What are the manpower resources required?(Project team, plant site assistance)
8. What consequence modeling tools will beneeded?
9. What sources of failure rate and reliability dataare available?
10. What other hardware, software, or other costsare needed to complete the project?
11. What are the budget constraints?
12. How will the “results” of the risk assessment bepresented to management?
13. What will be the procedures for interactivetechnical quality reviews and documentation?
14. What are the schedule and delivery dates?
REMARKS:
PROGRAM OBJECTIVES 1–22
1.4.3 Resource Allocation
Resource allocation considerations should include:1. Level of decision detail
• decision complexity• decision importance• physical boundaries of study• accidents of interest (or excluded accidents)• methods for risk estimation and comparison
2. Expenditures• human resources• assessment tools
i) computer modelsii) researchiii) testing
3. Constraints• time• budget
Figure 1.10 provides a general illustration of risk assessment resource investment levels. Asdepicted on Fig. 1.10, three general levels of detail are indicated:
• Risk ranking • First-order risk assessment, and • Second-order risk assessment

RISK-INFORMED, PERFORMANCE-BASED FIRE PROTECTION 1–23
DetailNeeded
GeneralResource
Investment
Fire & Explosion Risk ComplexityLow HighModerate
ModerateModerate
Low Low
HighHighSecond-Order Risk Assessment
First-Order Risk Assessment
Risk Ranking
Fig. 1.10: General Illustration of Risk-Based Project Resource Investment
Risk ranking, which is the relative semiquantitative categorization of fire and explosion risksto identify, screen, and focus further efforts is addressed in Chap. 3, Loss Scenario Development.
First-order risk assessment is a term unique to this book. First-order assessments relate tostructuring bounding scenarios and event trees that quantify significant risk contributors. Thisterm will become clearer from the approaches described in this book. First-order assessmentslimit the detail to that needed to produce results within the project objectives and resourceallocation constraints.
A second-order assessment involves additional detail. For example, it may entail applicationof finite-element heat transfer analysis to estimate a more accurate time of structure failure orvery complex fault tree analysis of initiating failure events. If this level of detail is needed, thenthe additional time, modeling tools, and expenses must be weighed against the benefit ofcompiling this additional level of detail.
The application of a formalized, risk-based assessment is beneficial if the total risk reductionbenefit of the effort exceeds the total costs. The costs include the time, resources, and costs
PROGRAM OBJECTIVES 1–24
associated with conducting the risk assessment project plus the cost related to theimplementation of the risk reduction measures.
For example, if the cost to do the risk-based assessment (i.e., project cost) is $50,000 and thecost to implement risk reduction measures is $100,000, the total cost is $150,000. If the riskreduction benefit obtained is estimated at $75,000, then the benefit/cost ratio is $75,000/$150,000 = 0.5. If the benefit/cost ratio is less than 1, then the risk assessment effort may not beconsidered beneficial. This is an important consideration that should be examined in Step 1.
An example of a successful, risk-informed, performance-based project follows. Plantmanagement was being forced to take action on a recommendation to reinforce a sprinklersystem (i.e., provide a higher sprinkler system design density) in a high-valued facilitycontaining numerous hydraulically operated machines. The recommendation purpose was toimprove protection against a hydraulic oil fire. Because the existing sprinkler protection washydraulically designed at a lower sprinkler design density based on the available water supply,the completion of this recommendation would require replacing most of the existing sprinklersystem and water supply improvements at a cost exceeding $150,000. In addition, the companyhad five other facilities that would require similar updating.
Plant management decided to conduct a fire risk assessment study to evaluate other possiblerisk reduction alternatives. The risk assessment followed the steps described in this book. Thealternatives that resulted from the assessment focused on methods to prevent and reduce theseverity of a hydraulic-oil torch fire situation. Alternatives included improved oil pressureinstrumentation and equipment shutdown interlocks, barriers positioned to deflect pressurized oilreleases, higher pressure flexible hydraulic hoses, and oil drain-down lines to a holdingreservoir. By minimizing the torch-fire probability and consequential exposure radius andduration and by providing risk reduction measures that would modify an oil release from a torchto a limited pool fire configuration, the existing sprinkler system would be adequate incontrolling the fire and minimizing damage.
The cost of the risk assessment study, which used first-order event trees and fault trees, was$28,000. The cost to make the improvements was approximately $60,000. The total cost wastherefore $88,000 versus the $150,000 to reinforce the existing sprinkler system. For fivefacilities the overall cost savings were approximately $366,000. In addition, the alternativeimprovements afforded a much higher risk reduction to the operations and employees working inthese facilities.

RISK-INFORMED, PERFORMANCE-BASED FIRE PROTECTION 1–25
1.5 RISK COMMUNICATION
The results of the risk-informed performance-based project must be presented in a formatunderstandable to the decision makers responsible for making the decisions and implementingthe action plan. Table 1.3 lists some primary risk communication needs.
Table 1.3: Some Primary Decision Concerns Versus Risk CommunicationDECISION CONCERNS RISK COMMUNICATION
How serious are the fire and explosion exposures (on-site, off-site)?
Graphical fire and explosion risk profiles. Comparisonwith risk tolerance criteria
How beneficial are the proposed loss controlrecommendations?
Estimated change in risk for each proposed loss-controlalternative or strategy
What regulatory implications (OSHA, EPA, buildingcodes, etc.) are involved?
Regulatory compliance issues
How expensive are the proposed loss controlrecommendations?
Estimated initial and annual costs associated with riskreduction alternatives
Do the recommended changes represent an exceptionto existing corporate policies or safety standards? Willother similar plants, facilities, or operations beaffected?
Identification of any potential conflicts with presentpolicies or procedures. Potential total cost to thecorporation for upgrading similar facilities
Graphical risk profiles, described in Chap. 7, Risk Estimation and Comparison, provide agood visual presentation format for communicating the following information to the decisionmakers:
• existing risk levels,• modified risk levels based on proposed risk reduction alternatives,• comparison of risk with management’s established risk tolerance limits, and• areas where further risk quantification may be needed.
An important point here is that the risk communication format must have the ability to“compare” existing and modified risk levels with established risk tolerance levels.
Some key project issues that should be addressed in Step 1 are listed here.• The type of risk profile presentation format that will be used to aid management
decision making• Establishing management’s risk tolerance limits for risk comparisons• Availability of fire and explosion models or algorithms for determining the potential
sizes of toxic or flammable vapor clouds, overpressure zones from explosions, fireintensities from building fire exposures, etc.
• Appropriate sources of failure rate and reliability data and selection methods tosupport probability modeling
PROGRAM OBJECTIVES 1–26
• Research, data gathering, testing that may be needed to support consequence andprobability modeling
• Incorporating human error and management factors into failure probability ranges.• Procedures for addressing and presenting uncertainty• Procedures for conducting interactive quality assurance reviews• Methods for tracking the implementation of action plans
Risk-informed, performance-based program objectives involve:• Establishing a risk-based decision making framework and team concept• Applying a structured, consistent methodology and steps to quantify risk and
perform risk reduction cost/benefit analysis• Implementing an effective project management plan
Implementation of an effective risk-informed, performance-based fire protection programrequires good project management that incorporates:
• project definition,• project team selection,• resource allocation, and• risk communication.
Risk-informed, performance-based approaches should be considered tools to enhance andimprove engineering judgements.
The following is extracted from reference [5]: Quantitative analysis techniques have gained a great deal of popularity
with decision makers and analysts in recent years. Unfortunately, many peoplehave mistakenly assumed that these techniques are magic “black boxes” thatunequivocally arrive at the correct answer or decision. No technique can makethat claim. These techniques are tools that can be used to help make decisionsand arrive at solutions. Like any tools, they can be used to good advantage byskilled practitioners, or they can be used to create havoc in the hands of theunskilled. In the context of Risk Analysis, quantitative tools should never be usedas a replacement for personal judgment.
Finally, you should recognize that Risk Analysis cannot guarantee that theaction you choose to follow — even if skillfully chosen to suit your personalpreferences — is the best action viewed from the perspective of hindsight.Hindsight implies perfect information, which you never have at the time thedecision is made. You can be guaranteed, however, that you have chosen the bestpersonal strategy given the information that is available to you. That’s not a badguarantee!
The risk-informed, performance-based methodology discussed in this book is based onrealistic experience and application. Application has included risk assessment and evaluation offire and explosion prevention and protection systems in the chemical, oil, gas, nuclear, and

RISK-INFORMED, PERFORMANCE-BASED FIRE PROTECTION 1–27
electric power industries as well as hazardous material processes, storage, and other industrialproduction operations. The application of this methodology, although based on industrial-typerisks, also lends itself to numerous commercial applications.
As for prescriptive codes, the movement will be more and more towards risk-informed,performance-based methods. Existing codes primarily concentrate on hardware design criteriabased on loss experience. Most existing codes do not address risk tolerance criteria, scenariolikelihoods, FPS response time of fire protection systems, system availability factors, andquantification of reliability versus common cause internal and external failures, human error, orFPS proof testing frequency versus reliability.
It is certainly expected that the methodology described in this book will be refined based onusers’ input and the progression of performance-based fire protection standards and applications.The current performance-based code thinking needs to extend beyond some of the current trendsthat primarily equate performance success to the results of deterministic fire modeling efforts.Performance success is a probabilistic measure. Risk tolerance criteria should dictateperformance requirements. Adding risk-informed to the performance equation will allow formore flexibility in evaluating alternative fire protection designs and testing options and will leadto improved cost-effectiveness.
1.6 REFERENCES
1. Schmidt, Michael E. G. and Mauney, D. A. Sept. 1988. How Financially OptimizingMaintenance Can Solve Your Safety Issues, Proceedings: International Conferenceand Workshop on Reliability and Risk Management, Center for Chemical ProcessSafety of AIChE, New York, NY, 1989.
2. American Institute of Chemical Engineers (AIChE). Center for Chemical Process Safety(CCPS), Guidelines for Chemical Process Quantitative Risk Analysis, New York,NY, 1989.
3. National Fire Protection Association 2000. SFPE Engineering Guide to PerformanceBased Fire Protection, Analysis and Design of Buildings, Quincy, MA.
4. Hadjisophocleous, G. V., Benichou, N., and Tamim, A. S.,1998. “Literature Review ofPerformance-Based Fire Codes and Design Environment.” Journal of FireProtection Engineering, 9(1), pp. 12 – 40.
5. Palisade Corporation. Guide To Using @ Risk; Risk Analysis and SimulationAdd-In for Microsoft Excel or Lotus 1-2-3. Newfield, NY, 1996.