ripple control of hot water in new zealand
TRANSCRIPT

Ripple Control of Hot Water in New Zealand September 2020
Front cover image Auckland at night
RIP
PLE
CO
NTR
OL O
F HO
T WATE
R IN
NE
W ZE
ALA
ND
- SE
PTE
MB
ER
2020
2
Contents10 Executive summary 4
20 Ripple Control in New Zealand 6
21 Introduction to ripple control 6
22 The benefits of ripple control
ndash balancing the grid and reducing energy costs 8
23 Project background and purpose 10
24 The use of ripple control in New Zealand today 11
25 How and why is ripple control used 14
26 Costs of ripple control 18
27 Requirements and incentives for load management 19
28 The reliability of ripple control of hot water 20
29 Barriers to the more effective use of ripple control 22
30 The future of hot water load control 24
31 Short-term outlook for ripple control 24
32 Ripple control and the evolving electricity system 25
33 The longer-term ndash distributed energy resource
management systems 26
34 Integration of ripple control and DERMs 28
40 Conclusions 30
50 Glossary of terms 32
60 Appendix A - Summary of existing data on ripple control 34
70 Appendix B - Costs of ripple control 48
80 Appendix C - EDB Case studies 52
RIP
PLE
CO
NTR
OL O
F HO
T WATE
R IN
NE
W ZE
ALA
ND
- SE
PTE
MB
ER
2020
3
DisclaimerIn this document PSC refers to Power Systems Consultants New Zealand Ltd a member of PSC Specialists Group Inc of Washington USA This document is intended for information purposes only
AcknowledgementsThe Energy Efficiency and Conservation Authority and PSC thank the individuals and organisations that took part in the surveys and interviews that informed the development of this report
About this reportTo reduce our environmental impact and emissions this document is published in digital form only It is available for download from our website wwweecagovtnz
Executive summaryRipple control is a network management tool for managing electricity demand New Zealandrsquos Electricity Distribution Businesses (EDBs) use ripple control to turn off consumersrsquo electric hot water systems at times of peak demand It has been New Zealandrsquos most important demand management tool since the 1950s
This report will help to inform future plans for managing demand for heating water and peak demand in general The report describes the current state of ripple control infrastructure its application by EDBs and the resulting benefits The report also describes problems with ripple control barriers to its effective use and its future role in the energy system in the context of emerging technologies Research for this report included surveys with consumers EDBs and electricians and well as a review of existing published information
All 29 EDBs in New Zealand own and operate ripple control plant which sends audio-frequency signals through the electricity network These signals are detected by ripple relays at consumersrsquo premises The relays respond by switching off certain electrical appliances mostly hot water systems Ownership of ripple relays varies around New Zealand and is split between EDBs electricity retailers and metering equipment providers (MEPs)
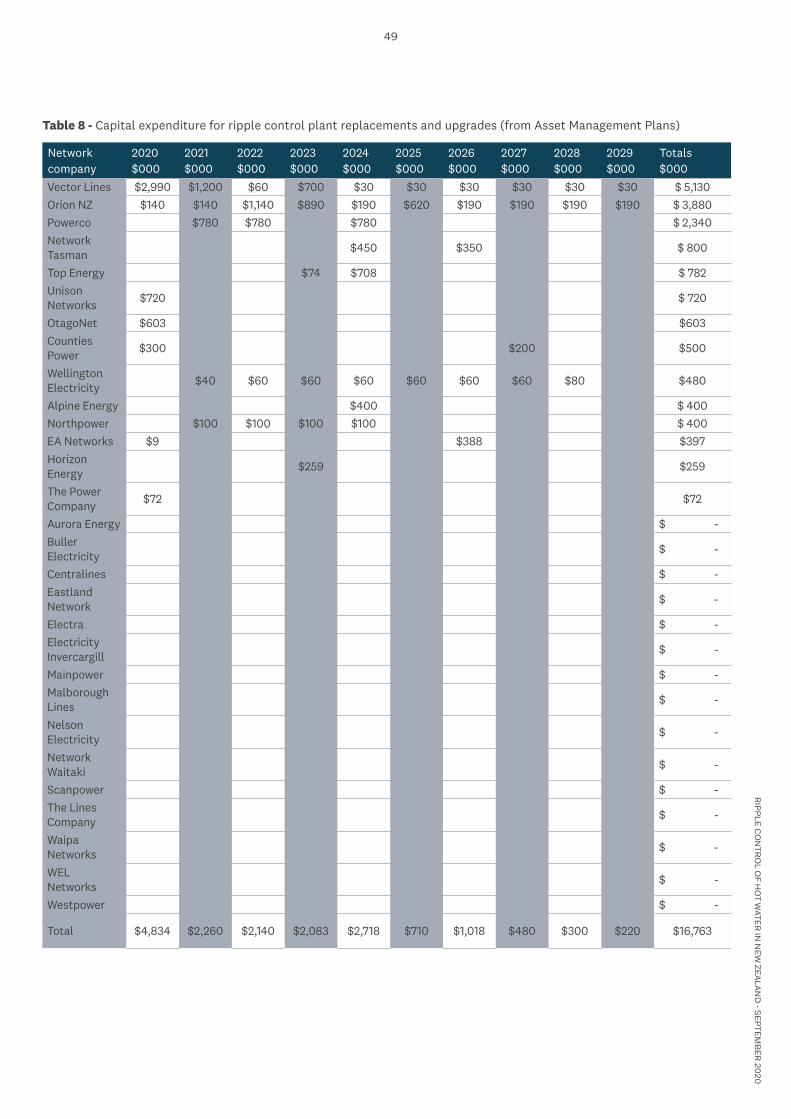
Ripple control continues to be widely used and well maintained EDBs continue to invest in ripple control plant with over$16M capital expenditure planned for upgrades and replacements across New Zealand through to 2029 EDBs continue to maintain ripple control plant and overall it appears to be in good condition
Most EDBs see ripple control as effective reliable and low-cost technology with multiple benefits It is estimated that just over half of electricity consumers have ripple control most of which is connected to hot water systems The load connected to ripple control equates to approximately 15 of New Zealands annual peak demand However the proportion of consumers with ripple control is gradually declining due to removal of ripple relays by retailers and disconnection of water heating from ripple relays by solar panel installers as well as the increasing uptake of alternate energy sources for water heating
Ripple relays are currently the most expensive part of providing ripple control Individual ripple control relays cost about$300 per ICP to supply and install or$10 per ICP per year assuming a 30 year life of a ripple relay Costs that were disclosed indicate the total annual cost of providing ripple control ranges between$10 and$27 per kW of controllable load and between$10 and$19 per ICP compared to approximately$130 per kW per year to provide additional peak distribution capacity
The most important use of ripple control is to control peak electricity demand EDBs take different approaches to the use of ripple control It is likely to be most useful in integrated networks typical of urban areas and in areas with growing electricity demand Most EDBs use ripple control in winter to maintain network demand within predetermined limits This has several potential benefits including
bull minimising the transmission charges that EDBs must pay to Transpower
bull ensuring demand does not exceed network capacity hence maintaining network security and reducing the risk of outages
bull deferring expenditure on network upgrades helping to keep customer bills lower
Some EDBs use ripple control to manage consumersrsquo electricity use in-line with their electricity tariff For example a consumer on a night-only tariff will have their water heated between 11pm and 7am This use of ripple control permanently shifts demand away from morning and evening periods when peaks occur In some regions ripple control is also used to switch off load in response to system low frequency events and other emergencies such as network failures
10
RIP
PLE
CO
NTR
OL O
F HO
T WATE
R IN
NE
W ZE
ALA
ND
- SE
PTE
MB
ER
2020
4
EDBs highlight a lack of clear market incentives to use ripple control Although ripple control reduces the cost of the electricity system the benefits do not necessarily accrue to the consumers and industry participants who provide the service EDBs continue to invest in ripple control for the benefit of their consumers not because of direct business incentives In fact if they were to abandon ripple control and allow peak loads to rise EDBs could upgrade their networks and increase their revenues Consumers should receive reduced rates in return for ripple control however not all retailers structure their tariffs to align with consumersrsquo consumption patterns and few retailers appear to actively promote the benefits of ripple control
In the short term (1-3 years) most EDBs see ripple control continuing as the best option for managing domestic hot water loads despite uncertainties on the horizon Industry participants recognise that the evolving electricity system will need new approaches to energy management beyond ripple control of hot water The Electricity Authorityrsquos proposed 2021 introduction of Default Distributor Agreements adds uncertainty Load control will become a contestable ldquorelated servicerdquo or ldquoadditional servicerdquo not a core distribution service EDBs may no longer be able to mandate ripple control in their connection agreements Further from April 2023 the Electricity Authority is changing the way Transpower allocates and recovers transmission costs The new cost-allocation method will no longer be related to the Regional Coincident Peak Demand For some EDBs this change will remove a major incentive to deploy ripple control
In the medium-term (5 years) the future of ripple control is uncertain Greater adoption of technologies such as electric vehicles solar power and home battery systems will increase the need to manage electricity demand including at the level of individual households There is currently no industry-wide strategy for ripple control or demand management This leads to lack of clarity over responsibility for demand management and the pace of change If change is gradual ripple control may continue for decades increasingly interacting with new technologies such as smart meters However with a more rapid transformation ripple control will be superseded more quickly
In the long-term (10 years) ripple control is likely to be displaced by a range of advanced technologies including
bull advanced smart meters and home automation systems that can transmit two-way information on current consumption and send signals to consumersrsquo appliances
bull individual appliances that respond to load and price signals sent by smart meters
bull software to handle monitoring forecasting of energy and control of appliances
bull alternative communication channels such as cellular networks and broadband
These technologies will combine to monitor forecast control and coordinate energy generation demand and storage They will surpass ripple control in their ability to control consumer equipment according to market conditions and provide real-time data on consumption at the household level Some retailers and EDBs in New Zealand are carrying out small trials of these technologies however their introduction is slow and piecemeal
RIP
PLE
CO
NTR
OL O
F HO
T WATE
R IN
NE
W ZE
ALA
ND
- SE
PTE
MB
ER
2020
5
Ripple control
20
21 Introduction to ripple controlElectricity grids must be constantly managed so that supply and demand are in balance One way to achieve this balance is to reduce or shift electricity consumption ndash an approach known as demand management Ripple control is a demand management technology that enables consumersrsquo electrical equipment to be switched off and on using a remote signal New Zealandrsquos Electricity Distribution Businesses (EDBs) have relied on ripple control as their main demand management tool since the 1950s
Ripple control involves control plant (Figure 1) sending an audio-frequency signal through the ordinary electricity network (Figure 2) This signal is detected by ripple relays located next to consumersrsquo meters (Figure 3) or embedded in a modern smart meter Relays respond by switching off the electricity supply to designated electrical appliances When power demand falls a second signal is sent to restart appliances This
report concerns the most common type of equipment under ripple control ndash domestic electric hot water heating systems
Data included in this report described as ripple control includes an older and less common technology called pilot wire Pilot wire is still used to control some domestic hot water heaters in older built-up areas in various locations around New Zealand The difference with pilot wire is that the initial signal is sent to substations not consumers These substations then send a signal over a dedicated wire that is separate from the mains supply Once the signal reaches a consumer their hot water is switched onoff
Figure 1 - Mangamaire 33 kV ripple injection plant (Photograph courtesy of Powerco)
RIP
PLE
CO
NTR
OL O
F HO
T WATE
R IN
NE
W ZE
ALA
ND
- SE
PTE
MB
ER
2020
6
This report focusses on the primary use of ripple control in New Zealand ndash reducing electricity demand at peak times It also discusses some related uses of ripple control such as alleviating network constraints and managing consumersrsquo electricity use to align with retailer tariffs
Ripple signals are transmitted for several other reasons that are outside the scope of this report For example they are used to a lesser extent to control the operation of other equipment such as street lighting night-storage heaters and irrigation pumps They are also used to alert commercial and industrial consumers to periods of high electricity consumption and in some parts of New Zealand to trigger Tsunami warning sirens These alternative uses for ripple control appear to be declining For example street lighting control is often being replaced with other control systems incorporating daylight sensors Tsunami warnings are now mostly via mobile phone alert systems
Figure 2 - Ripple control plants send signals to switch onoff thousands of hot water systems
Ripple Control Plant
power cable
onoff ripple signal
Consumerrsquos hot water system
Household
Relay recieves signal
Consumerrsquos hot water system
Household
Relay recieves signal
Consumerrsquos hot water system
Household
Relay recieves signal
Figure 1 - Ripple control plants send signals to switch onoff thousands of hot water systems
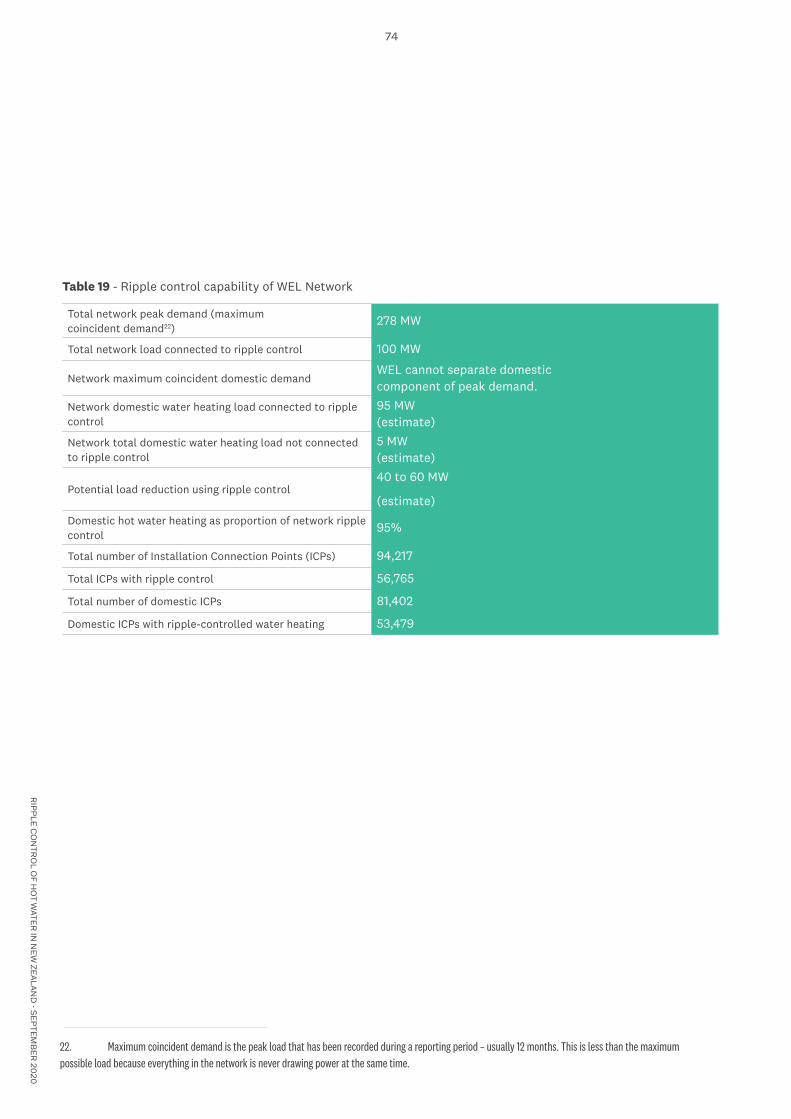
Figure 3 - A domestic meter board showing upper left = retailerrsquos meter upper right = WEL Networksrsquo meter of controlled hot water load lower right = WEL Networksrsquo ripple relay (Photograph courtesy of WEL Networks)
RIP
PLE
CO
NTR
OL O
F HO
T WATE
R IN
NE
W ZE
ALA
ND
- SE
PTE
MB
ER
2020
7
22 The benefits of ripple control ndash balancing the grid and reducing electricity costsRipple control of domestic electric hot water heating is one way of reducing demand In New Zealand it is deployed at times of peak electricity use ndash usually winter mornings (8-930am) and evenings (5-8pm) largely due to greater use of electric hot water heating and lighting Figure 4 shows how ripple control can enable a reduction in peaks of electricity demand
Demand management techniques such as ripple control have several benefits that support the New Zealand Governmentrsquos objectives for an energy system that is affordable reliable and more sustainable1
221 Ripple control reduces electricity costsRipple control can help deliver cheaper electricity for all consumers by reducing system costs in several ways
Lower network costs Figure 5 from Orion suggests that typically 25 of an electricity networkrsquos capacity is used only during peak demand periods in winter that accounts for less than 10 of the year Ripple control can flatten these peaks (Figure 4) improving asset utilisation and reducing the required capacity and overall cost of the transmission and distribution networks
Lower generation costs The cost of electricity usually rises when demand is high At these peak times lower cost generation is already operating at maximum output so more expensive generators such as gas-fired power stations with a higher environmental impact are deployed Also transmission lines can reach their capacity resulting in the dispatching of more expensive generation connected by different transmission lines with spare capacity Ripple control reduces the reliance on expensive generation by reducing peak demand
Reducing consumersrsquo energy bills Around half of New Zealand households have hot water systems under ripple control These consumers often pay a reduced rate for energy in return for allowing network companies to control their hot water systems
222 Ripple control supports the reliability of the electricity systemOccasionally electricity supply is unable to meet demand due to either insufficient generation or inadequate transmission capacity A last-resort measure in these situations is to cut electricity supply to some consumers causing sudden blackouts The option of ripple control reduces the likelihood that this emergency response will be activated
1 Ministry of Business Innovation and Employment Energy strategies for New Zealand
wwwmbiegovtnzbuilding-and-energyenergy-and-natural-resourcesenergy-strategies-for-new-zealand
Figure 3 - Ripple control can help reduce peaks in electricity demand
MW
Time
with ripple control without ripple control
Figure 4 - Ripple control can help reduce peaks in electricity demand
RIP
PLE
CO
NTR
OL O
F HO
T WATE
R IN
NE
W ZE
ALA
ND
- SE
PTE
MB
ER
2020
8
223 Ripple control supports power qualityA side effect of using ripple control to reduce network peaks is that it helps with network voltage control On occasions the automatic ripple response of EDBs participating with Orion in the Upper South Island Load control scheme has assisted in maintaining voltage security in the Upper South Island (See the Orion Case Study Appendix C)
WEL Networks have ripple relays configured to respond to under-frequency events to help maintain the power system frequency (See the WEL Networks Case Study Appendix C)
224 Ripple control supports the integration of renewable energy sourcesDemand management can also support New Zealandrsquos emissions reduction targets by facilitating the introduction of more wind and solar energy The variable output of these technologies increases the value of systems that manage demand including ripple control The integration of renewable energy sources will also
require greater electrification of transport and process heat which if not carefully managed could exacerbate spikes in demand Hot water load management is one way to reduce these spikes Demand management by shifting peak loads to off peak times is an opportunity to use the existing capacity of the power system more efficiently
Ripple control is now competing with other newer technologies that can enable demand management such as advanced smart meters (Box 1) EDBs will have to make strategic decisions about their level of investment in ripple control compared to these alternative technologies This report provides part of the evidence base for making those decisions
Hour of day (one day shown)
This last 25 of capacity only has about 10 utilisation
The next 25 of capacity is used less than halfthe time (~35 utilisation)
The next 25 of capacity is often in use(~80 utilisation)
The first 25 of capacity provided is almostalways fully used (~100 utilisation)
MW
dem
and
(sup
ply
capa
city
requ
ired)
00
4 8 12
25
50
75
100
16 20 24
Figure 4 - About 25 of an electricity networkrsquos capacity is only used for 10 of the time ndash mostly during peak demand on winter evenings
Summer
Winter
Figure 5 - About 25 of an electricity networkrsquos capacity is only used for 10 of the time ndash mostly during peak demand on winter evenings
RIP
PLE
CO
NTR
OL O
F HO
T WATE
R IN
NE
W ZE
ALA
ND
- SE
PTE
MB
ER
2020
9
23 Project background and purpose The main objective of this research is to provide a better understanding of the current state of ripple control for domestic electric hot water heating in New Zealand This understanding will help the Energy Efficiency and Conservation Authority (EECA) deliver new initiatives aimed at reducing peak electricity demand using existing power system capacity more efficiently and increasing use of renewable energy
EECA suspects that use of ripple control for domestic electric hot water heating is declining in parts of New Zealand The report explores this issue as well as looking to the future of managing domestic hot water heating loads It addresses the following questions
bull To what extent is ripple control being used to manage electric hot water heating loads
bull Is ripple control being used effectively and what are the problems with it
bull Are there adequate incentives for using ripple control
bull How much does it cost to install and maintain ripple
control technology and what are network companiesrsquo plans to invest in maintenance and upgrades
bull Are there better alternative technologies for managing electric hot water heating loads and are these alternatives being explored by network companies
To answer these questions this research explores various new and existing evidence including
bull Existing data and research such as network companiesrsquo Asset Management Plans Commerce Commission data and academic reports
bull Surveys conducted for this report with network companies electricians and electricity consumers
bull Case studies of four network companies developed through interviews conducted for this report
RIP
PLE
CO
NTR
OL O
F HO
T WATE
R IN
NE
W ZE
ALA
ND
- SE
PTE
MB
ER
2020
10
24 The use of ripple control in New Zealand today
241 EDBs use of ripple controlEvery EDB in New Zealand owns ripple control infrastructure which they can use to manage electricity demand in their area This infrastructure includes multiple ripple control plants each covering a different part of an EDBrsquos network These control plants send ripple control signals on different communication channels Ripple relays at consumer sites are programmed to respond to one or more of these channels This gives network companies the ability to control blocks of hot water systems according to different timetables or real-time needs
It is estimated that just over half of New Zealands electricity consumers have ripple control most of which is connected to hot water The total network load connected to ripple control is estimated to be approximately 15 of New Zealands peak demand This estimate is based on publicly available data on the extent of ripple control (Appendix A) The total load connected to ripple control cannot be determined exactly but is estimated based on the changes in network load that EDBs observe in response to ripple control on and off signalling The fragmented ownership of ripple relays between EDBs electricity retailers and metering equipment providers (MEPs) and differing requirements across New Zealand in EDB connection contracts for mandatory and optional ripple control of water heating add to the uncertainty of exactly what load is connected to ripple control
Ripple control is a one-way communication system with no information sent back from consumersrsquo sites This means EDBs cannot detect if individual ripple relays receive a signal or if a hot water system is correctly turned onoff EDBs can only estimate their controllable loads by monitoring the impact of ripple signals on their network load
Ripple-controlled water heaters generally remain off for less than three hours and occasionally up to five hours Only in rare events such as a system fault will ripple control affect an individual consumer for over five hours To minimise its impact ripple control is sometimes rotated between consumers Mostly it has very little or no impact on consumers as the water remains hot in the tank for several hours while the heater is switched off
Most EDBs see ripple control as an effective reliable and low-cost technology with multiple benefits as described below Ripple control is likely to be most useful in integrated networks typical of urban areas and in areas with growing electricity demand This type of network presents greater opportunities to realise some of the benefits of ripple control such as alleviating network constraints and maximising use of network assets (Section 25)
In sparsely populated rural networks ripple control may be less useful as its use may lead to under-utilisation of network capacity The case study on Eastland Networks (Appendix C) describes a rural network where distributed diesel generators are seen as a more effective alternative to ripple control alone The diesel generators run at peak times to meet demand and are also available as back-up power supplies when there are transmission failures and an area within the network loses its connections to its normal sources of generation
RIP
PLE
CO
NTR
OL O
F HO
T WATE
R IN
NE
W ZE
ALA
ND
- SE
PTE
MB
ER
2020
11
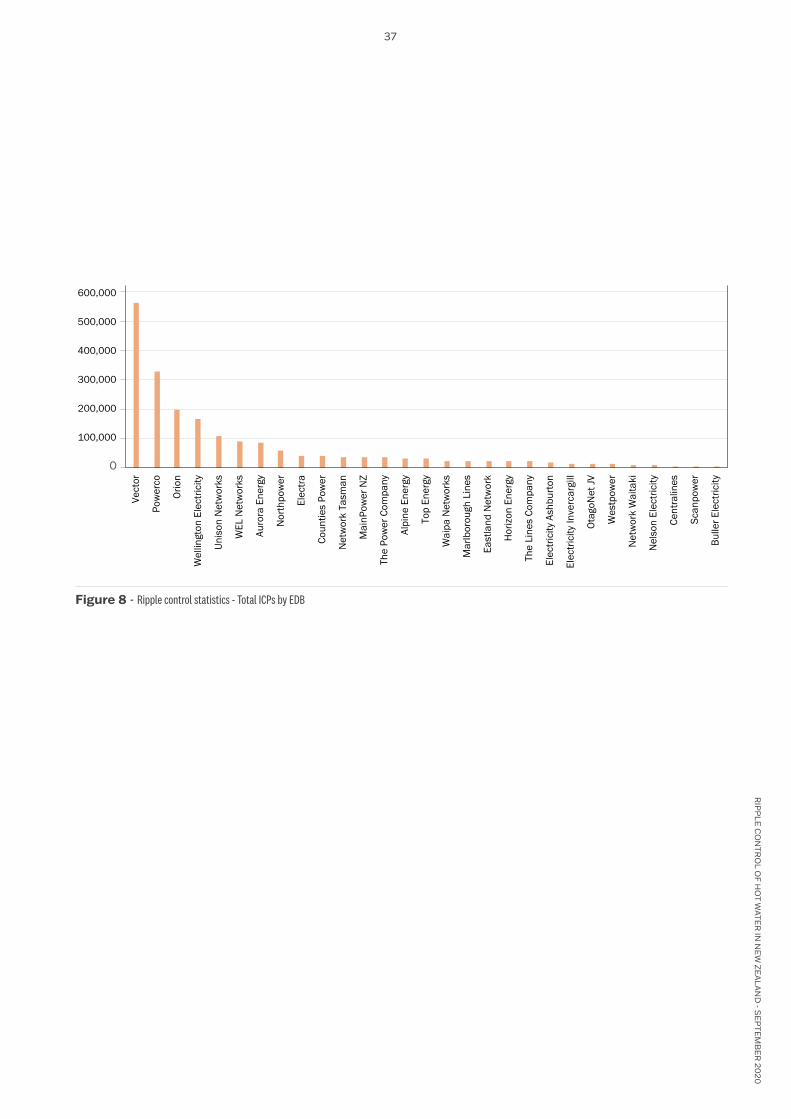
Table 1 - Quantification of ripple control in New Zealand
Quantification of ripple control in New Zealand
Total network peak demand in New Zealand 66172 MW
Network load connected to ripple control 9873 MW
Total Installation Control Points (ICPs) in New Zealand 21772194
Consumers (ICPs) with ripple control 11343013
Typical frequency of use
bull Reducing peak demand Weekdays in winter (1 to 4 month period)
bull Managing off-peak rates (tariff switching) 5 weekdays per week (throughout the year)
bull Emergency load-shedding lt5 times per year
2 Commerce Commission electricity distributors information disclosure data 2018
3 Estimate from Commerce Commission Electricity Distribution Business Emerging Technology data 2018 plus estimate for Vectorrsquos load (not
included in the Commerce Commission data)
4 Electricity Authority Market Information metering snapshot 3062020
242 Consumersrsquo perspectiveA short survey was conducted with 42 responses from domestic consumers located across 7 EDB network areas from Vector in Auckland to Orion in Christchurch Responses are summarised below in Table 2 as a percentage of the respondents that the question applied to ie some questions apply to only those with ripple controlled hot water and not those who answered the survey with no ripple control
RIP
PLE
CO
NTR
OL O
F HO
T WATE
R IN
NE
W ZE
ALA
ND
- SE
PTE
MB
ER
2020
12
Table 2 - Consumer survey response summary
Before receiving this survey were you aware of ripple control on domestic hot water systems
Yes 90
No 10
Do you have electric water heatingYes 62
No 38
Is your water heating ripple controlled
Yes 54
No 23
Donrsquot know 23
What benefit do you gain by having your hot water heating ripple controlled
Reduced rates 43
Nothing 29
Not sure 28
If ripple control of hot water heating in your area was optional would you choose to have it ripple controlled
Yes 70
No 15
Donrsquot know 15
Do you ever run out of hot water where you think it may be because of ripple control
Yes 21
No 79
Have you had hot water faults where you have called an electrician or reported a fault to your retailer and the cause of the fault has been due to the ripple control
Yes 7
No 93
Do you have any other ripple controlled load such as Night Store heaters
Yes 5
No 90
Donrsquot know 5
Do you suspect that ripple control interferes with any electrical appliances devices or lighting that you have (eg buzzing or flickering lighting)
Yes 2
No 98
243 Electriciansrsquo perspectiveAn attempt was made to gather experiences and views of electricians on ripple control A short survey was sent out to 37 electrical contractors spread across New Zealand from Northland to Southland selected based on their website information indicating a focus on residential work
Only one response was received so there was insufficient information to draw any conclusions
Once a ripple relay has been installed for a new build the terminal covers are sealed and from then on work on ripple relays is restricted to authorised contractors of the ripple relay owners Most residential focused electricians are not contractors to ripple relay owners and appear to have little interest in ripple control
RIP
PLE
CO
NTR
OL O
F HO
T WATE
R IN
NE
W ZE
ALA
ND
- SE
PTE
MB
ER
2020
13
25 How and why is ripple control usedThis section describes how EDBs use ripple control and their motivations for doing so (Figure 6) The sources of this information were
bull responses from 10 EDBs to a survey on ripple control
bull interviews with the four EDBs for the case studies in Appendix C
bull EDBsrsquo Asset Management Plans
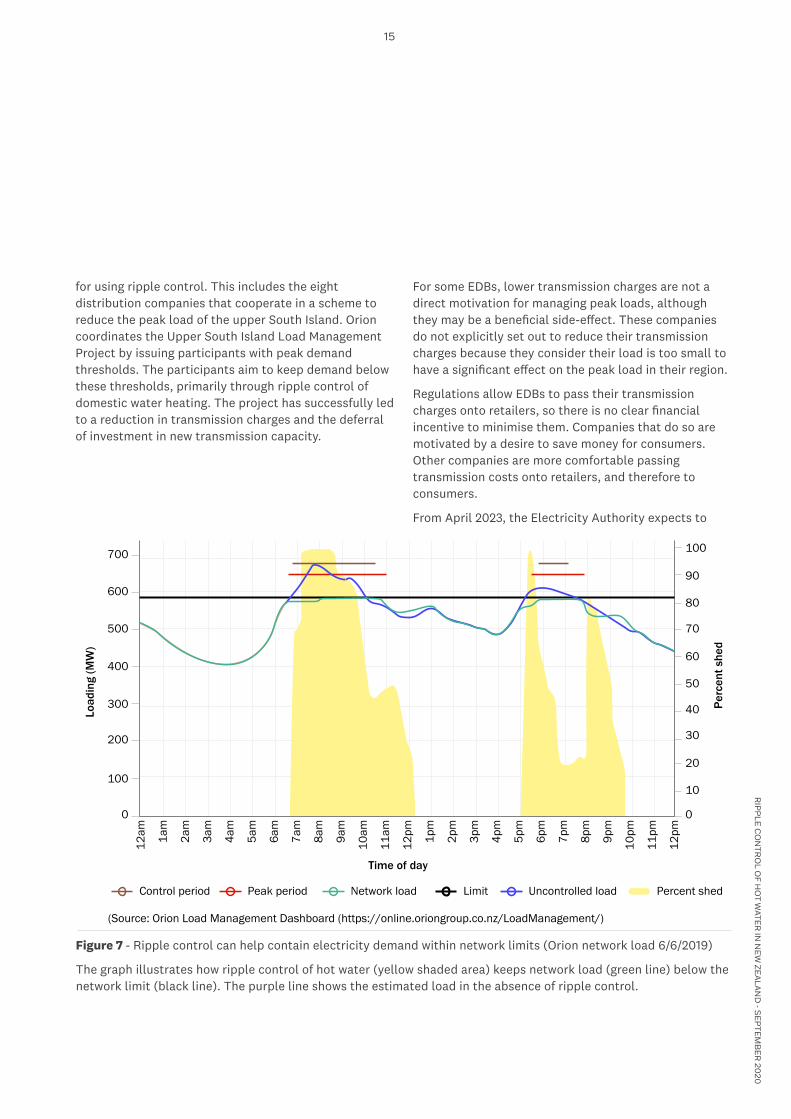
251 Ripple control for reducing peak demandAll 10 survey respondents reported using ripple control to reduce peak demand and maintain network loads within predetermined limits EDBs anticipate when their limit is about to be exceeded and respond by sending ripple signals to turn off some of their hot water load (Figure 7) This requires careful management to ensure individual water heaters are not turned off for too long
The use of ripple control to manage peak loads is most common on winter mornings and evenings Some companies only use ripple control for between one and three months each year as electricity demand tends not to approach the network limit outside winter
There are several potential benefits from using ripple control to manage peak loads minimising transmission charges alleviating network constraints maintaining grid security and deferring capital expenditure as explained further below
252 Minimising Transmission chargesTranspowerrsquos allocation of transmission charges to EDBs is based partly on regional peak loads (Regional Coincident Peak Demand (RCPD)) By reducing peak loads EDBs can sometimes reduce their transmission costs Three case study participants reported passing these lower costs onto retailers in the expectation that it would lead to lower bills for consumers However there is no obligation on retailers to pass lower costs onto consumers
For some EDBs (including eight survey respondents) minimising transmission charges is a direct motivation
Figure 5 - EDBsrsquo reasons for using ripple control of hot wateras percentage (from 10 survey respondents)
This was not specifically asked in the survey so may under-represent true number
100 Reducing peak loads
80 Minimising Transpower changes
80 Retailer tariff switching
80 Emergency load shedding
40 Participating in regional load control scheme
20 Participation in market for interruptible load
30 Price signalling (commercial)
Maintaining grid security70
Alleviating distribution network contraints70
Defering capital investment70
This was not specifically asked in survey so may under-represent true number
Figure 6 - EDBsrsquo reasons for using ripple control of hot water as percentage from 10 survey respondents
RIP
PLE
CO
NTR
OL O
F HO
T WATE
R IN
NE
W ZE
ALA
ND
- SE
PTE
MB
ER
2020
14
for using ripple control This includes the eight distribution companies that cooperate in a scheme to reduce the peak load of the upper South Island Orion coordinates the Upper South Island Load Management Project by issuing participants with peak demand thresholds The participants aim to keep demand below these thresholds primarily through ripple control of domestic water heating The project has successfully led to a reduction in transmission charges and the deferral of investment in new transmission capacity
For some EDBs lower transmission charges are not a direct motivation for managing peak loads although they may be a beneficial side-effect These companies do not explicitly set out to reduce their transmission charges because they consider their load is too small to have a significant effect on the peak load in their region
Regulations allow EDBs to pass their transmission charges onto retailers so there is no clear financial incentive to minimise them Companies that do so are motivated by a desire to save money for consumers Other companies are more comfortable passing transmission costs onto retailers and therefore to consumers
From April 2023 the Electricity Authority expects to
Time of day
Orion network load and load management
Percent shed
Perc
ent s
hed
Load
ing
(MW
)
12am 1a
m
2am
3am
4am
5am
6am
7am
8am
9am
10am
100
90
80
70
60
50
40
30
20
10
0
700
600
500
400
300
200
100
0
11am
12pm 1p
m
2pm
3pm
4pm
5pm
6pm
7pm
8pm
9pm
10pm
11pm
12pm
Peak periodControl period Limit Uncontrolled loadNetwork load
Figure 7 - The graph illustrates how ripple control of hot water (yellow shaded area) keeps network load (green line) below the network limit (black line) The red line shows the estimated load in the absence of ripple control
(Source Orion Load Management Dashboard (httpsonlineoriongroupconzLoadManagement)
Figure 7 - Ripple control can help contain electricity demand within network limits (Orion network load 662019)
The graph illustrates how ripple control of hot water (yellow shaded area) keeps network load (green line) below the network limit (black line) The purple line shows the estimated load in the absence of ripple control
RIP
PLE
CO
NTR
OL O
F HO
T WATE
R IN
NE
W ZE
ALA
ND
- SE
PTE
MB
ER
2020
15
change the way Transpower allocates and recovers transmission costs5 The new cost-allocation method will no longer be related to the Regional Coincident Peak Demand For some EDBs particularly those without capacity constraints in their own networks this change will remove a major incentive to deploy ripple control as ripple control will no longer reduce the transmission charges from Transpower that pass through to consumers
253 Alleviating network constraints and maintaining grid securityIf a networkrsquos capacity is exceeded the result can be a power outage or a drop in the system voltage below agreed supply limits EDBs continuously monitor their networks to ensure that loads remain within their capacity Ripple control of hot water offers one way to protect a network that is close to capacity This helps to reduce the likelihood of outages and maintain network security Ripple control can also allow an EDB to carry out essential maintenance without interrupting the service to consumers By alleviating network constraints with ripple control EDBs maximise the use of their existing assets
254 Deferring capital expenditure on network upgradesRegulators determine expenditure on network upgrades according to peak demand By using ripple control to reduce peak demand EDBs can defer costly upgrades Across New Zealand this reduces expenditure on network infrastructure by tens of millions of dollars every year helping to keep consumer bills lower
Ripple control enables the deferral of two types of upgrade Firstly it minimises peak loads at Transpowerrsquos substations ndash known as Grid Exit Points (GXPs)6 Without ripple control EDBs could be required by Transpower to fund more frequent supply capacity increases at GXPs Secondly ripple control allows EDBs to reliably handle peak loads on sub-transmission networks that are close to
their maximum capacity also deferring the necessity of upgrades
EDBs that aim to delay expenditure do so on behalf of their consumers but have no direct financial incentive to do so On the contrary they may have a financial incentive to upgrade their networks as under current rules they are able to make a return on this investment and grow their revenue
255 Retailer tariff switchingSome electricity consumers can select cheaper tariffs where appliances such as water cylinders and night-store heaters are operated outside peak periods For example on the night-only tariff water heating occurs overnight and is then off all day Other tariffs include peak control night-only with afternoon boost night-only with weekend boost and emergency control
Some EDBs send fixed-time ripple control signals every weekday to support these tariffs Some companies support the full range of tariffs others support only the night-only tariff while others do not support tariff switching at all In general EDBs are not incentivised by retailers to provide a tariff switching service
This use of ripple control has the additional benefit of permanently shifting demand away from morning and evening periods when peaks occur EDBs must balance this demand reduction with their obligations to achieve service level targets
EDBs handle switching of consumers on different tariffs by using multiple ripple control channels For this to work effectively ripple relays must be correctly programmed to align with consumersrsquo selected tariffs Where an EDB does not own a ripple relay it must rely on the relay owner to correctly programme the relay to align with a consumerrsquos selected tariff which may not always occur
5 httpswwweagovtnzdevelopmentwork-programmepricing-cost-allocationtransmission-pricing-review
6 Grid exit points (GXPs) are the points of connection (Transpower substations) where electricity flows out of the national
grid to local networks or direct consumers
RIP
PLE
CO
NTR
OL O
F HO
T WATE
R IN
NE
W ZE
ALA
ND
- SE
PTE
MB
ER
2020
16
256 Ripple control for emergency load shedding
In some networks ripple control is used to reduce load in grid emergencies ndash known as emergency load shedding Grid emergencies can be due to a failure in the network caused for example by damage to lines caused by storms or a high vehicle Emergencies can also result from the sudden failure of a generating station In such cases Transpower may direct an EDB to reduce load Using ripple control to limit demand is the preferred first response before taking more extreme action such as turning off all supply to consumers over wide areas This helps prevent disruption to supply including electricity outages while the problem is fixed
257 Using ripple control to participate in reserve marketWhen the network frequency falls below 492 Hz the system needs to respond within seconds by reducing demand andor increasing generation Some EDBs use ripple relays to drop load in response to low-frequency events by having low frequency load shedding as a function programmed into ripple relays This enables
them to earn revenue in the reserve market for fast interruptible load Low frequency activation typically only occurs a few times per year and EDBs usually participate only outside the winter months as lsquoripple reserversquo cannot be offered during periods when ripple control is already in use
Some EDBs do not provide this service because the financial rewards are too small to justify the additional operational complexity and risk Ripple control systems are too slow to respond by sending control signals within the time required by regulation For companies that do provide this service an under-frequency detection function is programmed in the ripple relay and does not require a ripple signal to be transmitted over the network
RIP
PLE
CO
NTR
OL O
F HO
T WATE
R IN
NE
W ZE
ALA
ND
- SE
PTE
MB
ER
2020
17
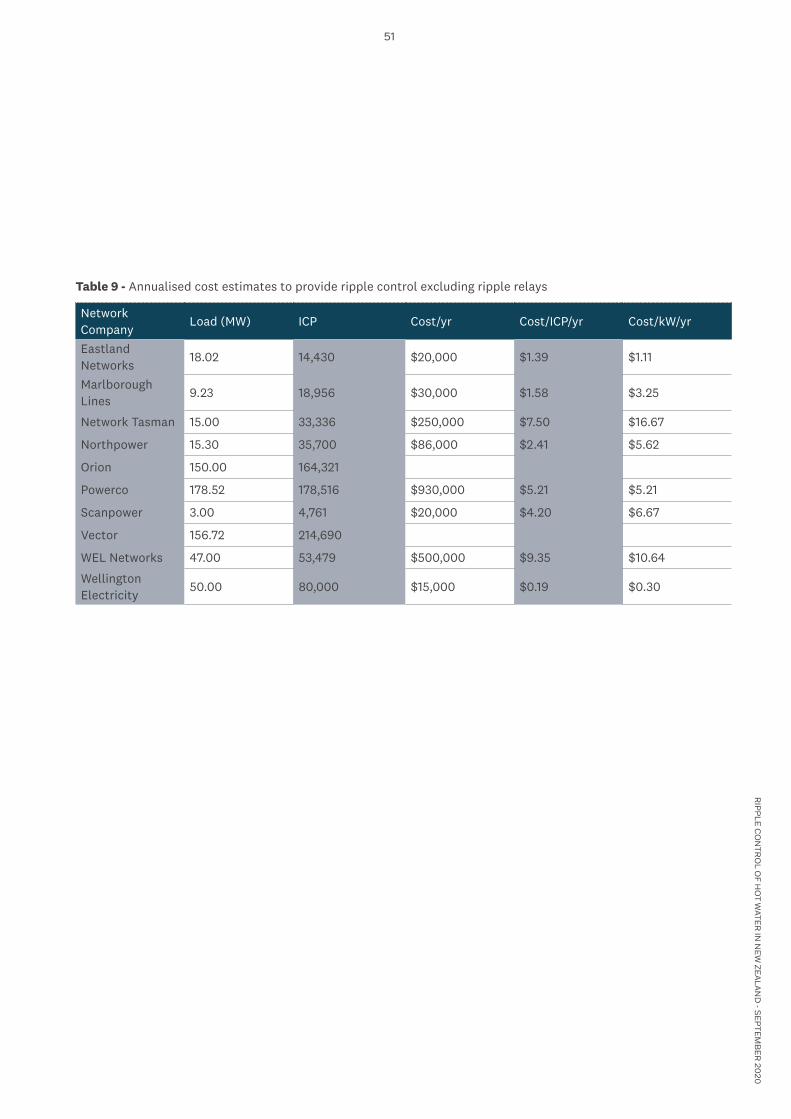
26 Costs of ripple controlEDB Commerce Commission information disclosures do not separately identify maintenance expenditure on ripple plant Annual costs were requested in the EDB survey that was conducted for this report however some of the respondents to the survey did not provide any maintenance costs Annual maintenance costs that were disclosed ranged between$10000 and$80000 per year With this level of expenditure the annual cost of maintenance is generally below$1 per ICP per year and below$1 per kW of controllable load per year
Capital costs of ripple control are dominated by the cost of supplying and installing ripple control relays EDBs responding to this survey that owned ripple relays stated the cost of supplying and installing stand-alone ripple relays (that is not embedded in smart meters) was commonly about$300 but could be$500 or more for a rural installation Assuming a ripple relay life of 30 years this gives cost of around$10 per year per ICP for an urban consumer ripple control installation
EDB cost information provided for this research is included in Appendix B This shows the total annual cost of ripple control ranged between$10 and$27 per kW of controllable load and between$10 and$19 per ICP which compares favourably to approximately$130kWyear for increased peak distribution capacity
Capital costs of planned ripple control plant upgrades and replacements over the next 10 years have been
extracted from EDB disclosures published in 2019 Asset Management Plans and tabulated in Appendix B The planned total over all of New Zealand is$168M
In general EDBs consider ripple control as an inexpensive method of managing loads with positive financial benefits Several EDBs reported that their financial benefit from ripple control is at least twice the costs However a couple of companies mentioned the anticipated costs of ripple plant replacements over the next decade provides an opportunity to evaluate the benefits of alternatives to ripple control
RIP
PLE
CO
NTR
OL O
F HO
T WATE
R IN
NE
W ZE
ALA
ND
- SE
PTE
MB
ER
2020
18
27 Requirements and incentives for load management
271 ConsumersCurrently EDBs have the power to make ripple control mandatory for consumers with electric hot water heating Most companies do not exercise this power but some do particularly in the upper South Island Use of ripple control tends to be more extensive and effective in those areas where it is compulsory Two large areas where ripple control is not compulsory Auckland and Wellington have comparatively low ripple-controlled load Data from Auckland is unusual in that there is a substantial area that was served by a pilot wire system which is no longer in service because it has become unreliable Vector is exploring different technologies approaches and their costs that may replace the services provided by the pilot wire system The replacement should be adaptable such that it not only replaces the services from the pilot wire system but also addresses the uncertainty from a future with many distributed energy resources
Many consumers receive reduced rates for allowing their water heating to be controlled This can happen in one of two ways
bull Some domestic installations with ripple control have one meter for water heating (or other controlled loads) and a second meter for all other appliances This allows these consumers to receive a discounted rate for their water heating
bull Other consumers have a single meter and receive a discounted rate for all load in return for allowing water heating to be controlled
In some areas the extent of consumersrsquo discounts depends on the degree of ripple control they allow as determined by their chosen tariff (Section 255) However some variable tariffs are not well-aligned with actual ripple control or an EDBs use of ripple control does not support the range of tariffs offered by all retailers Also some retailers do not offer reductions
for controlled load or offer flat rates which take limited account of controlled load Ripple control is not well promoted by retailers and many consumers are unaware of its potential benefits or even of its presence in their house
272 EDBsThere are no regulatory requirements for EDBs to maintain or use ripple control infrastructure However as outlined in Section 25 EDBs have several potential motivations for using ripple control including lower transmission charges deferred expenditure reducing consumer energy bills and participation in the reserve market Except for participation in the reserve market these are not direct financial incentives but rely largely on EDBsrsquo willingness to act responsibly The EDBs interviewed for the case studies (Appendix C) stressed that regulatory and community expectations are a major incentive for them to use ripple control This is particularly the case for community owned EDBs
273 Retailers and meter ownersEngagement with retailers and meter equipment providers (MEPs) was not part of the research for this report EDBs believe retailers or MEPs are not promoting ripple control to their consumers which indicates they have few incentives to do so On the one hand retailers that are also generators may lose out from the use of ripple control because it undercuts profitable peak generation On the other hand where they have fixed price contracts to supply electricity having the ability through load control to shift load from high price peak periods to low price off peak periods improves profitability of supply contracts EDBs reported poor coordination of ripple control between themselves retailers and MEPs
RIP
PLE
CO
NTR
OL O
F HO
T WATE
R IN
NE
W ZE
ALA
ND
- SE
PTE
MB
ER
2020
19
28 The reliability of ripple control of hot waterEDBs report that they can control a large proportion of electric hot water systems using ripple control with few technical problems For example WEL Networks indicated an annual failure rate of individual relays of less than 02 Most hot water faults tend to be related to the consumersrsquo equipment not ripple control
Often publicised in trade literature is the potential problem of adverse interaction between ripple control signalling and consumer equipment such as causing some types of lighting to flicker Neither the consumer nor the EDB surveys indicated that this is a common problem in New Zealand Some industrial equipment has the potential to absorb ripple signalling power to the extent that ripple control signalling in the surrounding area becomes unreliable This is mostly an issue for the older ripple control systems using
the higher signalling frequencies eg 1050 Hz which are more prone to signal degradation Powerco stated that their Network Connection Standard requires the installation of blocking filters to prevent consumer equipment interfering with ripple control signals
Most ripple control plant is well-maintained and very reliable However their failure is the most serious potential technical problem with ripple control infrastructure Several companies reported that their ripple control infrastructure is several decades old and hence more likely to fail The risk is compounded by difficultly of obtaining new parts for ripple control plant and a lack of technicians with the skills to repair the older ripple control infrastructure
RIP
PLE
CO
NTR
OL O
F HO
T WATE
R IN
NE
W ZE
ALA
ND
- SE
PTE
MB
ER
2020
20
Older ripple control plant uses a higher frequency (eg 1050 Hz) which has a greater risk of signal loss Many newer installations have moved to a more reliable lower frequency range (200 to 400 Hz) Migration to lower-frequency signalling requires ripple relays to be replaced This is a slow and costly process especially where ripple relays are not owned by EDBs Pilot wire is less reliable than ripple control and replacement parts even harder to source For this reason some EDBs are decommissioning pilot wire as part of scheduled renewal programmes
Sometimes hot water control systems get stuck in the ldquooffrdquo position This can happen for example when the ldquoswitch onrdquo signal coincides with a network failure or maintenance It can also be caused by failures in communication between the SCADA Master Station and the control plant as well as operational mistakes Generally EDBs can overcome this problem quickly by re-sending the ldquoswitch onrdquo signal Newer ripple control relays can be programmed to switch themselves on if they do not receive an expected ldquoonrdquo signal after a pre-set time limit Orion reported sending nightly confirmation signals to ensure hot water systems are turned back on Some modern ripple relays revert to a pre-programmed timetable if they do not receive an expected ripple signal
Ripple relays themselves sometimes fail and no longer respond to ripple control signals If a relay fails in the ldquooffrdquo state an EDB will not know until they receive a consumerrsquos complaint about lack of hot water If a relay fails in the ldquoonrdquo state it is likely to remain in this state indefinitely as the consumer will continue to have hot water and is unlikely to report a problem Also the relay owner is unlikely to discover the problem as regulations do not require regular condition assessments
Some problems relate to the ownership of meters and ripple control relays by third parties This means EDBs have a limited understanding of the status of relays in their area For example they may not know what ripple channels different relays are set to and therefore can only determine how much load is controlled by a particular channel by observing the effect on their network by switching the channel on and off It can also mean that that the control of a consumerrsquos hot water system does not align with their chosen tariff Sometimes retailers incorrectly wire the ripple relays when replacing consumersrsquo meters An EDB has no way of finding out about this unless a consumer reports a problem This is unlikely however as the consumer will still have hot water
Split ownership of ripple relays also makes fault finding complicated and potentially time consuming with multiple parties often involved If a consumer has a problem with no hot water EDBs prefer that the consumer contacts their retailer first to have the problem resolved If a consumer is not aware of this then they are just as likely to call a local electrician or plumber If the electrician or plumber determines that the fault is related to the ripple control then the consumer will have to make another call to their retailer Another contractor depending upon who owns the ripple relay will need to attend the consumerrsquos premise to undertake testing of the ripple control signal level and the ripple control relay Potentially a consumer could have a period of time with no hot water and a call-out invoice from an electrician or plumber to claim back from their retailer
RIP
PLE
CO
NTR
OL O
F HO
T WATE
R IN
NE
W ZE
ALA
ND
- SE
PTE
MB
ER
2020
21
29 Barriers to the more effective use of ripple controlRipple control could be used more extensively and effectively than it is today As indicated by Figure 6 not all EDBs extract the full range of benefits from ripple control In fact none of the survey respondents use ripple control to its full capability as a demand management tool especially outside winter
The fundamental barrier to greater use of ripple control is the lack of a national or industry-wide strategy on load control Along with no effective strategy there is no effective market with financial incentives for the controllable load available via ripple control This leads to uncertainty among EDBs about the future of ripple control as well as a lack of coordination between market participants and even conflicting objectives For example some retailers aim to maximise the electricity delivered while EDBs aim to maintain secure supply at minimum cost This research revealed several specific problems that arise due to this lack of industry coordination including
bull lack of understanding among EDBs about consumers electricity use patterns
bull EDBsrsquo ripple control not coordinated with Transpowerrsquos demand management measures
bull retailersrsquo unnecessary removal of working ripple relays without consulting EDB
bull retailers or MEPs failing to program ripple relays
correctly and not consulting EDBs
bull retailers not promoting the benefits of ripple control to consumers or even offering tariff structures (such as flat rates) that discourage load control
bull the lack of clear business incentives for some EDBs to provide ripple control
Part of EDBsrsquo motivation for using and maintaining ripple is political and public expectation that they will run an efficient network Fear of reputational damage may be the most common incentive for EDBsrsquo continued investment in ripple control But such an incentive could be eroded if one or more EDBs were to break ranks by abandoning ripple control There is a greater risk of this among EDBs that reap fewer rewards from ripple control such as those in rural areas The case study on Eastland Networks (Appendix C) shows how for some EDBs distributed generators have business and operational advantages over load management Some EDBs also point out there is a disincentive to providing ripple control because by allowing peak loads to rise EDBs could upgrade their network and increase their revenues
RIP
PLE
CO
NTR
OL O
F HO
T WATE
R IN
NE
W ZE
ALA
ND
- SE
PTE
MB
ER
2020
22
RIP
PLE
CO
NTR
OL O
F HO
T WATE
R IN
NE
W ZE
ALA
ND
- SE
PTE
MB
ER
2020
23
The future of hot water load control31 Short-term outlook for ripple controlIn general ripple control infrastructure is well maintained and its level of deployment is roughly stable Most EDBs consider ripple control to be the best option for managing domestic hot water loads at least for the next few years Nevertheless the proportion of hot water systems in New Zealand connected to ripple control and pilot wire control is declining slowly (see Appendix A) due to
bull removal of ripple relays by retailers and MEPs
bull increased use of alternative water heating systems particularly gas-fired heaters
bull installers of rooftop solar moving hot water systems to the main meter disconnecting from ripple control
bull Vectorrsquos faulty pilot wire system being disabled between 2014 and 2015 and not replaced
Impending regulatory changes may introduce new barriers to the use of ripple control
bull In 2021 the Electricity Authority is planning to introduce Default Distributor Agreements which will make load control a contestable ldquoadditional servicerdquo separate from the distribution service7 EDBs may lose the ability to make hot water load control mandatory in their connection agreements One EDB reported that this change will remove a major incentive for continued investment in ripple control infrastructure This company also believes that it will make coordination harder and that for ripple control to work well it needs a central controller
bull From 2023 Transpowerrsquos Transmission Pricing Methodology will change8 Transmission charges to EDBs will no longer be related to the Regional Coincident Peak Demand (Section 252) For some EDBs this change will remove a financial incentive to deploy ripple control
Even with these changes many EDBs expect to continue to invest in ripple control as it will continue to be useful for limiting peak demand alleviating capacity constraints and deferring network expenditure
30
7 httpswwweagovtnzdmsdocument25535-code-amendment-default-distributor-agreement-proposal
8 httpswwweagovtnzdevelopmentwork-programmepricing-cost-allocationtransmission-pricing-review
RIP
PLE
CO
NTR
OL O
F HO
T WATE
R IN
NE
W ZE
ALA
ND
- SE
PTE
MB
ER
2020
24
32 Ripple control and the evolving electricity systemIn the coming decades New Zealand is likely to see the more widespread adoption of several technologies which could have a major impact on the electricity system These include
bull new sources of consumer demand for electricity particularly electric vehicles
bull domestic rooftop solar panels and batteries
bull grid-scale solar and wind energy which have variable output
These technologies have the potential to make a positive contribution to a cleaner energy system and a reliable electricity grid However their large-scale deployment also creates new risks for the electricity system by increasing fluctuations in supply and demand The importance of demand management is likely to grow to ensure successful integration of these technologies This may mean ripple control retains its value as a load control option Domestic hot water
cylinders are a large reservoir of stored energy which could be used to help balance the intermittent output of solar and wind energy in a similar way to batteries
However the future electricity system will need new approaches to energy management beyond ripple control of hot water New capabilities will be required such as real-time monitoring and control of energy consumption and production at the household level Ripple control is not well adapted to these new requirements as it can only signal to large blocks of hundreds or thousands of consumers Also as a one-way communication system ripple control cannot report on consumersrsquo use or production of energy Therefore as these new approaches to energy management and new capabilities evolve control of electric water heating may transfer from ripple control to new systems
RIP
PLE
CO
NTR
OL O
F HO
T WATE
R IN
NE
W ZE
ALA
ND
- SE
PTE
MB
ER
2020
25
33 The longer-term ndash distributed energy resource management systemsNew Zealands future energy system will need an enhanced ability to monitor forecast control and coordinate energy generation consumption and storage A system with these capabilities is sometimes called a Distributed Energy Resource Management System (DERMS) DERMS depend on a range of smart energy technologies including
bull smart meters that can transmit two-way information on current consumption and send signals to consumersrsquo appliances (Box 1)
bull individual appliances that respond to load and price signals sent by smart meters and home automation systems
bull software to handle monitoring forecasting of energy demand and production and control of appliances
bull alternative communication channels such as cellular networks and broadband
DERMS also depend on reliable two-way communications The risk of a failure in communication can be minimised by using multiple channels such as cellular networks ripple signals broadband and radio A breakdown in one network could then automatically activate an alternative network
There will be significant costs involved with fully implementing DERMS For example consumer meters may need replacing with more advanced devices as described in Box 1 with the data from these made readily available to EDBs However extensive application of DERMS is probably an essential component of New Zealandrsquos future energy system Eventually it could also negate the need for ripple control leading to avoided costs for both ripple relays and ripple control plant
The advent of DERMS has been flagged for many years and some EDBs are currently working with industry partners on DERMS trials For example Vector is carrying out trials of the demand management potential of home battery systems and electric vehicles Some newer smart meters have embedded ripple relays (Box 1) although their ripple control functionality is constrained by one-way ripple control signalling The adoption of smart energy management in New Zealand is slow and piecemeal Barriers to faster progress include
bull Lack of an industry-wide strategy on demand management For example there are no plans or targets for the rollout of the type of advanced smart meter described in Box 1 that integrates metering and control functionality This means industry participants are unclear about the direction and pace of change and lack clear incentives to plan for or invest in demand management fit for the evolving energy system
bull The fragmented ownership of electricity infrastructure leads to uncertainty about responsibility for smart energy management For example some EDBs see it as retailersrsquo responsibility
bull Limited incentives to try out new demand management technologies For example there is no scheme for equitable sharing of resulting cost reductions Also some EDBs believe they need to show that demand management solutions perform as reliably and predictably as traditional investments This sets a high bar which deters investment and innovation
RIP
PLE
CO
NTR
OL O
F HO
T WATE
R IN
NE
W ZE
ALA
ND
- SE
PTE
MB
ER
2020
26
Box 1 - Ripple control and smart metersOver 70 of households and businesses in New Zealand have a smart meter which measures and records electricity consumption at 30-minute intervals This data is transmitted to retailers using a radio or cell phone network Some advanced smart meters have additional features that have implications for the future of ripple control These features include
bull Embedded ripple relays that respond to ripple signals This negates the need for a separate ripple relay at a consumerrsquos premises saving space on the meter board and reducing the cost and complexity of the ripple control system
bull Some smart meter ripple relays can limit the time water heater are switched off or revert to a programmed timetable if they do not receive an expected ripple signal These features improve the reliability of ripple control
bull Some smart meters can also be programmed to control water heating in line with a consumerrsquos retail tariff (such as night-rate heating) This feature of smart meters could replace the need to use ripple control for tariff switching
bull Two-way communication between consumers and retailersEDBs of real-time information on consumption and control capability at the individual household level
bull The ability to communicate with consumerrsquos computing devices home automation systems and electrical appliances
bull Bi-directional energy recording capability suitable for monitoring consumption of electricity (import) and production of electricity (export)
Advanced smart meters with these capabilities could play an important role in the future electricity system Smart meter installations began in New Zealand in 2005 Types and models of meters installed vary so not all meters that have been installed since 2005 have the additional features listed above
RIP
PLE
CO
NTR
OL O
F HO
T WATE
R IN
NE
W ZE
ALA
ND
- SE
PTE
MB
ER
2020
27
34 Integration of ripple control and DERMSRipple control of hot water will continue to play an important role for some time It is likely that EDBs will persist with ripple control of hot water while more advanced technologies are gradually introduced to control electric vehicles batteries and other modern equipment
Even with universal application of DERMS some EDBs see ripple control plants continuing to manage hot water loads by communicating with smart meters which have embedded ripple relays (Box 1) In fact Orion has already carried out a small trial with a retailer using ripple control with DERMS However this will require DERMS that offer good control of hot water heating which is not generally the case today
With the right incentives ripple control of hot water could be used more frequently to manage daily fluctuations in demand and supply It could also be used to control the charging and discharging of electric vehicles and batteries and other appliances Network Tasman is currently conducting a trial of ripple-controlled batteries
Eventually DERMS technologies are likely to displace ripple control due to their greater capacity to control consumer equipment according to market conditions and provide real-time data on consumption at the household level The timeline for widespread introduction of smart energy management is unclear There is currently no industry-wide strategy for ripple control or demand management and this creates uncertainty over responsibility for demand management and the pace of change If change is gradual ripple control may continue for decades interacting with new technologies for example by communicating with smart meters with embedded ripple relays However with a more rapid transformation ripple control could be superseded much more quickly
RIP
PLE
CO
NTR
OL O
F HO
T WATE
R IN
NE
W ZE
ALA
ND
- SE
PTE
MB
ER
2020
28
RIP
PLE
CO
NTR
OL O
F HO
T WATE
R IN
NE
W ZE
ALA
ND
- SE
PTE
MB
ER
2020
29
Conclusions
Ripple control continues to be widely used with assets well maintained and in good condition Around half of New Zealands electricity consumers have ripple control most of which is connected to hot water systems The load connected to ripple control equates to approximately 15 of national peak demand
The proportion of consumers with ripple control is gradually declining due to the removal of ripple relays by retailers and installers of solar panels as well as the increasing number of gas water heaters Vectorrsquos removal from service of their faulty pilot wire system was a major contributor to the 11 decline in the total number of ICPs with ripple or pilot wire controlled hot water heating between 2014 and 2018
Most EDBs continue to invest in ripple control and see it as an effective reliable technology with multiple benefits Capital investment in ripple control plant through to 2029 disclosed in EDB Asset Management Plans is in excess of$16 million across all of New Zealand Operating and maintenance costs for ripple control are not disclosed by all EDBs For those that did disclose these costs for this ripple control research annual operational expenditure per EDB ranged up to$80000 per EDB per year The costs that were disclosed indicate the annual cost of providing ripple control ranges between$10 and$27 per kW of controllable load and between$10 and$19 per ICP
Each EDB takes a different approach to the use of ripple control It is likely to be most useful in integrated networks typical of urban areas and in areas with growing electricity demand Most EDBs use ripple control in winter to maintain network demand within predetermined limits This has several potential benefits including
bull minimising the transmission charges that EDBs must pay to Transpower
bull ensuring demand does not exceed network capacity hence maintaining network security and reducing the risk of outages
bull deferring expenditure on network upgrades helping to keep customer bills lower
Some EDBs use ripple control to manage consumersrsquo electricity use in-line with their electricity tariff For
example a consumer on a night-only tariff will have their water heated between 11pm and 7am This use of ripple control permanently shifts demand away from daytime periods when peaks occur Some EDBs use ripple control to reduce demand in response to emergencies such as a failure in part of the network Another application of ripple control to earn revenue in the reserve market for fast interruptible load
EDBs highlight a lack of clear market incentives to use ripple control Although ripple control reduces the cost of the electricity system the benefits do not necessarily accrue to the consumers and industry participants who provide the service EDBs continue to invest in ripple control for the benefit of end consumers not because of direct business incentives Consumers should receive a reduced rate in return for ripple control however not all retailers provide tariff options that compensate consumers for ripple-controlled load and few retailers appear to actively promote the benefits of ripple control
Most EDBs see ripple control as the best option for managing domestic hot water loads at least for the next few years However industry participants recognise that the evolving electricity system will need new approaches to energy management beyond ripple control of hot water Greater adoption of technologies such as electric vehicles solar power and home battery systems will increase the need to manage electricity demand including at the level of individual households
40
RIP
PLE
CO
NTR
OL O
F HO
T WATE
R IN
NE
W ZE
ALA
ND
- SE
PTE
MB
ER
2020
30
RIP
PLE
CO
NTR
OL O
F HO
T WATE
R IN
NE
W ZE
ALA
ND
- SE
PTE
MB
ER
2020
31
Glossary of terms
Coincident demand ndash The amount of demand at any given point in time All possible loads are never all switched on at the same time so coincident demand varies throughout the day depending on several factors such as weather or the state of thermostats in water heater and space heaters
Electricity demand ndash The amount of electricity required to satisfy all of the connected load
Demand management ndash Being able to switch discretionary loads on and off to exercise some control over the demand of the electricity network both for quantity and time of use
Distributed energy resource management system (DERMS) ndash A system used by an EDB to manage electricity resources distributed in their network such as storage batteries roof top solar standby diesel generators wind turbines
Distribution ndash Transport of electricity in the low voltage distribution network owned by EDBs
EDBs ndash Electricity Distribution Business Also called lines companies distribution companies or distributors of which there are 29 in New Zealand
EECA ndash The Energy Efficiency and Conservation Authority (EECA) is the government agency that works to improve the energy efficiency of New Zealand homes and businesses and encourage the uptake of renewable energy
Electricity Authority ndash The independent Crown entity which provides regulatory oversight of the New Zealand electricity sector
Grid emergency ndash A grid emergency occurs when the system operators ability to meet its principal performance objective (PPO) obligations is at risk equipment or people are at risk or the system operator has to take urgent action to restore the power system to a stable operating state
GXP ndash Grid Exit Point A point of connection where electricity flows out of the national grid to local networks or direct consumers
ICP ndashAn Installation Control Point is a physical point of connection on a local network or an embedded network that the distributor nominates as the point at which a retailer will be deemed to supply electricity to a consumer
Load ndash A device (eg water heater) or collection of devices (eg all electric appliances and devices in a house) that consume electricity
Load control ndash Turning on or off loads in an electricity network
Load diversity ndash The proportion of time that a load draws power compared to the amount of time that the load is connected and has power available
Electric hot water cylinders include thermostats so even though they are connected to a power source if the water is hotter than the thermostat setting then the hot water cylinder will not draw any power When ripple control switches off a group of hot water cylinders some of them will already be off because of thermostat action so the amount of load control that occurs is always less than the total possible load
Load shedding ndash The disconnection of load from a network usually used in an emergency situation when the amount of electricity available is no longer sufficient to meet the all of the load
Metering equipment providers (MEPs) ndashA metering equipment provider is a person who either assumes responsibility for any metering installation or is appointed to be responsible for any metering installation
Generally MEPs own meters and meter reading infrastructure An MEP may also own ripple switches
Network maximum coincident demand ndash The highest measured demand in a network recorded over a specified period often over a year
Regional Coincident Peak Demand (RCPD) ndash An average peak demand figure used in Transpowers transmission
50
RIP
PLE
CO
NTR
OL O
F HO
T WATE
R IN
NE
W ZE
ALA
ND
- SE
PTE
MB
ER
2020
32
pricing methodology defined as
Average of the lsquonrsquo frac12 hour net offtakes during the regional coincident peak periods for the region for a customer at a connection location during the capacity measurement period (CMP)
n=100 in Lower North and Lower South Island and n=100 in the Upper South Island and Upper South Island USI and UNI For the North Island and Lower South Island the months between November and April are excluded from CMP
Retailers ndash A company that sells electricity to customers
Ripple control ndash A method of using the power lines to send signals to turn on and off consumer loads
Ripple (control) channel ndash A means of sending several different signals down the same powerline to control different consumer equipment according to different schedules and functions
Ripple relay ndash A receiver for the ripple control signals which can switch loads on and off
SCADA ndash Supervisory Control and Data Acquisition The systems used by networks to collect and display information on how their system is operating on a moment-by-moment basis Provides the facilities to remotely control the electricity network from a central location
Transmission ndash Transport of electricity in the high voltage transmission network (the national grid) owned by Transpower
Transpower ndash The State-owned enterprise that owns the high voltage transmission network (the national grid) and acts as System Operator
Under frequency eventndash If the power system suddenly experiences a loss of power infeed either because of a generator fault or loss of connection to a generation source then the frequency falls If load is not quickly disconnected or the remaining generation increased to restore balance between generation and load then the frequency will fall further In severe cases the power system can reach a state known as system collapse
RIP
PLE
CO
NTR
OL O
F HO
T WATE
R IN
NE
W ZE
ALA
ND
- SE
PTE
MB
ER
2020
33
In producing this report PSC analysed the existing information on ripple control including
bull EDB emerging technology data gathered by the Commerce Commission in 2018
bull EDB information disclosure data collected each year by the Commerce Commission
bull EDBsrsquo Asset Management Plans
bull Electricity Authority Market Information
A1 Commerce Commission dataIn July 2018 the Commerce Commission surveyed all 29 network companies in New Zealand on the potential changes in peak demand from emerging technologies The survey data published on the Commerce Commissionrsquos website9 includes the most detailed readily available information on the extent of ripple control assets in New Zealand The survey included two metrics on ripple control for the period 2014-18 of interest for this report
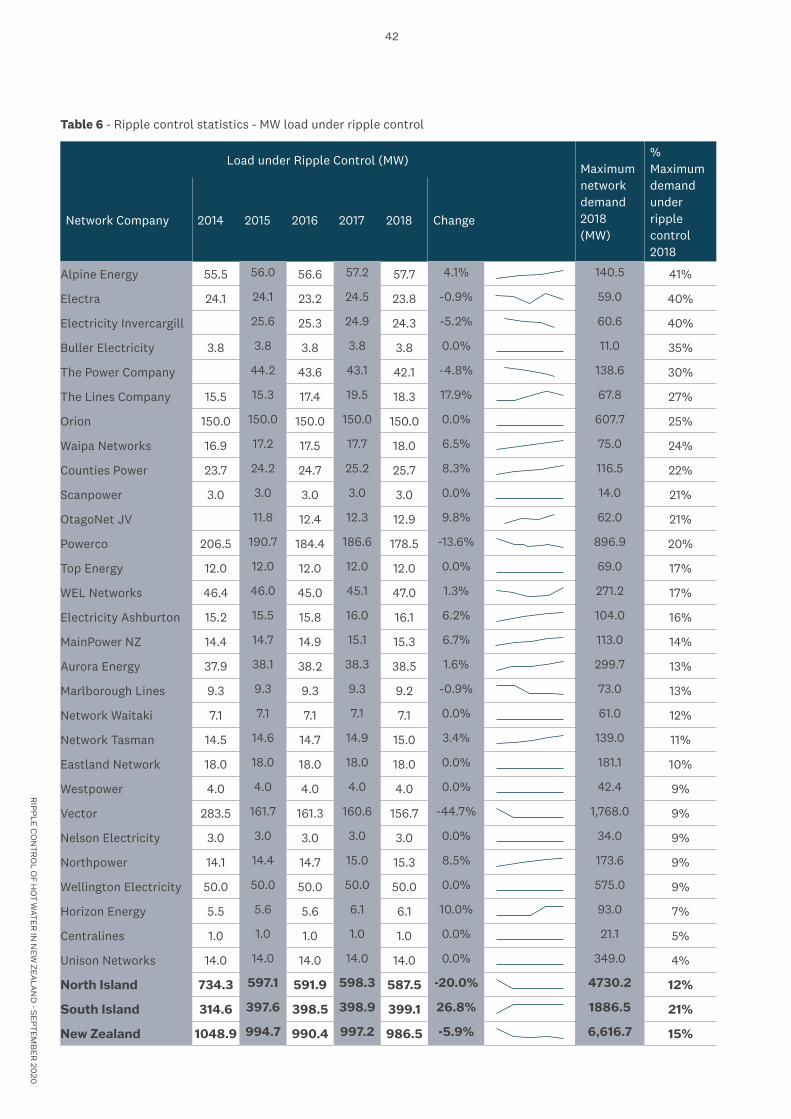
bull estimated number of Installation Control Point (ICPs) with ripple control
bull load under ripple control (MW)
Tables 1 to 5 present this data as well as other statistics calculated from the Commerce Commission data including
bull average load of an ICP under ripple control
bull percentage change in ICPs from 2014 to 2018
bull percentage of customers under ripple control
bull percentage of load under ripple control
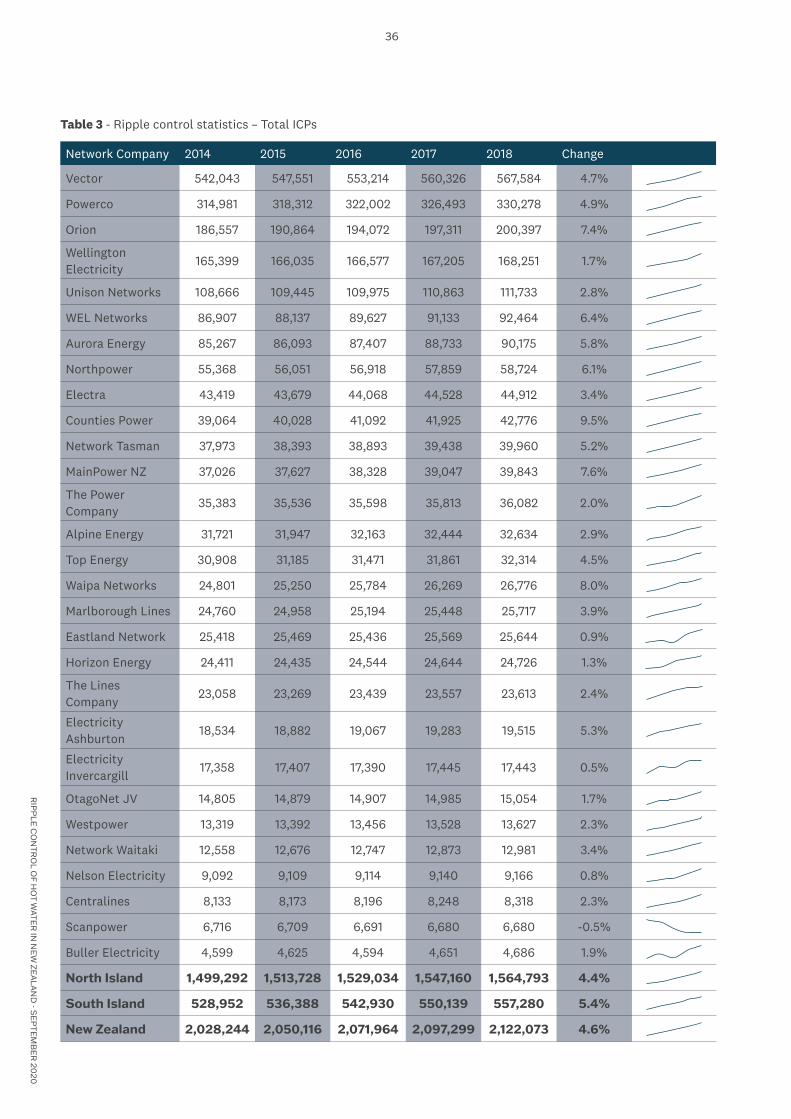
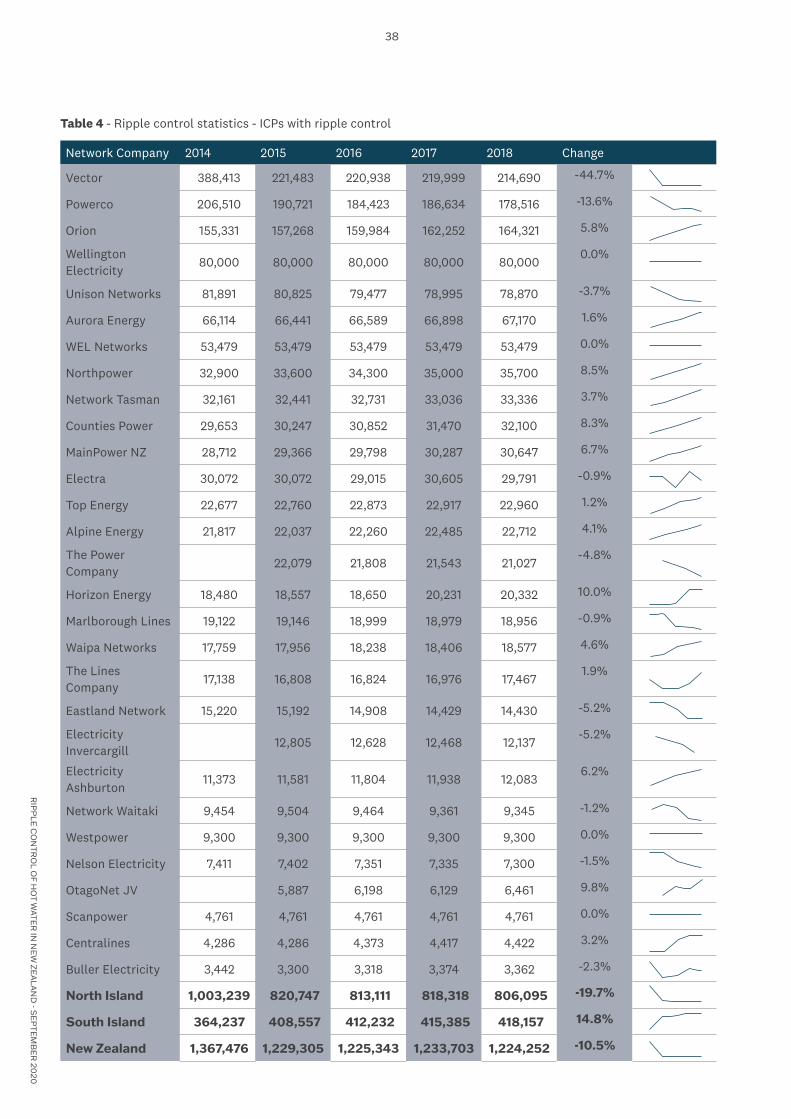
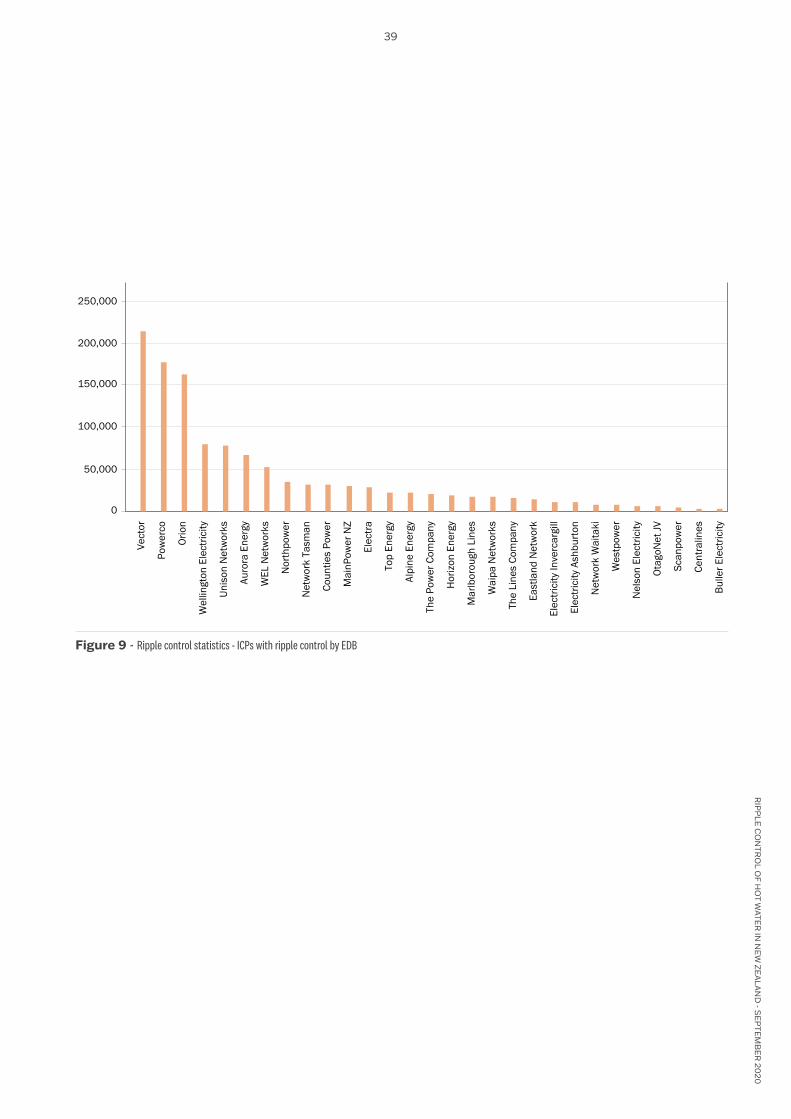
Table 3 and Table 4 list the ICPs across all EDBs and Table 5 shows that overall 58 of ICPs in New Zealand in 2018 included load under ripple control For most EDBs the percentage is higher than this but the national averaged is skewed downwards by the largest EDB Vector with a sharp drop recorded in the number of ICPs with ripple control
Two substantial discrepancies were found in the numbers of ICPs with ripple control as recorded in the Commerce Commission data compared to figures returned for the EDB survey conducted for this research In Table 4 the entries for WEL Networks and Wellington Electricity use the ICP counts with ripple control as returned for the survey undertaken for this report The number inserted for each year for these two EDBs is the number that was current for the end of 2019 The load under ripple control from the Commerce Commission data appeared to be a good match for the load figures provided by EDBs for the survey undertaken for this report
Change from 2014 to 2018 (Commerce Commission data)The average increase in ICPs from 2014 to 2018 was 46 which compares to New Zealand population growth over the same period of around 5310 Over the same period the EDB information disclosures show a 105 fall in the number of ICPs with ripple control and a decline of 97 in the proportion of ICPs with ripple control This decline was particularly large for the networks owned by Vector and Powerco (Vectorrsquos large decline is due to no longer counting ICPs from pilot wire schemes that are no longer in use)
Appendix A - Summary of existing data on ripple control
60
9 Commerce Commission Oct 2018 Electricity Distribution Businesses emerging technology data httpscomcomgovtnz__dataassetsexcel_
doc0014100670Electricity-distribution-businesses-emerging-technology-data-10-October-2018xlsx
10 Statistics NZ httpswwwstatsgovtnztopicspopulation
11 httpswwwemieagovtnzRetailReportsH3WIHLRegionType=NWKPampMarketSegment=Indamp_si=_dr_DateTo|20171231_dr_
RegionType|NWKP_dr_MarketSegment|Allv|4
RIP
PLE
CO
NTR
OL O
F HO
T WATE
R IN
NE
W ZE
ALA
ND
- SE
PTE
MB
ER
2020
34
According to EDBs the main reasons for the decline are
bull retailersMEPs removing ripple relays
bull replacing of electric water heating with gas
bull solar PV installers removing ripple control and the associated second meter for water heating
Tables 3 to 7 with the summary graphs in figures 8 to 12 were compiled from the Commerce Commission Emerging Technology Data9 and EA market information11
Note that Vectorrsquos ldquoload under ripple controlrdquo is not
shown in the Commerce Commissionrsquos Emerging Technology Data and Vectorrsquos survey response for this study did not include this information either Consequently Table 6 uses a calculated value for Vectorrsquos load under ripple control based on their number of ICPs with ripple control multiplied by the average load per ICP from all other EDBs
RIP
PLE
CO
NTR
OL O
F HO
T WATE
R IN
NE
W ZE
ALA
ND
- SE
PTE
MB
ER
2020
35
Table 3 - Ripple control statistics ndash Total ICPs
Network Company 2014 2015 2016 2017 2018 Change
Vector 542043 547551 553214 560326 567584 47
Powerco 314981 318312 322002 326493 330278 49
Orion 186557 190864 194072 197311 200397 74
Wellington Electricity
165399 166035 166577 167205 168251 17
Unison Networks 108666 109445 109975 110863 111733 28
WEL Networks 86907 88137 89627 91133 92464 64
Aurora Energy 85267 86093 87407 88733 90175 58
Northpower 55368 56051 56918 57859 58724 61
Electra 43419 43679 44068 44528 44912 34
Counties Power 39064 40028 41092 41925 42776 95
Network Tasman 37973 38393 38893 39438 39960 52
MainPower NZ 37026 37627 38328 39047 39843 76
The Power Company
35383 35536 35598 35813 36082 20
Alpine Energy 31721 31947 32163 32444 32634 29
Top Energy 30908 31185 31471 31861 32314 45
Waipa Networks 24801 25250 25784 26269 26776 80
Marlborough Lines 24760 24958 25194 25448 25717 39
Eastland Network 25418 25469 25436 25569 25644 09
Horizon Energy 24411 24435 24544 24644 24726 13
The Lines Company
23058 23269 23439 23557 23613 24
Electricity Ashburton
18534 18882 19067 19283 19515 53
Electricity Invercargill
17358 17407 17390 17445 17443 05
OtagoNet JV 14805 14879 14907 14985 15054 17
Westpower 13319 13392 13456 13528 13627 23
Network Waitaki 12558 12676 12747 12873 12981 34
Nelson Electricity 9092 9109 9114 9140 9166 08
Centralines 8133 8173 8196 8248 8318 23
Scanpower 6716 6709 6691 6680 6680 -05
Buller Electricity 4599 4625 4594 4651 4686 19
North Island 1499292 1513728 1529034 1547160 1564793 44
South Island 528952 536388 542930 550139 557280 54
New Zealand 2028244 2050116 2071964 2097299 2122073 46
RIP
PLE
CO
NTR
OL O
F HO
T WATE
R IN
NE
W ZE
ALA
ND
- SE
PTE
MB
ER
2020
36
Figure 8 - Ripple control statistics - Total ICPs by EDB
0
100000
200000
300000
400000
500000
600000
Vect
or
Pow
erco
Orio
n
Wel
lingt
on E
lect
ricity
Uni
son
Net
wor
ks
WEL
Net
wor
ks
Auro
ra E
nerg
y
Nor
thpo
wer
Elec
tra
Coun
ties
Pow
er
Net
wor
k Ta
sman
Mai
nPow
er N
Z
The
Pow
er C
ompa
ny
Alpi
ne E
nerg
y
Top
Ener
gy
Wai
pa N
etw
orks
Mar
lbor
ough
Lin
es
East
land
Net
wor
k
Hor
izon
Ene
rgy
The
Line
s Co
mpa
ny
Elec
tric
ity A
shbu
rton
Elec
tric
ity In
verc
argi
ll
Ota
goN
et J
V
Wes
tpow
er
Net
wor
k W
aita
ki
Nel
son
Elec
tric
ity
Cent
ralin
es
Scan
pow
er
Bul
ler E
lect
ricity
RIP
PLE
CO
NTR
OL O
F HO
T WATE
R IN
NE
W ZE
ALA
ND
- SE
PTE
MB
ER
2020
37
Table 4 - Ripple control statistics - ICPs with ripple control
Network Company 2014 2015 2016 2017 2018 Change
Vector 388413 221483 220938 219999 214690 -447
Powerco 206510 190721 184423 186634 178516 -136
Orion 155331 157268 159984 162252 164321 58
Wellington Electricity
80000 80000 80000 80000 8000000
Unison Networks 81891 80825 79477 78995 78870 -37
Aurora Energy 66114 66441 66589 66898 67170 16
WEL Networks 53479 53479 53479 53479 53479 00
Northpower 32900 33600 34300 35000 35700 85
Network Tasman 32161 32441 32731 33036 33336 37
Counties Power 29653 30247 30852 31470 32100 83
MainPower NZ 28712 29366 29798 30287 30647 67
Electra 30072 30072 29015 30605 29791 -09
Top Energy 22677 22760 22873 22917 22960 12
Alpine Energy 21817 22037 22260 22485 22712 41
The Power Company
22079 21808 21543 21027-48
Horizon Energy 18480 18557 18650 20231 20332 100
Marlborough Lines 19122 19146 18999 18979 18956 -09
Waipa Networks 17759 17956 18238 18406 18577 46
The Lines Company
17138 16808 16824 16976 1746719
Eastland Network 15220 15192 14908 14429 14430 -52
Electricity Invercargill
12805 12628 12468 12137-52
Electricity Ashburton
11373 11581 11804 11938 1208362
Network Waitaki 9454 9504 9464 9361 9345 -12
Westpower 9300 9300 9300 9300 9300 00
Nelson Electricity 7411 7402 7351 7335 7300 -15
OtagoNet JV 5887 6198 6129 6461 98
Scanpower 4761 4761 4761 4761 4761 00
Centralines 4286 4286 4373 4417 4422 32
Buller Electricity 3442 3300 3318 3374 3362 -23
North Island 1003239 820747 813111 818318 806095 -197
South Island 364237 408557 412232 415385 418157 148
New Zealand 1367476 1229305 1225343 1233703 1224252 -105
RIP
PLE
CO
NTR
OL O
F HO
T WATE
R IN
NE
W ZE
ALA
ND
- SE
PTE
MB
ER
2020
38
Figure 9 - Ripple control statistics - ICPs with ripple control by EDB
250000
200000
150000
100000
50000
0
Vect
or
Pow
erco
Orio
n
Wel
lingt
on E
lect
ricity
Uni
son
Net
wor
ks
Auro
ra E
nerg
y
WEL
Net
wor
ks
Nor
thpo
wer
Net
wor
k Ta
sman
Coun
ties
Pow
er
Mai
nPow
er N
Z
Elec
tra
Top
Ener
gy
Alpi
ne E
nerg
y
The
Pow
er C
ompa
ny
Hor
izon
Ene
rgy
Mar
lbor
ough
Lin
es
Wai
pa N
etw
orks
The
Line
s Co
mpa
ny
East
land
Net
wor
k
Elec
tric
ity In
verc
argi
ll
Elec
tric
ity A
shbu
rton
Net
wor
k W
aita
ki
Wes
tpow
er
Nel
son
Elec
tric
ity
Ota
goN
et J
V
Scan
pow
er
Cent
ralin
es
Bul
ler E
lect
ricity
RIP
PLE
CO
NTR
OL O
F HO
T WATE
R IN
NE
W ZE
ALA
ND
- SE
PTE
MB
ER
2020
39
Table 5 - Ripple control statistics - ICPs with ripple control
Network Company 2014 2015 2016 2017 2018 Change
Network Tasman 85 84 84 84 83 -13
Horizon Energy 76 76 76 82 82 65
Orion 83 82 82 82 82 -13
Nelson Electricity 82 81 81 80 80 -19
MainPower NZ 78 78 78 78 77 -06
Counties Power 76 76 75 75 75 -09
Aurora Energy 78 77 76 75 74 -30
The Lines Company 74 72 72 72 74 -04
Marlborough Lines 77 77 75 75 74 -35
Network Waitaki 75 75 74 73 72 -33
Buller Electricity 75 71 72 73 72 -31
Scanpower 71 71 71 71 71 04
Top Energy 73 73 73 72 71 -23
Unison Networks 75 74 72 71 71 -48
Alpine Energy 69 69 69 69 70 08
Electricity Invercargill 74 73 71 70 -40
Waipa Networks 72 71 71 70 69 -22
Westpower 70 69 69 69 68 -16
Electra 69 69 66 69 66 -29
Electricity Ashburton 61 61 62 62 62 06
Northpower 59 60 60 60 61 14
The Power Company 62 61 60 58 -39
WEL Networks 62 61 60 59 58 -37
Eastland Network 60 60 59 56 56 -36
Powerco 66 60 57 57 54 -115
Centralines 53 52 53 54 53 05
Wellington Electricity 48 48 48 48 48 -08
OtagoNet JV 40 42 41 43 34
Vector 72 40 40 39 38 -338
North Island 67 54 53 53 52 -154
South Island 69 76 76 76 75 62
New Zealand 67 60 59 59 58 -97
RIP
PLE
CO
NTR
OL O
F HO
T WATE
R IN
NE
W ZE
ALA
ND
- SE
PTE
MB
ER
2020
40
Net
wor
k Ta
sman
Hor
izon
Ene
rgy
Orio
n
Nel
son
Elec
tric
ity
Mai
nPow
er N
Z
Coun
ties
Pow
er
Auro
ra E
nerg
y
The
Line
s Co
mpa
ny
Mar
lbor
ough
Lin
es
Net
wor
k W
aita
ki
Bul
ler E
lect
ricity
Scan
pow
er
Top
Ener
gy
Uni
son
Net
wor
ks
Alpi
ne E
nerg
y
Elec
tric
ity In
verc
argi
ll
Wai
pa N
etw
orks
Wes
tpow
er
Elec
tra
Elec
tric
ity A
shbu
rton
Nor
thpo
wer
The
Pow
er C
ompa
ny
WEL
Net
wor
ks
East
land
Net
wor
k
Pow
erco
Cent
ralin
es
Wel
lingt
on E
lect
ricity
Ota
goN
et J
V
Vect
or
Nor
th Is
land
Sout
h Is
land
New
Zea
land
90
80
70
60
50
40
30
20
10
0
Figure 10 - Ripple control statistics - ICPs with ripple control
RIP
PLE
CO
NTR
OL O
F HO
T WATE
R IN
NE
W ZE
ALA
ND
- SE
PTE
MB
ER
2020
41
Table 6 - Ripple control statistics - MW load under ripple control
Load under Ripple Control (MW)Maximum network demand 2018 (MW)
Maximum demand under ripple control 2018
Network Company 2014 2015 2016 2017 2018 Change
Alpine Energy 555 560 566 572 577 41 1405 41
Electra 241 241 232 245 238 -09 590 40
Electricity Invercargill 256 253 249 243 -52 606 40
Buller Electricity 38 38 38 38 38 00 110 35
The Power Company 442 436 431 421 -48 1386 30
The Lines Company 155 153 174 195 183 179 678 27
Orion 1500 1500 1500 1500 1500 00 6077 25
Waipa Networks 169 172 175 177 180 65 750 24
Counties Power 237 242 247 252 257 83 1165 22
Scanpower 30 30 30 30 30 00 140 21
OtagoNet JV 118 124 123 129 98 620 21
Powerco 2065 1907 1844 1866 1785 -136 8969 20
Top Energy 120 120 120 120 120 00 690 17
WEL Networks 464 460 450 451 470 13 2712 17
Electricity Ashburton 152 155 158 160 161 62 1040 16
MainPower NZ 144 147 149 151 153 67 1130 14
Aurora Energy 379 381 382 383 385 16 2997 13
Marlborough Lines 93 93 93 93 92 -09 730 13
Network Waitaki 71 71 71 71 71 00 610 12
Network Tasman 145 146 147 149 150 34 1390 11
Eastland Network 180 180 180 180 180 00 1811 10
Westpower 40 40 40 40 40 00 424 9
Vector 2835 1617 1613 1606 1567 -447 17680 9
Nelson Electricity 30 30 30 30 30 00 340 9
Northpower 141 144 147 150 153 85 1736 9
Wellington Electricity 500 500 500 500 500 00 5750 9
Horizon Energy 55 56 56 61 61 100 930 7
Centralines 10 10 10 10 10 00 211 5
Unison Networks 140 140 140 140 140 00 3490 4
North Island 7343 5971 5919 5983 5875 -200 47302 12
South Island 3146 3976 3985 3989 3991 268 18865 21
New Zealand 10489 9947 9904 9972 9865 -59 66167 15
RIP
PLE
CO
NTR
OL O
F HO
T WATE
R IN
NE
W ZE
ALA
ND
- SE
PTE
MB
ER
2020
42
45
40
35
30
25
20
15
10
5
0
Alpi
ne E
nerg
y
Elec
tra
Elec
tric
ity In
verc
argi
ll
Bul
ler E
lect
ricity
The
Pow
er C
ompa
ny
The
Line
s Co
mpa
ny
Orio
n
Wai
pa N
etw
orks
Coun
ties
Pow
er
Scan
pow
er
Ota
goN
et J
V
Pow
erco
Top
Ener
gy
WEL
Net
wor
ks
Elec
tric
ity A
shbu
rton
Mai
nPow
er N
Z
Auro
ra E
nerg
y
Mar
lbor
ough
Lin
es
Net
wor
k W
aita
ki
Net
wor
k Ta
sman
East
land
Net
wor
k
Wes
tpow
er
Vect
or
Nel
son
Elec
tric
ity
Nor
thpo
wer
Wel
lingt
on E
lect
ricity
Hor
izon
Ene
rgy
Cent
ralin
es
Uni
son
Net
wor
ks
Nor
th Is
land
Sout
h Is
land
New
Zea
land
Figure 11 - Ripple control statistics - Load under ripple control as of the EDBrsquos maximum demand
RIP
PLE
CO
NTR
OL O
F HO
T WATE
R IN
NE
W ZE
ALA
ND
- SE
PTE
MB
ER
2020
43
Table 7 - Ripple control statistics - average load under ripple control per ICP with ripple control
Network Company 2014 2015 2016 2017 2018 Change
Alpine Energy 254 254 254 254 254 00
Electricity Invercargill 200 200 200 200 00
OtagoNet JV 200 200 200 200 00
The Power Company 200 200 200 200 00
Electricity Ashburton 134 134 134 134 134 00
Eastland Network 118 119 121 125 125 55
Buller Electricity 110 115 115 113 113 24
The Lines Company 090 091 104 115 105 157
Powerco 100 100 100 100 100 00
Waipa Networks 095 096 096 096 097 18
Orion New Zealand 097 095 094 092 091 -55
WEL Networks 087 086 084 084 088 07
Counties Power 080 080 080 080 080 00
Electra 080 080 080 080 080 00
Network Waitaki 075 075 075 076 076 12
Vector 073 073 073 073 073 00
Scanpower 063 063 063 063 0630 00
Wellington Electricity 063 063 063 063 0625 00
Aurora Energy 057 057 057 057 057 00
Top Energy 053 053 052 052 052 -12
MainPower NZ 050 050 050 050 050 00
Marlborough Lines 049 049 049 049 049 00
Network Tasman 045 045 045 045 045 -02
Westpower 043 043 043 043 043 00
Northpower 043 043 043 043 043 00
Nelson Electricity 040 041 041 041 041 15
Horizon Energy 030 030 030 030 030 00
Centralines 023 023 023 023 023 -31
Unison Networks 017 017 018 018 018 38
North Island 080 082 082 082 082 20
South Island 086 097 097 096 095 105
New Zealand 082 087 087 087 087 59
RIP
PLE
CO
NTR
OL O
F HO
T WATE
R IN
NE
W ZE
ALA
ND
- SE
PTE
MB
ER
2020
44
000
250
200
150
100
300
050
Alpi
ne E
nerg
y
Elec
tric
ity In
verc
argi
ll
Ota
goN
et J
V
The
Pow
er C
ompa
ny
Elec
tric
ity A
shbu
rton
East
land
Net
wor
k
Bul
ler E
lect
ricity
The
Line
s Co
mpa
ny
Pow
erco
Wai
pa N
etw
orks
Orio
n N
ew Z
eala
nd
WEL
Net
wor
ks
Coun
ties
Pow
er
Elec
tra
Net
wor
k W
aita
ki
Vect
or
Scan
pow
er
Wel
lingt
on E
lect
ricity
Auro
ra E
nerg
y
Top
Ener
gy
Mai
nPow
er N
Z
Mar
lbor
ough
Lin
es
Net
wor
k Ta
sman
Wes
tpow
er
Nor
thpo
wer
Nel
son
Elec
tric
ity
Hor
izon
Ene
rgy
Cent
ralin
es
Uni
son
Net
wor
ks
Nor
th Is
land
Sout
h Is
land
New
Zea
land
kW
Figure 12 - Ripple control statistics - average load under ripple control per ICP with ripple control
RIP
PLE
CO
NTR
OL O
F HO
T WATE
R IN
NE
W ZE
ALA
ND
- SE
PTE
MB
ER
2020
45
95000
96000
97000
98000
99000
100000
101000
102000
103000
104000
105000
106000
0
500000
1000000
1500000
2000000
2500000
2014 2015 2016 2017 2018
Load
(MW
)
Num
ber o
f IC
Ps
Total ICPs Total ICPs with Ripple control Load under ripple control (MW)
Figure 13 - Summary of ICPs and ripple controlled load
00
50
10
15
20
25
30
2014 2015 2016 2017 2018
Figure 14 - Summary of NZ total ripple controlled load as percentage of peak demand
RIP
PLE
CO
NTR
OL O
F HO
T WATE
R IN
NE
W ZE
ALA
ND
- SE
PTE
MB
ER
2020
46
Evaluation of Commerce Commission dataIn Table 6 the ldquoLoad under ripple control (MW)rdquo is a very approximate figure normally an estimate provided by EDBs based on operational experience It is highly variable and subject to seasonal variation It is not directly measurable for existing installations but its effects are observed by monitoring total network demand as ripple control channels are switched on and off From time to time some EDBs carry out drop load testing by switching ripple channels off and on to determine the approximate amount of controllable load that is responding to ripple control
The data summarised in Table 6 show EDBs have significant ability to manage peak loads with an average of 15 of peak demand connected to ripple control This average conceals a wide spread with several EDBs reporting under 10 and several others apparently able to control 30-41 of load
These large variations may reflect differences in what is being reported Some EDBs may have recorded their total theoretical load under ripple control whereas others recorded the actual amount available at any one moment These two figures differ because the amount of load that can be switched off or on depends on the state of each water heaterrsquos thermostat at the moment of ripple control activation A third possibility is that EDBs reported the additional network capacity that would be needed in the absence of any load management capabilities Orion explicitly stated that this is what their response (150 MW) relates to Orion provided an additional note to their response to the Commerce Commission which suggests a lack of clarity about the data sought
This difference in reporting may also explain the disparity in average size of each ICP load under ripple control ndash from 02 kW to 25 kW This may be partly explained by different types of equipment under ripple control ndash for example domestic vs commercial and industrial The high average loads of some EDBs may also be partially explained by larger commercial loads being under ripple control The average controlled load per ICP listed in Table 7 is the after diversity effect of switching off ripple controlled load averaged over the number of ICPs with ripple control Whenever ripple-controlled load is switched off some of the connected
load will already be switched off due to thermostat action This means that the average load listed in Table 7 will always be less than the average rated value of the connect hot water heater elements Commonly today hot water heater elements are rated at 3 kW with older elements rated at 2 kW or occasionally less depending on the size of the cylinder For the top 4 EDBs in Table 7 with an average load of 2 kW and above it is likely that the number of ICPs with ripple control recorded in Table 4 from the Commerce Commission data is under reported The calculated average load for these 4 EDBs is well above the calculated national average These 4 EDBs did not provide returns for this report so the authors have no better data to substitute for the Commerce Commission figures here
The Commerce Commission data does not separate domestic ICPs from other types of connection While Electricity Authorityrsquos registry identifies residential ICPs many EDBrsquos do not appear to keep ripple control load data for commercial and residential installations separate Data provided by EDBs for this research was generally aggregated residential and commercial totals It is reasonable to assume that the majority of ICPs are domestic connections but the proportion is unknown Similarly the data collates all equipment under ripple control and does not reveal the proportion connected to domestic hot water heating systems In many regions most controlled load is likely to be domestic hot water but some networks have a large proportion of other equipment under ripple control For example some rural areas have a substantial load from irrigation pumps
In summary Commerce Commission data for ICP counts with ripple control appears questionable for six of the EDBs Data reported for load size has some uncertainty due to lack of clarity over how the load size has been determined Overall there is reasonable confidence that around 50 of customers nationwide have ripple controlled hot water heating If anything this proportion may be under reported The proportion is over 70 in several regions ndash often those where ripple control of electric hot water is a condition of service
RIP
PLE
CO
NTR
OL O
F HO
T WATE
R IN
NE
W ZE
ALA
ND
- SE
PTE
MB
ER
2020
47
Appendix B - Costs of ripple control
70
Every year all 29 network companies in New Zealand must meet Commerce Commission information disclosure requirements by publishing financial technical and pricing information Technical information is published in Asset Management Plans containing statutory information disclosures which the Commerce Commission consolidates into a spreadsheet published on the Commerce Commissionrsquos website12
Forecast operational expenditure for load control is not separately reported in the EDB disclosures preventing comparisons of the cost of providing ripple control across all of New Zealand EDB Asset Management Plans include forecast expenditure for ldquosignificantrdquo load control replacement and renewal projects
Load control replacement and renewal costs found in the EDB 2019 Asset Management Plans have been extracted and shown in Table 8 The costs for Orion are not directly comparable to other EDBs listed in the table as the Orion costs include replacement of load control SCADA systems used in the Orion network and for the Upper South Island load control scheme Other EDBs planning to replace load control SCADA systems such as Wellington Electricity listed the SCADA replacement separately For some others costs for load control and network SCADA are reported as a single combined figure The 10-year forecast total capital expenditure from Table 8 totals$168M This equates to$079 per year per ICP or$170 per year per kW of controllable load
Operations and maintenance costs for ripple control only are not able to be identified from expenditure disclosure made by most EDBs The PSC survey of EDBs requested an estimate of the annual cost of providing ripple control ie capital expenditure and maintenance excluding the cost of ripple relays This produced the spread of results shown in Table 9 To supply and install standalone ripple relays costs approximately$300 which assuming a life of 30 years is$10year Adding this to the costs in Table 9 gives indicative cost ranges for providing ripple control of
bull $10ICPyear to$19ICPyear or
bull $10kWyear to$27kWyear
The alternative to load management to meet peak demand is increased peak capacity for distribution At present the peak distribution charges for Vector Orion and Wellington Electricity average at approximately$130kWyear13 compared to a mid-point of$1850kWyear for ripple control
12 Commerce Commission Nov 2019 Electricity distributorrsquos information disclosure data 2013-2019
httpscomcomgovtnz__dataassetsexcel_doc0022155047Electricity-distributors-information-disclosure-data-2013-2019xlsm
13 httpsblob-staticvectorconzblobvectormediavector-regulatory-disclosures180201_price-schedule-1_apr-2018pdf
httpswwwwelectricityconzdisclosurespricing2020document206
httpwwworiongroupconzassetsCompanyCorporate-publicationsScheduleOfDeliveryPricespdf
RIP
PLE
CO
NTR
OL O
F HO
T WATE
R IN
NE
W ZE
ALA
ND
- SE
PTE
MB
ER
2020
48
Table 8 - Capital expenditure for ripple control plant replacements and upgrades (from Asset Management Plans)
Network company
2020 $000
2021 $000
2022 $000
2023 $000
2024 $000
2025 $000
2026 $000
2027 $000
2028 $000
2029 $000
Totals $000
Vector Lines $2990 $1200 $60 $700 $30 $30 $30 $30 $30 $30 $ 5130
Orion NZ $140 $140 $1140 $890 $190 $620 $190 $190 $190 $190 $ 3880
Powerco $780 $780 $780 $ 2340
Network Tasman
$450 $350 $ 800
Top Energy $74 $708 $ 782
Unison Networks
$720 $ 720
OtagoNet $603 $603
Counties Power
$300 $200 $500
Wellington Electricity
$40 $60 $60 $60 $60 $60 $60 $80 $480
Alpine Energy $400 $ 400
Northpower $100 $100 $100 $100 $ 400
EA Networks $9 $388 $397
Horizon Energy
$259 $259
The Power Company
$72 $72
Aurora Energy $ -
Buller Electricity
$ -
Centralines $ -
Eastland Network
$ -
Electra $ -
Electricity Invercargill
$ -
Mainpower $ -
Malborough Lines
$ -
Nelson Electricity
$ -
Network Waitaki
$ -
Scanpower $ -
The Lines Company
$ -
Waipa Networks
$ -
WEL Networks
$ -
Westpower $ -
Total $4834 $2260 $2140 $2083 $2718 $710 $1018 $480 $300 $220 $16763
RIP
PLE
CO
NTR
OL O
F HO
T WATE
R IN
NE
W ZE
ALA
ND
- SE
PTE
MB
ER
2020
49
Vect
or L
ines
Orio
n N
Z
Pow
erco
Net
wor
k Ta
sman
Top
Ener
gy
Uni
son
Net
wor
ks
Ota
goN
et
Coun
ties
Pow
er
Wel
lingt
on E
lect
ricity
Alpi
ne E
nerg
y
Nor
thpo
wer
EA N
etw
orks
Hor
izon
Ene
rgy
The
Pow
er C
ompa
ny
Auro
ra E
nerg
y
Bul
ler E
lect
ricity
Cent
ralin
es
East
land
Net
wor
k
Elec
tra
Elec
tric
ity In
verc
argi
ll
Mai
npow
er
Mal
boro
ugh
Line
s
Nel
son
Elec
tric
ity
Net
wor
k W
aita
ki
Scan
pow
er
The
Line
s Co
mpa
ny
Wai
pa N
etw
orks
WEL
Net
wor
ks
Wes
tpow
er
$0
$1000000
$2000000
$3000000
$4000000
$5000000
$6000000
Figure 15 - Planned capital expenditure on ripple control plant upgrades and replacements from 2020 to 2029
RIP
PLE
CO
NTR
OL O
F HO
T WATE
R IN
NE
W ZE
ALA
ND
- SE
PTE
MB
ER
2020
50
Network Company
Load (MW) ICP Costyr CostICPyr CostkWyr
Eastland Networks
1802 14430 $20000 $139 $111
Marlborough Lines
923 18956 $30000 $158 $325
Network Tasman 1500 33336 $250000 $750 $1667
Northpower 1530 35700 $86000 $241 $562
Orion 15000 164321
Powerco 17852 178516 $930000 $521 $521
Scanpower 300 4761 $20000 $420 $667
Vector 15672 214690
WEL Networks 4700 53479 $500000 $935 $1064
Wellington Electricity
5000 80000 $15000 $019 $030
Table 9 - Annualised cost estimates to provide ripple control excluding ripple relays
RIP
PLE
CO
NTR
OL O
F HO
T WATE
R IN
NE
W ZE
ALA
ND
- SE
PTE
MB
ER
2020
51
Appendix C - EDB Case studies
80
Case study 1 - Eastland Network
Introduction to Eastland NetworkEastland Network distributes electricity to approximately 19600 domestic consumers and 6000 non-domestic consumers in Gisborne Wairoa and the east coast Eastland owns and maintains the poles wires and underground cabling as well as since March 2015 the towers and poles that connect the region to the national grid
Electricity demand in the Eastland region has been steady in recent years with small declines in rural demand offset by small increases in towns Eastland services no large industrial loads
Eastland Network is part of Eastland Group wholly owned by the Eastland Community Trust that also owns Eastland Port Gisborne Airport and Eastland Generation which produces electricity from hydro diesel and geothermal plants
Ripple control capability and conditionEastland estimates it has approximately 18 MW of load connected to ripple control (The exact figure is uncertain as the extent of ripple was last accurately assessed in 2000) The vast majority (at least 95) of connected load is domestic hot water Eastland estimates that around one quarter of domestic hot water is not connected to ripple control most of which is thought to be gas heating
Eastland owns all ripple relays in its network outside Wairoa accounting for about 73 of relays at customersrsquo sites Ripple relays in the Wairoa area are owned by third parties In recent years many relays have been removed by retailers as they install smart meters especially in Gisborne area Only around 50 of Gisborne Wairoa and East Coast properties have a smart meter the lowest penetration In New Zealand
RIP
PLE
CO
NTR
OL O
F HO
T WATE
R IN
NE
W ZE
ALA
ND
- SE
PTE
MB
ER
2020
52
Table 10 - Ripple control capability of Eastland Network
Total network peak demand (maximum coincident demand14)
59 MW
Total network load connected to ripple control18 MW (figures from 2000)
Network maximum coincident domestic demand 47 MW
Network domestic water heating load connected to ripple control
Eastland cannot differentiate between domestic and commercial water heating control
Network total domestic water heating load not connected to ripple control
6 MW (estimate)
Load in your region can be reduced using ripple control
26 MW (Gisborne- 2 MW Wairoa - 06 MW)
Domestic hot water heating as proportion of network ripple control
95
Total number of Installation Connection Points (ICPs) 25569
Total ICPs with ripple control 18628
Total domestic ICPs 19555
Domestic ICPs with ripple-controlled water heating 17254
14 Maximum coincident demand is the peak load that has been recorded during a reporting period ndash usually 12 months This is less than the maximum
possible load because everything in the network is never drawing power at the same time
RIP
PLE
CO
NTR
OL O
F HO
T WATE
R IN
NE
W ZE
ALA
ND
- SE
PTE
MB
ER
2020
53
Box 2 - Eastlands ripple control plant ndash Asset Health IndicatorsNetwork companies report on the health of their assets in their information disclosures according to the Electricity Engineers Association (EEA) Asset Health Indicator Guide (AHI 2016) The guide is intended to help network companies identify assets that need replacing and plan upgrades
Eastlandrsquos ripple control plant is fully working but is end of life with lack of readily available spares All of Eastlandrsquos controlled water heating load is dependent on end of life ripple plant
Note that this health assessment covers the central ripple control plant owned by Eastland Networks not the ripple relays located at customer premises some of which are owned by others (ie retailers and Metering Equipment Providers)
Table 11 - Eastland Networks central ripple control plant health assessment
Asset Health Indicator of ripple control central plant
H5 As new condition ndash no drivers for replacement 0
H4Asset serviceable - no drivers for replacement normal in-service deterioration
0
H3End-of-life drivers for replacement present increasing asset related risk
0
H2End-of-life drivers for replacement present high asset related risk
100
H1 Replacement recommended 0
RIP
PLE
CO
NTR
OL O
F HO
T WATE
R IN
NE
W ZE
ALA
ND
- SE
PTE
MB
ER
2020
54
Current application of ripple controlEastland uses ripple control of hot water on weekdays for 2 to 3 months during winter with maximum use in August On these days the load control system turns off 40 of the Gisborne relays at around 430 pm to reduce fast-building demand The company always limits off periods for heating water to 3 hours in the morning and 3 hours in the evening Eastland estimates based on the visual projection of load graphs it can reduce peak loads by around 26 MW using ripple control (2 MW in Gisborne and 06 MW in Wairoa) This represents less than 5 of peak loads ndash a lower proportion than many other network companies The ripple control systems turn hot water systems on and off in large blocks of roughly 1 MW
For about one month during winter network load management is via ripple control and diesel generators Eastland Generation owns several 1 MW diesel generators around the Tairawhiti and Wairoa regions which are used mostly to manage peak loads in winter These diesel generators are turned on automatically when the load reaches a pre-determined threshold and run for at least 2 to 4 hours
Diesel generators are designed to run at maximum output not partial loads Eastland therefore deploys ripple control for 20 to 30 minutes while its generators are ramping up and for a similar period while they are ramping down Ripple control reduces the periods when this diesel generation is required Without ripple control the diesel generators would be required throughout winter
The overriding motivation for Eastland to deploy ripple control is to manage winter peak loads Eastland does not use ripple control for many of the reasons cited by other network companies such as maintaining network security alleviating distribution network constraints deferring capital investment emergency load management or supporting retailer tariff schemes
Eastlandrsquos use of ripple control does reduce its transmission charges ndash but as a side-effect rather than a direct motivation Transpowerrsquos method of allocating charges to distribution companies (based on Regional Coincident Peak Demand) is not a sufficient incentive for Eastland to reduce loads because it contributes only a small amount to the regional load In any case Eastland is able to pass transmission charges onto the retailers (and therefore electricity customers)
About once every two years Eastland is asked to carry out emergency load shedding to relieve transmission constraints However it uses its diesel generators to support this load shedding rather than ripple control Ripple control would only be useful during an emergency if it coincided with a period when many customers were heating water which isnrsquot always the case
From 2003 to 2005 as part of a national drive to conserve energy Eastland used ripple control to switch off water heaters for two 3-hour periods per day Eastland considers that this measure only saved energy to the extent that customersrsquo water was not as hot as normal R
IPP
LE C
ON
TRO
L OF H
OT W
ATER
IN N
EW
ZEA
LAN
D - S
EP
TEM
BE
R 20
2055
Does ripple control deliver its potential benefitsSection 22 of this report outlines six potential benefits of using ripple control Table 3 summarises whether each of these benefits is achieved in the case of Eastland Network
Table 12 - The benefits of Eastlandrsquos use of ripple control
Potential benefit Benefit delivered
Reducing network costs
No Used only to manage winter peaks in conjunction with embedded diesel generation
Reducing domestic energy bills
Yes To the extent that reduces transmission charges that Eastland passes onto retailers
Reducing generation costs
Yes Without ripple control embedded diesel generators would be used for longer periods
Supporting reliability of the electricity system
No
Power quality support No
Supporting the clean energy transition
Yes Without ripple control embedded diesel generators would be used for longer periods
Technical problems with ripple control When retailers replace consumersrsquo meters there have been issues with incorrectly wired ripple relays In cases where consumers pay an electrician to fix this problem Eastland reimburses the consumer and bills the retailer There is a lack of skills in the Eastland region to maintain and repair ripple control infrastructure meaning Eastland would struggle to resolve any major technical problems
Ripple control rarely causes problems where ripple control interacts with Eastland consumersrsquo equipment in undesirable ways The only major technical problems with ripple control occurred more than a decade ago For example in 2000 Eastland briefly used ripple control in Mahia to enable a retailer to carry out time-shifting Load fluctuation then caused the system to trip so Eastland discontinued the time shifting and stopped using load control in Mahia In 2001 weak signalling issues in the Mahia area prompted Trustpower to remove all their ripple relays
Barriers to the more effective use of ripple controlEastland has very little financial incentive to continue maintaining and investing in ripple control Eastlandrsquos existing dispatch system for ripple control and diesel generation does not anticipate load changes correctly and would need additional investment to make software improvements Its main incentive is to meet government and regulatorsrsquo expectations that network companies operate efficiently Eastland believes that abandoning load control could harm the companyrsquos image Without this motivation Eastland might stop investing in ripple control altogether
Even so load control is becoming less important for Eastland The company has found diesel generators to be a more flexible alternative for managing peak demand The generators also reduce Eastlandrsquos transmission charges
Diesel generators provide back up if a line goes down and can reduce the need to upgrade or build new lines In Wairoa Eastland has found the 5 MW embedded hydropower plant to be more effective at managing loads than ripple control
Eastland does not work with retailers to maximise benefits from ripple and has no incentives or requests to do so One barrier to using ripple control for time of use tariffs is that it requires Eastland to reprogram individual relays at a cost of$100 to$200 per relay
RIP
PLE
CO
NTR
OL O
F HO
T WATE
R IN
NE
W ZE
ALA
ND
- SE
PTE
MB
ER
2020
56
Future approaches to ripple control and demand management
Use of ripple control is slowly declining due to removal by retailers as well as increasing installations of rooftop solar Solar installers often move the hot water system to the main meter disconnecting it from ripple control
In future Eastland hopes to see responsibility for load control move to retailers Retailers will use energy management systems involving smart meters and individual appliances that respond to load and price signals This may replace the need for traditional ripple control as Eastland believe it makes no sense to have two load control systems operating simultaneously Ripple signals may still be useful as the means of communicating with smart appliances
However Eastland says smart demand management has been promised for several years without any real progress This leaves Eastland in an uncertain position regarding the future of ripple control
A few years ago Eastland explored the option of setting up a company to install smart meters and providing energy management services to individual customers However the initiative was abandoned and Eastland now believes its best option is to continue managing loads using small generators
RIP
PLE
CO
NTR
OL O
F HO
T WATE
R IN
NE
W ZE
ALA
ND
- SE
PTE
MB
ER
2020
57
Case Study 2 - Orion Group
Introduction to Orion
Orion owns and operates the electricity distribution network that provides power to central Canterbury from the Waimakariri River in the north to the Rakaia River in the south Orion distributes electricity to more than 200000 homes and businesses In 2019 total energy distributed across Orionrsquos network was 3317 GWh an increase of 8 GWh on 2018
Orion is a community-owned entity with two key shareholders ndash Christchurch City Council and Selwyn District Council
Ripple control capability and conditionThe vast majority of residential water heating load in Orionrsquos region can be turned on and off by ripple control This gives Orion significant capability to reduce peak demand by turning off hot water systems Domestic water heating accounts for 90 of Orionrsquos controllable load
The total amount of electrical load that Orion can control varies throughout the day week and year Controllable load peaks at about 57 MW on cold winter mornings Domestic water heating can be turned off using ripple control for up to 4 hours and equates to about 10 of demand (Table 13) Orion also has 190 MW of load connected to ripple control for the purposes of switching on appliances (mostly hot water) during low tariff periods at night
Orion operates two ripple coding systems
bull Telenerg based on 11 kV injectors using a 175 Hz carrier frequency which operates mainly in the urban Christchurch and Lyttelton areas and
bull Decabit based mainly on 33 kV injectors using a 317 Hz carrier frequency which operates in the rural Canterbury and Banks Peninsula areas
This plant is generally in a good condition (Box 3) and present few technical problems Each plant communicates with a few thousand consumers though specific channels could be used to reach just a few hundred consumers The timetables for ripple control for tariff switching are programmed into the ripple control plant and reassessed every year The timetables can also be switched by the Orion SCADA system
Orion believes that the success of its ripple control systems relies just as much on its people and processes as it does on hardware and software
Ripple control ownershipOrion owns and operates its ripple injection plant Ripple relays at consumersrsquo sites are all owned by either retailers or Metering Equipment Providers (MEPs) Most dwellings have two electricity meters ndash one for hot water and one for all other appliances A few years ago without consultation a retailer removed 6000 ripple relays from Orionrsquos network as part of a program installing new meters Ownership of meters at the sites where these relays were removed has changed again since the removal Orion does not know if the ripple relays have been replaced but in the absence of clear incentives for retailer to use load control it is unlikely
RIP
PLE
CO
NTR
OL O
F HO
T WATE
R IN
NE
W ZE
ALA
ND
- SE
PTE
MB
ER
2020
58
Table 13 - Ripple control capability of Orion Network
Total network peak demand (maximum coincident demand15)
610 MW
Total network load connected to ripple control and load that can be reduced using ripple control
(A simple figure for load reduction is not available All loads are not necessarily available at the same time and have seasonal and weather dependencies)
250 MW made up of
bull Residential water heating 57 MW connected most of which is available to reduce peak loads
bull Business water heating 3 MW connected most of which is available to reduce peak loads
bull Night load tariff switching 190 MW in total If this load was not controlled it would add approx 73 MW to load
bull Emergency control All above load can be switched off in an emergency Effectiveness depends on the time of occurrence of the emergency as some load may already be switched off due to normal ripple control action
Network maximum coincident domestic demand)Orion cannot separate domestic component of peak demand
Network total domestic water heating load not connected to ripple control
10
Domestic hot water heating as proportion of network ripple control
90
Total number of Installation Connection Points (ICPs) 207521
Total ICPs with ripple control 169000
Total number of domestic ICPs 178000
Domestic ICPs with ripple controlled water heating 160000
15 Maximum coincident demand is the peak load that has been recorded during a reporting period ndash usually 12 months This is less than the maximum
possible load because everything in the network is never drawing power at the same time
RIP
PLE
CO
NTR
OL O
F HO
T WATE
R IN
NE
W ZE
ALA
ND
- SE
PTE
MB
ER
2020
59
Box 3 - Orionrsquos ripple control plant ndash Asset Health IndicatorsEDBs report on the health of their assets in their information disclosures in accordance with the Electricity Engineers Association (EEA) Asset Health Indicator Guide (AHI 2016) The guide is intended to help electricity network companies identify assets that need replacing and plan upgrades
Orionrsquos asset health disclosure shows most of its ripple control plant to be in good condition although 16 are nearing end of life (Table 14) As ripple control is an important part of Orionrsquos network management strategy the company will continue to invest in replacement of end of life ripple control equipment
Note that this health assessment covers the central ripple control plant owned by Orion not the ripple relays located at consumer premises which are owned by retailers and MEPs
Table 14 - Orion Group central ripple control plant health assessment
Asset Health Indicator of ripple control central plant
H5 As new condition ndash no drivers for replacement 9
H4Asset serviceable - no drivers for replacement normal in-service deterioration
75
H3End-of-life drivers for replacement present increasing asset related risk
16
H2End-of-life drivers for replacement present high asset related risk
0
H1 Replacement recommended 0
RIP
PLE
CO
NTR
OL O
F HO
T WATE
R IN
NE
W ZE
ALA
ND
- SE
PTE
MB
ER
2020
60
Current application of ripple controlOrion operates the Upper South Island Load Management (USILM) Project a collaboration between eight EDBs to manage the peak loads on the transmission grid During periods of high electricity demand these companies use ripple control to manage domestic water heating throughout the region In a grid emergency16 the system can also reduce water heating load rapidly to help avoid power outages The USILM Project has led to a reduction in transmission charges and the deferral of investment in new transmission capacity
Orion uses ripple control of domestic hot water to reduce peak load on about 30 days per year mostly in winter Orion also uses ripple control for tariff switching emergency control and high consumption signalling
By using ripple control Orion can maintain reliability of supply and keep consumer bills lower Orion considers that its use of ripple control provides a major benefit to its consumers and the electricity system Orion says that benefitting consumers who are the ultimate owners of the company is their main incentive for deploying ripple control
Ripple control for reducing peak load Orion aims to keep total load below a network limit of 580 MW This limit is reviewed frequently and may change based on its effectiveness When the load approaches this level Orion sends ripple control signals to switch off hot water heaters For example if an excess load of 2 MW is expected the system will send an ldquooffrdquo signal that it estimates will reduce the load by 2 MW Once load levels start to fall appliances are switched on again Orion has about 57 MW of residential water heating connected to ripple control (Table 13) and can reduce peaks by just under this amount In addition Orion can turn off approximately 3 MW of business water heating
On days of high energy use water heaters are often switched off for up to four hours during the morning or
evening with four hours for re-heating in between Orion aims to limit the time domestic water heaters are turned off to no more than four hours in any eight-hour period to minimise impact on the consumersrsquo availability of hot water Business water heaters are turned off for only two hours During peaks that last longer than four hours Orion rotates through the ripple channels at least every 10 minutes so that the accumulated off time of each water heater is not too long
Figure 16 shows Orionrsquos peak load on 1 July 2020 a particularly cold winterrsquos day with high consumption throughout the day The red line shows what would have occurred in the absence of control The green line is what actually happened ndash both morning and evening peaks were flattened using control measures including ripple control of domestic hot water With ripple control being active over approximately 12 hours of the day the load limit was adjusted while ripple control was in use and ripple channels were cycled to avoid individual water heaters being turned off for excessive periods of time
16 Transpower may declare a Grid Emergency when problems arise and it believes it is unable to continue to keep the
power system operating in the required stable state Transpower may then request EDBs to assist by quickly reducing load
RIP
PLE
CO
NTR
OL O
F HO
T WATE
R IN
NE
W ZE
ALA
ND
- SE
PTE
MB
ER
2020
61
700
600
500
400
300
200
100
0
Time of day
Orion network load and load management
Percent shed
Perc
ent s
hed
Load
ing
(MW
)
12am 1a
m
2am
3am
4am
5am
6am
7am
8am
9am
10am
100
90
80
70
60
50
40
30
20
10
0
11am
12pm 1p
m
2pm
3pm
4pm
5pm
6pm
7pm
8pm
9pm
10pm
11pm
12pm
Peak periodControl period Limit Uncontrolled loadNetwork load
Figure 16 - Orion network load and load management on a winterrsquos day (172020)
(Source Orion Load Management Dashboard (httpsonlineoriongroupconzLoadManagement)
Figure 16 - Orion network load and load management on a winterrsquos day (172020)
Ripple control to align with off-peak tariffs Residential electricity consumers can choose cheaper electricity tariffs where appliances such as water cylinders and night store heaters are operated outside peak periods For example on the most common night-only tariff heating occurs overnight and is then off all day (Other tariffs are peak control night only with afternoon boost night only with weekend boost and emergency control)
Orion sends fixed-time ripple control signals every day to support these tariffs This permanently shifts load away from the daytime periods when peaks occur Without night control of hot water Orion estimates the coincident network peak would be 73 MW higher Orion uses ripple control to stagger the switching times for night heating of hot water to limit the step sizes of load change across its network
Orion receives no incentives from retailers for providing this service Orion aims to limit load without breaching service level targets agreed with electricity retailers and Transpower This involves a challenging trade-off between costs and service quality
Emergency control Orion also uses ripple control for emergency load shedding17 on a small but growing number of domestic water heaters Consumers signed up to the emergency control option account for less than 1 MW of load (Table 13) Orion only interrupts
water heating supply to these consumers to prevent or limit outages during emergency capacity shortages Residential consumers can expect fewer than two emergency events per year lasting up to two hours Retailers offer no discounts for the emergency control option and it is the closest Orion offer to continuous water heating
High consumption signalling Orion use ripple control to signal higher network energy consumption periods to some commercial consumers These consumers then have the option to use their own load control systems to minimise their electricity costs Their responses to high consumption signals include load reduction load shifting and starting up on-site diesel generators The cumulative impact of these responses varies but is approximately 25 MW High consumption signalling using ripple control occurs on fewer than 30 days per years High energy consumption links to increased transmission and distribution costs and but not directly to energy prices
Orion does not use ripple control to participate in the reserve market for fast interruptible load response as any ripple control system is too slow18 Orion also uses ripple control for street lighting industrial price signalling and irrigation load control (emergency only)
RIP
PLE
CO
NTR
OL O
F HO
T WATE
R IN
NE
W ZE
ALA
ND
- SE
PTE
MB
ER
2020
62
Does ripple control deliver its potential benefitsSection 22 of the main report outlines six potential benefits of using ripple control Table 15 summarises whether each of these benefits is achieved in the case of Orion
Table 15 - The benefits of Orionrsquos use of ripple control
Potential benefit Benefit delivered
Reducing network costsYes Ripple control reduces network costs and defers investment in distribution and transmission upgrades
Reducing domestic energy billsYes because Orion charges less due to ripple control but Orion cannot be sure that savings flow through to the consumers whose hot water is controlled and not also those with uncontrolled electric water heating
Reducing generation costsYes as required peak generation reduces The company believes current spot prices do not always reflect generation cost or actual loads
Supporting reliability of the electricity system
Yes Improves reliability and n-1 security
This benefit is linked to use of ripple control by all EDB participants in the Upper South Island Load Management Project
Power quality support On occasion automatic ripple response has kept system within voltage stability limits This benefit is linked to use of ripple control by all EDB participants in the Upper South Island Load Management Project
Supporting the clean energy transition
Ripple control supports the clean energy transition allowing control of the peak demand contribution from hot water to help match the variable output of clean energy sources embedded in the network such as roof top solar power
17 Emergency load shedding is a deliberate action taken to selectively reduce load in a network when a power supply problem arises Without emergency load
shedding power supply problems may cause more widespread and indiscriminate power cuts which take longer to recover from
18 In some other NZ regions pilot wire water heating control has been used for interruptible load control as it has faster signalling than ripple control See
also WEL Networks case study for their method of participating in the reserve market
N-1 security means the electricity system is in a secure state and for any one credible contingency event it would move to a satisfactory state
RIP
PLE
CO
NTR
OL O
F HO
T WATE
R IN
NE
W ZE
ALA
ND
- SE
PTE
MB
ER
2020
63
Technical problems with ripple control Orion has few technical problems with ripple control Orionrsquos ripple injection plants send nightly confirmation signals to ensure hot water systems are turned back on Additional confirmation signals can also be sent when problems arise There are occasional problems during maintenance of the distribution network when ripple signals must reach further through the network
Sometimes ripple relays fail or difficulties arise when a consumerrsquos hot water needs change Consumers often contact Orion with these issues but Orion refers consumers to their retailer as it is the responsibility of the ripple relay owners to fix In rare cases where the problem does relate to network signalling Orion compensates the consumer for any electrical work they have paid for
Barriers to the more effective use of ripple controlIt is a condition of Orionrsquos delivery service that its consumers with electric hot water heating have a ripple relay installed This requirement applies to all new connections and to all existing connections that already have ripple control Nevertheless the size of controllable domestic hot water load is slowly declining As mentioned above there have been instances of retailers removing ripple relays from Orionrsquos network Also the installation of rooftop solar is often accompanied with switching the hot water system to the main meter by-passing ripple control
Orion has very few business incentives to use and maintain ripple control as network savings are passed onto retailers (and hopefully consumers) In fact there is a disincentive as without ripple control Orion would need to upgrade its network and could make a return on this investment and grow its business Orion avoids this approach as it would be to the detriment of its consumers
In the absence of any national or industry-wide strategy for load management there is a lack of alignment about how to apply ripple control of hot water Ripple control favours some market participants and disadvantages others such as generators Increasingly electricity retailersrsquo pricing plans fail to reward consumers for ripple control of their water heating For example some retailers offer power at a flat rate giving the consumer no incentive to avoid heating water at peak times
In 2021 the Electricity Authority is planning to introduce default distributor agreements under which access to controllable loads will be opened up to a competitive market This will reduce Orionrsquos ability to control loads and retailers may switch consumers onto uncontrolled load to avoid the cost of maintaining ripple relays Orion believes that for load control including ripple control to work well it needs a central controller Furthermore if Orion loses central control of load management it would remove a major incentive for continued investment in its ripple control infrastructure
Future approaches to ripple control and demand managementRipple control of hot water is a simple low-cost technology that works well for Orion and its consumers It probably already operates close to its maximum potential in terms of managing Orionrsquos peak loads
However as more New Zealanders adopt technologies such as roof top solar and electric vehicles it will become more important to manage the electricity consumption and production at the level of individual consumers so that the aggregated effect can be properly controlled Ripple control does not currently provide this level of control However in the future Orion sees ripple signals interacting with distributed energy resource management systems (DERMS) and the company has already carried out a small trial with a retailer using ripple control with DERMS
RIP
PLE
CO
NTR
OL O
F HO
T WATE
R IN
NE
W ZE
ALA
ND
- SE
PTE
MB
ER
2020
64
Ripple control could also support the integration of more variable renewable energy into the grid Domestic hot water tanks represent a large reservoir of energy which could be used to balance the intermittent output of solar and wind energy However this will require DERMS that offer good control of hot water heating The systems Orion has explored so far are not able to provide this
One drawback of ripple control is that it is one-way communication Orion does not know if signals are received by individual relays and cannot diagnose problems A future demand management system should involve two-way communications Orion does not regard the Internet as a suitable alternative as they observed it to be less reliable than ripple control signals during the Christchurch earthquake emergency situations
Orion believes that a successful future for ripple control of hot water depends on an industry-wide strategy and supportive regulatory system This system would set appropriate incentives for all market participants and leave overall control in the hands of distribution companies
RIP
PLE
CO
NTR
OL O
F HO
T WATE
R IN
NE
W ZE
ALA
ND
- SE
PTE
MB
ER
2020
65
Case study 3 - Powerco
Introduction to PowercoPowerco distributes electricity to more than 340000 urban and rural households businesses and major industrial and commercial sites in New Zealands North Island Powercorsquos networks are in the Taranaki Wanganui Rangitikei Manawatu and Wairarapa regions including the urban centres of New Plymouth Wanganui Palmerston North and Masterton as well as Tauranga and the surrounding rural areas and the eastern and southern Waikato Thames and Coromandel regions
Powerco is New Zealandrsquos largest electricity distributor in terms of network length (28000km) and has the second largest number of electricity connections Total energy distributed across Powercorsquos electricity networks was 5099 GWh in 2019 up from 4809 GWh on 2017
Powerco is a privately owned network company which also operates a gas distribution network
Ripple control capability and conditionPowerco has significant capability to reduce peak demand using ripple control connected to domestic hot water Powerco estimates the maximum connected load for water heating as 280 MW (Table 16) The vast majority (about 95) of this load is domestic Ripple control provides fast response (under 10 seconds) and is extremely reliable and effective
The meter registry indicates that 194000 consumers in Powercorsquos network have controllable load (Table 16) The actual number is lower as not all these consumers are currently connected to ripple control Powerco cannot quantify these unconnected consumers as the meter registry does not differentiate between controlled and uncontrolled domestic water heating There is also no mechanism for reporting the removal of a ripple relays or the replacement of an electric water heater with another type of system Table 16 presents Powercorsquos estimate of its total controllable load as 155 MW - an estimate based on assuming an average of 08 kW for
all 194000 consumers recorded as having controllable load
For night-rate heating Powercorsquos estimated controllable load is 10 to 15 MW which includes both space heating (night storage) and larger domestic water heating systems Powerco uses different ripple control signalling channels for tariff switching and peak demand control
Ripple control ownershipPowerco owns and operates 26 ripple injection plants (audio frequency load control transmitters) located close to their related Grid Exit Points (GXP)19 (The exception is Waverley GXP which has no load control signalling capability)
Powerco has installed dual frequency systems to accommodate older ripple relays The company uses four signalling frequencies (217 283 317 and 383 Hz) which have all proven to be reliable in a 50 Hz power system Powerco transmits signals using the DECABIT Semagyr S50a and S52 and Rythmatic formats Powerco is planning to migrate all ripple signalling to DECABIT as Powerco has found it to be the most secure fast reliable and flexible format in their network
The majority of ripple relays on Powercorsquos network are owned by third parties mostly Metering Equipment Providers (MEPs) Powerco owns some pilot wire circuits along with a small number of ripple relays at the control points of these circuits These relays mostly contain multi-channel receivers with separate channels for street lighting control and hot water pilot wire control Additional interposing relays are installed on some consumers meter boards and are owned by MEPs
19 A Grid Exit Point (GXP) is defined in the Electricity Industry Participation Code as any point of connection on the grid at which electricity
predominantly flows out of the grid Typically a GXP is the point of connection in a Transpower substation for a cable or transmission line feeding power to a
network belonging to an Electricity Distribution Business
RIP
PLE
CO
NTR
OL O
F HO
T WATE
R IN
NE
W ZE
ALA
ND
- SE
PTE
MB
ER
2020
66
Table 16 - Ripple control capability of Powerco
Total network peak demand (maximum coincident demand )20 812 MW
Total network load connected to ripple control 280 MW
Network maximum coincident domestic demandPowerco cannot separate domestic component of peak demand21
Network domestic water heating load connected to ripple control
Powerco does not differentiate between domestic water heating control and other categories of load control
Network total domestic water heating load not connected to ripple control
Unknown
Load in region that can be reduced using ripple control
155 MW (estimate)
Domestic hot water heating as proportion of network ripple control
95 (estimate)
Total number of Installation Connection Points (ICPs) 344708
Total ICPs with ripple control194790 (according to meter registry data)
Total domestic ICPs 280233
Domestic ICPs with ripple-controlled water heating 184789 (according to meter registry data)
20 Maximum coincident demand is the peak load that has been recorded during a reporting period ndash usually 12 months This is less than the maximum
possible load because everything in the network is never drawing power at the same time
21 It could be done by analysing a significant quantity of data from Advanced Meters though retailers are reluctant to divulge this information
RIP
PLE
CO
NTR
OL O
F HO
T WATE
R IN
NE
W ZE
ALA
ND
- SE
PTE
MB
ER
2020
67
Box 4 - Powercorsquos ripple control plant ndash Asset Health IndicatorsNetwork companies report on the health of their assets in their information disclosures in accordance with the Electricity Engineers Association (EEA) Asset Health Indicator Guide (AHI 2016) The guide is intended to help electricity companies identify assets that need replacing and plan upgrades
Over the last 11 years Powerco has focused on modernising and upgrading the older technology Injection plants that were identified in previous Asset Management Plans as outdated overloaded and presenting a high risk of failure with a lack of availability of technical support This renewal programme has resulted in a system that while still containing some older technology plants is supported with readily available spares and technical support contracts The overall health of Powercorsquos ripple control assets is of a high standard
Powerco continues to operate ten phase distortion CycloControl transmitters on the Huirangi and Stratford networks (CycloControl is an outmoded signalling method with similar functions to ripple control) Technical support and spare parts are no longer available for these transmitters so they are being run until they fail The network area with the CycloControl system has been overlaid by a modern system which now provides reliable and supportable load control in this network area Any CycloControl receivers found by MEPs during routine meter replacements etc are replaced with modern ripple control receivers with DECABIT coding
Note - This health assessment covers only the central ripple control plant owned by Powerco and not the ripple relays located at consumer premises which are owned by MEPs Powerco has been able to influence MEPs to upgrade ripple relays as part of meter replacement programmes
Table 17 - Powercos central ripple control plant health assessment
Asset Health Indicator of ripple control central plant
H5 As new condition ndash no drivers for replacement 58
H4Asset serviceable - no drivers for replacement normal in-service deterioration
42
H3End-of-life drivers for replacement present increasing asset related risk
0
H2End-of-life drivers for replacement present high asset related risk
0
H1 Replacement recommended 0
RIP
PLE
CO
NTR
OL O
F HO
T WATE
R IN
NE
W ZE
ALA
ND
- SE
PTE
MB
ER
2020
68
Current application of ripple control Powercorsquos application and maintenance of ripple control is motivated largely by a desire to be a responsible participant in New Zealands electricity system The main objectives for Powercorsquos activation of ripple control are described below
Minimising peak loads to alleviate network constraints Powerco uses ripple control on about 20 days each year to reduce peak demand Occasionally Powerco uses ripple control of hot water in response to a direct request from Transpower in order to maintain network security and reliability It is also deployed to meet any demands from the Electricity Authority or other legislative bodies to limit demand during events such as electricity shortages or low frequency events
Using ripple control to reduce peak loads helps maintain network security (at n-1 level) and so reduces the likelihood of outages assisting with meeting supply reliability obligations It also helps Powerco carry out essential maintenance without interrupting the service to consumers
Ripple control of domestic hot water to control peak demand normally occurs during winter (Outside of winter Powerco sometimes uses ripple control to manage demand from dairy farms on GXPs with a high proportion of dairy farm load) It would be unusual for Powerco to use ripple control in the morning and afternoon of the same day Ripple control of domestic hot water is available and operates over the entire Powerco network area
Ripple control allows Powerco to reliably handle peak load on sub-transmission networks that are close to their maximum capacity This has allowed the company to defer upgrades potentially costing tens of millions of dollars thus reducing costs passed on to consumers
The estimated size of the hot water load to be shed or restored is determined by a load control algorithm This algorithm takes account of factors including current load time of day season time on since last off time time off during the current time period and social behaviour patterns such as school holidays Powerco believes consumers should not notice any impacts from ripple control so limits its use to a total of 3 to 4 hours off time per consumer per day
Aligning with off-peak tariffs Powerco also uses ripple control every day to align with retailersrsquo discounted tariffs for consumers with night-rate controlled loads This ensures consumersrsquo controlled loads (which may include water heating) can only be operated between 11pm and 7am to coincide with lower night-rate tariffs Some off-peak tariffs also include a ldquoboostrdquo period during the early afternoon intended for water heating
In the past retailers paid Powerco to turn off hot water during peak demand periods Powerco considered that some of these lsquooffrsquo periods were too long and the company now receives no incentives from retailers to deploy ripple control
Reducing Transpowerrsquos charges is not an objective of Powercorsquos use of ripple control This is partly because Powerco consider their load as too small to have a large effect on the peak load in the Lower North Island region (the basis for Powercorsquos transmission charges)
Powerco used to deploy ripple control to participate in the fast interruptible reserve market However the company has decided that the potential revenue from this market does not justify the risks and technical complications of participation
RIP
PLE
CO
NTR
OL O
F HO
T WATE
R IN
NE
W ZE
ALA
ND
- SE
PTE
MB
ER
2020
69
Does ripple control deliver its potential benefitsSection 22 outlines six potential benefits of using ripple control Table 18 summarises whether each of these benefits is achieved in the case of Powerco
Table 18 - The benefits of Powercorsquos use of ripple control
Potential benefit Benefit delivered
Reducing network costsYes ndash by improving asset utilisation and deferring investment in both transmission and distribution networks
Reducing domestic energy billsYes ndash by enabling night-rate tariffs (Though modern meters could also do this without ripple control)
Reducing generation costsYes ndash this is likely to be an indirect benefit of Powercorsquos use of ripple control through lower use of peaking generation plants
Supporting reliability of the electricity system
Yes ndash when responding to requests from Transpower and to enable network maintenance
Power quality support No Although may indirectly reduce risk of voltage problems Ripple control could be used to correct under-frequency problems but this would require MEPs to program ripple relays differently
Supporting the clean energy transition
Not deliberately but ripple control can play a supporting role by using loads with suitable energy storage to lower peak demands to assist matching to the variable output of clean energy sources such as rooftop solar generation eg hot water systems as a source of thermal energy storage or irrigation schemes where the energy is stored as moisture in the soil
Supporting the clean energy transitionRipple control supports the clean energy transition allowing control of the peak demand contribution from hot water to help match the variable output of clean energy sources embedded in the network such as roof top solar power
RIP
PLE
CO
NTR
OL O
F HO
T WATE
R IN
NE
W ZE
ALA
ND
- SE
PTE
MB
ER
2020
70
Technical problems with ripple control Sometimes ripple control problems arise on Powercos network when loads are turned off and require manual intervention to restore These problems are more often due to operational missteps rather than faulty equipment A busy operator could set controls and then forget to reset them Occasionally there may be failures in the communication system between the SCADA Master Station and the injection plant controller
Most of these issues are addressed by monitoring of the channel status at the injection plants With loss of signal over a pre-set time algorithms in newer ripple relays can be set to return output switches to the lsquoonrsquo state or revert to timetable mode thus further enhancing monitoring of system operations and reducing outage times to a minimum
Pilot wires can cause reliability problems that are unrelated to ripple control These problems include faulty joints conductor clashing and incorrect fuses Pilot wires also limit the functionality of load control and Powerco believes that pilot wire unreliability may contribute to negative attitudes towards ripple control Powerco is decommissioning pilot wire as part of its scheduled renewal programmes
There are few problems related to the interaction of consumer equipment with ripple control within Powercorsquos network Powerco has standardised ripple frequencies to within the 200 to 400Hz range making them less susceptible to such problems Powercorsquos Network Connection Standard requires the installation of blocking filters on the network side of any consumer loads that may otherwise absorb or interfere with ripple control signals
Powerco takes no responsibility for faulty ripple relays as it does not own them Powerco believes retailers and MEPs rarely check the health of their relays which can be set to incorrect channels as a result of unreported changes in consumersrsquo loads or shorted out or stuck in the lsquoonrsquo position It is widely recognised within the industry that such problems resulting in a control being always on are seldom reported
When consumers do report a problem their retailer will lodge a fault call with Powerco If the fault is thought to be network related Powerco sends a faults contractor to investigate and resolve it at no cost to the consumer or their retailer
Industry fragmentation makes fault finding complicated EDBs retailers and receiver owners each have their own field contractors Determining the underlying cause of a hot water complaint is often frustrating involving several attempts by different parties to resolve Powerco has a process for handling hot water complaints but it has never been formally adopted by retailers or MEPs
Barriers to the more effective use of ripple controlThe energy sector reforms of the 1990s introduced split ownership of ripple control systems with no clear business incentives to undertake load control In Powercorsquos opinion this has led to a lack of investment in ripple control and uncertainty about responsibility for load management For example Powerco lacks good information about the ripple relays in its area and the loads to which they are connected Because of these changes Powerco believes New Zealandrsquos ripple control systems have degraded and are less effective than they were
Powerco sees the main barrier to the more effective use of ripple control as a lack of strategic oversight and clarity For example while the Electricity Authority recognises that load control delivers a more secure electricity system at lower cost it has no strategy for ripple control Instead it believes that demand response measures should be driven by market incentives such as consumersrsquo willingness to pay
Fragmented ownership and lack of strategy contribute to several barriers to the more effective use of ripple control including
bull retailers failure to promote and incentivise load control
RIP
PLE
CO
NTR
OL O
F HO
T WATE
R IN
NE
W ZE
ALA
ND
- SE
PTE
MB
ER
2020
71
bull lack of understanding at Powerco about consumers electricity use patterns
bull conflicting incentives between network companies and retailers (eg EDBs aim to meet peak demand (kVA) and reliability obligations at minimum cost while retailers aim to maximise the electrical energy (kWh) delivered)
bull the unnecessary removal of functioning ripple relays at consumer sites
The future of ripple control and demand managementPowerco sees ripple control of domestic hot water as a fast reliable and effective service which can continue to play an important role in the electricity system In particular Powerco considers ripple control to be highly effective at reducing demands at peak times and shifting consumption to lower-demand periods Powerco is investing in two new ripple control plants on existing networks and a third ripple control plant as part of a new GXP Despite these investments and the benefits of ripple control its usage is slowly declining on the Powerco network due to
bull the lack of recognition of the benefits obtained from an effective means of demand management
bull unauthorised removal of ripple relays
bull an increase in alternate forms of water heating
Powerco believes that ripple control of hot water can be modernised to meet the needs of the evolving electricity system Newer relays can provide more flexible control which will make load-switching less noticeable to consumers Advanced metering units have in-built load control functionality and monitoring functionality This improves electricity network operational visibility and allows load switching to be scheduled so that for example they turn hot water back on at an appropriate time even when the ripple control system fails
However to fulfil the potential of ripple control Powerco believes there needs to be a clear national strategy for load control This strategy would describe how load control can support New Zealandrsquos sustainable energy future One of its key aims should be effective collaboration between the relevant stakeholders (ripple relay owners EDBs retailers and consumers) an equitable sharing of benefits between all stakeholders and the removal of conflicting business drivers Powerco considers that useful regulatory changes would include
bull sharing transmission cost savings among stakeholders including consumers
bull requirements to audit the health of ripple relays at consumersrsquo sites
bull introduction of standards for acceptable levels of ldquooffrdquo duration (with appropriate incentives and disincentives)
Powerco is monitoring developments of emerging alternative technology for managing loads electric hot water and other thermal storage devices Powerco is also in the early stages of planning a pilot of smart control on a small part of its network although the details and technologies involved are still being worked out
RIP
PLE
CO
NTR
OL O
F HO
T WATE
R IN
NE
W ZE
ALA
ND
- SE
PTE
MB
ER
2020
72
Case study 4 - WEL Networks
Introduction to WEL NetworksWEL Networks Limited (WEL) is the fifth largest electricity distribution company in New Zealand covering Hamilton and the northern and central Waikato region WEL distributes electricity to over 160000 people through 91000 installation connection points and 6796 km of lines In 2019 the total energy distributed across WELrsquos network was 1285 GWh
WEL is 100 owned by the community through its sole shareholder WEL Energy Trust
Ripple control capability and conditionWEL has significant capability to reduce peak demand using ripple control connected to domestic hot water About two-thirds of WELrsquos domestic customers have a ripple control relay connected to their electric hot water systems This allows WEL to reduce their network load by 40 to 60 MW ndash more than 10 of peak demand (Table 19) Ripple control is very effective at managing WELrsquos loads
Each ripple injection signals affects around 2000 to 3000 customers or about 2 MW of load
WEL used to be able to control smaller numbers of customers at the substation level but it was decided that the few cases when this was used did not justify the complexity of maintaining multiple coding schemes and complicated inventory management Customers on any given ripple control channel are not clustered but distributed across WELrsquos network to avoid large swings in demand in particular areas
Ripple control ownershipWEL owns the ripple control plant and all of the ripple control relays in its area WEL owns and operates 5 ripple injection plants (33kV and 11kV) which send ripple signals at a frequency of 283 Hz These systems are in good condition (Box 5) and present few technical problems
WEL also owns and operates smart meters at two-thirds of its customer sites These meters are mostly additional to the revenue meters that are installed at all sites For controlled tariff consumers WELrsquos smart meters contain ripple relays which have the capacity to control customer appliances However in most cases WEL does not generally use its smart meters for ripple control because this would interfere with the operation of the main revenue meters WEL does use its smart meters for several other purposes such as detecting network problems
RIP
PLE
CO
NTR
OL O
F HO
T WATE
R IN
NE
W ZE
ALA
ND
- SE
PTE
MB
ER
2020
73
Table 19 - Ripple control capability of WEL Network
Total network peak demand (maximum coincident demand22)
278 MW
Total network load connected to ripple control 100 MW
Network maximum coincident domestic demandWEL cannot separate domestic component of peak demand
Network domestic water heating load connected to ripple control
95 MW (estimate)
Network total domestic water heating load not connected to ripple control
5 MW (estimate)
Potential load reduction using ripple control40 to 60 MW
(estimate)
Domestic hot water heating as proportion of network ripple control
95
Total number of Installation Connection Points (ICPs) 94217
Total ICPs with ripple control 56765
Total number of domestic ICPs 81402
Domestic ICPs with ripple-controlled water heating 53479
22 Maximum coincident demand is the peak load that has been recorded during a reporting period ndash usually 12 months This is less than the maximum
possible load because everything in the network is never drawing power at the same time
RIP
PLE
CO
NTR
OL O
F HO
T WATE
R IN
NE
W ZE
ALA
ND
- SE
PTE
MB
ER
2020
74
Box 5 - WELs ripple control plant ndash Asset Health IndicatorsNetwork companies report on the health of their assets in their information disclosures according to the Electricity Engineers Association (EEA) Asset Health Indicator Guide (AHI 2016)23 The guide is intended to help network companies identify assets that need replacing and plan upgrades
WELrsquos asset health disclosure shows its ripple control plant to be in very good condition Note that this health assessment covers the central ripple control plant owned by WEL Networks Some of the ripple relays located at customer premises is owned by others (ie retailers and Metering Equipment Providers)
Table 20 - WEL Networks central ripple control plant health assessment
Asset Health IndicatorLoad under ripple
control (MW)
of load that is domestic water
heating
H5As new condition ndash no drivers for replacement
50 95
H4Asset serviceable - no drivers for replacement normal in service deterioration
50 95
H3End-of-life drivers for replacement present increasing asset related risk
0 0
H2End-of-life drivers for replacement present high asset related risk
0 0
H1 Replacement recommended 0 0
23 httpswwweeaconzSitenews-eventsnewsArchive-2017January-2017asset-health-indicator-guideaspx
RIP
PLE
CO
NTR
OL O
F HO
T WATE
R IN
NE
W ZE
ALA
ND
- SE
PTE
MB
ER
2020
75
Current application of ripple control Last year WEL employed ripple control on 94 days most of which were in winter Although WEL has the capability to reduce peak demand by 40 to 60 MW ripple control is not always deployed to its fullest extent or across every part of WELrsquos network WEL aims to limit the time appliances are turned off to 7 hours per day ndash 35 hours in the morning and 35 hours in the evening
WEL considers that it uses ripple control effectively and that both the company and its customers benefit from its application WEL receives an annual financial benefit of roughly$2 to 5 million from its ripple control capability compared to a cost of around$05 million
The main incentives and objectives for WELrsquos activation of ripple control are described below in order of importance
1 Minimising transmission costsTranspowerrsquos method of allocating charges to distribution companies is based partly on regional peak loads (Regional Coincident Peak Demand (RCPD)) WEL minimises its transmission charges by minimising network load during coincident peak demand periods This is the main reason the company activates ripple control
WEL passes these savings in transmission costs onto retailers in its network charge in the expectation that the savings are reflected in consumersrsquo bills WEL does this as a good corporate citizen not because it is required by regulation WEL could choose to pay higher charges to Transpower and then pass the costs onto retailers In this sense WEL has no direct financial incentive to reduce the fees it pays to Transpower
(The Electricity Authority is changing the way Transpower charges distribution companies and from April 2023 RCPD will no longer be part of transmission pricing methodology This change will remove a major incentive for WEL to activate ripple control)
2 Alleviating network constraints WEL uses ripple control to minimise peak load at Transpowerrsquos substations ndash known as Grid Exit Points (GXPs)24 This allows WEL to defer capital expenditure on network upgrades ndash a major secondary benefit of ripple control If ripple control was not available to WEL it could be required by Transpower to fund more frequent supply capacity increases at GXPs WEL also uses ripple control to relieve more localised network constraints
Alleviating network constraints also helps WEL maintain grid security reducing the likelihood of outages WEL occasionally uses ripple control to reduce network load while it carries out maintenance on a substation Use of ripple control indirectly reduces the risk of network voltage problems
3 Participating in reserve market WEL earns money from participating in the reserve market for fast interruptible load This involves providing a service to instantly reduce demand when the network frequency falls below 492 Hz The response is triggered by an under-frequency detection in the relay and does not require a ripple signal WEL uses ripple control to participate in this reserve market for much of the year It does this outside the winter months as it cannot offer a fast interruptible load response during periods when it is already using ripple control on a daily basis
24 Grid exit points (GXPs) are the points of connection (Transpower substations) where electricity flows out of the national grid to local networks or
direct consumers
RIP
PLE
CO
NTR
OL O
F HO
T WATE
R IN
NE
W ZE
ALA
ND
- SE
PTE
MB
ER
2020
76
WELrsquos use of ripple control is not timed to coincide with retailersrsquo tariffs schemes and retailers give WEL no incentive to do this In the past the retailer Genesis paid WEL to control hot water to align with its cost drivers but this agreement is no longer in place (Note WEL cannot control customersrsquo load according to their retailer so the agreement with Genesis affected all customers regardless of retailer)
WEL does not use ripple control for emergency load shedding During rare emergencies when the frequency drops below 48 Hz special relays in WELrsquos substations automatically drop load by shedding feeders but ripple control is not involved
Does ripple control deliver its potential benefitsSection 22 of this report outlines six potential benefits of using ripple control Table 21 summarises whether each of these benefits is achieved in the case of WEL
Potential benefit Benefit delivered
Reducing network costsYes Using ripple control reduces network costs by millions of dollars a year through deferral of expenditure on network upgrades and minimising Transpowerrsquos peak demand transmission costs
WEL also earns revenue from the reserve market
Reducing domestic energy bills
Yes ndash assuming that lower transmission charges are passed onto customers by retailers
Reducing generation costsWEL is not aware of the impact on generation costs (Although it is likely that by reducing peak loads WEL reduces generation costs)
Supporting reliability of the electricity system
Yes Ripple control helps maintain grid security (at N-1 level) and reduces the risk of outages It also helps WEL carry out network maintenance
Power quality support Yes ndash by supporting frequency control in the reserve market for fast interruptible load which also indirectly reduces risk of voltage problems
Supporting the clean energy transition
No Demand management could increase use of distributed renewables but this would require a finer level of control than offered by ripple control
Table 21 - The benefits of WELrsquos use of ripple control
N-1 security means the electricity system is in a secure state and for any one credible contingency event it would move to a satisfactory state
RIP
PLE
CO
NTR
OL O
F HO
T WATE
R IN
NE
W ZE
ALA
ND
- SE
PTE
MB
ER
2020
77
Technical problems with ripple control WEL has few technical problems with the effective use of ripple control In the last year the company responded to 380 reports of problems with electric water heater Of these problems WEL estimates that less than 25 are related to ripple control indicating an annual failure rate of less than 02 The most serious problem WEL encounters is the rare failure of injection plant components which can be hard to replace
The company has measured the effectiveness of ripple control by collecting smart meter data while transmitting lsquooffrsquo and lsquoonrsquo signals The data indicated a very high proportion of hot water systems were successfully controlled
When a customer reports a hot water problem directly to WEL the company first establishes the source of the problem If it relates to ripple control WEL fixes the problem at its own expense However if a customer first calls an electrician WEL usually compensates the customer if the source of the problems turns out to be ripple control
Problems caused by the interaction of ripple control and consumer equipment such as flickering lights are very rare in the WEL network Where they do occur WEL normally investigates at their own cost
The future of ripple control and demand managementWEL considers that for network-wide control of electric hot water ripple control is still the best option Despite this WEL does not foresee much greater potential for ripple control In fact once the RCPD component of transmission cost allocation ceases from April 2023 WELrsquos largest incentive to operate ripple control will disappear
WELrsquos strategy with regard to ripple control is to maintain its current approach and level of infrastructure The companyrsquos injection plants and relays are relatively new so there are no short-term plans to invest further in ripple control
WELrsquos use of ripple control is slowly declining due to the gradual increase in the proportion of hot water heating powered by gas Many new homes have gas hot water heating installed because it saves space and is perceived as more convenient Some householders have replaced electric hot water with gas systems
WEL is planning for expected changes to the electricity system including the more widespread adoption of technologies such as rooftop solar PV batteries and electric vehicles To successfully manage the integration of these technologies into the grid will require a greater degree of control at the level of individual customers
Ripple control does not support this small-scale level of control so WEL is exploring new approaches to demand management For example the charging and discharging of batteries and electric vehicles could be controlled via the Internet allowing consumers to be rewarded for providing grid support
WEL is currently scoping a trial to explore techniques for managing demand of appliances such as electric hot water solar PV electric vehicles and batteries As part of this research WEL is talking to Horizon Power about their trials of distributed intelligent microgrids in Western Australia New approaches are likely to consider innovative business models such as aggregated demand response services
WEL is carrying out these investigations as part of its internal strategy with some assistance from research institutes Neither the NZ Government nor Transpower provides WEL with any incentives to plan for demand management in an evolving system Nor is there any coordinated national or regional strategy for ripple control or demand management
RIP
PLE
CO
NTR
OL O
F HO
T WATE
R IN
NE
W ZE
ALA
ND
- SE
PTE
MB
ER
2020
78
RIP
PLE
CO
NTR
OL O
F HO
T WATE
R IN
NE
W ZE
ALA
ND
- SE
PTE
MB
ER
2020
79
- 4-Introduction
- 8-Our outcomes
- 10-Our funding
- 12-Our strategic focus
- Business
- Transport
-

Front cover image Auckland at night
RIP
PLE
CO
NTR
OL O
F HO
T WATE
R IN
NE
W ZE
ALA
ND
- SE
PTE
MB
ER
2020
2
Contents10 Executive summary 4
20 Ripple Control in New Zealand 6
21 Introduction to ripple control 6
22 The benefits of ripple control
ndash balancing the grid and reducing energy costs 8
23 Project background and purpose 10
24 The use of ripple control in New Zealand today 11
25 How and why is ripple control used 14
26 Costs of ripple control 18
27 Requirements and incentives for load management 19
28 The reliability of ripple control of hot water 20
29 Barriers to the more effective use of ripple control 22
30 The future of hot water load control 24
31 Short-term outlook for ripple control 24
32 Ripple control and the evolving electricity system 25
33 The longer-term ndash distributed energy resource
management systems 26
34 Integration of ripple control and DERMs 28
40 Conclusions 30
50 Glossary of terms 32
60 Appendix A - Summary of existing data on ripple control 34
70 Appendix B - Costs of ripple control 48
80 Appendix C - EDB Case studies 52
RIP
PLE
CO
NTR
OL O
F HO
T WATE
R IN
NE
W ZE
ALA
ND
- SE
PTE
MB
ER
2020
3
DisclaimerIn this document PSC refers to Power Systems Consultants New Zealand Ltd a member of PSC Specialists Group Inc of Washington USA This document is intended for information purposes only
AcknowledgementsThe Energy Efficiency and Conservation Authority and PSC thank the individuals and organisations that took part in the surveys and interviews that informed the development of this report
About this reportTo reduce our environmental impact and emissions this document is published in digital form only It is available for download from our website wwweecagovtnz
Executive summaryRipple control is a network management tool for managing electricity demand New Zealandrsquos Electricity Distribution Businesses (EDBs) use ripple control to turn off consumersrsquo electric hot water systems at times of peak demand It has been New Zealandrsquos most important demand management tool since the 1950s
This report will help to inform future plans for managing demand for heating water and peak demand in general The report describes the current state of ripple control infrastructure its application by EDBs and the resulting benefits The report also describes problems with ripple control barriers to its effective use and its future role in the energy system in the context of emerging technologies Research for this report included surveys with consumers EDBs and electricians and well as a review of existing published information
All 29 EDBs in New Zealand own and operate ripple control plant which sends audio-frequency signals through the electricity network These signals are detected by ripple relays at consumersrsquo premises The relays respond by switching off certain electrical appliances mostly hot water systems Ownership of ripple relays varies around New Zealand and is split between EDBs electricity retailers and metering equipment providers (MEPs)
Ripple control continues to be widely used and well maintained EDBs continue to invest in ripple control plant with over$16M capital expenditure planned for upgrades and replacements across New Zealand through to 2029 EDBs continue to maintain ripple control plant and overall it appears to be in good condition
Most EDBs see ripple control as effective reliable and low-cost technology with multiple benefits It is estimated that just over half of electricity consumers have ripple control most of which is connected to hot water systems The load connected to ripple control equates to approximately 15 of New Zealands annual peak demand However the proportion of consumers with ripple control is gradually declining due to removal of ripple relays by retailers and disconnection of water heating from ripple relays by solar panel installers as well as the increasing uptake of alternate energy sources for water heating
Ripple relays are currently the most expensive part of providing ripple control Individual ripple control relays cost about$300 per ICP to supply and install or$10 per ICP per year assuming a 30 year life of a ripple relay Costs that were disclosed indicate the total annual cost of providing ripple control ranges between$10 and$27 per kW of controllable load and between$10 and$19 per ICP compared to approximately$130 per kW per year to provide additional peak distribution capacity
The most important use of ripple control is to control peak electricity demand EDBs take different approaches to the use of ripple control It is likely to be most useful in integrated networks typical of urban areas and in areas with growing electricity demand Most EDBs use ripple control in winter to maintain network demand within predetermined limits This has several potential benefits including
bull minimising the transmission charges that EDBs must pay to Transpower
bull ensuring demand does not exceed network capacity hence maintaining network security and reducing the risk of outages
bull deferring expenditure on network upgrades helping to keep customer bills lower
Some EDBs use ripple control to manage consumersrsquo electricity use in-line with their electricity tariff For example a consumer on a night-only tariff will have their water heated between 11pm and 7am This use of ripple control permanently shifts demand away from morning and evening periods when peaks occur In some regions ripple control is also used to switch off load in response to system low frequency events and other emergencies such as network failures
10
RIP
PLE
CO
NTR
OL O
F HO
T WATE
R IN
NE
W ZE
ALA
ND
- SE
PTE
MB
ER
2020
4
EDBs highlight a lack of clear market incentives to use ripple control Although ripple control reduces the cost of the electricity system the benefits do not necessarily accrue to the consumers and industry participants who provide the service EDBs continue to invest in ripple control for the benefit of their consumers not because of direct business incentives In fact if they were to abandon ripple control and allow peak loads to rise EDBs could upgrade their networks and increase their revenues Consumers should receive reduced rates in return for ripple control however not all retailers structure their tariffs to align with consumersrsquo consumption patterns and few retailers appear to actively promote the benefits of ripple control
In the short term (1-3 years) most EDBs see ripple control continuing as the best option for managing domestic hot water loads despite uncertainties on the horizon Industry participants recognise that the evolving electricity system will need new approaches to energy management beyond ripple control of hot water The Electricity Authorityrsquos proposed 2021 introduction of Default Distributor Agreements adds uncertainty Load control will become a contestable ldquorelated servicerdquo or ldquoadditional servicerdquo not a core distribution service EDBs may no longer be able to mandate ripple control in their connection agreements Further from April 2023 the Electricity Authority is changing the way Transpower allocates and recovers transmission costs The new cost-allocation method will no longer be related to the Regional Coincident Peak Demand For some EDBs this change will remove a major incentive to deploy ripple control
In the medium-term (5 years) the future of ripple control is uncertain Greater adoption of technologies such as electric vehicles solar power and home battery systems will increase the need to manage electricity demand including at the level of individual households There is currently no industry-wide strategy for ripple control or demand management This leads to lack of clarity over responsibility for demand management and the pace of change If change is gradual ripple control may continue for decades increasingly interacting with new technologies such as smart meters However with a more rapid transformation ripple control will be superseded more quickly
In the long-term (10 years) ripple control is likely to be displaced by a range of advanced technologies including
bull advanced smart meters and home automation systems that can transmit two-way information on current consumption and send signals to consumersrsquo appliances
bull individual appliances that respond to load and price signals sent by smart meters
bull software to handle monitoring forecasting of energy and control of appliances
bull alternative communication channels such as cellular networks and broadband
These technologies will combine to monitor forecast control and coordinate energy generation demand and storage They will surpass ripple control in their ability to control consumer equipment according to market conditions and provide real-time data on consumption at the household level Some retailers and EDBs in New Zealand are carrying out small trials of these technologies however their introduction is slow and piecemeal
RIP
PLE
CO
NTR
OL O
F HO
T WATE
R IN
NE
W ZE
ALA
ND
- SE
PTE
MB
ER
2020
5
Ripple control
20
21 Introduction to ripple controlElectricity grids must be constantly managed so that supply and demand are in balance One way to achieve this balance is to reduce or shift electricity consumption ndash an approach known as demand management Ripple control is a demand management technology that enables consumersrsquo electrical equipment to be switched off and on using a remote signal New Zealandrsquos Electricity Distribution Businesses (EDBs) have relied on ripple control as their main demand management tool since the 1950s
Ripple control involves control plant (Figure 1) sending an audio-frequency signal through the ordinary electricity network (Figure 2) This signal is detected by ripple relays located next to consumersrsquo meters (Figure 3) or embedded in a modern smart meter Relays respond by switching off the electricity supply to designated electrical appliances When power demand falls a second signal is sent to restart appliances This
report concerns the most common type of equipment under ripple control ndash domestic electric hot water heating systems
Data included in this report described as ripple control includes an older and less common technology called pilot wire Pilot wire is still used to control some domestic hot water heaters in older built-up areas in various locations around New Zealand The difference with pilot wire is that the initial signal is sent to substations not consumers These substations then send a signal over a dedicated wire that is separate from the mains supply Once the signal reaches a consumer their hot water is switched onoff
Figure 1 - Mangamaire 33 kV ripple injection plant (Photograph courtesy of Powerco)
RIP
PLE
CO
NTR
OL O
F HO
T WATE
R IN
NE
W ZE
ALA
ND
- SE
PTE
MB
ER
2020
6
This report focusses on the primary use of ripple control in New Zealand ndash reducing electricity demand at peak times It also discusses some related uses of ripple control such as alleviating network constraints and managing consumersrsquo electricity use to align with retailer tariffs
Ripple signals are transmitted for several other reasons that are outside the scope of this report For example they are used to a lesser extent to control the operation of other equipment such as street lighting night-storage heaters and irrigation pumps They are also used to alert commercial and industrial consumers to periods of high electricity consumption and in some parts of New Zealand to trigger Tsunami warning sirens These alternative uses for ripple control appear to be declining For example street lighting control is often being replaced with other control systems incorporating daylight sensors Tsunami warnings are now mostly via mobile phone alert systems
Figure 2 - Ripple control plants send signals to switch onoff thousands of hot water systems
Ripple Control Plant
power cable
onoff ripple signal
Consumerrsquos hot water system
Household
Relay recieves signal
Consumerrsquos hot water system
Household
Relay recieves signal
Consumerrsquos hot water system
Household
Relay recieves signal
Figure 1 - Ripple control plants send signals to switch onoff thousands of hot water systems
Figure 3 - A domestic meter board showing upper left = retailerrsquos meter upper right = WEL Networksrsquo meter of controlled hot water load lower right = WEL Networksrsquo ripple relay (Photograph courtesy of WEL Networks)
RIP
PLE
CO
NTR
OL O
F HO
T WATE
R IN
NE
W ZE
ALA
ND
- SE
PTE
MB
ER
2020
7
22 The benefits of ripple control ndash balancing the grid and reducing electricity costsRipple control of domestic electric hot water heating is one way of reducing demand In New Zealand it is deployed at times of peak electricity use ndash usually winter mornings (8-930am) and evenings (5-8pm) largely due to greater use of electric hot water heating and lighting Figure 4 shows how ripple control can enable a reduction in peaks of electricity demand
Demand management techniques such as ripple control have several benefits that support the New Zealand Governmentrsquos objectives for an energy system that is affordable reliable and more sustainable1
221 Ripple control reduces electricity costsRipple control can help deliver cheaper electricity for all consumers by reducing system costs in several ways
Lower network costs Figure 5 from Orion suggests that typically 25 of an electricity networkrsquos capacity is used only during peak demand periods in winter that accounts for less than 10 of the year Ripple control can flatten these peaks (Figure 4) improving asset utilisation and reducing the required capacity and overall cost of the transmission and distribution networks
Lower generation costs The cost of electricity usually rises when demand is high At these peak times lower cost generation is already operating at maximum output so more expensive generators such as gas-fired power stations with a higher environmental impact are deployed Also transmission lines can reach their capacity resulting in the dispatching of more expensive generation connected by different transmission lines with spare capacity Ripple control reduces the reliance on expensive generation by reducing peak demand
Reducing consumersrsquo energy bills Around half of New Zealand households have hot water systems under ripple control These consumers often pay a reduced rate for energy in return for allowing network companies to control their hot water systems
222 Ripple control supports the reliability of the electricity systemOccasionally electricity supply is unable to meet demand due to either insufficient generation or inadequate transmission capacity A last-resort measure in these situations is to cut electricity supply to some consumers causing sudden blackouts The option of ripple control reduces the likelihood that this emergency response will be activated
1 Ministry of Business Innovation and Employment Energy strategies for New Zealand
wwwmbiegovtnzbuilding-and-energyenergy-and-natural-resourcesenergy-strategies-for-new-zealand
Figure 3 - Ripple control can help reduce peaks in electricity demand
MW
Time
with ripple control without ripple control
Figure 4 - Ripple control can help reduce peaks in electricity demand
RIP
PLE
CO
NTR
OL O
F HO
T WATE
R IN
NE
W ZE
ALA
ND
- SE
PTE
MB
ER
2020
8
223 Ripple control supports power qualityA side effect of using ripple control to reduce network peaks is that it helps with network voltage control On occasions the automatic ripple response of EDBs participating with Orion in the Upper South Island Load control scheme has assisted in maintaining voltage security in the Upper South Island (See the Orion Case Study Appendix C)
WEL Networks have ripple relays configured to respond to under-frequency events to help maintain the power system frequency (See the WEL Networks Case Study Appendix C)
224 Ripple control supports the integration of renewable energy sourcesDemand management can also support New Zealandrsquos emissions reduction targets by facilitating the introduction of more wind and solar energy The variable output of these technologies increases the value of systems that manage demand including ripple control The integration of renewable energy sources will also
require greater electrification of transport and process heat which if not carefully managed could exacerbate spikes in demand Hot water load management is one way to reduce these spikes Demand management by shifting peak loads to off peak times is an opportunity to use the existing capacity of the power system more efficiently
Ripple control is now competing with other newer technologies that can enable demand management such as advanced smart meters (Box 1) EDBs will have to make strategic decisions about their level of investment in ripple control compared to these alternative technologies This report provides part of the evidence base for making those decisions
Hour of day (one day shown)
This last 25 of capacity only has about 10 utilisation
The next 25 of capacity is used less than halfthe time (~35 utilisation)
The next 25 of capacity is often in use(~80 utilisation)
The first 25 of capacity provided is almostalways fully used (~100 utilisation)
MW
dem
and
(sup
ply
capa
city
requ
ired)
00
4 8 12
25
50
75
100
16 20 24
Figure 4 - About 25 of an electricity networkrsquos capacity is only used for 10 of the time ndash mostly during peak demand on winter evenings
Summer
Winter
Figure 5 - About 25 of an electricity networkrsquos capacity is only used for 10 of the time ndash mostly during peak demand on winter evenings
RIP
PLE
CO
NTR
OL O
F HO
T WATE
R IN
NE
W ZE
ALA
ND
- SE
PTE
MB
ER
2020
9
23 Project background and purpose The main objective of this research is to provide a better understanding of the current state of ripple control for domestic electric hot water heating in New Zealand This understanding will help the Energy Efficiency and Conservation Authority (EECA) deliver new initiatives aimed at reducing peak electricity demand using existing power system capacity more efficiently and increasing use of renewable energy
EECA suspects that use of ripple control for domestic electric hot water heating is declining in parts of New Zealand The report explores this issue as well as looking to the future of managing domestic hot water heating loads It addresses the following questions
bull To what extent is ripple control being used to manage electric hot water heating loads
bull Is ripple control being used effectively and what are the problems with it
bull Are there adequate incentives for using ripple control
bull How much does it cost to install and maintain ripple
control technology and what are network companiesrsquo plans to invest in maintenance and upgrades
bull Are there better alternative technologies for managing electric hot water heating loads and are these alternatives being explored by network companies
To answer these questions this research explores various new and existing evidence including
bull Existing data and research such as network companiesrsquo Asset Management Plans Commerce Commission data and academic reports
bull Surveys conducted for this report with network companies electricians and electricity consumers
bull Case studies of four network companies developed through interviews conducted for this report
RIP
PLE
CO
NTR
OL O
F HO
T WATE
R IN
NE
W ZE
ALA
ND
- SE
PTE
MB
ER
2020
10
24 The use of ripple control in New Zealand today
241 EDBs use of ripple controlEvery EDB in New Zealand owns ripple control infrastructure which they can use to manage electricity demand in their area This infrastructure includes multiple ripple control plants each covering a different part of an EDBrsquos network These control plants send ripple control signals on different communication channels Ripple relays at consumer sites are programmed to respond to one or more of these channels This gives network companies the ability to control blocks of hot water systems according to different timetables or real-time needs
It is estimated that just over half of New Zealands electricity consumers have ripple control most of which is connected to hot water The total network load connected to ripple control is estimated to be approximately 15 of New Zealands peak demand This estimate is based on publicly available data on the extent of ripple control (Appendix A) The total load connected to ripple control cannot be determined exactly but is estimated based on the changes in network load that EDBs observe in response to ripple control on and off signalling The fragmented ownership of ripple relays between EDBs electricity retailers and metering equipment providers (MEPs) and differing requirements across New Zealand in EDB connection contracts for mandatory and optional ripple control of water heating add to the uncertainty of exactly what load is connected to ripple control
Ripple control is a one-way communication system with no information sent back from consumersrsquo sites This means EDBs cannot detect if individual ripple relays receive a signal or if a hot water system is correctly turned onoff EDBs can only estimate their controllable loads by monitoring the impact of ripple signals on their network load
Ripple-controlled water heaters generally remain off for less than three hours and occasionally up to five hours Only in rare events such as a system fault will ripple control affect an individual consumer for over five hours To minimise its impact ripple control is sometimes rotated between consumers Mostly it has very little or no impact on consumers as the water remains hot in the tank for several hours while the heater is switched off
Most EDBs see ripple control as an effective reliable and low-cost technology with multiple benefits as described below Ripple control is likely to be most useful in integrated networks typical of urban areas and in areas with growing electricity demand This type of network presents greater opportunities to realise some of the benefits of ripple control such as alleviating network constraints and maximising use of network assets (Section 25)
In sparsely populated rural networks ripple control may be less useful as its use may lead to under-utilisation of network capacity The case study on Eastland Networks (Appendix C) describes a rural network where distributed diesel generators are seen as a more effective alternative to ripple control alone The diesel generators run at peak times to meet demand and are also available as back-up power supplies when there are transmission failures and an area within the network loses its connections to its normal sources of generation
RIP
PLE
CO
NTR
OL O
F HO
T WATE
R IN
NE
W ZE
ALA
ND
- SE
PTE
MB
ER
2020
11
Table 1 - Quantification of ripple control in New Zealand
Quantification of ripple control in New Zealand
Total network peak demand in New Zealand 66172 MW
Network load connected to ripple control 9873 MW
Total Installation Control Points (ICPs) in New Zealand 21772194
Consumers (ICPs) with ripple control 11343013
Typical frequency of use
bull Reducing peak demand Weekdays in winter (1 to 4 month period)
bull Managing off-peak rates (tariff switching) 5 weekdays per week (throughout the year)
bull Emergency load-shedding lt5 times per year
2 Commerce Commission electricity distributors information disclosure data 2018
3 Estimate from Commerce Commission Electricity Distribution Business Emerging Technology data 2018 plus estimate for Vectorrsquos load (not
included in the Commerce Commission data)
4 Electricity Authority Market Information metering snapshot 3062020
242 Consumersrsquo perspectiveA short survey was conducted with 42 responses from domestic consumers located across 7 EDB network areas from Vector in Auckland to Orion in Christchurch Responses are summarised below in Table 2 as a percentage of the respondents that the question applied to ie some questions apply to only those with ripple controlled hot water and not those who answered the survey with no ripple control
RIP
PLE
CO
NTR
OL O
F HO
T WATE
R IN
NE
W ZE
ALA
ND
- SE
PTE
MB
ER
2020
12
Table 2 - Consumer survey response summary
Before receiving this survey were you aware of ripple control on domestic hot water systems
Yes 90
No 10
Do you have electric water heatingYes 62
No 38
Is your water heating ripple controlled
Yes 54
No 23
Donrsquot know 23
What benefit do you gain by having your hot water heating ripple controlled
Reduced rates 43
Nothing 29
Not sure 28
If ripple control of hot water heating in your area was optional would you choose to have it ripple controlled
Yes 70
No 15
Donrsquot know 15
Do you ever run out of hot water where you think it may be because of ripple control
Yes 21
No 79
Have you had hot water faults where you have called an electrician or reported a fault to your retailer and the cause of the fault has been due to the ripple control
Yes 7
No 93
Do you have any other ripple controlled load such as Night Store heaters
Yes 5
No 90
Donrsquot know 5
Do you suspect that ripple control interferes with any electrical appliances devices or lighting that you have (eg buzzing or flickering lighting)
Yes 2
No 98
243 Electriciansrsquo perspectiveAn attempt was made to gather experiences and views of electricians on ripple control A short survey was sent out to 37 electrical contractors spread across New Zealand from Northland to Southland selected based on their website information indicating a focus on residential work
Only one response was received so there was insufficient information to draw any conclusions
Once a ripple relay has been installed for a new build the terminal covers are sealed and from then on work on ripple relays is restricted to authorised contractors of the ripple relay owners Most residential focused electricians are not contractors to ripple relay owners and appear to have little interest in ripple control
RIP
PLE
CO
NTR
OL O
F HO
T WATE
R IN
NE
W ZE
ALA
ND
- SE
PTE
MB
ER
2020
13
25 How and why is ripple control usedThis section describes how EDBs use ripple control and their motivations for doing so (Figure 6) The sources of this information were
bull responses from 10 EDBs to a survey on ripple control
bull interviews with the four EDBs for the case studies in Appendix C
bull EDBsrsquo Asset Management Plans
251 Ripple control for reducing peak demandAll 10 survey respondents reported using ripple control to reduce peak demand and maintain network loads within predetermined limits EDBs anticipate when their limit is about to be exceeded and respond by sending ripple signals to turn off some of their hot water load (Figure 7) This requires careful management to ensure individual water heaters are not turned off for too long
The use of ripple control to manage peak loads is most common on winter mornings and evenings Some companies only use ripple control for between one and three months each year as electricity demand tends not to approach the network limit outside winter
There are several potential benefits from using ripple control to manage peak loads minimising transmission charges alleviating network constraints maintaining grid security and deferring capital expenditure as explained further below
252 Minimising Transmission chargesTranspowerrsquos allocation of transmission charges to EDBs is based partly on regional peak loads (Regional Coincident Peak Demand (RCPD)) By reducing peak loads EDBs can sometimes reduce their transmission costs Three case study participants reported passing these lower costs onto retailers in the expectation that it would lead to lower bills for consumers However there is no obligation on retailers to pass lower costs onto consumers
For some EDBs (including eight survey respondents) minimising transmission charges is a direct motivation
Figure 5 - EDBsrsquo reasons for using ripple control of hot wateras percentage (from 10 survey respondents)
This was not specifically asked in the survey so may under-represent true number
100 Reducing peak loads
80 Minimising Transpower changes
80 Retailer tariff switching
80 Emergency load shedding
40 Participating in regional load control scheme
20 Participation in market for interruptible load
30 Price signalling (commercial)
Maintaining grid security70
Alleviating distribution network contraints70
Defering capital investment70
This was not specifically asked in survey so may under-represent true number
Figure 6 - EDBsrsquo reasons for using ripple control of hot water as percentage from 10 survey respondents
RIP
PLE
CO
NTR
OL O
F HO
T WATE
R IN
NE
W ZE
ALA
ND
- SE
PTE
MB
ER
2020
14
for using ripple control This includes the eight distribution companies that cooperate in a scheme to reduce the peak load of the upper South Island Orion coordinates the Upper South Island Load Management Project by issuing participants with peak demand thresholds The participants aim to keep demand below these thresholds primarily through ripple control of domestic water heating The project has successfully led to a reduction in transmission charges and the deferral of investment in new transmission capacity
For some EDBs lower transmission charges are not a direct motivation for managing peak loads although they may be a beneficial side-effect These companies do not explicitly set out to reduce their transmission charges because they consider their load is too small to have a significant effect on the peak load in their region
Regulations allow EDBs to pass their transmission charges onto retailers so there is no clear financial incentive to minimise them Companies that do so are motivated by a desire to save money for consumers Other companies are more comfortable passing transmission costs onto retailers and therefore to consumers
From April 2023 the Electricity Authority expects to
Time of day
Orion network load and load management
Percent shed
Perc
ent s
hed
Load
ing
(MW
)
12am 1a
m
2am
3am
4am
5am
6am
7am
8am
9am
10am
100
90
80
70
60
50
40
30
20
10
0
700
600
500
400
300
200
100
0
11am
12pm 1p
m
2pm
3pm
4pm
5pm
6pm
7pm
8pm
9pm
10pm
11pm
12pm
Peak periodControl period Limit Uncontrolled loadNetwork load
Figure 7 - The graph illustrates how ripple control of hot water (yellow shaded area) keeps network load (green line) below the network limit (black line) The red line shows the estimated load in the absence of ripple control
(Source Orion Load Management Dashboard (httpsonlineoriongroupconzLoadManagement)
Figure 7 - Ripple control can help contain electricity demand within network limits (Orion network load 662019)
The graph illustrates how ripple control of hot water (yellow shaded area) keeps network load (green line) below the network limit (black line) The purple line shows the estimated load in the absence of ripple control
RIP
PLE
CO
NTR
OL O
F HO
T WATE
R IN
NE
W ZE
ALA
ND
- SE
PTE
MB
ER
2020
15
change the way Transpower allocates and recovers transmission costs5 The new cost-allocation method will no longer be related to the Regional Coincident Peak Demand For some EDBs particularly those without capacity constraints in their own networks this change will remove a major incentive to deploy ripple control as ripple control will no longer reduce the transmission charges from Transpower that pass through to consumers
253 Alleviating network constraints and maintaining grid securityIf a networkrsquos capacity is exceeded the result can be a power outage or a drop in the system voltage below agreed supply limits EDBs continuously monitor their networks to ensure that loads remain within their capacity Ripple control of hot water offers one way to protect a network that is close to capacity This helps to reduce the likelihood of outages and maintain network security Ripple control can also allow an EDB to carry out essential maintenance without interrupting the service to consumers By alleviating network constraints with ripple control EDBs maximise the use of their existing assets
254 Deferring capital expenditure on network upgradesRegulators determine expenditure on network upgrades according to peak demand By using ripple control to reduce peak demand EDBs can defer costly upgrades Across New Zealand this reduces expenditure on network infrastructure by tens of millions of dollars every year helping to keep consumer bills lower
Ripple control enables the deferral of two types of upgrade Firstly it minimises peak loads at Transpowerrsquos substations ndash known as Grid Exit Points (GXPs)6 Without ripple control EDBs could be required by Transpower to fund more frequent supply capacity increases at GXPs Secondly ripple control allows EDBs to reliably handle peak loads on sub-transmission networks that are close to
their maximum capacity also deferring the necessity of upgrades
EDBs that aim to delay expenditure do so on behalf of their consumers but have no direct financial incentive to do so On the contrary they may have a financial incentive to upgrade their networks as under current rules they are able to make a return on this investment and grow their revenue
255 Retailer tariff switchingSome electricity consumers can select cheaper tariffs where appliances such as water cylinders and night-store heaters are operated outside peak periods For example on the night-only tariff water heating occurs overnight and is then off all day Other tariffs include peak control night-only with afternoon boost night-only with weekend boost and emergency control
Some EDBs send fixed-time ripple control signals every weekday to support these tariffs Some companies support the full range of tariffs others support only the night-only tariff while others do not support tariff switching at all In general EDBs are not incentivised by retailers to provide a tariff switching service
This use of ripple control has the additional benefit of permanently shifting demand away from morning and evening periods when peaks occur EDBs must balance this demand reduction with their obligations to achieve service level targets
EDBs handle switching of consumers on different tariffs by using multiple ripple control channels For this to work effectively ripple relays must be correctly programmed to align with consumersrsquo selected tariffs Where an EDB does not own a ripple relay it must rely on the relay owner to correctly programme the relay to align with a consumerrsquos selected tariff which may not always occur
5 httpswwweagovtnzdevelopmentwork-programmepricing-cost-allocationtransmission-pricing-review
6 Grid exit points (GXPs) are the points of connection (Transpower substations) where electricity flows out of the national
grid to local networks or direct consumers
RIP
PLE
CO
NTR
OL O
F HO
T WATE
R IN
NE
W ZE
ALA
ND
- SE
PTE
MB
ER
2020
16
256 Ripple control for emergency load shedding
In some networks ripple control is used to reduce load in grid emergencies ndash known as emergency load shedding Grid emergencies can be due to a failure in the network caused for example by damage to lines caused by storms or a high vehicle Emergencies can also result from the sudden failure of a generating station In such cases Transpower may direct an EDB to reduce load Using ripple control to limit demand is the preferred first response before taking more extreme action such as turning off all supply to consumers over wide areas This helps prevent disruption to supply including electricity outages while the problem is fixed
257 Using ripple control to participate in reserve marketWhen the network frequency falls below 492 Hz the system needs to respond within seconds by reducing demand andor increasing generation Some EDBs use ripple relays to drop load in response to low-frequency events by having low frequency load shedding as a function programmed into ripple relays This enables
them to earn revenue in the reserve market for fast interruptible load Low frequency activation typically only occurs a few times per year and EDBs usually participate only outside the winter months as lsquoripple reserversquo cannot be offered during periods when ripple control is already in use
Some EDBs do not provide this service because the financial rewards are too small to justify the additional operational complexity and risk Ripple control systems are too slow to respond by sending control signals within the time required by regulation For companies that do provide this service an under-frequency detection function is programmed in the ripple relay and does not require a ripple signal to be transmitted over the network
RIP
PLE
CO
NTR
OL O
F HO
T WATE
R IN
NE
W ZE
ALA
ND
- SE
PTE
MB
ER
2020
17
26 Costs of ripple controlEDB Commerce Commission information disclosures do not separately identify maintenance expenditure on ripple plant Annual costs were requested in the EDB survey that was conducted for this report however some of the respondents to the survey did not provide any maintenance costs Annual maintenance costs that were disclosed ranged between$10000 and$80000 per year With this level of expenditure the annual cost of maintenance is generally below$1 per ICP per year and below$1 per kW of controllable load per year
Capital costs of ripple control are dominated by the cost of supplying and installing ripple control relays EDBs responding to this survey that owned ripple relays stated the cost of supplying and installing stand-alone ripple relays (that is not embedded in smart meters) was commonly about$300 but could be$500 or more for a rural installation Assuming a ripple relay life of 30 years this gives cost of around$10 per year per ICP for an urban consumer ripple control installation
EDB cost information provided for this research is included in Appendix B This shows the total annual cost of ripple control ranged between$10 and$27 per kW of controllable load and between$10 and$19 per ICP which compares favourably to approximately$130kWyear for increased peak distribution capacity
Capital costs of planned ripple control plant upgrades and replacements over the next 10 years have been
extracted from EDB disclosures published in 2019 Asset Management Plans and tabulated in Appendix B The planned total over all of New Zealand is$168M
In general EDBs consider ripple control as an inexpensive method of managing loads with positive financial benefits Several EDBs reported that their financial benefit from ripple control is at least twice the costs However a couple of companies mentioned the anticipated costs of ripple plant replacements over the next decade provides an opportunity to evaluate the benefits of alternatives to ripple control
RIP
PLE
CO
NTR
OL O
F HO
T WATE
R IN
NE
W ZE
ALA
ND
- SE
PTE
MB
ER
2020
18
27 Requirements and incentives for load management
271 ConsumersCurrently EDBs have the power to make ripple control mandatory for consumers with electric hot water heating Most companies do not exercise this power but some do particularly in the upper South Island Use of ripple control tends to be more extensive and effective in those areas where it is compulsory Two large areas where ripple control is not compulsory Auckland and Wellington have comparatively low ripple-controlled load Data from Auckland is unusual in that there is a substantial area that was served by a pilot wire system which is no longer in service because it has become unreliable Vector is exploring different technologies approaches and their costs that may replace the services provided by the pilot wire system The replacement should be adaptable such that it not only replaces the services from the pilot wire system but also addresses the uncertainty from a future with many distributed energy resources
Many consumers receive reduced rates for allowing their water heating to be controlled This can happen in one of two ways
bull Some domestic installations with ripple control have one meter for water heating (or other controlled loads) and a second meter for all other appliances This allows these consumers to receive a discounted rate for their water heating
bull Other consumers have a single meter and receive a discounted rate for all load in return for allowing water heating to be controlled
In some areas the extent of consumersrsquo discounts depends on the degree of ripple control they allow as determined by their chosen tariff (Section 255) However some variable tariffs are not well-aligned with actual ripple control or an EDBs use of ripple control does not support the range of tariffs offered by all retailers Also some retailers do not offer reductions
for controlled load or offer flat rates which take limited account of controlled load Ripple control is not well promoted by retailers and many consumers are unaware of its potential benefits or even of its presence in their house
272 EDBsThere are no regulatory requirements for EDBs to maintain or use ripple control infrastructure However as outlined in Section 25 EDBs have several potential motivations for using ripple control including lower transmission charges deferred expenditure reducing consumer energy bills and participation in the reserve market Except for participation in the reserve market these are not direct financial incentives but rely largely on EDBsrsquo willingness to act responsibly The EDBs interviewed for the case studies (Appendix C) stressed that regulatory and community expectations are a major incentive for them to use ripple control This is particularly the case for community owned EDBs
273 Retailers and meter ownersEngagement with retailers and meter equipment providers (MEPs) was not part of the research for this report EDBs believe retailers or MEPs are not promoting ripple control to their consumers which indicates they have few incentives to do so On the one hand retailers that are also generators may lose out from the use of ripple control because it undercuts profitable peak generation On the other hand where they have fixed price contracts to supply electricity having the ability through load control to shift load from high price peak periods to low price off peak periods improves profitability of supply contracts EDBs reported poor coordination of ripple control between themselves retailers and MEPs
RIP
PLE
CO
NTR
OL O
F HO
T WATE
R IN
NE
W ZE
ALA
ND
- SE
PTE
MB
ER
2020
19
28 The reliability of ripple control of hot waterEDBs report that they can control a large proportion of electric hot water systems using ripple control with few technical problems For example WEL Networks indicated an annual failure rate of individual relays of less than 02 Most hot water faults tend to be related to the consumersrsquo equipment not ripple control
Often publicised in trade literature is the potential problem of adverse interaction between ripple control signalling and consumer equipment such as causing some types of lighting to flicker Neither the consumer nor the EDB surveys indicated that this is a common problem in New Zealand Some industrial equipment has the potential to absorb ripple signalling power to the extent that ripple control signalling in the surrounding area becomes unreliable This is mostly an issue for the older ripple control systems using
the higher signalling frequencies eg 1050 Hz which are more prone to signal degradation Powerco stated that their Network Connection Standard requires the installation of blocking filters to prevent consumer equipment interfering with ripple control signals
Most ripple control plant is well-maintained and very reliable However their failure is the most serious potential technical problem with ripple control infrastructure Several companies reported that their ripple control infrastructure is several decades old and hence more likely to fail The risk is compounded by difficultly of obtaining new parts for ripple control plant and a lack of technicians with the skills to repair the older ripple control infrastructure
RIP
PLE
CO
NTR
OL O
F HO
T WATE
R IN
NE
W ZE
ALA
ND
- SE
PTE
MB
ER
2020
20
Older ripple control plant uses a higher frequency (eg 1050 Hz) which has a greater risk of signal loss Many newer installations have moved to a more reliable lower frequency range (200 to 400 Hz) Migration to lower-frequency signalling requires ripple relays to be replaced This is a slow and costly process especially where ripple relays are not owned by EDBs Pilot wire is less reliable than ripple control and replacement parts even harder to source For this reason some EDBs are decommissioning pilot wire as part of scheduled renewal programmes
Sometimes hot water control systems get stuck in the ldquooffrdquo position This can happen for example when the ldquoswitch onrdquo signal coincides with a network failure or maintenance It can also be caused by failures in communication between the SCADA Master Station and the control plant as well as operational mistakes Generally EDBs can overcome this problem quickly by re-sending the ldquoswitch onrdquo signal Newer ripple control relays can be programmed to switch themselves on if they do not receive an expected ldquoonrdquo signal after a pre-set time limit Orion reported sending nightly confirmation signals to ensure hot water systems are turned back on Some modern ripple relays revert to a pre-programmed timetable if they do not receive an expected ripple signal
Ripple relays themselves sometimes fail and no longer respond to ripple control signals If a relay fails in the ldquooffrdquo state an EDB will not know until they receive a consumerrsquos complaint about lack of hot water If a relay fails in the ldquoonrdquo state it is likely to remain in this state indefinitely as the consumer will continue to have hot water and is unlikely to report a problem Also the relay owner is unlikely to discover the problem as regulations do not require regular condition assessments
Some problems relate to the ownership of meters and ripple control relays by third parties This means EDBs have a limited understanding of the status of relays in their area For example they may not know what ripple channels different relays are set to and therefore can only determine how much load is controlled by a particular channel by observing the effect on their network by switching the channel on and off It can also mean that that the control of a consumerrsquos hot water system does not align with their chosen tariff Sometimes retailers incorrectly wire the ripple relays when replacing consumersrsquo meters An EDB has no way of finding out about this unless a consumer reports a problem This is unlikely however as the consumer will still have hot water
Split ownership of ripple relays also makes fault finding complicated and potentially time consuming with multiple parties often involved If a consumer has a problem with no hot water EDBs prefer that the consumer contacts their retailer first to have the problem resolved If a consumer is not aware of this then they are just as likely to call a local electrician or plumber If the electrician or plumber determines that the fault is related to the ripple control then the consumer will have to make another call to their retailer Another contractor depending upon who owns the ripple relay will need to attend the consumerrsquos premise to undertake testing of the ripple control signal level and the ripple control relay Potentially a consumer could have a period of time with no hot water and a call-out invoice from an electrician or plumber to claim back from their retailer
RIP
PLE
CO
NTR
OL O
F HO
T WATE
R IN
NE
W ZE
ALA
ND
- SE
PTE
MB
ER
2020
21
29 Barriers to the more effective use of ripple controlRipple control could be used more extensively and effectively than it is today As indicated by Figure 6 not all EDBs extract the full range of benefits from ripple control In fact none of the survey respondents use ripple control to its full capability as a demand management tool especially outside winter
The fundamental barrier to greater use of ripple control is the lack of a national or industry-wide strategy on load control Along with no effective strategy there is no effective market with financial incentives for the controllable load available via ripple control This leads to uncertainty among EDBs about the future of ripple control as well as a lack of coordination between market participants and even conflicting objectives For example some retailers aim to maximise the electricity delivered while EDBs aim to maintain secure supply at minimum cost This research revealed several specific problems that arise due to this lack of industry coordination including
bull lack of understanding among EDBs about consumers electricity use patterns
bull EDBsrsquo ripple control not coordinated with Transpowerrsquos demand management measures
bull retailersrsquo unnecessary removal of working ripple relays without consulting EDB
bull retailers or MEPs failing to program ripple relays
correctly and not consulting EDBs
bull retailers not promoting the benefits of ripple control to consumers or even offering tariff structures (such as flat rates) that discourage load control
bull the lack of clear business incentives for some EDBs to provide ripple control
Part of EDBsrsquo motivation for using and maintaining ripple is political and public expectation that they will run an efficient network Fear of reputational damage may be the most common incentive for EDBsrsquo continued investment in ripple control But such an incentive could be eroded if one or more EDBs were to break ranks by abandoning ripple control There is a greater risk of this among EDBs that reap fewer rewards from ripple control such as those in rural areas The case study on Eastland Networks (Appendix C) shows how for some EDBs distributed generators have business and operational advantages over load management Some EDBs also point out there is a disincentive to providing ripple control because by allowing peak loads to rise EDBs could upgrade their network and increase their revenues
RIP
PLE
CO
NTR
OL O
F HO
T WATE
R IN
NE
W ZE
ALA
ND
- SE
PTE
MB
ER
2020
22
RIP
PLE
CO
NTR
OL O
F HO
T WATE
R IN
NE
W ZE
ALA
ND
- SE
PTE
MB
ER
2020
23
The future of hot water load control31 Short-term outlook for ripple controlIn general ripple control infrastructure is well maintained and its level of deployment is roughly stable Most EDBs consider ripple control to be the best option for managing domestic hot water loads at least for the next few years Nevertheless the proportion of hot water systems in New Zealand connected to ripple control and pilot wire control is declining slowly (see Appendix A) due to
bull removal of ripple relays by retailers and MEPs
bull increased use of alternative water heating systems particularly gas-fired heaters
bull installers of rooftop solar moving hot water systems to the main meter disconnecting from ripple control
bull Vectorrsquos faulty pilot wire system being disabled between 2014 and 2015 and not replaced
Impending regulatory changes may introduce new barriers to the use of ripple control
bull In 2021 the Electricity Authority is planning to introduce Default Distributor Agreements which will make load control a contestable ldquoadditional servicerdquo separate from the distribution service7 EDBs may lose the ability to make hot water load control mandatory in their connection agreements One EDB reported that this change will remove a major incentive for continued investment in ripple control infrastructure This company also believes that it will make coordination harder and that for ripple control to work well it needs a central controller
bull From 2023 Transpowerrsquos Transmission Pricing Methodology will change8 Transmission charges to EDBs will no longer be related to the Regional Coincident Peak Demand (Section 252) For some EDBs this change will remove a financial incentive to deploy ripple control
Even with these changes many EDBs expect to continue to invest in ripple control as it will continue to be useful for limiting peak demand alleviating capacity constraints and deferring network expenditure
30
7 httpswwweagovtnzdmsdocument25535-code-amendment-default-distributor-agreement-proposal
8 httpswwweagovtnzdevelopmentwork-programmepricing-cost-allocationtransmission-pricing-review
RIP
PLE
CO
NTR
OL O
F HO
T WATE
R IN
NE
W ZE
ALA
ND
- SE
PTE
MB
ER
2020
24
32 Ripple control and the evolving electricity systemIn the coming decades New Zealand is likely to see the more widespread adoption of several technologies which could have a major impact on the electricity system These include
bull new sources of consumer demand for electricity particularly electric vehicles
bull domestic rooftop solar panels and batteries
bull grid-scale solar and wind energy which have variable output
These technologies have the potential to make a positive contribution to a cleaner energy system and a reliable electricity grid However their large-scale deployment also creates new risks for the electricity system by increasing fluctuations in supply and demand The importance of demand management is likely to grow to ensure successful integration of these technologies This may mean ripple control retains its value as a load control option Domestic hot water
cylinders are a large reservoir of stored energy which could be used to help balance the intermittent output of solar and wind energy in a similar way to batteries
However the future electricity system will need new approaches to energy management beyond ripple control of hot water New capabilities will be required such as real-time monitoring and control of energy consumption and production at the household level Ripple control is not well adapted to these new requirements as it can only signal to large blocks of hundreds or thousands of consumers Also as a one-way communication system ripple control cannot report on consumersrsquo use or production of energy Therefore as these new approaches to energy management and new capabilities evolve control of electric water heating may transfer from ripple control to new systems
RIP
PLE
CO
NTR
OL O
F HO
T WATE
R IN
NE
W ZE
ALA
ND
- SE
PTE
MB
ER
2020
25
33 The longer-term ndash distributed energy resource management systemsNew Zealands future energy system will need an enhanced ability to monitor forecast control and coordinate energy generation consumption and storage A system with these capabilities is sometimes called a Distributed Energy Resource Management System (DERMS) DERMS depend on a range of smart energy technologies including
bull smart meters that can transmit two-way information on current consumption and send signals to consumersrsquo appliances (Box 1)
bull individual appliances that respond to load and price signals sent by smart meters and home automation systems
bull software to handle monitoring forecasting of energy demand and production and control of appliances
bull alternative communication channels such as cellular networks and broadband
DERMS also depend on reliable two-way communications The risk of a failure in communication can be minimised by using multiple channels such as cellular networks ripple signals broadband and radio A breakdown in one network could then automatically activate an alternative network
There will be significant costs involved with fully implementing DERMS For example consumer meters may need replacing with more advanced devices as described in Box 1 with the data from these made readily available to EDBs However extensive application of DERMS is probably an essential component of New Zealandrsquos future energy system Eventually it could also negate the need for ripple control leading to avoided costs for both ripple relays and ripple control plant
The advent of DERMS has been flagged for many years and some EDBs are currently working with industry partners on DERMS trials For example Vector is carrying out trials of the demand management potential of home battery systems and electric vehicles Some newer smart meters have embedded ripple relays (Box 1) although their ripple control functionality is constrained by one-way ripple control signalling The adoption of smart energy management in New Zealand is slow and piecemeal Barriers to faster progress include
bull Lack of an industry-wide strategy on demand management For example there are no plans or targets for the rollout of the type of advanced smart meter described in Box 1 that integrates metering and control functionality This means industry participants are unclear about the direction and pace of change and lack clear incentives to plan for or invest in demand management fit for the evolving energy system
bull The fragmented ownership of electricity infrastructure leads to uncertainty about responsibility for smart energy management For example some EDBs see it as retailersrsquo responsibility
bull Limited incentives to try out new demand management technologies For example there is no scheme for equitable sharing of resulting cost reductions Also some EDBs believe they need to show that demand management solutions perform as reliably and predictably as traditional investments This sets a high bar which deters investment and innovation
RIP
PLE
CO
NTR
OL O
F HO
T WATE
R IN
NE
W ZE
ALA
ND
- SE
PTE
MB
ER
2020
26
Box 1 - Ripple control and smart metersOver 70 of households and businesses in New Zealand have a smart meter which measures and records electricity consumption at 30-minute intervals This data is transmitted to retailers using a radio or cell phone network Some advanced smart meters have additional features that have implications for the future of ripple control These features include
bull Embedded ripple relays that respond to ripple signals This negates the need for a separate ripple relay at a consumerrsquos premises saving space on the meter board and reducing the cost and complexity of the ripple control system
bull Some smart meter ripple relays can limit the time water heater are switched off or revert to a programmed timetable if they do not receive an expected ripple signal These features improve the reliability of ripple control
bull Some smart meters can also be programmed to control water heating in line with a consumerrsquos retail tariff (such as night-rate heating) This feature of smart meters could replace the need to use ripple control for tariff switching
bull Two-way communication between consumers and retailersEDBs of real-time information on consumption and control capability at the individual household level
bull The ability to communicate with consumerrsquos computing devices home automation systems and electrical appliances
bull Bi-directional energy recording capability suitable for monitoring consumption of electricity (import) and production of electricity (export)
Advanced smart meters with these capabilities could play an important role in the future electricity system Smart meter installations began in New Zealand in 2005 Types and models of meters installed vary so not all meters that have been installed since 2005 have the additional features listed above
RIP
PLE
CO
NTR
OL O
F HO
T WATE
R IN
NE
W ZE
ALA
ND
- SE
PTE
MB
ER
2020
27
34 Integration of ripple control and DERMSRipple control of hot water will continue to play an important role for some time It is likely that EDBs will persist with ripple control of hot water while more advanced technologies are gradually introduced to control electric vehicles batteries and other modern equipment
Even with universal application of DERMS some EDBs see ripple control plants continuing to manage hot water loads by communicating with smart meters which have embedded ripple relays (Box 1) In fact Orion has already carried out a small trial with a retailer using ripple control with DERMS However this will require DERMS that offer good control of hot water heating which is not generally the case today
With the right incentives ripple control of hot water could be used more frequently to manage daily fluctuations in demand and supply It could also be used to control the charging and discharging of electric vehicles and batteries and other appliances Network Tasman is currently conducting a trial of ripple-controlled batteries
Eventually DERMS technologies are likely to displace ripple control due to their greater capacity to control consumer equipment according to market conditions and provide real-time data on consumption at the household level The timeline for widespread introduction of smart energy management is unclear There is currently no industry-wide strategy for ripple control or demand management and this creates uncertainty over responsibility for demand management and the pace of change If change is gradual ripple control may continue for decades interacting with new technologies for example by communicating with smart meters with embedded ripple relays However with a more rapid transformation ripple control could be superseded much more quickly
RIP
PLE
CO
NTR
OL O
F HO
T WATE
R IN
NE
W ZE
ALA
ND
- SE
PTE
MB
ER
2020
28
RIP
PLE
CO
NTR
OL O
F HO
T WATE
R IN
NE
W ZE
ALA
ND
- SE
PTE
MB
ER
2020
29
Conclusions
Ripple control continues to be widely used with assets well maintained and in good condition Around half of New Zealands electricity consumers have ripple control most of which is connected to hot water systems The load connected to ripple control equates to approximately 15 of national peak demand
The proportion of consumers with ripple control is gradually declining due to the removal of ripple relays by retailers and installers of solar panels as well as the increasing number of gas water heaters Vectorrsquos removal from service of their faulty pilot wire system was a major contributor to the 11 decline in the total number of ICPs with ripple or pilot wire controlled hot water heating between 2014 and 2018
Most EDBs continue to invest in ripple control and see it as an effective reliable technology with multiple benefits Capital investment in ripple control plant through to 2029 disclosed in EDB Asset Management Plans is in excess of$16 million across all of New Zealand Operating and maintenance costs for ripple control are not disclosed by all EDBs For those that did disclose these costs for this ripple control research annual operational expenditure per EDB ranged up to$80000 per EDB per year The costs that were disclosed indicate the annual cost of providing ripple control ranges between$10 and$27 per kW of controllable load and between$10 and$19 per ICP
Each EDB takes a different approach to the use of ripple control It is likely to be most useful in integrated networks typical of urban areas and in areas with growing electricity demand Most EDBs use ripple control in winter to maintain network demand within predetermined limits This has several potential benefits including
bull minimising the transmission charges that EDBs must pay to Transpower
bull ensuring demand does not exceed network capacity hence maintaining network security and reducing the risk of outages
bull deferring expenditure on network upgrades helping to keep customer bills lower
Some EDBs use ripple control to manage consumersrsquo electricity use in-line with their electricity tariff For
example a consumer on a night-only tariff will have their water heated between 11pm and 7am This use of ripple control permanently shifts demand away from daytime periods when peaks occur Some EDBs use ripple control to reduce demand in response to emergencies such as a failure in part of the network Another application of ripple control to earn revenue in the reserve market for fast interruptible load
EDBs highlight a lack of clear market incentives to use ripple control Although ripple control reduces the cost of the electricity system the benefits do not necessarily accrue to the consumers and industry participants who provide the service EDBs continue to invest in ripple control for the benefit of end consumers not because of direct business incentives Consumers should receive a reduced rate in return for ripple control however not all retailers provide tariff options that compensate consumers for ripple-controlled load and few retailers appear to actively promote the benefits of ripple control
Most EDBs see ripple control as the best option for managing domestic hot water loads at least for the next few years However industry participants recognise that the evolving electricity system will need new approaches to energy management beyond ripple control of hot water Greater adoption of technologies such as electric vehicles solar power and home battery systems will increase the need to manage electricity demand including at the level of individual households
40
RIP
PLE
CO
NTR
OL O
F HO
T WATE
R IN
NE
W ZE
ALA
ND
- SE
PTE
MB
ER
2020
30
RIP
PLE
CO
NTR
OL O
F HO
T WATE
R IN
NE
W ZE
ALA
ND
- SE
PTE
MB
ER
2020
31
Glossary of terms
Coincident demand ndash The amount of demand at any given point in time All possible loads are never all switched on at the same time so coincident demand varies throughout the day depending on several factors such as weather or the state of thermostats in water heater and space heaters
Electricity demand ndash The amount of electricity required to satisfy all of the connected load
Demand management ndash Being able to switch discretionary loads on and off to exercise some control over the demand of the electricity network both for quantity and time of use
Distributed energy resource management system (DERMS) ndash A system used by an EDB to manage electricity resources distributed in their network such as storage batteries roof top solar standby diesel generators wind turbines
Distribution ndash Transport of electricity in the low voltage distribution network owned by EDBs
EDBs ndash Electricity Distribution Business Also called lines companies distribution companies or distributors of which there are 29 in New Zealand
EECA ndash The Energy Efficiency and Conservation Authority (EECA) is the government agency that works to improve the energy efficiency of New Zealand homes and businesses and encourage the uptake of renewable energy
Electricity Authority ndash The independent Crown entity which provides regulatory oversight of the New Zealand electricity sector
Grid emergency ndash A grid emergency occurs when the system operators ability to meet its principal performance objective (PPO) obligations is at risk equipment or people are at risk or the system operator has to take urgent action to restore the power system to a stable operating state
GXP ndash Grid Exit Point A point of connection where electricity flows out of the national grid to local networks or direct consumers
ICP ndashAn Installation Control Point is a physical point of connection on a local network or an embedded network that the distributor nominates as the point at which a retailer will be deemed to supply electricity to a consumer
Load ndash A device (eg water heater) or collection of devices (eg all electric appliances and devices in a house) that consume electricity
Load control ndash Turning on or off loads in an electricity network
Load diversity ndash The proportion of time that a load draws power compared to the amount of time that the load is connected and has power available
Electric hot water cylinders include thermostats so even though they are connected to a power source if the water is hotter than the thermostat setting then the hot water cylinder will not draw any power When ripple control switches off a group of hot water cylinders some of them will already be off because of thermostat action so the amount of load control that occurs is always less than the total possible load
Load shedding ndash The disconnection of load from a network usually used in an emergency situation when the amount of electricity available is no longer sufficient to meet the all of the load
Metering equipment providers (MEPs) ndashA metering equipment provider is a person who either assumes responsibility for any metering installation or is appointed to be responsible for any metering installation
Generally MEPs own meters and meter reading infrastructure An MEP may also own ripple switches
Network maximum coincident demand ndash The highest measured demand in a network recorded over a specified period often over a year
Regional Coincident Peak Demand (RCPD) ndash An average peak demand figure used in Transpowers transmission
50
RIP
PLE
CO
NTR
OL O
F HO
T WATE
R IN
NE
W ZE
ALA
ND
- SE
PTE
MB
ER
2020
32
pricing methodology defined as
Average of the lsquonrsquo frac12 hour net offtakes during the regional coincident peak periods for the region for a customer at a connection location during the capacity measurement period (CMP)
n=100 in Lower North and Lower South Island and n=100 in the Upper South Island and Upper South Island USI and UNI For the North Island and Lower South Island the months between November and April are excluded from CMP
Retailers ndash A company that sells electricity to customers
Ripple control ndash A method of using the power lines to send signals to turn on and off consumer loads
Ripple (control) channel ndash A means of sending several different signals down the same powerline to control different consumer equipment according to different schedules and functions
Ripple relay ndash A receiver for the ripple control signals which can switch loads on and off
SCADA ndash Supervisory Control and Data Acquisition The systems used by networks to collect and display information on how their system is operating on a moment-by-moment basis Provides the facilities to remotely control the electricity network from a central location
Transmission ndash Transport of electricity in the high voltage transmission network (the national grid) owned by Transpower
Transpower ndash The State-owned enterprise that owns the high voltage transmission network (the national grid) and acts as System Operator
Under frequency eventndash If the power system suddenly experiences a loss of power infeed either because of a generator fault or loss of connection to a generation source then the frequency falls If load is not quickly disconnected or the remaining generation increased to restore balance between generation and load then the frequency will fall further In severe cases the power system can reach a state known as system collapse
RIP
PLE
CO
NTR
OL O
F HO
T WATE
R IN
NE
W ZE
ALA
ND
- SE
PTE
MB
ER
2020
33
In producing this report PSC analysed the existing information on ripple control including
bull EDB emerging technology data gathered by the Commerce Commission in 2018
bull EDB information disclosure data collected each year by the Commerce Commission
bull EDBsrsquo Asset Management Plans
bull Electricity Authority Market Information
A1 Commerce Commission dataIn July 2018 the Commerce Commission surveyed all 29 network companies in New Zealand on the potential changes in peak demand from emerging technologies The survey data published on the Commerce Commissionrsquos website9 includes the most detailed readily available information on the extent of ripple control assets in New Zealand The survey included two metrics on ripple control for the period 2014-18 of interest for this report
bull estimated number of Installation Control Point (ICPs) with ripple control
bull load under ripple control (MW)
Tables 1 to 5 present this data as well as other statistics calculated from the Commerce Commission data including
bull average load of an ICP under ripple control
bull percentage change in ICPs from 2014 to 2018
bull percentage of customers under ripple control
bull percentage of load under ripple control
Table 3 and Table 4 list the ICPs across all EDBs and Table 5 shows that overall 58 of ICPs in New Zealand in 2018 included load under ripple control For most EDBs the percentage is higher than this but the national averaged is skewed downwards by the largest EDB Vector with a sharp drop recorded in the number of ICPs with ripple control
Two substantial discrepancies were found in the numbers of ICPs with ripple control as recorded in the Commerce Commission data compared to figures returned for the EDB survey conducted for this research In Table 4 the entries for WEL Networks and Wellington Electricity use the ICP counts with ripple control as returned for the survey undertaken for this report The number inserted for each year for these two EDBs is the number that was current for the end of 2019 The load under ripple control from the Commerce Commission data appeared to be a good match for the load figures provided by EDBs for the survey undertaken for this report
Change from 2014 to 2018 (Commerce Commission data)The average increase in ICPs from 2014 to 2018 was 46 which compares to New Zealand population growth over the same period of around 5310 Over the same period the EDB information disclosures show a 105 fall in the number of ICPs with ripple control and a decline of 97 in the proportion of ICPs with ripple control This decline was particularly large for the networks owned by Vector and Powerco (Vectorrsquos large decline is due to no longer counting ICPs from pilot wire schemes that are no longer in use)
Appendix A - Summary of existing data on ripple control
60
9 Commerce Commission Oct 2018 Electricity Distribution Businesses emerging technology data httpscomcomgovtnz__dataassetsexcel_
doc0014100670Electricity-distribution-businesses-emerging-technology-data-10-October-2018xlsx
10 Statistics NZ httpswwwstatsgovtnztopicspopulation
11 httpswwwemieagovtnzRetailReportsH3WIHLRegionType=NWKPampMarketSegment=Indamp_si=_dr_DateTo|20171231_dr_
RegionType|NWKP_dr_MarketSegment|Allv|4
RIP
PLE
CO
NTR
OL O
F HO
T WATE
R IN
NE
W ZE
ALA
ND
- SE
PTE
MB
ER
2020
34
According to EDBs the main reasons for the decline are
bull retailersMEPs removing ripple relays
bull replacing of electric water heating with gas
bull solar PV installers removing ripple control and the associated second meter for water heating
Tables 3 to 7 with the summary graphs in figures 8 to 12 were compiled from the Commerce Commission Emerging Technology Data9 and EA market information11
Note that Vectorrsquos ldquoload under ripple controlrdquo is not
shown in the Commerce Commissionrsquos Emerging Technology Data and Vectorrsquos survey response for this study did not include this information either Consequently Table 6 uses a calculated value for Vectorrsquos load under ripple control based on their number of ICPs with ripple control multiplied by the average load per ICP from all other EDBs
RIP
PLE
CO
NTR
OL O
F HO
T WATE
R IN
NE
W ZE
ALA
ND
- SE
PTE
MB
ER
2020
35
Table 3 - Ripple control statistics ndash Total ICPs
Network Company 2014 2015 2016 2017 2018 Change
Vector 542043 547551 553214 560326 567584 47
Powerco 314981 318312 322002 326493 330278 49
Orion 186557 190864 194072 197311 200397 74
Wellington Electricity
165399 166035 166577 167205 168251 17
Unison Networks 108666 109445 109975 110863 111733 28
WEL Networks 86907 88137 89627 91133 92464 64
Aurora Energy 85267 86093 87407 88733 90175 58
Northpower 55368 56051 56918 57859 58724 61
Electra 43419 43679 44068 44528 44912 34
Counties Power 39064 40028 41092 41925 42776 95
Network Tasman 37973 38393 38893 39438 39960 52
MainPower NZ 37026 37627 38328 39047 39843 76
The Power Company
35383 35536 35598 35813 36082 20
Alpine Energy 31721 31947 32163 32444 32634 29
Top Energy 30908 31185 31471 31861 32314 45
Waipa Networks 24801 25250 25784 26269 26776 80
Marlborough Lines 24760 24958 25194 25448 25717 39
Eastland Network 25418 25469 25436 25569 25644 09
Horizon Energy 24411 24435 24544 24644 24726 13
The Lines Company
23058 23269 23439 23557 23613 24
Electricity Ashburton
18534 18882 19067 19283 19515 53
Electricity Invercargill
17358 17407 17390 17445 17443 05
OtagoNet JV 14805 14879 14907 14985 15054 17
Westpower 13319 13392 13456 13528 13627 23
Network Waitaki 12558 12676 12747 12873 12981 34
Nelson Electricity 9092 9109 9114 9140 9166 08
Centralines 8133 8173 8196 8248 8318 23
Scanpower 6716 6709 6691 6680 6680 -05
Buller Electricity 4599 4625 4594 4651 4686 19
North Island 1499292 1513728 1529034 1547160 1564793 44
South Island 528952 536388 542930 550139 557280 54
New Zealand 2028244 2050116 2071964 2097299 2122073 46
RIP
PLE
CO
NTR
OL O
F HO
T WATE
R IN
NE
W ZE
ALA
ND
- SE
PTE
MB
ER
2020
36
Figure 8 - Ripple control statistics - Total ICPs by EDB
0
100000
200000
300000
400000
500000
600000
Vect
or
Pow
erco
Orio
n
Wel
lingt
on E
lect
ricity
Uni
son
Net
wor
ks
WEL
Net
wor
ks
Auro
ra E
nerg
y
Nor
thpo
wer
Elec
tra
Coun
ties
Pow
er
Net
wor
k Ta
sman
Mai
nPow
er N
Z
The
Pow
er C
ompa
ny
Alpi
ne E
nerg
y
Top
Ener
gy
Wai
pa N
etw
orks
Mar
lbor
ough
Lin
es
East
land
Net
wor
k
Hor
izon
Ene
rgy
The
Line
s Co
mpa
ny
Elec
tric
ity A
shbu
rton
Elec
tric
ity In
verc
argi
ll
Ota
goN
et J
V
Wes
tpow
er
Net
wor
k W
aita
ki
Nel
son
Elec
tric
ity
Cent
ralin
es
Scan
pow
er
Bul
ler E
lect
ricity
RIP
PLE
CO
NTR
OL O
F HO
T WATE
R IN
NE
W ZE
ALA
ND
- SE
PTE
MB
ER
2020
37
Table 4 - Ripple control statistics - ICPs with ripple control
Network Company 2014 2015 2016 2017 2018 Change
Vector 388413 221483 220938 219999 214690 -447
Powerco 206510 190721 184423 186634 178516 -136
Orion 155331 157268 159984 162252 164321 58
Wellington Electricity
80000 80000 80000 80000 8000000
Unison Networks 81891 80825 79477 78995 78870 -37
Aurora Energy 66114 66441 66589 66898 67170 16
WEL Networks 53479 53479 53479 53479 53479 00
Northpower 32900 33600 34300 35000 35700 85
Network Tasman 32161 32441 32731 33036 33336 37
Counties Power 29653 30247 30852 31470 32100 83
MainPower NZ 28712 29366 29798 30287 30647 67
Electra 30072 30072 29015 30605 29791 -09
Top Energy 22677 22760 22873 22917 22960 12
Alpine Energy 21817 22037 22260 22485 22712 41
The Power Company
22079 21808 21543 21027-48
Horizon Energy 18480 18557 18650 20231 20332 100
Marlborough Lines 19122 19146 18999 18979 18956 -09
Waipa Networks 17759 17956 18238 18406 18577 46
The Lines Company
17138 16808 16824 16976 1746719
Eastland Network 15220 15192 14908 14429 14430 -52
Electricity Invercargill
12805 12628 12468 12137-52
Electricity Ashburton
11373 11581 11804 11938 1208362
Network Waitaki 9454 9504 9464 9361 9345 -12
Westpower 9300 9300 9300 9300 9300 00
Nelson Electricity 7411 7402 7351 7335 7300 -15
OtagoNet JV 5887 6198 6129 6461 98
Scanpower 4761 4761 4761 4761 4761 00
Centralines 4286 4286 4373 4417 4422 32
Buller Electricity 3442 3300 3318 3374 3362 -23
North Island 1003239 820747 813111 818318 806095 -197
South Island 364237 408557 412232 415385 418157 148
New Zealand 1367476 1229305 1225343 1233703 1224252 -105
RIP
PLE
CO
NTR
OL O
F HO
T WATE
R IN
NE
W ZE
ALA
ND
- SE
PTE
MB
ER
2020
38
Figure 9 - Ripple control statistics - ICPs with ripple control by EDB
250000
200000
150000
100000
50000
0
Vect
or
Pow
erco
Orio
n
Wel
lingt
on E
lect
ricity
Uni
son
Net
wor
ks
Auro
ra E
nerg
y
WEL
Net
wor
ks
Nor
thpo
wer
Net
wor
k Ta
sman
Coun
ties
Pow
er
Mai
nPow
er N
Z
Elec
tra
Top
Ener
gy
Alpi
ne E
nerg
y
The
Pow
er C
ompa
ny
Hor
izon
Ene
rgy
Mar
lbor
ough
Lin
es
Wai
pa N
etw
orks
The
Line
s Co
mpa
ny
East
land
Net
wor
k
Elec
tric
ity In
verc
argi
ll
Elec
tric
ity A
shbu
rton
Net
wor
k W
aita
ki
Wes
tpow
er
Nel
son
Elec
tric
ity
Ota
goN
et J
V
Scan
pow
er
Cent
ralin
es
Bul
ler E
lect
ricity
RIP
PLE
CO
NTR
OL O
F HO
T WATE
R IN
NE
W ZE
ALA
ND
- SE
PTE
MB
ER
2020
39
Table 5 - Ripple control statistics - ICPs with ripple control
Network Company 2014 2015 2016 2017 2018 Change
Network Tasman 85 84 84 84 83 -13
Horizon Energy 76 76 76 82 82 65
Orion 83 82 82 82 82 -13
Nelson Electricity 82 81 81 80 80 -19
MainPower NZ 78 78 78 78 77 -06
Counties Power 76 76 75 75 75 -09
Aurora Energy 78 77 76 75 74 -30
The Lines Company 74 72 72 72 74 -04
Marlborough Lines 77 77 75 75 74 -35
Network Waitaki 75 75 74 73 72 -33
Buller Electricity 75 71 72 73 72 -31
Scanpower 71 71 71 71 71 04
Top Energy 73 73 73 72 71 -23
Unison Networks 75 74 72 71 71 -48
Alpine Energy 69 69 69 69 70 08
Electricity Invercargill 74 73 71 70 -40
Waipa Networks 72 71 71 70 69 -22
Westpower 70 69 69 69 68 -16
Electra 69 69 66 69 66 -29
Electricity Ashburton 61 61 62 62 62 06
Northpower 59 60 60 60 61 14
The Power Company 62 61 60 58 -39
WEL Networks 62 61 60 59 58 -37
Eastland Network 60 60 59 56 56 -36
Powerco 66 60 57 57 54 -115
Centralines 53 52 53 54 53 05
Wellington Electricity 48 48 48 48 48 -08
OtagoNet JV 40 42 41 43 34
Vector 72 40 40 39 38 -338
North Island 67 54 53 53 52 -154
South Island 69 76 76 76 75 62
New Zealand 67 60 59 59 58 -97
RIP
PLE
CO
NTR
OL O
F HO
T WATE
R IN
NE
W ZE
ALA
ND
- SE
PTE
MB
ER
2020
40
Net
wor
k Ta
sman
Hor
izon
Ene
rgy
Orio
n
Nel
son
Elec
tric
ity
Mai
nPow
er N
Z
Coun
ties
Pow
er
Auro
ra E
nerg
y
The
Line
s Co
mpa
ny
Mar
lbor
ough
Lin
es
Net
wor
k W
aita
ki
Bul
ler E
lect
ricity
Scan
pow
er
Top
Ener
gy
Uni
son
Net
wor
ks
Alpi
ne E
nerg
y
Elec
tric
ity In
verc
argi
ll
Wai
pa N
etw
orks
Wes
tpow
er
Elec
tra
Elec
tric
ity A
shbu
rton
Nor
thpo
wer
The
Pow
er C
ompa
ny
WEL
Net
wor
ks
East
land
Net
wor
k
Pow
erco
Cent
ralin
es
Wel
lingt
on E
lect
ricity
Ota
goN
et J
V
Vect
or
Nor
th Is
land
Sout
h Is
land
New
Zea
land
90
80
70
60
50
40
30
20
10
0
Figure 10 - Ripple control statistics - ICPs with ripple control
RIP
PLE
CO
NTR
OL O
F HO
T WATE
R IN
NE
W ZE
ALA
ND
- SE
PTE
MB
ER
2020
41
Table 6 - Ripple control statistics - MW load under ripple control
Load under Ripple Control (MW)Maximum network demand 2018 (MW)
Maximum demand under ripple control 2018
Network Company 2014 2015 2016 2017 2018 Change
Alpine Energy 555 560 566 572 577 41 1405 41
Electra 241 241 232 245 238 -09 590 40
Electricity Invercargill 256 253 249 243 -52 606 40
Buller Electricity 38 38 38 38 38 00 110 35
The Power Company 442 436 431 421 -48 1386 30
The Lines Company 155 153 174 195 183 179 678 27
Orion 1500 1500 1500 1500 1500 00 6077 25
Waipa Networks 169 172 175 177 180 65 750 24
Counties Power 237 242 247 252 257 83 1165 22
Scanpower 30 30 30 30 30 00 140 21
OtagoNet JV 118 124 123 129 98 620 21
Powerco 2065 1907 1844 1866 1785 -136 8969 20
Top Energy 120 120 120 120 120 00 690 17
WEL Networks 464 460 450 451 470 13 2712 17
Electricity Ashburton 152 155 158 160 161 62 1040 16
MainPower NZ 144 147 149 151 153 67 1130 14
Aurora Energy 379 381 382 383 385 16 2997 13
Marlborough Lines 93 93 93 93 92 -09 730 13
Network Waitaki 71 71 71 71 71 00 610 12
Network Tasman 145 146 147 149 150 34 1390 11
Eastland Network 180 180 180 180 180 00 1811 10
Westpower 40 40 40 40 40 00 424 9
Vector 2835 1617 1613 1606 1567 -447 17680 9
Nelson Electricity 30 30 30 30 30 00 340 9
Northpower 141 144 147 150 153 85 1736 9
Wellington Electricity 500 500 500 500 500 00 5750 9
Horizon Energy 55 56 56 61 61 100 930 7
Centralines 10 10 10 10 10 00 211 5
Unison Networks 140 140 140 140 140 00 3490 4
North Island 7343 5971 5919 5983 5875 -200 47302 12
South Island 3146 3976 3985 3989 3991 268 18865 21
New Zealand 10489 9947 9904 9972 9865 -59 66167 15
RIP
PLE
CO
NTR
OL O
F HO
T WATE
R IN
NE
W ZE
ALA
ND
- SE
PTE
MB
ER
2020
42
45
40
35
30
25
20
15
10
5
0
Alpi
ne E
nerg
y
Elec
tra
Elec
tric
ity In
verc
argi
ll
Bul
ler E
lect
ricity
The
Pow
er C
ompa
ny
The
Line
s Co
mpa
ny
Orio
n
Wai
pa N
etw
orks
Coun
ties
Pow
er
Scan
pow
er
Ota
goN
et J
V
Pow
erco
Top
Ener
gy
WEL
Net
wor
ks
Elec
tric
ity A
shbu
rton
Mai
nPow
er N
Z
Auro
ra E
nerg
y
Mar
lbor
ough
Lin
es
Net
wor
k W
aita
ki
Net
wor
k Ta
sman
East
land
Net
wor
k
Wes
tpow
er
Vect
or
Nel
son
Elec
tric
ity
Nor
thpo
wer
Wel
lingt
on E
lect
ricity
Hor
izon
Ene
rgy
Cent
ralin
es
Uni
son
Net
wor
ks
Nor
th Is
land
Sout
h Is
land
New
Zea
land
Figure 11 - Ripple control statistics - Load under ripple control as of the EDBrsquos maximum demand
RIP
PLE
CO
NTR
OL O
F HO
T WATE
R IN
NE
W ZE
ALA
ND
- SE
PTE
MB
ER
2020
43
Table 7 - Ripple control statistics - average load under ripple control per ICP with ripple control
Network Company 2014 2015 2016 2017 2018 Change
Alpine Energy 254 254 254 254 254 00
Electricity Invercargill 200 200 200 200 00
OtagoNet JV 200 200 200 200 00
The Power Company 200 200 200 200 00
Electricity Ashburton 134 134 134 134 134 00
Eastland Network 118 119 121 125 125 55
Buller Electricity 110 115 115 113 113 24
The Lines Company 090 091 104 115 105 157
Powerco 100 100 100 100 100 00
Waipa Networks 095 096 096 096 097 18
Orion New Zealand 097 095 094 092 091 -55
WEL Networks 087 086 084 084 088 07
Counties Power 080 080 080 080 080 00
Electra 080 080 080 080 080 00
Network Waitaki 075 075 075 076 076 12
Vector 073 073 073 073 073 00
Scanpower 063 063 063 063 0630 00
Wellington Electricity 063 063 063 063 0625 00
Aurora Energy 057 057 057 057 057 00
Top Energy 053 053 052 052 052 -12
MainPower NZ 050 050 050 050 050 00
Marlborough Lines 049 049 049 049 049 00
Network Tasman 045 045 045 045 045 -02
Westpower 043 043 043 043 043 00
Northpower 043 043 043 043 043 00
Nelson Electricity 040 041 041 041 041 15
Horizon Energy 030 030 030 030 030 00
Centralines 023 023 023 023 023 -31
Unison Networks 017 017 018 018 018 38
North Island 080 082 082 082 082 20
South Island 086 097 097 096 095 105
New Zealand 082 087 087 087 087 59
RIP
PLE
CO
NTR
OL O
F HO
T WATE
R IN
NE
W ZE
ALA
ND
- SE
PTE
MB
ER
2020
44
000
250
200
150
100
300
050
Alpi
ne E
nerg
y
Elec
tric
ity In
verc
argi
ll
Ota
goN
et J
V
The
Pow
er C
ompa
ny
Elec
tric
ity A
shbu
rton
East
land
Net
wor
k
Bul
ler E
lect
ricity
The
Line
s Co
mpa
ny
Pow
erco
Wai
pa N
etw
orks
Orio
n N
ew Z
eala
nd
WEL
Net
wor
ks
Coun
ties
Pow
er
Elec
tra
Net
wor
k W
aita
ki
Vect
or
Scan
pow
er
Wel
lingt
on E
lect
ricity
Auro
ra E
nerg
y
Top
Ener
gy
Mai
nPow
er N
Z
Mar
lbor
ough
Lin
es
Net
wor
k Ta
sman
Wes
tpow
er
Nor
thpo
wer
Nel
son
Elec
tric
ity
Hor
izon
Ene
rgy
Cent
ralin
es
Uni
son
Net
wor
ks
Nor
th Is
land
Sout
h Is
land
New
Zea
land
kW
Figure 12 - Ripple control statistics - average load under ripple control per ICP with ripple control
RIP
PLE
CO
NTR
OL O
F HO
T WATE
R IN
NE
W ZE
ALA
ND
- SE
PTE
MB
ER
2020
45
95000
96000
97000
98000
99000
100000
101000
102000
103000
104000
105000
106000
0
500000
1000000
1500000
2000000
2500000
2014 2015 2016 2017 2018
Load
(MW
)
Num
ber o
f IC
Ps
Total ICPs Total ICPs with Ripple control Load under ripple control (MW)
Figure 13 - Summary of ICPs and ripple controlled load
00
50
10
15
20
25
30
2014 2015 2016 2017 2018
Figure 14 - Summary of NZ total ripple controlled load as percentage of peak demand
RIP
PLE
CO
NTR
OL O
F HO
T WATE
R IN
NE
W ZE
ALA
ND
- SE
PTE
MB
ER
2020
46
Evaluation of Commerce Commission dataIn Table 6 the ldquoLoad under ripple control (MW)rdquo is a very approximate figure normally an estimate provided by EDBs based on operational experience It is highly variable and subject to seasonal variation It is not directly measurable for existing installations but its effects are observed by monitoring total network demand as ripple control channels are switched on and off From time to time some EDBs carry out drop load testing by switching ripple channels off and on to determine the approximate amount of controllable load that is responding to ripple control
The data summarised in Table 6 show EDBs have significant ability to manage peak loads with an average of 15 of peak demand connected to ripple control This average conceals a wide spread with several EDBs reporting under 10 and several others apparently able to control 30-41 of load
These large variations may reflect differences in what is being reported Some EDBs may have recorded their total theoretical load under ripple control whereas others recorded the actual amount available at any one moment These two figures differ because the amount of load that can be switched off or on depends on the state of each water heaterrsquos thermostat at the moment of ripple control activation A third possibility is that EDBs reported the additional network capacity that would be needed in the absence of any load management capabilities Orion explicitly stated that this is what their response (150 MW) relates to Orion provided an additional note to their response to the Commerce Commission which suggests a lack of clarity about the data sought
This difference in reporting may also explain the disparity in average size of each ICP load under ripple control ndash from 02 kW to 25 kW This may be partly explained by different types of equipment under ripple control ndash for example domestic vs commercial and industrial The high average loads of some EDBs may also be partially explained by larger commercial loads being under ripple control The average controlled load per ICP listed in Table 7 is the after diversity effect of switching off ripple controlled load averaged over the number of ICPs with ripple control Whenever ripple-controlled load is switched off some of the connected
load will already be switched off due to thermostat action This means that the average load listed in Table 7 will always be less than the average rated value of the connect hot water heater elements Commonly today hot water heater elements are rated at 3 kW with older elements rated at 2 kW or occasionally less depending on the size of the cylinder For the top 4 EDBs in Table 7 with an average load of 2 kW and above it is likely that the number of ICPs with ripple control recorded in Table 4 from the Commerce Commission data is under reported The calculated average load for these 4 EDBs is well above the calculated national average These 4 EDBs did not provide returns for this report so the authors have no better data to substitute for the Commerce Commission figures here
The Commerce Commission data does not separate domestic ICPs from other types of connection While Electricity Authorityrsquos registry identifies residential ICPs many EDBrsquos do not appear to keep ripple control load data for commercial and residential installations separate Data provided by EDBs for this research was generally aggregated residential and commercial totals It is reasonable to assume that the majority of ICPs are domestic connections but the proportion is unknown Similarly the data collates all equipment under ripple control and does not reveal the proportion connected to domestic hot water heating systems In many regions most controlled load is likely to be domestic hot water but some networks have a large proportion of other equipment under ripple control For example some rural areas have a substantial load from irrigation pumps
In summary Commerce Commission data for ICP counts with ripple control appears questionable for six of the EDBs Data reported for load size has some uncertainty due to lack of clarity over how the load size has been determined Overall there is reasonable confidence that around 50 of customers nationwide have ripple controlled hot water heating If anything this proportion may be under reported The proportion is over 70 in several regions ndash often those where ripple control of electric hot water is a condition of service
RIP
PLE
CO
NTR
OL O
F HO
T WATE
R IN
NE
W ZE
ALA
ND
- SE
PTE
MB
ER
2020
47
Appendix B - Costs of ripple control
70
Every year all 29 network companies in New Zealand must meet Commerce Commission information disclosure requirements by publishing financial technical and pricing information Technical information is published in Asset Management Plans containing statutory information disclosures which the Commerce Commission consolidates into a spreadsheet published on the Commerce Commissionrsquos website12
Forecast operational expenditure for load control is not separately reported in the EDB disclosures preventing comparisons of the cost of providing ripple control across all of New Zealand EDB Asset Management Plans include forecast expenditure for ldquosignificantrdquo load control replacement and renewal projects
Load control replacement and renewal costs found in the EDB 2019 Asset Management Plans have been extracted and shown in Table 8 The costs for Orion are not directly comparable to other EDBs listed in the table as the Orion costs include replacement of load control SCADA systems used in the Orion network and for the Upper South Island load control scheme Other EDBs planning to replace load control SCADA systems such as Wellington Electricity listed the SCADA replacement separately For some others costs for load control and network SCADA are reported as a single combined figure The 10-year forecast total capital expenditure from Table 8 totals$168M This equates to$079 per year per ICP or$170 per year per kW of controllable load
Operations and maintenance costs for ripple control only are not able to be identified from expenditure disclosure made by most EDBs The PSC survey of EDBs requested an estimate of the annual cost of providing ripple control ie capital expenditure and maintenance excluding the cost of ripple relays This produced the spread of results shown in Table 9 To supply and install standalone ripple relays costs approximately$300 which assuming a life of 30 years is$10year Adding this to the costs in Table 9 gives indicative cost ranges for providing ripple control of
bull $10ICPyear to$19ICPyear or
bull $10kWyear to$27kWyear
The alternative to load management to meet peak demand is increased peak capacity for distribution At present the peak distribution charges for Vector Orion and Wellington Electricity average at approximately$130kWyear13 compared to a mid-point of$1850kWyear for ripple control
12 Commerce Commission Nov 2019 Electricity distributorrsquos information disclosure data 2013-2019
httpscomcomgovtnz__dataassetsexcel_doc0022155047Electricity-distributors-information-disclosure-data-2013-2019xlsm
13 httpsblob-staticvectorconzblobvectormediavector-regulatory-disclosures180201_price-schedule-1_apr-2018pdf
httpswwwwelectricityconzdisclosurespricing2020document206
httpwwworiongroupconzassetsCompanyCorporate-publicationsScheduleOfDeliveryPricespdf
RIP
PLE
CO
NTR
OL O
F HO
T WATE
R IN
NE
W ZE
ALA
ND
- SE
PTE
MB
ER
2020
48
Table 8 - Capital expenditure for ripple control plant replacements and upgrades (from Asset Management Plans)
Network company
2020 $000
2021 $000
2022 $000
2023 $000
2024 $000
2025 $000
2026 $000
2027 $000
2028 $000
2029 $000
Totals $000
Vector Lines $2990 $1200 $60 $700 $30 $30 $30 $30 $30 $30 $ 5130
Orion NZ $140 $140 $1140 $890 $190 $620 $190 $190 $190 $190 $ 3880
Powerco $780 $780 $780 $ 2340
Network Tasman
$450 $350 $ 800
Top Energy $74 $708 $ 782
Unison Networks
$720 $ 720
OtagoNet $603 $603
Counties Power
$300 $200 $500
Wellington Electricity
$40 $60 $60 $60 $60 $60 $60 $80 $480
Alpine Energy $400 $ 400
Northpower $100 $100 $100 $100 $ 400
EA Networks $9 $388 $397
Horizon Energy
$259 $259
The Power Company
$72 $72
Aurora Energy $ -
Buller Electricity
$ -
Centralines $ -
Eastland Network
$ -
Electra $ -
Electricity Invercargill
$ -
Mainpower $ -
Malborough Lines
$ -
Nelson Electricity
$ -
Network Waitaki
$ -
Scanpower $ -
The Lines Company
$ -
Waipa Networks
$ -
WEL Networks
$ -
Westpower $ -
Total $4834 $2260 $2140 $2083 $2718 $710 $1018 $480 $300 $220 $16763
RIP
PLE
CO
NTR
OL O
F HO
T WATE
R IN
NE
W ZE
ALA
ND
- SE
PTE
MB
ER
2020
49
Vect
or L
ines
Orio
n N
Z
Pow
erco
Net
wor
k Ta
sman
Top
Ener
gy
Uni
son
Net
wor
ks
Ota
goN
et
Coun
ties
Pow
er
Wel
lingt
on E
lect
ricity
Alpi
ne E
nerg
y
Nor
thpo
wer
EA N
etw
orks
Hor
izon
Ene
rgy
The
Pow
er C
ompa
ny
Auro
ra E
nerg
y
Bul
ler E
lect
ricity
Cent
ralin
es
East
land
Net
wor
k
Elec
tra
Elec
tric
ity In
verc
argi
ll
Mai
npow
er
Mal
boro
ugh
Line
s
Nel
son
Elec
tric
ity
Net
wor
k W
aita
ki
Scan
pow
er
The
Line
s Co
mpa
ny
Wai
pa N
etw
orks
WEL
Net
wor
ks
Wes
tpow
er
$0
$1000000
$2000000
$3000000
$4000000
$5000000
$6000000
Figure 15 - Planned capital expenditure on ripple control plant upgrades and replacements from 2020 to 2029
RIP
PLE
CO
NTR
OL O
F HO
T WATE
R IN
NE
W ZE
ALA
ND
- SE
PTE
MB
ER
2020
50
Network Company
Load (MW) ICP Costyr CostICPyr CostkWyr
Eastland Networks
1802 14430 $20000 $139 $111
Marlborough Lines
923 18956 $30000 $158 $325
Network Tasman 1500 33336 $250000 $750 $1667
Northpower 1530 35700 $86000 $241 $562
Orion 15000 164321
Powerco 17852 178516 $930000 $521 $521
Scanpower 300 4761 $20000 $420 $667
Vector 15672 214690
WEL Networks 4700 53479 $500000 $935 $1064
Wellington Electricity
5000 80000 $15000 $019 $030
Table 9 - Annualised cost estimates to provide ripple control excluding ripple relays
RIP
PLE
CO
NTR
OL O
F HO
T WATE
R IN
NE
W ZE
ALA
ND
- SE
PTE
MB
ER
2020
51
Appendix C - EDB Case studies
80
Case study 1 - Eastland Network
Introduction to Eastland NetworkEastland Network distributes electricity to approximately 19600 domestic consumers and 6000 non-domestic consumers in Gisborne Wairoa and the east coast Eastland owns and maintains the poles wires and underground cabling as well as since March 2015 the towers and poles that connect the region to the national grid
Electricity demand in the Eastland region has been steady in recent years with small declines in rural demand offset by small increases in towns Eastland services no large industrial loads
Eastland Network is part of Eastland Group wholly owned by the Eastland Community Trust that also owns Eastland Port Gisborne Airport and Eastland Generation which produces electricity from hydro diesel and geothermal plants
Ripple control capability and conditionEastland estimates it has approximately 18 MW of load connected to ripple control (The exact figure is uncertain as the extent of ripple was last accurately assessed in 2000) The vast majority (at least 95) of connected load is domestic hot water Eastland estimates that around one quarter of domestic hot water is not connected to ripple control most of which is thought to be gas heating
Eastland owns all ripple relays in its network outside Wairoa accounting for about 73 of relays at customersrsquo sites Ripple relays in the Wairoa area are owned by third parties In recent years many relays have been removed by retailers as they install smart meters especially in Gisborne area Only around 50 of Gisborne Wairoa and East Coast properties have a smart meter the lowest penetration In New Zealand
RIP
PLE
CO
NTR
OL O
F HO
T WATE
R IN
NE
W ZE
ALA
ND
- SE
PTE
MB
ER
2020
52
Table 10 - Ripple control capability of Eastland Network
Total network peak demand (maximum coincident demand14)
59 MW
Total network load connected to ripple control18 MW (figures from 2000)
Network maximum coincident domestic demand 47 MW
Network domestic water heating load connected to ripple control
Eastland cannot differentiate between domestic and commercial water heating control
Network total domestic water heating load not connected to ripple control
6 MW (estimate)
Load in your region can be reduced using ripple control
26 MW (Gisborne- 2 MW Wairoa - 06 MW)
Domestic hot water heating as proportion of network ripple control
95
Total number of Installation Connection Points (ICPs) 25569
Total ICPs with ripple control 18628
Total domestic ICPs 19555
Domestic ICPs with ripple-controlled water heating 17254
14 Maximum coincident demand is the peak load that has been recorded during a reporting period ndash usually 12 months This is less than the maximum
possible load because everything in the network is never drawing power at the same time
RIP
PLE
CO
NTR
OL O
F HO
T WATE
R IN
NE
W ZE
ALA
ND
- SE
PTE
MB
ER
2020
53
Box 2 - Eastlands ripple control plant ndash Asset Health IndicatorsNetwork companies report on the health of their assets in their information disclosures according to the Electricity Engineers Association (EEA) Asset Health Indicator Guide (AHI 2016) The guide is intended to help network companies identify assets that need replacing and plan upgrades
Eastlandrsquos ripple control plant is fully working but is end of life with lack of readily available spares All of Eastlandrsquos controlled water heating load is dependent on end of life ripple plant
Note that this health assessment covers the central ripple control plant owned by Eastland Networks not the ripple relays located at customer premises some of which are owned by others (ie retailers and Metering Equipment Providers)
Table 11 - Eastland Networks central ripple control plant health assessment
Asset Health Indicator of ripple control central plant
H5 As new condition ndash no drivers for replacement 0
H4Asset serviceable - no drivers for replacement normal in-service deterioration
0
H3End-of-life drivers for replacement present increasing asset related risk
0
H2End-of-life drivers for replacement present high asset related risk
100
H1 Replacement recommended 0
RIP
PLE
CO
NTR
OL O
F HO
T WATE
R IN
NE
W ZE
ALA
ND
- SE
PTE
MB
ER
2020
54
Current application of ripple controlEastland uses ripple control of hot water on weekdays for 2 to 3 months during winter with maximum use in August On these days the load control system turns off 40 of the Gisborne relays at around 430 pm to reduce fast-building demand The company always limits off periods for heating water to 3 hours in the morning and 3 hours in the evening Eastland estimates based on the visual projection of load graphs it can reduce peak loads by around 26 MW using ripple control (2 MW in Gisborne and 06 MW in Wairoa) This represents less than 5 of peak loads ndash a lower proportion than many other network companies The ripple control systems turn hot water systems on and off in large blocks of roughly 1 MW
For about one month during winter network load management is via ripple control and diesel generators Eastland Generation owns several 1 MW diesel generators around the Tairawhiti and Wairoa regions which are used mostly to manage peak loads in winter These diesel generators are turned on automatically when the load reaches a pre-determined threshold and run for at least 2 to 4 hours
Diesel generators are designed to run at maximum output not partial loads Eastland therefore deploys ripple control for 20 to 30 minutes while its generators are ramping up and for a similar period while they are ramping down Ripple control reduces the periods when this diesel generation is required Without ripple control the diesel generators would be required throughout winter
The overriding motivation for Eastland to deploy ripple control is to manage winter peak loads Eastland does not use ripple control for many of the reasons cited by other network companies such as maintaining network security alleviating distribution network constraints deferring capital investment emergency load management or supporting retailer tariff schemes
Eastlandrsquos use of ripple control does reduce its transmission charges ndash but as a side-effect rather than a direct motivation Transpowerrsquos method of allocating charges to distribution companies (based on Regional Coincident Peak Demand) is not a sufficient incentive for Eastland to reduce loads because it contributes only a small amount to the regional load In any case Eastland is able to pass transmission charges onto the retailers (and therefore electricity customers)
About once every two years Eastland is asked to carry out emergency load shedding to relieve transmission constraints However it uses its diesel generators to support this load shedding rather than ripple control Ripple control would only be useful during an emergency if it coincided with a period when many customers were heating water which isnrsquot always the case
From 2003 to 2005 as part of a national drive to conserve energy Eastland used ripple control to switch off water heaters for two 3-hour periods per day Eastland considers that this measure only saved energy to the extent that customersrsquo water was not as hot as normal R
IPP
LE C
ON
TRO
L OF H
OT W
ATER
IN N
EW
ZEA
LAN
D - S
EP
TEM
BE
R 20
2055
Does ripple control deliver its potential benefitsSection 22 of this report outlines six potential benefits of using ripple control Table 3 summarises whether each of these benefits is achieved in the case of Eastland Network
Table 12 - The benefits of Eastlandrsquos use of ripple control
Potential benefit Benefit delivered
Reducing network costs
No Used only to manage winter peaks in conjunction with embedded diesel generation
Reducing domestic energy bills
Yes To the extent that reduces transmission charges that Eastland passes onto retailers
Reducing generation costs
Yes Without ripple control embedded diesel generators would be used for longer periods
Supporting reliability of the electricity system
No
Power quality support No
Supporting the clean energy transition
Yes Without ripple control embedded diesel generators would be used for longer periods
Technical problems with ripple control When retailers replace consumersrsquo meters there have been issues with incorrectly wired ripple relays In cases where consumers pay an electrician to fix this problem Eastland reimburses the consumer and bills the retailer There is a lack of skills in the Eastland region to maintain and repair ripple control infrastructure meaning Eastland would struggle to resolve any major technical problems
Ripple control rarely causes problems where ripple control interacts with Eastland consumersrsquo equipment in undesirable ways The only major technical problems with ripple control occurred more than a decade ago For example in 2000 Eastland briefly used ripple control in Mahia to enable a retailer to carry out time-shifting Load fluctuation then caused the system to trip so Eastland discontinued the time shifting and stopped using load control in Mahia In 2001 weak signalling issues in the Mahia area prompted Trustpower to remove all their ripple relays
Barriers to the more effective use of ripple controlEastland has very little financial incentive to continue maintaining and investing in ripple control Eastlandrsquos existing dispatch system for ripple control and diesel generation does not anticipate load changes correctly and would need additional investment to make software improvements Its main incentive is to meet government and regulatorsrsquo expectations that network companies operate efficiently Eastland believes that abandoning load control could harm the companyrsquos image Without this motivation Eastland might stop investing in ripple control altogether
Even so load control is becoming less important for Eastland The company has found diesel generators to be a more flexible alternative for managing peak demand The generators also reduce Eastlandrsquos transmission charges
Diesel generators provide back up if a line goes down and can reduce the need to upgrade or build new lines In Wairoa Eastland has found the 5 MW embedded hydropower plant to be more effective at managing loads than ripple control
Eastland does not work with retailers to maximise benefits from ripple and has no incentives or requests to do so One barrier to using ripple control for time of use tariffs is that it requires Eastland to reprogram individual relays at a cost of$100 to$200 per relay
RIP
PLE
CO
NTR
OL O
F HO
T WATE
R IN
NE
W ZE
ALA
ND
- SE
PTE
MB
ER
2020
56
Future approaches to ripple control and demand management
Use of ripple control is slowly declining due to removal by retailers as well as increasing installations of rooftop solar Solar installers often move the hot water system to the main meter disconnecting it from ripple control
In future Eastland hopes to see responsibility for load control move to retailers Retailers will use energy management systems involving smart meters and individual appliances that respond to load and price signals This may replace the need for traditional ripple control as Eastland believe it makes no sense to have two load control systems operating simultaneously Ripple signals may still be useful as the means of communicating with smart appliances
However Eastland says smart demand management has been promised for several years without any real progress This leaves Eastland in an uncertain position regarding the future of ripple control
A few years ago Eastland explored the option of setting up a company to install smart meters and providing energy management services to individual customers However the initiative was abandoned and Eastland now believes its best option is to continue managing loads using small generators
RIP
PLE
CO
NTR
OL O
F HO
T WATE
R IN
NE
W ZE
ALA
ND
- SE
PTE
MB
ER
2020
57
Case Study 2 - Orion Group
Introduction to Orion
Orion owns and operates the electricity distribution network that provides power to central Canterbury from the Waimakariri River in the north to the Rakaia River in the south Orion distributes electricity to more than 200000 homes and businesses In 2019 total energy distributed across Orionrsquos network was 3317 GWh an increase of 8 GWh on 2018
Orion is a community-owned entity with two key shareholders ndash Christchurch City Council and Selwyn District Council
Ripple control capability and conditionThe vast majority of residential water heating load in Orionrsquos region can be turned on and off by ripple control This gives Orion significant capability to reduce peak demand by turning off hot water systems Domestic water heating accounts for 90 of Orionrsquos controllable load
The total amount of electrical load that Orion can control varies throughout the day week and year Controllable load peaks at about 57 MW on cold winter mornings Domestic water heating can be turned off using ripple control for up to 4 hours and equates to about 10 of demand (Table 13) Orion also has 190 MW of load connected to ripple control for the purposes of switching on appliances (mostly hot water) during low tariff periods at night
Orion operates two ripple coding systems
bull Telenerg based on 11 kV injectors using a 175 Hz carrier frequency which operates mainly in the urban Christchurch and Lyttelton areas and
bull Decabit based mainly on 33 kV injectors using a 317 Hz carrier frequency which operates in the rural Canterbury and Banks Peninsula areas
This plant is generally in a good condition (Box 3) and present few technical problems Each plant communicates with a few thousand consumers though specific channels could be used to reach just a few hundred consumers The timetables for ripple control for tariff switching are programmed into the ripple control plant and reassessed every year The timetables can also be switched by the Orion SCADA system
Orion believes that the success of its ripple control systems relies just as much on its people and processes as it does on hardware and software
Ripple control ownershipOrion owns and operates its ripple injection plant Ripple relays at consumersrsquo sites are all owned by either retailers or Metering Equipment Providers (MEPs) Most dwellings have two electricity meters ndash one for hot water and one for all other appliances A few years ago without consultation a retailer removed 6000 ripple relays from Orionrsquos network as part of a program installing new meters Ownership of meters at the sites where these relays were removed has changed again since the removal Orion does not know if the ripple relays have been replaced but in the absence of clear incentives for retailer to use load control it is unlikely
RIP
PLE
CO
NTR
OL O
F HO
T WATE
R IN
NE
W ZE
ALA
ND
- SE
PTE
MB
ER
2020
58
Table 13 - Ripple control capability of Orion Network
Total network peak demand (maximum coincident demand15)
610 MW
Total network load connected to ripple control and load that can be reduced using ripple control
(A simple figure for load reduction is not available All loads are not necessarily available at the same time and have seasonal and weather dependencies)
250 MW made up of
bull Residential water heating 57 MW connected most of which is available to reduce peak loads
bull Business water heating 3 MW connected most of which is available to reduce peak loads
bull Night load tariff switching 190 MW in total If this load was not controlled it would add approx 73 MW to load
bull Emergency control All above load can be switched off in an emergency Effectiveness depends on the time of occurrence of the emergency as some load may already be switched off due to normal ripple control action
Network maximum coincident domestic demand)Orion cannot separate domestic component of peak demand
Network total domestic water heating load not connected to ripple control
10
Domestic hot water heating as proportion of network ripple control
90
Total number of Installation Connection Points (ICPs) 207521
Total ICPs with ripple control 169000
Total number of domestic ICPs 178000
Domestic ICPs with ripple controlled water heating 160000
15 Maximum coincident demand is the peak load that has been recorded during a reporting period ndash usually 12 months This is less than the maximum
possible load because everything in the network is never drawing power at the same time
RIP
PLE
CO
NTR
OL O
F HO
T WATE
R IN
NE
W ZE
ALA
ND
- SE
PTE
MB
ER
2020
59
Box 3 - Orionrsquos ripple control plant ndash Asset Health IndicatorsEDBs report on the health of their assets in their information disclosures in accordance with the Electricity Engineers Association (EEA) Asset Health Indicator Guide (AHI 2016) The guide is intended to help electricity network companies identify assets that need replacing and plan upgrades
Orionrsquos asset health disclosure shows most of its ripple control plant to be in good condition although 16 are nearing end of life (Table 14) As ripple control is an important part of Orionrsquos network management strategy the company will continue to invest in replacement of end of life ripple control equipment
Note that this health assessment covers the central ripple control plant owned by Orion not the ripple relays located at consumer premises which are owned by retailers and MEPs
Table 14 - Orion Group central ripple control plant health assessment
Asset Health Indicator of ripple control central plant
H5 As new condition ndash no drivers for replacement 9
H4Asset serviceable - no drivers for replacement normal in-service deterioration
75
H3End-of-life drivers for replacement present increasing asset related risk
16
H2End-of-life drivers for replacement present high asset related risk
0
H1 Replacement recommended 0
RIP
PLE
CO
NTR
OL O
F HO
T WATE
R IN
NE
W ZE
ALA
ND
- SE
PTE
MB
ER
2020
60
Current application of ripple controlOrion operates the Upper South Island Load Management (USILM) Project a collaboration between eight EDBs to manage the peak loads on the transmission grid During periods of high electricity demand these companies use ripple control to manage domestic water heating throughout the region In a grid emergency16 the system can also reduce water heating load rapidly to help avoid power outages The USILM Project has led to a reduction in transmission charges and the deferral of investment in new transmission capacity
Orion uses ripple control of domestic hot water to reduce peak load on about 30 days per year mostly in winter Orion also uses ripple control for tariff switching emergency control and high consumption signalling
By using ripple control Orion can maintain reliability of supply and keep consumer bills lower Orion considers that its use of ripple control provides a major benefit to its consumers and the electricity system Orion says that benefitting consumers who are the ultimate owners of the company is their main incentive for deploying ripple control
Ripple control for reducing peak load Orion aims to keep total load below a network limit of 580 MW This limit is reviewed frequently and may change based on its effectiveness When the load approaches this level Orion sends ripple control signals to switch off hot water heaters For example if an excess load of 2 MW is expected the system will send an ldquooffrdquo signal that it estimates will reduce the load by 2 MW Once load levels start to fall appliances are switched on again Orion has about 57 MW of residential water heating connected to ripple control (Table 13) and can reduce peaks by just under this amount In addition Orion can turn off approximately 3 MW of business water heating
On days of high energy use water heaters are often switched off for up to four hours during the morning or
evening with four hours for re-heating in between Orion aims to limit the time domestic water heaters are turned off to no more than four hours in any eight-hour period to minimise impact on the consumersrsquo availability of hot water Business water heaters are turned off for only two hours During peaks that last longer than four hours Orion rotates through the ripple channels at least every 10 minutes so that the accumulated off time of each water heater is not too long
Figure 16 shows Orionrsquos peak load on 1 July 2020 a particularly cold winterrsquos day with high consumption throughout the day The red line shows what would have occurred in the absence of control The green line is what actually happened ndash both morning and evening peaks were flattened using control measures including ripple control of domestic hot water With ripple control being active over approximately 12 hours of the day the load limit was adjusted while ripple control was in use and ripple channels were cycled to avoid individual water heaters being turned off for excessive periods of time
16 Transpower may declare a Grid Emergency when problems arise and it believes it is unable to continue to keep the
power system operating in the required stable state Transpower may then request EDBs to assist by quickly reducing load
RIP
PLE
CO
NTR
OL O
F HO
T WATE
R IN
NE
W ZE
ALA
ND
- SE
PTE
MB
ER
2020
61
700
600
500
400
300
200
100
0
Time of day
Orion network load and load management
Percent shed
Perc
ent s
hed
Load
ing
(MW
)
12am 1a
m
2am
3am
4am
5am
6am
7am
8am
9am
10am
100
90
80
70
60
50
40
30
20
10
0
11am
12pm 1p
m
2pm
3pm
4pm
5pm
6pm
7pm
8pm
9pm
10pm
11pm
12pm
Peak periodControl period Limit Uncontrolled loadNetwork load
Figure 16 - Orion network load and load management on a winterrsquos day (172020)
(Source Orion Load Management Dashboard (httpsonlineoriongroupconzLoadManagement)
Figure 16 - Orion network load and load management on a winterrsquos day (172020)
Ripple control to align with off-peak tariffs Residential electricity consumers can choose cheaper electricity tariffs where appliances such as water cylinders and night store heaters are operated outside peak periods For example on the most common night-only tariff heating occurs overnight and is then off all day (Other tariffs are peak control night only with afternoon boost night only with weekend boost and emergency control)
Orion sends fixed-time ripple control signals every day to support these tariffs This permanently shifts load away from the daytime periods when peaks occur Without night control of hot water Orion estimates the coincident network peak would be 73 MW higher Orion uses ripple control to stagger the switching times for night heating of hot water to limit the step sizes of load change across its network
Orion receives no incentives from retailers for providing this service Orion aims to limit load without breaching service level targets agreed with electricity retailers and Transpower This involves a challenging trade-off between costs and service quality
Emergency control Orion also uses ripple control for emergency load shedding17 on a small but growing number of domestic water heaters Consumers signed up to the emergency control option account for less than 1 MW of load (Table 13) Orion only interrupts
water heating supply to these consumers to prevent or limit outages during emergency capacity shortages Residential consumers can expect fewer than two emergency events per year lasting up to two hours Retailers offer no discounts for the emergency control option and it is the closest Orion offer to continuous water heating
High consumption signalling Orion use ripple control to signal higher network energy consumption periods to some commercial consumers These consumers then have the option to use their own load control systems to minimise their electricity costs Their responses to high consumption signals include load reduction load shifting and starting up on-site diesel generators The cumulative impact of these responses varies but is approximately 25 MW High consumption signalling using ripple control occurs on fewer than 30 days per years High energy consumption links to increased transmission and distribution costs and but not directly to energy prices
Orion does not use ripple control to participate in the reserve market for fast interruptible load response as any ripple control system is too slow18 Orion also uses ripple control for street lighting industrial price signalling and irrigation load control (emergency only)
RIP
PLE
CO
NTR
OL O
F HO
T WATE
R IN
NE
W ZE
ALA
ND
- SE
PTE
MB
ER
2020
62
Does ripple control deliver its potential benefitsSection 22 of the main report outlines six potential benefits of using ripple control Table 15 summarises whether each of these benefits is achieved in the case of Orion
Table 15 - The benefits of Orionrsquos use of ripple control
Potential benefit Benefit delivered
Reducing network costsYes Ripple control reduces network costs and defers investment in distribution and transmission upgrades
Reducing domestic energy billsYes because Orion charges less due to ripple control but Orion cannot be sure that savings flow through to the consumers whose hot water is controlled and not also those with uncontrolled electric water heating
Reducing generation costsYes as required peak generation reduces The company believes current spot prices do not always reflect generation cost or actual loads
Supporting reliability of the electricity system
Yes Improves reliability and n-1 security
This benefit is linked to use of ripple control by all EDB participants in the Upper South Island Load Management Project
Power quality support On occasion automatic ripple response has kept system within voltage stability limits This benefit is linked to use of ripple control by all EDB participants in the Upper South Island Load Management Project
Supporting the clean energy transition
Ripple control supports the clean energy transition allowing control of the peak demand contribution from hot water to help match the variable output of clean energy sources embedded in the network such as roof top solar power
17 Emergency load shedding is a deliberate action taken to selectively reduce load in a network when a power supply problem arises Without emergency load
shedding power supply problems may cause more widespread and indiscriminate power cuts which take longer to recover from
18 In some other NZ regions pilot wire water heating control has been used for interruptible load control as it has faster signalling than ripple control See
also WEL Networks case study for their method of participating in the reserve market
N-1 security means the electricity system is in a secure state and for any one credible contingency event it would move to a satisfactory state
RIP
PLE
CO
NTR
OL O
F HO
T WATE
R IN
NE
W ZE
ALA
ND
- SE
PTE
MB
ER
2020
63
Technical problems with ripple control Orion has few technical problems with ripple control Orionrsquos ripple injection plants send nightly confirmation signals to ensure hot water systems are turned back on Additional confirmation signals can also be sent when problems arise There are occasional problems during maintenance of the distribution network when ripple signals must reach further through the network
Sometimes ripple relays fail or difficulties arise when a consumerrsquos hot water needs change Consumers often contact Orion with these issues but Orion refers consumers to their retailer as it is the responsibility of the ripple relay owners to fix In rare cases where the problem does relate to network signalling Orion compensates the consumer for any electrical work they have paid for
Barriers to the more effective use of ripple controlIt is a condition of Orionrsquos delivery service that its consumers with electric hot water heating have a ripple relay installed This requirement applies to all new connections and to all existing connections that already have ripple control Nevertheless the size of controllable domestic hot water load is slowly declining As mentioned above there have been instances of retailers removing ripple relays from Orionrsquos network Also the installation of rooftop solar is often accompanied with switching the hot water system to the main meter by-passing ripple control
Orion has very few business incentives to use and maintain ripple control as network savings are passed onto retailers (and hopefully consumers) In fact there is a disincentive as without ripple control Orion would need to upgrade its network and could make a return on this investment and grow its business Orion avoids this approach as it would be to the detriment of its consumers
In the absence of any national or industry-wide strategy for load management there is a lack of alignment about how to apply ripple control of hot water Ripple control favours some market participants and disadvantages others such as generators Increasingly electricity retailersrsquo pricing plans fail to reward consumers for ripple control of their water heating For example some retailers offer power at a flat rate giving the consumer no incentive to avoid heating water at peak times
In 2021 the Electricity Authority is planning to introduce default distributor agreements under which access to controllable loads will be opened up to a competitive market This will reduce Orionrsquos ability to control loads and retailers may switch consumers onto uncontrolled load to avoid the cost of maintaining ripple relays Orion believes that for load control including ripple control to work well it needs a central controller Furthermore if Orion loses central control of load management it would remove a major incentive for continued investment in its ripple control infrastructure
Future approaches to ripple control and demand managementRipple control of hot water is a simple low-cost technology that works well for Orion and its consumers It probably already operates close to its maximum potential in terms of managing Orionrsquos peak loads
However as more New Zealanders adopt technologies such as roof top solar and electric vehicles it will become more important to manage the electricity consumption and production at the level of individual consumers so that the aggregated effect can be properly controlled Ripple control does not currently provide this level of control However in the future Orion sees ripple signals interacting with distributed energy resource management systems (DERMS) and the company has already carried out a small trial with a retailer using ripple control with DERMS
RIP
PLE
CO
NTR
OL O
F HO
T WATE
R IN
NE
W ZE
ALA
ND
- SE
PTE
MB
ER
2020
64
Ripple control could also support the integration of more variable renewable energy into the grid Domestic hot water tanks represent a large reservoir of energy which could be used to balance the intermittent output of solar and wind energy However this will require DERMS that offer good control of hot water heating The systems Orion has explored so far are not able to provide this
One drawback of ripple control is that it is one-way communication Orion does not know if signals are received by individual relays and cannot diagnose problems A future demand management system should involve two-way communications Orion does not regard the Internet as a suitable alternative as they observed it to be less reliable than ripple control signals during the Christchurch earthquake emergency situations
Orion believes that a successful future for ripple control of hot water depends on an industry-wide strategy and supportive regulatory system This system would set appropriate incentives for all market participants and leave overall control in the hands of distribution companies
RIP
PLE
CO
NTR
OL O
F HO
T WATE
R IN
NE
W ZE
ALA
ND
- SE
PTE
MB
ER
2020
65
Case study 3 - Powerco
Introduction to PowercoPowerco distributes electricity to more than 340000 urban and rural households businesses and major industrial and commercial sites in New Zealands North Island Powercorsquos networks are in the Taranaki Wanganui Rangitikei Manawatu and Wairarapa regions including the urban centres of New Plymouth Wanganui Palmerston North and Masterton as well as Tauranga and the surrounding rural areas and the eastern and southern Waikato Thames and Coromandel regions
Powerco is New Zealandrsquos largest electricity distributor in terms of network length (28000km) and has the second largest number of electricity connections Total energy distributed across Powercorsquos electricity networks was 5099 GWh in 2019 up from 4809 GWh on 2017
Powerco is a privately owned network company which also operates a gas distribution network
Ripple control capability and conditionPowerco has significant capability to reduce peak demand using ripple control connected to domestic hot water Powerco estimates the maximum connected load for water heating as 280 MW (Table 16) The vast majority (about 95) of this load is domestic Ripple control provides fast response (under 10 seconds) and is extremely reliable and effective
The meter registry indicates that 194000 consumers in Powercorsquos network have controllable load (Table 16) The actual number is lower as not all these consumers are currently connected to ripple control Powerco cannot quantify these unconnected consumers as the meter registry does not differentiate between controlled and uncontrolled domestic water heating There is also no mechanism for reporting the removal of a ripple relays or the replacement of an electric water heater with another type of system Table 16 presents Powercorsquos estimate of its total controllable load as 155 MW - an estimate based on assuming an average of 08 kW for
all 194000 consumers recorded as having controllable load
For night-rate heating Powercorsquos estimated controllable load is 10 to 15 MW which includes both space heating (night storage) and larger domestic water heating systems Powerco uses different ripple control signalling channels for tariff switching and peak demand control
Ripple control ownershipPowerco owns and operates 26 ripple injection plants (audio frequency load control transmitters) located close to their related Grid Exit Points (GXP)19 (The exception is Waverley GXP which has no load control signalling capability)
Powerco has installed dual frequency systems to accommodate older ripple relays The company uses four signalling frequencies (217 283 317 and 383 Hz) which have all proven to be reliable in a 50 Hz power system Powerco transmits signals using the DECABIT Semagyr S50a and S52 and Rythmatic formats Powerco is planning to migrate all ripple signalling to DECABIT as Powerco has found it to be the most secure fast reliable and flexible format in their network
The majority of ripple relays on Powercorsquos network are owned by third parties mostly Metering Equipment Providers (MEPs) Powerco owns some pilot wire circuits along with a small number of ripple relays at the control points of these circuits These relays mostly contain multi-channel receivers with separate channels for street lighting control and hot water pilot wire control Additional interposing relays are installed on some consumers meter boards and are owned by MEPs
19 A Grid Exit Point (GXP) is defined in the Electricity Industry Participation Code as any point of connection on the grid at which electricity
predominantly flows out of the grid Typically a GXP is the point of connection in a Transpower substation for a cable or transmission line feeding power to a
network belonging to an Electricity Distribution Business
RIP
PLE
CO
NTR
OL O
F HO
T WATE
R IN
NE
W ZE
ALA
ND
- SE
PTE
MB
ER
2020
66
Table 16 - Ripple control capability of Powerco
Total network peak demand (maximum coincident demand )20 812 MW
Total network load connected to ripple control 280 MW
Network maximum coincident domestic demandPowerco cannot separate domestic component of peak demand21
Network domestic water heating load connected to ripple control
Powerco does not differentiate between domestic water heating control and other categories of load control
Network total domestic water heating load not connected to ripple control
Unknown
Load in region that can be reduced using ripple control
155 MW (estimate)
Domestic hot water heating as proportion of network ripple control
95 (estimate)
Total number of Installation Connection Points (ICPs) 344708
Total ICPs with ripple control194790 (according to meter registry data)
Total domestic ICPs 280233
Domestic ICPs with ripple-controlled water heating 184789 (according to meter registry data)
20 Maximum coincident demand is the peak load that has been recorded during a reporting period ndash usually 12 months This is less than the maximum
possible load because everything in the network is never drawing power at the same time
21 It could be done by analysing a significant quantity of data from Advanced Meters though retailers are reluctant to divulge this information
RIP
PLE
CO
NTR
OL O
F HO
T WATE
R IN
NE
W ZE
ALA
ND
- SE
PTE
MB
ER
2020
67
Box 4 - Powercorsquos ripple control plant ndash Asset Health IndicatorsNetwork companies report on the health of their assets in their information disclosures in accordance with the Electricity Engineers Association (EEA) Asset Health Indicator Guide (AHI 2016) The guide is intended to help electricity companies identify assets that need replacing and plan upgrades
Over the last 11 years Powerco has focused on modernising and upgrading the older technology Injection plants that were identified in previous Asset Management Plans as outdated overloaded and presenting a high risk of failure with a lack of availability of technical support This renewal programme has resulted in a system that while still containing some older technology plants is supported with readily available spares and technical support contracts The overall health of Powercorsquos ripple control assets is of a high standard
Powerco continues to operate ten phase distortion CycloControl transmitters on the Huirangi and Stratford networks (CycloControl is an outmoded signalling method with similar functions to ripple control) Technical support and spare parts are no longer available for these transmitters so they are being run until they fail The network area with the CycloControl system has been overlaid by a modern system which now provides reliable and supportable load control in this network area Any CycloControl receivers found by MEPs during routine meter replacements etc are replaced with modern ripple control receivers with DECABIT coding
Note - This health assessment covers only the central ripple control plant owned by Powerco and not the ripple relays located at consumer premises which are owned by MEPs Powerco has been able to influence MEPs to upgrade ripple relays as part of meter replacement programmes
Table 17 - Powercos central ripple control plant health assessment
Asset Health Indicator of ripple control central plant
H5 As new condition ndash no drivers for replacement 58
H4Asset serviceable - no drivers for replacement normal in-service deterioration
42
H3End-of-life drivers for replacement present increasing asset related risk
0
H2End-of-life drivers for replacement present high asset related risk
0
H1 Replacement recommended 0
RIP
PLE
CO
NTR
OL O
F HO
T WATE
R IN
NE
W ZE
ALA
ND
- SE
PTE
MB
ER
2020
68
Current application of ripple control Powercorsquos application and maintenance of ripple control is motivated largely by a desire to be a responsible participant in New Zealands electricity system The main objectives for Powercorsquos activation of ripple control are described below
Minimising peak loads to alleviate network constraints Powerco uses ripple control on about 20 days each year to reduce peak demand Occasionally Powerco uses ripple control of hot water in response to a direct request from Transpower in order to maintain network security and reliability It is also deployed to meet any demands from the Electricity Authority or other legislative bodies to limit demand during events such as electricity shortages or low frequency events
Using ripple control to reduce peak loads helps maintain network security (at n-1 level) and so reduces the likelihood of outages assisting with meeting supply reliability obligations It also helps Powerco carry out essential maintenance without interrupting the service to consumers
Ripple control of domestic hot water to control peak demand normally occurs during winter (Outside of winter Powerco sometimes uses ripple control to manage demand from dairy farms on GXPs with a high proportion of dairy farm load) It would be unusual for Powerco to use ripple control in the morning and afternoon of the same day Ripple control of domestic hot water is available and operates over the entire Powerco network area
Ripple control allows Powerco to reliably handle peak load on sub-transmission networks that are close to their maximum capacity This has allowed the company to defer upgrades potentially costing tens of millions of dollars thus reducing costs passed on to consumers
The estimated size of the hot water load to be shed or restored is determined by a load control algorithm This algorithm takes account of factors including current load time of day season time on since last off time time off during the current time period and social behaviour patterns such as school holidays Powerco believes consumers should not notice any impacts from ripple control so limits its use to a total of 3 to 4 hours off time per consumer per day
Aligning with off-peak tariffs Powerco also uses ripple control every day to align with retailersrsquo discounted tariffs for consumers with night-rate controlled loads This ensures consumersrsquo controlled loads (which may include water heating) can only be operated between 11pm and 7am to coincide with lower night-rate tariffs Some off-peak tariffs also include a ldquoboostrdquo period during the early afternoon intended for water heating
In the past retailers paid Powerco to turn off hot water during peak demand periods Powerco considered that some of these lsquooffrsquo periods were too long and the company now receives no incentives from retailers to deploy ripple control
Reducing Transpowerrsquos charges is not an objective of Powercorsquos use of ripple control This is partly because Powerco consider their load as too small to have a large effect on the peak load in the Lower North Island region (the basis for Powercorsquos transmission charges)
Powerco used to deploy ripple control to participate in the fast interruptible reserve market However the company has decided that the potential revenue from this market does not justify the risks and technical complications of participation
RIP
PLE
CO
NTR
OL O
F HO
T WATE
R IN
NE
W ZE
ALA
ND
- SE
PTE
MB
ER
2020
69
Does ripple control deliver its potential benefitsSection 22 outlines six potential benefits of using ripple control Table 18 summarises whether each of these benefits is achieved in the case of Powerco
Table 18 - The benefits of Powercorsquos use of ripple control
Potential benefit Benefit delivered
Reducing network costsYes ndash by improving asset utilisation and deferring investment in both transmission and distribution networks
Reducing domestic energy billsYes ndash by enabling night-rate tariffs (Though modern meters could also do this without ripple control)
Reducing generation costsYes ndash this is likely to be an indirect benefit of Powercorsquos use of ripple control through lower use of peaking generation plants
Supporting reliability of the electricity system
Yes ndash when responding to requests from Transpower and to enable network maintenance
Power quality support No Although may indirectly reduce risk of voltage problems Ripple control could be used to correct under-frequency problems but this would require MEPs to program ripple relays differently
Supporting the clean energy transition
Not deliberately but ripple control can play a supporting role by using loads with suitable energy storage to lower peak demands to assist matching to the variable output of clean energy sources such as rooftop solar generation eg hot water systems as a source of thermal energy storage or irrigation schemes where the energy is stored as moisture in the soil
Supporting the clean energy transitionRipple control supports the clean energy transition allowing control of the peak demand contribution from hot water to help match the variable output of clean energy sources embedded in the network such as roof top solar power
RIP
PLE
CO
NTR
OL O
F HO
T WATE
R IN
NE
W ZE
ALA
ND
- SE
PTE
MB
ER
2020
70
Technical problems with ripple control Sometimes ripple control problems arise on Powercos network when loads are turned off and require manual intervention to restore These problems are more often due to operational missteps rather than faulty equipment A busy operator could set controls and then forget to reset them Occasionally there may be failures in the communication system between the SCADA Master Station and the injection plant controller
Most of these issues are addressed by monitoring of the channel status at the injection plants With loss of signal over a pre-set time algorithms in newer ripple relays can be set to return output switches to the lsquoonrsquo state or revert to timetable mode thus further enhancing monitoring of system operations and reducing outage times to a minimum
Pilot wires can cause reliability problems that are unrelated to ripple control These problems include faulty joints conductor clashing and incorrect fuses Pilot wires also limit the functionality of load control and Powerco believes that pilot wire unreliability may contribute to negative attitudes towards ripple control Powerco is decommissioning pilot wire as part of its scheduled renewal programmes
There are few problems related to the interaction of consumer equipment with ripple control within Powercorsquos network Powerco has standardised ripple frequencies to within the 200 to 400Hz range making them less susceptible to such problems Powercorsquos Network Connection Standard requires the installation of blocking filters on the network side of any consumer loads that may otherwise absorb or interfere with ripple control signals
Powerco takes no responsibility for faulty ripple relays as it does not own them Powerco believes retailers and MEPs rarely check the health of their relays which can be set to incorrect channels as a result of unreported changes in consumersrsquo loads or shorted out or stuck in the lsquoonrsquo position It is widely recognised within the industry that such problems resulting in a control being always on are seldom reported
When consumers do report a problem their retailer will lodge a fault call with Powerco If the fault is thought to be network related Powerco sends a faults contractor to investigate and resolve it at no cost to the consumer or their retailer
Industry fragmentation makes fault finding complicated EDBs retailers and receiver owners each have their own field contractors Determining the underlying cause of a hot water complaint is often frustrating involving several attempts by different parties to resolve Powerco has a process for handling hot water complaints but it has never been formally adopted by retailers or MEPs
Barriers to the more effective use of ripple controlThe energy sector reforms of the 1990s introduced split ownership of ripple control systems with no clear business incentives to undertake load control In Powercorsquos opinion this has led to a lack of investment in ripple control and uncertainty about responsibility for load management For example Powerco lacks good information about the ripple relays in its area and the loads to which they are connected Because of these changes Powerco believes New Zealandrsquos ripple control systems have degraded and are less effective than they were
Powerco sees the main barrier to the more effective use of ripple control as a lack of strategic oversight and clarity For example while the Electricity Authority recognises that load control delivers a more secure electricity system at lower cost it has no strategy for ripple control Instead it believes that demand response measures should be driven by market incentives such as consumersrsquo willingness to pay
Fragmented ownership and lack of strategy contribute to several barriers to the more effective use of ripple control including
bull retailers failure to promote and incentivise load control
RIP
PLE
CO
NTR
OL O
F HO
T WATE
R IN
NE
W ZE
ALA
ND
- SE
PTE
MB
ER
2020
71
bull lack of understanding at Powerco about consumers electricity use patterns
bull conflicting incentives between network companies and retailers (eg EDBs aim to meet peak demand (kVA) and reliability obligations at minimum cost while retailers aim to maximise the electrical energy (kWh) delivered)
bull the unnecessary removal of functioning ripple relays at consumer sites
The future of ripple control and demand managementPowerco sees ripple control of domestic hot water as a fast reliable and effective service which can continue to play an important role in the electricity system In particular Powerco considers ripple control to be highly effective at reducing demands at peak times and shifting consumption to lower-demand periods Powerco is investing in two new ripple control plants on existing networks and a third ripple control plant as part of a new GXP Despite these investments and the benefits of ripple control its usage is slowly declining on the Powerco network due to
bull the lack of recognition of the benefits obtained from an effective means of demand management
bull unauthorised removal of ripple relays
bull an increase in alternate forms of water heating
Powerco believes that ripple control of hot water can be modernised to meet the needs of the evolving electricity system Newer relays can provide more flexible control which will make load-switching less noticeable to consumers Advanced metering units have in-built load control functionality and monitoring functionality This improves electricity network operational visibility and allows load switching to be scheduled so that for example they turn hot water back on at an appropriate time even when the ripple control system fails
However to fulfil the potential of ripple control Powerco believes there needs to be a clear national strategy for load control This strategy would describe how load control can support New Zealandrsquos sustainable energy future One of its key aims should be effective collaboration between the relevant stakeholders (ripple relay owners EDBs retailers and consumers) an equitable sharing of benefits between all stakeholders and the removal of conflicting business drivers Powerco considers that useful regulatory changes would include
bull sharing transmission cost savings among stakeholders including consumers
bull requirements to audit the health of ripple relays at consumersrsquo sites
bull introduction of standards for acceptable levels of ldquooffrdquo duration (with appropriate incentives and disincentives)
Powerco is monitoring developments of emerging alternative technology for managing loads electric hot water and other thermal storage devices Powerco is also in the early stages of planning a pilot of smart control on a small part of its network although the details and technologies involved are still being worked out
RIP
PLE
CO
NTR
OL O
F HO
T WATE
R IN
NE
W ZE
ALA
ND
- SE
PTE
MB
ER
2020
72
Case study 4 - WEL Networks
Introduction to WEL NetworksWEL Networks Limited (WEL) is the fifth largest electricity distribution company in New Zealand covering Hamilton and the northern and central Waikato region WEL distributes electricity to over 160000 people through 91000 installation connection points and 6796 km of lines In 2019 the total energy distributed across WELrsquos network was 1285 GWh
WEL is 100 owned by the community through its sole shareholder WEL Energy Trust
Ripple control capability and conditionWEL has significant capability to reduce peak demand using ripple control connected to domestic hot water About two-thirds of WELrsquos domestic customers have a ripple control relay connected to their electric hot water systems This allows WEL to reduce their network load by 40 to 60 MW ndash more than 10 of peak demand (Table 19) Ripple control is very effective at managing WELrsquos loads
Each ripple injection signals affects around 2000 to 3000 customers or about 2 MW of load
WEL used to be able to control smaller numbers of customers at the substation level but it was decided that the few cases when this was used did not justify the complexity of maintaining multiple coding schemes and complicated inventory management Customers on any given ripple control channel are not clustered but distributed across WELrsquos network to avoid large swings in demand in particular areas
Ripple control ownershipWEL owns the ripple control plant and all of the ripple control relays in its area WEL owns and operates 5 ripple injection plants (33kV and 11kV) which send ripple signals at a frequency of 283 Hz These systems are in good condition (Box 5) and present few technical problems
WEL also owns and operates smart meters at two-thirds of its customer sites These meters are mostly additional to the revenue meters that are installed at all sites For controlled tariff consumers WELrsquos smart meters contain ripple relays which have the capacity to control customer appliances However in most cases WEL does not generally use its smart meters for ripple control because this would interfere with the operation of the main revenue meters WEL does use its smart meters for several other purposes such as detecting network problems
RIP
PLE
CO
NTR
OL O
F HO
T WATE
R IN
NE
W ZE
ALA
ND
- SE
PTE
MB
ER
2020
73
Table 19 - Ripple control capability of WEL Network
Total network peak demand (maximum coincident demand22)
278 MW
Total network load connected to ripple control 100 MW
Network maximum coincident domestic demandWEL cannot separate domestic component of peak demand
Network domestic water heating load connected to ripple control
95 MW (estimate)
Network total domestic water heating load not connected to ripple control
5 MW (estimate)
Potential load reduction using ripple control40 to 60 MW
(estimate)
Domestic hot water heating as proportion of network ripple control
95
Total number of Installation Connection Points (ICPs) 94217
Total ICPs with ripple control 56765
Total number of domestic ICPs 81402
Domestic ICPs with ripple-controlled water heating 53479
22 Maximum coincident demand is the peak load that has been recorded during a reporting period ndash usually 12 months This is less than the maximum
possible load because everything in the network is never drawing power at the same time
RIP
PLE
CO
NTR
OL O
F HO
T WATE
R IN
NE
W ZE
ALA
ND
- SE
PTE
MB
ER
2020
74
Box 5 - WELs ripple control plant ndash Asset Health IndicatorsNetwork companies report on the health of their assets in their information disclosures according to the Electricity Engineers Association (EEA) Asset Health Indicator Guide (AHI 2016)23 The guide is intended to help network companies identify assets that need replacing and plan upgrades
WELrsquos asset health disclosure shows its ripple control plant to be in very good condition Note that this health assessment covers the central ripple control plant owned by WEL Networks Some of the ripple relays located at customer premises is owned by others (ie retailers and Metering Equipment Providers)
Table 20 - WEL Networks central ripple control plant health assessment
Asset Health IndicatorLoad under ripple
control (MW)
of load that is domestic water
heating
H5As new condition ndash no drivers for replacement
50 95
H4Asset serviceable - no drivers for replacement normal in service deterioration
50 95
H3End-of-life drivers for replacement present increasing asset related risk
0 0
H2End-of-life drivers for replacement present high asset related risk
0 0
H1 Replacement recommended 0 0
23 httpswwweeaconzSitenews-eventsnewsArchive-2017January-2017asset-health-indicator-guideaspx
RIP
PLE
CO
NTR
OL O
F HO
T WATE
R IN
NE
W ZE
ALA
ND
- SE
PTE
MB
ER
2020
75
Current application of ripple control Last year WEL employed ripple control on 94 days most of which were in winter Although WEL has the capability to reduce peak demand by 40 to 60 MW ripple control is not always deployed to its fullest extent or across every part of WELrsquos network WEL aims to limit the time appliances are turned off to 7 hours per day ndash 35 hours in the morning and 35 hours in the evening
WEL considers that it uses ripple control effectively and that both the company and its customers benefit from its application WEL receives an annual financial benefit of roughly$2 to 5 million from its ripple control capability compared to a cost of around$05 million
The main incentives and objectives for WELrsquos activation of ripple control are described below in order of importance
1 Minimising transmission costsTranspowerrsquos method of allocating charges to distribution companies is based partly on regional peak loads (Regional Coincident Peak Demand (RCPD)) WEL minimises its transmission charges by minimising network load during coincident peak demand periods This is the main reason the company activates ripple control
WEL passes these savings in transmission costs onto retailers in its network charge in the expectation that the savings are reflected in consumersrsquo bills WEL does this as a good corporate citizen not because it is required by regulation WEL could choose to pay higher charges to Transpower and then pass the costs onto retailers In this sense WEL has no direct financial incentive to reduce the fees it pays to Transpower
(The Electricity Authority is changing the way Transpower charges distribution companies and from April 2023 RCPD will no longer be part of transmission pricing methodology This change will remove a major incentive for WEL to activate ripple control)
2 Alleviating network constraints WEL uses ripple control to minimise peak load at Transpowerrsquos substations ndash known as Grid Exit Points (GXPs)24 This allows WEL to defer capital expenditure on network upgrades ndash a major secondary benefit of ripple control If ripple control was not available to WEL it could be required by Transpower to fund more frequent supply capacity increases at GXPs WEL also uses ripple control to relieve more localised network constraints
Alleviating network constraints also helps WEL maintain grid security reducing the likelihood of outages WEL occasionally uses ripple control to reduce network load while it carries out maintenance on a substation Use of ripple control indirectly reduces the risk of network voltage problems
3 Participating in reserve market WEL earns money from participating in the reserve market for fast interruptible load This involves providing a service to instantly reduce demand when the network frequency falls below 492 Hz The response is triggered by an under-frequency detection in the relay and does not require a ripple signal WEL uses ripple control to participate in this reserve market for much of the year It does this outside the winter months as it cannot offer a fast interruptible load response during periods when it is already using ripple control on a daily basis
24 Grid exit points (GXPs) are the points of connection (Transpower substations) where electricity flows out of the national grid to local networks or
direct consumers
RIP
PLE
CO
NTR
OL O
F HO
T WATE
R IN
NE
W ZE
ALA
ND
- SE
PTE
MB
ER
2020
76
WELrsquos use of ripple control is not timed to coincide with retailersrsquo tariffs schemes and retailers give WEL no incentive to do this In the past the retailer Genesis paid WEL to control hot water to align with its cost drivers but this agreement is no longer in place (Note WEL cannot control customersrsquo load according to their retailer so the agreement with Genesis affected all customers regardless of retailer)
WEL does not use ripple control for emergency load shedding During rare emergencies when the frequency drops below 48 Hz special relays in WELrsquos substations automatically drop load by shedding feeders but ripple control is not involved
Does ripple control deliver its potential benefitsSection 22 of this report outlines six potential benefits of using ripple control Table 21 summarises whether each of these benefits is achieved in the case of WEL
Potential benefit Benefit delivered
Reducing network costsYes Using ripple control reduces network costs by millions of dollars a year through deferral of expenditure on network upgrades and minimising Transpowerrsquos peak demand transmission costs
WEL also earns revenue from the reserve market
Reducing domestic energy bills
Yes ndash assuming that lower transmission charges are passed onto customers by retailers
Reducing generation costsWEL is not aware of the impact on generation costs (Although it is likely that by reducing peak loads WEL reduces generation costs)
Supporting reliability of the electricity system
Yes Ripple control helps maintain grid security (at N-1 level) and reduces the risk of outages It also helps WEL carry out network maintenance
Power quality support Yes ndash by supporting frequency control in the reserve market for fast interruptible load which also indirectly reduces risk of voltage problems
Supporting the clean energy transition
No Demand management could increase use of distributed renewables but this would require a finer level of control than offered by ripple control
Table 21 - The benefits of WELrsquos use of ripple control
N-1 security means the electricity system is in a secure state and for any one credible contingency event it would move to a satisfactory state
RIP
PLE
CO
NTR
OL O
F HO
T WATE
R IN
NE
W ZE
ALA
ND
- SE
PTE
MB
ER
2020
77
Technical problems with ripple control WEL has few technical problems with the effective use of ripple control In the last year the company responded to 380 reports of problems with electric water heater Of these problems WEL estimates that less than 25 are related to ripple control indicating an annual failure rate of less than 02 The most serious problem WEL encounters is the rare failure of injection plant components which can be hard to replace
The company has measured the effectiveness of ripple control by collecting smart meter data while transmitting lsquooffrsquo and lsquoonrsquo signals The data indicated a very high proportion of hot water systems were successfully controlled
When a customer reports a hot water problem directly to WEL the company first establishes the source of the problem If it relates to ripple control WEL fixes the problem at its own expense However if a customer first calls an electrician WEL usually compensates the customer if the source of the problems turns out to be ripple control
Problems caused by the interaction of ripple control and consumer equipment such as flickering lights are very rare in the WEL network Where they do occur WEL normally investigates at their own cost
The future of ripple control and demand managementWEL considers that for network-wide control of electric hot water ripple control is still the best option Despite this WEL does not foresee much greater potential for ripple control In fact once the RCPD component of transmission cost allocation ceases from April 2023 WELrsquos largest incentive to operate ripple control will disappear
WELrsquos strategy with regard to ripple control is to maintain its current approach and level of infrastructure The companyrsquos injection plants and relays are relatively new so there are no short-term plans to invest further in ripple control
WELrsquos use of ripple control is slowly declining due to the gradual increase in the proportion of hot water heating powered by gas Many new homes have gas hot water heating installed because it saves space and is perceived as more convenient Some householders have replaced electric hot water with gas systems
WEL is planning for expected changes to the electricity system including the more widespread adoption of technologies such as rooftop solar PV batteries and electric vehicles To successfully manage the integration of these technologies into the grid will require a greater degree of control at the level of individual customers
Ripple control does not support this small-scale level of control so WEL is exploring new approaches to demand management For example the charging and discharging of batteries and electric vehicles could be controlled via the Internet allowing consumers to be rewarded for providing grid support
WEL is currently scoping a trial to explore techniques for managing demand of appliances such as electric hot water solar PV electric vehicles and batteries As part of this research WEL is talking to Horizon Power about their trials of distributed intelligent microgrids in Western Australia New approaches are likely to consider innovative business models such as aggregated demand response services
WEL is carrying out these investigations as part of its internal strategy with some assistance from research institutes Neither the NZ Government nor Transpower provides WEL with any incentives to plan for demand management in an evolving system Nor is there any coordinated national or regional strategy for ripple control or demand management
RIP
PLE
CO
NTR
OL O
F HO
T WATE
R IN
NE
W ZE
ALA
ND
- SE
PTE
MB
ER
2020
78
RIP
PLE
CO
NTR
OL O
F HO
T WATE
R IN
NE
W ZE
ALA
ND
- SE
PTE
MB
ER
2020
79
- 4-Introduction
- 8-Our outcomes
- 10-Our funding
- 12-Our strategic focus
- Business
- Transport
-
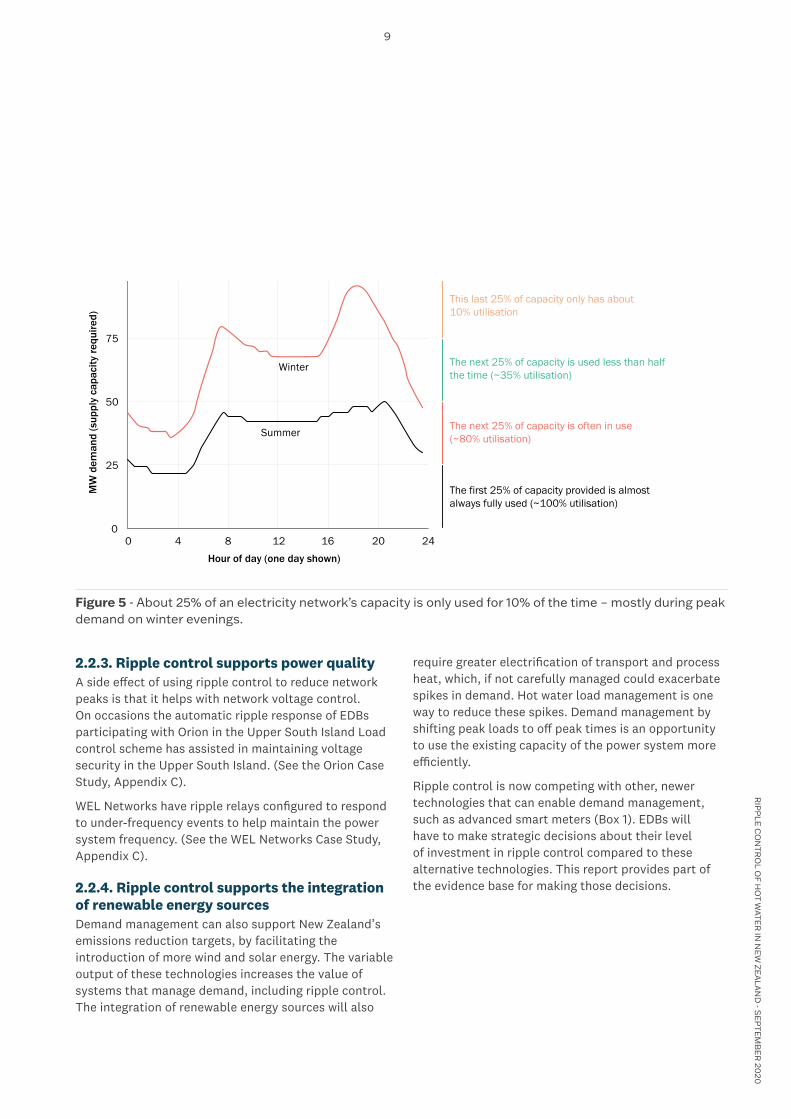