richard woods, georgia’s school superintendent … · score. the student growth ... a tem rating...
TRANSCRIPT

Richard Woods, Georgia’s School Superintendent
“Educating Georgia’s Future” gadoe.org
Richard Woods, Georgia’s School Superintendent “Educating Georgia’s Future”
gadoe.org
Teacher Effectiveness Measures: TAPS and
Student Growth Tift County Schools
March 2015
3/18/2015 1

Richard Woods, Georgia’s School Superintendent
“Educating Georgia’s Future” gadoe.org
3/18/2015 2
Teacher Keys
Effectiveness System Generates a Teacher Effectiveness
Measure
Teachers of Tested Subjects
Student Growth Percentiles
Student Growth
Surveys of Instructional Practice
Grades 3-5, Grades 6-8, Grades 9-12
Teacher Assessment
on Performance Standards
Observations and Documentation
Teacher Keys Effectiveness System
Support and Documentation
Teachers of Non-Tested Subjects
LEA-Developed, DOE-Approved Student Learning Objectives

Richard Woods, Georgia’s School Superintendent
“Educating Georgia’s Future” gadoe.org
Richard Woods, Georgia’s School Superintendent
“Educating Georgia’s Future” gadoe.org
Leader Keys Effectiveness System
3/18/2015 3
Support and Documentation
Leader Keys
Effectiveness System
Generates a Leader Effectiveness Measure
Leader Assessment
on Performance Standards
Performance Goal Setting
Documentation of Practice
Governance and Leadership
Climate Survey
Student Attendance
Retention of Effective Teachers
Student Growth and Academic Achievement
Student Growth Percentiles
LEA-Developed, DOE-Approved Student Learning Objectives
Achievement Gap Reduction

Richard Woods, Georgia’s School Superintendent
“Educating Georgia’s Future” gadoe.org
Teacher Effectiveness Measure
• What is it? • A rating level based on documentation and data collected
from components of the TKES: The TAPS Summative and Student Growth results.
• Who gets one? • All teachers who have provided instruction for 65% of a
course for either a tested or non-tested subject (or both if both are taught), and who have an aggregate of 15 growth results in either measure, will receive a Student Growth score. The Student Growth score in a given year is based on the previous year’s data.
3/18/2015 4

Richard Woods, Georgia’s School Superintendent
“Educating Georgia’s Future” gadoe.org
Richard Woods, Georgia’s School Superintendent
“Educating Georgia’s Future” gadoe.org
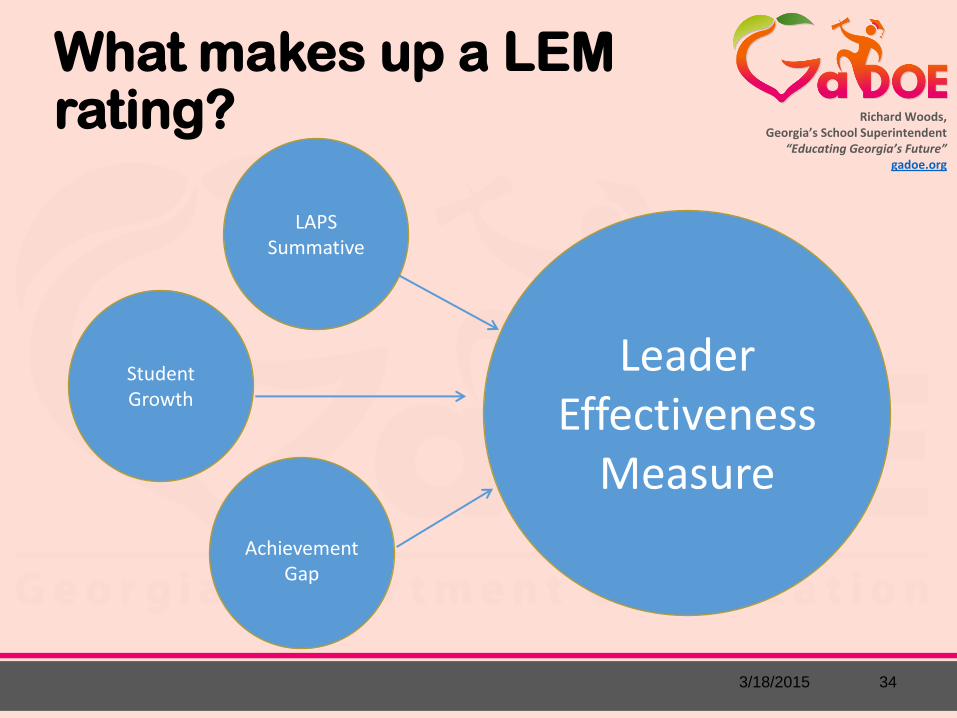
Leader Effectiveness Measure
• What is it? • A rating level based on documentation and data
collected from all three components of the LKES: The LAPS Summative, Student Growth results, and Achievement Gap Reduction.
• Who gets one? • All leaders employed and present at least 65% of the
school year shall be evaluated using at least one growth measure in order to receive a Leader Effectiveness Measure (LEM); AND
• All leaders who have an aggregate of 15 growth results in either measure, will receive a Student Growth score. The Student Growth score in a given year is based on the previous year’s data.
3/18/2015 5

Richard Woods, Georgia’s School Superintendent
“Educating Georgia’s Future” gadoe.org
Dr. John D. Barge, State School
Superintendent
“Making Education Work for All Georgians”
www.gadoe.org
TEM / LEM Timelines
Cohort 1 (RT3 Districts)
• 2013-2014 TEM = 2012-2013 CRCT/EOCT + Spring 2014 TAPS summative
• 2014-2015 TEM = 2013-2014 CRCT/EOCT/SLO + Spring 2015 TAPS summative
• 2015-2016 TEM = 2014-2015 GA Milestones/SLO + Spring 2016 TAPS summative
3/18/2015 6
Richard Woods, Georgia’s School Superintendent
“Educating Georgia’s Future” gadoe.org
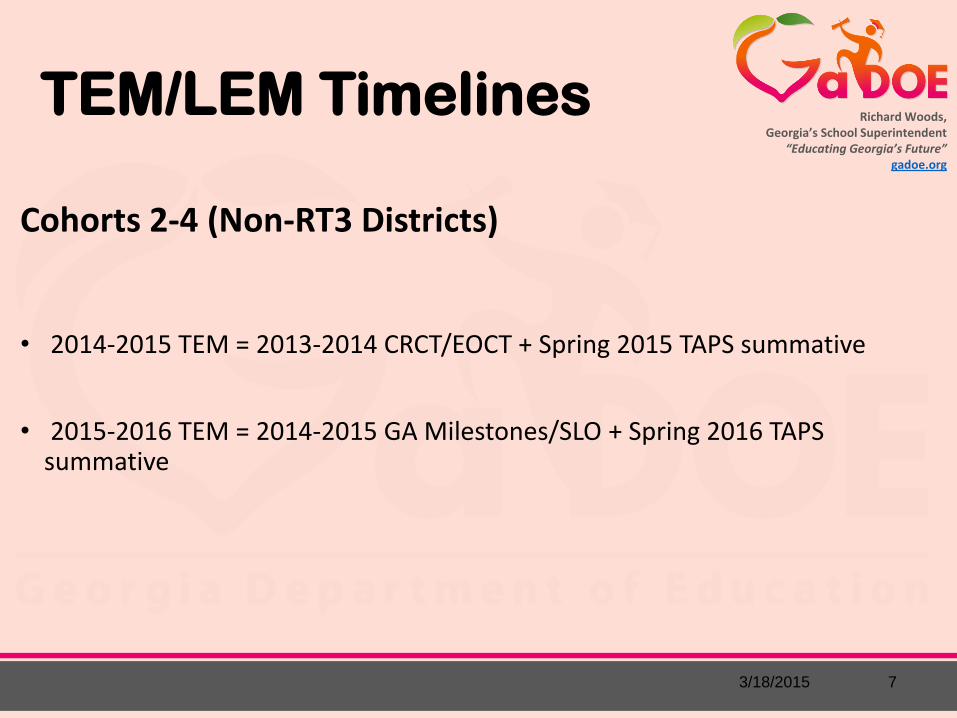
TEM/LEM Timelines
Cohorts 2-4 (Non-RT3 Districts)
• 2014-2015 TEM = 2013-2014 CRCT/EOCT + Spring 2015 TAPS summative
• 2015-2016 TEM = 2014-2015 GA Milestones/SLO + Spring 2016 TAPS summative
3/18/2015 7
Richard Woods, Georgia’s School Superintendent
“Educating Georgia’s Future” gadoe.org
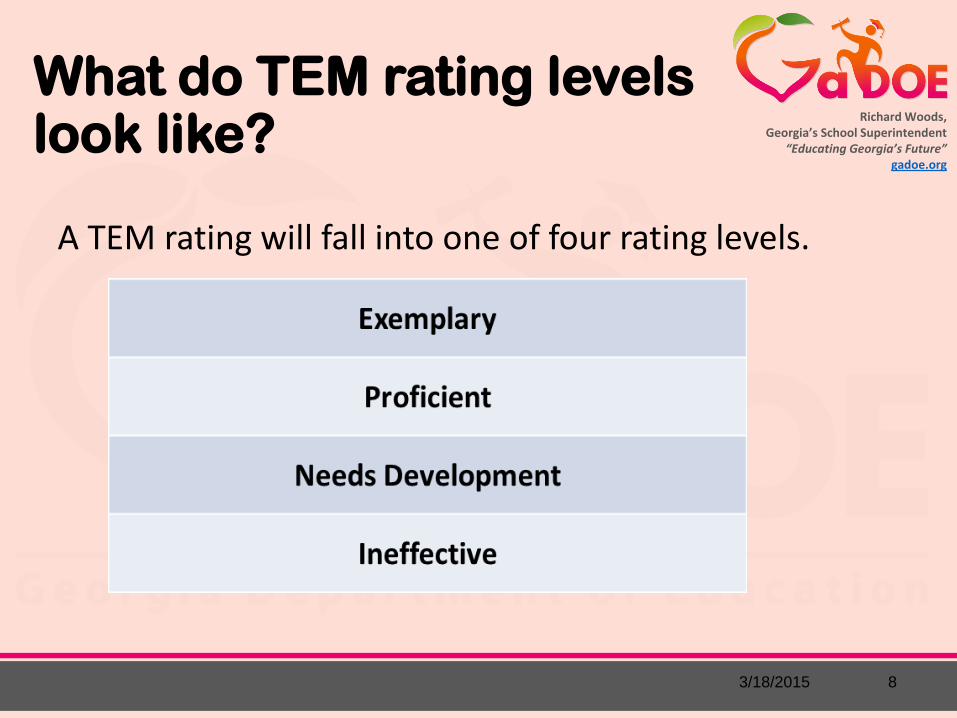
What do TEM rating levels look like?
A TEM rating will fall into one of four rating levels.
3/18/2015 8

Richard Woods, Georgia’s School Superintendent
“Educating Georgia’s Future” gadoe.org
What makes up a TEM rating?
TAPS
Student Growth
Teacher Effectiveness
Measure
3/18/2015 9

Richard Woods, Georgia’s School Superintendent
“Educating Georgia’s Future” gadoe.org
TAPS Standard Ratings
Each of the ten Performance Standards will be rated using the following scale:
Performance
Standard Rating Point Value
Level IV 3
Level III 2
Level II 1
Level I 0
3/18/2015 10
Please note: A maximum point value of 3 may be earned for each standard.
Richard Woods, Georgia’s School Superintendent
“Educating Georgia’s Future” gadoe.org
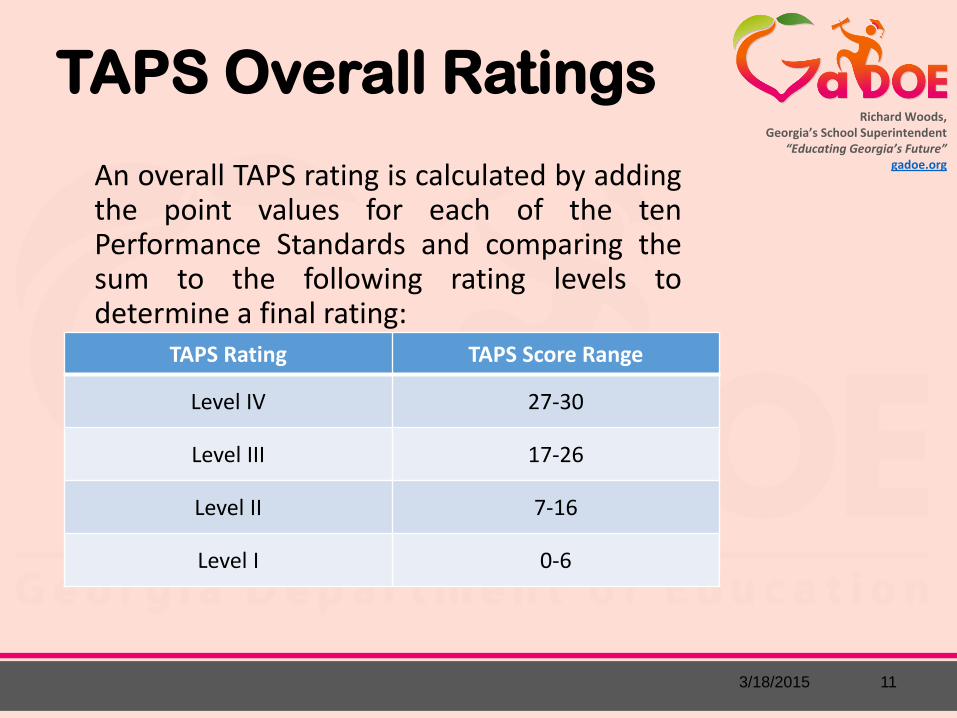
TAPS Overall Ratings
An overall TAPS rating is calculated by adding the point values for each of the ten Performance Standards and comparing the sum to the following rating levels to determine a final rating:
TAPS Rating TAPS Score Range
Level IV 27-30
Level III 17-26
Level II 7-16
Level I 0-6
3/18/2015 11

Richard Woods, Georgia’s School Superintendent
“Educating Georgia’s Future” gadoe.org
SGP and SLO Data
Students must be enrolled for 65% of the
course
A teacher must provide instruction for 65% of
the course
At least 15 measure results for growth to
apply Lagging data source
SGP / SLO
12 3/18/2015

Richard Woods, Georgia’s School Superintendent
“Educating Georgia’s Future” gadoe.org
Student Growth
A teacher who receives an overall Student Growth rating will have growth that is based on the results from SGPs, SLOs, or a combination of the two.
• SGPs: State-tested subjects result in Student Growth Percentiles (SGP) based on CRCT , EOCT, or GA Milestones results.
• SLOs: Non state-tested subjects result in Student Learning Objective (SLO) scores.
13 3/18/2015

Richard Woods, Georgia’s School Superintendent
“Educating Georgia’s Future” gadoe.org
What is an SGP?
76
What is a percentile?
Who is a student compared to?
How much growth is enough?
What does the percentile tell us
about instruction?
14 10/16/2013

Richard Woods, Georgia’s School Superintendent
“Educating Georgia’s Future” gadoe.org
Richard Woods, Georgia’s School Superintendent
“Educating Georgia’s Future” gadoe.org
What are Student Growth Percentiles?
• A student growth percentile (SGP) describes a student’s growth relative to other students statewide with similar prior achievement • Calculations based solely on achievement
• SGPs not only show how individual students are progressing, but they also can be aggregated to show how groups of students, schools, districts, and the state are progressing
15

Richard Woods, Georgia’s School Superintendent
“Educating Georgia’s Future” gadoe.org
Richard Woods, Georgia’s School Superintendent
“Educating Georgia’s Future” gadoe.org
Student Change in Status
16
-3 -2 -1 0 1 2 3
Grade 4
Test Score Expressed in Standard Deviation Units
-3 -2 -1 0 1 2 3
Grade 5
Test Score Expressed in Standard Deviation Units
16% 50%
If a student goes from scoring better than 16% of all students in grade 4 to scoring better than 50% of students in grade 5, would this be evidence that growth had occurred?
Richard Woods, Georgia’s School Superintendent
“Educating Georgia’s Future” gadoe.org
Richard Woods, Georgia’s School Superintendent
“Educating Georgia’s Future” gadoe.org
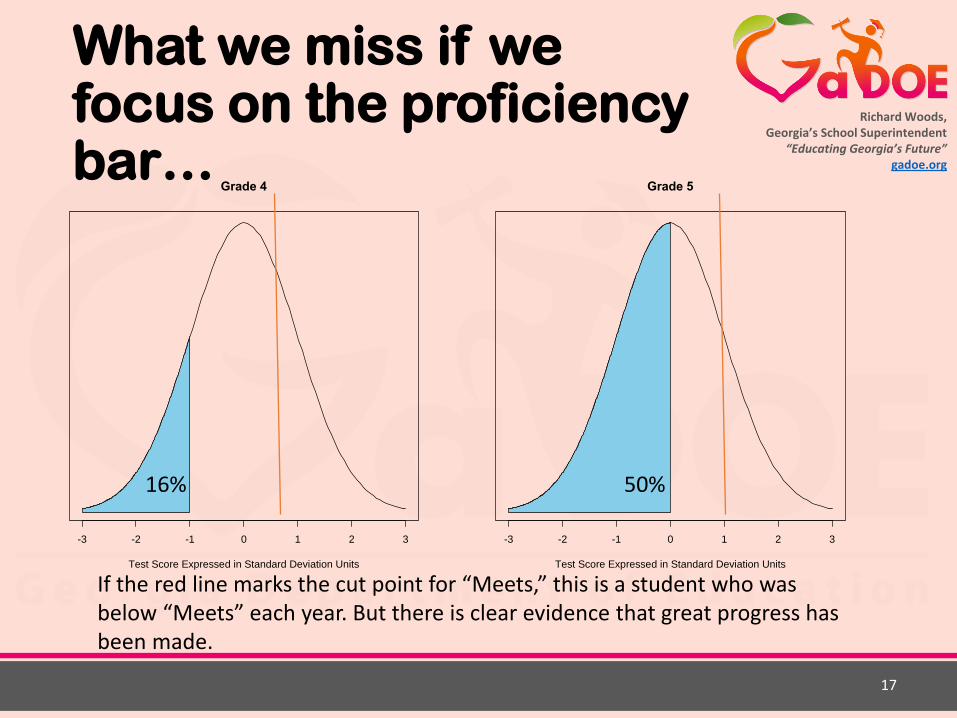
What we miss if we focus on the proficiency bar…
17
-3 -2 -1 0 1 2 3
Grade 4
Test Score Expressed in Standard Deviation Units
-3 -2 -1 0 1 2 3
Grade 5
Test Score Expressed in Standard Deviation Units
16% 50%
If the red line marks the cut point for “Meets,” this is a student who was below “Meets” each year. But there is clear evidence that great progress has been made.

Richard Woods, Georgia’s School Superintendent
“Educating Georgia’s Future” gadoe.org
Richard Woods, Georgia’s School Superintendent
“Educating Georgia’s Future” gadoe.org
SGPs for Individual Students
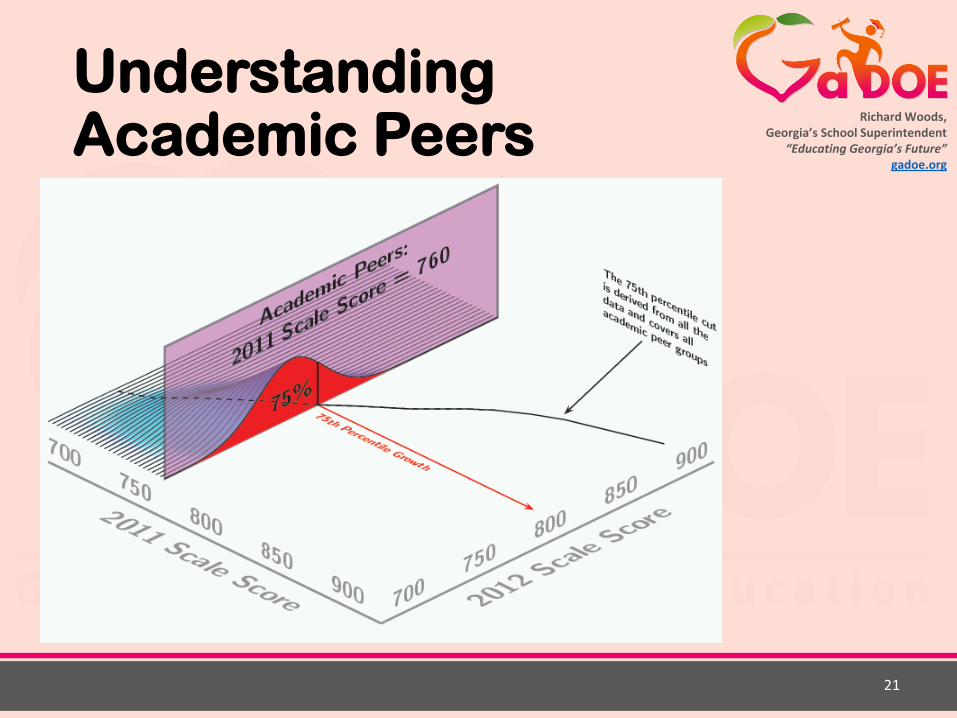
• Each student obtains an SGP, which indicates how much he or she grew relative to his or her academic peers • Academic peers are other students statewide with a similar
score history • Priors are the historical assessment scores used to model
growth • Two priors are used when available (the immediate
consecutive prior is required)
• Growth percentiles range from 1 to 99 • Lower percentiles indicate lower academic growth and higher
percentiles indicate higher academic growth
• All students, regardless of their achievement level, have the ability to demonstrate all levels of growth
18

Richard Woods, Georgia’s School Superintendent
“Educating Georgia’s Future” gadoe.org
Richard Woods, Georgia’s School Superintendent “Educating Georgia’s Future”
gadoe.org
2012 SGP = 1 2011 4th Grade Math Scale Score = 990 2012 5th Grade Math Scale Score = 847
2012 SGP = 99 2011 4th Grade Math Scale Score = 990 2012 5th Grade Math Scale Score = 990
2012 SGP = 1 2011 4th Grade Math Scale Score = 744 2012 5th Grade Math Scale Score = 734
2012 SGP = 99 2011 4th Grade Math Scale Score = 744 2012 5th Grade Math Scale Score = 843
All students can demonstrate all levels of growth – regardless of their achievement level

Richard Woods, Georgia’s School Superintendent
“Educating Georgia’s Future” gadoe.org
Richard Woods, Georgia’s School Superintendent “Educating Georgia’s Future”
gadoe.org
All students can demonstrate all levels of growth – regardless of their achievement level
Students with Disabilities (SWD) Economically Disadvantaged (ED) English Language Learners (ELL)
Richard Woods, Georgia’s School Superintendent
“Educating Georgia’s Future” gadoe.org
Richard Woods, Georgia’s School Superintendent
“Educating Georgia’s Future” gadoe.org
Understanding Academic Peers
21

Richard Woods, Georgia’s School Superintendent
“Educating Georgia’s Future” gadoe.org
Richard Woods, Georgia’s School Superintendent
“Educating Georgia’s Future” gadoe.org
Student Growth Levels • Low (1-34), Typical (35-65), and High (66-99)
• Levels were set using information about the interaction between student growth and status-based achievement • A student who demonstrates low growth generally will
regress academically (i.e., not maintain his/her current level of achievement)
• A student who demonstrates typical growth generally will maintain or improve academically
• A student who demonstrates high growth generally will make greater improvement academically
22
Richard Woods, Georgia’s School Superintendent
“Educating Georgia’s Future” gadoe.org
Richard Woods, Georgia’s School Superintendent
“Educating Georgia’s Future” gadoe.org
What does this mean for instruction?
• Example (real data, fake names) • Clubhouse High School
• Urban
• One of many high schools in district
• Has 12 9th-Grade Literature teachers in 2012
• Ms. M. Mouse • Taught 9th Grade Literature in 2012
• Taught 28 students in 3 classes
23

Richard Woods, Georgia’s School Superintendent
“Educating Georgia’s Future” gadoe.org
Richard Woods, Georgia’s School Superintendent
“Educating Georgia’s Future” gadoe.org
How did Ms. Mouse’s students do on the 9th Grade Lit EOCT?
24
18 scored Does Not
Meet
5 scored Meets
0 scored Exceeds
18% of students (5 of 23) met the state standard

Richard Woods, Georgia’s School Superintendent
“Educating Georgia’s Future” gadoe.org
Richard Woods, Georgia’s School Superintendent
“Educating Georgia’s Future” gadoe.org
But did these students grow?
25
3 demonstrated low growth
11 demonstrated typical growth
14 demonstrated high growth
Yes – 89% demonstrated typical or high growth MGP = 66

Richard Woods, Georgia’s School Superintendent
“Educating Georgia’s Future” gadoe.org
Richard Woods, Georgia’s School Superintendent
“Educating Georgia’s Future” gadoe.org
What about the other 9th Grade Lit teachers in the school?
26
Ms. Mouse – low proficiency (18%), high growth (MGP = 66) 9
th G
rad
e Li
t P
rofi
cien
cy
9th Grade Lit Growth

Richard Woods, Georgia’s School Superintendent
“Educating Georgia’s Future” gadoe.org
Richard Woods, Georgia’s School Superintendent
“Educating Georgia’s Future” gadoe.org
What if we consider where students started – across the district?
27
Ms. Mouse – Had more student growth than most other teachers with students of similar prior achievement levels
8th
Gra
de
Pro
fici
ency
9th Grade Lit Growth

Richard Woods, Georgia’s School Superintendent
“Educating Georgia’s Future” gadoe.org
Student Growth: SGP Rating Levels
Mean Growth Percentile Rating Levels
Mean Growth Percentile Score Range
Level IV > 65
Level III > 40 AND <=65
Level II >= 30 AND <=40
Level I < 30
28 3/18/2015
Richard Woods, Georgia’s School Superintendent
“Educating Georgia’s Future” gadoe.org
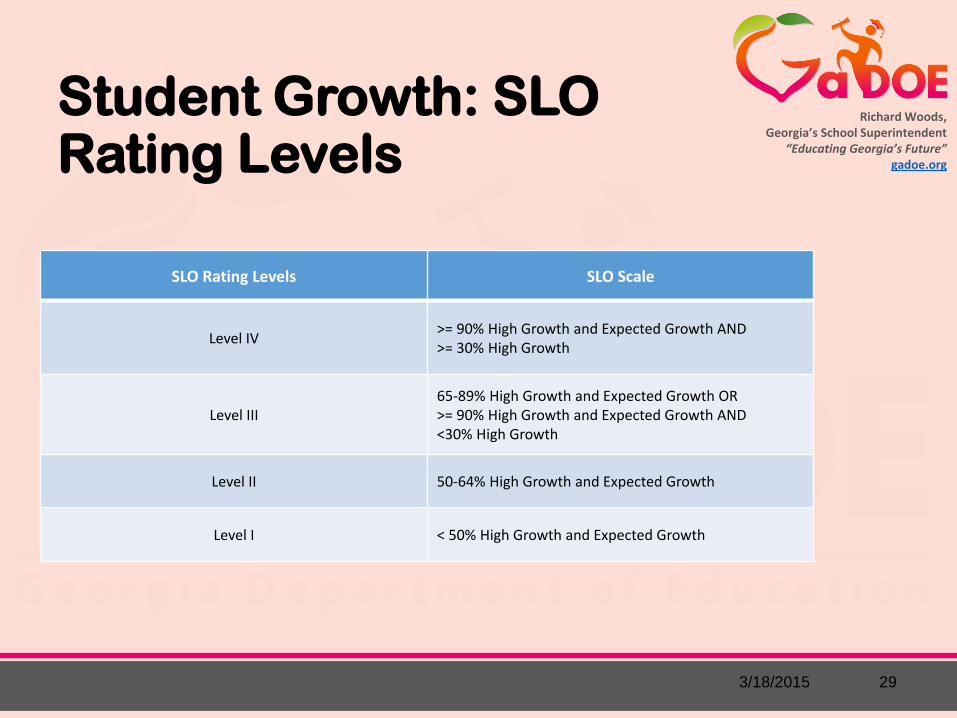
Student Growth: SLO Rating Levels
29 3/18/2015
SLO Rating Levels SLO Scale
Level IV >= 90% High Growth and Expected Growth AND >= 30% High Growth
Level III 65-89% High Growth and Expected Growth OR >= 90% High Growth and Expected Growth AND <30% High Growth
Level II 50-64% High Growth and Expected Growth
Level I < 50% High Growth and Expected Growth

Richard Woods, Georgia’s School Superintendent
“Educating Georgia’s Future” gadoe.org
Combined Student Growth Rating
When a teacher has both SGP and SLO students: • A teacher’s SGP and SLO ratings will be weighted
using the number of student results for each growth type, then averaged.
• This average will be rounded according to standard rounding rules in order to determine that teacher’s overall Student Growth rating.
30 3/18/2015

Richard Woods, Georgia’s School Superintendent
“Educating Georgia’s Future” gadoe.org
Combined Student Growth Rating
Example: If a teacher had 40 SGP results and 58 SLO results, and ratings of Levels III and II, respectively, the following calculation will be used:
SGP SLO
Rating: 3 (III) Rating: 2 (II)
40 students 58 students
3x40 students = 120 2x58 students = 116
(120+116)/(40+58) = 236/98
Student Growth Rating = 2.41, rounded to 2 (II)
31 3/18/2015

Richard Woods, Georgia’s School Superintendent
“Educating Georgia’s Future” gadoe.org
TEM Decision Table
Overall Student Growth Rating
IV Needs
Development Proficient Exemplary Exemplary
III Needs
Development Proficient Proficient Exemplary
II Ineffective Needs
Development Needs
Development Proficient
I Ineffective Ineffective Needs
Development Needs
Development
I II III IV
Overall TAPS Summative Rating
32 3/18/2015

Richard Woods, Georgia’s School Superintendent
“Educating Georgia’s Future” gadoe.org
Richard Woods, Georgia’s School Superintendent
“Educating Georgia’s Future” gadoe.org
What do LEM rating levels look like?
A LEM rating will fall into one of four rating levels:
3/18/2015 33
Richard Woods, Georgia’s School Superintendent
“Educating Georgia’s Future” gadoe.org
Richard Woods, Georgia’s School Superintendent
“Educating Georgia’s Future” gadoe.org
What makes up a LEM rating?
LAPS Summative
Leader Effectiveness
Measure
3/18/2015 34
Student Growth
Achievement Gap

Richard Woods, Georgia’s School Superintendent
“Educating Georgia’s Future” gadoe.org
Richard Woods, Georgia’s School Superintendent
“Educating Georgia’s Future” gadoe.org
LAPS Standard Ratings
Each of the 8 Performance Standards will be rated using the following scale:
Performance Standard Rating
Point Value
Level IV 3
Level III 2
Level II 1
Level I 0
3/18/2015 35

Richard Woods, Georgia’s School Superintendent
“Educating Georgia’s Future” gadoe.org
Richard Woods, Georgia’s School Superintendent
“Educating Georgia’s Future” gadoe.org
LAPS Overall Ratings
An overall LAPS rating is calculated by adding the point values for each of the 8 Performance Standards and comparing the sum to the following rating levels to determine a final rating:
LAPS Rating LAPS Score Range
Level IV 22-24
Level III 14-21
Level II 6-13
Level I 0-5
3/18/2015 36

Richard Woods, Georgia’s School Superintendent
“Educating Georgia’s Future” gadoe.org
Richard Woods, Georgia’s School Superintendent
“Educating Georgia’s Future” gadoe.org
Student Growth: SGP Rating Levels
Mean Growth Percentile Rating Levels
Mean Growth Percentile Score Range
Level IV MeanGP > 60
Level III MeanGP >45 and < = 60
Level II MeanGP >=35 and <=45
Level I MeanGP <35
3/18/2015 37

Richard Woods, Georgia’s School Superintendent
“Educating Georgia’s Future” gadoe.org
Richard Woods, Georgia’s School Superintendent
“Educating Georgia’s Future” gadoe.org
Student Growth: SLO Rating Levels
38 3/18/2015
SLO Rating Levels SLO Scale
Level IV >= 90% High Growth and Expected Growth AND >= 30% High Growth
Level III 65-89% High Growth and Expected Growth OR >= 90% High Growth and Expected Growth AND <30% High Growth
Level II 50-64% High Growth and Expected Growth
Level I < 50% High Growth and Expected Growth
Richard Woods, Georgia’s School Superintendent
“Educating Georgia’s Future” gadoe.org
Richard Woods, Georgia’s School Superintendent
“Educating Georgia’s Future” gadoe.org
Combined Student Growth Rating
When a leader has both SGP and SLO students: • A leader’s SGP and SLO ratings will be weighted using
the number of student results for each growth type, then averaged.
• This average will be rounded according to standard rounding rules in order to determine that leader’s overall Student Growth rating.
39 3/18/2015

Richard Woods, Georgia’s School Superintendent
“Educating Georgia’s Future” gadoe.org
Richard Woods, Georgia’s School Superintendent
“Educating Georgia’s Future” gadoe.org
Combined Student Growth Rating
Example: If a leader had 240 SGP results and 160 SLO results, and ratings of Levels III and II, respectively, the following calculation will be used:
MGP SLO
Rating: 3 (III) Rating: 2 (II)
240 student measures 160 student measures
3*240 student measures= 720 2*160 student measures = 320
(720+320)/(240+160) = 1040/400
Student Growth Score = 2.6, rounded to 3 (III)
40 3/18/2015

Richard Woods, Georgia’s School Superintendent
“Educating Georgia’s Future” gadoe.org
Richard Woods, Georgia’s School Superintendent
“Educating Georgia’s Future” gadoe.org
Achievement Gap Reduction
What is it?
• The difference in student performance between the school’s lowest-achieving 25% of students (focal group) and the state’s mean performance (reference group)
• Gap size: calculated between a focal group and reference group
• Gap change: calculated from year to year, represents a change in the gap size from the previous year to the current year
3/18/2015 41

Richard Woods, Georgia’s School Superintendent
“Educating Georgia’s Future” gadoe.org
Richard Woods, Georgia’s School Superintendent
“Educating Georgia’s Future” gadoe.org
Achievement Gap Reduction
How is it calculated?
• For each subject, schools receive a rating for both gap size and gap change. A final subject score is the higher of the two ratings.
• The overall Achievement Gap Reduction Score is calculated by averaging the final subject scores.
3/18/2015 42

Richard Woods, Georgia’s School Superintendent
“Educating Georgia’s Future” gadoe.org
Richard Woods, Georgia’s School Superintendent
“Educating Georgia’s Future” gadoe.org
Achievement Gap Reduction: Gap Change & Size Rubrics
Gap Change Score
0.05 or greater 1
-0.04 – 0.04 2
-0.15 – -0.05 3
Less than -0.15 4
Gap Size Score
1.2 or greater 1
0.9 – 1.19 2
0.5 – 0.89 3
Less than 0.5 4
43 3/18/2015

Richard Woods, Georgia’s School Superintendent
“Educating Georgia’s Future” gadoe.org
Richard Woods, Georgia’s School Superintendent
“Educating Georgia’s Future” gadoe.org
Achievement Gap Reduction Example
Subject Gap Size Score Gap Change
Score Final Subject
Score
Reading 4 3 4
ELA 2 3 3
Math 3 4 4
Science 1 2 2
Social Studies 3 3 3
Average of Final Subject Scores: 3.2, rounds to 3
Level III
44 3/18/2015
Richard Woods, Georgia’s School Superintendent
“Educating Georgia’s Future” gadoe.org
Richard Woods, Georgia’s School Superintendent
“Educating Georgia’s Future” gadoe.org
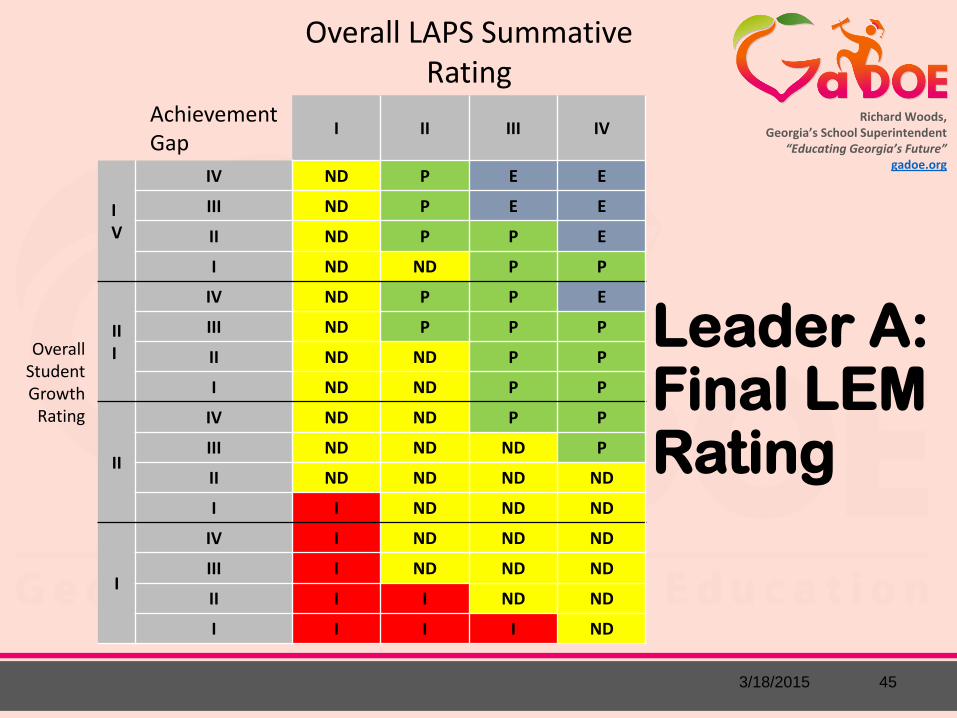
Leader A: Final LEM Rating
Overall LAPS Summative Rating
Achievement Gap
I II III IV
Overall Student Growth
Rating
IV
IV ND P E E
III ND P E E
II ND P P E
I ND ND P P
III
IV ND P P E
III ND P P P
II ND ND P P
I ND ND P P
II
IV ND ND P P
III ND ND ND P
II ND ND ND ND
I I ND ND ND
I
IV I ND ND ND
III I ND ND ND
II I I ND ND
I I I I ND
3/18/2015 45
Richard Woods, Georgia’s School Superintendent
“Educating Georgia’s Future” gadoe.org
For further Information, contact:
Avis King, Deputy Superintendent, Office of School Improvement
Cindy Saxon, Associate Superintendent, Division of Teacher/Leader Effectiveness
Melinda Moe, Program Manager, TLE-TKES/LKES Implementation
Carlene Kirkpatrick, Program Manager, TLE-Title II, Part A & TLE Electronic Platform
Michele Purvis, Program Manager, TLE-Student Learning Objectives
Keisla Tisdel, Program Manager, TLE-Evaluation, Data, & Documentation
46