ricardo teles / vale vale’s performance in 2017 · ricardo teles / vale vale’s performance in...
TRANSCRIPT

1
Ricardo Teles / Vale
Vale’s Performance in 2017Rio de Janeiro, February 28th, 2018

2 Ag
en
da“This presentation may include statements that present Vale's expectations about
future events or results. All statements, when based upon expectations about the
future and not on historical facts, involve various risks and uncertainties. Vale
cannot guarantee that such statements will prove correct. These risks and
uncertainties include factors related to the following: (a) the countries where we
operate, especially Brazil and Canada; (b) the global economy; (c) the capital
markets; (d) the mining and metals prices and their dependence on global
industrial production, which is cyclical by nature; and (e) global competition in the
markets in which Vale operates. To obtain further information on factors that may
lead to results different from those forecast by Vale, please consult the reports
Vale files with the U.S. Securities and Exchange Commission (SEC), the
Brazilian Comissão de Valores Mobiliários (CVM), the French Autorité des
Marchés Financiers (AMF) and in particular the factors discussed under
“Forward-Looking Statements” and “Risk Factors” in Vale’s annual report on Form
20-F.”
“Cautionary Note to U.S. Investors - The SEC permits mining companies, in their
filings with the SEC, to disclose only those mineral deposits that a company can
economically and legally extract or produce. We present certain information in
this presentation, including ‘measured resources,’ ‘indicated resources,’ ‘inferred
resources,’ ‘geologic resources’, which would not be permitted in an SEC filing.
These materials are not proven or probable reserves, as defined by the SEC, and
we cannot assure you that these materials will be converted into proven or
probable reserves, as defined by the SEC. U.S. Investors should consider closely
the disclosure in our Annual Report on Form 20-K, which may be obtained from
us, from our website or at http://http://us.sec.gov/edgar.shtml.” Dis
clai
mer

3 Ag
en
da
1. Vale’s performance in 2017
2. Vale’s performance in 4Q17
a. Highlights
b. Capital expenditures
c. Capital structure
Agen
da

4
Vale’s performance
in 2017

5
US$ 15.3 biTotal EBITDA
Performance highlights in 2017
5
US$ 3.8 biCapital Expenditures
US$ 330 miCoal EBITDA
US$ 37.9/tFerrous Minerals1
EBITDA Margin
US$ 8.6 biFree Cash Flow
US$ 18.1 biNet Debt
28%
24%
711%26%
446% 28%
1 Excluding Manganese and Ferroalloys

6
EBITDA improved 28% as a result of higher prices, higher
premiums and commercial initiatives
6
11,972 11,972
15,81416,528 16,119 15,852 15,637 15,338 15,3383,842
1,439
725409 267 215 299
0
2,000
4,000
6,000
8,000
10,000
12,000
14,000
16,000
18,000
20,000
EBITDA2016
Market prices¹ Premiums &commercialiniciatives
FX Bunker Oil Freight Energy costs Others EBITDA2017
US$ million, 2017 vs. 2016
1 The impact of the increase of market prices (US$ 4.537 billion) is net of impact of the procyclical effects of higher prices in
costs (US$ 695 million), as higher commodities prices result in higher pelletizing plants’ leasing costs, higher royalties,
higher costs of feed purchased from third-parties and provision for profit sharing payments to employees
Mainly due to one-off effects
of the transition to single
furnace in Sudbury and
operational issues at
Thompson in 1Q17
Net of procyclical effects of
higher prices in costs
(US$ 695 million)

7
Ferrous Minerals EBITDA improved as a result of the increase
of Platts IODEX and gains in competitiveness
18
10,476
2,248
556 409 143 1,439
336 94 281
13,192
EBITDA2016
IODEX62% Fe¹
FX Bunker Volume Premiums &commercialinitiatives
Freight &distribution
costs
Unit costs Others EBITDA2017
US$ million, 2017 vs. 2016
Gains in competitiveness: US$ 1.433 billion
1 The impact of the increase of IODEX 62% Fe (US$ 2.943 billion) is net of impact of higher prices in costs (US$ 695 million)

8
S11D ramp-up and supply chain optimization were key to
counterbalance exogenous factors impacts in C1 cash costs
C1 cash costs, US$/t, 2017 vs. 2016
13.3
14.8
1.1
0.6
0.4 0.4
0.40.2
C1 Cash Cost2016
FX Procyclical price linked cost factors
Inflation S11D ramp-up Supply chain optimization
Others C1 Cash Cost2017
9
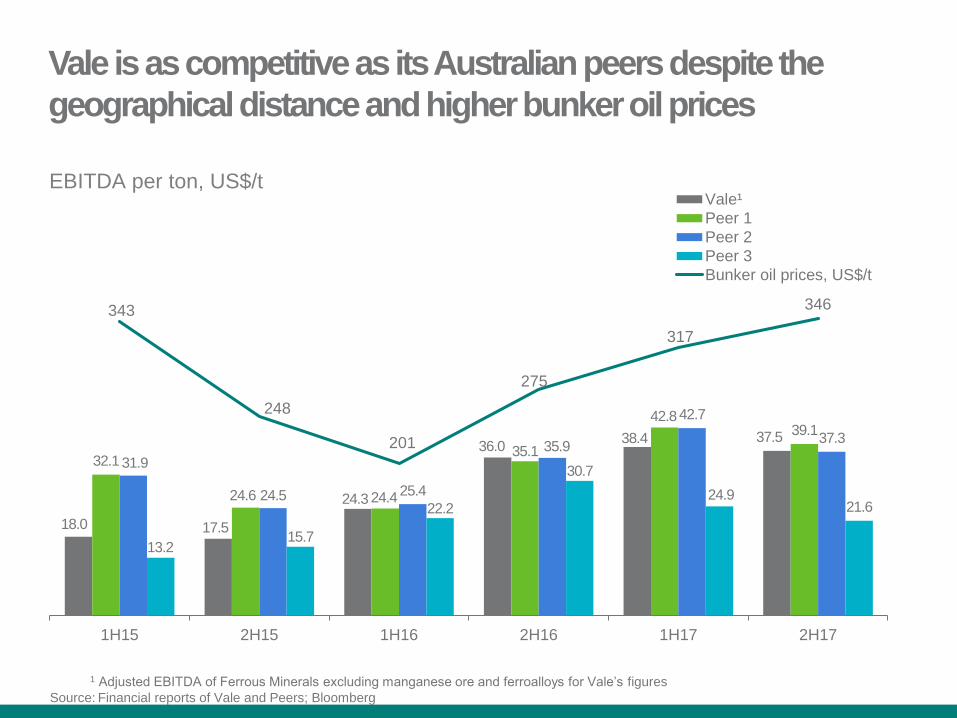
18.0 17.5
24.3
36.038.4 37.5
32.1
24.6 24.4
35.1
42.839.1
31.9
24.5 25.4
35.9
42.7
37.3
13.215.7
22.2
30.7
24.921.6
343
248
201
275
317
346
50
100
150
200
250
300
350
400
0.0
10.0
20.0
30.0
40.0
50.0
60.0
70.0
80.0
1H15 2H15 1H16 2H16 1H17 2H17
Vale¹
Peer 1
Peer 2
Peer 3
Bunker oil prices, US$/t
1 Adjusted EBITDA of Ferrous Minerals excluding manganese ore and ferroalloys for Vale’s figures
Source: Financial reports of Vale and Peers; Bloomberg
EBITDA per ton, US$/t
Vale is as competitive as its Australian peers despite the
geographical distance and higher bunker oil prices

10
Base Metals EBITDA increased 16% vs. 2016, as a result of
higher prices
10
2017 Highlights
Costs were impacted in 2017 by
the transition to a simpler and
more efficient nickel flowsheet
in the North Atlantic operations, to
deliver stronger results from
2018 onwards
Vale’s commitment to value
over volume is reflected in the
nickel business
In 2017, Vale carried out a
detailed review on a mine-by-
mine basis, placing in care and
maintenance two mines in Canada
and one nickel refinery in Taiwan
US$ million, 2017 vs. 2016
1,848
1,029
150
203
385
2,139
EBITDA2016
Price FX Volume Costs andexpenses
EBITDA2017

11
Coal EBITDA achieved its first annual positive result since 2010
11
2017 Highlights
Adjusted EBITDA for the coal
shipped through Nacala port
reached US$ 410 million in 2017
The increase in EBITDA was
mainly due to higher realized
prices and the ramp-up of the
mine expansion and of the
Nacala Logistics Corridor
21
-168
-274
-455
-669
-508
-54
330
2010 2011 2012 2013 2014 2015 2016 2017
US$ million, 2017 vs. 2016

12
Capital expenditures reached the lowest level since 2005
2017 Highlights
Capital expenditures in 2017 totaled US$
3.8 billion decreasing US$ 1.3 billion vs.
2016, mainly due to the conclusion of
the S11D mine and plant project
2017 is also the first year since 2005
where investments in sustaining
exceed investments in growth projects
Capital expenditures guidance of US$
3.8 billion for 2018, with CLN S11D the
only capital project being developed
Project and sustaining capex
US$ billion
12
5.5
3.2
1.6
2.8
2.3
2.2
0
1
2
3
4
5
6
7
8
9
2015 2016 2017
Título do Gráfico
Growth Projects Sustaining
8.4
5.5
3.8

13
Strong cash generated from operations and lower capex led
to a remarkable FCF in 2017
13
US$ million
15,562 1,686
1,051 240 3,848
101 846 1,080 8,604
60 7,022
1,456
66
Cashgenerated
fromoperations
Interestson loans
Incometaxes
& Refissettlementprogram
Derivatives Capex Netdividendsreceived/
paid
Netdisposal/
acquisitionof assets
andinvestments¹
Others² Freecashflow³
Effect ofexchange
ratechanges on
cash andcash
equivalents
Debtrepayment,
net
Dividendspaid toshare-holders
Increase(decrease)
incash & cashequivalents
1 Includes the equity transaction of Nacala with Mitsui and the sale of vessels2 Includes US$ 135 million related to shareholders debentures remuneration, US$ 252 million of cash outflow from the
Fertilizers segment, US$ 353 million of payment to Sumic related to the purchase of its equity interest in VNC, US$ 294
million of funds to the Renova Foundation and US$ 141 million to Samarco to fund its working capital3 Cash flow before debt additions/repayments and distribution of dividends to shareholders

14
Net Debt substantially reduced y-o-y
2017 Highlights
Net debt decreased by US$ 6.9
billion compared to the end of
2016
The US$ 18.1 billion net debt in
4Q17 is equivalent to a pro
forma of US$ 14.4 billion,
considering the cash inflows of
US$ 3.7 bi from the sale of
Fertilizers and from the Project
Finance at Nacala Corridor¹
These inflows, together with the
continuing cash inflows from
operations, will enable us to
achieve our US$ 10 billion net
debt target in the short term
Debt position
US$ million
14
25,234 25,075
~14,400
~3,700
2015 2016 2017
Cash position on
December 31st, 2017
4,346
18,143
1 The cash inflow from the Fertilizers deal with Mosaic occurred in January and from the Nacala Corridor Project Finance will
occur on March 21st, 2018

15
Vale’s performance in 4Q17
Highlights

16
Despite the reduction of US$ 5.3/t in Platts IODEX, EBITDA
remained in line with 3Q17
US$ million, 4Q17 vs. 3Q17
16
4,192
3,760 3,760
3,953
4,021
4,213
4,109 4,109
432
193
68
192
55 159
EBITDA 3Q17 LowerIron Oreprices
HigherBase Metals
prices
HigherCoal
prices
HigherSales
Volumes
LowerBase Metals
costs
Others EBITDA 4Q17

17
Vale’s CFR iron ore price was US$ 7/t higher than Platts,
despite the decrease of market premiums
17
65.6
72.6
63.1
2.0 1.9 0.5 0.2
1.0 2.4 3.9
5.7
AveragePlatts
4Q17 (dmt)
Quality Premium / discount and commercial conditions
Provisionalprices in
prior quarter¹
Laggedprices
Current Provisionalprices
in currentquarter²
CFR reference price (dmt)
Adjustmentfor
FOB sales
Moisture Vale CFR/FOB price(wmt)³
Impact of pricing system adjustments
1 Adjustment as a result of provisional prices booked in 3Q17 at US$ 62.7/t2 Difference between the weighted average of the prices provisionally set at the end of 4Q17 at US$ 72.8/t based on forward curves and US$
65.6/t from the 4Q17 IODEX3 Vale price is net of taxes
US$/t, 4Q17
+10.7%

18
R$/t
18
47.047.8
46.1
49.3
45.8
47.7
4Q15 4Q16 1Q17 2Q17 3Q17 4Q17
1 2015 figures were adjusted to the new allocation criteria, as reported in the 4Q15, and include acquisition costs of third
party purchased ore2 Using the IGP-M (FGV) metric from 4Q15 to 4Q17
+1.5%
+4.1%
When compared to 4Q15, C1 cash cost FOB port in BRL1
increased only 1.5% despite 10.8% inflation2

19
In 4Q17, Base Metals had the highest quarterly EBITDA
since 1Q11
4Q17 Highlights
Base Metals EBITDA
increased US$ 221 million q-
o-q
Higher nickel and copper
realized prices, lower costs
and higher by-product
prices were the main drivers
for the Base Metals EBITDA
increase
US$ million, 4Q17 vs. 3Q17
19
561
561
713768 808 833 799 782
152
55
40 2516
50 17
782
0
100
200
300
400
500
600
700
800
900
EBITDA3Q17
Ni &Cu
prices
Costs By-productprices
Volumes FX By-productvolumes
Expenses EBITDA4Q17

20
3,035
4,298 352
197 17 977
122 182 315
2,744 98
(389)
Cashgenerated
fromoperations
Interestson loans
Incometaxes
& Refissettlementprogram
Derivatives Capex Netdividendsreceived/
paid
Net disposal/acquisitionof assets
andinvestments¹
Others² Freecashflow³
Effect ofexchange
rate changeson cash and
cashequivalents
Debtrepayment,
net
Increase(decrease)
incash & cashequivalents
Free Cash Flow increased considerably vs. 3Q17 as a result
of the strong EBITDA and increased sales collections
20
US$ million
1 Includes the sale of vessels 2 Includes US$ 65 million related to shareholders debentures remuneration, US$ 81 million of cash outflow from the Fertilizers
segment, US$ 78 million of funds to the Renova Foundation and US$ 25 million to Samarco to fund its working capital3 Cash flow before debt additions/repayments and distribution of dividends to shareholders

21
Vale’s performance in 4Q17
Capital expenditures
22
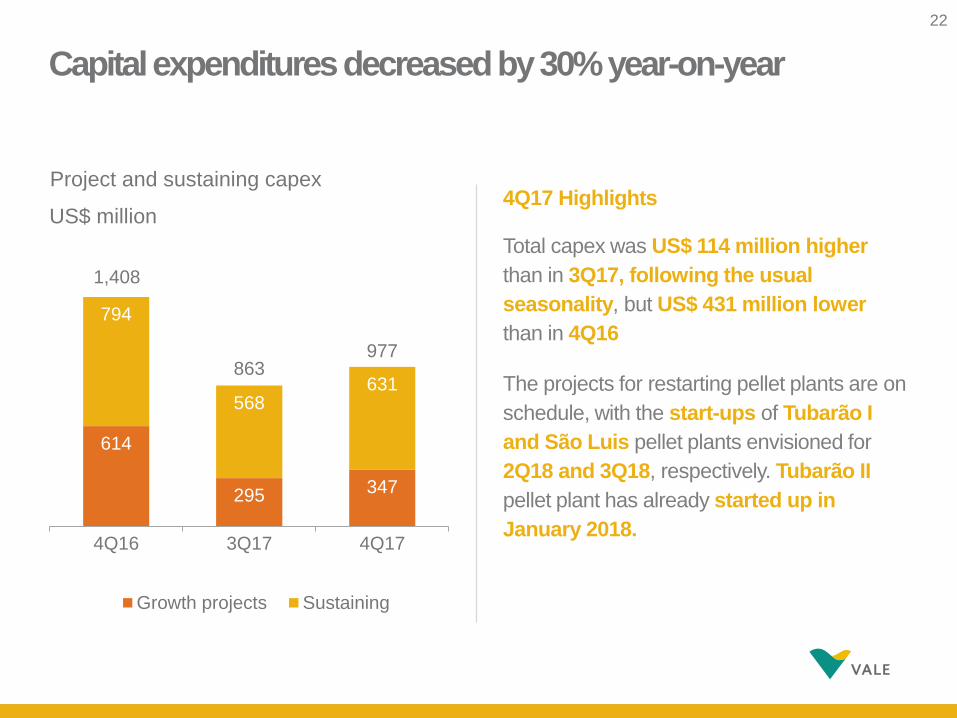
Capital expenditures decreased by 30% year-on-year
4Q17 Highlights
Total capex was US$ 114 million higher
than in 3Q17, following the usual
seasonality, but US$ 431 million lower
than in 4Q16
The projects for restarting pellet plants are on
schedule, with the start-ups of Tubarão I
and São Luis pellet plants envisioned for
2Q18 and 3Q18, respectively. Tubarão II
pellet plant has already started up in
January 2018.
Project and sustaining capex
US$ million
614
295 347
794
568631
4Q16 3Q17 4Q17
Growth projects Sustaining
22
1,408
863977

23
The physical progress of S11D is on schedule
Highlights
93% of combined physical
progress in 4Q17 with the
mine site concluded and 88%
at the logistic infrastructure
sites
The duplication of the
railway reached 80% of
physical progress with 505 km
duplicated
Port expansion reached 97%
of physical progress
23

24
Vale’s performance in 4Q17
Capital structure

25
Net debt decreased by US$ 2.9 billion compared to the end
of 3Q17
25
Net debt
US$ billion
US$ 4.346 billionCash position
on Dec 31th, 2017
Highlights 4Q17
Free Cash Flow was US$ 2.7
billion and net debt decreased by
US$ 2.9 billion totaling US$ 18.1
billion
The US$ 18.1 billion net debt in
4Q17 is equivalent to a pro forma
of US$ 14.4 billion, considering
the cash inflows of US$ 3.7 billion
from the conclusion of the
Fertilizers deal with Mosaic in
January and from the Project
Finance at Nacala Corridor to be
received on March, 21st, 2018
25.042
21.066~14.400
~3.700
4Q16 3Q17 4Q17

26
2.1
1.61.5
1.31.2
4Q16 1Q17 2Q17 3Q17 4Q17
Vale is set to reduce its leverage level
Net debt / LTM1 EBITDA Ratio
1 LTM – last twelve months
Net debt in
4Q17:
US$ 18.143
billion
Cash position in
4Q17:
US$ 4.346 billion
Average
maturity:
8.9 years
Average cost of
debt:
5.06% per annum
26

27
1.2 1.82.6 2.6
13.8
22.0
2018 2019 2020 2021 2022onwards
Gross debt
Efficient liability management led to an amortization schedule
with 63% of debt settlement after 2022
Gross debt amortization schedule1
1 As of December 31st, 2017. Does not include accrued interests
US$ billion
27

28
Additional
information

29
Fe Pellets Ni Cu Coal
Vale achieved annual records in iron ore, pellets, Salobo,
gold and coal
Production highlights 2017
Total: 366.5 Mt
N. System: 169.2 Mt
Total: 50.3 Mt Total: 288.2 kt
VNC: 40.3 kt
Onça Puma: 24.7 kt
Total: 438.5 kt
Salobo: 193.4 kt
Total: 11.3 Mt
%
Annual record%
29
% %
% %
%
%

30
Net operating revenues by destination
in 2017
30
Higher prices and volumes led to higher y-o-y revenues
2017 Highlights
Net operating revenues of US$ 33.967
billion
Revenues were 24% higher vs. 2016
mainly due to higher realized prices
of Ferrous Minerals, Base Metals and
Coal and higher sales volumes of
Ferrous Minerals and Coal
41% sales to China and 10% in Brazil
Ferrous Minerals accounted for 74%
of revenues
Base Metals accounted for 20% of
revenues
41%
16%
11%
10%
7%
7%
5% 3%
China EuropeOther Asia BrazilJapan North AmericaRest of the World Middle East

31
Evolution of iron ore fines cash cost, freight and expenses
14.4 14.5 14.6
4Q16 3Q17 4Q17
C1 cash cost FOB port1 Freight
US$/t
13.2
15.0
17.0
4Q16 3Q17 4Q17
Expenses2 & royalties
3.5 3.5 3.6
4Q16 3Q17 4Q17
1 Ex-ROM and ex-royalties2 Net of depreciation, including dividends received
31

32
1 Ex-ROM
4Q17 cash break-even cost landed in China for iron ore
and pellets
14.6
17.0
3.6
0.7 3.1 3.9
35.2
1.3
33.9
3.4 37.3
C1 cash cost¹ Freight Royalties & expenses
Distribution Moisture Quality EBITDA breakeven
iron ore fines
Pellet adjustment
EBITDA breakeven (pellets &
fines)
Sustaining Iron ore & pellets cash breakeven
Cost landed in China
US$/t, 4Q17
32

33
Iron ore pricing systems
Provisional – prior quarter Lagged
Current Provisional – current quarter
2.7
-0.5
3Q17 4Q17
0.3 0.2
3Q17 4Q17
-0.2
1.0
3Q17 4Q17
-3.2
2.4
3Q17 4Q17
Pricing system breakdown Impact of pricing mechanisms
US$/t
33
10% 10% 11%
45%51% 49%
45%39% 40%
4Q16 3Q17 4Q17
Lagged
Current
Provisional

34
Iron ore fines sales composition
34
4Q17 Highlights
Sales volumes of iron ore fines reached
79.6 Mt in 4Q17 vs. 76.4 Mt in 3Q17,
4.2% higher than in 3Q17, mainly due to
the S11D ramp-up
In 4Q17, some sales were deliberately
postponed to 1Q18 for margin
optimization
17% 16%
19% 15%
26%25%
37% 42%
3Q17 4Q17
Carajás Blend
Southern Southeastern
Others

35
Evolution of iron ore fines sustaining per ton
35
US$/t
3.2
3.8
2.8 2.9
3.4
4Q16 1Q17 2Q17 3Q17 4Q17
3.2Last twelve
months

36
Price realization nickel
11,584
11,781
434 237
Average LME nickel price
Price premium on refined products
Price discount on intermediate products
Average nickel realized price
36
US$/t, 4Q17

37
Price realization copper
6,808
7,044
7,286
6,735
236
242 551
Average LME copper price
Current period price adjustments
Copper gross realized price
Prior period price adjustments
Copper realized price before discounts
TC/RCs, penalties, premiums and
discounts
Average copper realized price
37
US$/t, 4Q17

38
Unit cash cost of sales per operation, net of by-product
credits1
Operation (US$ / t) 4Q17 3Q17 4Q164
North Atlantic Operations (nickel)2 4,624 4,484 5,125
PTVI (nickel)2 6,609 5,866 5,770
VNC (nickel)3 8,420 9,841 11,375
Onça Puma (nickel) 7,536 7,944 9,204
Sossego (copper) 3,270 2,951 3,207
Salobo (copper) 679 792 838
1 North Atlantic figures includes Clydach and Acton refining costs2 Prior periods restated to include royalties, freight and other period costs3 Unit cash cost restated for periods prior to 1Q17 to exclude pre-operating and other operating expenses4 We realigned our unit cash cost of sales methodology in 1Q17 to include all freight, royalty and other costs reported as cost of goods sold and to
exclude other operating expenses and pre-operating expenses for certain operations. Considering the previous criteria, the unit cash cost figures
would be as follows: North Atlantic, US$ 3,412/t in 4Q16; PTVI, US$ 5,695/t in 4Q16, and; VNC, US$ 11,017/t in 4Q16
38

39
Price realization –metallurgical coal from Mozambique
US$/t, 4Q17
39
204.7
178.5 178.5
6.2
11.1
9.6 6.3
0.3
5.3
150.0
160.0
170.0
180.0
190.0
200.0
210.0
Averagereference price
4Q17
Quality Current price Fixed,lagged &
benchmark prices
Provisionalprice
Freightdifferential
Others Valeprice
Impact of pricing system adjustments

40
Price realization – thermal coal from Mozambique
40
Impact of pricing system adjustments
US$/t, 4Q17
92.5
78.1 78.6
14.1
0.5 0.2 0.3 0.2 0.5
Averagereference price
4Q17
Quality Current price Fixed & lagged prices
Provisionalprice
Freightdifferential
Others Valeprice

41
Coal proformaproduction costs through Nacala
US$/t
41
2
1 Includes mine and logistics operational costs2 Includes total tariff charged by the Nacala Logistics Corridor (NLC) excluding its operational costs minus the
provision for interests related to Vale’s shareholder loans made to the NLC
97.8
84.2 74.2 71.3
92.6
89.393.8
104.4
4Q16 1Q17 2Q17 3Q17 4Q17
Net additional tariffs cost
Operational costs only1
2

42
75%
16%
8%
USD Hedge to USD BRL Others
75%
19%
5%
USD BRL EUR Others
Debt position breakdown by currency
Debt position breakdown by currency
(before hedge)
Debt position breakdown by currency
(after hedge)
42

43