revista ingeniería de construcción ric vol 31 nº2 2016 www ... · en chile, como en muchos...
TRANSCRIPT

Revista Ingeniería de Construcción RIC Vol 31 Nº2 2016 www.ricuc.cl
ENGLISH VERSION.....................................................................................................................................................................................................................................................
Revista Ingeniería de Construcción Vol 31 Nº2 Agosto de 2016 www.ricuc.cl 159
Probabilistic assessment of asphalt pavement design Determinación probabilística del tiempo de servicio de estructuras de pavimentos
M. Rodríguez 1*, G. Thenoux **, Á. González ***
* Universidad de Medellín, Medellín. COLOMBIA ** Pontificia Universidad Católica de Chile, Santiago. CHILE *** Universidad del Desarrollo, Santiago. CHILE
Fecha de Recepción: 08/03/2016 Fecha de Aceptación: 21/06/2016
PAG 83-90
Abstract In Chile, as in many South American countries, AASHTO-93 is the current official method for the design of asphalt pavements. The method gives an estimated number of 80 kN standard axle loads (W18) that the pavement can withstand for a certain serviceability. A safety factor is then applied to W18 to take into account the confidence level and the estimated variance of the inputs used in the method, whereby the magnitude of the structure’s life cycle is estimated. Normally, data used in the AASHTO-93 method are assumed to be deterministic, disregarding their random nature. This paper presents a probabilistic assessment of the AASHTO-93 pavement design method under Chilean conditions, which provides a set of probability density functions (PDFs) that allow a probabilistic estimation of the pavement life cycle in terms of the value W18. To achieve the goal, we developed a simulation model based on a sample of 13 groups of roads located throughout Chile. Keywords: Pavement design, asphalt pavements, probabilistic assessment Resumen En Chile, como en muchos países de Suramérica, AASHTO 93 es el método oficial para el diseño de pavimentos asfálticos. El método entrega un número estimado de ejes equivalentes estándar de 80 kN que el pavimento puede soportar hasta alcanzar un cierto valor de serviciabilidad. Un factor de seguridad es luego aplicado al número estimado de ejes equivalente tomando en cuenta el nivel de confianza y la varianza estimada de los datos de entrada utilizados en el método, con lo cuál se estima la magnitud del ciclo de vida de la estructura. Normalmente, los datos utilizados en el método AASHTO 93 son asumidos como valores deterministas, sin tomar en cuenta su naturaleza aleatoria. Este trabajo presenta una evaluación probabilística del método de diseño AASHTO 93 de pavimentos bajo condiciones chilenas, el cuáll proporciona un conjunto de funciones de densidad de probabilidad, que permiten realizar la estimación probabilística del ciclo de vida del pavimento en términos del valor del número de ejes equivalente. Para alcanzar el objetivo se desarrollo un modelo de simulación a partir de una muestra de 13 grupos de carreteras ubicados a largo de Chile. Palabras clave: Diseño de pavimentos, pavimentos en asfalto, evaluación probabilística
1. Introduction Pavement design methods are divided in three types based on their approach; they can be either mechanistic, when based on the mechanics of materials; empirical, when based on tests and field trials; or mechanistic empirical, when they adopt theoretical concepts from mechanics of materials complemented by field data (FHWA, 2006). All design methods must incorporate reliability, so as to protect the design from the uncertainties that appear when defining traffic loads, environmental conditions, evolution of the deterioration, mechanical properties and structural performance of the materials (AASHTO, 1993), as well as the quality of the construction processes (Sánchez-Silva et al., 2005). During the pavement’s design stage, the reliability protecting the design from the uncertainty of the aspects mentioned above is defined as "the probability that a pavement section designed with this process will perform satisfactorily under traffic and environmental conditions during the period of life" (AASHTO, 1993).
Chile currently uses the AASHTO-93 design method (MOP, 2012), which assumes the design reliability by setting a confidence level (R) that defines the level of variance adopted in the design (ZR), and a value that includes the variance estimated from each of the factors used in the model’s prediction model (Huang, 1993). The model’s input and output data are defined in a deterministic way; however, it should be noted that pavement engineering projects have a certain degree of uncertainty in their design, construction and operation. This implies that an adequate performance of the solution cannot be absolutely guaranteed, only in terms of the probability of success to meet the performance criterion (Achintya and Sankaran, 2000), which in this case is the number of equivalent standard axle loads of 80 kN which define the pavement’s service life. The objective of this research is to incorporate probability when calculating the life cycle of a pavement structure. Therefore, a simulation model was developed to assess the probability of Chilean roads, classified by their geographic location, structural capacity and traffic, to reach the service life expressed in terms of the number of equivalent single axle loads of 80 kN.
1 Corresponding author:
Professor of the Faculty of Engineering, Universidad de Medellín, Colombia E-mail: [email protected]

Revista Ingeniería de Construcción RIC Vol 31 Nº2 2016 www.ricuc.cl
ENGLISH VERSION.....................................................................................................................................................................................................................................................
Revista Ingeniería de Construcción Vol 31 Nº2 Agosto de 2016 www.ricuc.cl 160
2. Structural design methods Pavements’ structural design methods allow measuring the thickness of the pavement layers that withstand the action of vehicle loads and climate conditions during their life cycle, thereby guaranteeing the compliance with the serviceability thresholds previously defined. These design methods are divided in three types depending on their approach:
− The mechanistic methods assess the pavement’s response through compressive stress, tensile stress and deformations (Tighe et al., 2007), relating structural behavior and performance in the presence of traffic loads and environmental conditions (FHWA 2006).
− The empirical methods are based on experimental
results and they are represented by mathematical relations developed from field data (Carvalho and Schwartz, 2006). The AASHTO method is probably the most popular and most widely used empirical design method, not only in the USA, but also at global level (Abaza and Abu-Eisheh, 2003).
− The empirical mechanistic methods establish a
relation between the pavement’s response based on the materials mechanics, when they are subjected to traffic loads and climate conditions, and the pavement performance through empirical deterioration models (Carvalho et al., 2006), where the MEPDG method is one of the most representative.
Regardless of the structure design method selected, the variability of the model’s input and output data must be considered together with the random factor in the construction processes, and the climate conditions to which the pavement structure is subjected to. 2.1 AASHTO-93 design method The AASHTO-93 design method is based on algorithms developed in the AASHO road test, completed in May 1962 and modified in the design guides published on
July 1986 (Baus et al., 1989) and 1993. The design formula is represented by Equation 1. Log 𝑊!" =
𝑍! ∗ 𝑆! + 9,36 ∗ 𝑙𝑜𝑔 𝑆𝑁 + 1 − 0,20 +!"#
!!!!!!,!!!,!
!,!"! !"#$!"!! !,!"
+ 2,32 ∗
𝑙𝑜𝑔 𝑀! − 8,07 (1) Where: − W18: Predicted number of 80 kN equivalent single axle
loads. − ZR: Normal standard deviation associated with the design
reliability R. − So: Combined standard error. − Pi: Initial serviceability index. − Pf: Final serviceability index. − SN: Structural number (inches). − MR: Effective resilient modulus of the subgrade soil
(MPa). All factors in Equation 1 show some degree of uncertainty, but there are also other situations that are outside of the scope of the design technique, which also present variability. For example: the construction process, the climate condition of the site and the load applied to the structure. They all affect the adequate performance of the pavement throughout its life cycle. The way the AASHTO-93 design methods takes into account the variability of these factors is based on the probability method (Lemer and Moavenzadeh, 1971). This method appreciates the reliability of the design by establishing a confidence level (R) that defines the level of variance adopted in the design (ZR) and a value including the variance estimated for each one of the factors used in the prediction model (So) (Huang, 1993). In the specific case of Chile, the values for R, Z
R and S
o
are recommended by the Chilean Highway Design Manual (MOP, 2012), but in general they are defined based on the experience and good judgment of the designer, which can entail some risks of over or under sizing the structure, depending on the values adopted by the pavement designer (Figure 1a).
(a) (b)
Figure 1. Serviceability of asphalt pavements versus pavement life (Pi=Initial serviceability, Pf=Final serviceability, Nf1= W18 for conservative designer, Nf2= W18 for less conservative designer, Nfo= real number of W18)
Predicted number of 80 kN equivalent simple axle (Millions) Predicted number of 80 kN equivalent simple axle (Millions)
Serv
icea
bilit
y
Serv
icea
bilit
y

Revista Ingeniería de Construcción RIC Vol 31 Nº2 2016 www.ricuc.cl
ENGLISH VERSION.....................................................................................................................................................................................................................................................
Revista Ingeniería de Construcción Vol 31 Nº2 Agosto de 2016 www.ricuc.cl 161
The input data used in the design formula are defined according to the field data analysis, where the corridor is sectioned in order to delimit the design. In this regard, the input data of the design formula, and consequently the output data, are set in a deterministic way, which only applies a safety factor based on parameters R, ZR and So, to protect the design from the variability sources. The reliability in the AASHTO-93 method is defined as "the probability that a pavement section designed with this process will perform satisfactorily under traffic and environmental conditions during the design period" (AASHTO, 1993). According to the latter, it seems more adequate to analyze the service life or life cycle under probabilistic hypotheses, as represented in Figure 1b, which is possible if the input data are considered as random variables, thereby obtaining an equally random output variable as a result, which represents the pavement’s life cycle, expressed in terms of the number of 80 kN equivalent axle loads.
3. Methodology With the aim of meeting the objective of this research, a simulation model was developed (Figure 2) using the Monte Carlo method, which could repeatedly evaluate the response of the AASHTO-93 design method for different road groups when their input variables were represented as probability density functions. In order to define the input data of the design method, field data from roads located in Chile were used, which were in service for more than 10 years. 3.1 Factorial design used in the simulation The factorial design of the simulation considered three factors: geographic location, traffic and pavement structural capacity defined by the structural number. In turn, each factor was divided in three levels, which generated a factorial with 27 cells (Figure 3).
Figure 2. Execution of the simulation model
Figure 3. Factorial design matrix of the simulation model

Revista Ingeniería de Construcción RIC Vol 31 Nº2 2016 www.ricuc.cl
ENGLISH VERSION.....................................................................................................................................................................................................................................................
Revista Ingeniería de Construcción Vol 31 Nº2 Agosto de 2016 www.ricuc.cl 162
The purpose was that each cell could be occupied with the largest number of asphalt pavement structures, thereby considering that highways had similar characteristics of geometry, structural capacity and traffic that would allow them to be grouped into a same factorial cell. In the research, each road was divided in 20 meter long sampling units, which were selected at random and its final number was defined so that bias in the data could be avoided. Each cell was identified by three groups of letters. The first group is composed by a character representing the geographic area to which the road belongs, north (N), center (C) or south (S). The second group represents the type of traffic, which can be low (LT), medium (MT) or high (HT).
The third group represents the value of the structural number as low (LS), medium (MS) or high (HS). For example, NLTLS represents a road located in the north, with low traffic and low structural number. 3.2 Simulation process In order to prepare the simulation model, the first step was to establish the conceptual model under which the simulation was designed (Figure 4). The conceptual model was divided in three phases; phase 1 and 2 were developed simultaneously, while phase 3 gathered the results of the two previous phases.
3.2.1Phase 1: data architecture (input data) The input random variables were the Structural Number SN (in inches) and the subgrade’s Resilient Modulus MR (in MPa). Detailed information was needed to calculate the structural number, which referred to the thickness and type of materials of each layer of the studied road sections, in addition to the subgrade’s CBR value; these data were Where:
obtained from the road network database of the Ministry of Public Works of Chile (MOP). Afterwards, the structural number was calculated based on Equation 2 (Huang, 1993) and Equation 3 (Hodges et al., 1975). The values of the structural and drainage coefficients were those recommended by MOP (2012).
Figura 4. Conceptual model for the simulation model development
SN = 𝑎!! ∗ 𝐷!! + 𝑎!" ∗ 𝐷!" + 𝑎!" ∗ 𝐷!" + 𝑎! ∗ 𝐷! ∗𝑚! + 𝑎! ∗ 𝐷! ∗𝑚! + 𝑅 (2) 𝑅 = (3,51 ∗ log 𝐶𝐵𝑅)− [0,85 ∗ (log 𝐶𝐵𝑅)!] − 1,43 (3)

Revista Ingeniería de Construcción RIC Vol 31 Nº2 2016 www.ricuc.cl
ENGLISH VERSION.....................................................................................................................................................................................................................................................
Revista Ingeniería de Construcción Vol 31 Nº2 Agosto de 2016 www.ricuc.cl 163
− SN: Structural number (in) − aij: Structural coefficient for the asphalt layer j − Dij: Thickness of the asphalt layer j (in) − a2: Structural coefficient for the granular base layer − D2: Thickness of the granular base layer (in) − m2: Drainage coefficient of the granular base layer − a3:
Structural coefficient for the granular subbase layer − D3: Thickness of the granular subbase layer (in) − m3: Drainage coefficient of the granular subbase layer − R: Contribution to the calculation of the subbase
structural number − CBR: Subgrade strength (California Bearing Ratio) The probability density function represented by the random variable SN for each cell of the factorial design was obtained by finding out, through a statistical software, which was the probability density function that best fitted the structural number values calculated for all sections that were part of each factorial cell. The Resilient Modulus of the subgrade was calculated with the CBR value of every pavement structure that was part of each factorial cell, based on the information from the MOP database. Equations 4 and 5 (MOP, 2012) were used in the calculation. 𝑀! = 17,6 ∗ 𝐶𝐵𝑅 !,!" For CBR < 12% (4) 𝑀! = 22,1 ∗ 𝐶𝐵𝑅 !,!! For 12 < CBR < 80% (5) Where: − MR: Resilient Modulus of the subgrade (MPa). − CBR: Subgrade strength (California Bearing Ratio). The probability density function represented by the random variable MR for each factorial cell was obtained by finding out, through a statistical software, which was the probability density function that best fitted the MR values calculated for all sections that were part of each factorial cell. 3.2.2 Phase 2: Development of the simulation model In this phase, a software was selected to perform the simulation. Then, a flow chart with the moduli that took part in the simulation model was conceptually developed, and in the end the computer code was entered in each modulus using the software language. The main structure of the simulation model was based on the Monte Carlo method, which allows assessing the risk or reliability of complex engineering systems by using random numbers associated to probability density functions, and that also allows determining the joint
probability when more than two random variables are incorporated to a problem, as in this case (Stewart, 2004). The Monte Carlo method consists in choosing random numbers associated to a probability. This probability allows establishing the values of the variable needed to run the simulator in the density functions of the input variables. The output of the simulator represents a deterministic response of the phenomenon. This process is repeated a number of cycles that is set by selecting a confidence level for the response expected from the simulator. The set of outputs is later adjusted to a probability density function that best represents the model responses through a statistical test. This phase was completed with the calibration and validation of the simulation model. 3.2.3 Phase 3: Implementation of the Simulation Model Once the simulation model was developed and input data were defined (random variables SN and MR), the simulator was launched using the input data established for each factorial design cell. In order to set the value for the number of 80 kN equivalent axle loads that the structure could withstand according to the design formula, this stage of the simulation did not include the values for factors R, ZR and So; instead, the basic expression of the AASHTO method was used. The simulation was run a certain number of times calculated through the Student’s t-test, with the aim of defining the size of a sample with 95% confidence. The set of data that make up the output of the different repetitions were adjusted to probability density functions and became the random variable that represents the probabilistic assessment of the prediction referring to the duration of the pavement’s life cycle, expressed in terms of equivalent standard axle loads of 80 kN, according to the AASHTO-93 design method.
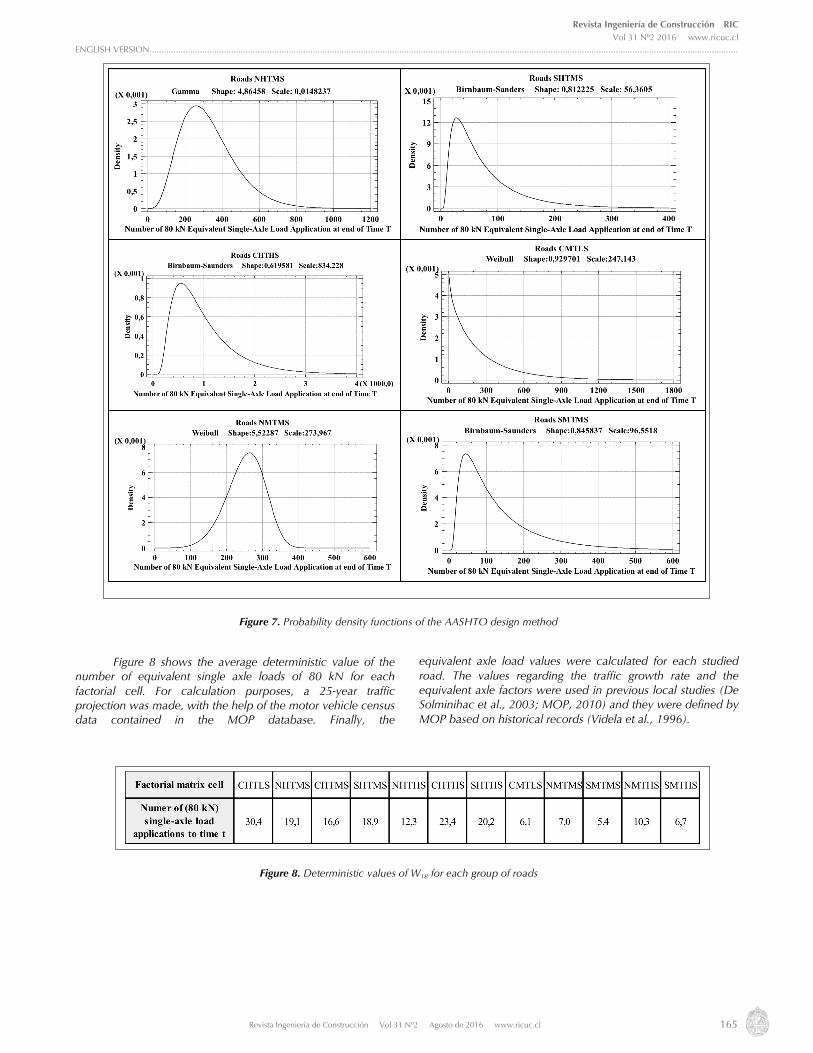
4. Analysis of Results After analyzing the database provided by MOP, the data collected allowed the study of only 13 of the 27 cells from the initial factorial design, representing a database of 66 roads located along Chile (Figure 5). 4.1 Response of the Simulation Model The response of the model provides a probability density function that predicts the service life in terms of the number of equivalent standard axle loads of 80 kN for each set of roads that was part of the factorial design matrix, which represent 13 probability density functions (Figure 6). Figure 7 shows a sample of 6 from 13 responses (probability functions) concerning the AASHTO design method for different studied roads.

Revista Ingeniería de Construcción RIC Vol 31 Nº2 2016 www.ricuc.cl
ENGLISH VERSION.....................................................................................................................................................................................................................................................
Revista Ingeniería de Construcción Vol 31 Nº2 Agosto de 2016 www.ricuc.cl 164
Figure 5. Factorial design matrix of the simulation model actually used in the research
Figure 6. Probabilistic response of the AASHTO design method
Revista Ingeniería de Construcción RIC Vol 31 Nº2 2016 www.ricuc.cl
ENGLISH VERSION.....................................................................................................................................................................................................................................................
Revista Ingeniería de Construcción Vol 31 Nº2 Agosto de 2016 www.ricuc.cl 165
Figure 8 shows the average deterministic value of the number of equivalent single axle loads of 80 kN for each factorial cell. For calculation purposes, a 25-year traffic projection was made, with the help of the motor vehicle census data contained in the MOP database. Finally, the
equivalent axle load values were calculated for each studied road. The values regarding the traffic growth rate and the equivalent axle factors were used in previous local studies (De Solminihac et al., 2003; MOP, 2010) and they were defined by MOP based on historical records (Videla et al., 1996).
Figure 7. Probability density functions of the AASHTO design method
Figure 8. Deterministic values of W18 for each group of roads

Revista Ingeniería de Construcción RIC Vol 31 Nº2 2016 www.ricuc.cl
ENGLISH VERSION.....................................................................................................................................................................................................................................................
Revista Ingeniería de Construcción Vol 31 Nº2 Agosto de 2016 www.ricuc.cl 166
4.2 Discussion In general, density plots present kurtosis and skewness and their analysis showed the following: All responses of the model are asymmetrical, twelve present a positive skewness and one has a negative skewness, thereby indicating that the model has a response concentration skewed to the left or the right respectively. Most of the analyzed road groups present a data concentration to the left of the mode, which indicates that there is a higher probability for the model response to be below this value. Eleven road groups showed positive kurtosis, indicating that the distribution is more peaked at the mode and has longer tails than usual and, therefore, it shows a high output data concentration level around the variable mode. Only one group presented a negative kurtosis, indicating that the function is flatter than the normal distribution with shorter tails; therefore, it shows a low output data concentration level around the variable mode. The probabilistic response of the AASHTO design method for seven factorial groups are represented by probability functions of the Birnbaum-Sanders type, three by Weibull and the remaining three by Lognormal, Gamma and uniform distribution (Figure 6). All probability distributions, except the uniform one, correspond to life distribution functions that are a probability model associated to a life variable (Marshall and Olkin, 2007), which are characterized for being asymmetrical and positively skewed; they assess and predict the service life properly. The Birnbaum-Saunders distribution is known as the fatigue life distribution, since it describes the materials’ fatigue process from the initial stages of imperceptible cracks, followed by growth and propagation caused by cyclic stress and tension, to the materials’ rupture or failure due to fatigue (Barros, Paula, Leiva, 2009), which adequately reflects the deterioration
suffered throughout the life cycle of an asphalt pavement structure.
Finally, when comparing the probabilistic results obtained in this research with the deterministic values of the number of equivalent axle loads that define the length of the structures’ life cycle, it is possible to establish that, except for the CHTLS roads that have a 62% probability of failure before reaching the number of equivalent axle loads that define the life cycle, most of the structures will easily comply with the prediction, thereby showing that most structures are oversized.
5. Conclusions
− This paper developed a probabilistic model of the AASHTO-93 design method, using a Chilean database. The research provides expressions that predict the length of a pavement life cycle by using probability density functions in highways classified by geographic location, type of traffic and structural capacity.
− The methodology implemented in this study could be replicated in any part of the world, but the specific results only apply to Chilean road conditions, as a consequence of the database used in the research.
− The result of this research can be used to incorporate risk analysis in the design of pavement layers.
The functions describing the prediction of the pavement structures’ life cycle in terms of the number of equivalent axle loads of 80 kN correspond mostly to life distributions, where the Birnbaum-Saunders type of functions are more frequent and they adequately describe the fatigue failure caused by physical phenomena.
6. References Achintya H. y Sankaran M. (2000), Probability, Reliability, and Statistical Methods in Engineering Design. New York: John Willey & Sons, Inc. Cap. 5, 6, 7, 8. American Association of State Highway and Transportation Officials (1993), AASHTO Guide for Design of Pavement Structures. United States: (s.n.).
Parte I: Cap. 1, 4. Parte II: Cap. 1, 2, 3. Abaza K. y Abu-Eisheh S. (2003), An Optimum Design Approach for Flexible Pavement. The International Journal of Pavement Engineering, 4 (1), 1-11. Barros M., Paula G.A. y Leiva V. (2009), An R implementation for generalized Birnbaum-Saunders distributions. Computational Statistics and Data
Analysis, 53 (5), 1511-1528. Baus R. y Fogg J. (1989), AASHTO Flexible Pavement Design Equation Study. Journal of Transportation Engineering, 115 (5), 559-564. Carvalho R. y Schwartz C. (2006), Comparisons of Flexible Pavement Design AASHTO Empirical Versus NCHRP Project 1-37A Mechanistic-Empirical.
Journal of Transportation Research Record, (1947), 167 – 174. De Solminihac H., Hidalgo P. y Salgado M. (2003), Calibration of Performance Models for Surface Treatment to Chilean Conditions: the HDM-4 Case.
Journal of the Transportation Research Board, (1819), 285-293. Federal Highway Administration FHWA (2006), Geotechnical Aspects of Pavements. Publication No. FHWA NHI-05-037. Washington: Federal
Highway Administration. U.S. Department of Transportación. Cap. 1, 3, 5, 6. Hodges J. W., J. Rolt y T.E. Jones (1975), The Kenya Road Transport Cost Study: Research on Road Deterioration, TRRL Laboratory Report 673.
Crowthorne, Inglaterra: Transport Research Laboratory. Cap. 1, 2, 3, 4, 5. Huang Y. (1993), Pavement Analysis and Design. (2a ed.). New Jersey: Prentice Hall. Capitulos 10 y 11 Lemer A. C. y Moavenzadeh F. (1971), Reliability of highway pavements. Highway Research Record, (362), 1-8. Marshall A. y Olkin I. (2007), Life Distributions. Structure of Nonparametric, Semiparametric, and Parametric Families. Nueva York: Springer. Cap. 1, 2. Ministerio de Obras Publica – MOP (2012), Manual de Carreteras. Santiago, Chile: Ministerio de Obras Públicas – Dirección de Vialidad. Cap. 3 Ministerio de Obras Públicas de Chile (2010), Estudio Básico Seguimiento de Pavimentos Asfálticos. Santiago, Chile: Ministerio de Obras Públicas. Sanchez-Silva M., Arroyo O., Junca M., Caro S. y Caicedo B. (2005), Reliability based design optimization of asphalt pavements. International Journal of
Pavement Engineering, 6 (4), 281- 294. Stewart Robinson (2004), Simulation: The Practice of Model Development and Use. Inglaterra: John Willey and Sons, Inc. Cap. 1, 2, 5, 6, 7. Tighe S., Huen K. y Haas R. (2007). Environmental and traffic deterioration with mechanistic empirical pavement design model. Journal of Transportación
Research Record, 2 (1989), 336-343. Videla C., De Solminihac H., Gaete R. y Bustos M. (1996), Ajuste de Factores de Calibración para Ampliar Modelos de Deterioro de Pavimentos
asfálticos. Santiago, Chile: Ministerio de Obras Públicas y Pontificia Universidad Católica de Chile.