revisit energy efficiency gap: do quantity and price of...
TRANSCRIPT
Revisit Energy Efficiency Gap:Do Quantity and Price of Energy Efficient
Appliances Respond to Changes in Energy Pricesand Interest Rates?
Hyun-gyu Kim, Michael Roberts and Arlan Brucal
University of Hawaii at Manoa
February 29, 2016
Main Question
I How prices and sales of energy efficient appliance respond tothe changes in interest rates and energy prices?

Energy Efficiency Gap(EEG)?
I Consumers and business often slow to invest in energyefficiency, called ”Energy Paradox”(Jaffe & Stavins,1994)
I High discount rates for energy cost saving

Estimated Average Discount Rate
Source: Train, 1985

Why the Energy Efficiency is Important?
I Reducing Green House Gas(GHG) emission
I Without Political Difficulty
I High Returns of Investment ($520 billion⇒ $1.2 trillion)
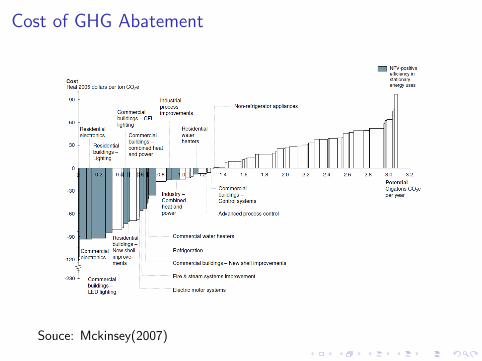
Cost of GHG Abatement
Souce: Mckinsey(2007)
Why Do We Revisit Energy Efficiency Gap?
I Previous literatures provide the evidence of EEG.I Cross-sectionalI Unobservable characteristicsI Does not meet modern standard credibility
(Allcott and Greenstone [2012])
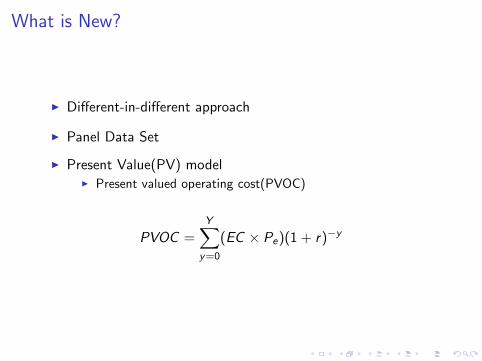
What is New?
I Different-in-different approach
I Panel Data Set
I Present Value(PV) modelI Present valued operating cost(PVOC)
PVOC =Y∑
y=0
(EC × Pe)(1 + r)−y
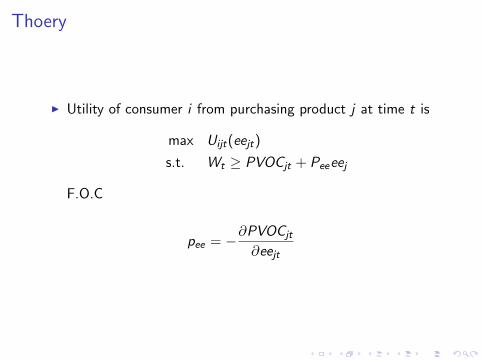
Thoery
I Utility of consumer i from purchasing product j at time t is
max Uijt(eejt)
s.t. Wt ≥ PVOCjt + Peeeej
F.O.C
pee = −∂PVOCjt
∂eejt
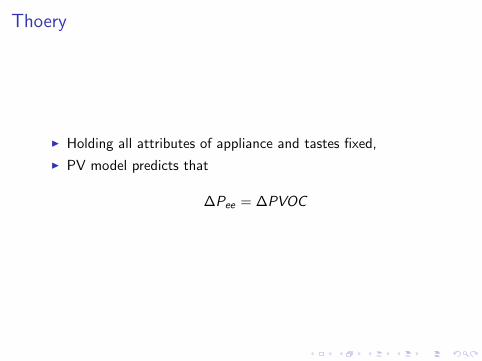
Thoery
I Holding all attributes of appliance and tastes fixed,
I PV model predicts that
∆Pee = ∆PVOC
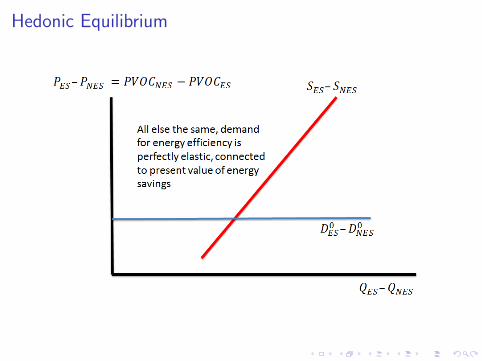
Hedonic Equilibrium

Hedonic Equilibrium
Coveat of Hedonic Equilibrium Model
I Consumers might be hetergeneous (Sorting)I Timmins 2007
I Imperfect Competition
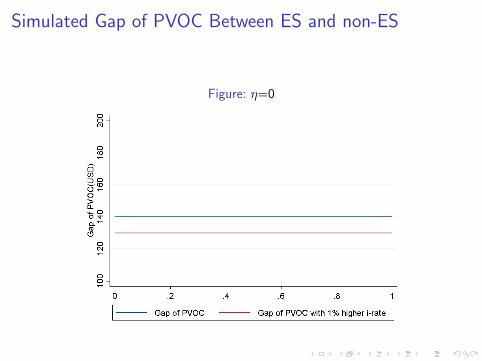
Simulated Gap of PVOC Between ES and non-ES
Figure: η=0

Simulated Gap of PVOC Between ES and non-ES
Figure: η=N(0.05, 0.09)

Data
I Point-of-sale dataI NPD GroupI Monthly Revenue and SalesI CharacteristicsI Price=Total revenue/ Number of salesI Jan 2003 - Dec 2011
I Federal Trade Commission(FTC)I Annual Energy ConsumptionI Energy Efficiency Rate

Bunching Energy Efficiency Rate
Figure: Refrigerator

Summary Statistics(Clothes Washer)
Weighted WithinWithout Weight by Sales Model Obs.
Mean SD Mean SD SD
Real Price (USD) Estar 781.15 264.72 699.10 233.43 107.27 7,804Non Estar 414.32 172.45 376.15 126.63 30.25 3,518
PVOC (USD) Estar 325.18 126.39 324.76 124.96 10.56 7,804Non Estar 738.67 200.87 718.13 181.47 22.73 3,518
Capacity (Cu.Ft.) Estar 3.47 0.411 3.48 0.34 7,804Non Estar 3.13 0.24 3.20 0.23 3,518
Sales (Unit) Estar 1,528 2,563 1,718 7,804Non Estar 1,583 2,454 1,481 3,518

Constant Quality Index for PVOC
CQOIt =
CQOIt−1 + CQOIt−1
∑i Wit
(PVOCit−PVOCit−1
(PVOCit+PVOCit−1)/2
)∑
i Wit
,∀t > 0
where :
Wit =qit + qit−1
2,∀i that exist in t & t − 1.
and:
CQOI0 =
∑i qi0PVOCi0∑
i qi0

Trend of CQI of PVOC(Refrigerator)
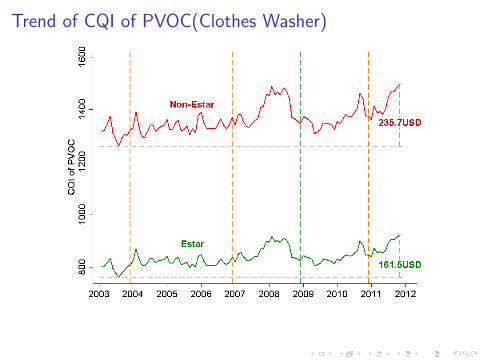
Trend of CQI of PVOC(Clothes Washer)
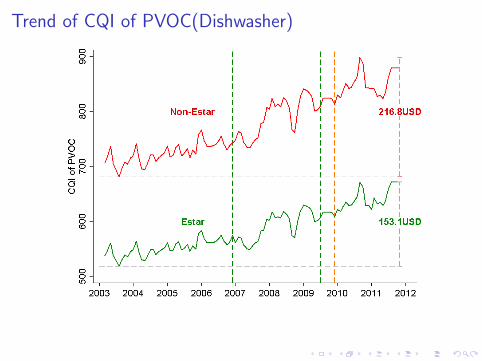
Trend of CQI of PVOC(Dishwasher)
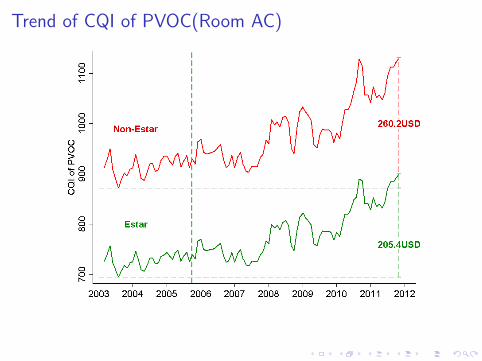
Trend of CQI of PVOC(Room AC)
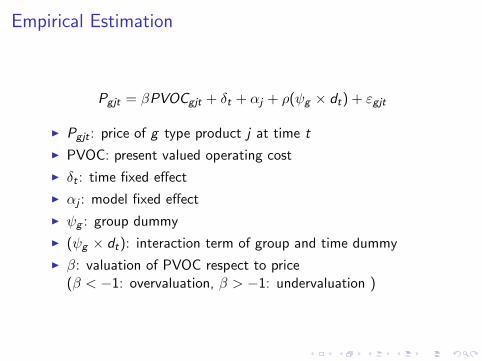
Empirical Estimation
Pgjt = βPVOCgjt + δt + αj + ρ(ψg × dt) + εgjt
I Pgjt : price of g type product j at time t
I PVOC: present valued operating cost
I δt : time fixed effect
I αj : model fixed effect
I ψg : group dummy
I (ψg × dt): interaction term of group and time dummy
I β: valuation of PVOC respect to price(β < −1: overvaluation, β > −1: undervaluation )

Empirical Estimation
logQgjt = γPVOCgjt + δt + αj + ρ(ψg × dt) + εgjt
I Qgjt : monthly sales of g type product j at time t
I PVOC: function of present valued operating cost
I δt : time fixed effect
I αj : model fixed effect
I ψg : group dummy
I (ψg × dt): interaction term of group and time dummy
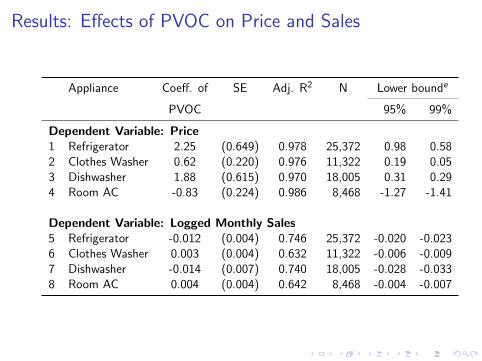
Results: Effects of PVOC on Price and Sales
Appliance Coeff. of SE Adj. R2 N Lower bounde
PVOC 95% 99%
Dependent Variable: Price1 Refrigerator 2.25 (0.649) 0.978 25,372 0.98 0.582 Clothes Washer 0.62 (0.220) 0.976 11,322 0.19 0.053 Dishwasher 1.88 (0.615) 0.970 18,005 0.31 0.294 Room AC -0.83 (0.224) 0.986 8,468 -1.27 -1.41
Dependent Variable: Logged Monthly Sales5 Refrigerator -0.012 (0.004) 0.746 25,372 -0.020 -0.0236 Clothes Washer 0.003 (0.004) 0.632 11,322 -0.006 -0.0097 Dishwasher -0.014 (0.007) 0.740 18,005 -0.028 -0.0338 Room AC 0.004 (0.004) 0.642 8,468 -0.004 -0.007
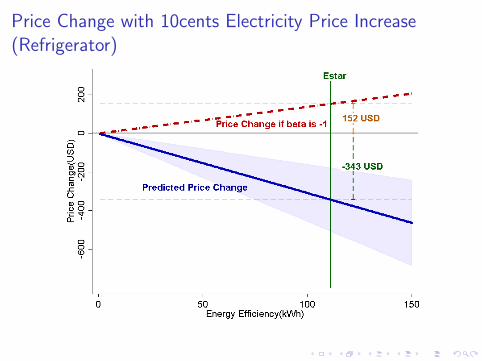
Price Change with 10cents Electricity Price Increase(Refrigerator)
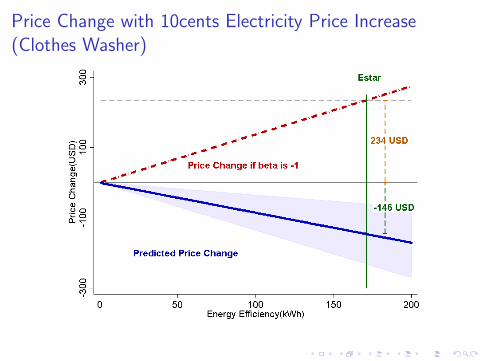
Price Change with 10cents Electricity Price Increase(Clothes Washer)

Price Change with 10cents Electricity Price Increase(Dishwasher)

Price Change with 10cents Electricity Price Increase(Room AC)

Possible Reason for Positive Coefficients
I Increasing Returns to Scale
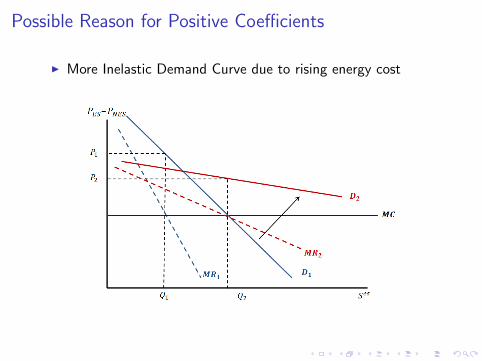
Possible Reason for Positive Coefficients
I More Inelastic Demand Curve due to rising energy cost
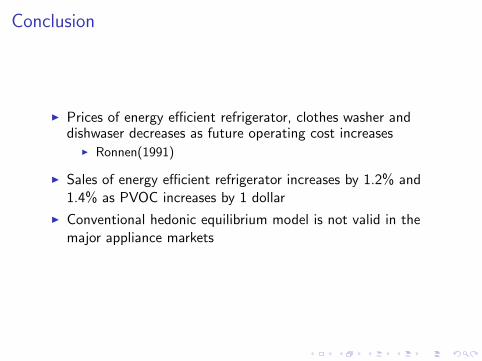
Conclusion
I Prices of energy efficient refrigerator, clothes washer anddishwaser decreases as future operating cost increases
I Ronnen(1991)
I Sales of energy efficient refrigerator increases by 1.2% and1.4% as PVOC increases by 1 dollar
I Conventional hedonic equilibrium model is not valid in themajor appliance markets

Thank you!!!

Reference
Hunt Allcott and Michael Greenstone. Is there an energy efficiencygap? The Journal of Economic Perspectives, pages 3–28, 2012.
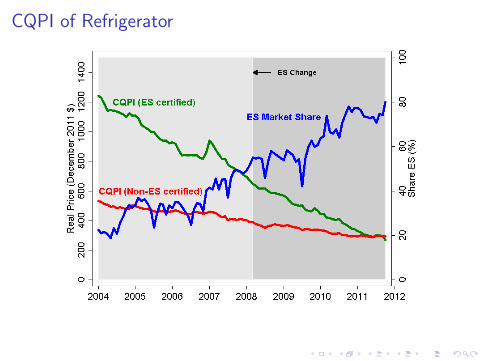
CQPI of Refrigerator
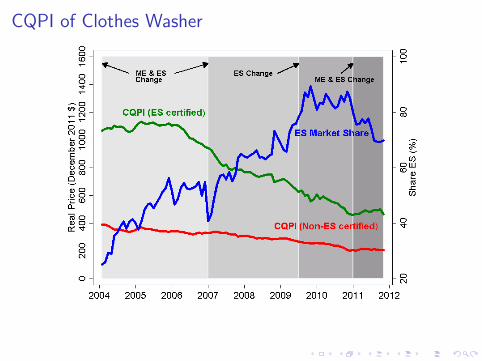
CQPI of Clothes Washer