revised draft forecast of electricity demand for the fifth
TRANSCRIPT

Revised Draft
Forecast of Electricity Demand
for the 5th Pacific Northwest Conservation and Electric Power Plan
May 13, 2003

DRAFT DRAFT DRAFT
1
Introduction and Summary A twenty-year forecast of electricity demand is a required component of the Council’s Northwest Regional Conservation and Electric Power Plan. 1 Understanding growth in electricity demand is, of course, crucial to determining the need for new electricity resources and helping assess conservation opportunities. The Council has also had a tradition of acknowledging the uncertainty of any forecast of electricity demand and developing ways to reduce the risk of planning errors that could arise from this and other uncertainties in the planning process. Electricity demand is forecast to grow from 20,080 average megawatts in 2000 to 25,423 average megawatts by 2025 in the medium forecast. The average annual rate of growth in this forecast is just less than 1 percent per year. This is slower demand growth than forecast in the Council’s 4th power plan, which grew at 1.3 percent per year from 1994 to 2015. The slower demand growth primarily reflects reduced electricity use by the aluminum industry and other electricity intensive industries in the region. Forecasts of higher electricity and natural gas prices will fundamentally challenge energy intensive industries in the region. The medium case electricity demand forecast means that the region’s electricity needs would grow by 5,343 average megawatts by 2015, an average annual increase of 214 average megawatts. As a result of the 2000-01 energy crisis, the 2003 demand is expected to be nearly 2000 average megawatts lower than in 2000, making the annual growth rates and megawatt increases from 2003-2025 higher than from the 2000 base. The annual growth rate from 2003 to 2025 is 1.5 percent per year, with annual megawatt increases averaging 330. Compared to the 2015 forecast of demand in the Council’s 4th power plan, the 5th plan forecast is 3,000 average megawatts lower. Nearly, two thirds of this difference is due to lower expectations for the region’s aluminum smelters. The most likely range of demand growth (between the medium-low and medium-high forecasts) is between 0.4 and 1.50 percent per year. However, the low to high forecast range recognizes that growth as low as -0.5 percent per year or as high as 2.4 percent per year is possible, although relatively unlikely. Table 1 summarizes the forecast range.
1 Public Law 96-501, Sec. 4(e)(3)(D)

DRAFT DRAFT DRAFT
2
Table 1 Demand Forecast Range
(Actual) Growth Rates 2000 2015 2025 2000-2015 2000-2025
Low 20,080 17,489 17,822 -0.92 -0.48 Medium Low 20,080 19,942 21,934 -0.05 0.35 Medium 20,080 22,105 25,423 0.64 0.95 Medium High 20,080 24,200 29,138 1.25 1.50 High 20,080 27,687 35,897 2.16 2.35
Forecasting Methods The approach to the demand forecasts is significantly different from previous Council plans. For this plan, the Council has not used its Demand Forecasting System. Instead there are three separate approaches to the forecast in terms of methods and relationship to the Council’s 4th power plan. The methods differ for (1) the range of long-term non-direct service industry (non-DSI) forecasts from low to high, (2) for a monthly near-term medium case forecast, and (3) for a forecast of aluminum smelter and other direct service industry (DSI) demand. The non-DSI forecasts generally rely on the forecasts from the 4th power plan for their long-term demand trends. The decision to use the 4th power plan forecast trends was based partly on an assessment of the accuracy of those forecasts over the five or six years since they were done.2 The total demand forecasts tracked actual loads very closely between 1995 and 2000. The average percentage error in the forecast of electricity consumption for those years has been less than one half of a percent. Figure 1 illustrates actual consumption compared to the medium, medium-low and medium-high forecasts through 2000. Figure 1 also illustrates the ability of the model to simulate the period before 1995 when actual values of the main forecast drivers are used. The forecasts for individual consuming sectors have also been quite accurate since the 1995 forecasts were done. The level of residential consumption was overforecast by an average of 0.6 percent. Commercial consumption was underforecast by an average of 0.9 percent, and industrial consumption, excluding DSIs, was overforecast by an average of 3.6 percent. Since there was little evidence that the long-term forecasts were departing seriously from actual electricity consumption, the Council decided to continue to rely on its earlier forecast trends for non-DSI electricity demand. The medium case non-DSI forecast is developed in two stages. The first stage is a near-term monthly forecast of demand recovery from the recent energy crisis. The second stage is a long-term forecast of demand trends from 2005 to 2025.
2 Northwest Power Planning Council. “Economic and Electricity Demand Analysis and Comparison of the Council’s 1995 Forecast to Current Data.” September 2001, Council Document 2001-23. http://www.nwcouncil.org/library/2001/2001-23.htm

DRAFT DRAFT DRAFT
3
Figure 1 Demand Forecast Versus Actual Consumption of Electricity
10500
12500
14500
16500
18500
20500
22500
1981
1983
1985
1987
1989
1991
1993
1995
1997
1999
Years
Ave
rage
Meg
awat
ts
ACTUAL
Medium High
Medium
Medium Low
During late 2000 and 2001 electricity demand decreased dramatically in the region due to the electricity crisis, large increases in retail electricity rates, and an economic recession. The Council analyzed the components and causes of the 2000-2001 decline in electricity consumption in its assessment of the outlook for winter 2001-2002 electricity adequacy and reliability. 3 As illustrated in Figure 2, nearly 60 percent of the reduction was due to closing down aluminum smelters, which make up the bulk of the DSI category. Therefore, a large part of the total medium forecast of demand recovery depends on specific assumptions about the return to operation of aluminum and other large industrial loads that were either bought out or shut down during 2001. The medium case forecast to 2005 addresses the recovery from this starting condition. The medium case forecast of non-DSI demand recovery depends on assumptions about recovery from the economic recession and the effects of recent retail electricity price increases, although these effects are not modeled in any formal way. In general, the effects of higher retail electricity prices are assumed to dampen the effect of economic recovery on electricity use and slow the recovery of electricity demand. By 2005 non-DSI electricity demands are assumed to have nearly returned to a non-recession level, but that demand is lower than the 4th power plan forecast due to some assumed permanent effects of higher electricity prices, as well as lasting efficiencty improvements achieved during the crisis.
3 Northwest Power Planning Council. “Analysis of Winter 2001-2002 Power Supply Adequacy”. November 2001. Council Report 2001-28. http://www.nwcouncil.org/library/2001/2001-28.pdf

DRAFT DRAFT DRAFT
4
Figure 2 Components of a 20 Percent Load Reduction from July 2000 to July 2001
DSI58%
Buyouts5%
Shutdowns7%
Other Response
30%
The near-term medium forecasts are done on a monthly basis through 2005. The monthly forecasts through 2005 are done as electricity loads to facilitate tracking the forecast against actual load data as it becomes available. After 2005 the forecast is presented as electricity sales and is comparable to the range forecasts and to previous Council demand forecasts. The range of long-term non-DSI forecasts is developed for the years following 2005. These four forecasts, as well as the medium case extension beyond 2005, depend on the growth rates of the corresponding forecasts in the 4th power plan. The 2005 starting points for the range forecasts are estimated by applying 4th plan low to high case growth rates to an estimate of actual electricity demand in 2000 instead of the 4th plan forecasts for 2000. However, the relative pattern of growth for each case is adjusted to resemble the pattern near-term medium case decreases in 2001 and recovery to 2005. After 2005, low to high case annual growth rates from the 4th plan were applied to the respective range of cases. This approach results in a narrower range of forecasts than the corresponding years forecasts in the 4th power plan. The long-term forecasts should be viewed as estimates of future demand, unreduced for conservation savings beyond what would be induced by consumer responses to price changes. The Council has referred to these forecasts as “price effects” forecasts in the past. The shift from actual consumption to the price effects forecast is made in 2001. In the medium case, the only sector with any significant programmatic conservation by 2001 in the 4th power plan was the residential sector. Residential sector consumption in

DRAFT DRAFT DRAFT
5
2001 has 191 average megawatts of programmatic conservation savings added to demand. This makes the decrease in residential consumption appear smaller in the forecast than actual consumption decreases are likely to be for 2001. Similar adjustments affect the higher growth cases for the other sectors as well. The forecast of electricity demand by the region’s aluminum smelters and the few other remaining industrial plants that were traditionally served directly by the Bonneville Power Administration (DSIs) are discussed separately below. The forecast of aluminum smelter electricity use is an exception to reliance on the 4th plan forecast trends. Both the method of forecasting and the results are significantly different from the 4th power plan.
Demand Forecast The demand forecasts are presented in this section. The medium-term monthly forecasts are presented in the form of monthly “load” forecasts. That is, the values include transmission and distribution losses. The long-term forecasts are presented as electricity sales, or electricity consumption at the end-use level, and therefore exclude transmission and distribution losses. The long-term forecasts of electricity demand are developed for individual consuming sectors such as residential, commercial, and industrial. The long-term forecasts are directly comparable to the demand forecasts presented in the 4th power plan. The forecast of demand for electricity by aluminum smelters is treated separately from the non-DSI demand. This reflects the large amount of electricity required by these plants combined with a growing uncertainty about their future operation in the region.
Non-DSI Forecasts
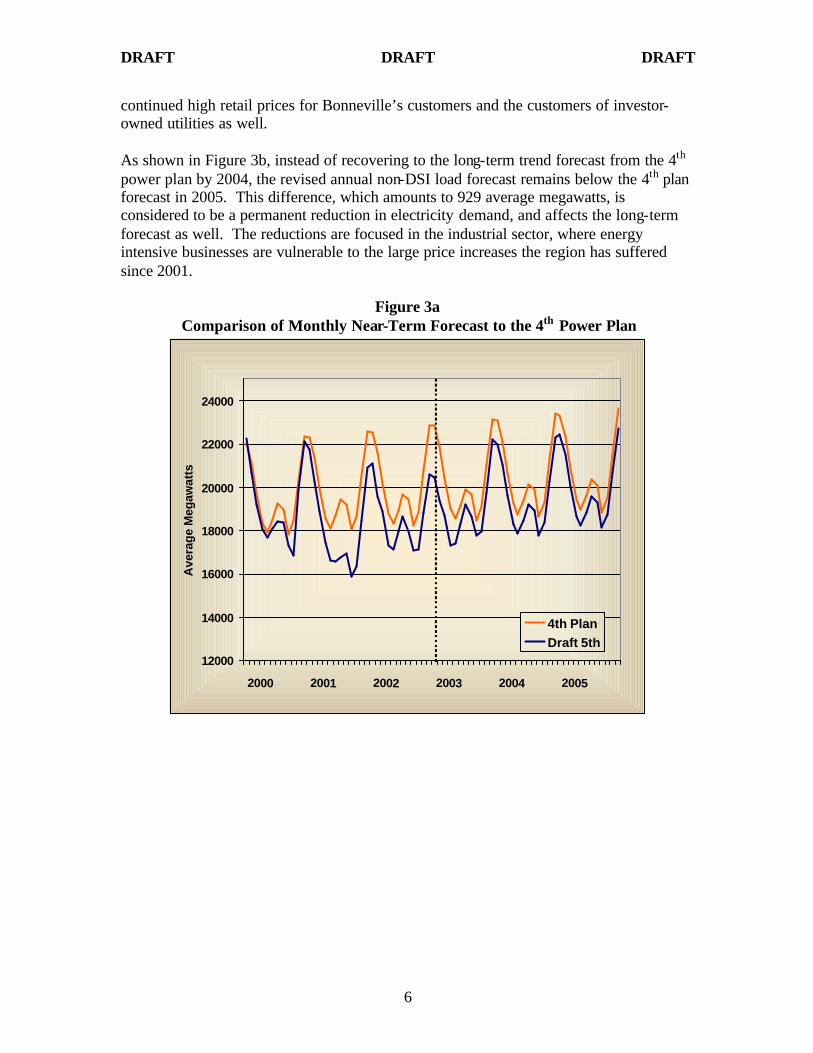
Near-Term Monthly Non-DSI Load Forecast Figures 3a and 3b illustrate how the near-term forecasts of non-DSI loads are designed to track recovery back toward the forecast trends from the Council’s 4th power plan. In Figure 3a the upper line is the 4th power plan trend forecast converted to electricity loads with a monthly pattern added. The lower line shows the near-term monthly forecast of loads. The dashed vertical line separates actual monthly load data from the forecast. The recovery may be more clear in the corresponding annual numbers shown in Figure 3b.
When the Council first developed a near-term forecast of load recovery in October 2001 it was expected that non-DSI loads would recover to near the 4th plan forecast levels by 2004. This is no longer the case, as shown in Figures 3a and 3b. There are two substantial reasons for the changes to the near-term load forecast since the earlier assessment. First, the anticipated rate of economic recovery has been slower than expected. Second, energy prices, which fell substantially in 2002, have increased again in 2003. Some of the increase is due to temporary conditions including strikes in the oil industry of Venezuela, concerns about the war in Iraq, a cold winter in the eastern part of the country, and low runoff forecasts for the Pacific Northwest. However, other contributors to high energy prices may be indicative of longer-term trends. These include the reduced growth in natural gas supplies in spite of significant drilling activity and
DRAFT DRAFT DRAFT
6
continued high retail prices for Bonneville’s customers and the customers of investor-owned utilities as well. As shown in Figure 3b, instead of recovering to the long-term trend forecast from the 4th power plan by 2004, the revised annual non-DSI load forecast remains below the 4th plan forecast in 2005. This difference, which amounts to 929 average megawatts, is considered to be a permanent reduction in electricity demand, and affects the long-term forecast as well. The reductions are focused in the industrial sector, where energy intensive businesses are vulnerable to the large price increases the region has suffered since 2001.
Figure 3a Comparison of Monthly Near-Term Forecast to the 4th Power Plan
12000
14000
16000
18000
20000
22000
24000
2000 2001 2002 2003 2004 2005
Ave
rag
e M
egaw
atts
4th PlanDraft 5th

DRAFT DRAFT DRAFT
7
Figure 3b
Comparison of Annual Near-Term Forecast to the 4th Power Plan
10000
12000
14000
16000
18000
20000
22000
1999 2000 2001 2002 2003 2004 2005
Ave
rage
Meg
awat
ts
5th Plan Non-DSI
4th Plan Non-DSI
Long-Term Forecasts of Non-DSI Demand The range of long-term forecasts of total non-DSI electricity sales is shown in Figure 4. In the medium forecast, non-DSI electricity consumption grows from 17,603 average megawatts in 2000 to 24,464 average megawatts by 2025. This is an increase of 1.33 percent, and 275 average megawatts, per year from 2000 to 2025. These growth indicators are lowered somewhat by the electricity crisis and recession in 2000-01. From 2005 to 2025 the average annual growth rate is 1.43 percent per year, with an average annual increase in consumption of 300 average megawatts. Figure 4 illustrates how the 4th plan demand forecast and the draft near-term and long-term forecasts for the 5th power plan compare. The near-term forecast reflects the currently depressed electricity demand and then merges into the medium forecast. The other forecasts in the range appear as dashed lines that extend from 2005 to 2025. The 4th plan forecasts appear as solid lines that extend to 2015. Historical actual weather adjusted sales appears as a dotted line through the year 2000. The range of forecasts indicate that actual future demands should fall within plus or minus 15 percent of the medium forecast in 2025 with fairly high probability. This is reflected in the medium-low to medium-high forecast range in Table 2. However, under more extreme variations in circumstances they could vary by 30 to 40 percent from the medium forecast, as shown by the low to high forecast range.

DRAFT DRAFT DRAFT
8
Figure 4 Forecast Total Non-DSI Electricity Sales Compared to 4th Plan Forecasts
10000
15000
20000
25000
30000
35000
40000
1981
1984
1987
1990
1993
1996
1999
2002
2005
2008
2011
2014
2017
2020
2023
4th Plan RangeActual5th Plan Range5th Plan Medium
Table 2 Non-DSI Electricity Sales Forecast Range
Growth Rates 2000 2015 2025 2000-15 2000-25 (Actual)
Low 17603 17489 17822 -0.04% 0.05% Medium Low 17603 19482 21474 0.68% 0.80% Medium 17603 21147 24464 1.23% 1.33% Medium High 17603 23000 27937 1.80% 1.86% High 17603 26187 34397 2.68% 2.72%
Maintaining growth rates from the 4th power plan’s demand forecasts after 2005 implicitly assumes that the underlying assumptions remain about the same in terms of their effects on growth in electricity demand. The main driving assumptions in the 4th power plan demand forecasts were economic growth, fuel price assumptions, and electricity price forecasts. We have not attempted to develop a new economic forecast. However, the 4th plan economic forecasts were checked for obvious deviations from actual values since the forecasts were developed in 1995.4 The most aggregate determinates of demand are, population, households, and total non-farm employment. The number of households is
4 Council Document 2001-23, sited above.
DRAFT DRAFT DRAFT
9
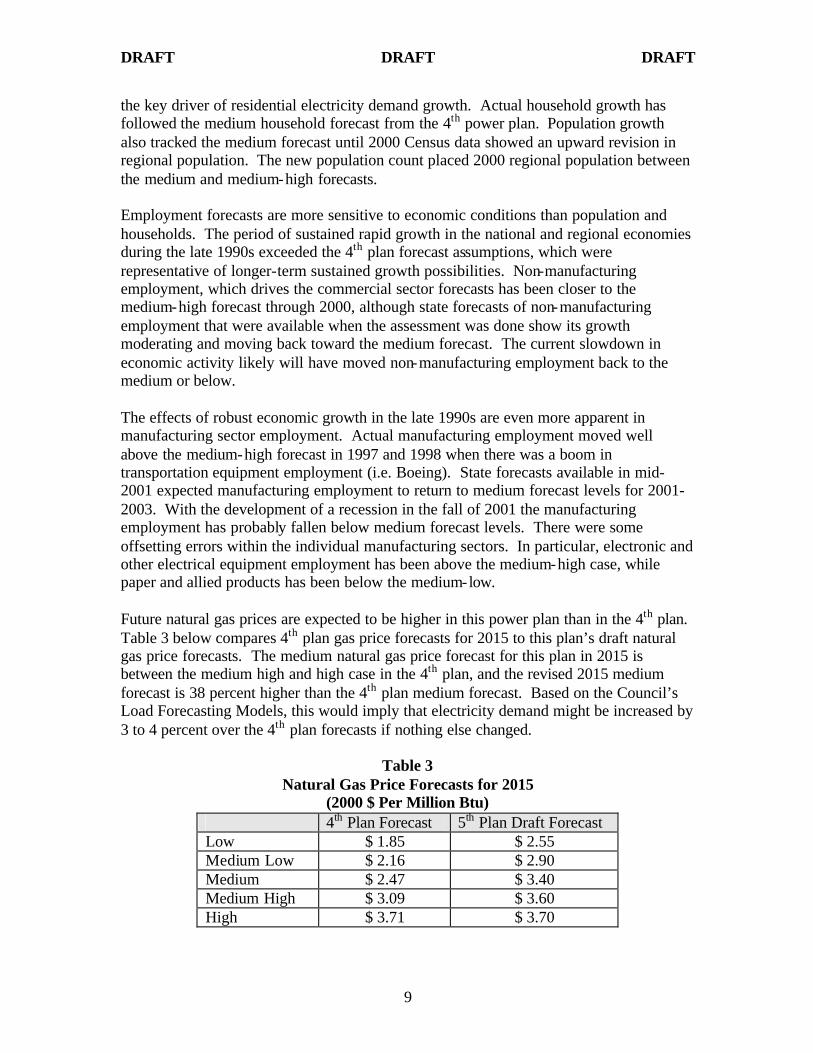
the key driver of residential electricity demand growth. Actual household growth has followed the medium household forecast from the 4th power plan. Population growth also tracked the medium forecast until 2000 Census data showed an upward revision in regional population. The new population count placed 2000 regional population between the medium and medium-high forecasts. Employment forecasts are more sensitive to economic conditions than population and households. The period of sustained rapid growth in the national and regional economies during the late 1990s exceeded the 4th plan forecast assumptions, which were representative of longer-term sustained growth possibilities. Non-manufacturing employment, which drives the commercial sector forecasts has been closer to the medium-high forecast through 2000, although state forecasts of non-manufacturing employment that were available when the assessment was done show its growth moderating and moving back toward the medium forecast. The current slowdown in economic activity likely will have moved non-manufacturing employment back to the medium or below. The effects of robust economic growth in the late 1990s are even more apparent in manufacturing sector employment. Actual manufacturing employment moved well above the medium-high forecast in 1997 and 1998 when there was a boom in transportation equipment employment (i.e. Boeing). State forecasts available in mid-2001 expected manufacturing employment to return to medium forecast levels for 2001-2003. With the development of a recession in the fall of 2001 the manufacturing employment has probably fallen below medium forecast levels. There were some offsetting errors within the individual manufacturing sectors. In particular, electronic and other electrical equipment employment has been above the medium-high case, while paper and allied products has been below the medium-low. Future natural gas prices are expected to be higher in this power plan than in the 4th plan. Table 3 below compares 4th plan gas price forecasts for 2015 to this plan’s draft natural gas price forecasts. The medium natural gas price forecast for this plan in 2015 is between the medium high and high case in the 4th plan, and the revised 2015 medium forecast is 38 percent higher than the 4th plan medium forecast. Based on the Council’s Load Forecasting Models, this would imply that electricity demand might be increased by 3 to 4 percent over the 4th plan forecasts if nothing else changed.
Table 3 Natural Gas Price Forecasts for 2015
(2000 $ Per Million Btu) 4th Plan Forecast 5th Plan Draft Forecast Low $ 1.85 $ 2.55 Medium Low $ 2.16 $ 2.90 Medium $ 2.47 $ 3.40 Medium High $ 3.09 $ 3.60 High $ 3.71 $ 3.70

DRAFT DRAFT DRAFT
10
However, the effects of higher gas prices may be offset by higher electricity prices. It is difficult to compare retail electricity prices between the two forecasts because the old price forecasting models are no longer appropriate for price forecasting in a partially restructured electricity market. The new price model addresses only wholesale electricity prices. Future retail prices will reflect both wholesale market prices and utility-owned resource costs if the system remains mixed, as it is currently. It is clear that higher natural gas prices will have an effect on electricity prices, both through the cost of utility owned natural gas-fired generation and through the wholesale market price of electricity. Higher electricity prices have a larger downward effect on electricity consumption than the upward effect that a comparable increase in natural gas prices would have. In the end, it isn’t clear whether the changes in natural gas and electricity prices would cause a net increase or decrease in electricity consumption.
Sector Forecasts Total non-DSI consumption of electricity is forecast to grow from 17,603 average megawatts in 2000 to 24,464 average megawatts by 2025, an average yearly rate of growth of 1.33 percent. The year 2000 is used as the base year for the forecast and growth rate calculations. It is a more representative year for examining long-term trends in demand than 2001 or 2002 would be. Table 4 shows the forecast for each consuming sector in the medium case. Each sector’s forecast is discussed in separate sections below.
Table 4 Medium Case Non-DSI Consumption Forecast
(Average Megawatts) 2000 2005 2010 2015 2020 2025 Growth Rates (Actual) 2000-25 2000-15 2005-25
Total Non-DSI Sales 17,603 18,433 19,688 21,147 22,742 24,464 1.33 1.23 1.43 Residential 6,724 7,262 7,687 8,230 8,809 9,430 1.36 1.36 1.31 Commercial 5,219 5,453 5,771 6,146 6,556 6,993 1.18 1.10 1.25 Non-DSI Industrial 4,836 4,904 5,397 5,919 6,505 7,150 1.58 1.36 1.90 Irrigation 652 629 641 654 667 681 0.17 0.02 0.40 Other 172 185 191 198 204 211 0.82 0.93 0.66
Residential Sector Residential electricity consumption is forecast to grow by 1.36 percent per year between 2000 and 2025. Figure 5 illustrates the range of the residential consumption forecast, compared to historical data, and the forecasts from the Council’s 4th power plan. The medium case residential demand forecast for 2005 is 161 average megawatts lower than the 4th plan forecast for that year. The forecast growth of residential sector use of electricity is slightly less than the growth from 1986-1999 of 1.8 percent annually. The medium residential forecast remains just below the 4th plan medium case. This adjustment reflects the fact that the 4th plan slightly overforecast actual residential sales between 1995 and 2000, and that there are expected to be some longer-term effects of utility and consumer efficiency investments in response to the electricity crisis and high prices of the last couple of years. The 2005 residential demand forecast is 161 megawatts

DRAFT DRAFT DRAFT
11
lower than the 4th plan forecast for 2005, or a 2.2 percent reduction in the forecast consumption level.
Figure 5 Forecast Residential Electricity Sales Compared to 4th Plan Forecasts
4000
5000
6000
7000
8000
9000
10000
11000
12000
13000
14000
1981
1985
1989
1993
1997
2001
2005
2009
2013
2017
2021
2025
Ave
rag
e M
egaw
atts
4th Plan RangeActual5th Plan Range
5th Plan Medium
Although the near-term forecast shows a significant dip in residential consumption in 2001, the reduction in consumption is dampened significantly by making the adjustment to a “price effects” forecast in 2001. That is, the forecasts are intended to reflect what demand for electricity would be if new conservation programs are not implemented. The consumption levels before 2001 include the effects of conservation programs on electricity use, thus reducing consumption. The residential sector sales forecast is the only one affected by programmatic conservation in 2001 in the medium case of the 4th power plan. The adjustment to eliminate the savings from conservation programs increased the residential electricity use forecast by 191 average megawatts in 2005. It should be noted that the draft forecasts presented here have not been adjusted for the future effects of new building or appliance codes that have been put into effect since the 4th plan forecasts were done. These changes in minimum energy efficiency would reduce the future “price effects” forecast shown here. The analysis to make these adjustments has not been completed at this time.
Commercial Sector Commercial sector electricity consumption is forecast to grow by 1.18 percent per year between 2000 and 2025, increasing from 5,219 to 6,993 average megawatts. Figure 6 illustrates the forecast. Compared to the 4th power plan forecast of commercial electricity

DRAFT DRAFT DRAFT
12
use, the medium case has been adjusted upwards to reflect the fact that there has been a slight tendency to underforecast commercial demand since 1995. The draft forecast for 2005 is 325 average megawatts higher than the 2005 medium forecast in the Council’s 4th power plan.
Figure 6 Forecast Commercial Electricity Sales Compared to 4th Plan Forecasts
2000
3000
4000
5000
6000
7000
8000
9000
10000
11000
1981
1985
1989
1993
1997
2001
2005
2009
2013
2017
2021
2025
Ave
rag
e M
egaw
atts
4th Plan RangeActual5th Plan Range5th Plan Medium
Comments in the residential section about the effects of new building and appliance efficiency codes apply to the commercial sector as well. In the medium commercial sector forecast, there is no adjustment made for conservation programs in shifting to the medium price effects forecast in 2001. The conservation program adjustment does affect the starting point for the medium-high and high forecast in 2005. It also affects the 4th plan forecast shown in the graph. The transition from a “sales” forecast to a “price effects” forecast is apparent in the high case, the upper line in Figure 6. The near-term forecast dip in the medium case is the expected effect of recent price changes and economic recession. The growth forecast for the commercial sector is for a significantly slower growth than in the past. Between 1986 and 1999 commercial electricity use grew at 3.1 percent per year. Therefore, the forecast growth rate of 1.2 percent represents a big slowdown in commercial growth. This slowdown was present in the 4th power plan forecasts as well. But there has not been a significant underforecasting trend since the 4th plan forecast of commercial demand was done even though the region has experienced a robust growth cycle during these years. Figure 7 shows the forecast compared to actual sales for 1994 through 1999. Although the actuals for 1995 and 1999 are above and at the medium-high, respectively, the other four years are at or below the medium case forecast.

DRAFT DRAFT DRAFT
13
Figure 7
4th Plan Commercial Forecast Performance
3800
4000
4200
4400
4600
4800
5000
5200
5400
1994 1995 1996 1997 1998 1999 2000
Ave
rag
e M
egaw
atts
MHMLMediumActual
Several factors could help explain the forecast of slower growth of commercial electricity use. The underlying forecast of employment growth in the non-manufacturing sectors is significantly slower than historical growth. This alone could account for much of the decreased electricity demand growth forecast. In addition, the demand forecasting model accounts for building vintages and efficiency. As newer, more energy efficient, buildings that have been subject to building efficiency codes enter the stock and replace older buildings the electricity use per square foot of buildings will tend to decrease. Such factors may account for the decreased rate of growth of commercial electricity use, but the Council continues to evaluate the commercial forecasts to see if these forecasts might understate future commercial electricity needs. The Council would like to hear the views of utilities and the public on this issue.
Non-DSI Industrial Sector Industrial electricity demand is difficult to forecast with much confidence. Unlike the residential and commercial sectors where energy use is predominately for buildings, and therefore reasonably uniform and easily related to household growth and employment, industrial electricity use is extremely varied. Further, the use tends to be concentrated in a relatively few very large users instead of spread among many relatively uniform users. The direct service industries (DSIs) of Bonneville are treated separately in this discussion because this hand-full of plants (mainly aluminum smelters) accounts for nearly 40 percent of industrial electricity use. In addition, the future of these plants is highly uncertain. Large users in a few industrial sectors such as pulp and paper, food

DRAFT DRAFT DRAFT
14
processing, chemicals, primary metals other than aluminum, and lumber and wood products dominate the remainder of the industrial sector’s electricity use. Many of these sectors are declining or experiencing slower growth. These traditional resource based industries are becoming less important to the regional electricity demand while new industries, such as semiconductor manufacturing are growing faster. Non-DSI industrial consumption is forecast to grow at 1.58 percent annually from 2000 to 2025 (see Figure 8). Electricity consumption grows from 4,836 average megawatts in 2000 to 7,150 in 2025. The medium-high and medium-low forecasts are about 20 and 30 percent higher and lower than the medium forecast, respectively. This reflects the greater uncertainty in forecasting the industrial sector’s electricity demand. In addition, the actual industrial consumption data is becoming more difficult to obtain as some consumers gain access to electricity supplies from independent marketers instead of their local distribution utility who must report their electricity sales. The near-term forecast reflects a severe reduction of consumption in 2001 and 2002. Higher electricity prices are expected to continue to repress industrial electricity use. 2005 demand remains significantly, 1,022 average megawatts, lower than the 2005 forecast for 4th power plan.
Figure 8 Forecast Non-DSI Industrial Electricity Sales Compared to 4th Plan Forecasts
3000
4000
5000
6000
7000
8000
9000
10000
11000
12000
1981
1984
1987
1990
1993
1996
1999
2002
2005
2008
2011
2014
2017
2020
2023
Ave
rage
Meg
awat
ts
4th PlanHistory5th Plan Range5thPlan Medium
Irrigation and Other Uses Irrigation and other uses are relatively small compared to the residential, commercial and industrial sectors. Irrigation has averaged about 640 average megawatts between 1986

DRAFT DRAFT DRAFT
15
and 1999 with little trend discernable among the wide fluctuations that reflect year-to-year weather and rainfall variations. Other includes streetlights and various federal agencies that are served by Bonneville. It is relatively stable and averaged about 180 megawatts a year between 1986 and 1999. Unlike most other sectors in the draft forecast, the irrigation forecast range has been changed substantially, although due to its small size it has little effect on total demand. Analysis showed that the average irrigation use over the past 20 years was substantially lower than where the medium forecast in the 4th plan started. The 2005 consumption was lowered to 629 average megawatts in the draft forecast, compared to a 4th plan value of 700 average megawatts in that year. The forecast medium case, shown in Figure 9, includes very little growth, as has been the case for the last 10 or more years. The range considers a high case growth of 0.7 percent a year and the low case considers that irrigation electricity use could decline by 0.8 percent annually. Substantial expansion of irrigated agriculture seems unlikely given the competing uses of the oversubscribed water in the Pacific Northwest.
Figure 9 Forecast Irrigation Electricity Sales Compared to 4th Plan Forecasts
0
100
200
300
400
500
600
700
800
900
1981
1985
1989
1993
1997
2001
2005
2009
2013
2017
2021
2025
Ave
rage
Meg
awat
ts
4th Plan Range
Actual5th Plan Range
5th Plan Medium
Other electricity use did not have a range associated with its forecast in the 4th power plan. The other forecast is unchanged from the 4th plan forecast, growing at just under one percent annually.

DRAFT DRAFT DRAFT
16
Aluminum (DSIs)
Background Direct Service Industries, or DSIs, refers to a group of industrial plants that have purchased electricity supplies directly from the Bonneville Power Administration. In the past, most of these plants obtained all of their electricity needs from Bonneville. Recently, many of these plants have diversified their electricity supplies, either by choice or because of reduced allocations from Bonneville. This discussion generally addresses the total electricity requirements of these industrial consumers regardless of source. “DSIs” is often used interchangeably with aluminum smelters because aluminum smelters account for the vast bulk of this categories’ electricity consumption. If all of the region’s ten aluminum smelters were operating at capacity, they could consume about 3,150 average megawatts of electricity. Table 5 shows the smelters, their locations, their aluminum production capacity and the amount of electricity they are capable of consuming at full operation.
Table 5: Pacific Northwest Aluminum Plants Owner Plants County Capacity Electricity
Demand (M tons/yr.) (MW)
Alcoa Bellingham WA Whatcom 282 457 Alcoa Troutdale OR Multnomah 130 279 Alcoa Wenatchee WA Chelan 229 428
Glencore Vacouver WA Clark 119 228 Glencore Columbia Falls MT Flathead 163 324
Longview Aluminum Longview WA Cowlitz 210 417 Kaiser Mead WA Spokane 209 390 Kaiser Tacoma WA Pierce 71 140
Golden Northwest Goldendale WA Klickitat 166 317 Golden Northwest The Dalles OR Wasco 84 167
Total 1663 3145
Source: Metal Strategies, LLC, The Survivability of the Pacific Northwest Aluminum Smelters, Redacted Version, February, 2001.
This amount of electricity is significant in the Pacific Northwest power system. The amount of power used by these aluminum plants in full operation could account for 15 percent of total regional electricity use. When operating, the electricity use of these plants tends to be very uniform over the hours of the day and night. However, the aluminum plants have faced increasing difficulty operating consistently over the past 20 years because of increased electricity prices and aluminum market volatility.

DRAFT DRAFT DRAFT
17
Aluminum smelting in the region started during the early 1940s to help build up for the war effort and to provide a market for the hydroelectric power production in the region. Smelting capacity was expanded throughout the 1960s and 1970s. Since then no new plants have been added, although improvements to the existing plants have resulted in some increases in smelting capacity. The 10 aluminum plants in the Pacific Northwest account for a significant share of the U.S., and even the world, aluminum smelting capacity. Before the millennium, the region’s smelters accounted for 40 percent of the U.S. aluminum smelting capacity and about 6 to 7 percent of the world capacity. Their presence in the region is largely due to the historical availability of low priced electricity from the Federal Columbia River Power System. Aluminum smelting is extremely electricity intensive. Electricity accounts for about 20 percent of the total cost of producing aluminum worldwide and is therefore a critical factor in a plants’ ability to compete in world aluminum markets. With increasing electricity prices this share is now substantially larger for the region’s smelters, perhaps as much as one third of costs. Deteriorating Position of Northwest Smelters The position of the region’s aluminum smelters in the world market has been deteriorating since 1980. This is due to a combination of increased electricity prices, declining world aluminum prices and the addition of lower cost aluminum smelting capacity throughout the world. Around 1980 the cost and availability of electricity supplies to the Pacific Northwest aluminum plants began to change dramatically. At the time, Bonneville supplied all of the smelters’ electricity needs at very competitive prices. However, between 1979 and 1984 Bonneville’s electricity prices increased nearly 500 percent. This is illustrated in Figure 10, which shows Bonneville preference utility rates for electricity since 1940. The aluminum plants, along with other electricity consumers in the region, suddenly found themselves in a much less advantageous position with regard to electricity costs. As the region’s aging smelters have struggled to stay competitive in a world aluminum market, the conditions of their electricity service have also been changing. During the 1970s, the region’s electricity demand began to outgrow the capability of the hydroelectric system. The fact that aluminum smelters had no preference access to the Federal hydroelectric energy meant that their electricity supplies were threatened. The Pacific Northwest Electric Power Planning and Conservation Act of 1980 (The Act) extended the DSI access to Federal power in exchange for the DSIs covering, for a time, the cost of the residential and small farm exchange for investor-owned utility customers. In addition, the DSIs were to provide a portion of Bonneville’s reserve requirements through interruptibility provisions in their electricity service. Over the years since the Act, the DSI service conditions and rates have changed in response to changing conditions. After the dramatic electricity price increases of 1980, smelters became more vulnerable to changing aluminum market conditions. Between 1986 and 1996 Bonneville implemented electricity rates for the aluminum plants that changed with changes in aluminum prices. These rates were intended to help the aluminum plants operate through difficult aluminum market conditions, and to help

DRAFT DRAFT DRAFT
18
stabilize Bonneville’s revenues. Until 1996, aluminum plants in the region bought all of their electricity from Bonneville, with the exception of one plant that acquired part of its electricity supply from a Mid-Columbia dam. In the 1996 rate case, aluminum plants chose to reduce the amount of energy they purchased from Bonneville to about 60 percent of their demand in order to gain greater access to a (then) very attractive wholesale power market. In the 2001 rate case, Bonneville further reduced the aluminum allocation to about 45 percent of smelters’ potential demand, or about 1,425 megawatts. The aluminum smelters are now required to obtain over half of their electricity requirements in the wholesale electricity market or from other non-Bonneville sources.
Figure 10: Bonneville Power Administration Preference Rates
0
5
10
15
20
25
30
1940
1943
1946
1949
1952
1955
1958
1961
1964
1967
1970
1973
1976
1979
1982
1985
1988
1991
1994
1997
2000
Mill
s pe
r K
ilow
att-
hour
Most new world aluminum smelting capacity has been added outside of the traditional western economies, often in countries where social agendas may be driving the capacity decisions as much as aluminum market fundamentals. The disintegration of the former Soviet Union and the liberalization of trade in China have had a significant effect on the development of a world aluminum market. The addition of more capacity over time and improving aluminum smelting technology is reflected in declining aluminum price trends. Figure 11 shows aluminum prices from 1960 through 2001. Trends calculated over different time periods all show a consistent downward trend. On average, aluminum prices corrected for general inflation decreased by about 0.8 percent annually from 1960 to 2001. The downward trend is particularly pronounced from 1980 to the present.

DRAFT DRAFT DRAFT
19
Figure 11: Aluminum Price Trends
Aluminum Association 2002
Long run price trends
0
500
1000
1500
2000
2500
3000
3500
4000
19601961
196219631964
19651966
196719681969
19701971
197219731974
19751976
197719781979
19801981
198219831984
19851986
198719881989
19901991
199219931994
19951996
199719981999
20002001
LME 3 Months, 2001$
Trend (1960-2001) -exp
Trend (1981-2001) -exp
trend 1990-2001
Source: CRU International Ltd., Presentation to Aluminum Association 2002.
The steady improvement in aluminum smelting technologies over time has meant that the region’s smelters have tended to grow relatively less competitive in terms of their operating costs as new more efficient capacity has been added throughout the world. By investing in improved technology some of the region’s smelters have been able to partially offset the effects of these declining cost trends. In addition, the worsening position of the region’s aluminum smelters relative to other aluminum plants may have been partly offset by the decreasing capital costs and debt as older plants and equipment depreciate. Nevertheless, a growing share of the regional smelting capacity has become swing capacity. That is, plants could operate profitably during times of strong aluminum prices or low electricity prices, but tended to be shut down during periods of less favorable market conditions. Caught in the pincers of decreasing aluminum prices and increasing electricity prices, many of the region’s smelters have reached a critical point. Events since the spring of 2000, in both the electricity and aluminum markets, have had a dramatic effect on the region’s aluminum plants. By mid-summer of 2001, all of the region’s aluminum smelters had been shut down for normal production, either because of high electricity prices and poor aluminum market conditions or because Bonneville bought back the electricity to help meet an expected shortfall of electricity supplies and remarket the electricity at much higher market prices. The elimination of aluminum electricity load played a key role in avoiding electricity shortages in the summer of 2001 and the following winter.

DRAFT DRAFT DRAFT
20
Sharing of the savings from remarketing aluminum plants’ electricity helped ease the financial strain on aluminum companies and their employees of a long shut down. During 2002 electricity prices in the wholesale market fell to low levels, but aluminum prices remained very low and only a few smelters found it desirable to partially return to production. In addition, Bonneville’s rates have remained high. There does not appear to be much optimism for a quick recovery of aluminum prices. Some analysts expect the Global aluminum market to remain in surplus until 2005. Currently, two of the regions smelters have closed permanently, two more are in bankruptcy proceedings, and others are in dire financial straights. During 2002 aluminum plants on average only consumed 393 average megawatts of electricity. Increases in energy and electricity prices during 2003 have worsened the conditions for aluminum smelters and the three plants that had partially reopened have recently announced plans to cut back or suspend operations. With aluminum market recovery uncertain, and with expected future electricity prices too high for most aluminum plants to operate profitability, future aluminum electricity use is expected to be much lower than in previous Council plans. The ability of aluminum plants to operate depends critically on the level of electricity prices. With the medium natural gas price assumptions, the Council currently forecasts spot market electricity prices to move up to the $40 per megawatt-hour range (see Figure 12). Few, if any, of the region’s smelters would be able to operate with electricity prices at that level. It is unclear how much of the aluminum load Bonneville might serve in the future, but Bonneville’s future electricity prices may also be higher than aluminum plants can afford except when aluminum prices are especially high.

DRAFT DRAFT DRAFT
21
Figure 12: Draft Medium Case Wholesale Price Forecasts for Mid-Columbia Electricity
0
5
10
15
20
25
30
35
40
45
50
2001
2002
2003
2004
2005
2006
2007
2008
2009
2010
2011
2012
2013
2014
2015
2016
2017
2018
2019
2020
2021
2022
2023
2024
2025
2000
$ P
er M
egaw
att-
Ho
ur
A Simple Model of Aluminum Electricity Demand A simple model of Pacific Northwest aluminum plants was developed to relate the likelihood of existing aluminum plants operating to different levels of aluminum prices and electricity prices. Given an aluminum price, the model estimates what each aluminum plant in the northwest could afford to pay for electricity given its other costs. Then for a given electricity price, the electricity demand of the plants that can afford to operate make up the aluminum electricity demand in the region. Basic data for the model came from the July 2000 study cited as the source for Table 5, advice from the Council’s Demand Forecasting Advisory Committee, and comments on a draft aluminum forecast paper.5 Figure 13 illustrates the relative competitiveness of the eight remaining Northwest aluminum plants as represented in the model. (It is assumed that the other two smelters in Troutdale, Oregon and Tacoma, Washington are permanently closed.) Figure 13 shows the amount that each plant could afford to pay for electricity given an assumed aluminum price of $1500 per tonne (about 67 cents a pound), which is about the average aluminum price over the past several years.
5 “Forecasting Electricity Demand of the Region’s Aluminum Plants”. Northwest Power Planning Council document 2002-20. December, 2002.

DRAFT DRAFT DRAFT
22
Figure 13: Affordable Electricity Price Limits of PNW Aluminum Smelters
At $1500 Per Tonne Aluminum Prices
0.00
5.00
10.00
15.00
20.00
25.00
30.00
35.00
40.00
Smelter1
Smelter2
Smelter3
Smelter4
Smelter5
Smelter6
Smelter7
Smelter8
$/M
wh
Electricity prices needed to operate smelters assuming a $1500 aluminum price.
One aluminum plant in the region is very efficient and likely to operate under a wide range of electricity and aluminum prices. Three other smelters could pay around $25 a megawatt-hour for electricity if aluminum prices were $1500 a tonne, which is higher than aluminum prices have been in several months. The other smelters could only afford to operate at electricity prices near $20 per megawatt-hour. There are some important limitations to this simple model. It is intended to represent whether aluminum plants would be willing to operate for an intermediate time period. The costs used in the model include an amount above the pure short-term operating costs to allow sufficient ongoing capital investments to maintain the plants capability to produce. But the costs do not include sufficient returns on capital to justify the long-term operation of the plant. Thus, the model does not address the question of when a plant would be likely to be permanently closed. In order to remain in operation, a plant would have to be able to recover sufficient funds during periods of high aluminum prices and low electricity prices to recover an adequate return on investment. However, as plants depreciate, or as they are sold at discounted prices, capital recovery becomes a smaller part of the decision, and strategic positioning in global markets may enable some plants to remain available for operation when conditions are attractive enough. The implicit assumption in the model is that, if a plant can operate for the intermediate term under expected electricity and aluminum prices, then it will be able to recover sufficient returns during favorable cyclical market conditions to survive in the long term.

DRAFT DRAFT DRAFT
23
The model does not address the dynamics of temporary closures of aluminum plants or their return to operation. The dynamics of aluminum smelter operations are important considerations for assessing their potential value as demand-side reserves. The potential demand-side reserves that might be provided by aluminum plants include; very short-duration interruptions for system stability purposes, interruptions of up to four hours during extreme peak electricity price spikes, and long-term shut downs of several months to a year or more to address periods of poor hydroelectric conditions or other periods of significant generation capacity shortages. These issues will be addressed outside of the simple aluminum model described here. In the Council’s portfolio risk model, aluminum plant closure, reserves, and reopening conditions are related to uncertain variations in electricity and aluminum prices. This will be discussed in more detail later. Model Results By varying the aluminum and electricity prices over a range of possible values, the simple model can be used to simulate expected aluminum electricity demands under varying conditions. Aluminum prices were varied between $1050 and $2250 per tonne in $100 increments. For each aluminum price, electricity prices were varied between $20 and $40 per megawatt-hour. This generated 91 different estimates of aluminum plant electricity demand under the varying aluminum and electricity combinations. Figure 14 shows the results of this exercise. A couple of bracketing points are evident. First, at aluminum prices below $1150 per tonne, none of the Northwest aluminum plants can operate profitably at any electricity price between $20 and $40 per megawatt-hour. Aluminum prices have seldom been below $1200 a ton (in 2002 prices) in the past 20 years. On the other extreme, all eight smelters could operate at aluminum prices above $2050 per tonne for electricity prices up to $40 per megawatt-hour. If past trends in aluminum prices continue, aluminum prices might decline at about 1 percent a year. That would mean that average aluminum prices might average less than $1500 over the next 20 years. Of course there will be considerable volatility around that trend. At this point in the Council’s planning process, we do not have a range of future electricity prices that match the range of natural gas prices we are assuming for our analysis. Preliminary analysis with the medium natural gas price forecast shows that wholesale electricity prices under medium assumptions (see Figure 12) could be around $40 per megawatt-hour over the long term. In those ranges of electricity and aluminum prices, it is unlikely that more than two aluminum plants could operate, and electricity demand by aluminum smelters in the region would be less than 900 megawatts. The results in Figure 14 include an assumption that one smelter will continue to have access to low cost mid-Columbia dam power for part of its electricity demand. Access to some lower cost supplies of electricity from Bonneville or other sources and further investments in smelter efficiency may improve the ability of some smelters to stay in operation. The simple aluminum model was used to see what effect an offer of 100 megawatts of electricity priced at $28 per megawatt-hour would have on smelter

DRAFT DRAFT DRAFT
24
operations. Assuming an availability of such electricity supplies changes the model results for the 91 combinations of aluminum and electricity prices.
Figure 14: Spectrum of Potential Aluminum Smelter Electricity Demands
0
500
1000
1500
2000
2500
3000
1050 1150 1250 1350 1450 1550 1650 1750 1850 1950 2050
Aluminum Price ($/Tonne)
Ele
ctri
city
Use
(Mw
a) 2025283032
3540
$/Mwh
In order to more easily illustrate these effects, an expected value of electricity demand was calculated for each assumed electricity market price. This was done by weighting electricity demand simulated at different aluminum prices by the percent of days in the last ten years that actual aluminum prices fell into that range. Another way of characterizing an individual bar in Figure 15 is that it is a weighted average of the electricity use in an individual line from Figure 14. Using just market electricity prices and the one mid-Columbia supply contract, expected smelter electricity demands ranged from 783 megawatts at $40 per megawatt-hour electricity prices to 2,138 megawatts at $20 electricity prices. This is shown in the left-most bar for each electricity price group in Figure 15. If smelters could arrange to purchase 100 megawatts of power priced at $28 per megawatt-hour, it is estimated to have a relatively small effect on expected aluminum operations (See the middle bars in Figure 15). At market prices below $28 the expected electricity demand of aluminum smelters is actually reduced by the higher priced power supply. If market power prices were $40, the availability of 100 MW of power at $28 per megawatt-hour is estimated to increase the expected value of aluminum smelters’ electricity demand of from 783 to 875 megawatts, a relatively small effect. If smelters could arrange a block of power at $20 (illustrated by the right-most bars in Figure 15) the estimated increase in electricity demand at the $40 market price would be 314 megawatts. That increase is roughly the electricity demand of one additional smelter.

DRAFT DRAFT DRAFT
25
Figure 15: Expected Aluminum Plant Electricity Demand (Effect of Special Electricity Supplies)
0
500
1000
1500
2000
2500
20 25 28 30 32 35 40
Market Electricity Price ($/MWh)
Exp
ecte
d d
eman
d (M
W)
Market Price100MW of Power @$28100MW of Power @$20
The analysis above addresses the question of whether the existing smelters in the region are likely to operate under different aluminum and electricity market conditions. It does not address the likelihood of permanent closure. Historically, older and less efficient smelters are not frequently closed permanently. Their depreciated capital costs allow them to operate when electricity and aluminum prices are attractive. They may provide an inexpensive option for aluminum supplies in tight aluminum markets. In addition, permanent closure may involve expensive site clean up. The result is that the region might retain a large, but uncertain, electricity demand. If such a demand is required to be served when they need electricity, it can be very costly for their electricity supplier to maintain generating capacity to serve the potential demand. If serving the demand is optional, however, through either interruption agreements or the smelters purchasing available power in the market, it can have attractive features that may reduce electricity price volatility. The future of aluminum operations in the region may depend on the ability of aluminum plants to find, and get value for, their potential for complementing the power system in a competitive wholesale market. Mid-Term Aluminum Demand Assumption The Council is required to include in its power plans a 20-year forecast of demand. The Council is also increasing its focus on the nearer term for purposes of reliability and adequacy analysis. For these purposes, a specific forecast of total electricity demand is useful. And for that, specific assumptions about DSI demands are needed. This section presents such a best guess forecast, but it is important to keep the extreme uncertainty regarding this assumption in mind when evaluating reliability, adequacy, or long-term resource strategies.

DRAFT DRAFT DRAFT
26
Figure 16 shows the assumed mid-term pattern of aluminum electricity demand through 2005 compared to the Council’s assumption for the 4th power plan. In the current forecast, electricity demand is assumed to recover to about 1,000 megawatts by 2005. This would be consistent with two aluminum smelters operating plus 60 average megawatts of non-aluminum DSI demand. If the aluminum model is reasonably accurate, and if electricity can be acquired for $30 to $35 per megawatt-hour, this implies that aluminum prices would have to recover to $1,450 to $1,550 per tonne by 2005. The higher end of that range is similar to average aluminum prices during the past 10 years, but given recent trends and events in world aluminum markets, should be viewed as a reasonably optimistic assumption for the region’s aluminum plants in the future. The forecast is significantly more pessimistic about aluminum plants’ ability to operate than the Council’s 4th power plan. This is consistent with a prolonged period of low aluminum prices during 2001 through 2004, with higher forecasts of electricity prices. It also is more pessimistic about the ability of some smelters to survive a prolonged period of high electricity prices, poor aluminum prices, and uncertainty about electricity markets and contracts.
Figure 16: Medium Case Assumptions for Aluminum Demand Recovery to 2005 (Comparison to 4th Plan Assumptions)
0
500
1000
1500
2000
2500
3000
3500
Jan-0
2Apr-
02Ju
l-02
Oct-02
Jan-0
3Apr-
03Ju
l-03
Oct-03
Jan-0
4Apr-
04Ju
l-04
Oct-04
Jan-0
5
Apr-05
Jul-0
5Oct-
05
Meg
awat
ts
4th Plan
5th Plan Medium Term
The 5th plan expectation for aluminum recovery is also significantly more pessimistic than the Council’s assumption in the summer of 2001 forecast. That forecast assumed that there would be a reasonably rapid economic recovery, with a concurrent recovery in aluminum prices and a significant lessening of electricity prices as the effects of the
DRAFT DRAFT DRAFT
27
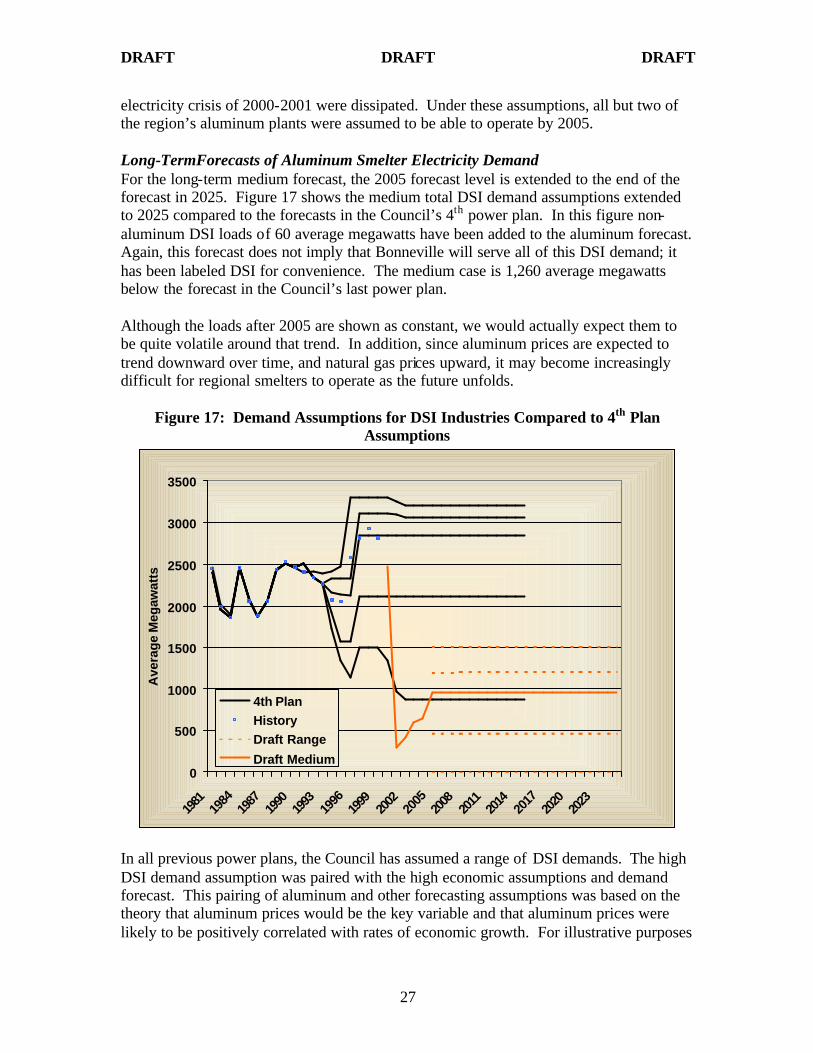
electricity crisis of 2000-2001 were dissipated. Under these assumptions, all but two of the region’s aluminum plants were assumed to be able to operate by 2005. Long-TermForecasts of Aluminum Smelter Electricity Demand For the long-term medium forecast, the 2005 forecast level is extended to the end of the forecast in 2025. Figure 17 shows the medium total DSI demand assumptions extended to 2025 compared to the forecasts in the Council’s 4th power plan. In this figure non-aluminum DSI loads of 60 average megawatts have been added to the aluminum forecast. Again, this forecast does not imply that Bonneville will serve all of this DSI demand; it has been labeled DSI for convenience. The medium case is 1,260 average megawatts below the forecast in the Council’s last power plan. Although the loads after 2005 are shown as constant, we would actually expect them to be quite volatile around that trend. In addition, since aluminum prices are expected to trend downward over time, and natural gas prices upward, it may become increasingly difficult for regional smelters to operate as the future unfolds.
Figure 17: Demand Assumptions for DSI Industries Compared to 4th Plan Assumptions
0
500
1000
1500
2000
2500
3000
3500
1981
1984
1987
1990
1993
1996
1999
2002
2005
2008
2011
2014
2017
2020
2023
Ave
rag
e M
egaw
atts
4th PlanHistoryDraft Range
Draft Medium
In all previous power plans, the Council has assumed a range of DSI demands. The high DSI demand assumption was paired with the high economic assumptions and demand forecast. This pairing of aluminum and other forecasting assumptions was based on the theory that aluminum prices would be the key variable and that aluminum prices were likely to be positively correlated with rates of economic growth. For illustrative purposes

DRAFT DRAFT DRAFT
28
a similar approach has been used to develop a range of aluminum demand assumptions. Figure 18 shows the aluminum demand assumptions included in each forecast case for the Council’s 4th power plan compared to the outlook now. Only in the low forecast of the 4th power plan was there a large reduction of aluminum demand. It was assumed that Bonneville or other relatively affordable power would be available to the aluminum plants. Thus most of the plants were assumed to remain competitive, or at least operate as swing plants, in the medium case. Now the expectation is that only between zero and four of the region’s smelters could survive to operate at significant capacity factors. The expectation of higher electricity prices and rapid expansion of aluminum smelting capacity in China and other areas have changed the outlook for the region’s smelters substantially. Aluminum prices are still important, but the cost of electricity has become a critical element for Northwest smelters. Since electricity prices are related to natural gas prices in the long-term, and high natural gas prices are associated with the high economic growth case, it is also reasonable to expect that lower aluminum demand could be associated with the higher economic growth cases. However, if high aluminum prices are still associated with higher economic growth, then it is possible that the high economic growth cases will favor aluminum plant operation given that electricity prices are not too high. In short, it is not clear how aluminum demand will be related to the economic growth conditions.
Figure 18: Aluminum Electricity Demand Assumptions for 2005-2025 Compared to the Council’s 4th Power Plan
0
500
1000
1500
2000
2500
3000
3500
Low Medlo Medium Medhi High
Ave
rag
e M
egaw
atts
4th Plan5th Plan
The proposed solution to this dilemma is to forecast aluminum electricity demand separately from other demands for electricity. Since aluminum demands are very

DRAFT DRAFT DRAFT
29
significant in determining future electricity demands of the region, they are an important source of uncertainty that should be modeled and addressed directly in the Council’s resource planning process. Therefore, the Council is modeling aluminum industry demands explicitly in its portfolio model. To that end, a simple model of the relationship between aluminum electricity demand and electricity and aluminum prices was developed. Aluminum Demand in the Portfolio Analysis In developing the 5th power plan, the Council is modeling aluminum plants as uncertain loads that depend on aluminum prices and electricity prices. This will be done in the Council’s portfolio analysis model. As it simulates alternative futures, the portfolio model randomly selects different electricity prices and aluminum prices. These conditions will be used to estimate the aluminum plants’ demand for electricity. The relationship between the aluminum plants’ electricity demand and electricity and aluminum prices is derived from the results of aluminum model simulations similar to those illustrated in Figure 14. However, the simulations contained in the portfolio model take into account, in addition to the basic cost information for each plant, assumptions about cost of shutting down and restarting plants and minimum down time and up time. For example, it is assumed that the decision to restart a plant would include the startup costs and that, if a plant were to reopen, it would remain open for at least 6 months. Similarly, a plant may not close immediately when current prices make it unprofitable, and once it does close it would likely remain closed for a period of at least 6 months. The portfolio model goes beyond these calculations to consider the value of an aluminum plant interruption option to Bonneville or the regional power system.
New Dimensions of Council Demand Forecasting Changing electricity markets are changing the planning requirements for the region. Electricity prices in the Pacific Northwest are related directly to demand and supply conditions, not just in the region, but also in the entire interconnected western United States. In addition, electricity markets have been, and are expected to remain, volatile. Shortages and high prices will occur at specific times of the year and day depending on electricity demand, but can be prolonged in cases of poor hydroelectric conditions, such as occurred in 2001. Evaluating electricity markets requires assumptions about demand growth in the entire west and some understanding of how the demand will vary across different seasons and across hours of the day. The sections below describe the simple approaches used to develop assumptions about future patterns of electricity consumption and predicted growth in demand throughout the rest of the west.
Patterns of Regional Electricity Consumption One approach to forecasting temporal patterns of demand is to use the monthly and hourly patterns from the 4th power plan. In the 4th power plan, the Council used an extremely detailed hourly electricity demand forecasting model to estimate hourly demand patterns in the future. We have not run that model for this forecast, but the

DRAFT DRAFT DRAFT
30
hourly patterns would remain similar. Another approach would be to use historical patterns of demand. In practice, these approaches would not result in significantly different monthly patterns of consumption. Whatever typical monthly shape is used, specific months can depart from the normal pattern depending on weather. Variability in consumption patterns due to weather events will be considered in the portfolio planning model that addresses mitigation of risk and uncertainty in electricity markets. Typical monthly patterns provide a starting point for that analysis. The same is true for the peak demand forecast and the typical hourly patterns of demand.
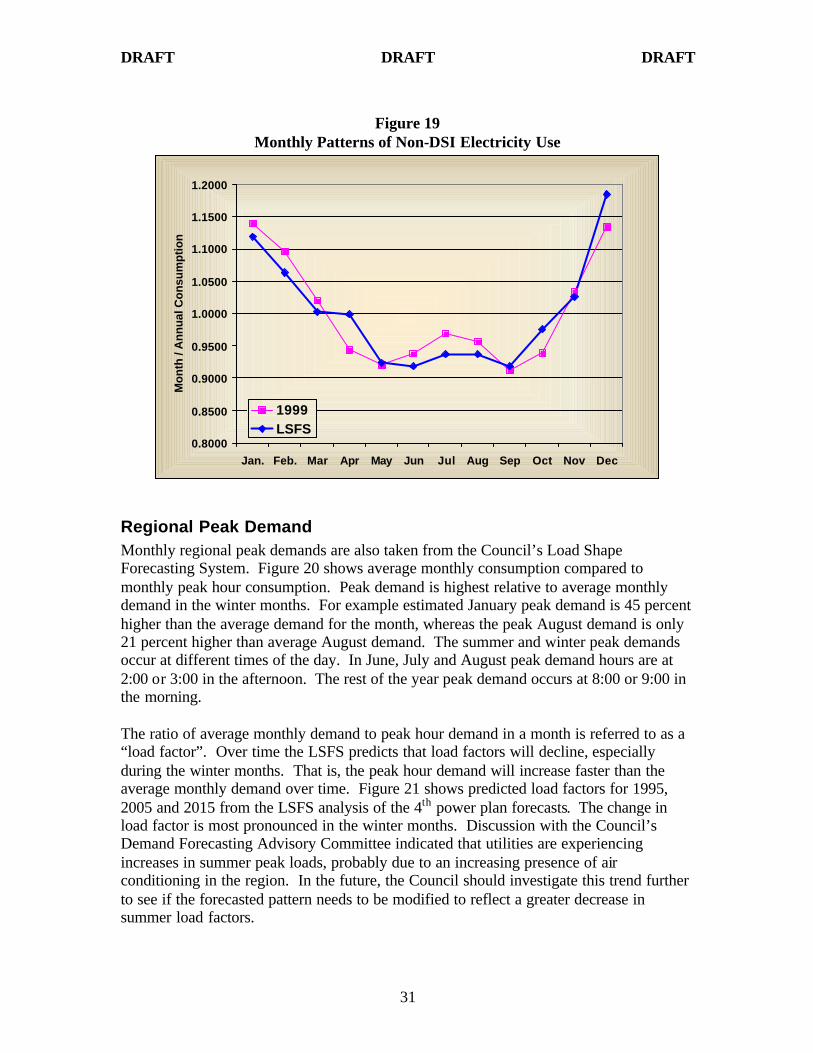
Monthly Patterns of Regional Demand Figure 19 compares monthly patterns of regional demand in 1999 with patterns from the Council’s Load Shape Forecasting System (LSFS) from the 4th power plan simulation for 1995. The points on this graph indicate the monthly consumption of electricity compared to the annual average. These patterns have been adjusted to reflect only non-DSI demand. DSI demands, dominated by aluminum plants, tend to be seasonally flat. The monthly patterns of both the actual and modeled demand reflect the higher electricity consumption in the winter with a secondary and smaller increase during the summer. Within that general pattern, there appear variations in specific months. The LSFS was based on a year in which there was a severe cold event in December. A particular year was chosen to design the model rather than an average over several years to preserve the variability in the load patterns. Averaging would have tended to flatten the hourly variation masking some of the potential volatility. For purposes of this forecast, the 1999 pattern is used. Table 6 shows the monthly demand shape in numerical terms.
Table 6
Monthly Non-DSI Electricity Consumption Pattern Month Shape Factor January 1.140 February 1.097 March 1.020 April 0.943 May 0.921 June 0.938 July 0.969 August 0.957 September 0.911 October 0.940 November 1.033 December 1.185
DRAFT DRAFT DRAFT
31
Figure 19
Monthly Patterns of Non-DSI Electricity Use
0.8000
0.8500
0.9000
0.9500
1.0000
1.0500
1.1000
1.1500
1.2000
Jan. Feb. Mar Apr May Jun Jul Aug Sep Oct Nov Dec
Mo
nth
/ A
nn
ual
Co
nsu
mp
tio
n
1999LSFS
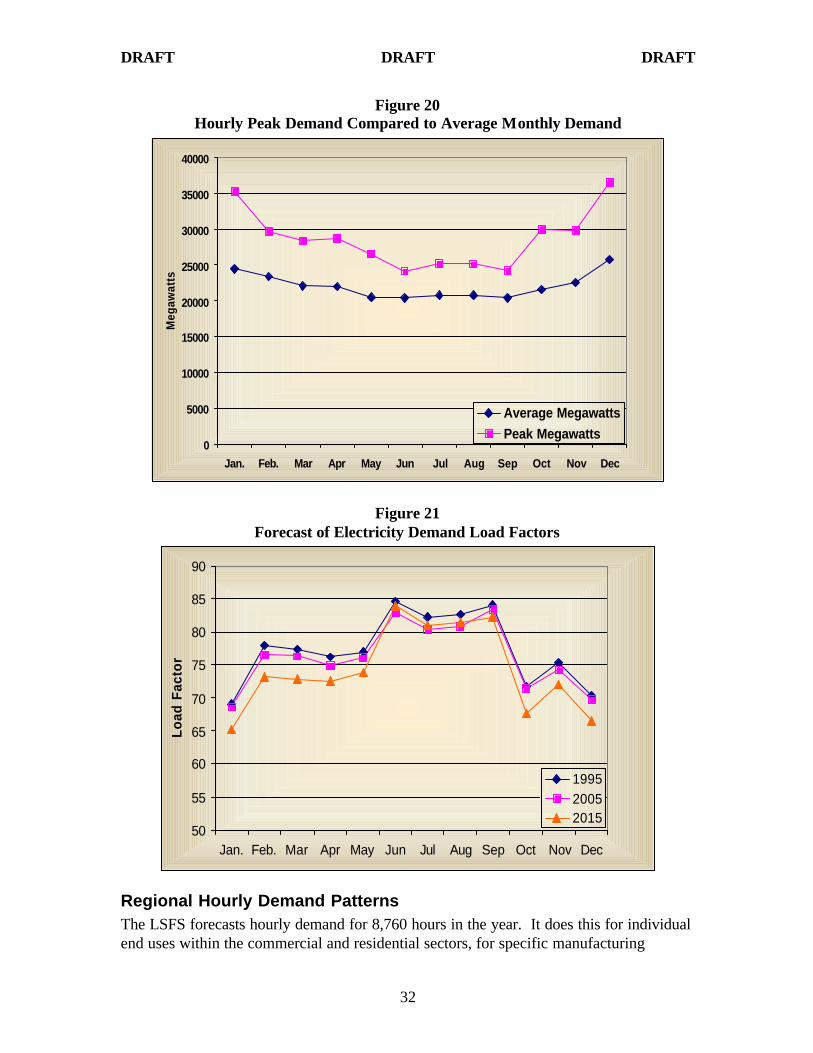
Regional Peak Demand Monthly regional peak demands are also taken from the Council’s Load Shape Forecasting System. Figure 20 shows average monthly consumption compared to monthly peak hour consumption. Peak demand is highest relative to average monthly demand in the winter months. For example estimated January peak demand is 45 percent higher than the average demand for the month, whereas the peak August demand is only 21 percent higher than average August demand. The summer and winter peak demands occur at different times of the day. In June, July and August peak demand hours are at 2:00 or 3:00 in the afternoon. The rest of the year peak demand occurs at 8:00 or 9:00 in the morning. The ratio of average monthly demand to peak hour demand in a month is referred to as a “load factor”. Over time the LSFS predicts that load factors will decline, especially during the winter months. That is, the peak hour demand will increase faster than the average monthly demand over time. Figure 21 shows predicted load factors for 1995, 2005 and 2015 from the LSFS analysis of the 4th power plan forecasts. The change in load factor is most pronounced in the winter months. Discussion with the Council’s Demand Forecasting Advisory Committee indicated that utilities are experiencing increases in summer peak loads, probably due to an increasing presence of air conditioning in the region. In the future, the Council should investigate this trend further to see if the forecasted pattern needs to be modified to reflect a greater decrease in summer load factors.
DRAFT DRAFT DRAFT
32
Figure 20 Hourly Peak Demand Compared to Average Monthly Demand
0
5000
10000
15000
20000
25000
30000
35000
40000
Jan. Feb. Mar Apr May Jun Jul Aug Sep Oct Nov Dec
Meg
awat
ts
Average MegawattsPeak Megawatts
Figure 21 Forecast of Electricity Demand Load Factors
50
55
60
65
70
75
80
85
90
Jan. Feb. Mar Apr May Jun Jul Aug Sep Oct Nov Dec
Load
Fac
tor
199520052015
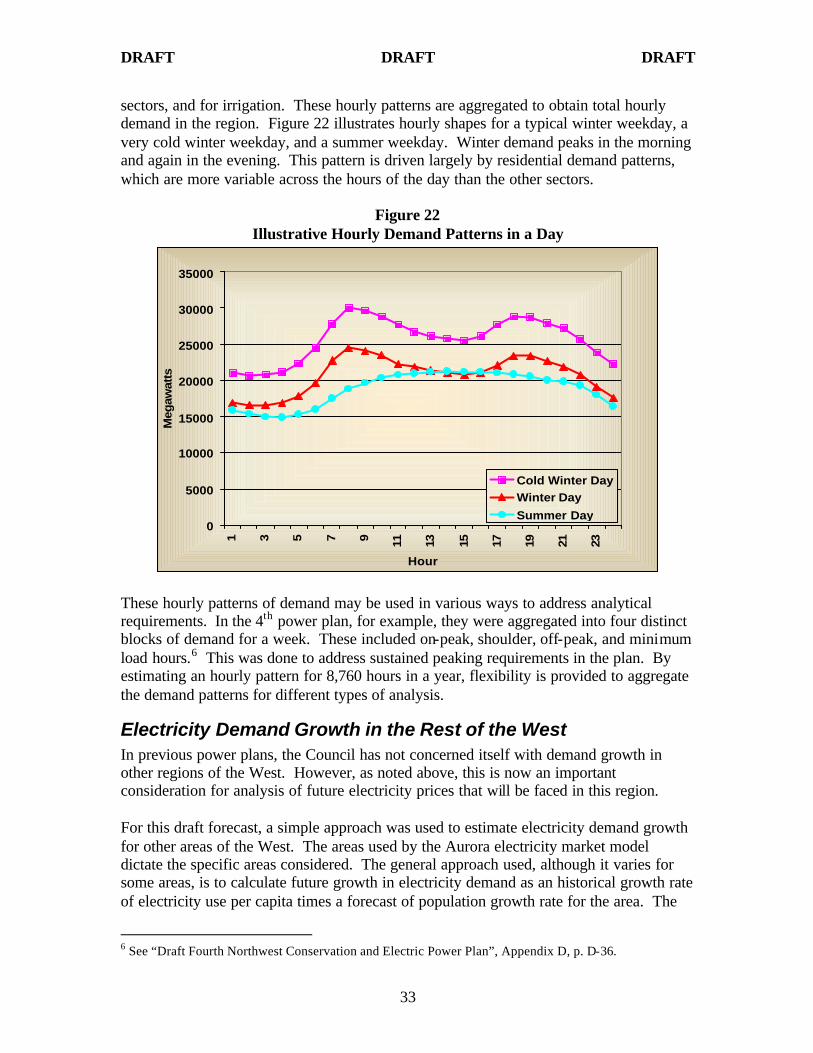
Regional Hourly Demand Patterns The LSFS forecasts hourly demand for 8,760 hours in the year. It does this for individual end uses within the commercial and residential sectors, for specific manufacturing
DRAFT DRAFT DRAFT
33
sectors, and for irrigation. These hourly patterns are aggregated to obtain total hourly demand in the region. Figure 22 illustrates hourly shapes for a typical winter weekday, a very cold winter weekday, and a summer weekday. Winter demand peaks in the morning and again in the evening. This pattern is driven largely by residential demand patterns, which are more variable across the hours of the day than the other sectors.
Figure 22 Illustrative Hourly Demand Patterns in a Day
0
5000
10000
15000
20000
25000
30000
35000
1 3 5 7 9 11 13 15 17 19 21 23
Hour
Meg
awat
ts
Cold Winter DayWinter Day
Summer Day
These hourly patterns of demand may be used in various ways to address analytical requirements. In the 4th power plan, for example, they were aggregated into four distinct blocks of demand for a week. These included on-peak, shoulder, off-peak, and minimum load hours.6 This was done to address sustained peaking requirements in the plan. By estimating an hourly pattern for 8,760 hours in a year, flexibility is provided to aggregate the demand patterns for different types of analysis.
Electricity Demand Growth in the Rest of the West In previous power plans, the Council has not concerned itself with demand growth in other regions of the West. However, as noted above, this is now an important consideration for analysis of future electricity prices that will be faced in this region. For this draft forecast, a simple approach was used to estimate electricity demand growth for other areas of the West. The areas used by the Aurora electricity market model dictate the specific areas considered. The general approach used, although it varies for some areas, is to calculate future growth in electricity demand as an historical growth rate of electricity use per capita times a forecast of population growth rate for the area. The
6 See “Draft Fourth Northwest Conservation and Electric Power Plan”, Appendix D, p. D-36.

DRAFT DRAFT DRAFT
34
exceptions to this method were California where forecasts by the California Energy Commission were used, the Pacific Northwest as discussed below, and the Canadian provinces where electricity demand forecasts were directly available from the National Energy Board. Population forecasts for states are available from the U.S. Census Bureau web site. However, the Census forecasts were replaced by more recent state forecasts when they could be identified. For example, Nevada population forecasts were taken from the Nevada Department of Water Resources. There were two reasons for this. First, the Aurora model distinguishes between northern and southern Nevada and Census forecasts were only available at the state level. Second, the Census Bureau forecast showed Nevada population growing at only .85 percent a year, whereas Nevada has recently been the fastest growing state in the nation with population growth in the neighborhood of 5 percent a year. Other population forecast sources used were the Colorado Department of Labor Affairs, the Arizona Department of Economic Security, Pacificorp’s Integrated Resource Plan for Utah, and the Wyoming Department of Administration and Information. Electricity consumption per capita varies substantially among the states in the West, as have their patterns of change over time. Figure 23 shows electricity use per capita for western states from 1960 to 1999. The most spectacular change is for Wyoming, which started out in 1960 with the lowest use per capita and grew to substantially higher than any other state. This may reflect significant heavy industrial growth in electricity intensive, but low employment, plants; for example, oil and natural gas production. The Pacific Northwest states are the highest per capita users of electricity reflecting a past of very low electricity prices and a heavy presence of aluminum smelters. California is the lowest user of electricity per capita, followed by New Mexico, Utah and Colorado, which are all very similar to one another. Nevada and Arizona fall between these three states and the Pacific Northwest states. The general pattern is substantial growth in electricity use per capita until about 1980. After 1980, most states’ electricity use per capita levels off or actually declines. Exceptions to this pattern are Colorado, New Mexico, Arizona, and Utah where use per capita has slowed, but continued growing. The Pacific Northwest was a special case. In Aurora, the Pacific Northwest is divided into four areas; western Oregon and Washington (west of the Cascade Mountains), eastern Oregon and Washington combined with northern Idaho, southern Idaho, and Montana. The sum of these area forecasts should be consistent with the 20-year regional forecast discussed earlier. One approach would have been to share the regional demand forecast to areas based on historical shares. However, in order to recognize that areas within the Pacific Northwest have not grown uniformly, the forecast area growth rates were modified to reflect historical relative population growth in the four areas while maintaining consistency with the total regional population growth.

DRAFT DRAFT DRAFT
35
Table 7 shows the forecast growth rates for the Aurora demand areas. They are average annual growth rates from 2000 to 2025.
Figure 23 State Electricity Use Per Capita: 1960 to 1999
0.000
5.000
10.000
15.000
20.000
25.000
30.000
1960
1962
1964
1966
1968
1970
1972
1974
1976
1978
1980
1982
1984
1986
1988
1990
1992
1994
1996
1998
MW
hr
Per
Per
son
Colorado
California
Nevada
Arizona
New Mexico
Utah
Wyoming
Washington
Oregon
Idaho
Montana
Table 7 Forecast Electricity Demand Growth Rates for Western Demand Areas
Area Annual Growth Rate PNW Western OR+WA 1.06 PNW Eastern OR+WA and Northern ID 0.42 PNW Southern ID 1.50 PNW MT 0.63 Northern CA 1.51 Southern CA 1.62 Northern NV 2.12 Southern NV 2.72 WY 0.62 UT 2.80 CO 2.34 NM 3.05 AZ 2.47 Alberta 1.59 British Columbia 1.39

DRAFT DRAFT DRAFT
36
Future Forecasting Methods At the time the Council was formed, growth in electricity demand was considered the key issue for planning. The region was beginning to see some slowing of the historically rapid growth of electricity use, and the future of several proposed nuclear and coal generating plants was thereby put in question. It was important for the Council’s Demand Forecasting System (DFS) to be able to determine the causes of changing demand growth and the extent and composition of future demand trends. Simple historical trends were no longer reliable. In addition, the requirement of the Northwest Power Act for a balanced consideration of both conservation and new generation placed another requirement on the Demand Forecasting System; it needed to support the detailed evaluation of improved efficiency opportunities and their effects on electricity demand. These analytical requirements necessitated an extremely detailed approach to demand forecasting. Rather than identifying trends in aggregate or sectoral electricity consumption and their determinants, the Council developed a forecasting system that built demand forecasts up from the end-use details of each consuming sector (residential, commercial, industrial). Forecasting with these models required detailed economic forecasts for all of the sectors that are represented separately in the demand models. The models also required forecasts of demographic trends, electricity prices and fuel prices. Before the last power plan update a significant new component was added to the demand forecasting system. As Western electricity systems became more integrated through deregulated wholesale markets, and as capacity issues began to arise in the region, it became clear that we needed to understand the patterns of electricity demand over seasons, months and hours of the day. Therefore the Load Shape Forecasting System (LSFS) was developed. This model builds up the hourly shape of demand based on the underlying hourly shapes of electricity use by the different types of end-use equipment. It contains about the same detail as the Demand Forecasting System, but when multiplied by 8,760 hours per year, a one year forecast can contain 400 million values. The detailed approaches of the DFS and LSFS are expensive and time consuming. Major efforts are involved in collecting detailed end-use data, building the models, and maintaining and operating the systems. Neither the current planning issues, nor the available data and resources seem to support the continued use of the old demand forecasting approach. The Council developed an issue paper on forecasting methods in May 2001 to explore alternative approaches.7 It was agreed that it was not possible for the Council to employ the forecasting models for the 5th power plan. However, there was little consensus among commenters in the region about what changes should be made to the forecasting system for future Council planning. The basic priorities for a demand forecast have changed. Although the Northwest Power Act still requires a 20-year forecast of demand, there are few decisions that need to be made today to meet growing electricity demands beyond the next five years. The lead-
7 Northwest Power Planning Council. “Council Demand Forecasting Issues”. May 2001, Council document number 2001-13. [http://www.nwcouncil.org/library/2001/2001-13.htm]

DRAFT DRAFT DRAFT
37
time required to put new generating resources in place has been reduced substantially from the large scale nuclear and coal plants that appeared to be desirable in the early 1980s. In addition, the restructuring of the wholesale electricity markets to rely more on competitively developed supplies means that there is a less clear role for the Council’s planning of the type and timing of new resources to be acquired. The focus of the Council’s power activity has shifted to the evaluation of the performance of more competitive power markets and how to acquire conservation in the new market. The Council also has been concerned about the likelihood of competitive wholesale power markets providing adequate and reliable power supplies, which has three implications for demand forecasting. First, the focus is much shorter term. Adequacy and reliability depend generating resources, including water conditions and their effects of hydroelectric generation, compared to loads. The question that has faced the region recently has been whether there is adequate capacity and energy to meet the coming winter demand. Second, the region is no longer independent of the entire Western U.S. electricity market. Electricity prices and adequacy of supply are now determined by West-wide electricity conditions. The Aurora electricity market model that the Council is using requires assumptions about demand growth for all areas of the western integrated electricity grid. Third, the temporal patterns of demand and peak demands matter more. The region is becoming more likely to be constrained by sustained peaking capability than average annual energy supplies, as it was in the past. Further, the rest of the West has always been capacity constrained and thus peak prices throughout the West can be expected during peak demand periods. Thus, for purposes of demand forecasting, the requirements of the forecast are shifting to shorter term, temporal patterns, and expanded geographic areas. This implies that a different type of demand forecasting system may be useful for future Council planning. However, there remains the question of estimated potential efficiency gains in the use of electricity. To assess cost-effective conservation potential the end-use detail of the old forecasting models would still be useful. But even if the Council still had the resources to use the old forecasting models, the detailed data necessary to update the models does not exist. Finding new ways of assessing conservation potent ial, or of encouraging its adoption without explicit estimates of the amount likely to be saved is a significant issue for regional planning. The forecasts presented in this paper are based on an extension of the previous Council plan and relatively simple approaches to expanding the geographic and temporal dimensions of the forecast. The Council needs to invest in new forecasting approaches for future power plans. One of the action items for this plan is for the Council to develop a new forecasting system that is better oriented to the available Council resources, to the current planning issues, and to the available data regarding electricity consumption and its driving variables. The Council welcomes suggested approaches and advice in this area. ________________________________________ q:\tm\ww\2001powerplan\demand forecast5_03.doc