reviews educational research and
TRANSCRIPT

Educational Research and
Reviews
Volume 11 Number 14 23 July, 2016
ISSN 1990-3839

ABOUT ERR
Educational Research and Reviews (ISSN 1990-3839) is published bi-monthly (one volume per year) by Academic Journals. Educational Research and Reviews (ERR) is an open access journal that publishes high-quality solicited and unsolicited articles, in English, in all areas of education including education policies and management such as Educational experiences and mental health, the effect of land tenure system on resource management, Visualization skills and their incorporation into school curriculum, Gender, education and child labour etc. All articles published in ERR are peer-reviewed.
Contact Us
Editorial Office: [email protected]
Help Desk: [email protected]
Website: http://www.academicjournals.org/journal/ERR
Submit manuscript online http://ms.academicjournals.me/.

Editors
Dr. Peter W. Wong Southern Cross University Australia.
Associate Editors
Dr. Melissa Vick School Of Education James Cook University Townsville, Australia. Dr. Maniam Kaliannan Faculty of Adminstrative Science & Policy Studies Universiti Teknologi MARA (UiTM) Selangor, Malaysia. Dr. Tavis D. Jules Cultural and Educational Policy Studies School of Education Loyola University Chicago Chicago, USA. Dr. Adams Onuka Centre for Peace and conflict Studies (CEPACS) University of Ibadan Nigeria. Dr. Yambo John M. Onyango University of Eastern Africa Kamagambo Adventist College Campus Baraton, Kenya. Dr. Tolga Gök Torbali Vocational School of Higher Education Dokuz Eylul University Izmir, Turkey.
Assoc. Prof. Manjula Vithanapathirana Faculty of Education University of Colombo Colombo, Sri Lanka.
Dr. Ahmet Basal Yıldız Technical University Education Faculty Foreign Languages Education Department İstanbul, Turkey. Prof. Lazarus Ndiku Makewa University of Eastern Africa Baraton, Kenya.
Prof. Ogunsakin R. Ebenezer Department of Statistics Ekiti State University Ado Ekiti, Nigeria.
Dr. A. Kadir Maskan Dicle University Ziya Gokalp Education Faculty Department of Physics Education Diyarbakir, Turkey.
Dr. Mohd Akhtar Siddiqui Institute of Advanced Studies in Education Faculty of Education Jamia Millia Islamia Central University New Delhi, India.

Editorial Board Prof. García Mayo, María del Pilar Departamento de Filología Inglesa y Alemana y de Traducción e Interpretación Universidad del País Vasco (UPV/EHU) Paseo de la Universidad 5 Vitoria, Spain. Prof. Frank Witlox Ghent University Department of Geography Gent, Belgium. Prof. Georgios D. Sideridis University of Crete Department of Psychology Rethimno, Greece. Prof. Andreas Veglis Department of Journalism and Mass Media Aristotle University of Thessaloniki Thessaloniki, Greece. Prof. Mutendwahothe Walter Lumadi Curriculum & Instructional Studies College of Education UNISA, South Africa. Dr. Miriam McMullan Faculty of Health and Social Work University of Plymouth Plymouth, UK. Prof. Moshe Barak Graduate Program for Science and Technology Education Ben-Gurion University of the Negve, Beer Sheva, Israel. Dr. Hiam Zein Psychology and Education Lebanese American University Chouran-Beirut, Lebanon. Dr. Joel O. Eriba Faculty of Education Benue State University Makurdi, Nigeria.
Prof. Bingjun Yang School of Foreign Languages Southwest University Chongqing, China.
Dr. Ernest W. Brewer The University of Tennessee Educational Administration and Supervision Tennessee, USA. Prof. Gail Derrick Regent University School of Education Virginia Beach, USA.
Dr. Evridiki Zachopoulou Department of Early Childhood Care and Education Thessaloniki, Greece. Dr. Francesco Pastore Seconda Università di Napoli Italy, Dr. Syed Iftikhar Hussain Shah Technical Education and Vocation TEVTA Secretariat Lahore, Pakistan. Dr. Ravi Kant College of Teacher Education Maulana Azad National Urdu University Darbhanga, India. Dr. Dibakar Sarangi Directorate of Teacher Education and State Council for Educational Research and Training (DTE & SCERT) Odisha, India. Dr. Elisa Backer Faculty of Business Federation University Australia Australia. Dr. Ahmad Alkhawaldeh Department of Curriculum and instruction University of Jordan Jordan.

Educational Research and Reviews
Table of Contents: Volume 11 Number 14 23 July, 2016
ARTICLES
Research Articles
Strengthening preceptors’ competency in Thai clinical nursing 2653 Renu Mingpun, Boonchom Srisa-ard, and Apinya Jumpamool
The effect of playing different musical instruments on arm asymmetry 2661 E. Erdem KAYA
Organizational ımage perceptions of higher education students 2667 Rüyam KÜÇÜKSÜLEYMANOĞLU
The curriculum development for science teachers’ training: The action lesson focusing on science process skills 2674 Jesda Khayotha, Somsong Sitti and Kanyarat Sonsupap
The proposed model of writing with accompaniment of music education for students and its prospect in application 2684 Izzet Yucetoker The validity and reliability study of the sports facility utilization scale of university students: The case of Karabük University 2688 Serdar CEYHUN Analyzing state and private school students’ achievement goal orientation levels in terms of some variables 2695 Ünal TÜRKÇAPAR
Benefits of teaching interdisciplinary subjects collaboratively in Jordanian pre-vocational education 2702 Mon’im A. Al-Saaideh and Mohammad Sayel Nasr-allah Al-Zyoud
ARTICLES
Learning disabilities: Current policy and directions for community involvement among the Arab community in Israel 1279 Samaher Jabareen-Taha and Haitham Taha
Analyzing musical self-esteem and performance-anxiety levels of students receiving professional music education at different ınstitutions in Turkey 1288 Sena Gürşen Otacıoğlu
Numerical implementation of indicators and statistical control tools in monitoring and evaluating CACEI-ISO indicators of study program in industrial process by systematization 1297 Gabriela Cota Ayala Francia Angélica Karlos Real and Ramirez Alvarado Edqar Ivan What changes education? An action research to overcome barriers 1302 Yeşer Eroğlu Eskicioğlu The difficulties that the undergraduate students face about inner product space 1311 Hülya Burhanzade and Nilgün Aygör Multidisciplinary approach for curriculum design of professional master’s program with focusing on solidary economy in Oaxaca, Mex 1317 Rasilla Cano Margarita and Juárez Ruiz Lidia Argelia The effect of sportive and cultural activities on the self-esteem and hope of the children who have tendency to ınvolve in a crime 1324 Zekiye BASARAN Investigating the awareness and knowledge of secondary school students about the effects of allergic pollen on human health: A case of Burdur Province 1331 Kadir Tuzlak Metaphor perceptions of pre-service teachers towards mathematics and mathematics education in preschool education 1338 Oğuz Keleş, Işıl Taş and Durmuş Aslan Pre- and in-service preschool teachers’ science teaching efficacy beliefs 1344 Durmuş Aslan, Işıl Taş and İrem Gürgah Oğul

Vol. 11(14), pp. 1279-1287, 23 July, 2016
DOI: 10.5897/ERR2016.2831
Article Number: 68BB11D59513
ISSN 1990-3839
Copyright © 2016
Author(s) retain the copyright of this article
http://www.academicjournals.org/ERR
Educational Research and Reviews
Review
Learning disabilities: Current policy and directions for community involvement among the Arab community in
Israel
Samaher Jabareen-Taha* and Haitham Taha
Department of Social Work- Haifa University, Israel.
Department of Learning Disabilities and the Cognitive Lab for Reading and Learning Research, Sakhnin College, Israel.
Received 23 April, 2016; Accepted 20 June, 2016
This article seeks to identify and review the basic characteristics of learning disability which are specifically mentioned in the literature. In addition, the article intends to conduct a brief analysis on learning disability policy in Israel and the differentiation problems at the level of awareness among the Arab society in Israel. Despite the fact that during the past twenty years this field earned a significant progress in Israel, lags in awareness and educational policy between the Arab and the Jewish communities in Israel still rises. These lags could be attributed to different causes like parents awareness toward the effect of learning disabilities on the academic domain of the students. The article raises the question of the ways that programs of community involvement suggest for increasing awareness on behalf of parents and educators concerning learning disabilities. This intervention model is presented by a suggested ecological quarto-model as a recommended model toward intervention in the Arab community in Israel. Key words: Learning disabilities, Arab community in Israel, intervention, awareness.
INTRODUCTION Learning disability is a term that refers to a heterogeneous group of disturbances in the acquisition of learning skills. Such disturbances are not resulted from a physical disability, mental retardation, sensory disturbance or emotional disorders (NJCLD, 1994). Since the term "learning disability" has been suggested by "Samuel Kirk" in 1963, the increase in knowledge regarding has been evident as a result of the increasing research done in this specific area (Hallahan and Mercer, 2002). The introductory research on this field intended to promote a
comprehensive understanding to the sub disabilities that are included in this term. It also sought to expand knowledge on the areas of diagnosis and intervention including adjustment in the methods of diagnosis and testing (Siegel, 2012).
Undoubtedly, the process of learning is complex; it involves the acquisition of different academic skills. Accordingly, the acquisition of a specific skill is being regarded as a process that relies on functional and cognitive processes based on the simultaneous work of
*Corresponding author. E-mail: [email protected].
Authors agree that this article remain permanently open access under the terms of the Creative Commons Attribution
License 4.0 International License

1280 Educ. Res. Rev. different brain systems (Fingelkurts, Fingelkurts and Kähkönen, 2005; Pennington, 2009). For the purpose of understanding the etiological causes of learning disability, the research has largely focused on the human neurosciences sciences from neurological, cognitive and developmental aspects (Matejko and Ansari, 2012; Nicolson and Fawcett, 1999). As mentioned above, learning disability is a group of heterogeneous disturbances in the acquisition of academic skills such as reading, writing and math. The disability in the acquisition of reading is known as dyslexia, while the disabilities in writing and math are known as dysgraphia and dyscalculia respectively (Pennington, 2009). According to McNulty (2003), learning disability has implications on the individual's life beyond those concerning his or her academic achievements. These implications manifested by an impact on the child's emotional and social life. Learning disability: sub-types, etiology characteristics and treatment Reading disability- Dyslexia.
Reading disability refers to the ineffectiveness in the acquisition of word reading skills and of reading fluency, in a way that does not match with what is expected from the reader according to his or her chronological age and grade level (Snowling, 2008). Therefore, reading disability is a failure in the acquisition of fluent reading skills which may also leads to a lack of the development of spelling skills also due to the developmental relationship between spelling and reading skills (Coltheart, 2005; Vellutino et al., 2004).
The academic characteristics of children with reading disability (disorder) as noted in the "Diagnostic and Statistical Manual of Mental Disorders-5" of the American Psychiatric Association (APA, 2013) are the following: 1. Difficulties in word decoding and word reading fluency. 2. Difficulties in Reading comprehension. 3. Spelling inaccuracies. From a cognitive perspective, different explanations behind the development of reading disability have been suggested; for example, Snowling, (2001) postulates the phonological deficit explanation which suggests that reading disability could be a result of inadequate development of phonological awareness and phonological processing skills. This explanation is an acceptable one among different researchers who mainly studied the disability in alphabetic systems, such as Arabic, Hebrew and English (Share, 2008; Vellutino et al., 2004).
The phonological awareness is the ability in identifying the sounds the spoken words (Anthony and Francis, 2005). Ziegler and Goswami, 2005 argues that this awareness constitutes the basics for the acquisition of the correspondences between the sound structure of the
word and its written representation. This process is considered as a basic process during the earlier stages of the reading acquisition, and might influence reading fluency afterwards (Ehri, 2005). Accordingly, many researches have shown that children with reading disability have a phonological processing deficit that explains their failure in the acquisition of reading skills (Snowling, 2001; Vellutino et al., 2004; Taha et al., 2014). The neurocognitive research reveals that the ineffectiveness of neurological systems that are specialized in the phonological processing of spoken words is one of the etiological reasons of the reading disabilities (see; Finn et al., 2013). For example, a non-typical activation in the" Insula" (Figure 1), a region at the left hemisphere of the brain, was expected among disabled readers in comparison to that which was measured among typical readers (Ackermann et al., 2009). It was also suggested that in light of the primary difficulty in the acquisition of decoding processes among children with reading disability, brain systems which are intended for visual word recognition of words in the left tempro-occipital area (Figure 2) or what is known as visual word forming area (VWFA), do not develop effectively among children with developmental reading disability. According to Shaywitz and Lyon (2006), this ineffective development of the VWFA leads to ineffective visual recognition of the written words.
According to the research data garnered in the study of reading disability and the sources of the disability, intervention programs for strengthening the phonological decoding skills were suggested to enable efficient and automatic word recognition. For example, Shaywitz et al., (2004), suggested intervention program focusing on intensive training for improving the phonological awareness among children. Such exercises were designed to enhance the phonological decoding skills. The research findings that examined the effectiveness of these programs showed a significant improvement in reading ability and word recognition skills in addition to the increased efficiency of the left tempro-occipital brain regions, which is associated with word recognition, as a direct result of the intervention.
Recently, software based programs for interventions to overcome cases of difficulties in fluent reading, by accelerating the "brain-reading" systems, were suggested. This technique relies on accelerating the presentation of the text in front of the reader and to enforce him or her to read in a speeded way (Breznitz, 2006). The findings which are reported by researchers that examined programs of acceleration of the mentioned type showed an increased efficiency of the brain systems specialized in word identification (Breznitz et al., 2013).
Writing disability [Dysgraphia]. The term writing disability refers to the ineffectiveness in performing the writing skill from different aspects: The

Jabareen-Taha and Taha 1281
Figure 1. The Insula in the left brain hemisphere.
Figure 2. The left tempro-occipital region.
quality of hand-writing and readability (The grapho-motor aspect), ineffective spelling and writing and ineffective writing expression (Pennington, 2009). Regarding the grapho-motor aspect, writing is a motor process that is targeted to drawing the letters' templates that represent the written word (Ratzon et al., 2007). This relies on both perceptual and motor processes in planned and continuing process (Sandler et al., 1992). A deficit in the cerebral systems which are responsible on integration between perceptual input and motor processes may reveal into developmental difficulties considering the readability of handwriting (Kulp and Sortor, 2003). In addition, upon the acquisition of the process of writing, it basically relies on the quality of planning of the whole
motor movement of the hand that enables the drawing in accordance of the sequence of letters. Delays in the process of motor planning may make it difficult to learn and produce such movements in a proper fashion (Sandler et al., 1992). From a neuropsychological perspective, it was indicated that disability in the integration between sensory information is attributed to parietal lobes of the brain, where less effectiveness of such regions constitute an explanation for the ineffectiveness of the processes of visual-motor integration (Andersen and Zipser, 1988). On the other hand, ineffectiveness of the frontal regions of the brain lobe makes the processes of motor planning difficult (Dum and Strick 2002).

1282 Educ. Res. Rev.
Abu Rabia and Taha (2004), postulate that incorrect spelling of words might be basically related to an initial reading disability. As mentioned previously, reading disability refers to ineffectiveness in the development of brain systems which are specialized in the recognition of the written words. It also refers to difficulty in the development of the ability of learning letter-sound correspondences (Taha et al., 2014). Such deficits in the development of the brain systems may lead to a difficulty in writing words correctly due to the lack of an efficient storage of orthographic patterns of words in the memory which is known as the lexical route (Coltheart, 2005). Such developmental deficits of the lexical route may lead into spelling inaccuracies. For the illustration of the mutual relationship between the development of reading and spelling, we can refer to the kindergarteners' way of spelling. Error can be observed when kindergarteners are asked to write words. However, due to the still-undeveloped mental orthographic lexicon or the lexical information about words at this early age, those kindergarteners may find it difficult to spell words accurately and mainly rely on phoneme-grapheme correspondences only as the predominate strategy of spelling. Abu Rabia and Taha, (2006) argues that this ineffective way of spelling could reveal into the performing of spelling mistakes. For such example, these errors are known as phonetic or regular errors (Abu Rabia and Taha, 2004, 2006; Coltheart, 2005). Accordingly, this is explained that writing errors made by children with reading disability is because of their ineffective orthographic knowledge. On the other hand, writing expression disability refers to the ineffectiveness in producing a composition that represents a mental idea through integrating fitting verbal expressions with presenting ideas in a coherent, fluent and sequential fashion. Certainly, such difficulty is attributed to ineffectiveness in the expressive language skills. In addition, it was suggested that such difficulty is related to the area of language disturbances (Pennington, 2009).
The grapho-motor writing disability is usually treated through implementing programs of treatments that cultivate the grapho-motor ability such as occupational therapy (Ratzon et al., 2007). On the other hand, problems in writing expression and difficulties in spelling skills are carried out through intervention programs of involvement that deal with writing and reading skills. These interventions usually consider that the didactical aspects and learning strategies is what makes these writing functions more efficient (Pennington, 2009). Dyscalculia Dyscalculia is a difficulty in the acquisition of the basic mathematical skills and knowledge about numbers, arithmetical facts and calculations. This difficulty may disturb the ability of learning math afterwards (Henik et
al., 2011). The developmental process of knowledge on math is different from the processes of the acquisition of reading and spelling since it deals with a continious learning of incremental mathematical knowledge, while the knowledge on specific skills is required in decoding, word recognition and spelling is repetitive (Landerl et al., 2009).
Children with dyscalculia may demonstrate a difficulty in learning quantitative problems, manipulating quantities, learning numbers facts and numerical knowledge, and problems in learning basic arithmetical facts and procedures (Butterworth et al., 2011). From the cognitive point of view, the research attributes the failure in learning math among children with dyscalculia to the difficulty in understanding the quantitative magnitudes, is which leads to leads to a difficulty in learning the quantitative value of numbers (Dehaene, 2011). This difficulty is known as the difficulty in the development of numerical cognition (McCloskey, 1992). Various studies show that children with dyscalculia suffer from a delay in the development of the quantitative knowledge which is represented by symbolic digits (Wynn, 1992). Other studies indicate that there are some children with dyscalculia who encounter difficulty in learning mathematical problem solving skills due to difficulties in their executive functions (EF) (Vandersson, 2008). Executive functions is an umbrella term that includes a group of cognitive abilities that enable the planning of cognitive and behavioral action, performing and producing it until reaching a final goal (Lezak, 2004, p. 611). Although the process of performing the cognitive processes, there is a need for a sufficient recruitment of attention (Andersson, 2008). Accordingly, it was argued that children with attention deficit hyperactivity disorder (ADHD) most likely suffer from difficulties in math due to the ineffectiveness of the EF among this group of children (Miranda et al., 2012).
Considering the deficit in the development of numerical cognition, the neurological explanation is attributed to the ineffectiveness of the Intra-Parietal Sulcus (IPS) in the parietal lobe (Figure 3). Various studies indicate that among children with dyscalculia, the typology of this sulcus is different from typical children (Kadosh, 2007). While the ineffectiveness attributed to the EF is explained through dysfunctions to the pre-frontal brain regions (Andersson, 2008). Nowadays, intervention programs for students with dyscalculia are mainly conducted through employing didactic methods in which the child goes through intensive exercises in studying math and workout plans and strategies for the purpose of cultivating the numerical and arithmetical knowledge (Shalev, 2004). Those interventions also involve cultivating cognitive skills that are related to math. Usually, computer training software programs can constitute basic tools for the processes of treatments for the purpose of activating an intensive activation for brain systems responsible for numerical processing (Cohen-Kadosh et al., 2013;

Jabareen-Taha and Taha 1283
Figure 3. The Inter-parietal sulcus.
Räsänen et al., 2009). The Socio-emotional domain. The negative experience of failure that children with learning disability go through in the academic experience may lead to adopting a low academic self-concept (Chapman et al., 2000). According to Chapman et al. (2000) such academic self-concept (the self-belief in the personal ability to learn) is shaped toward reaching after the first years of school, as the child has been already going through several experiences of academic failures. Such poor academic self-concept negatively influences the general self-concept. Accordingly, such low general self-concept involves emotional fears and difficulties which may have a negative impact on the personality of children with learning disability (Scarborough and Parker, 2003). Also, it was found that emotional difficulties that will develop on behalf of children with learning disability could have direct implications on their cognitive ability. This was explained by the notion that the emotional imbalance and the fears that accompany children with learning disability become additional reasons to recruit cognitive resources during the process of learning beside the disability itself (Owens et al., 2012). These difficulties will be also an additional cause for academic failures. Therefore, the process of intervention for learning disabilities must take into consideration the following elements: the emotional aspect, strengthening the self-esteem and making the methods of dealing with experiences of failure and disappointments much more efficient. This treatment enables children to experience
success and positive learning experiences and accordingly to reveal into high degree of self-confidence and consequently it may significantly improve the self-academic concept as well. Learning disabilities in the Arab community in Israel The field of learning disability in Israel, in general, has earned special attention since the "Margalit committee" published its report in 1997 (Israeli Ministry of Education, 1997). The "Margalit committee" headed by "Malka Margalit" was set up by the minister of education "Zvollon Hammer". According to the committee report, it was indicated that various institutions in Israel were not sufficiently effective and organized in dealing with learning disability. The findings also revealed that there were no clear policy regarding the treatment of learning disability in Israel. In the aftermath of this committee, the minister of education established a body for learning disability that dealt with implementing regulations in the educational system including specific accommodations for learning disabled students throughout exams. Accommodations constitute a stage in the process of intervention that is directed to dealing with the difficulties that facing children with learning disability in accordance to the type of disability. Those accommodations change the regular way that children are tested with (Zuriff, 2000). Empirical findings support the notion that Accommodations were found to accelerate reading comprehension among learning disabled students. For example, Runyan (1991) examined the effects of extra time on the ability of university students with and without

1284 Educ. Res. Rev.
Figure 4. The suggested ecological quatro-model toward intervention in the Arab community in Israel (Abbreviation: LD= Learning Disabled).
learning disabilities to complete a reading comprehension test under timed and extra-time conditions. It was found that that there is a significant difference between scores of students with learning disabilities and normally achieving students under timed conditions and that there are no significant differences in test performance between students with learning disabilities and normally achieving university students when students with learning disabilities are provided extra time. Accordingly, school and regional committees' were set up for the purpose of arranging the treatment process of children with learning disabilities in Israel. Mainly, this process includes the arrangement of the diagnosis process, and approving the suggested accommodation for each student.
Nowadays, learning disability is perceived as a disability that necessitates specific attention from the school. The fact that learning disability is attributed to ineffective neurological functions, it requires that the educational system adapt the teaching methods, learning and testing accommodations for the purpose of enabling children with learning disability to achieve the full academic potential they have. This perspective is one of the essential perspectives that the general director of the minister of education emphasize in the field of accommodations (Israeli Ministry of Education, 2003). As a result, accommodations for learning to disabled students became a central point of interest among schools and educators in Israel since the previous report of "Margalit committee" was published in 1997. This was evident by the remarkable growth in the number of accommodations that were used and approved for students with learning disabilities during the years 2000-
2007. This fact is based on the data that was reported by Schiff et al. (2010), as it has been extracted from the working paper that was submitted to the department of education and teaching in the "Central Bureau of Statistics in Israel". According to this survey, a remarkable growth was noticed in approving the applications for accommodations that were submitted by students from the 10
th into the 12
th grades in Israel, for both Arab and
Hebrew sectors (Figure 4). These accommodations are usually divided into three levels depending on the way and the level of change by which the given accommodation could produce on the regular way of examination.
For example, accommodations from level "A" are those to be considered as simple accommodations and usually do not extremely change the regular way of examination. For example, allowing time extension for answering the exam questions. However, accommodations from level "B" are supposed to produce a moderate change in the way of examination or receiving the answers from the student for making the exam and the answering way suitable with students' need. For example, ignoring spelling mistakes which is being made by the student during his or her answering process. While on the other hand, accommodations from level "C" are supposed to change the regular way of examination in extreme way according to the student needs. The approval of accommodations form level "C" is considered as complex process which requires an expanded process of diagnosis, while the application for approving such accommodations should be submitted to professional committee in the ministry of education (The Ministry of
Education in Israel, 2003). According to Schiff et al. (2010), the growth in the number of the accommodations that were approved in Israel was observed on the three levels of accommodations; A, B and C. The number of the accommodations was increased form 11.2% and was used by students in 2000 to 19.9% in 2007. Yet, until the present days, a lack of awareness among certain populations in Israel, like the Arab community, is noticeable concerning this issue. For example, awareness about learning disability in the Arab society in Israel is lower than that in the Jewish society in Israel. The lack of awareness is manifested through a wrong diagnosis for children with disabilities and their application to the relevant framework (Jabareen and Agbariya, 2010, pp. 38-39). Also, such lack of awareness could be considered as main reason for the differences that were reported by Schiff et al. (2010) on the number of the accommodations that were used by Arab students (5.7% from the students in the 10
th into 12
th grades)
compared to students from the Hebrew sector (23.9% from the students in the 10
th into 12
th grades). However, it
should be mentioned here that some researchers tend to postulate that in spite of formal published statistics, where the numbers of learning disabled students in the Hebrew community are higher than those in the Arab community in Israel, but in fact the realty is not as this. For example, Abu Rabia and Maroun (2005) postulate that the frequent consanguineous marriage type in some Arab communities in Israel is potential cause on high rates of reading disabilities among this population. In light of their postulation, Abu Rabia and Maroun examined whether the rate of reading disabilities among offspring of first-cousin parents could be compared to the offspring of unrelated parents; and whether reading-disabled children of first-cousin parents were more disabled in phonological awareness and phonological decoding than reading-disabled children of unrelated parents and normally reading younger children. Abu Rabia and Maroun examined these questions by investigating 814 pupils of the 4th, 5th, and 6th grades. Two experimental groups were chosen from this population; a reading-disabled group of twenty-two pupils who were children of first-cousin marriages and twenty-one pupils who were children of unrelated parents beside to control group which consisted of twenty-one younger normally reading pupils at the same reading level. All the groups were tested on non-words, real words, phonological, orthographic and working memory measures. The results indicated that the rate of reading disabilities among children of first-cousin parents was higher than that of the children of second-cousin parents, distantly related parents, or unrelated parents. Another obstacle that interferes with learning disabilities treatment in the Arab community in Israel is the lack of standardized diagnostic tools for assessing academic and related cognitive skills for different ages and especially for kindergarten children and adult students (Mazzawi, 1997). Just recently, a
Jabareen-Taha and Taha 1285 standardized reading diagnostic battery was published for children from first into sixth grades. Unfortunately, the lack of those standardized tools led to a higher risk of inaccurate diagnoses for students in Arab society in Israel (Assadi, Ibrahim, Ben-Simon and Shany, 2014).
There are several factors that explain gaps in the level of awareness between the two populations and accordingly leading to significance difference in the level of diagnosis and intervention administrations (Jabareen and Agbariya, 2010, pp. 38-39). For example, a lack of a comprehensive training for educational staffs in Arab schools in Israel at the area of learning disabilities is an important cause for the lack of awareness among these staffs. This may have negative implications on the staffs' ability to identify children with learning disability in the class and impedes an early involvement on their behalf. In addition, a lack of awareness about this field among parents is evident due to lack of community programs targeted to increase awareness among parents concerning their impact on the emotional and academic life of their children and their interaction within the family that might be damaged as a result of their disability. Such community programs are more common in the Jewish society than they are in the Arab society in Israel (The Israeli Jewish Joint Distribution Committee, 2006). This leads to the difference in the awareness between Arab and Jewish parents.
Programs for increasing awareness among educational staffs and parents may contribute to improving involvement for identifying and treating children with learning disability at early ages. This may also lead to creating a comfortable learning atmosphere on their behalf. The success of these children in their studies may minimize their public or secretive drop out from school as well as decreasing the level of violence and juvenile delinquency that may resulted from their drop out from school (Sveta et al., 2000). The intervention at this level of the educational staffs may include also the issue of developing standardized diagnostic tools for assessing academic and related cognitive skills for different ages using the support of academic professional services. As mentioned above, in the Arab community in Israel is the lack of standardized diagnostic tools for assessing academic and related cognitive skills for different ages and especially for kindergarten children and adult students (Mazzawi, 1997). This lack negatively contributes to the "false diagnosis" of students as having developmental learning disabilities or not. Standardized diagnostic tools contribute to the true diagnosis and the suitable intervention as a result.
These programs of involvement could be implemented within the framework of schools through advanced courses, learning, professional training at the levels of school and community and even a comprehensive school based, intervention programs for students with learning disabilities. The suggested school intervention programs are supposed to be designed in a way that could enable

1286 Educ. Res. Rev.
professional identification of students with learning disability, and also to enable an intervention for strengthening their academic and social skills. The effectiveness of those school programs could be a matter of collaboration between the educational system and the parents. Accordingly, effective model of intervention that could be suggested for such community should work as an ecological one while different domains should be involved in such intervention.
See figure 4 as suggested quarto-level model for such intervention. Community involvement and intervention programs which aim to support students with learning disabilities were reported in different studies in the word-class literature. Considering the social domain of intervention for learning disabled students, Smith and Shu (2000) reported that interventions by parents, teachers, and the students' peers were often effective. Also, Smith and Shu (2000) suggested that teachers require guidance on fostering peer support and altering the role of bystanders, initially during teacher training education and later in ongoing in-service sessions. In compatible manner, Smith and Myron-Wilson (1998) contended that alongside school-based interventions, work is required with parents and families; they argued that parents might need for professional support to realize that their behavior may contribute to their child’s difficulties. According to Mishna (2003), in adapting schoolwide interventions to suit the particular school and students in order to increase the likelihood of success, it may be necessary to incorporate accommodations for the students with LD in a manner that does not single them out.
The criticism around different intervention programs and how they can cover the learning disabled students' needs has been discussed by different researchers. For example, Kavale et al. (2005) published a large discussion about the limitations of the well know Response-to-Intervention approach which intended to identify students according to their response to validate and monitor instruction. Students who do not respond receive either more intensive or different instruction. The progress continues to be monitored, while the failure to respond may qualify a student for special education. Despite the fact the this approach has been supported by different researchers (for example; Barth, et al., 2008; Fletcher and Vaughn, 2009;), Kavale et al. (2005) argue that fundamental issues related to RTI have not been resolved, while better strategy may be to more rigorously implement existing identification criteria (for example., discrepancy and psychological processing deficits) in a structured psychometric framework. Eventually, an inappropriate involvement could constitute a cause for other problems in the community and society such as violence and juvenile delinquency.
Thus, in order to achieve awareness at the level of children, there is a need for involvement in increasing awareness at the level of educators, teachers and parents.
Conflict of Interests The authors have not declared any conflicts of interest. REFERENCES
Abu‐Rabia S, Maroun L (2005). The effect of consanguineous marriage
on reading disability in the Arab community. Dyslexia, 11(1):1-21. Abu-Rabia S, Taha H (2004). Reading and spelling error analysis of
native. Read. Writ. 17(7-8):651-690. Abu-Rabia S, Taha H (2006). Phonological errors predominate in Arabic
spelling across grades 1–9. J. Psycholinguist. Res. 35(2):167-188. American Psychiatric Association. (2013). Diagnostic and statistical
manual of mental disorders (5th ed.). Arlington, VA: American Psychiatric Publishing.
Andersen RA, Zipser D (1988). The role of the posterior parietal cortex in coordinate transformations for visual-motor integration. Can. J. Physiol. Pharmacol. 66(4):488-501.
Andersson U (2008). Working memory as a predictor of written arithmetical skills in children: The importance of central executive functions. Br. J. Educ. Psychol. 78(2):181-203.
Anthony JL, Francis DJ (2005). Development of phonological awareness. Curr. Directions Psychol. Sci. 14(5):255-259.
Assadi I, Ibrahim R, Ben-Simon A, Shany M (2014). A System for diagnosis reading disability and writing skills in Arabic. Retrieved from: http://www.hebpsy.net/articles.asp?id=3160 (Hebrew).
Barth AE, Stuebing KK, Anthony JL, Denton CA, Mathes PG, Fletcher JM, Francis DJ (2008). Agreement among response to intervention criteria for identifying responder status. Learn. Individ. Diff. 18(3):296- .307
Breznitz Z (2006). Fluency in reading: Synchronization of processes (page: 36-48). London: Lawrence Erlbaum Associates.
Breznitz Z, Shaul S, Horowitz-Kraus T, Sela I, Nevat M, Karni A (2013). Enhanced reading by training with imposed time constraint in typical and dyslexic adults. Nature Commun. 4:1486.
Butterworth B, Varma S, Laurillard D (2011). Dyscalculia: from brain to education. Science 332(6033):1049-1053.
Chapman JW, Tunmer WE, Prochnow JE (2000). Early reading-related skills and performance, reading self-concept, and the development of academic self-concept: A longitudinal study. J. Educ. Psychol. .703:(4)92
Cohen Kadosh R, Dowker A, Heine A, Kaufmann L, Kucian K (2013). Interventions for improving numerical abilities: present and future. Trends Neurosci. Educ. 2(2), 85-93.
Coltheart M (2005). Modelling reading: The dual-route approach. In: Snowling, M.J. & Hulme, C. (Eds). The Science of Reading. Oxford: Blackwells Publishing.
Dehaene S (2011). The number sense: How the mind creates mathematics. Oxford University Press.
Dum RP, Strick PL (2002). Motor areas in the frontal lobe of the primate. Physiol. Behav. 77(4):677-682.
Ehri LC (2005). Learning to read words: Theory, findings, and issues. Sci. Stud. Read. 9(2):167-188.
Fingelkurts AA, Fingelkurts AA, Kähkönen S (2005). Functional connectivity in the brain—is it an elusive concept?. Neurosci. Biobehav. Rev. 28(8):827-836.
Finn ES, Shen X, Holahan JM, Scheinost D, Lacadie C, Papademetris X, Constable RT (2013). Disruption of Functional Networks in Dyslexia: A Whole-Brain, Data-Driven Analysis of Connectivity. Biol. Psychiatry 76(5)397-404.
Fletcher JM, Vaughn S (2009). Response to intervention: Preventing and remediating academic difficulties. Child Dev. Perspect. 3(1):30- .37
Hallahan DP, Mercer CD (2002). Learning disabilities: Historical perspectives. Identification of learning disabilities: Research to practice. In: R. Bradley., L. Danielson., & D. P. Hallahan, (Eds.). Identification of Learning Disabilities: Research to Practice. Routledge. pp. 1 - 67
Henik A, Rubinsten O, Ashkenazi S (2011). The ―where‖ and ―what‖ in developmental dyscalculia. Clin. Neuropsychol. 25(6):989-1008.

Israeli Ministry of Education. (1997). The report of the professional
committee for Examine the abilities realizations of learning disabled students in Israel: Margalit, M. Available at: http://makom-m.cet.ac.il/pages/item.asp?item=302.
Israeli Ministry of Education. (2003). General director of the ministry of education instructions' for accommodations in exams for learning disabled students in high schools. Available at: http://cms.education.gov.il/educationcms/applications/mankal/arc/sd4bk4_3_25.htm.
Jabareen Y, Agbariya A (2011). Education on Hold: Government Policy and Civil Society Initiatives to Advance Arab Education in Israel. Dirasat, Arab Center for Law and Policy: Nazareth. Available at: http://www.dirasat-aclp.org/arabic/files/education-on-hold_dirasat_2010.pdf.
Kadosh RC, Walsh V (2007). Dyscalculia. Curr. Biol. 17(22):R946-R947.
Kulp MT, Sortor JM (2003). Clinical value of the Beery visual-motor integration supplemental tests of visual perception and motor coordination. Optometry Vision Sci. 80(4):312-315.
Landerl K, Fussenegger B, Moll K, Willburger E (2009). Dyslexia and dyscalculia: Two learning disorders with different cognitive profiles. J. Exper. Child Psychol. 103(3):309-324.
Matejko A, Ansari D (2012). Developmental Cognitive Neuroscience and Learning. In Encyclopedia of the Sciences of Learning. Springer US. pp. 961-966
Mazzawi A (1997). The educational consulting services and psychological education system in Israel. Available at: http://makom-m.cet.ac.il/pages/item.asp?s=1&id=200&defid=-1&page=4&item=301
McCloskey M (1992). Cognitive mechanisms in numerical processing: Evidence from acquired dyscalculia. Cognition 44(1):107-157.
McNulty MA (2003). Dyslexia and the life course. J. Learn. Disabilities 36(4):363-381.
Miranda A, Colomer C, Fernández I, Presentación MJ (2012). Executive functioning and motivation of children with attention deficit hyperactivity disorder (ADHD) on problem solving and calculation tasks. Revista de Psicodidáctica 17(1):51-71.
Miranda A, Colomer C, Fernández I, Presentación MJ (2012). Executive functioning and motivation of children with attention deficit hyperactivity disorder (ADHD) on problem solving and calculation tasks. Revista de Psicodidáctica 17(1):51-71.
Mishna F (2003). Learning disabilities and bullying double jeopardy. J. Learn. Disabilities 36(4):336-347.
National Joint Committee on Learning Disabilities. (1985/1994). Learning disabilities and the preschool child. In Collective perspectives on issues affecting learning disabilities: Position papers and statements. Austin, TX: Pro-Ed. pp. 37-48.
Nicolson RI, Fawcett AJ (1999). Developmental dyslexia: The role of the cerebellum. In Dyslexia: Advances in theory and practice. Springer: Netherlands. pp. 173-196
Owens M, Stevenson J, Hadwin JA, Norgate R (2012). Anxiety and depression in academic performance: An exploration of the mediating factors of worry and working memory. School Psychol. Int. 33(4):433- .449
Pennington FB (2009). Diagnosing Learning Disorders: A Neuropsychological Framework. NY: Guilford Press
Räsänen P, Salminen J, Wilson AJ, Aunio P, Dehaene S (2009). Computer-assisted intervention for children with low numeracy skills. Cognitive Dev. 24(4):450-472.
Ratzon NZ, Efraim D, Bart O (2007). A short-term graphomotor program for improving writing readiness skills of first-grade students. Am. J. Occup. Therapy 61(4):399-405.
Rubinsten O, Henik A (2009). Developmental dyscalculia: heterogeneity might not mean different mechanisms. Trends Cognitive Sci. .92-99:(2)13
Runyan MK (1991). The effect of extra time on reading comprehension scores for university students with and without learning disabilities. J. Learn. Disabilities 24(2):104-108.
Jabareen-Taha and Taha 1287 Sandler AD, Watson TE, Footo M, Levine MD, Coleman WL, Hooper
SR (1992). Neurodevelopmental study of writing disorders in middle childhood. J. Dev. Behav. Pediatrics 13(1):17-23.
Scarborough HS, Parker JD (2003). Matthew effects in children with learning disabilities: Development of reading, IQ, and psychosocial problems from grade 2 to grade 8. Ann. Dyslexia, 53(1):47-71.
Schiff Y, Shimoni E, Portnoy H (2010). Students receiving accommodations for the matriculation examinations: Characteristics and achievements. The Central Bureau of Statistics – Department of Education and Teaching Forces: Jerusalem. Available at: http://www.cbs.gov.il/www/publications/pw58.pdf
Shalev RS (2004). Developmental dyscalculia. J. Child Neurol. .765-771:(10)19
Share DL (2008). On the Anglocentricities of current reading research and practice: the perils of overreliance on an" outlier" orthography. Psychol. Bull. 134(4):584.
Shaywitz BA, Lyon GR, Shaywitz SE (2006). The role of functional magnetic resonance imaging in understanding reading and dyslexia. Dev. Neuropsychol. 30(1):613-632.
Shaywitz BA, Shaywitz SE, Blachman BA, Pugh KR, Fulbright RK, Skudlarski P, Gore JC (2004). Development of left occipitotemporal systems for skilled reading in children after a phonologically-based intervention. Biol. Psychiatry 55(9):926-933.
Siegel LS (2012). Confessions and reflections of the black sheep of the learning disabilities field. Aust. J. Learn. Difficulties 17(2):63-77.
Snowling M (2001). From language to reading and dyslexia. Dyslexia 7:37-46.
Snowling MJ (2008). Specific disorders and broader phenotypes: The case of dyslexia. Q. J. Exper. Psychol. 61(1):142-156.
Smith PK, Myron-Wilson R (1998). Parenting and school bullying. Clin. Child Psychol. Psychiatry 3:405-417.
Smith PK, Shu S (2000). What good school can do about bullying: Findings from a survey in English schools after a decade of research and action. Childhood 7:193-212.
Steinbrink C, Ackermann H, Lachmann T, Riecker A (2009). Contribution of the anterior insula to temporal auditory processing deficits in developmental dyslexia. Hum. Brain Mapping 30(8):2401- .2411
Taha H, Ibrahim R, Khateb A (2014). Exploring the Phenotype of Phonological Reading Disability as a Function of the Phonological Deficit Severity: Evidence from the Error Analysis Paradigm in Arabic. Reading Psychol. 35(7):683-701.
The Israeli Jewish Joint Distribution Committee. (2006). People with disabilities in the Arab community in Israel: An opportunity for social change: Sandler-Laf & Shahak. Available at: http://www2.jdc.org.il/sites/default/files/arabs-disability-heb.pdf
Vellutino FR, Fletcher JM, Snowling MJ, Scanlon DM (2004). Specific reading disability (dyslexia): what have we learned in the past four decades?. J. Child Psychol. Psychiatry 45(1):2-40.
Ziegler JC, Goswami U (2005). Reading acquisition, developmental dyslexia, and skilled reading across languages: a psycholinguistic grain size theory. Psychol. Bull. 131(1):3.
Zuriff GE (2000). Extra examination time for students with learning disabilities: An examination of the maximum potential thesis. Appl. Measure. Educ. 13(1):99-117.

Vol. 11(14), pp. 1288-1296, 23 July, 2016
DOI: 10.5897/ERR2016.2820
Article Number: F1351EB59515
ISSN 1990-3839
Copyright © 2016
Author(s) retain the copyright of this article
http://www.academicjournals.org/ERR
Educational Research and Reviews
Full Length Research Paper
Analyzing musical self-esteem and performance-anxiety levels of students receiving professional music
education at different ınstitutions in Turkey
Sena Gürşen Otacıoğlu
Fine Arts Department. Music Education Section, Marmara University, Ataturk Education Faculty. İstanbul, Turkey.
Received 14 April, 2016; Accepted 20 June, 2016
The study was conducted to establish which variables cause the interrelations between musical self-esteem and performance-anxiety levels of students receiving professional music education at different institutions to vary. In relation to this framework, “musical self-esteem” and “performance anxiety” scores of students registered at the departments of music education, conservatories and music departments in Turkish faculties of fine arts were examined with respect to a set of variables. The population of the research consisted of 306 students from the first, second, third and fourth grades in the departments of Music Education affiliated to Mimar Sinan University, Istanbul University, Doğu Akdeniz University, Marmara University, Kocaeli University, Karadeniz Technical University, Dokuz Eylül University, On Sekiz Mart University and Uludağ University during the fall term of the 2014 to 2015 academic year. In the study, we utilized the Turkish version of the “Kenny Music Performance Anxiety” inventory originated in 1979 by Schmitt to measure Musical Self-esteem levels and subsequently developed by Kenny (2004). One-way variance analysis, independent group t-test, Mann Witney U and Kruskal-Wallis tests were harnessed to analyze the variables of research data in terms of frequency (f), percentage (%), musical self-esteem and music performance anxiety inventory scores that varied with
respect to variables such as ( X ) and (sd) values, gender, age, university and individual instrument at school. In all these processes “significance level 0.05” was the agreed figure. Key words: Music education, musical self-esteem, music performance anxiety.
INTRODUCTION The phrase “music education” bears dissimilar definitions and associations in different disciplines and countries. At this point arguments about the applicability of a specific theoretical opinion on a universal scale are still in progress. Furthermore, music education embodies
endless variations unlike many fixed course topics in miscellaneous educational programs. Hargreaves (2001) agreed with the English and American originated views regarding the contents of music education and advocated that music practices are universal rather than local.
E-mail: [email protected], [email protected].
Authors agree that this article remain permanently open access under the terms of the Creative Commons Attribution
License 4.0 International License

Throughout ages acclaimed intellectuals, scholars and educators have laid emphasis on the significant position of music in the lives of humans and rationalized the practice of music as an educational tool (Bilen, 1995).
Ordinary rules cannot apply to music teaching and learning since common laws fail to be practical in the field of music. The learning process in music that starts in early childhood can be categorically listed under three main headings; acquisition of music knowledge and experience; storing music knowledge, and developing music skills. Thus we are not only endowed with a conscious memory capable of presenting the acquired knowledge and experience but also a near-automatic memory that is presented during any given performance and all relevant musical skills (Clarke, 2001).
Self-esteem is decisively one of the most fundamental necessities of this modern age of development. Experiences encompassing psychological achievements lay the foundation for the self-esteem that underlines what an individual can achieve. Schmuck and Schmuck (2001) attested that the academic self-esteem of students is significantly affected by the feedback provided by their teachers and classmates. This effect can manifest itself as either an elevated or diminished score in academic self-esteem. Creative teachers can further support the academic self-esteem of students exhibiting a lower academic self-esteem level by setting them achievable aims and organizing target-oriented activities to boost student development (Schmuck and Schmuck, 2001).
Self-esteem is a state of appreciation that emerges from the approval of the self concept that the individual reaches after self-evaluation. The individual who finds himself incompetent can criticize himself/or find others completely positive or like himself. For self-appreciation and self-esteem. the individual does not have to possess superior qualities. Rather than considering oneself better or worse than the real situation, self-esteem is the feeling of self-appreciation (Aslan et al., 2010). In his study. Harter (1992) claimed that musical self-esteem has a nature shapeable by children and the very earliest musical experiences have been attested to create quite a profound impact on any child's musical experience.
Self-concept of an individual is influenced by the love and values received from parents in childhood, interactions with peers, success or failures in school life, social class of the family he lives in and many other experiences in life. In contrast, self-concept influences physical and spiritual wellness of an individual, his interactions with other people and the quality of these interactions, academic success, choice of profession and many other choices he makes in his life (Yağışan and Arslan, 2014).
Austin (1998) holds the belief that the self-esteem model that any given student assigns to himself guides his motivation to participate in music activities and behaviors in music courses. In relevant research data
Otacıoglu 1289 based on personal stories it was identified that an adult with a lower level of musical self-esteem narrated a story of elementary school age when he was denied the right to participate in a musical activity or practice music (Lendon, 1982).
Personal anxiety level is another significant factor profoundly affecting the musical self-esteem concept. It is a common knowledge that anxiety levels are particularly high among performers on stage.
Children with low self-respect have high levels of anxiety and depression and weak friendship relations. Some of these children might have difficulty in participating in play groups and sports teams and might be unwilling to participate in group activities. These children can be said to be the students having the most difficulty. In this period, children‟s self-respect can be heightened by presenting them with opportunities to be successful and thus made more compliant. With rising self-respect, children can improve their self-confidence, establish better relations with other people, express themselves better, observe rules of society more as they feel themselves to be members of the society, and share and cooperate with other people (Yağışan and Arslan, 2014).
Anxiety is a persistent, aimless and pathological reaction originating from fear. Anxiety relates to observable reactions such as worry and stress that are cumulatively stimulated by stress-induced situations (Spielberger, 1972; Quot andÖzgüven, 1998). Mathison (1977) described anxiety as the failure to thoroughly define one's personal emotions (Quot and Cheung, 2006). Two main features of anxiety are lack of control over repeated thoughts and a general disposition to assume that things will get worse (Tallis, 2003). Anxiety that we commonly observe in the field of music is heavily centered on performance activity.
Music psychology contends that musical performance could also be explained by the psychology of the performer and resulting performance level as well as the way audiences are musically and emotionally affected by the staged performance. In sum, it is defined as the active attempt of the performer to stage the artwork for the audience. The musical message transmitted during a musical performance closely parallels the mood of audience at the time and all the things that the performer is able to transmit. It is thus a requirement to establish a wider connection among esthetical life domains within the triangle of composer-performer and audience. It is of crucial importance to transfer the effective and correctly-transmitted musical message disseminated by the performer to recipient individuals and societies. It is thus concluded that any performer who is immune to stage anxiety and fear plays quite a substantial role in the transfer of such musical sharing.
In Turkey there exist several state-university affiliated institutions offering professional music and instrument education (State Conservatories, Faculties of Fine Arts

1290 Educ. Res. Rev.
and Departments of Music Teaching within Faculties of Education). Among these institutions, it is expected that prospective music teachers studying in the departments of music teaching shall upon completing undergraduate studies in four years be professionally able and endowed with effective teaching qualities in music. On the other hand, students trained in conservatories and departments of music in the faculties of fine arts are required to graduate with high GPAs in instrument playing and in performance specifically. Hence the self-esteem level of the students in music education programs and the ways they cope with anxiety hold major values for their self-development.
A person's ability to identify his failings depends on the level of self concept and self congruity. It can thus become feasible for him to become a renowned musician and teacher who has further developed himself in the course of time. Aside from that it is feasible to list the expected traits of educators under various dimensions some of which are cognitive, personal, social, knowledge, correct professional attitudes and behaviors.
Psychometric approaches in the field of music science have gained remarkable impetus in the last two decades. The USA in particular is the recognized leader in this area. Despite the fact that there are various test types in the music field, it is quite convenient to determine the criteria for variables while testing. As argued by Kemp (2002), whilst the validity of a music test constitutes no problem, its typical criteria can forge certain assessments on instrument performance and literary or audio skills. Measurements that relate to the field of music integrate behavioral analyses and applied studies and render particular emphasis on the topics of “music therapy” and “music education”.
In view of the findings aforelisted, the present study aims to analyze whether a significant relationship really exists between “musical self-esteem" and "performance anxiety” scores of students registered at institutions of music and instrument education. In parallel with this objective another aim of this study is to analyze the “musical self-esteem" and "performance anxiety” mean scores of participating students and their variation with respect to gender, age, grade, institution, instrument and their interrelation with “musical self-confidence and performance anxiety” scores.
METHOD
This study aimed to analyze the relationship between the musical self-esteem and performance anxiety levels of students receiving professional music education. The research was designed in line with the survey method since the study involved inter-group comparisons and whether a significant differentiation existed with respect to various features between the problem solving and anxiety levels of students.
Participants
The research population consisted of students receiving
undergraduate professional music education at various institutions in Turkey. The population consisted of 306 students from the Departments of Music Education affiliated to Mimar Sinan University State Conservatory (n=17), Istanbul University State Conservatory (n=28), Eastern Mediterranean University Faculty of Education (n=34), Marmara University Faculty of Fine Arts (n=14), Kocaeli University Faculty of Fine Arts (n=16), Marmara University Faculty of Education (n=51), Karadeniz Technical University State Conservatory (n=17), Dokuz Eylül University Faculty of Education (n=37), On Sekiz Mart University Faculty of Education (n=39) and Uludağ University Faculty of Education (n=53). Data collection tools Data in this research were collected via the Self-esteem of Music Ability (SEMA) scale originally designed by Schmitt (1979) to measure students' musical self-esteem levels and the Kenny Music Performance Anxiety Inventory (K-MPAI) developed by Kenny (2004) to detect students' performance anxiety levels. In this research, there was also a 10-item student information form prepared by the researcher to collect the personal data of the sampling group. Self- Esteem of Music Ability Scale The original of the musical self-esteem scale utilized in this research was the Self-esteem of Music Ability scale designed by Schmitt (1979). The scale consists of 43 questions. Scale items were formed by arranging generic Eigen-value propositions with regard to musical talent. In the subtests of the scale, self-esteem, musical skills and capabilities, feelings of acceptance and reinforcers inherited from family, peers and teachers have been investigated. The scores a student receives from this scale and participation in a musical activity correlated at the level of 0.60. This is a Likert-type scale. In the scale there are four-grade propositions termed "I strongly agree - I agree - I disagree - I strongly disagree". Students are asked to indicate to what level the propositions are correct for them. Cronbach Alpha reliability analysis conducted to measure the use of the scale for this research is explained later. Reliability refers to the inter-consistency of the items listed in the questionnaire and to what extent the utilized scale reflects the target problem. To test the reliability of the Likert question group, Cronbach Alpha Reliability Coefficient was used in this research. Since Cronbach Alfa Coefficient is 0.70 and above. it is validated that the question group is reliable and can safely be implemented for the relevant required analyses. According to reliability analysis conducted for Likert questions, 0.80 ≤ Cronbach Alfa = 0.852 < 0.90, which translates to the deduction that this is a highly-reliable scale.
Music Performance Anxiety Inventory
The Kenny Music Performance Anxiety Inventory (K-MPAI) was developed in 2004 by Kenny to measure pre-performance experiences and underlying psychological vulnerabilities, to conduct a broader conceptualization of the problem so as to aid artists prone to performance anxiety; and to take one further step to focus on more appropriate and comprehensive treatments (Kenny, 2006). In this Likert scale, agreement of the scale with the statements is scored between “I strongly disagree” and “I strongly agree” options. In research among the members of the National Opera Association, the reliability coefficient of KMPAI was measured as 0.94. The Turkish adaptation of the scale was performed by Tokinan (2013) among 696 students studying in the first, second, third and fourth grades (18-23 age group) in the departments of Music Education

Otacıoglu 1291
Table 1. f and % computations of the “Educational institution” (n=306).
Institution F %
Mimar Sinan U. Fine Arts Conservatory 17 5.6
İstanbul U. State Conservatory 28 9.2
Doğu Akdeniz U. Music Teaching (KKTC-North Cyprus) 34 11.1
Marmara U. Faculty of Fine Arts 14 4.6
Kocaeli U. Faculty of Fine Arts 16 5.2
Marmara U. Music Teaching 51 16.7
Karadeniz Technical U. Conservatory 17 5.6
Dokuz Eylül U. Music Teaching 37 12.1
Çanakkale Onsekiz Mart U. Music Teaching 39 12.7
Uludağ U. Music Teaching 53 17.3
Total 306 100.0
u., University.
affiliated to different universities in Turkey. In the analysis of this adapted inventory, Cronbach Alfa reliability coefficient of the 25 items was computed as 0.895.
The analyses conducted by the researcher validated that the Turkish adaptation of the Kenny Music Performance Anxiety Inventory is a valid and reliable measurement tool. Statements in this Likert type inventory are scored between „I strongly disagree‟ (0) and „I strongly agree‟ (6) and total scores vary between 0 and 150. 105 and higher score indicates higher musical performance anxiety whilst 45 and lower score indicates lower musical performance anxiety.
Procedure
Research data were collected in a numbered rank. Initially, descriptive distributions of the features of participants were tabulated. Next. relational analyses that are in parallel with research objectives were completed. Here are the statistical analyses relevant to the data obtained in this research. In order to summarize demographic features of students constituting the sampling, variables' frequency (f), percentages (%) and from the students'
perspective, mean ( X ) and standard deviation (sd) values of the scores they attributed to Musical Self-esteem and Music Performance Anxiety Inventory, perception levels on musical self-esteem and music performance anxiety, and to detect whether a significant differentiation existed with respect to variables of gender, age, institution personal instrument independent groups t-test; in the failure to achieve normality hypothesis non-parametric Kruskal-Wallis. Mann Whitney U (post hoc LSD in the aftermath) and one-way variance analysis (Anova) test were applied. To detect whether a significant relationship existed between musical self-confidence and the music performance anxiety scores of students. Pearson product moment correlation coefficient that is an analysis technique used to measure the level of linear relationship between two continuous variables was harnessed. In addition, to detect whether musical self-esteem scale values were affected by performance anxiety scale values and if affected. to measure the level of the effect, simple regression analysis was conducted. In all statistical measurements significance level was taken as 0.05. If significance value was found to be lower than 0.05 (p<.05) relations and differences between the groups (categories) of independent variables were accepted as “significant” and the findings were evaluated accordingly.
FINDINGS
In this part of the research, numerical data retrieved via statistical analyses on the employed scale are tabulated then commented upon.
Table 1 demonstrates f and % computations of the relevant institutions. Total 306 students are involved in the study. In details, Mimar Sinan University State conservatory n=17. Istanbul University State conservatory n=28, Doğu Akdeniz University Education Faculty n=34, Marmara University Fine Arts Faculty n=14, Kocaeli University Fine Arts Faculty n=16, Marmara University Education Faculty n=51, Karadeniz Technic University State Conservatory n=17, Dokuz Eylül University Education faculty n=37, On Sekiz Mart University Education Faculty n=39 and Uludağ University Education Faculty n=53.
Participants in the group that was selected in the 2014 to 2015 academic term via the random sampling method consisted of 55.2% male and 44.8% female students. The great majority of students (56.2%) belonged to the 21 to 24 age group; 1st (43.8%) and 2nd (28.8%) graders formed the largest part of the study. As students' personal instruments at university were analyzed, the percentages were respectively, 42.2% of students' personal instrument was bow. 20.3% was string. 19.9% was wind. 11.1% was opera. 6.2% was the piano and 0.3% was a percussion instrument. Distribution of students with respect to their demographic features is demonstrated in Table 2.
Generic Descriptive Values of the “Musical Self-esteem and Musical Performance Anxiety” Scales are show in Table 3.
A general analysis of musical self-esteem perceptions of participating students reveals that the computed mean
score proves students' positive perception ( X =85.22 ± 19.33). Table 3 provides the descriptive statistics of the scale that is used to measure the level at which students

1292 Educ. Res. Rev.
Table 2. % and f distributions of students with respect to personal features (n=306).
Variable Group F %
Gender Male 169 55.2
Female 137 44.8
Age
18-21 83 27.1
21-24 172 56.2
24-27 32 10.5
27 and above 19 6.2
Grade
1 134 43.8
2 88 28.8
3 46 15.0
4 38 12.4
Personal instrument in school
Bow 129 42.2
Wind 61 19.9
Percussion 1 0.3
Stringed 62 20.3
Opera 34 11.1
Piano 19 6.2
Table 3. Descriptive statistics of the musical self-esteem and music performance anxiety levels of students (n=306).
Scale Min. and max. score to receive Min. and max. score received
sd
Musical self-esteem inventory (32-192) 44-164 85.22 19.33
Music performance anxiety inventory (0-150) 8-144 68.38 28.26
Min., Minimum; max., maximum.
Table 4. Independent unrelated group t-test conducted to display the differences of musical self-esteem scores with respect to “gender”. variable.
Scale Gender n X Sd t
t P
Musical self-esteem
Female 137 85.07 17.94 0.12 .903*
Male 169 85.34 21.02
*p<.05.
feel anxious before or during any musical performance. According to the figures, the mean anxiety score of participants was 68.38±28.26, which indicates that students possessed a „mid‟ range of musical anxiety. It was computed that 21.6% of students (66 individuals) possessed a „low‟ range of musical performance anxiety (score range between 0 to 45). 66.7% of students (204 individuals) possessed a „mid‟ range of musical performance anxiety (score range between 46-104) and 11.8% of students (36 individuals) possessed a „high‟ range of musical performance anxiety. These figures indicate that the majority of students possessed a „mid‟
range of musical anxiety. In Table 4 musical self-esteem scores of students did
not differ significantly with respect to the gender (t=0.12; p>05) variable. Gender of group participants had no effect on their overall musical self-esteem levels.
It was identified that with respect to the gender variable, music performance anxiety levels of students differed significantly [t(304)=2.29 and p<0.05].
Mean scores of the gender of the group indicated that among male students, a anxiety levels were higher than
female students ( X Male=71.69 and X Female=64.29) (Table 5 to 9).
X

Otacıoglu 1293
Table 5. Independent unrelated group t test conducted to display the differences of music performance anxiety scores with respect to gender variable.
Scale Gender n X Sd T
t p
Music performance anxiety
Female 137 64.29 27.80 2.29 0.023*
Male 169 71.69 28.39
*p <0.05.
Table 6. Anova test conducted to measure the differences of Music Performance Anxiety Levels with respect to Age variables (N=306).
Scale Age Descriptive Statistics Anova Difference in
between n X sd F p
Music performance anxiety
18-21 (1) 83 74.08 25.85
4.10 0.017* 1 to 2. 3 21-24 (2) 172 63.34 27.91
24 and above (3) 51 60.57 32.33
* p<0.05.
Table 7. Anova test conducted to display the differences of Music Performance Anxiety scores with respect to “Grade” variable.
Scale Grade Descriptive statistics Anova Difference in
between n X sd F p
Music performance anxiety
1 134 68.54 28.75
0.56 0.034 1 to 2.3.4 2 88 65.02 27.75
3 46 68.40 27.73
4 38 72.68 28.21
* p<0.05.
Table 8. Kruskal-Wallis test conducted to display the differences of Music Performance Anxiety Scores with respect to “Individual Instrument” variable.
Scale Personal Instrument Descriptive statistics Kruskal-Wallis Difference in
between n Mean rank X2 sd p
Music performance anxiety
Bow (1) 129 158.09
9.89 4 0.042* 5 to 1. 2. 3 .4
Wind (2) 61 165.48
Stringed (3) 62 149.40
Opera (4) 34 150.03
Piano (5) 19 95.42
*p<.05.
It was also identified that with respect to the age group of students, music performance anxiety levels differed significantly [F(2; 303)=4.10 and p<0.05]. According to the post-hoc LSD test conducted upon the Anova test, to determine among which age groups existed a significant difference; students in the age group 18-21 had higher anxiety levels ( X 18-21=74.08; X 21-24=63.34 and X 24 and
above=60.57).
According to the Anova test conducted to see if the music performance anxiety scores of students differed with respect to the grade variable, students' grade (1st. 2nd. 3rd or 4th year) existed significant differentiation in their music performance anxiety. Grade 1 had higher anxiety levels. As a result. 1st grade students have higher anxiety becouse they are youngest.
It was detected that with respect to students' individual

1294 Educ. Res. Rev.
Table 9. Kruskal-Wallis Test conducted to display the differences of Music Performance Anxiety scores with respect to “Registered Institution” variable.
Dimension Registered institution Descriptive statistics
Kruskal-Wallis
Difference n Mean Rank
x
2 sd p
Music performance
anxiety
Mimar Sinan State Con.(1) 17 175.82
14.63 9 0.020*
1. 4. 6
to
3. 5. 7. 9
İstanbul Uni. State Con. (2) 28 157.96
Doğu Akdeniz Uni Music Dept. (3) 34 125.78
Marmara Üni.Fine Art Dept.. (4) 14 175.11
Kocaeli Üni. Fine Arts Dept.(5) 16 128.88
Marmara Ü. Music Edu. Dept. (6) 51 173.15
Karadeniz Technical Üni. Cons. (7) 17 124.64
Dokuz Eylül Üni. Music Dept (8) 37 152.17
Çanakkale Onsekiz Mart Üni. Music (9) 39 122.94
Uludağ Ü. Music Dept.(10) 53 151.26
* p<0.05; Con., Conservatory. Uni., University; Edu., Education; Dept., Department
Table 10. Pearson table measuring the relation between “Musical Self-esteem” and “Musical Performance Anxiety ” scores.
Scale n X sd r p
Musical self-esteem 306 58.44 14.65 0.655 0.003*
Music per.anxiety 306 67.27 21.55
*p<0.01.
instruments, music performance anxiety levels differed significantly (X
2=9.89 and p<0.05). According to the post-
hoc Mann-Whitney test conducted to identify among which instrument groups existed a significant difference of the students whose individual instrument at school was piano (Group 5) anxiety levels were significantly lower than the others (Mean rank bow=158.09; Mean rank
wind=165.48; Mean rank stringed=149.40; Mean rank
Opera=150.03 and Mean rank Piano=95.42). The registered institution of participating students
triggered a significant differentiation in their music performance anxiety levels (X
2=14.63 and p<0.05).
According to the results of the Post-hoc Mann-Whitney test, music performance anxiety levels of students in Mimar Sinan Conservatory, Marmara University, Fine Arts and Marmara University, Department of Music Teaching (Groups 1. 4 and 6) were significantly higher than the students registered at the Doğu Akdeniz University, Department of Music Teaching, Kocaeli University, Faculty of Fine Arts, Karadeniz Technical University Conservatory and Çanakkale Onsekiz Mart University, Department of Music Teaching (Groups 2, 3, 5, 7 and 9) (Mean rankMimar Sinan FA.=175.82; Mean rankDoğu
Akdeniz U. Music T.=125.78; Mean rankMarmara U. F.FA=175.11; Mean rankKocaeli U. F.A.A.=128.88; Mean rankMarmara U. Music
T.=173.15; Mean rankKaradeniz Technical U. Cons.=124.64 and Mean rankÇanakkale Onsekiz Mart U. Music T.=122.94). It was identified in Table 10 that there is a negative relationship between students' “musical self-esteem” and
“musical” performance anxiety levels. Based on the features of present inventories. whilst “low” scores received from musical self-esteem inventory are positive, “high” scores received from musical performance anxiety scale are positive.
In this research, “simple regression” analysis (Table 11) was also conducted to identify whether musical self-esteem inventory scores and musical performance anxiety scores are related. Regression coefficient was computed as 0.067 (p>.05). However. the performance anxiety coefficient score was 0.084 (p>0.05) and no statistically significant difference was measured. DISCUSSION In the light of all the findings obtained from the present study it can feasibly be argued that no differentiation was detected between students' musical self-esteem levels and the gender variable. It was however manifested that depending on students' gender, levels of music performance anxiety differed significantly. As the mean scores of students were analyzed with respect to the gender variable it surfaced that male students exhibited higher anxiety levels compared to female students. Austin (1998) reached a supportive result in his research in which he identified that no significant relationship existed between the gender of elementary school students competing in music contests and their musical

Otacıoglu 1295
Table 11. “Simple Regression” analysis to measure “Musical Self-esteem” and “Music Performance Anxiety” inventory scores.
Coefficient a
Model Non standard Standard
T Sig. Beta Sd Beta
1 Musical self-esteem 2.456 0.180 13.677 0.000
Music per.anxiety 0.084 0.097 0.067 0.860 0.388
self-esteem levels. Gender variables did not provide a significant differentiation in students' musical self-esteem levels. Leondari and Syngollitou (1998) on the other hand posited in their research focused on academic achievement and motivation that males exhibited a higher sense of self-esteem and motivation. Larkin and Abel (1990) attest that compared to female musicians, male musicians experienced lower levels of performance anxiety. As claimed by Iusca and Dafinoiu (2011) and LeBlanc et al. (1997) female musicians sense the presence of the audience as a threat element. A comparable finding was also posited by Şentürk and Çırakoğlu (2013). It was likewise claimed that compared to female performers, male performers had lower levels of state trait anxiety and performance anxiety.
Crain and Bracken (1994) found that as people get older, they interact with a lot of new people in new environments they enter, acquire new experiences and find chances to assess their behaviors in line with successes and failures and reactions from other people. As result of these different learning experiences, people develop differentiated self-concepts.
Arslan et al. (2010) found that there was a significantly positive relationship between the life satisfaction and self esteem of the Turkish University students. This result suggests that as the self esteem of adolescents increase, life satisfaction also increases. It shows that self esteem effects different part of psychological areas of education.
Another finding of this study is that with respect to students' personal instruments at school, their music performance anxiety levels differed significantly. According to the results of the test conducted to identify which instrument groups exhibited a significant difference, the anxiety level of students playing the piano as their personal instrument at school was lower. The underlying reason is that as the preliminary instrument in music education, the piano is one of the instruments that can be used in solo as well as duo (partnered) performances. Hence regardless of being stringed or wind or sound performances, it is noticeably difficult for other instruments to take the stage rather than the piano. This might be related to the idea that since pianists have a greater number of stage experiences they exhibit lower anxiety levels.
Another finding of this research is that there is a negative relationship between students‟ “musical self-confidence” and “musical performance anxiety ” scores,
which is quite an unexpected finding since a general outlook on the case underlines that a performer with a higher sense of musical self-esteem should be less anxious during actual performances.
On the other hand a list of studies posited that “Musical Performance Anxiety” left such irreversible effects on the career of musicians that some had to discontinue their careers. Çırakoğlu (2013) attests that on the basis of international studies conducted so far, it can be argued that behavioral techniques and cognitive behaviorist therapy are beneficial and far more effective compared to similar techniques serving the same purpose.
Yağışan and Arslan (2014) found that the students receiving musical instrument training have higher happiness and satisfaction, popularity perceptions, more positive perceptions in terms of behavior and compliance and less anxiety compared to the students not receiving musical instrument training. The result of this study indicates that receiving musical instrument training is influential on students in terms of enabling them to have psychologically positive feelings about themselves. This result supports the results of study.
Kendrick et al. (1982) in their study revealed the results of Cognitive Behaviorist Therapy that was conducted amongst fifty-three virtuosos (pianists) with musical performance anxiety problems and the virtuosos in the control group not performing on stage and undergoing therapy. The results found that no significant difference existed between the test and control groups. On the other hand. a five-week monitoring program conducted on the identical group showed that compared to the control group, participants in the Cognitive Behaviorist Therapy group exhibited a significant fall.
Among a range of methods serving the same purpose it would be a better option to analyze the techniques most favorable for the personal life, social life and work life of the individual. Revesz (2001) maintains that the core problem in music psychology is the recognition of music as one definition of musical creativity. Another issue is that this problem is deemed to be a stimulant evoking musical emotions and expressions. In sum, the psychology of music is embedded and developed around “performance” in all domains of music. In that sense it would be a more logical approach to initially define this domain prior to evaluating individual-based physical and psychological problems experienced during the performance.

1296 Educ. Res. Rev.
In parallel with the findings obtained and references from the relevant literature, it can be reasonably suggested that since lack of self-confidence among students and prospective teachers in the field of professional music education is a psychosomatic disorder, Psychological Counseling and Guidance Departments in the faculties of education could organize related scientific conventions and seminars to remedy this problem, which triggers a negative effect on students driven to the problem of lower self-esteem in professional and personal life.
Another alternative suggestion is that in order to eliminate or alleviate anxiety factors that cause a negative effect on stage performance several methods such as biofeedback, meditation and yoga, Alexander technique, hypnotherapy and music therapy to remedy musical performance anxiety should be considered (Quot and Çırakoğlu, 2013). Conflict of Interests The authors have not declared any conflict of interests. REFERENCES Arslan C, Hamarta E, Uslu M (2010). The relationship between conflict
communication. self-esteem and life satisfaction in University students. Educ. Res. Rev. 5(1):31-34.
Arslan C, Dilmaç B, Hamarta E (2009) Coping with stress and trait anxiety in terms of locus of control: A study with Turkish university students. Social Behavior and Personality: Int. J. 37(6):791-800).
Austin JR (1988). The effect of music contest format on selfconcept. motivation. achievement and attitude of elementary band students. J. Res. Music Educ. 36:95-107.
Bilen S (1995). Effect of accompanying learning over music teaching and motive processes.. Unpublished doctorate thesis. Dokuz Eylül University. Social science institution.
Cheung Hoi Yan (2006). Factors affecting the state anxiety level of higher education students in macau: the impact of trait anxiety and self-esteem. Assessment and Evaluation in Higher Education. 31(6):709-725.
Crain RM, Bracken BA (1994). Age. race and gender differences in child and adolescent self-concept: Evidence from behavioral-acqusation. context-dependent model. School Psychol. Rev. 23(3):496-511.
Çırakoğlu OC (2013). Enemy on the stage: Revision for performance anxiety for musicians. Turk. Psychol. Articles 16(32):95-104.
Clarke EF (2001). Meaning and specification of motion in music. Musicae Scientiae 5(2):213-234.
Hargreaves DJ (2001). The developmental psychology of music. Cambridge University Pub. 272 p.
Harter S (1992). The perceived competence scale for children. Child Dev. 53:87-97.
Kendrick MJ, Craig KD, Lawson DM, Davidson PO (1982). Cognitive and behavioral therapy for musical performance anxiety. J. Consult. Clinical Psychol. 50(3):353-362.
Kenny DT (2006). Music performance anxiety: Origins. phenomenology.
assessment and treatment. Context. A J. Music Res. 31:51-64 Kemp AE (2002). The education of professional musician. Psychol.
Music 10(2):48-58. Larkin KT, Abel JL (1990). Anticipation of performance among
musicians: Psychol. Music 18(2):171-182. Leondari A, Syngollitou E (1998). Academic achievement. motivation
and possible selves. J. Adolescence 21(2):219-222. LeBlanc A, Jin YC, Obert M, Siivola C (1997). Effect of audience on
music performance anxiety. J. Res. Music Educ. 45(3):480-496. Lendon GH (1982). I played the drum. when the class sang. Music
Educators J. 68(6):36-37. Özgüven İE (1998). Psychological Tests. Ankara: PDREM publication. Revesz G (2001). Introduction to the psychology of music. Norman.
Oklohoma: University of Oklahoma Pre. Şentürk ÇG, Çırakoğlu OC (2013). Development of a performance
anxiety scale for music students. Med. Problems Perform. Artists 28:199-206.
Schmuck AR, Schmuck AP (2001). Group processes in the classroom (8. Edition). Hightstown: The McGraw-Hill Companies.
Tallis F (2003).Surpassing anxieties. İstanbul: Sistem Publication. Tokinan B (2013). Kenny Müzik Performans Kaygısı Envanterini
Türkçe‟ye Uyarlama Çalışması. Ahi Evran University Kırşehir Eğitim Fakültesi Dergisi (KEFAD) Cilt 14(1):53-65.
Yağışan N, Arslan C (2014). Comparison of Self-Concepts of Secondary School Students Receiving and not Receiving Musical Instrument Training. Online J. Counsel. Educ. 3(1):28-41.

Vol. 11(14), pp. 1297-1301, 23 July, 2016
DOI: 10.5897/ERR2015.2295
Article Number: 48FB85759518
ISSN 1990-3839
Copyright © 2016
Author(s) retain the copyright of this article
http://www.academicjournals.org/ERR
Educational Research and Reviews
Full Length Research Paper
Numerical implementation of indicators and statistical control tools in monitoring and evaluating CACEI-ISO indicators of study program in industrial process by
systematization
Gabriela Cota Ayala1* Francia Angélica Karlos Real2 and Ramirez Alvarado Edqar Ivan2
1Carrera de Ingeniería Industrial, Instituto Tecnológico de Chihuahua II, Avenida de las industrias 11101, Complejo
Industrial Chihuahua, Chihuahua, Mexico. 2Procesos Industriales, Universidad Tecnológica de Chihuahua, Ave. Montes Americanos 9501 Sector 35 Chihuahua,
Chihuahua, C.P. 31216, Mexico.
Received 28 October, 2015; Accepted 17 November, 2015
The research was conducted to determine if the study program of the career of industrial processes Technological University of Chihuahua, 1 year after that it was certified by CACEI, continues achieving the established indicators and ISO 9001: 2008, implementing quality tools, monitoring of essential indicators are determined, flow charts are developed and introduced to strengthen the quality management system, the website was designed to systematize finally implemented for each requirement primary control indicator and their respective metric to measure performance and determined that 17 indicators are being met extensively, five indicators were moderately satisfied and 3 indicators are not met, it has a 12% failure of the primary indicators measured during the study period 2014-2015. Key words: Accreditation Board of Engineering Education (CACEI), ISO 9001: 2008, tracking.
INTRODUCTION There are three models of evaluation in higher education, according to four basic variables: The purpose of the evaluation, the reference and basis for assessing the extent of the evaluation and the main models or procedures in the system. It also describes three basic models of quality assessment: The American model, the continental European model and the British model.
The American model basically attempts to improve the
institutional program and provide assurance to the public. The assessment scope leans towards the achievement of corporate goals, evaluating entire institutions as scheduled in education, research and administration are included. The peer evaluation rarely focuses on degree and qualification standards.
Around the European continental model, improvement and quality are defined not only to the public assurance
*Corresponding author. E-mail: [email protected].
Authors agree that this article remain permanently open access under the terms of the Creative Commons Attribution
License 4.0 International License
1298 Educ. Res. Rev. but the government. The reference for assessment is basically the expectations of the association; the evaluation is primarily the academic program, rather than administrative services and structures. The main method used is the external peer review team. The British model emphasizes the maintenance of standards of qualifications and the establishment of quality criteria. The basic procedures are those of the peer evaluation and use of performance indicators.
These models mentioned above are related to the models that are used here in Mexico because the importance of quality is therefore essential to evaluate and determine the logistics of that measurement (Royero, n.d.).
One way of evaluating the quality of education is based on the implementation of indicators by which you can determine the efficiency of performance of any activity within the educational process. That is why this research aims to develop indicators and their respective metric in order to make the educational process as well as all support processes that are involved in college education more efficient. This coupled with the efficient increases if indicators are evaluated; a certification is estimated in ISO 9001: 2008 and a certification of CACEI by this indicator is more efficient. Basic quality tools implementation is seek with this research in order to follow up and to create a culture of quality to continuous improvement in the educational process.
In Mexico in 1994 is founded Consejo de Acreditacion de la Enseñanza de la Ingenieria (CACEI), by the National Association of Colleges and Schools of Engineering agreement. At first it was a civil association formed in plural form; it is involved with professional practice and forming of engineers.
In almost 17 years of its foundation CACEI takes an intense and fruitful activity establishing the methodology for accreditation processes and implementing various programs in almost four branches of engineering. To CACEI the essential indicators (25) are those that determine the essence of an object or process. Compliance must ensure compliance of the same for the existence of a good quality of a program. (CACEI, 2011)
ISO (International Organization for Standardization) is a worldwide federation of national standards bodies (ISO member bodies). The adoption of a quality management system should be a strategic decision of the organization. This standard promotes the adoption of a process-based approach when developing, implementing and improving the effectiveness of a quality management system, to enhance customer satisfaction by meeting their requirements.
For the ISO 9001: 2008, a quality management system is a set of interrelated and coordinated activity used to direct, control and improve an organization’s quality (IMNC, 2008).
Tools of Quality Management provide a means to implement processes of quality control, monitor these
processes and solve any problems arising from them (Paul, 2000). Ishikawa diagram is a graphical method that relates a problem or effect to the factors or causes that may generate it. The importance of this diagram is that it is obliged to find the different causes that affect the problem under analysis and this way, avoids the mistake of looking for solutions directly without questioning what the real control causes. Control charts are diagrams showing the upper and lower limits of the process to be controlled. A control chart is a schematic presentation of the data over time. These diagrams are constructed so that new data can be readily compared with those obtained from past performance (Barry, 2006). Statement of the problem There is a lack of numerical indicators and use of statistical control tools in monitoring and evaluating the systematization of CACEI-ISO indicators in the industrial process studies program at Universidad Tecnologica de Chihuahua.
Purpose of research
The work aims to establish the minimum criteria of CACEI using basic tools of quality and time series graphics as a control measure in the systematization of CACEI-ISO indicators in order to facilitate monitoring of the study program of industrial processes.
Research question Are there internal indicators that measure and control the primary indicators established for CACEI-ISO accreditation? MATERIALS AND METHODS
This research aimed to create and implement the necessary controls of the key indicators established by CACEI besides determining their efficiency. The sample consists of the principal of industrial process career, a career coordinator, director of finance administration, director of press, broadcasting and cultural activities, general counsel, head of school services, 13 full-time teachers in the morning shift, 19 part-time teachers tutoring in the afternoon shift and 31 teachers.
The methodology followed is as follows
1. Systematization of the minimum primordial indicators with ISO 9001: 2008 by creating website, industrial processes webpage. 2. Unify ISO 9001: 2008 with the guidelines established by CACEI in SGC. 3. Determining the indicators and the Metric Control of the main indicators established by CACEI. 4. Method of Measurement of primordial indicators was stipulated. 5. The measurement results of the primordial indicators are obtained.

Ayala et al. 1299
Figure 1. Industrial processes website.
Content
Opportunities were analyzed within the operational processes of the career; to systematize these processes a website was designed. With this, improvement of procedures improve was realized based on the guidelines of CACEI and basically taking the indispensable minimum indicators. Figure 1 shows the industrial processes website.
The application of ISO 9001:2008 was unified with CACEI to optimize standardization of activities taking place in the process, meet the guidelines performing activities in the process and these activities serve to implement the guidelines established by CACEI; also it serves to avoid duplication of activities to comply with both guidelines. Primary indicators and their respective metric used 1. Development plan indicator (annual) = development career plan document presented by career management. Metric: submission in the first two months of the year. 2. Academic staff income indicator which is composed of academic structure indicator = Deliver academic structure according to the procedure of SGC. The metric is: academic structure authorized no later than the second week of the third month of the quarter, and hiring index = new academic staff recruitment procedure. The procedure starts the first week of the fourth month of each quarter and ends the third week of the fourth month of each quarter. Their respective metric is hiring new teachers later than the second week of the fourth month of each quarter. It is said that this indicator is met if 90% of new teachers are hired under this scheme. 3. Activity teachers indicator which consists of the implementation of POCT Index = (RPTC activities / total activities RPTC). * 100%. The metric is: (80% of full professors meet RPTC 80% of activities didactic sequences index rating = didactic sequence 90 points minimum value for each teacher with the authorization ensured. Metric: 80% of teachers have the authorization of the didactic sequence and the failure rate = students failed by quarter / semester students enrolled by quarter. Corresponding metric is: 5% or less failure rate each quarter. 4. Teachers’ evaluation indicator will be measured by the evaluation index applied to teacher and tutor = Survey SGC. Surveys are done
by the students of each subject per quarter. It is metric: 80% of teachers who teach in the career of industrial processes have an acceptable minimum average 3.5 in any subject taught, as well as the tutor. 5. Integration of academic staff indicator which is composed of teachers’ index with knowledge related to the career= Number of teachers with related engineering to the career / total of teachers in the career. Metric: At least 70% of the teachers must meet. The Index teachers humanists degree or specialty areas = the number of teachers with bachelor's degree or specialty in humanistic / total area teachers who are in the career. Metric: At least 30% of the teachers must meet. And the index of teachers who are at least 2 years industry experience = number of teachers who are at least 2 years experience in the industry / total teachers who are in the career. Metric: At least 30% of teachers must meet. Metrics are: 70% of teachers must meet the requirements of having a related engineering to industrial processes career, 30% of teachers should be a bachelor's or master's degree in humanistic areas and 30% of teachers should have at least two years of professional experience. 6. Regulations indicator. Students index regulations students= the group receives information about the academic regulations in the second week of classes of the semester. Metric: 90% of tutors provide information to their students about regulations. 7. Objectives and structure of the study program indicator. Index = AST Procedure (every 4 years) first month of year make the AST. Academy meetings index = 2 at least per quarter. Metric: Modify curricula 1 time every 4 years. 8. Graduate profile indicator. When the students make their stay in the productive sector at the end of their studies, control indicator will be the final evaluation of the technical advisor of the company. It is the employer who is in charge of the student when he makes its stay. It is measured when the students are in the industrial sector and the metric is that students have a minimum qualification in stay of 85% in each of the areas evaluated. Graduate profile Index = Number of students who are in excellent or well conditions in the survey of corporate counsel in the SGC / total number of students tested in the SGC profile. Metric: The student must have 90% overall average on what is evaluated. 9. Extension study program indicator is integrated total hours Index devoted to basic science = total hours devoted to basic science / total hours of curricula. Metric: 30% of hours should be devoted to basic sciences. Index of total hours devoted to engineering

1300 Educ. Res. Rev. sciences = total hours devoted to engineering sciences / total hours of the curricula. Metric: 35% of hours devoted to engineering sciences. Index of total hours spent on the application engineering = total hours devoted to engineering sciences / total hours of the curricula. Metric: 15% of hours devoted to engineering sciences.
Index of total hours spent on social sciences and humanities Total = hours devoted to social sciences and humanities / total hours of the curricula. Metric: 12% of hours devoted to engineering sciences. Index of total hours spent on other courses = total hours spent on other courses / total hours of the curricula. Metric: 8% of hours devoted to engineering sciences. Which must meet the requirements established by CACEI which are: 800 h in basic sciences, 900 h in engineering sciences, applied engineering 400 h, 300 h of social sciences and humanities and 200 h in other courses. Responsible for following up this indicator is the career director. 10. Study program content indicator. The table of contents of the curriculum = number of programs was established: the aim, learning activities, literature, props, activities / total number of programs that have established the career. Metric: 100% of programs. 11. Study program review indicator. The study program revised index = study program is reviewed every 4 years by the CGUT career and directors. Metric: At least there is a review of the study program every four years. 12. Degree indicator. Degree index = (graduate students in that period / enrolled students that period) * 100 Metric = 80% of graduates during the period. 13. Indicator of alternative methodologies in the teaching process: this indicator is reached with sequences teaching index = Teaching sequence 90 points minimum value for each teacher with authorization. Metric ensures that 80% of teachers have the authorization of the teaching sequence. 14. Computational tools indicator. The index used is the laboratory use = (current hours used during the quarter / Total hours scheduled during the quarter) * 100. Metric: 80% use the computer lab. 15. Classrooms indicator. The number of classrooms indicator = Number of students reentry + number of students per semester admission of industrial process career / Constant of 35 students per classroom. Metric: have 100% of classrooms for the number of students per semester. 16. Laboratories minimum index of using heavy laboratories = (current hours used during the quarter / Total hours scheduled during the quarter) * 100. Metric: Use 80% of the integral center of the process. 17. Features laboratories indicator. The metric is the existence of a document certifying what should or should not be any changes to the laboratories in the development plan. Index on characteristics of laboratories = Compliance process for making the curriculum of the career of industrial processes. Metric: 100% compliance. 18. Bibliographic index = (related books to industrial process career / total books in library) * 100. Metric: Get 20% of all library books related to the career of industrial processes. 19. Research features and / or technological development indicator. Research index and / or technological development = (research and / or technological development completed during the year / total research agreements and / or technological development) * 100. Metric: Comply with 50%. 20. Computer equipment indicator. The control indicator consists on measuring how many computer equipment corresponding to the assigned students in industrial processes. Index of number of students per machine = number of students enrolled each quarter / number of computers that are available to students in the career of industrial processes. Metric: Maximum 10 students per computer. 21. Vinculation indicator. Visits and / or conferences index = number of visits and / or conferences during the quarter / number of planned groups during the semester attending visits and / or
conference. Metric: 80% of groups who planned visit attend at least one visit and / or conference per quarter. 22. Financial planning indicator. Purchases efficiency index = (orders served on time / orders requested during the quarter) * 100. Metric: Comply with 80% on purchases during the quarter. 23. Terminal efficiency indicator. Terminal efficiency index = (graduated students during the quarter / students registered during the semester) * 100. Metric: Reach 70% terminal efficiency. 24. Degree efficiency. Titling efficiency index = (degree during the quarter / income students during the quarter) * 100. Metric: Get 80% of graduated students. 25. Graduates monitoring indicator. monitoring index = number of graduated students who are being monitoring six months after graduating / total number of students by year. Metric must be monitored 80% of students each year.
Then the measurement in the period 2014-2015 was performed for each of the key indicators in the educational program in which the following results were obtained.
For example in the 4th indicator on evaluation of teachers, Figure 2 shows the control chart of students’ performance in the industrial processes in 2014; teachers had less than 3.5 points, so that 98.18% of the teachers were evaluated above 3.5 on average per field. With respect to the teachers’ evaluation, index it is satisfied.
Another example is graduated profile indicator where students at the end of their studies go to the industrial sector to realize their stay, for four months. The performance in several areas was analyzed in this indicator as shown in Table 1. This shows that this indicator in 2015 is also reached.
RESULTS
40% of the primary indicators index and their respective metric are determined; besides the statistical methodology was established to provide control and monitoring of all primary indicators that operate in the career of industrial processes. Added to this effect is given to the general objective of the research by implementing indicators and metrics on the career of industrial processes such that it is determined that 17 primary indicators established CACEI are being met under the metric previously established. Similarly, 8 of the primary indicators are not widely met; for that reason you have a 68% compliance with the primary criteria in the form of widely and 5 indicators of 8 that are not met are widely displayed corresponding to 20%; the remaining primary indicators corresponding to 3 did not correspond to 12% time.
It is important to point out that the 3 primary indicators are not met: study program extension, contents and review.
These three indicators are fundamental to the educational program because they are the basis of the study of the program; the causes of failure were analyzed resulting in the following: The educational model of the UTs was designed to train college coaches. As time change, this approach and have had much acceptance in society; so it is not fulfilled these three indicators because in 2014 the change of plans and programs of study was not made.
There was a one-year delay since the whole model of UT was analyzed in depth. They changed all programs of study for the contents thereof are designed for

Ayala et al. 1301
Figure 2. Control chart of teachers’ evaluation indicator.
Table 1. Descriptive statistics indicator of graduate profile.
ASESOR EMPRESARIAL Enero-Abril Mayo-Agosto
Nivel de Conocimiento 96% 97%
Capacidad de Innovacion 96% 98%
Se Apega a la Normatividad 96% 100%
Cuenta con Valores 96% 100%
Nivel de Ingles 69.00% 83%
Promedio: 90.6% 95.6%
engineering, as such existing programs suffer a substantial change in all its programs. DISCUSSION The verification of compliance with each of the key indicators was carried out through internal audits that establish Technological University in its program yearly. Quantifying each of the key indicators is evidence of compliance.
It is very important to create a culture of using the basic tools of quality control in order to analyze opportunities for improvement, monitoring trends and be able to prevent possible system failures. Conflict of Interests The authors have not declared any conflicts of interest.
REFERENCES Barry RM, Stair MR, Hanna ME (2006). Mátodos cuantitativos para los
negocios.méxico: pearson prentice hall. ISBN: 970-26-0738-8 CACEI (2011). Manual NMS. México. http://cacei.org.mx/ IMNC NM (2008). Sistema de gestión de la calidad requisitos.
http://www.gestion-calidad.com/archivos%20web/Sistema-gestion-calidad.pdf
ISO (9001:2008). Diagnostic tool implementing quality management systems. http://www.intracen.org/ISO-90012008-Diagnostic-tool/
Royero J (n.d.). Contexto mundial sobre la evaluación en las instituciones de educación superior. Revista iberoamericana de educación.

Vol. 11(14), pp. 1302-1310, 23 July, 2016
DOI: 10.5897/ERR2016.2652
Article Number: EC0F7ED59520
ISSN 1990-3839
Copyright © 2016
Author(s) retain the copyright of this article
http://www.academicjournals.org/ERR
Educational Research and Reviews
Full Length Research Paper
What changes education? An action research to overcome barriers
Yeşer Eroğlu Eskicioğlu
Abant Izzet Baysal University, School of Physical Education and Sports, Bolu, Turkey.
Received 19 January, 2016; Accepted 24 June, 2016
According to the National Disabled People Data Base within Ministry of Family and Social Policies (Özveri), there are 1.559.222 disabled people in Turkey. If this rate would be linked to the families of the disabled people, the number of people who spend time with disabled individuals would increase to 10 million. This number corresponds to 12.5% of the country’s population. This requires sensitiveness from each individual because everyone is either a disabled person, related to a disabled person or a potential disabled person. In this case, the importance of information related to disabled people, acquired by the students in the highest institutions of the education system increases due to the fact that they are future teachers and potential managers. This research was conducted in Abant Izzet Baysal University, School of Physical Education and Sport in order to analyze and understand the effects of disability training on the students. Designed as an activity research, this study took 36 h for 12 weeks. The research was conducted with 15 voluntary students who took Physical Education and Sport for Disabled People and Sport for Disabled People classes. The data were gathered through focus group discussion and field notes. In the analysis of the data, both descriptive and content analyses were used. All of the operations were done by NVIVO 10 qualitative analysis program. Results showed that the students reached almost all phases of the cognitive domain outcomes by acquiring a level of information more advanced than the level they had at the beginning. Furthermore, especially the outcomes at the affective domain revealed that the students became more equipped in this respect. Key words: Disabled people, action research, education, outcome.
INTRODUCTION The right to live is a basic human right and being healthy is a prior condition. Health is not only the absence of illness and disability, but also being physically, mentally and socially well (Arslan et al., 2014). However, some individuals may be disabled and lose health due to prenatal, natalor and post-natal causes.
Many different paths can lead to an understanding of disabilities and their effect on individuals, their loved ones, and their communities. Definitions often put into place a language system that describes individuals and their generalized characteristics. Definitions can also explain how individuals are treated. Definitions, in their
E-mail: [email protected]. Tel: 090 374 254 10 00/2015, 090 532 684 02 72.
Authors agree that this article remain permanently open access under the terms of the Creative Commons Attribution
License 4.0 International License

existence, might even contribute to how people react to others who are different in appearance, learning style or behavior. Often different disciplines offer different definitions of disabilities; in other words, nothing is absolute when studying the human condition. For example, some definitions include analyses of group of individuals’ common characteristics. Other definitions take a more sociological view and discuss how differences are socially constructed and as much a part of social system as is the individual (Smith, 1998).
Disability: any restriction or lack of ability (resulting from impairment) to perform an activity in the manner or within the range considered normal for a human being (WHO, 1980). There are certain roles that an individual should play during his/her lifetime depending on various factors. Unless the individual fulfills these roles due to inability, this inability transforms into an obstacle. An obstacle also includes the adaptation of the individual to the environment. This is because an individual experiences difficulties in adapting to social life due to his/her disability (Aral and Gürsoy, 2011).Human is a social being. Within cultural conditions, social relations affect the form of society, culture and individual. An individual tries to adapt to his/her environment throughout his/her life. Adaptation starts from birth and is a life-long progress (İlhan, 2008).
One of the emotions that pull up a person’s vital motivation is the feeling of “being useful” and the results of this feeling. In cases when disability causes reduction in abilities in different levels or continues as an ongoing illness, the person passes from the state of having a medical problem to having the beginning of a psychological problem, and the expectation related to the willingness for “the feeling of being useful” can become more intense. This transfer expresses a change of which solution should be found in society. The health level of disability is taking the obstacle and disability as personal problems and configuring the solution individually. But, social environment, physical structure, beliefs, opinions, sensitiveness, levels of understanding and levels of perceiving, composed by the people who are in interaction in different levels in social domain are influential and the solutions may not be always in the desired level, time and footing (Çolak and Çetin, 2014).
Poverty is common among disabled people because their education level is very low, they have limited opportunities for getting a profession and only a minor number of them are working. For this reason, their social and economic conditions can be defined generally as “social disaster.” Attending social life is a difficult process for the disabled people and generally it is known that they are exposed to social exclusion. Social exclusion and discrimination in every field of social life have negative effects over the means of getting education, profession and income by disabled people. They face inequality in education and job opportunities and thus they cannot reach influential decision making bodies for the social life
Eskicioglu 1303 and cannot have enough influence over the decisions that affect them (Mamatoğlu, 2015).
Disabled people experience social exclusion multi dimensionally, and although practices for social inclusion are increasing, there is still a long way to go before we obtain permanent solutions (Kökten and Erdoğan, 2014). Disability is a social exclusion factor. For disabled people, being precluded from social relations, cultural and social activities, having access to basic services, close environment and economic field is seen as a secondary obstacle. In societies where different groups live at peace with each other, solidarity and cooperation grow stronger. Supporting disabled people when their individual abilities remain incapable increase their success level; developing and applying comprehensive social inclusion policies, which will remove the elements that force them to live distant from social life, will cling them to life (Genç and Çat, 2013).
When thought, belief and emotions about disabled people indicate that they are perceived as humans first and then as humans with different needs, it shows that the attitudes are positive. On the other hand, when thought, belief and emotions about disabled people indicate that they are seen with their incapability and then as humans, it shows the attitudes towards disabled people are negative (Özyürek, 2006).
The idea that the attitude of society towards disabled people plays an important role in the development of services, quantitatively and qualitatively, for disabled individuals in their acceptance and inclusion within the society is advocated. It is also seen that the attitudes of disabled people’s close relations are emphasized in our country and abroad (Diken and Sucuoğlu, 1999).
As disabled psychotherapist Rhoda Olkin (1999) stated disabled people (all of the minority groups) faced “prejudice, discrimination and stigma” everywhere. There are not many people either among political and social power holders or in media and art fields to represent disabled people who have limited opportunity to access economic sources and who are traditionally underrated by “non-disabled” majority. However, World Health Organization approaches the concept of disability as “Participation in Activity”, and suggests focusing on what disabled individuals can do more than what they cannot do. In short, disabled people, who are also weak in terms of social status, are deprived of all of the important opportunities. For this reason, this feeling of “social” exclusion existing despite all of the legal regulations and legislations, causes violations of social rights of disabled people and prevent them from being acknowledged as equal individuals. “International Covenant Related to the Rights of Disabled People” and “United Nations International Covenant on Economic, Social and Cultural Rights”, to which Turkey is a party, clearly expresses taking all kinds of necessary measures for preventing the violations of the rights of disabled people. However,

1304 Educ. Res. Rev. despite this, disabled people are perceived as not “normal” people, but instead “handicapped” and “deficient” individuals who damage social status of the family they belong to (Sachs, 2003).
In parallel with the development of the concept and awareness of citizenship, it should be emphasized that disabled people have the same social, economic and political rights with the rest of the citizens in the society under the concept of citizenship. This understanding is fundamental for disabled people to maintain free and honorable life (Burcu, 2007). METHODOLOGY Research model This research was an activity research based on qualitative research approach. The aim behind using activity research with qualitative methods was the lack of flexible structure and generalizing goal in qualitative research (Yıldırım and Şimşek, 2013). The research was planned as an activity research with emancipating/enhancing/critical science made approach. With this approach the participant students would provide new information, ability and experience about disabled people, and develop a critical point of view against current practice. In this approach the participants can look critically to the practice they live within and can state informed explanations to the problems they face. Moreover, activity researches are used frequently in education. In this respect, conducting this research within the scope of “Physical Education and Sport for Disabled People” and “Sport for Disabled People” classes was compatible with the design of activity research. Elliot (1991) stated that activity researches greatly contributed to the development of practices in the field of education through research by bringing together program development and evaluation, research and thinking (cited by Yıldırım and Şimşek, 2013).
The purpose of the research
It requires a transformation for the society to acquire this understanding, and sensitiveness towards disabled people. Education is an important tool for this transformation. This reveals the need of educating individuals in the society about disabled people and disability. In this case, the importance of information related to disabled people, acquired by the students in the highest institutions of the education system increases due to the fact that they are future teachers and manager candidates. Several departments on university level train professionals to provide service to disabled people. One of these departments is School of Physical Education and Sport. It is a legal obligation to train students especially in the field of teaching physical education about disabled people. Besides that, there are several obligatory and elective classes about disabled people in the programs in different departments of these schools. The aim of this research is to analyze and understand the differences created by disability training in Abant Izzet Baysal University School of Physical Education and Sport over the students.
Participants This research was conducted with 15 students taking “Physical
Education and Sport for Disabled People” and “Sport for Disabled People” classes in the fall semester of 2014-2015 academic year. In the determination of students, easily accessible case sampling within purposeful sampling methods was used in accordance with the nature of qualitative research. Easy case sampling gives speed and practicality to the researcher. In this respect, the researcher conducted the research with volunteer participant students. 47% of the participants were physical education and sport students and 53% were sport management students. 33% of them were females and 67% were male students. Collecting data The method of collecting data in the research was “focus group discussion”. This discussion approach was chosen because it allowed the researcher freedom both to obtain detailed information about the questions and to ask further questions, by remaining faithful to the issues and questions which had been prepared earlier (Yıldırım and Şimşek, 2011). Moreover, the researcher, as the instructor of the course, undertook the role of “participant observer” and took notes about researcher observations. Four separate focus group discussions were carried out during the activity (application) process, which took 12 weeks; two at the beginning of the process and two at the end. Pre-application focus group discussions were carried out separately with the students at physical education and sport department and sport management department. Information about the number of participants in focus group discussion and duration of discussions are given in Table 1.
The number of questions is limited in accordance with the nature of application in focus group discussions. These questions focused on information and perception related to disabled people pre-application, and information, ability and experiences related to disabled people outcome post-application.
Data were recorded via tape recorder after obtaining permission from participants. As Creswell suggested (Creswell, 2009) researcher took short notes besides tape recorder. Activity (Application) plan
Activity research is process-driven. The process is studied within its own environment and data related to the focused problem are collected. In this process, understanding the problem, applying solution choices and evaluating the results are within activity research process (Yıldırım and Şimşek, 2013).
Context and procedures of the study
This research was carried out for 12 weeks in the scope of “Physical Education and Sport for Disabled People” and “Sport for Disabled People” classes. Physical Education and Sport for Disabled People class is obligatory in the Department of Physical Education Teaching in the School of Physical Education and Sport (PES) at Abant Izzet Baysal University (AIBU); and Sport for Disabled People class is obligatory in the Department of Sport Management. The classes are given at the VII semester in the Department of Physical Education and at the V semester in the Department of Sport Management. It is a 36-h class in both departments. Within this process theoretical section of the class is given by the instructor and the practice section is carried out by the students under the guidance of the instructor. In the end of the process, the expectation is to provide students, who will be teachers or managers, with the opportunity to work with disabled individuals without difficulty when they need to, and at the same

Eskicioglu 1305
Table 1. Number of participants and duration of discussion.
Pre-application Post-application
Focus Group (PES) Focus Group (SMS) Focus Group (PES) Focus Group (SMS)
Number of participants 7 8 7 8
Duration of discussion 30 mn 22 mn 33 mn 35 mn
Table 2. Activity (Application) plan.
Week Application phases Application details
1. Week Definition of handicapped – disabled, reasons for disability, prevention, meaning and importance of physical education and sport for disabled people
Presentation prepared by the Instructor
2. Week Opportunities of education and employment for disabled people, classification in disabled people
Presentation prepared by the Instructor
3. Week Mentally challenged Presentation prepared by the Instructor
4. Week Visually Impaired Presentation prepared by the Instructor
5. Week Speech handicapped and hearing impaired Presentation prepared by the Instructor
6. Week Orthopedically handicapped Presentation prepared by the Instructor
7. Week Other handicapped groups (Posture Disorders) Presentation prepared by the Instructor
8. Week Other handicapped groups (emotional and behavioral disorders, learning disability)
Presentation prepared by the Instructor
9. Week Sport organizations for disabled people (IPC and Private Olympics)
Presentation prepared by the Instructor
10. Week Hydrotherapy- Hippotherapy Presentation prepared by the Instructor
11. Week Working with disabled groups Physical activities, branches of sport and applications in different disability groups (prepared by the students)
12. Week Working with disabled groups Physical activities, branches of sport and applications in different disability groups (prepared by the students)
time positive attitude and behavior towards the disabled people. The researcher prepared the syllabus, informed the students who
took the class about the research and designated the ones who volunteered to participate at the research before the activity. Following this phase, first focus discussion was carried out with the students who would participate at the research. All the details related to activity (application) phase following the phase before the activities are given in Table 2. This application was carried out in the same manner with the students in both departments. After the activity, the researcher evaluated the results of the application presented by focus group discussions. Data analysis Descriptive analysis and content analysis were used in the research. In descriptive analysis, the data obtained via tape recorder was processed by the researcher expertized in qualitative research, and transferred into electronic environment. Moreover, the findings were checked for consistency with short notes kept by the researcher. In this phase participant students in the department of physical education teaching were coded as (PES9, PES10...), and students in the department of sport management as (SMS1, SMS2…). In content analysis of data, primarily the data obtained at focus discussion was transformed into prose in computer environment. Then this data were transferred into NVIVO 10 program. After this
phase, all of the operations were carried out with NVIVO 10 qualitative analysis program. In recent years, computer programs like NVIVO have been used frequently in qualitative researches. NVIVO makes it easy to classify and code data and sources systematically, reach themes, and present the results as a model.
All of the operations during the process of analyzing data were carried out by two experts, who were experienced in researcher and qualitative analysis, independent from each other. The statements matching up with each other in coding were classified in a theme. The study was supported with quotations from participants’ observations. Validity and reliability Lincoln and Guba (1985) suggested the usage of concepts like persuasiveness, transmissibility, consistency and approvability in order to secure validity and reliability (cited by: Yıldırım and Şimşek, 2013).
Persuasiveness (inner validity) was ensured through methods like long term interaction, diversifications and gathering profundity oriented data, expert analysis and approval of the participant. The researcher had been directing the physical education and sport class for disabled people for ten years, had attended various seminars about disabled people, taught educational games for disabled people towards youth leaders within the ministry of sport,

1306 Educ. Res. Rev.
Table 3. Thought about disabled people.
Theme Statements Participants
Empathy (f=6) ... You think how hard life is for the disabled people outside. PES9
Lack of empathy (f=3) … I think we cannot understand this kind of situations unless it happens to us. SMS1
Life experience (f=4) ... I cannot seat at nights. That is why I can understand them better. I have night blindness. It depresses me and I cannot stay in dark environments alone.
SMS2
Pity (f=3) ... I am moved to tears immediately when I see one of them. PES12
Table 4. Knowledge.
Theme Statements Participants
Employment rights (f=5) … I know about employment and that they can be officers at state institutions”, “I know that a workplace with a specific number of employees has to employ disabled people.
PES12
Education form (f=2) … There was an inlusive student in the school where I did my internship. She was somehow distant during class. We tried to include her.
PES9
and was a member of the board of education in federation of visually handicapped people. These factors were influential in enabling the researcher to understand the situations caused by subjective perceptions on data sources by strengthening long term interaction with the field. Moreover, besides focus group discussions, field notes, which the researcher had kept during the activity as a participant observer, provided data diversity in obtaining data and increased reliability of the study (Tobin and Begley, 2004; Briller et al., 2008; Bekhet and Zauszniewski, 2012).
When it comes to about persuasiveness, finally an expert’s support was received for qualitative data during the research. Among purposeful sampling methods, easily accessible case sampling was used in the research in order to strengthen transmissibility (external validity) feature, adopted instead of generalizing in qualitative data (Yıldırım and Şimşek, 2013).
For the consistency of research (inner reliability), data were analyzed and themes were created by the researcher and two field experts. “Unanimity” and “dissensus” statements were defined for codes and themes determined by the researcher and field expert. Reliability formula of Miles and Huberman (1994) was used for the reliability calculation of the research. Conciliation Percentage % =[Na (Unanimity)/ Na (Unanimity) + Nd (dissensus)] x 100 Unanimity for total statements was determined as 29 code, and dissensus was 10 code According to Miles and Huberman (1994)’s formula, reliability of the research was 74%. If reliability calculations are over 70%, the rate is valid for the reliability of the research (Miles and Huberman, 1994).
For the approvability of the research (external reliability), the researcher preserved all of the data collection tools, raw data, coding during analysis phase for the purpose of re-analysis when needed.
FINDINGS
Findings are presented in two chapters; before the application and after 12-week activity in accordance with the scope of research. In the tables repetition in answers
of students are shown with the respective numbers (e.g. f=5). In this way, it was much easier to classify the opinion codes in numbers.
Finding about pre – activity
In pre-activity phase of the research, the participants were asked; “what are your thoughts about disabled people?”, “what do you think about the opinions in the society about the disabled people?”, and “what are your expectations from this class?” The findings at the end of the analysis of collected data are presented under the chapters of thoughts about the disabled people, knowledge, society’s opinion and expectations from the class.
All of the themes and codes revealed at the end of the data analysis are as shown in Tables 3, 4, 5 and 6.
Findings about post-activity
During post-activity, students were asked “How much of your expectations was fulfilled at the end of 12-week training?”, “what do you think you know about disabled people now?” and “what do you think you have earned at the end of this training?” Findings revealed as a result of the analysis of collected data were presented as cognitive, affective and psychomotor outcomes. All of the themes and codes revealed at the end of data analysis are as shown in Tables 7, 8, and 9. DISCUSSION Thoughts about disabled people revealed in the first part

Eskicioglu 1307
Table 5. Perspective of society.
Theme Statements Participants
Lack of education (f=12)
... I do not think I have information about disabled people. I am a university student but I have not yet got education on it. None of the education division has offered such information.
SMS8
Disrespect (f=8) … for example there are roads for disabled people on sidewalks but I read that they park cars on those roads in a newspaper.
SMS2
Undervalue (f=6) … I do not know much about it but I think we do not value as much as the people abroad. PES11
Inequality (f=5) … I think appropriate conditions to benefit the disabled people are created in our country. I think they are not equal neither in terms of roads nor in terms of finding a job, they are not given equal rights.
SMS1
Awareness (f=3) … We know as much as we learn through experience. We learn when we encounter a situation.
SMS1
Mistreatment (f=2)
… Now, including rehabilitation centers, it is about material gain. They just seem caring. I watched a swimmer coach beat a swimmer with Down syndrome again in the news.
SMS7
Excluding (f=1) … First of all we exclude disable people directly or indirectly. Because they are excluded, they cannot do a lot.
SMS6
Prejudice(f=1) … I am not sure if it is my deficiency or transferred to me from my parents but I am prejudiced. I say ‘Disabled? How is he/she going to do it?’ I think disabled people are disadvantaged.
SMS5
Acceptance (f=1)
…There was an orthopedically disabled girl in the school where I did my internship. She was an inclusive student. The students in the class accepted her nicely. With the society’s acceptance, the girl became more self-confident.
PES12
Table 6. Expectations from class.
Theme Statements Participants
Gaining awareness (f=8) … I expect this class to create awareness in terms of the things that I cannot see or I cannot think. I expect that it will earn me the ability to think about disabled people .
SMS1
Behavioral instructions (f=4) … I want to learn what I can make them do when I face them. PES15
Working with disabled people (f=3) … I wish theoretical education were given before and we could practice
in this field when we are at universtiy. SMS6
Getting information (f=1) … I think classes will be intense. I think we will think about disabled people and acquire information.
PES11
of the research, society’s perception and lack of information about the field seem to be consistent with unawareness, level of information and lack of education. Thomson (1997) defined disabled people as “inferior unlucky individuals” in the society. This opinion arose from the negative perception that evoked dominant ideas, widespread and fear about disabled people who were seen as worthless, suspected and disregarded people, whose social identities were labeled with prejudice (cited by: Aslan and Şeker, 2011). Disability can be seen as an inferiority, personal misfortune, abnormal and extraordinary (Sachs, 2003).
The results of the researches conducted separately by Prime Ministry Department of the Administration of the Disabled (1997) and Burcu (2010) showed that the perception in Turkey about disabled people is not very
different than the perception defined by Thomson (1997) (cited by: Arslan and others, 2014). Cognitive outcomes in the end of research match with the studies in this field.
Through informing, individuals communicate easier with the disabled people and generalize their information and experiences about one disability group for other groups (Campbell et al., 2003). Cameron and Rutland (2006) reached a conclusion that a program based on communicating with disabled people, applied at primary school students, decreased prejudices towards disabled people.
Pruett et al. (2008) also reached the conclusion that the attitudes of elderly participants changed positively. Campbell, Gilmore and Cuskelly (2003) informed candidates of teachers, before they started working as teachers, about children with Down syndrome. After the

1308 Educ. Res. Rev.
Table 7. Cognitive outcomes.
Theme Statements Participants
Comprehension (f=18) … I thought there were some sports that they could not do. I saw they could. PES10
Awareness (f=11)
… I realized the importance of this class. I acquired a completely different awareness. I saw the difference in points of view about disabled people between the ones whose awareness had changed after the class and the ones who did not take the class.
PES12
Change in point of view (f=6)
… I generally felt pity about them. My perception has changed. Now I see them as individuals.
PES15
Gaining information (f=6) ... There was a scientific contribution of the class. I learned about different illnesses. I learned about birth. I learned that there are several opportunities for disabled people. I know the roads specified for them.
PES14
Problem solving (f=4) … I learned how I needed to face and behave if I have a disabled child. PES9
Questioning (f=2) … I learned that there weren’t any space for disabled people, and now we can ask the reasons for the lack of space.
SMS8
Understanding professional liability (f=1)
… We learned that as physical education teacher we could understand best. I realized that we needed to care.
PES11
Searching job opportunities (f=1)
... I also started searching about what I can do and what I need to do. I think there are job opportunities for me about my field.
SMS7
Table 8. Affective outcomes.
Theme Statements Participants
Being sensitive (f=17) … We became more tender and sensitive. But it is not pity, let’s say awareness.
SMS6
Desire to teach disabled people (f=6)
… I applied for a summer job about autistic people after this class. I will spend the summer by working with them.
PES12
Awareness (f=5) … I now pay more attention to disabled people in the news and newspapers.
SMS6
Empathy (f=3) … We can be disabled any time. SMS8
Communicating with disabled people (f=3)
… My friend has a disabled sibling. He/she cannot move and has difficulty in talking. I did not want to talk to him/her a lot in the past. It is too difficult to understand his/ her speech. Now I want to talk more.
PES11
Self-confidence (f=3)
… It would be too difficult for me to be a coach of a disabled person 14 weeks ago. My knowledge about coaching would not be enough. But nor it has changed. The most important thing I have now is self-confidence
PES10
Being respectful (f=2) … I am now more respectful to their spaces. PES13
Desire for self-development (f=2)
… I am thinking to get certificates related to this issue. I want to learn more. I research more.
SMS5
Moving away from prejudices (f=2)
… I used to say, when I look at disabled people, that guy couldn’t achieve that. I had that prejudice. This prejudice was broken down after I watched the characters did and achieved in the movies about disabled people.
PES9
Enjoyment (f=1)
… When communicating with speech handicapped individuals or stutterers, you dictated that we needed to wait for them to finish and be patient. It happened to me, I waited for him/her to finish speaking, tried to listen and I enjoyed it.
SMS5
experiment, it was observed that the attitudes of teachers who took this training change positively towards children with down syndrome and disabled people in general, and
the discomfort they felt while communicating with disabled people decreased.
It is revealed that visual data given in Examination of

Eskicioglu 1309
Table 9. Psychomotor Outcomes.
Theme Statements Participants
Acting in (f=3) … There are ramps for disabled people at the entrance of stores, malls. I had been obsessed since childhood with walking over those ramps. Since this class I have never done that. I do not use them anymore.
PES10
Attending activities (f=1) … We attended activities related to disabled people, to see what is done. SMS3
Physical Education Teacher Candidates’ Attitudes towards Individuals with Physical Disability by Visual Information by Fethi (2015) did not influence the behaviors of teacher candidates towards disabled people, an outcome acquired in contrast with this study.
It is understood that especially affective outcomes increased in post-activity when compared with pre-activity. The research showed that education-oriented applications about disabled people could create change in affective field, one of the behavioral fields. Because the students decreased their prejudices relatively to pre-activity, they became more sensitive and more efficient in communicating with disabled people, and enjoyed it.
Becket (2009) emphasized that education was an important factor in changing behavioral attitude towards disabled people in UK in her study Challenging disabling attitudes, building an inclusive society’: considering the role of education in encouraging non-disabled children to develop positive attitudes towards disabled people. Healy et al. (2016) reached the conclusion that education and experience had essential influence in preparing physical education teachers for future encounters with the autistic children in their study.
Kargın and Baydık (2002) realized that inclusive education was effective in attitude change in their study which analyzed students’ attitude towards hearing-impaired students, and suggested strengthening communication system with disabled individuals in educational environment. When other studies related to attitudes and values towards disabled people in society are considered, similarities are revealed with the results of this study.
In the study of Aktaş and Küçükler (2002), which analyzed social acceptance levels of primary school students towards their physically disabled peers, it was observed that an attitude changing program with cognitive and affective base was influential in developing primary school students’ social acceptance levels towards their physically disabled peers. For example, Graf et al. (2007) reached the conclusion that in the families where a member was disabled, although the attitude of families was positive towards disabled individuals, they saw those individuals as in need of family care.
Other conclusions of the research were that the families wanted to spend time with disabled people, disabled
members were not ashamed of their families, the feeling of discomfort was low in the company of disabled people, it was necessary to be nice towards disabled people and to excuse them for uncontrolled behaviors, but on the other hand that the belief in a better future and success for disabled people was limited.
In a research of Wolman et al. (2004), which analyzed the attitudes of faculty members towards disabled people, it was found that American faculty members were more positive towards disabled people, and their opinions about the professional development of visually and hearing impaired people were more affirmative when compared with the opinions of Mexican colleagues.
Diken (2006)’s study on Turkish mothers revealed that some of the Turkish mothers with mentally disabled children believed that the disability was temporary, and that almost half of them believed disability was fate and a decision of God due to their belief. Laat et al. (2013) reached the conclusion that age, self-respect, gender, religion and familiarity with disabled people had essential influence on behaviors towards disabled people in their study conducted on German students. The results of the study showed the desire to transfer the acquired information to life. These behaviors outcomed through education created a desire in the participants to put them in practice. These opinions were gathered under psychomotor outcomes at the end of the study. In this respect, the importance of education in behaviors was revealed.
To sum up, this research aimed to reveal the change created by an application for students about disabled people, in universities as they were taken as the highest level of education in our country, and in this respect to emphasize the importance of education for individuals by handling the lack of education about disabled people as the starting point.
The results of the research showed that the students reached the outcomes in almost all phases of cognitive field by reaching a further level of information level after the activity, relative to their level at the beginning. Moreover, especially the outcomes in affective field revealed that the students became more equipped. The results showed that trainings towards disabled people are beneficial in terms of outcomes and should be taken in earlier ages. This situation might be influential in removing negative opinions of societies towards disabled people.

1310 Educ. Res. Rev. SUGGESTIONS Since this research is a qualitative study, its results cannot be generalized. For this reason, repeating this study, which was conducted with the students of School of Physical Education and Sport and on university level, with participants in different age and groups might be more influential in seeing the influence of training applications towards disabled people. Conflict of Interests The author has not declared any conflicts of interest. REFERENCES Aktaş C, Küçüker S (2002). Bilişsel - Duyuşsal Odaklı Bir Programın
İlköğretim Öğrencilerinin Fiziksel Engelli Yaşıtlarına Yönelik Sosyal Kabul Düzeylerine Etkisinin İncelenmesi. Ankara Üniversitesi Eğitim Bilimleri Fakültesi Özel Eğitim Dergisi. 3(2):15-25.
Aral N, Gürsoy F (2011). Özel Eğitim Gerektiren Çocuklar ve Özel Eğitime Giriş. Ankara : Morpa Kültür Yayınları.
Arslan Y, Şahin HM, Gülnar U, Şahbudak M (2014). Görme Engellilerin Toplumsal Hayatta Yasadıkları Zorluklar (Batman Merkez Örnegi” Batman Üniversitesi . Yaşam Bilimleri Dergisi. 4(2):1-14.
Aslan M, Şeker S (2011). Engellilere Yönelik Toplumsal Algı Ve Dışlanmışlık (Siirt Örneği). III. Sosyal Haklar Uluslararasi Sempozyumu. Kocaeli Üniversitesi.
Becket AE (2009). Challenging disabling attitudes, building an inclusive society’: Considering the role of education in encouraging non-disabled children to develop positive attitudes towards disabled people. Bri. J. Sociol. Educ. 30(3):317-329.
Bekhet AK, Zauszniewski JA (2012). Methodological triangulation: An approach to understanding data. Nurse Res. 20(2):40-43.
Briller SH, Meert KL, Schim SM, Thurston CS (2008). Implementing a triangulation protocol in bereavement research: a methodological discussion. Omega 57(3):245-260.
Burcu E (2007). Türkiye’ de Özürlü Birey Olma: Temel Sosyolojik Özellikleri ve Sorunları Üzerine Bir Araştırma. Ankara: Hacettepe Üniversitesi Yayınları.
Cameron L, Rutland A (2006). Extended Contact through Story Reading in School: Reducing Children’s Prejudice toward the Disabled. J. Soc. Issues. 62(3):469-488.
Campbell J, Gilmore L, Cuskelly M (2003). Changing student teachers’ attitudes towards disability and inclusion”. J. Intellect. Dev. Disability. 28(4):369-379.
Creswell John W (2009). Research Design: Qualitative, Quantitative, and Mixed Methods Approaches (3rd Edition). Los Angeles: Sage Publications. Inc.
Çolak M, Çetin C (2014). Öğretmenlerin Engelliliğe Yönelik Tutumları Üzerine Bir Araştırma. İzmir. Dokuz Eylül Üniversitesi İktisadi ve İdari Bilimler Fakültesi Dergisi 29(1):191-211.
Diken İH, Sucuoğlu B (1999). Sınıfında Zihin Engelli Çocuk Bulunan ve Bulunmayan Sınıf Öğretmenlerinin Zihin Engelli Çocukların Kaynaştırılmasına Yönelik Tutumlarının Karşılaştırılması. Özel Eğitim Dergisi 2(3):25-39.
Diken İH (2006). Turkısh Mothers’ Interpretatıons Of The Dısabılıty Of Theır Chıldren Wıth Mental Retardatıon. Int. J. Specıal Educ. 21(2):8-17.
Fethi A (2015). Examination of Physical Education Teacher
Candidates’Attitudes towards Individuals with Physical Disabilityby Visual Information. Anthropologist 21(1,2):197-201.
Genç Y, Çat G (2013). Engellilerin İstihdamı ve Sosyal İçerme İlişkisi. Akademik İncelemeler Dergisi. 8(1):363-393.
Graf NM, Blankenship CJ, Sanchez G, Carlson R (2007). Living on the line: Mexican and Mexican American attitudes toward disability. Rehabilitation Counsell. Bull. 50(3):153-165.
Healy S, Judge JP, Block ME, Kwon EH (2016). Preparing Adapted Physical Educators to Teach Students With Autism: Current Practices and Future Directions. Phys. Educator 73:97-109.
İlhan L (2008). Eğitilebilir Zihinsel Engelli Çocuklarda Beden Eğitimi Ve Sporun Sosyalleşme Düzeylerine Etkisi. Kastamonu Eğitim Dergisi 16(1):315-324.
Kargın T, Baydık B (2002). Kaynaştırma Ortamındaki İşiten Öğrencilerin İşitme Engelli Akranlarına Yönelik Tutumlarının Çeşitli Değişkenler Açısından İncelenmesi. Ankara Üniversitesi Eğitim Bilimleri Fakültesi Özel Eğitim Dergisi. 3(2):27-39.
Kökten E, Erdoğan B (2014). Engelli Gençler, Sosyal Dışlanma ve İnternet. İstanbul: İstanbul Gelişim Üniversitesi Yayınları.
Laat S, Freriksen E, Vervloed MPJ (2013). Attitudes of children and adolescents toward persons who are deaf, blind, paralyzed or intellectually disabled. Res. Dev. Disabilities 34(2):855-863.
Mamatoğlu N (2015). Türkiye’de Engelli İstihdamının Genel Görünümü: İşveren Gözüyle Engelli İstihdamını Artırma Konusunda Önerilen Politikalar. Alternatif Politika Dergisi 7(3):524-561.
Miles MB, Huberman AM (1994). Qualitative Data Analysis (2nd edition). Thousand Oaks, CA: Sage Publications.
Özveri (2012). Aile ve Sosyal Politikalar Bakanlığı bünyesinde yer alan Ulusal Engelliler Veritabanı. http://www.sgkrehberi.com
Özyürek M (2006). Engelliler Yönelik Tutumların Değiştirilmesi. (4. Baskı). Ankara: Kök Yayıncılık.
Sachs R (2003). Faculty/Staff Guide: Integrating Disability Studies into Existing Curriculum. Available at: www.cms.montgomerycollege.edu.
Smith DD (1998). Intoduction to special education teaching an age of challenge. USA: Woodstock Publishers’ Services.
Pruett S, Lee E, Chan F, Wang M, Lane F (2008). Dimensionality of the Contact With Disabled Persons Scale: Results from exploratory and confirmatory factor analyses. Rehabil. Counsel. Bull. 51(4):210-220.
Başbakanlık Özürlüler Dairesi Başkanlığı TC (1997). Toplum Özürlülüğü Nasıl Anlıyor. Ankara.
Tobin GA, Begley CM (2004). Methodological rigour within a qualitative framework. J. Adv. Nurs. 48(4):388-396.
Wolman C, Mc Crinki CS, Rodgriguez SF, Harris Looby J (2004). The accommodation of university students with disabilities inventory (AUSDI): Assessing American and Mexican faculty attitudes toward students with disabilities. J. Hispanic Higher Educ. 3(3):284-295.
World Health Organization (1980). The international classification of impairments, disability and handicap. Geneva: WHO.
Yıldırım A, Şimşek H (2008). Sosyal Bilimlerde Nitel Araştırma Yöntemleri (7. Baskı). Ankara: Seçkin Yayınevi.

Vol. 11(14), pp. 1311-1316, 23 July, 2016
DOI: 10.5897/ERR2016.2827
Article Number: 96C66AA59522
ISSN 1990-3839
Copyright © 2016
Author(s) retain the copyright of this article
http://www.academicjournals.org/ERR
Educational Research and Reviews
Full Length Research Paper
The difficulties that the undergraduate students face about inner product space
Hülya Burhanzade* and Nilgün Aygör
Department of Mathematics, Faculty of Art and Science, Yildiz Technical University, Davutpasa 34210,Istanbul, Turkey.
Received 19 April, 2016; Accepted 8 July, 2016
In this qualitative research, we studied difficulties that undergraduate students face while learning the concept of inner product space. Participants were 35 first-year mathematics students from Yildiz Technical University in the 2011 and 2012 academic years. We asked participants to solve 5 inner product space questions. Data were jointly analyzed by researchers. After evaluating the results, we grouped students’ answers into “right,” “wrong,” or “blank.” The foremost difficulty that the students encountered while studying inner product spaces is that they could not understand the concept thoroughly and they did not know how to choose the elements of inner product spaces. Additionally, it was seen that because the students simply memorized the concepts instead of learning and understanding them they made conceptual and procedural errors. Key words: Inner product space, conception learning, mathematics education.
INTRODUCTION The purpose of mathematics education is to ensure that all students develop the highest level of learning ability by advancing their analytic thinking. Nevertheless, a majority of students experience difficulty in mathematics, and, consequently, this affects their success in other areas. Students often find mathematics difficult because they have trouble learning abstract concepts. However, such difficulties can be eliminated or reduced by concretizing these abstract concepts and using appropriate examples during education.
Even though as a whole, mathematics courses are perceived to be difficult, this does not apply to all mathematical topics and concepts. Further, the difficulty level of all mathematic concepts is not the same. Indeed,
students consider some topics relatively more difficult than others. Research studies identifying topics that students find “easy” or generally “difficult” have been considered significant in steering education and guiding planners and teachers (Gürbüz et al., 2011).
To make a definition or concept consistent in mathematics, one must understand it by learning its features through its own mathematical terms rather than through memorization while actually as being unaware of its content (Dilber et al., 2000). Permanent and functional learning in mathematics is possible only by balancing operational and conceptual knowledge (Noss and Baki, 1996). Redundancy in the number of concepts learned and the inability to associate these concepts with the
*Corresponding author. E-mail: [email protected].
Authors agree that this article remain permanently open access under the terms of the Creative Commons Attribution
License 4.0 International License

1312 Educ. Res. Rev.
information available have further increased students’ learning difficulties at the university level (Kar et al., 2011). When the balance between operational and conceptual knowledge is stabilized, students can attain success in learning concepts.
Specifically, we can categorize the purposes behind the teaching of linear algebra, taught in the first year in the Department of Mathematics, under two headings: the first purpose is to enable its application in other mathematical fields; some of this course’s topics have a wide range of application; for instance, in analysis, differential equations, and probability. We also see possible application of linear algebra in physics, biology, chemistry, psychology, sociology, and in all branches of engineering. The second purpose is to introduce axiomatic mathematics to students. This purpose also ensures that students have a better understanding of abstract concepts and improve their skills in this regard.
Linear algebra is an abstract field of mathematics used to introduce MA and PhD levels in Turkish Universities until 1960. After that, it became an undergraduate course. The importance of linear algebra topics can be discussed in two dimensions. The first is the application of linear algebra not only to mathematics departments but also to other departments in the arts and sciences, engineering, and even the social sciences faculties. And the second is creating a base for abstract lectures introduced in the sophomore year. Since linear algebra is one of the most important subjects in mathematics, the basis of abstract algebra, students are required to learn at a higher level than previously (Ozdag and Aygor, 2011). Linear algebra and calculus are the two main mathematical subjects taught in science universities. However, this teaching has always been difficult. In fact, during the last two decades, it has become an active area for research in mathematics education in several countries. In most universities, science-oriented curricula contain calculus and linear algebra.
Mathematics education research first developed works on calculus; however, in the past 20 years, many studies have been conducted on the teaching and learning of linear algebra (Dorier, 2002). In the first phase of his study, prepared based on his personal experiences of lecturing in linear algebra, Haddad (1999) discussed difficulties that students experience in learning linear algebra based on three different perspectives: the nature of linear algebra, teaching of linear algebra, and how students learn linear algebra. He categorizes the root causes of students’ inability to learn linear algebra as follows: students’ inability in sufficient abstract thinking despite the course being abstract, the axiomatic character of linear algebra, and students’ is having inadequate math bases (Tatar, 2006). Conceptual exercises and introducing concepts in an exploratory way allow linear algebra to be understood abstractly.
Indeed, it is quite easy to relate to the basis of linear algebra. Linear algebra expresses itself to students in a clear, strong way, and teachers should convey linear
algebra to students just as it guides teachers themselves. Only such an approach can make this class dynamic and beneficial. Still, with this approach, understanding some concepts and applications may take some time (Uhlig, 2002). Hillel divides the languages used in linear algebra into three basic sections: 1. “Abstract language” of the general abstract theory 2. “Algebraic language” of the theory; and 3. “Geometric language” of two- and three-dimensional spaces. A teacher who drifts from one language to the other during the course of the teaching without clearly warning students is not aware that symbolizations become a problem for students. What students are mostly confused by, or they cannot understand, is the transition from abstract symbolization to algebraic symbolization while working in the space (Aydin, 2009). One of the basic challenges in learning linear algebra is related to viewpoints and structures that can be used to symbolize abstract concepts (Dias, 1995). Students should be able to distinguish concepts from their symbolizations and drift from one to the other. Activation of all these abilities depends on the teachers’ attitudes. This is the main theme of studies on learning and teaching linear algebra (Dorier et al., 2000). In this research, during tests, university students were observed making mistakes because they could not exactly understand abstract concepts regarding inner product spaces. Therefore, this study aimed to reduce these mistakes to a minimum level. If an instructor knows in which topics students experience which difficulty, he or she will provide a better understanding through the selection of appropriate teaching methods thus minimizing the learning challenges. This study’s purposes are to determine which difficulties undergraduate mathematics students encounter in learning concepts of inner product space and enlighten concerned instructors. METHODOLOGY This research sample involved 35 first-year students at the Department of Mathematics, Faculty of Arts and Sciences, Yildiz Technical University, during the 2011 and 2012 spring semesters. The study was conducted to determine what difficulties students encounter in the matter of inner product space and to analyze their lack of knowledge. In this research, students were asked to answer five questions about inner product spaces. The topic of inner product spaces had been explained to all students participating in the research. Questions were selected from concepts frequently encountered in different years and necessary for learning linear algebra course material at the university. Experts in the field checked the questions for reliability and validity. The examination time was 60 min. Problem used in research The following questions were presented to students in order to

Figure 1. Student A’s answer to the first question.
obtain this study’s research data. The examination consisted of five questions on the concept of inner product spaces. The questions involved concepts that students could encounter in the later years of study; further, they are necessary for learning linear algebra course material. In the evaluation of the information obtained, students’ answers were classified and tabulated as true, false, and blank. 1. i ) Write the definition of inner product. ii ) Let ( ) ( )
be. Show that ⟨ ⟩ is an inner product. 2. i ) Write the definition of orthogonal set.
ii ) Find the value of a for which the set * , - , - , - + in . 3. i ) Write the definition of orthogonal complement.
ii ) Let be the subspace of spanned by the vectors *, - , -+ Find the orthogonal complement ( ) of a
subspace 4. i ) Define the matrix of the inner product relative to the basis S. ii) Find the matrix of the inner product ⟨ ⟩ = relative to the basis = *( ) ( )+. 5. i ) Define the inner product denoted by the matrix with respect to standard basis.
ii ) Find the inner product denoted by the matrix [
]
of with respect to standard basis.
FINDINGS
Assessed qualitatively, this study’s findings were created and interpreted based on the written answers to the questions posed to the students, who concentrated only on performing the operations. Therefore, they tried to solve the questions by ignoring concepts outside of the operation in the given question. However, it is impossible to arrive at the solution of the questions related to the concepts’ properties without fully understanding the concept itself. Some answers by five students (Student A,
Burhanzade and Aygor 1313
Figure 2. Student B for to the second question.
Student B, Student C, Student D, and Student E) who tried to solve the questions without fully understanding the concepts are illustrated below through a scanned copy of their answer sheet (please note that we have not made any changes to the answers of all the students). Student A’s answer to the first question is shown in Figure 1
Although Student A wrote the definition of inner product space correctly, the student could not apply the example to the fourth condition of inner product space conditions. When we examined other students’ papers, we observed that a majority of students wrote the definition correctly; however, like Student A, they could not apply the fourth condition to the example. Some students tried to take its complex conjugate by ignoring that the field is one of the real numbers in the third inner product space condition; and some other students chose the elements of inner product space incorrectly. Student B’s answer of Student B for to the second question is shown in Figure 2.
Although Student B knows the definition of orthogonal set, the student used the definition of orthogonal complement, confusing the two definitions while performing the operations. When we examined other students’ papers, we observed that a large portion of students confused the definitions of orthogonal set with the orthogonal complement. Student C’s answer to the third question is shown in Figure 3.
Although Student C knows the definition of orthogonal complement, the student could not solve the equation system due to lack in the background knowledge. When we examined other students’ papers, we observed that, like Student C, the vast majority of students could not solve the equation system. Furthermore, although some students did solve the equation system, they were unable to reach the conclusion because they selected the wrong arbitrary values. Because some students could not select the element from , they could not establish the equation, and, therefore, they could not reach the conclusion. Student D’s answer to the fourth question is shown in Figure 4.
Although student D knows the matrix definition of inner product according to a base, the student could not apply the definition to the example. Further, the student could not contemplate applying the defined inner product

1314 Educ. Res. Rev.
Figure 3. Student C’s answer to the third question.
Figure 4. Student D’s answer to the fourth question.
Figure 5. Student E’s answer to the fifth question.
separately to the vectors in base for the elements
of . When we examined other students’ papers, we found similar errors. Additionally, some students performed an error in the operation. Student E’s answer to the fifth question is shown in Figure 5.
Although student E knows the inner product definition of matrix according to a base, the student performed an operation by taking a vector formed as , - instead of taking two vectors formed as ( ) ( ). This resulted because the student did not know how to
select the element in . When we examined other students’ papers, we observed that some students wrote the definition incorrectly, and some performed an error in the operation. Overall, students’ answers were grouped
as true, false, and blank and then converted to table form.
As can be seen from Table 1, although the vast majority of students correctly wrote the definitions required in part i) of the questions, they could not apply these definitions to the examples given in part ii) of the questions. In other words, although 76% of students wrote definitions correctly in answer to part i) of the questions, only 36% could give correct answers to part ii). Students could not apply these definitions to examples even though they knew the definitions. In the second and third questions, where background knowledge is necessary, many students could not solve the questions correctly because they could not recall their background knowledge. In other words, students do not know how to combine their background knowledge and new information. These two cases indicate that students wrote definitions from memory but did not understand them conceptually.
CONCLUSION AND RECOMMENDATIONS In his study, Tall (1993) classified learning difficulties in mathematics as follows: 1. Insufficient understanding of basic concepts 2. Inability to formulate verbal problems mathematically, and 3. Inability in algebraic, geometric, and trigonometric skills. Moore (1994) examined difficulties that university students experience in learning how to do mathematical proofs, and he identified these difficulties as follows: 1. Understanding the concept 2. Mathematical language and notation, and 3. Starting the proof. Besides that, students’ perception of the methods of mathematics and proofs influence how they go about the steps in the proof. Similar to what Tall (1993) and Moore (1994) reported, this study determined that students cannot quite form conceptual definitions in their minds, have difficulty in understanding concepts, and cannot perform applications involving the use of such concepts. We can easily see this by comparing parts i) and ii ) of the questions.
Harel (1989) studied causes of students’ learning difficulties related to basic concepts in linear algebra and how a program should be designed to overcome the difficulties. In this study, reasons for students’ difficulties are as follows: first, concepts are abstract structures; second, their application areas are unusual for students; and third, most students have yet to learn proof and axiomatic methods. Moreover, the author mentioned the importance of visualization in overcoming learning

Burhanzade and Aygor 1315
Table 1. Number of true, false and blank answers with their respective percentages.
Variable
Q1 Q2 Q3 Q4 Q5
i. ii. i. ii. i. ii. i. ii. i. ii.
F % F % F % F % F % F % F % F % F % F %
True 33 94 20 57 28 80 13 37 24 68 10 29 28 80 12 34 20 57 8 23
False 2 6 9 26 3 9 12 34 8 23 13 37 1 3 13 37 7 20 14 40
Blank - - 6 17 4 11 10 29 3 9 12 34 6 17 10 29 8 23 13 37
difficulties by stating that the basic concepts in linear algebra are not shown geometrically. In other words, students will have difficulties learning these concepts if they have not visualized them correctly. Further, the author stated that this is the primary cause of difficulties in learning abstract concepts.
This study is consistent with the author’s view, in that it determined that students are not fully able to conceive the definition of a concept; they have difficulties in understanding a concept and they are unable to apply the concept in problems.
This is a consequence of memorizing the concept without actually understanding it. In this study as well, students’ learning difficulties in linear algebra were found as follows: failing in abstract thinking although the topics require abstract thinking, poor conception of definitions, incapacity to interpret verbal expressions, and inability in the readiness level.
Both in mathematics and other areas, learning difficulties that students often experience are identified, and studies can be conducted in order to resolve these difficulties. Instructors should follow this type of research on the basis of the subject and must be aware of the kinds of difficulties that their students encounter in the subject that they teach. To minimize learning difficulties that students experience the following methods have to be adopted:
1. Instructors should explain concepts used in definitions through examples. 2. They should emphasize on which field the inner product space lies and show how elements should be selected. 3. In examples that define an inner product different from the standard inner product, they should dwell on the newly defined inner product and solve the examples.
In addition, instructors, while lecturing on a subject, should remind students of the basic information connected to the subject and increase students’ readiness level. Instructors should reshape their courses by paying attention to these basic matters. In short, they should provide mathematics teaching by balancing operational and conceptual knowledge and should use materials that reduce the abstractness of the concept discussed.
Conflict of Interests The authors have not declared any conflict of interests. REFERENCES Aydın S (2009). On Linear Algebra Education, Inonu University J.
Faculty Educ. 10(1):93-105. Dias AM (1995). Articulation Problems Between Different Systems of
Symbolic Representations in Linear Algebra. DOCUMENT RESUME, P 42.
Dilber R, Aksakallı A, Karahan İH, Bakkaloğlu ÖF (2000). A study about the forgetting process for the topic; physic [Fizik konularının unutulma süreci üzerine bir çalışma], IV. Fen Bilimleri Eğitimi Kongresi [University of Hacettepe 4th Congress of Science Educatıon], Ankara pp. 354-358.
Dorier JL, Robert A, Robinet J, Rogalski M (2000). On a research program about the teaching and learning of linear algebra. Int. J. Mathe. Educ. Sci. Technol. ISSN: 0020-739X. 31(1):27-35.
Dorier JL (2002). Teaching Linear Algebra at University, In Li Tatsien (Ed.): Proceedings of the International Congress of Mathematicians, Beijing, August 20-28, 2002. (Higher Education Press, China. III:875- 884. ISBN 7-04-008690-5
Gürbüz R, Toprak Z, Yapıcı H, Doğan S (2011). Subjects Perceived as Difficult in Secondary Mathematics Curriculum and Their Reasons [Ortaöğretim Matematik Müfredatında Zor Olarak Algılanan Konular ve Bunların Nedenleri], Gaziantep Üniversitesi Sosyal Bilimler Dergisi [University of Gaziantep J. Soc. Sci. 10(4):1311-1323.
Hillel J (2000). Modes of Description and the Problem of Representation in Linear Algebra. in J-L. Dorier (Ed.), On the Teaching of Linear Algebra Kluwer Academic Publishers, Dordrecht. pp. 191-207.
Kar T, Çiltaş A, Işık A (2011). A Study on The Learnıng Dıffıcultıes For Algebra Concepts [Cebirdeki Kavramlara Yönelik Öğrenme Güçlükleri Üzerine Bir Çalışma.], Kastamonu eğitim dergisi [Kastamonu Educ. J. 19(3):939-952.
Moore RC (1994). Making the transition to formal proof. Educ. Stud. Math. 27(3):249-266.
Noss R, Baki A (1996). Liberating school mathematics from procedural view. Hacettepe Üniversitesi Eğitim Fakültesi Dergisi [Hacettepe University J. Educ. 12:179-182.
Ozdag H, Aygor N (2011). Algebra education of undergraduate students: Factorization of Determinant [Lisans ogrencilerinin cebir ogrenimi: Determinantlarm hesaplanmalan durumu], 10. Matematikçiler Sempozyumu [Poster Session Presented the annual meeting of the 10th Congress of Mathematic Education], University of Işık, Şile, İstanbul.
Ozdag H, Aygor N (2012). Undergraduate students’ performances in linear algebra: factorization of a determinant of n*n dimensional matrices. Procedia – Soc. Behav. Sci. 46(2012):125-129
Tall D (1994). Students’ difficulties in calculus, In: C. Gaulin, B. R. Hodgson, D. H. Wheeler and J. C. Egsgard (Eds.). Proceedings of the 7th International Congress on Mathematical Education: Quebec, 17- August 23, 1992. Les Presses de Universite Laval, Sainte-Foy, 3:13-28.
Tatar E (2006). Diagnosing learning difficulties in binary operation and

1316 Educ. Res. Rev.
the effect of 4 mat method on achievement, Ph.D. Thesis. Atatürk University Graduate School of Natural and Applied Sciences, Department of Mathematics Education.
Uhlig F (2002). The role of proof in comprehending and teaching
elementary linear algebra, Educ. Stud. Math. 50(3):335-346.

Vol. 11(14), pp. 1317-1323, 23 July, 2016
DOI: 10.5897/ERR2016.2669
Article Number: 379907A59525
ISSN 1990-3839
Copyright © 2016
Author(s) retain the copyright of this article
http://www.academicjournals.org/ERR
Educational Research and Reviews
Full Length Research Paper
Multidisciplinary approach for curriculum design of professional master’s program with focusing on
solidary economy in Oaxaca, Mex
Rasilla Cano Margarita and Juárez Ruiz Lidia Argelia*
Instituto Politécnico Nacional CIIDIR Oaxaca. Hornos 1003, Colonia Nochebuena, Santa Cruz Xoxocotlán, Oax.
71230, Mexico.
Received 26 January, 2016; Accepted 7 June, 2016
The IPN Oaxaca CIIDIR has a mission to train human resources to postgraduate level that contribute to sustainable regional development in the South-East of Mexico. This is a vulnerable region that boasts an important source of natural resources and a great social, economic and technological backwardness that is directly related to the educational aspect. A master's degree has been designed with three lines of work, taking into account the strengths of the CIIDIR-Oaxaca: Design and sustainable technologies to the building, Security and food safety, and water resources. The aim is to encourage the transfer of knowledge and technology, with methodologies that allow promoting the work of collaborative multi and interdisciplinary and linking with the professional sector. The curriculum design responds to the educational model of the IPN, this model is characterized as facilitator of professional skills and too responds to the model of social integration. The curriculum of the master degree in “Project management for the solidary development” was designed with vocational guidance in response to the shortcomings detected in the region about social and environmental problems, through relevant diagnosis and analysis. This program is included in the PNPC-CONACYT
i. The starting point of this
methodology is the social order and the context deals with the social, economic and environmental aspects. The training of graduate students has the focus of solidarity economy and sustainability as an alternative view and feature in the proposal of projects to manage. Key words: Curriculum, graduate, sustainability, management and development in solidarity.
INTRODUCTION The social, environmental and economic problems, on the State of Oaxaca in particular and the south-southeast Mexican region in general, present similarities that turn it into a socially, economically and environmentally vulnerable region. This region has an important source of
natural resources and at the same time a great social, economic and technological backwardness directly related with the educational aspect.
The society is a system in which all sectors have interconnections at different levels, and therefore respond
*Corresponding author. E-mail:[email protected].
Authors agree that this article remain permanently open access under the terms of the Creative Commons Attribution
License 4.0 International License

1318 Educ. Res. Rev.
to a dynamic that generates new challenges on an ongoing basis, and the educational institutions must plan based on this dynamic, in order to give sense to its fundamental actions, develop human talent, generate knowledge for the resolution of social problems with a multidisciplinary approach. This becomes one of the challenges of education for the knowledge society (Tobón, 2013).
As a response to this context, for over 30 years and trough the CIIDIR
1 Oaxaca, the IPN
2 intends to form
postgraduate level human resources that contribute to sustainable regional development (CIIDIR, 2012a). Considering this as a starting point and with the purpose to promote the development of the South-Southeast region of Mexico, we design the master in “Project management to solidary development” with professional profile. Its vision is to generate actions solution to unemployment as a response to the identified needs of the region. This postgraduate course is the result of a curriculum design that encourages the inclusion of curriculum actors (managers and teachers), and supported collaborative work with a teacher training process, resulting in a curriculum that is flexible, multidisciplinary and enabler of professional competences.
According to Tobon (2013), it is necessary to transform the current education that transcends the emphasis in content and begin to focus on the resolution of context problems. Here is described, in a general way, the process that led to open the first generation of the master degree in August 2013, and determine the main objective, to train professionals at postgraduate level with skills in solidary self-management, collaborative work, practices of participatory democracy and ethical values, in order to identify, implement and evaluate projects in three strategic areas: Food Safety And Food Security, Water Resources and, Design and Sustainable Technologies for the Building, under the solidary economy approach, in urban and rural communities. As a result of this methodology, the master’s degree with professional orientation in “Project Management for solidary development”, managed to be included in the quality postgraduate register of the CONACYT (PNPC) in October 2013. This action involves, among others, the transformation of researchers CIIDIR-IPN into a teaching practice where the appropriation of the curriculum is given from participation in multidisciplinary design expertise.
APPROACH AND METHODOLOGY
The institutional tradition of design plans and curricula, is being replaced by an instrument of organization and academic articulation, in which framework, dynamic, flexible and integrated
1 CIIDIR. Interdisciplinary Research Centre for the Regional Integral
Development 2 IPN. National Polytechnic Institute
manner, it is expressed and the Educational Model of IPN (2004a) projects characterized as facilitator of professional skills. This instrument must also respond to the Social Integration Model (IPN, 2004b), his concept of research and its organizational structure. This instrument is the Curriculum. In the IPN have not reported the design of a professional master from this perspective and regional level either, so it can be said that the CIIDIR IPN Oaxaca is a pioneer in the use of systemic methodology to graduate level curriculum. Also this postgraduate program has been incorporated into standard quality graduate CONACYT, practically since its inception.
In many cases the curriculum theories set guidelines that are impossible to follow completely so it is necessary to incorporate concepts and procedures appropriate for the context of implementation. A curriculum design that responds only to a single theoretical position, leads to tensions between formal or established curriculum from the hidden or real position (Rangel, 2015). This work shows the result of collaborative work, slow and tense, and can be described as democratic, from its design and also in its implementation, unique in the IPN.
If one of the indicators of relevance of the curriculum begins at conception design based on the context to which there is impact, for this design, more contextual elements of rural and urban reality can be said to be included during processing that bureaucratic elements. This allowed generation of an inclusive system of several social actors with a multidisciplinary vision (Coll, 1990).
According to Stenhouse (1975), integrating needs contextual and focused on learning, this design is flexible, open to the needs of the learner. The (intentional) contents should be adapted to the individual projects of each student, in such a way that they cater to the functionality of the learning (Taylor, 1991).
The starting point of this methodology is the social commitment, understood as the requirements established by the society to educational institutions. These requirements are relative to the solution capacity of the current and perspective problems on the part of the professional graduates from these institutions, and by its academic staff and managers. For this reason it is considered that the curriculum design should be develop by the executors of the same, that is, the academic group and management, defining the context in which it will be implemented. In this master’s program, the context addresses the social, economic and environmental aspects and training the graduate has the focus solidarity economy and sustainability, as an alternative vision and feature in the proposed projects to manage.
The organization of the faculty of teachers who are involved in curriculum design, characterized as a multidisciplinary group, responded to the various stages of design, which always involved the formation of the working group through participatory techniques, to perform various tasks such as Analysis of the problems and social custom, detection of strengths and weaknesses of the educational institution, training for curriculum design assisted, determination of competencies required in the postgraduate program, approach determination of the postgraduate program, general curriculum design: determination of the graduation profile and the entry profile, formation of work lines and the curricular map, strengths and weaknesses detection of the academic group and, Strategies for implementation and launch of the postgraduate course.
Once the social problem has been identified and defined, and since the process does not end only with the design, we proceed to establish a general plan that allows having quality elements, because we must operate it, evaluate it and compare it with the problem at a later moment, which surely, it will require of a redesign according to the context characteristics at the time. Always taking into account, this initial design will evolve as long as we are aware of the permanent need of evaluation. The described process responds to a Program of continuous improvement that goes with the curriculum design.

Margarita and Argelia 1319
Figure 1. Foundations of curriculum design competence from the social problem. (Rasilla, 2007)
With the above set is necessary to redact the educational objective, keeping in mind the Level of competence that allows us to propose solutions to real problems, in other words, the answers to next questions must be explicit. The professional to be educated: What does he solves? What doesn’t he solve? and what does he participate?
The objective allows visualizing and defining the competences that will be contributed to during the educational process, defining the graduation profile, which must be frame, in a natural way, with the social problem and the objective. By integrating a concept that allows us to give identity and technical-scientific support to the curriculum, appears the theoretical nucleus. From this moment on, it is necessary to determine which sciences will contribute with its contents to achieve this profile.
The derivation of targets for the levels prior to the general objective and its corresponding level profile (Figure 1), provides a matrix as a guide for tactical assessment process. Since each object is checked in accordance with the knowledge acquired at each level. The input profile (CIIDIR, 2012b) is defined as a logical consequence of this analysis.
The competences in the second year, does not necessarily have to match their level, the profile exit, because surely a process of closing the productive project will be necessary and / or social; and of course the defense of the master's thesis, which complements the learning process of students. With this overview, we begin with the curriculum design, and later the study program. This program is based on the conceptual, procedural and value contents in order to integrate the competencies (Figure 2). The general and specific competences were determined by the work groups for each line.
DESIGN DEVELOPMENT
In the CIIDIR Oaxaca were invited a total of 23 teachers to integrate a multidisciplinary group, in February 2011. Group that was finally
reduced to 15 members who completed the general design of the curriculum 15 months later.
The design began justifying the problematic elements that supported the need for graduate level educational offer directed towards a professional profile. As an initial task, the group became involved in the definition of the social problem that will affect graduates of this expertise, based on the regional context, the Mission, Vision and strengths of the CIIDIR-IPN Oaxaca Unit and guiding principles institutional (IPN, 2004c).
One of the specific objectives of this first plan is to unite the developer group, based on the discussion of the scope of this work, its strengths and limitations. Allowing to establish a viable, real and achievable objective, which permanently will need to resort to the self-assessment. In the case of the master’s we were able to determine, through consensus of interdisciplinary groups, the following (CIIDIR, 2012b):
“At the heart of the grave socio-economic and environmental situation of the state of Oaxaca, we have begun to develop some productive transformations, some of which today have international recognition for the type of local progress they generate, such is the case of Community-based Forest Enterprises, organic Production of coffee, honey, among others. These productive partnerships operate under an organization scheme according to traditions and customs. They are linked with ONG universities and research centers, so they can generate specific knowledge that helps them get a better economic, social and environmental development. The promotion to this type of initiatives constitutes the mission of the Master’s degree in Project Management for Solidary Development. Train professionals who are able to identify and cooperate on the construction of viable productive projects economically, environmentally and socially. Projects meant to increase the people’s life quality trough solidary and sustainable organization. We will train professionals capable to make incursions into

1320 Educ. Res. Rev.
Figure 2. Scheme of the integration of the curriculum from competences. (Rasilla, 2010).
management of sustainable regional projects, under the approach of solidary economy in the areas of food security and food safety, design and sustainable technologies for the building, and water resources. With the perspective of opening their own working field through project managing, consults and/or inclusion in specific areas of public and private institutions, from an integral and interdisciplinary perspective, to increase the communities life quality. The master will contribute not only to the objective of Solidary and Sustainable Development of Oaxaca, but also of the country southeast region that presents similar indicators to those of this state”. At this point in the design, we write the formative objective taking into account the competence level that allows proposing solutions to real problems. During this design working groups were organized by committees for each one of the different stages, and also existed disciplinary work as a transversal work. Achieving the following results (CIIDIR, 2012b): “Master’s degree objective: Train professional to postgraduate level with competences solidary self-management, collaborative work, practices of participatory democracy and ethical values to identify, apply and evaluate projects in three strategic areas: Food Safety and Food Security, Water Resources and Design and Sustainable Technologies for the Building, under the approach of Solidary Economy in urban and rural communities”. The social problem being addressed leads to the definition of the three lines of work to achieve the objective of the master, so the exit profile diversifies depending on the line that the student chooses to guide your project, without losing sight interdisciplinary (CIIDIR, 2012b): “Entry profile: The applicant must be a professional committed
with the search of alternatives to social, economic and environmental problems, being critic and reflexive. Moreover he must have a professional degree in an area of knowledge that has affinity with any of the following lines of work and terminal options, offer by the Master’s degree project management for solidary development. 1.Food safety and food security: Generate productive projects is what it’s intend here, projects that improve the productive process, include basic growing and local resources for the local populations nutrition, and generate mechanisms of technology transfer to create value added, just as the acknowledgement and creation of solidary associative networks. Aimed at graduates from agronomy, agro ecology, biotechnology, biochemistry, nutrition and similar careers. 2. Water resources: The objective of this line is to strengthen the education of professionals that promote a change on the current conception of water management, based on the approach of integral management of water and solidary development. Aimed at graduates from civil, industrial, chemical and environmental engineers, hydrology, geology, biological sciences. 3. Design and sustainable technologies for the build: On this line, in order to improve the habitability of housing and buildings in general, design aspects will be considered, that provide security, comfort, illumination, ventilation, orientation, just as the materials characteristics and the construction place conditions. Aimed at graduates from civil engineer, environmental engineer, architecture and similar careers. Furthermore, to enter the program, the next basic competences are required: (i) Reading and comprehension of English texts. (ii) Skill for documental and field investigation. (iii) Software knowledge to create and work with texts, graphics and

spreadsheets. (iv) Interest and disposition to deal with problems of their environment, related with their discipline with a focus on sustainability. (v) Disposition for self-learning. (vi) Innovative spirit. (vii) Disposition for multidisciplinary work and team work.
Graduate profile: Graduate in project management for solidary development. Identify, to design, manage and evaluate projects based on the conceptual fundaments of solidary economy. He will dispose of a combination of theoretical methodological knowledge, skills and values that will allow him to have high performance when applying with a suitable and practical way, the acquired knowledge in design and sustainable technologies for the building, food safety and food security, and water resources.
In addition, students will acquired transformation competences and skills for self-employment and facilitate his access to sources of employment in areas related to sustainability. The competence for transformation describe the ability of future vision, that is required to structure the approach to sustainability and solidary economy through the active participation in the future of the society. That is why we include in this profile the next sub competences of transformation (Michelsen and Rieckamnn, 2008)
(i) Competence for thinking ahead (prospective) that allows him to work with uncertainties, as well with predictions, expectations and future concepts. (ii) Competence for working in an interdisciplinary manner. (ii) The competence for a wide perception that allow the inter-cultural understanding of communication and cooperation. (iv) Competence for critic reflection of paradigms. (v) Being able to plan, supervise and execute projects, identify niches of opportunity, adapt technological innovations, apply technologies. (vi) Having an attitude of commitment, respect, and responsibility, highlighting the professional ethics with the social and ecological environment. (v) Promoting the understanding of the sustainability value. (vi) Coping with climate change and energy-related needs. ”From the definition of these parameters, we proceeded to the design of the curriculum, and then, the study program of the common part and the three work lines. The design is based on the conceptual, procedural and content values, to integrate the relevant competence. The institutional regulation of the IPN establishes the integration of learning units as training cells that integrate the curriculum.
The Master's program “project management for the solidary development” was included in the National Register's Quality Postgraduates (PNPC) CONACYT of Mexico in October 2013. RESULTS The academic group of the Interdisciplinary Center of Research for the Regional Integral Development, Oaxaca Unit of the IPN, and based on this work methodology, established the next curriculum map (Figure 3).
Definitions of the work lines was based on the needs detected in the diagnostic of the regional context and on the skills developed during the 30 years of CIIDIR operating in the State of Oaxaca. In the same way we detected that the lines of economy, education and energy, are necessary, and due to lack of strength of
Margarita and Argelia 1321 academic staff in the CIIDIR Oaxaca to work with them as lines, currently only included in a transversal way.
The Master´s modality is formal and classroom education, with intra and extramural activities, with prevalence of linked and articulated activities by the school activities. This activities outline in the learning Units, are mandatory in the common part and project seminars, and optional the corresponding to the work lines according to the project to develop.
This curriculum design considers the learning units of the common or basic stock, as the responsible for developing skills and values that must permeate in the planning, design, ex-ante evaluation and implementation of projects supported on the theoretical-conceptual elements. The project Seminars are considered the curriculum integrative spaces, since its aim is the permanent assessment of learning, teaching, relevance of the contents and the feasibility of operation (educational management), trough 1) identify an economic, social and environmentally viable project (Protocol integration); 2) design the project; 3) make an ex-ante evaluation of economic, social and environmental variables for its implementation and 4) implement the project in field and the ex-post evaluation.
DISCUSSION
According to Tobon (2013b), the implementation of the curriculum is important based on competencies, in accordance with current social challenges and trends towards the future, the quality management of learning and the training of people with critical thinking, entrepreneurship and ethical performance that are basics aspects of this design curriculum.
The master’s program opened its first semester on August 2013, currently has 22 students, and 3 graduates; the applicants were selected through an admission process focused on the evaluation of general and specific competences, through the application of institutional instruments and instruments design by the academic group that is responsible for the operation of the master. The process consisted in a series of interviews conducted by a member of each work line, common group and projects seminars, just as the presentation and defense of a first draft of interest for the applicant, according to his entry profile and demonstrating the inclusion of the solidary development vision.
As a result of self-assessment and the process of continuous improvement, we will offer new optional learning units to strengthen the training for the management of projects (elements for multidisciplinary teaching and environmental management). In addition to this, the permanent seminar on strengthening the multidisciplinary training of students has started, that involves specific actions on the needs identified in the curriculum learning units and that are attended by external experts strengthening the linkage with the real

1322 Educ. Res. Rev.
Figure 3. Curriculum map. Master's degree in "Project Management for the solidary development" IPN. CIIDIR (2012b).
problems of the region. These specific actions are conferences, round table discussions and visits to specific communities to address any issue or a social program evaluation. The latter are independent of the field visits planned in some of the learning units. CONCLUSIONS From this methodology, it was detected that it is possible to diversify the graduation profile. Solving the problem, using the Center resources and institutional strength, enabled the problem to be addressed from three disciplinary areas. (i) The integration of disciplinary groups and committees allowed the definition of disciplinary and generic competences that needed to be promoted, besides finding matches in competences by disciplinary areas to the called nodal specific competences. This methodology of curriculum design promotes the inclusion of the curriculum creators (Managers and teachers) and the
collaborative work of teachers, resulting in a curriculum that is flexible, interdisciplinary and enabler of professional competences. (ii) The permanent teacher training, during the process of curriculum design, allowed a construction of learning in teachers that respond to the needs that arose them. The integration of multidisciplinary groups allowed the design methodology to be enriched. The curriculum design process, and the design and operation of the admission process, has given us elements to make a pre-evaluation of the relevance of the master’s and its procedures, since the operation of the first semester. (iii) The graduation profile of the master’s allows the students to apply their knowledge for self-employment, through the generation and application of solidarity projects and/or technical consultancies, and the managing the necessary resources for the implementation. This process of curriculum design has involved a vision of systemic nature, flexible, of permanent evaluation (internal, external and meta-evaluation) with a learning vision, inclusive and with a view of contributing to the solution of real problems of one of the three poorest

states and with the greater diversity of the country. With this systemic process, flexible and with a vision of continuous improvement to ensure its relevance, we strive to bring about changes in the training of high-level professionals. According to Tobon (2013), it is expected that the majority of students are going to have a well-rounded education and they are going to be able to respond to the challenges of today and in the future. Conflict of interests The authors have not declared any conflict of interests. ACKNOWLEDGEMENTS To the National Polytechnic Institute – IPN, CONACYT. The working group who participated in the curriculum design of the master in "Project management for the solidary development". REFERENCES Coll C (1990). Psicología y currículum, Una aproximación
psicopedagógica a la elaboración del currículum escolar. México: Paidós.
IPN (2004a). Nuevo Modelo Educativo para el IPN, Materiales para la Reforma No. 1. México, IPN.
IPN (2004b). Modelo de Integración Social del IPN, Materiales para la Reforma No. 4. México, IPN.
IPN (2004c). Manual para el rediseño de planes y programa de estudio en el Marco del modelo educativo y académico. Materiales para la Reforma No. 12. México, IPN.
CIIDIR (2012a). www.ciidiroaxaca.ipn.mx, consultado 22 septiembre 2014. Provide title of work.
CIIDIR (2012b). Diseño curricular de la maestría con orientación profesional: Gestión de proyectos para el desarrollo solidario. CIIDIR Oaxaca, IPN.
Michelsen G, Rieckmann M (2008). “Programa de Maestría Internacional: Sustainable Development and Management”. Alemania: Verlag für Akademische Schriften.
Rangel H (2015). Una mirada internacional de la construcción curricular. Por un currículo vivo, democrático y deliverativo. Revista Electrónica de Investigación Educativa 17(1):1-16.
Margarita and Argelia 1323 Rasilla Hernández, Baltazar (2007). “El curriculum y la calidad en la
educación”. En memorias del ier congreso internacional de educación media superior y superior para la juventud del futuro. ciudad de méxico. gobierno de la ciudad de méxico.
Rasilla, Hernández, Baltazar (2010). Metodología de diseño integral del curriculum. En memorias del II Foro De Profesores “Diseño curricular. Ciudad de México. ESIQIE-IPN.
Stenhouse L (1975). An introduction of curriculum research and development. Londres: Heineman.
Taylor C (1991). El multiculturalismo y la política del reconocimiento. México: Fondo de Cultura Económica
Tobón S (2013). Los Proyectos Formativos: Transversalidad y desarrollo de competencias para la sociedad del conocimiento. México D.F. Instituto CIFE
Tobón S. (2013b). Metodología de gestión curricular. Una perspectiva socioformativa. México. Trillas.
i National Quality Postgraduate Program of National Council of Science and Technology in Mexico.

Vol. 11(14), pp. 1324-1330, 23 July, 2016
DOI: 10.5897/ERR2015.2242
Article Number: B95DE7259527
ISSN 1990-3839
Copyright © 2016
Author(s) retain the copyright of this article
http://www.academicjournals.org/ERR
Educational Research and Reviews
Full Length Research Paper
The effect of sportive and cultural activities on the self-esteem and hope of the children who have tendency to
ınvolve in a crimei
Zekiye BASARAN
Kocaeli University School of Physical Education, Kocaeli, Turkey.
Received 27 April, 2015; Accepted 10 February, 2016
This study aimed to investigate the effects of sportive and cultural recreative activities on the hope and self-esteem of children who have tendency to involve in a crime. The sample of the research consists of 41 students aged between 8 and 14. The data was collected during the project called ‘Our future is safe with sport.' Personal information form, scale of hope in children, and Cooper Smith self-esteem inventory were used as the data collecting tools and were conducted both at the beginning and at the end of the project as pre-tests and post-tests. The program was performed two days a week and one and half hours a day. These activities were judo, table tennis, ice skating, gymnastics, and taekwondo. The children were also taken to different cities every two weeks. The research lasted eight weeks. The data was analyzed using SPSS 18.0 package programme. Descriptive statistic, paired samples t-test, and correlation were used to analyze the data (p<0.05). It was observed at the end of the research that there was a numerical increase in the effect of these sportive and cultural activities on the children. However, this effect was observed to have less significant effect statistically. Yet, these children were observed to be showing better attitudes, communicating, solving a problem, taking responsibilities and attending their schools. It is recommended to do longer research for this kind of work.
Key words: Crime, child, sportive-cultural activities, hope, self-esteem.
INTRODUCTION
The development of societies is possible with healthy and successful individuals. The youngest members of societies are children and they are the future of their countries. The better they are trained, the better they lead their society to the future. Self-concept is important in the growth of children and the formation of their personality. Self-concept, which is aquired through socialisation and maturation, is a feature that differentiates individual's self and one person from another (Onur, 2000; Sayar, 2003)
and it is the way the person knows himself. Self-esteem is accepted as an important aspect of personality and a positive personal trait and it expresses one’s own personal feelings about his value, importance, success, and being perfect (Coopersmith, 1987; Kalliopuska, 1990). Self-concept is affected by the values and life style of the society and family (Sayar, 2003; Bayazıt, 2014). Researches on the self-esteem of children and teenagers have found that while positive social manners have
E-mail: [email protected]. Tel: +90 (262) 3033633.
Authors agree that this article remain permanently open access under the terms of the Creative Commons Attribution
License 4.0 International License

positive effect on the self-esteem, negative social manners have negative effects (Bayraktar et al., 2009). The connection between the self-esteem and the age, gender, the number of friends, being or not being friends with opposite sex, the attitudes of family, economic status, social appearance, doing sports, and life conditions have been investigated.
Hope is the desire and expectation to reach a goal. Snyder et al. (2009) stated high level of hope increases the level of self-esteem and people’s kindness (Atik, 2009). Self-perception begins in childhood. Family, school, and environment are influential in the development of self-perception. Children should be brought up with love, frienship, cooperation, morality as good examples. Those who grew up in an unhealthy environment harm not only the family but also the society (Stekel, 1997; Eres, 2009). In the studies that were performed on juvenile delinquency, it was concluded that the factors that led the child to crime were as follows: domestic violence, leaving home, drug abuse, having individuals in the family that committed crimes (Seyhan and Zincir, 2009), family structure, circle of friends, the way he spends his leisure time (Avci, 2008), socio-cultural position and education level (Sengul et al., 2012). As seen here, they are personal and environmental reasons (Akduman et al., 2007). The child tending to crime is the one who pays the family’s and society’s mistakes and then makes the society pay. That is why, there is no child who commits a crime; there is a child who is pushed into the crime. The most effective and the most permanent ways to fight against crime consist of the preventive activities that are done before the crime is committed (Zengin and Kesgin, 2013). One of the preventive activities is recreation activities.
Recreation is a set of relaxing and entertaining activities that individuals and social groups do voluntarily in their spare times (Karakucuk, 2008). It is put forward by many researches that various sports, cultural, and social activities practiced for children contribute positively to both self-esteem and development of self. Moreover, recreative activities are chosen to improve mental health, self-esteem, problem solving ability and communication skills (Gray and Judy, 2003). These activities have been considered to be important for the child to fit in the society. Therefore, this research aims to investigate the effect of sportive and cultural recreative activities on the self-esteem and hope level of children who have tendency to involve in a crime in contemplation of the following question: ‘’Can children be provided with positive attitudes by enhancing their self-esteem and hope level via recreative activities?’’ METHODOLOGY Experimental group The research was done in Kocaeli city of Turkey. The sample of the research consists of 41 children who completely filled in the
Basaran 1325 questionnaires. They are in the project* called ‘Our Future is Safe with Sport’. These children come from the bustees where the crime rate is high. They are elementary school students aged between 8 and 14. They were chosen with the help of school principals and guidance counsellors. Their school success is usually low. They have problems such as fighting, racketeering, attacking with a knife, and poor attendance to school. Their financial status is below the average and very low. There is violence and marital conflict in their families. There are even members in their families who have substance-abuse problem (like alcohol), even the ones who’d committed crimes.
These children were given a programme consisting of judo, table tennis, ice-skating, gymnastics, and teakwondo trainings two days a week, for eight weeks. Total number of children were divided into two groups and then studied considering the age and numbers of group members. Furthermore, trips to different cities (Ankara, Istanbul, Canakkale, and Bursa) were organised to introduce history and culture of the cities visited once in two weeks. This research was conducted between December 14, 2013 and January 31, 2014. The program is shown in Table 1. Teaching subjects and techniques that were used in these classes Judo: Basic turns, fall to forward and backward, basic stance and basic walk, moreta seonage technique, and kosher guruma technique. Ice-skate: Slip forward, snow slingshot and forward brake, draw of the lemon shape on the ice, opening and closing of foots. Taekwondo: Cumbi and caryo, apsugi, apkubi, cucumsogi, maki, apsugi monton, absugi olgun, cirigi, palding, tolyo, and apcagi techniques. Gymnastics: Eagle posture, forward somersault, backward somersault. Table tennis: Rules of table tennis, forehand, backhand and service techniques.
Instrument Personal information form consisting of demographic features, the scale of hope in children (Snyder, et al., 1997), and Coopersmith Self-Esteem Inventory (1991) were used as the data collecting tool.
The scale of hope in children (CUO) CUO was developed by Snyder et al. (1997). This scale which is used to determine the continuous level of hope in children consists of 6 items in accordance with Likert type. The grading is like this: ‘Never: 1, Seldom: 2, Sometimes: 3, Often: 4, Most times: 5, and Always: 6.’ The grading of the scale was done by adding the point obtained from each item and the highest point that came from the scale is 36, whereas the lowest is 6. The questionnaire has two dimensions; ‘pathways to the target’ and ‘motivation to the target’. Snyder et al. (1997) stated that hope is formed together with these two dimensions; therefore it should not be dealt with separately. In the original questionnaire, Cronbach alpha reliability coefficient was calculated for the whole and different coefficient was found in different samples ranging from 0.72 to 0.86. The test-retest correlation coefficient for the questionnaire was found positive and significant (n=359; r=.71, p<.001) (Snyder et al., 1997). The scale translated into Turkish by Atik and Kemer (2009). In the adaptation of the questionnaire done according to the data set in this research, 0.74 was found for the internal consistency reliability Cronbach alpha coefficient, whereas the test-retest reliability correlation coefficient was found positive and statistically significant (n=191;

1326 Educ. Res. Rev.
Table 1. Program of the study.
Date Day Hour Activities
14,15,21,22 December 2013 Saturday/Sunday 13:00-15:00 Judo
24,26,31 December 2013 Tuesday/Thursday 13:00-14:00 Ice-skate
02 January 2014
7,9,15,17 January 2014 Wednesday/Friday 11:00-12:30 Taekwondo
22,24 January 2014 Wednesday/Friday 11:00-12:30 Gymnastics
29,31 January 2014 Wednesday/Friday 11:00-12:30 Table tenis
r=0.57, p<0.01) (Atik and Kemer, 2009). In this study, the hope scores of the participants were analyzed by assessing on total scores. Cronbach alpha reliability coefficient was calculated as 0.72. Coopersmith self-esteem inventory (CSEI) Coopersmith self-esteem inventory was developed by Coopersmith (1967) so as to evaluate the person’s social, personal, academic, and familial opinions. He calculated the reliability coefficient of the test-retest in the inventory as 0.88 (every 5 weeks) and 0.70 (every 3 years). Coopersmith also stated that Kuder-Richardson reliability coefficient as 0.91 for the girls and 0.80 for the boys. It has been revised a few times since it was developed. These are School Form, School Short Form, and Adult Form. School Short Form consists of the first 25 questions of the School Form. It was applied to children. It does not have a lie scale. Total scores are considered. Turkish validity and reliability was carried out by Turan and Tufan (1987) as r=0.76, Ozogul (1988) as r=0.77, Gucray (1989) as r=0.70 and 0.83, and Piskin (1996) as r=0.76 (Korkmaz, 2007; Kucuk, 2011).
Those who reply ‘No’ for a negative statement and ‘Yes’ for the positive one are given one point for each statement. All the points are added and they are multiplied with 4 so as to make the assessment out of 100. Thus, the score that is obtained after all these steps shows the person’s self-esteem level. If the score is high, it means that the level of self-esteem is high, and if it is low, the self-esteem level is low (www.mebk12.meb.gov.tr). Coopersmith’s (1991) short form (CSEI) was used in this study. The reliability coefficient was found to be r=0.76 (p<0.05). Collecting the data The questionnaires were given to all the children both on the first day who are in the judo hall and on the final day to the ones who are in the table tennis hall of the application at the same time. The data from 41 students who completely filled in every question in each three questionnaires was processed for this research. The processes took about twenty minutes. According to the data, the majority of the children are male (68.3), most of them were born (65.9%) and brought up in Kocaeli, 95.2% of them live with their parents.
Data analysis The data was analyzed using SPSS 18.0. Descriptive statistics, paired samples t-test which determines the difference between two dependent variables in parametric data and corelation which determines the relationship between tests were used to analyze the data. Significance level was taken as 0.05.
FINDINGS According to the Table 2, ages of children in the research group are 8 (4.9%), 9 (7.3%), 10 (24.4%), 11 (29.3%), 12 (22%), 13 (9.8%), and 14 (2.4%). The majority of them are male (68.3%), the others are famele (31.7%). The children have siblings who are 1 (4.9%), 2 (48.8%), 3 (26.8%), 4 (14.6%), and 5 (4.9%). Most of them were born (65.9%) and brought up in Kocaeli, the others came from (34.1%) different cities. 95.2% of them live with their parents, 2.4% of them live with their mother, and 2.4% of them live with their relatives.
When the averages of self-esteem are examined at Table 3, it can be observed that there is statistical increase between the post-test (67.2±15.16) and pre-test (65.3±17.38). However, this was concluded not to be statistically significant (p=0.053). The scores pre-test (28.8±4.3) and post-tests (28.8±5) of hope are at the same level.
No connection (r=-0.162, p=0.312, p<0.01) was traced between the self-esteem level of the children and pre-test of the level of hope at the end of the correlation analysis (Table 4). However, there was a statistically significant and negative connection between their post-tests (r=-0.430 p=0.005 p<0.05). DISCUSSION In the study, the sample group are children whose ages are 8 (4.9%), 9 (7.3%), 10 (24.4%), 11 (29.3%), 12 (22%), 13 (9.8%), and 14 (2.4%). The majority of them are male (68.3), the others are famale (31.7%). The children have siblings who are 1 (4.9%), 2 (48.8%), 3 (26.8%), 4 (14.6%), 5 (4.9%). Most of them were born (65.9%) and brought up in Kocaeli, the rest came from (34.1%) different cities. 95.2% of them live with their parents, 2.4% of them live with their mother and 2.4% of them live with their relatives (Table 1). They have a risk of involving in a crime. They live in the bustees of Kocaeli, which is an industrial city in Turkey. Their family income and level of parents’ education is low. In their family, there is domestic violence, substance abuse (alcohol, etc.), and derangement. There are even convicted members in their families. Their school success

Basaran 1327
Table 2. Personal information frequency.
Personal ınformation Frequency %
Age
8 2 4,9
9 3 7,3
10 10 24,4
11 12 29,3
12 9 22
13 4 9,8
14 1 2,4
Total 41 100
Gender
Female 13 31,7
Male 28 68,3
Total 41 100
Number of siblings
1 2 4,9
2 20 48,8
3 11 26,8
4 6 14,6
5 2 4,9
Toplam 41 100
Who he/she lives with
Parents 39 95,1
Mother 1 2,4
Relative 1 2,4
Total 41 100
Hometown Frequency %
How long he has lived in Kocaeli
Kocaelı 27 65.9
Kars 2 4.9
Trabzon 1 2.4
Mersın 1 2.4
Diyarbakır 4 9.8
Mus 2 4.9
Gümüshane 1 2.4
İstanbul 1 2.4
Rize 1 2.4
Bolu 1 2.4
Total 41 100
How long he has lived in Kocaeli
3 1 2.4
7 2 4.9
8 2 4.9
9 5 12.2
10 9 22
11 11 26.8
12 7 17.1
13 3 7.3
14 1 2.4
Total 41 100
is usually low. They have problems at school, such as fighting, racketeering, attacking with a knife, and poor attendance to school.
The reasons why a child commits a crime are personal and environmental (Eres, 2009). They can be listed as follows: inadequate child education, parent delinquency,

1328 Educ. Res. Rev.
Table 3. Self-esteem and hope of the research group pre-test and post-test of paired samples t-test results.
Polls N Minimum Maximum Mean Std. Deviation Corelation P
Self-esteem pre-test 41 28 92 65.3 17.38 0.305 0.053
Self-esteem post-test 41 32 88 67.2 15.16
Hope pre-test 41 20 36 28.8 4.3 -0.134 0.403
Hope post-test 41 14 35 28.3 5
*P<0.05.
family structure, unemployment, financially insufficiency, broken family, immigration, demographic features of the family, and the conditions of the house, low level of the child’s intelligence, friends group and the school, the way he spends his leisure time. These are some of the factors that lead a child into crime (Avci, 2008). It was aimed in this research to help children who are deprived of social, cultural and sportive opportunities to develop motor skills and self-confidence with the help of the healing effect of sport, to help them act with coordination, gain leadership skills, develop collaborative and friendly manners instead of self-centred behaviours, and obtain communication skills. (Yarımel, 2014) and aimed to reintegrate them into the society. Effect of 8-week sportive and cultural activities applied with this purpose on the self-esteem of the children was found to be at the average level. In the research conducted by Seyhan and Zincir (2009), they determined that convicted children often had someone in their family or in their social environment who had committed crimes before. They also found out that their self-esteem was at the average level. Besides, it was also observed that self-esteem level decreased in the children who were exposed to violence or cruelty (Cetinkaya et al., 2009), who were neglected or abused (Unal, 2008) and who had substance abuse (Toker et al., 2011). In this research, there was a statistical increase between self-esteem pre-test mean (65.3±17.38) and post-test mean (67.2±15.16). However, this increase (p<0.05) was observed not to be statistically significant (p=0.053) (Table 3). This was because of the limited time for such a research. Besides, it may also be explained with the fact that the age group was young and the age gap was quite wide.
In the research performed by Walters and Martin (2000), they found that aerobics exercises had no effect to increase the self-esteem. In another research by Tracy and Erkut (2002), it was determined that participation in sportive activities by Afro-American girls was not an important way to fancy the school and their self-esteem level. One more study by Acar (2009), the researcher stated that the effect of teamwork on the self-esteem level of convicted children displayed an increase when compared with the children in the control group. However, it was not statistically significant. These results all match with our research. Yet, there were different
results, as well. Ekeland et al. (2005) stated at the end of the analysis of 23 different studies that exercise could have affirmative, but short-term effects on the self-esteem of the children and teenagers aged between 3 and 20 in some low-quality events. Whitehead and Corbin (1997) stated that physical activities and physical education course programmes could help to develop self-esteem only when they were well-applied. Tramblay et al. (2010) too found an affirmative connection between the sportive activities and the self-esteem. Bayazıt (2014) detected a positive effect of recreation activities on the self-esteem of teenage females. There are more research supporting the positive effect of sport on the self-esteem level of handball players (Gacar and Yalıc, 2012), and badminton players (Gencer and Ilhan, 2009). Sport was also proved to decrease the social phobia level (Karagun et al., 2010).
Ciarrochi et al. (2007) declared that positive thinking increased the self-esteem and the level of hope in high school students. Kitano and Lewis (2005) suggested that we strengthen optimism in children at risk, teach them hope, and help them develop courage and life skills (Oktan, 2012). Kabakcı and Totan (2013) found out that hope only differed according to the class level. In this research, when the effect of sportive and cultural activities on the level of hope in children was examined, a connection was detected between the age and hope. However, there were no change in the level of hope and no correlation (0.403) between pre-test (28.3±4) and post-test (28.3±5) (Table 3). Because children’s average scores of hope (Mean=28) were high, it might be deduced that applied activities did not make a difference. Another reason is that some manners known as crimes by the society are likely to be recognised as success in the neighbourhood where these children grew up.
However, it was concluded that there could be differences according to the age. While no connection was traced in pre-tests (r=-0.162 p=0.312 p<0.01) at the end of the correlation between hope and self-esteem, a statistically significant and a negative connection was observed in post-tests (r=-0.430, p=0.005, p<0.05). This finding illustrates that sportive activities increased self-esteem scores, which were lower. However, they made no difference in their level of hope, which was already high (Table 4). Shotade (2010) emphasized in a study

Basaran 1329
Table 4. Results of the correlation analysis between pre and post-tests of the self-esteem and the hope.
Polls N Mean Ss r p
Self-esteem pre-test 41 65.37 17.38 -0.162 0.312
Hope pre-test 41 28.8 4.34
Self-esteem post-test 41 67.22 15.16 -0.430 0.005*
Hope post-test 41 28.32 5.04
*p<0.05.
that the participation of youngsters in entertaining sports activities is effective in integration into social life, increasing self-esteem, developing a social and cultural identity (as cited in Bayazıt, 2014). This study aimed to develop positive personality traits in children by increasing self-esteem through various recreational activities. Conclusıon In conclusion, the present study examined the effect of sportive and cultural recreational activity programs on hope and self-esteem development of the children who have tendency to involve in a crime. According to the data, these activities have not changed the level of hope of the children. These activities have had a positive effect on self-esteem development of the children. Also, positive changes in their manners were observed in these children, such as attendance to school regularly, a good way of addressing each other, dealing with problems in a much calmer manner, and willing to take responsibilities. In this context, it is suggested that a long-term planning should be done including recreative activities. The plan should be prepared with cooperation between state and local governments. Programs should be well-planned, carried out continuously, and tracked regularly. These recommended programs provide an opportunity to the children to improve their self-esteem, to integrate into their comunity, and to keep them away from crime.
Conflict of Interests The author has not declared any conflicts of interest. ACKNOWLEDGEMENTS The author thank Cafer Gündoğdu, Mehmet Gölükcü, Özge Çakmak, Emre Acar, Tuncay Erenci, Serap Çolak, and Mine Gül who assisted in this study. This project was led by the Ministry of Development and it was conducted with the collaboration of the Kocaeli Province Directorate of Safety, Directorate of Education and the Kocaeli Metropolitan Municipality. It was sponsored by East
Marmara Development Agency (MARKA). REFERENCES Acar BY (2009). The effect of group work on the level of self esteem
emphatic skills and social relationships of convicted young sexual offenders. J. Soc. Soc. Serv. 20(1):33-46.
Akduman GG, Akduman B, Canturk G (2007). Investigation of the some personal and familial characteristics of juvenile delinquency. Turk Arch Ped. 42:156-61.
Atik G (2009). Hope as an estimated variance for tyranny. Ankara University, J. Faculty Educ. Sci. 42(1):53-68.
Atik G, Kemer G (2009). Psychometric properties of children’s hope scale: validity and reliability study. Elementary education. Online. 8(2):379-390, http://ilkogretim-online.org.tr. (Retrieved May 24, 2015)
Avci M (2008). A study on convicted children: social reasons pushing the child into crime and recommendations for solutions. Atatürk university, J. Soc. Sci. Institute 11(1):49-73.
Bayazıt B (2014). The effect of recreational activities on self-esteem development of girls in adolescence. Educ. Res. Rev. 9 (20):920-924
Bayraktar F, Sayıl M, Kumru A (2009). Self-Esteem among high-school adolescents and college students: The role of parental and peer attachment, empathy and psychological adjustment variables. Turk. J. Psychol. 24(63):48-63.
Ciarrochi J, Patrick CL, Heaven FD (2007). The impact of hope, self-esteem, and attributional style on adolescents’ school grades and emotional well-being: a longitudinal study. J. Res. Pers. 41(6):1161-1178.
Coopersmith S (1967). The Antecedents of Self-Esteem. San Francisco: W. H. Freeman.
Coopersmith S (1987). (SEI)-Self-Esteem inventories. Palo Alto: Consulting Psychologist Press.
Coopersmith, S (1991). SEI-Self-Esteem Inventories. Consulting Psychologist Press, Inc. Palo Alto.
Cetinkaya S, Nur N, Ayvaz A, Ozdemir D, Kavakcı O (2009). The relationship between school bullying and depression and self-esteem levels among the students of three primary schools with different socioeconomic levels in Sivas province. Anatolian j. Psychiatry. 10:151-158
Ekeland E, Heian F, Hagen KB (2005). Can exercise Improve self esteem in children and young people? A systematic review of randomised controlled trials. Br. J. Sports Med. 39(11):792-798
Eres F (2009). A Social Problem: convicted children and the importance of the family. J. Research, Family-Society and Education Culture. April-May-June: 90-95.
Gacar A, Yanlıc N (2012). Examination of self respect levels of adolescent handball players aged 13-17 in terms of certaın variables. J. Sports Performance Res. 3(2):45-50
Gencer E, Ilhan EL (2009). Examining badminton athletes’ self-esteem according to some variables. 4. Racquet Sports Symposium. December, 11-12, Kocaeli, Turkey: 2-6.
Gücray S (1989). Some factors which are affecting self-esteem of the children who are 9-11 ages and stay with their families and in foundling hospital. Unpublished doctoral dissertation, Hacettepe University, Ankara, Turkey.

1330 Educ. Res. Rev. Gray Ty-Am, Judy O (2003). Recreation & Dance. J. Phys. Educ.
74(6):52. http://www. mebk12.meb.gov.tr/.../18012106_coopersmithozsaygienvanteri. (Retreived May 09, 2014)
Kabakcı OF, Totan T (2013). Effects of social and emotional learning skills on life satisfaction and hope. Aku, J. Theoretical Educ. Sci. 6(1):40-61.
Kalliopuska M (1990) Self-esteem and empathy as related to participation in the arts or sports activities. In: L. Oppenheimer (Ed.), The self-concept: European perspectives on its development, aspects, and applications. Springer, New York pp. 120-123.
Karagun E, Yıldız M, Basaran Z, Cağlayan C (2010). The Effect of recreational activities on phobic attitudes of the university students with social phobia: a comparative study. Anatolian J. Psychiatry 11:139-144
Karakucuk S (2008). Recreation, evaluation of leisure time. Gazi Publisher, Ankara, Turkey.
Kitano MK, Lewis RB (2005). Resilience and coping: Implications for gifted children and youth at risk. Roper Review 27:200-205.
Korkmaz NH (2007). The connection between summer sport schools and the self esteem in children. Uludag University, J. Educ. Faculty 20(1):49-65.
Kucuk DP (2011). Self-esteem and self-efficacy perception for music talent in children participating and not participating in music activities. Elementary Educ. Online 10(2):512-522.
Oktan V (2012). Hope as a moderator for the improving psychological endurance. Int. J. Hum. Sci. 9(2):5-11.
Onur B (2000). Development Psychology. Imge Publishing. Ankara. Turkey.
Ozogul SN (1988). Effect to self-esteem of the child of mother's work and some individual qualities. Unpublished master's thesis, Hacettepe University, Ankara, Turkey.
Piskin M (1996). Self-esteem, locus of control and academic achievement of secondary school children both in England and Turkey. Unpublished doctoral dissertation, University of Leicester, İngiltere.
Sayar K (2003). Self-esteem and personality in terms of cultural overview. New Symp. 41(2):78-85.
Seyhan D, Zincir H (2009). Examining self esteem level in arrested /convicted youth and the family features/ determining the correlation between them. The J. Research, Family-Society and Education and Culture. October-November-December, 5(19):7-24
Shotade AR (2010). Ritual aspects of sports consumption: how to sports fans become ritualized? Int. Sci. Congress. Perspectives in Physical Education and Sport. (10th edition), Constanta, Romania.
Snyder CR, Hoza B, Pelham WE, Rapoff M, Ware L, Danovsky M, Highberger L, Rubinstein H, Stahl KJ (1997). The development and validation of the children’s hope scale. J. Pediatric Psychol. 22(3):399-421.
Snyder CR, Ilardi SS, Cheavens J, Michael ST, Yamhure L, Sympson S (2000). The role of hope in cognitive behavior therapies. Cognit. Therapy Res. 24:747-762.
Stekel W (1997). Letters to a mother. Translation: Ali Cankırılı. Timas
publications, Istanbul. Sengul HA, Canturk N, Canturk G, Dagalp R (2012). Evaluation of the
children on trial in the Ankara 1.st Children's high criminal court for peer abuse. Turk. Arch. Pediatrics 47:283-289.
Toker T, Tiryaki A, Ozcurumez G, Iskender B (2011). The relationship between traumatic childhood experiences and proclivities towards substance abuse, self-esteem and coping strategies. J. Turk. Psychiatry 22(2):83-92.
Tracy AJ, Erkut S (2002). Gender and race patterns in the pathways from sports participation to self-esteem. Sociol. Perspect. 45(4):445-466.
Tremblay MSJ, Inman W, Williams JD (2010). The relationship between physical activity, self-esteem, and academic achievement in 12-year-old children. Paediatric Exerc. Sci. 12:312-323.
Turan N, Tufan B (1987). Coopersmith self-esteem inventory (SEI) validity-reliability study. 23rd Nat. Congress of Psychiatry and Neurological Sciences. Istanbul, Turkey.
Unal F (2008). Child abuse and neglect children in family. J. Turk. Social Res. (TSA), April, 9-18, 12(1):9-18.
Walters ST, Martin JE (2000). Does aerobic exercise really enhance self-esteem in children? a prospective evaluation in 3rd - 5th graders. J. Sport Behav. 23(1):1-10.
Whitehead JR, Corbin CB (1997). Self-esteem in children and youth: the role of sport and physical education. In: K.R. FOX (ed.) The physical self: from motivation to well-being. Champaign, IL, US: Human Kinetics pp. 175-204.
Yarımel L (2014). http://www.memleket.com.tr/ The project that our future is safe with sport-300463h.htm (Retrieved August 08, 2014)
Zengin Z, Kesgin M (2013). The interaction of local management with institutional players for the prevention of juvenile delinquency. Dumlupınar university, J. Soc. Sci. 37:13-31.
i It was presented at the international conference on lifelong learning and leadership for all.

Vol. 11(14), pp. 1331-1337, 23 July, 2016
DOI: 10.5897/ERR2016.2836
Article Number: 8E0685659532
ISSN 1990-3839
Copyright © 2016
Author(s) retain the copyright of this article
http://www.academicjournals.org/ERR
Educational Research and Reviews
Full Length Research Paper
Investigating the awareness and knowledge of secondary school students about the effects of allergic
pollen on human health: A case of Burdur Province
Kadir Tuzlak
Department of Elementary Education, Faculty of Education, Suleyman Demirel University, Isparta, Turkey.
Received 14 April, 2016; Accepted 24 June, 2016
The overall objective of this study is to increase the awareness of secondary school students of the effects of pollen allergy on human health by mapping allergic pollens appearing in Burdur atmosphere. This study is a pre-test and post-test experimental design. Mix method is applied thus. Both qualitative and quantitative data are gathered. The sample of this study consists of students in 6
th and 7
th grades in
Alpaslan Ali Can Secondary School, Burdur. Pre-treatment and post-treatment questionnaire and achievement test are administered in order to determine the effectiveness of the education seminar given on the effects of pollen allergy. According to the findings obtained from the analysis of the achievement test, cognitive awareness of the students about the effects of pollen allergy on human health is found to be higher. Post-treatment results obtained from the questionnaire show there is increase in awareness of the students about the importance of pollen allergies and how to take precautions. Key words: Polinization, hay fever, human health, secondary school students.
INTRODUCTION The first study on Aeropalinologic was conducted by Blackeley in the United Kingdom in 1866. Blackeley proved that pollens cause hay fever by carrying out a skin test (Pehlivan ,1995).The studies on the presence of pollens in the atmosphere of Turkey began with the studies of Özkaragöz and Karamanoğlu on pollens and spores in the atmosphere of Ankara (Capital City of Turkey) in 1967. Afterwards, İnceoğlu et al. (1994) make contribution to Aeropalinologic studies with their research on the atmospheric pollen concentration in Ankara. In
this study, they analyzed the presence and concentration levels of pollens between 1990-1993 in Ankara. Davies and Smith(1973) state that pollen concentrations are effected by such factors as season, precipitation, sunlight, temperature and wind.
Aytug et al. (1990), examining the allergenic plants in the region of Thrace, indicated the importance of pollen analysis and consequently prepared allergenic pollen calendar for Istanbul city and its surroundings. In addition, they specify how to use allergenic pollen
E-mail: [email protected].
Authors agree that this article remain permanently open access under the terms of the Creative Commons Attribution
License 4.0 International License

1332 Educ. Res. Rev. calendar and refer to the importance of informing people about pollen dissemination periods.
Pollens appearing abundantly and prevalantly in the atmosphere affect us as soon as they reach our respiratory organs via breathing and cause allergic diseases. In order to take precautions against them, creating pollen allergenic calendar of the region via detection of allergenic pollen and their concentration in the atmosphere is of vital importance (Aytuğ et al., 1995).Pehlivan (1995) indentifies the fact that pollen calendars depend on the climate and echological conditions of certain regions in certain period, and in his book entitled “Turkey's Allergenic pollens Atlas”, he exhibits the importance of these pollen calendars by stating that they include crucial information for both doctors and patients.
On the other hand, Kalyoncu (1994) conducts a review study to evaluate the state of allergic asthma and other allergic diseases across the world. Moreover, he introduces data on the allergic diseases occuring in Turkey. . Effects of pollen allergy on human health
Specific IgE (immunoglobulin E) is defined as the antigens that stimulate antibody formation and react with this antibody. Being influenced by allergens is an important risk factor for the development of allergic respiratory tract disease which affects one third of the world population. In 1873, Charles Blackley discovered that pollens cause allergic diseases thereupon; studies conducted on this issue specify the fact that pollens take important place underlying allergic diseases (Brusic et al., 2003).
Pollens are the first distinguished allergens dispersed into the environment in various ways depending on a particular month in the blooming period. For instance; pollens carried by wind are quite aerodynamic and may cause sensitivity by moving away 200 km from the pollen sources. They are elliptical or circular in shape. On the other hand, the pollens carried by insects are the pollens of colorful and flowery plants and they are moist and sticky. People having direct contact with such pollens are more likely to develop allergic disease.
Allergenic degrees of pollens depend on the abundance of plants disseminating these pollens and the amount of the pollens appearing in the atmosphere. To assist in the diagnosis and treatment of these diseases, recognition and naming of the morphologies of allergen pollens and their amount in the atmosphere as well as the surrounding vegetation and determination of the blooming period are of great importance. While the beginning period in which allergen pollens appear in the atmosphere, the maximum concentration they reach and the ending period are announced in the daily meteorology broadcasts, they should also be continuously publicized via radio, television and newspapers (Pehlivan, 1984,
1995; Esch et al., 2001). Pollen allergies have considerable clinical importance in the world and a significant increase is observed in the prevalence of allergic reactions caused by pollens. Pollen allergy research conducted in Europe reports that dissemination period is a six-month period extending from spring to autumn (D'Amato et al., 1998).
Pollens of plants of Gramineae are regarded as the most important allergen sources worldwide. Pollens of this family have been reported as important aeroallergens in many countries (Baldoet al., 1982; Bousquetet al., 1984 and Malik et al., 1991). Approximately 50% of the allergic patients show sensitivity to Gramineae pollen (Corti et al., 2005).
Pollen allergy is mostly seen in people between the ages of 5-40, and the number of people contracting this disease now seems to increase. Allergies can cause complaints by affecting different organ systems. If the nose is affected, it is known as "allergic rhinitis "; if it affects the lungs, it is known as "allergic asthma". Pollen allergy is also popularly known as seasonal allergy in medicine and hay fever in colloquial language (Topalet al.2014). The knowledge of allergies may help to prevent their influence and their management (Twichell et al., 2015).
Pollens in the atmosphere mostly settle into the body through inhalation. The immune system actually sees these harmless pollens as enemies and save data bank and surveil. The most important symptoms are recurrent colds, nasal itching, nasal congestion and sneezing at least 4-5 times in succession. Other symptoms are as follows; 1. Cough due to postnasal drainage, vomiting, abdominal pain and poor appetite, 2. Hearing loss due to effusion, 3. Sinusitis depending on the infection tendency of the allergies, 4. Frequent throat infections in the mouth depending on nasal congestion, 5. Striae on the nose due to wiping also known as allergic salute, 6. Itching and watery eyes, eye redness, swelling of the eyelids, 7. Shade color is observed under the lower eyelid skin of the children with allergic rhinitis.
The accuracy of diagnosis is important to guide treatment. For instance, untreated rhinitis not only causes future asthma, sinusitis, lower respiratory tract infections, otitis media, nasal polyps and dental malocclusion, it may also negatively affect one‟s quality of life, intellectual capabilities, work and school performance as well (Kavutet al. 2012).
There is an urgent need to inquire into the allergy management plans and policies in schools and to develop teacher education organizations on the subject.
Teachers and students in K-12 level are not fully aware

of allergic pollens; both training and informative seminars need to be organized for them (Ercan et al., 2012; Polloni et al., 2013). Therefore, the purpose of this study is to investigate the awareness and knowledge of secondary school students about the effects of allergic pollen on human health in Burdur located Southwest of Turkey.
Measures to be taken to protect one from pollens
1. You should not go outdoors from 05.00 a.m to 10.00 a.m when the pollens are disseminated intensively in the atmosphere. However, you can go out with the mouth and nose masks on you. 2. You should not do sports outdoors at pollen times. 3. Hair keeps dust. Therefore, take a shower; wash your hair every evening. So you can rid of the dust on you. 4. Make sure your children change their clothes after coming from outside. 5. Do not open the window while in the car. Use the air conditioner for air exchange. 6. Prefer the seaside for holidays. 7. Use sunglasses and hat outdoors. Wash your sunglasses under water every day. 8. Consult a doctor for allergy. 9. Avoid mowing the lawn or use mask while mowing. MATERIALS AND METHODS In this study, pollen movement in Burdur (a small city of Turkey) was investigated for 5 months. Durham instrument is used for this. The Durham sampler is the standard instrument and a traditional and representative method for sampling and collecting airborne pollen (Durham 1946). After creating the pollen map in Burdur atmosphere, the following procedures are applied to the students selected as the study group. Research design In the study, pretest and post-test model forms the basis of the experimental model. Mix method combining quantitative and qualitative data collection methods is used. Sample of the research The sample of this study consists of 50 students in 6th and 7th grades in Alpaslan Ali Can Secondary School in Burdur. However, considering the participation on voluntary base, data obtained from the students with poor attendance are excluded from the study. Data collection tools and process Pre-treatment and post-treatment 5 items-questionnaire and achievement test are administered in order to determine the effectiveness of the education seminar given on the effects of pollen allergy. Experts‟ opinion is consulted in order to determine the validity and clarity of the questionnaire items. On the other hand, the opinions of relevant experts are taken in order to ensure achievement test validity.
Reliability study of the achievement test is administered based on
Tuzlak 1333 the results of this study since no study has been conducted on this test. Data analysis The data obtained in this study are analyzed by SPSS Windows 21.0 (Statistical Package for the Social Sciences). Data are analyzed using descriptive statistical methods (Number, percentage, mean, standard deviation). These statistics are used to summarize data and provide information about the sample from which the data were drawn and the accuracy with which the sample represents the population of interest. The mean, median, and mode are measurements of the “central tendency” of the data. Paired sample t-test is used to compare quantitative data obtained from pretest and post test result of the groups.
Research application process Education environment Trainings were given to participants in Alpaslan Ali Can Secondary School. It was conducted in the learning environment equipped with computer and overhead projector (Table 1). Education process A 3-day training program was prepared for the participants. In the first day of the training program, questionnaire (15 min) and pre-test (25 min) were conducted. In the second day, a seminar was given on the pollen and pollen allergy. In the last day (3rd day), the questionnaire was administered (15 min); additionally, post-test was applied to participants.
In preparing for the training program, active participation of the students is taken into consideration. The use of learner-centered teaching and learning approaches and methods are so important in modern education (Modan, 1995). Constructive teaching approaches were applied during the training session. Constructivist approach in teaching is an approach that requires active participation of students during the teaching process. Research found that the mean achievement of the students who participated actively in teaching learning process was greater than their counterparts who attended traditional classes (Brooks & Brooks, 2001; Bhattacharjee, 2015 and Juvova et al, 2015).The training process is conducted on the basis of reciprocal questions and answers. FINDINGS The findings of the study are presented on the basis of data collection instruments used.
Findings obtained from questionnaire Content analysis is administered to analyze the data (qualitative data). The following steps are followed in the content analysis. Content analysis is a research technique for systematically analyzing written text data collected from the participants. Content analysis can help be used to identify propaganda or describe attitudes and psychological states (Hardy et al., 2004). It is a research

1334 Educ. Res. Rev.
Table 1. Descriptive statistics of participants.
Tables Variables Frequency Percentage
Grade level
6 22 56.4
7 17 43.6
Total 39 100.0
Gender
Female 24 61.5
Male 15 38.5
Total 39 100.0
tool used to determine the presence of certain words or concepts within texts or sets of texts. The following steps are followed in the content analysis: 1. Code numbers given to each student instead of their name are used in the analysis of qualitative data. 2. Answers given by the students for each question of the survey are combined in the computer environment. That is, for example all responses to question 1 are gathered together. This procedure is applied for all questions. 3. Improper answers are excluded from the research study. 4. Responses are classified according to similarities and differences. 5. Codes related with each other are grouped under a specific category. In this research, the data obtained from questionnaires administered in pre and post training are categorized under such subtitles as importance of pollens, possible cases occurring in the absence of pollens, negative effects of pollens on people, factors causing allergies and allergy prevention methods. Importance of pollens Students' opinions on the importance of pollens are introduced under two headings for Environment and society. Pre-treatment findings indicate that students state the importance of pollens for environment as growth of plants (38%), necessary for honey process (36%) and effective for protecting nature (13%). However, after post-treatment, significant increase (74%) is observed among the students who identify another important duty of pollens such as propagation of plants/ensuring polinization. Considering that the most important task of pollens is polinization, after training there seems to be an increase in the students‟ awareness.
In the pre-treatment process, students indicate the importance of pollens as follows: source of income (horticulture 13%), ensure the continuity of life (13%), raw materials for fruit nutrition (2%) whereas, post-treatment provides us the same answers with different
results: source of income (0%),ensure the continuity of life (23%), raw materials for fruit nutrition (77%). As a result, it can be said that there is an increase in students‟ awareness after treatment of the importance of pollens for environment and society. Possible cases occurring in the absence of pollens The students are asked about the possible cases which may occur in the absence of pollens and their answers are categorized as environment-based and society-based. In their society-based views, such opinions as the importance of honey as bee product (36%), mal-nutrition of people (10%), bad health (38%) as well as causing allergy and reduction in plant diversity(15%) are the main answers reported by the students in the pre-treatment. In their society-based views, they uttered such opinions as plants with blooming problems (59%), breaking the food chain (30%) not of any importance (2%).After training, increase in malnutrition (70%) and plants with blooming problems (77%) rise as well. This case indicates that increase in their awareness is realized as they are now well aware of the possible results in the absence of pollens. Negative effects of pollens on people In pre-treatment, majority of the students give such answers to the question “What are the negative effects of pollens on people?” as itching eyes, sneezing (77%), no effect on human health (8%) and heart attack, stroke (5%)as well as nasal itching and body itching (10%).
In post-treatment, the answers itching eyes, sneezing (100%) are observed to increase. This case is an indicator of increased awareness of the levels of the main symptoms of pollens. Factors causing allergies In pretreatment process, the answers given to the question on the factors causing allergies by the participants

Tuzlak 1335
Table 2. Pretreatment and post treatment achievement results of the participants (secondary school 6th and 7th graders) in terms of gender.
Variables Group N Mean St.Dev. t p
Pretreatment achievement test Female 24 4.250 2.090
0.340 0.736 Male 15 4.067 1.280
Post treatment achievement test Female 24 8.375 1.498
0.962 0.342 Male 15 7.867 1.767
Table 3. Pretreatment and post treatment achievement results of the participants (secondary school 6th and 7th graders) in terms of their grade levels
Variables Group N Mean St. Dev. t p
Pretreatment achievement test 6 22 4.636 1.840
1.856 0.071 7 17 3.588 1.622
Post treatment achievement test 6 22 8.182 1.500
0.010 0.992 7 17 8.176 1.776
are: “Pollen (20%), animal feather (3%), house dust (5%) and all (72%)”; on the other hand, post treatment results demonstrate that all (100%) is answered by the students.
Allergy prevention methods If pollens cause allergy, what are their prevention methods? This question is answered thus, „You shouldn‟t go outdoors from 05.00 a.m. to 10.00 a.m. when the pollens spread intensively in the atmosphere (23%)‟,„buying allergy pills from pharmacy and using them regularly (59%)‟, „pollens do not cause allergy (5%)‟,„consult a doctor for allergy and take syrup (13%)‟.
After seminars, the answer “You shouldn‟t go outdoors from 05.00 a.m. to 10.00 a.m. when the pollens spread intensively in the atmosphere (100%) is observed to increase significantly.
Findings obtained from achievement tests
Within the scope of this study, achievement tests administered in pre and post training are presented in order to indicate the difference among students‟ cognitive awareness in allergic rhinitis caused by pollens. According to the grade level distribution, 22 students (56.4%) are 6
th graders and 17 students (43.6%) are 7
th
graders .According to the gender distribution, 24 of them are females (61.5%) and 15 them are males (38.5).
Participants who have allergic diseases or affected by pollen were excluded from the study (Table 1). There is no statistically significant difference between pretest and posttest results of the participants in terms of their gender when analyzing their t-test results administered to determine whether there is a difference or not (t=0.340;
p=0.736>0.05) (Table 2). In addition, no significant difference is observed
between pretest and posttest results of the participants in terms of their gender when analyzing their t-test results applied to identify whether there is a difference among group averages. (t=0.962; p=0.342>0.05).
There is no statistically significant difference in pretest results of the participants in terms of their grade level based on the result of t-test used to examine inter-groups averages (t=1.856; p=0.071>0.05) (Table 3).
Besides, no significant difference is found in post test results of the participants in terms of their grade level based on the result of t-test used to examine inter-groups averages. (t=0.010; p=0.992>0.05).
Findings obtained from the analysis results in order to determine whether there is a significant difference between pretreatment and post treatment achievement tests of the students are introduced in Table 4 and Figure 1. In paired sample t-test results of the participants administered to see whether there is a difference between pretreatment and post treatment achievement tests of the students, significant difference is observed between arithmetic means (t=-10.999; p=0.000<0.05). Achievement test mean scores of the 6
th and 7
th graders
are lower in pretreatment process (x = 4.180) than those of post treatment process (x = 8.180) (Table 5 and Figure 2).
DISCUSSION This study represents an investigation of the awareness and knowledge of secondary school pupils about the effects of allergic pollen on human health. The findings of the study showed that after the training students‟ awareness towards allergic pollens was increased.

1336 Educ. Res. Rev.
Table 4. Difference between pretreatment and post treatment achievement tests of the participants.
Groups N Mean St. Dev. sd t p
Pretreatment achievement test 39 4.180 1.805 38 -10.999 0.000
Post treatment achievement test 39 8.180 1.604
Figure 1. Difference between Pretreatment and Post treatment Achievement Tests.
Table 5. Difference between pretreatment and post treatment achievement tests of the participants
Groups N Mean St. Dev. sd t p
Pretreatment achievement test 39 4.180 1.805 38 -10.999 0.000
Post treatment achievement test 39 8.180 1.604
Figure 2. Difference between pretreatment and post treatment achievement tests of the participants.

Allergic pollens have the potential to trigger respiratory problems. Therefore, increasing students‟ awareness on allergic pollens is a significant issue from human health perspective. Furthermore, the findings obtained from the analysis of achievement test, cognitive awareness of the students about the effects of pollen allergy on human health is found to be higher. Post-treatment results obtained from the questionnaire show increase in awareness of the students of the importance of pollen allergies and how to take precautions. The current research studies are by definition constrained by sample size but allow for a deeper exploration of life experience. According to the findings obtained from the achievement tests after mapping pollen atmosphere of Burdur, it is concluded that significant increase is observed in the cognitive awareness level of secondary school students about pollen allergy. According to the findings obtained from survey data (qualitative data), after training, students‟ awareness on the important effects of pollen allergy on human health is found to increase. Conflict of Interests The author has not declared any conflict of interests. REFERENCES Aytuğ B, Yaltırık F, Efe A (1995). Allergenic pollen producing plants of
Turkey. In: Aytuğ B (ed.): Proceedings of the National Palynology Congress, 21–23 December, İstanbul University, Forest Faculty, İstanbul. pp. 201-212.
Aytug B, Efe A, Kursad C (1990). Trakya'nın allerjen polenleri (Allergent pollence of thrace) Allergen pollens of Thrace. Acta Pharm. Turcica 32:67-88.
Baldo BA, Sutton R, Wrigley CW (1982). “Grass allergens with particular reference to cereals”, Prog. Allergy, 30: 1-66.Bhattacharjee, J. (2015) Constructivist Approach to Learning– An Effective Approach of Teaching Learning. Int. Res. J. Interdiscipl. Multidiscipl. Stud. 1(4):65-74.
Brusic V, Millot M, Petrovsky N, Gendel SM, Gigonzac O, Stelman SJ (2003). Allergen databases. Allergy 58(11):1093-1100.
Brooks JM, Brooks MG (2001). Chapter 9. Becoming a Constructivist Teacher. In In Search of Understanding: The Case for Constructivist Classrooms (2nd ed.)
Bousquet J, Cour P, Guerin B, Michel FB (1984). Allergy in the Mediterranean area. I. Pollen counts and pollinosis of Mont Pellier. Clin. Allergy 14:249-258.
Corti V, Cattaneo A, Bachi A, Rossi RE, Monasterolo G, Paolucci C, Burastero ES, Alessio M (2005). Identification of Grass Pollen Allergens by Two-Dimensional Gel Electrophoresis and Serological Screening. Proteomics 5:729-736.
D‟Amato G, Spieksma FTh M, Liccardi G (1998). Pollen-related Allergy in Europe. Position Paper of the European Academy of Allergology and Clinical Immunology. Allergy 53:567-578.
D‟Amato G (2000). Urban Air Pollution and Plant Derived Respiratory Allergy. Clin. Exp. Allergy 30:628-636.
Tuzlak 1337 Davies RR, Smith LP (1973). Forecasting the start and severity of the
hay fever season. Clin. Allergy 3:263-267. Durham OC (1946). The volumetric incidence of atmospheric allergens
IV. A proposed standard method of gravity sampling, counting, and volumetric interpolation of results. J. Allergy 17:79-86.
Ercan H, Ozen A, Karatepe H, Berber M, Cengizlier R (2012) Primary school teachers‟ knowledge about and attitudes toward anaphylaxis. Pediatr. Allergy Immunol. 23:428-432.
Esch RE, Hartsell CJ, Crenshaw R, Jacobson RS (2001). Common allergenic Pollens, Fungi, Animals, and Artropods. Clin. Rev. Allergy Immunol. 21:261-263.
Hardy C, Harley B, Phillips N (2004). Discourse analysis and content analysis: two solitudes? Qual. Methods (newsletter of the APSA Organized Section on Qualitative Methods) 2(1):19-22.
Juvova A, Chudy S, Neumeister P, Plischke J, Kvintova J (2015). Reflection of Constructivist Theories in Current Educational Practice. Universal J. Educ. Res. 3(5):345-349.
Kalyoncu AF (1994). Türkiye‟de Astım ve Alerji Hastalıklarının Konumu ve Epidemiyolojisi. Medikal Dergi. 100:49-55.
Kavut AB, Kalpaklıoğlu F, Atasoy P (2012). Contribution of neurogenic and allergic ways to the pathophysiology of nonallergic rhinitis. Int Arch Allergy Immunol. 160:184-191.
Malik P, Singh AB, Babu CR (1991). Atmospheric concentration of pollen grains at human height. Grana 30:129-135.
Modan A (1995). Psikoloji müzeye giriyor. Siyah Beyaz Gazetesi 26:10. Pehlivan S (1995). Türkiye‟nin Alerjen Polenleri Atlası. Ankara: Ünal
Offset. Pehlivan S (1984). Aeropalinolojik çalışmaların tıptaki önemi”, Türk
Hijyen ve Deneysel Biyoloji Dergisi 41(3):315-323. Pehlivan, S (1994). Scanning electron microscope studies of the pollen
grains of some Turkish endemic Centaurea. J. Fac. Pham. Gazi 11(2):205-211.
Polloni L, Lazzarotto F, Toniolo A, Ducolin G, Muraro A (2013). What do school personnel know, think and feel about food allergies? Clin. Transl. Allergy 3:39.
Topal E, Bakirtas A, Yılmaz O, Karagöl IHE, Arslan U, Arga M, Demirsoy MS, Turktas I (2014).June. Predictive factors to differentiate between allergic and nonallergic rhinitis in children. In International forum of allergy & rhinology 4(6):447-452.
Twichell S, Wang K, Robinson H, Acebal M, Sharma H (2015). Food Allergy Knowledge and Attitudes among School Nurses in an Urban Public School District. Children 2(3):330-341.

Vol. 11(14), pp. 1338-1343, 23 July, 2016
DOI: 10.5897/ERR2016.2727
Article Number: 6E6A71359534
ISSN 1990-3839
Copyright © 2016
Author(s) retain the copyright of this article
http://www.academicjournals.org/ERR
Educational Research and Reviews
Full Length Research Paper
Metaphor perceptions of pre-service teachers towards mathematics and mathematics education in
preschool education
Oğuz Keleş*, Işıl Taş and Durmuş Aslan
Faculty of Education, Çukurova University, Turkey.
Received 29 February, 2016; Accepted 20 June, 2016
The aim of this study was to identify the thoughts of pre-service teachers, who play an important role in the early preschool experience of children in mathematics, towards the concepts of mathematics and education of mathematics with the help of metaphors. The study group of the research consists of a total of 227 pre-service teachers at the Department of Preschool Education, Faculty of Education, Cukurova University in the 2013–2014 academic years. The data of the study were collected by asking preservice teachers to complete some sentences like “do you think, education of math is like …. in the preschool education; because Math is like …; because….”. The responses obtained from pre-service teachers were categorized by content analysis. As a result of the study, seven categories created by preservice teachers towards the concepts of mathematics and education of mathematics are as follows: the source of life-itself, mathematics using skills of mental processes, math facilitating the fun learning, cumulative math facilitates life, complicated math difficult to learn and boring math. There are 223 metaphors in 112 types in this category. Considering the categories created, there are five positive and two negative categories. The rates of positive categories were calculated as 88.8%, while the rates of negative categories were 11.2%,. This shows that pre-service teachers produce mostly positive metaphors about mathematics and education of math and they have positive beliefs. As a result of the research, the categories like the source of life-itself, mathematics using skills of mental processes and math facilitating the fun learning come to the forefront. Key words: Preschool, metaphor, mathematics, mathematics education.
INTRODUCTION The knowledge, belief and attitudes with respect to mathematics, science, music and many other fields are been developed in the preschool period. Math is closely related to concrete experiences of children towards their concept development. Since mathematics is an important part of early childhood, knowledge and concepts of
mathematics gained in the preschool period will allow children to integrate into society as individuals who can use mathematics in the future (Akman, 2002).
The preschool is important since it is the first step for children to interact with the outside world after their families (Aslan, 2013). Since the first identification model
*Corresponding author. E-mail: [email protected].
Authors agree that this article remain permanently open access under the terms of the Creative Commons Attribution
License 4.0 International License

is preschool teachers after mother and father, they are important in shaping the character of the children (Aslan et al., 2015). Therefore, preschool teachers are critical in child development (Yavuzer, 2007). Children attending preschools are influenced by opinions, attitudes and behaviors of their teachers either consciously or unconsciously (Aslan et al., 2013). Thus, perceptions, attitudes and behaviors of teachers in preschool, which is the first step of education life and formation and shaping period of perceptions of children towards mathematics, have critical importance for children attending preschools (Aslan, 2013).
Metaphors are powerful tools used to present perspectives of pre-service teachers regarding mathematics and reflect their past experiences, present and prospective thoughts (Güveli et al., 2011). The concept of metaphor is defined in different ways by researchers. The word metaphor is generated from “Metapherein” in Greek. Considering the structures forming this word, “Meta” means changing and “pherein” means coding (Levine, 2005). According to the definition of Lakoff and Johnson (2005), metaphor is not only an idea material, a form of human understanding and figure of word, but also a figure of thinking. Metaphors are one of the most powerful mental tools structuring, navigating and controlling our thoughts about formation and process of events such as analogies, metaphors, figures and figures of speech (Yalçınkaya, 2013). Although, metaphors are managing our daily thoughts and actions in a conscious or unconscious way, they are used to show how realities and life are interpreted (Kılıç and Arkan, 2010). Metaphors are often used in educational research to determine the concept traces in the minds of people by other words not related to these concepts. Metaphors can be used to identify different dimensions of a concept in different ways (Saban, 2009). In recent years, another reason why metaphorical method is increasingly used in the studies is that understanding physical and social reality is already metaphorical (Özdemir, 2012).
Metaphors are considered to be a method providing rich data in terms of allowing individuals to establish strong links with other existing schemes in their minds to understand their world better. However, no study has been conducted yet to investigate thoughts of prospective preschool teachers regarding mathematics and education of mathematics by using metaphors in the literature. In this context, this study aimed to determine how prospective preschool teachers perceive mathematics and education of mathematics through metaphors. Objective
The purpose of this research was to determine thoughts
Keles et al. 1339 of pre-service teachers towards the concepts of mathematics and education of mathematics with the help of metaphors. In this regard, the following questions were tried to answer: 1. What are the metaphors of prospective preschool teachers regarding the concepts of mathematics and education of mathematics? 2. Under what categories can these metaphors be grouped in terms of common characteristics? METHODOLOGY In this study, one of the qualitative research methods, phenomenology design was used. In this approach, cases that the authors are aware of but do not have detail understanding on are investigated. The aim of the phenomenology approach is to present and interprete individual perceptions about a case in general (Yıldırım and Şimşek, 2008). Individuals with the data obtained in studies using phenomenology approach experience, reflect or externalize these events. In this context, perceptions of pre-service teachers regarding mathematics and education of mathematics were discovered and reviewed. Participants Participants consist of 227 pre-service teachers including 46 freshmen, 44 sophomore, 65 junior and 72 senior students at the Çukurova University, Department of Preschool Education in the academic years of 2013–2014. Data collection In this study, preservice teachers were asked to fill out the questionaire to collect the data. A number is given to each pre-service teacher’s form. The numbers represent those pre-service teachers (e.g. PT-1, Pre-service teacher 1). Preservice teachers were asked to complete some sentences like “Do you think, education of math is like …. in the preschool education; because Math is like …; because….” and their responses were grouped under specific thematic titles. In this context, they were asked to produce a single metaphor for each concept and explain why they used this metaphor. Data analysis The data collected in this study were analyzed using content analysis, which is one of the qualitative data analyses. The blank answers or answers with no metaphors were excluded. After this step, metaphors were analyzed and grouped by their subject, attributed thought and source and then these metaphors developed by preservice teachers were presented in tables with the number of preservice teachers (f) representing the metaphor and percentage (%) values. In the last step, metaphors with common characteristics identified by the researchers were presented as categories that can meet these common characteristics. In the categorization process, the reliability formula proposed by Miles and Huberman (1994) was used for reliability calculation of the research. Accordingly, (Reliability = consensus / consensus + disagreements) was used. As a result, the reliability of the research was found to be 93%.

1340 Educ. Res. Rev. Table 1. The metaphors produced about the category of “mathematics is the source of life”.
Categories Metaphors related to math Metaphors produced related to the education of math
The number of metaphor
types
The number of metaphors produced
Ratio by the number of metaphors
Math is the source of life
Life (5), tree (4), brain (3), logic (2), the essential part of life (2), engine of a car, air, God, life itself, life, source of life, breath
Base (12), water (6), tree (3), life (3), building (2), mother, breastfeeding, sleep, bread, olive pits
22 55 24.7
Table 2. The metaphors produced about the category of “mathematics using skills of mental processes”.
Categories Metaphors related to math Metaphors produced related to the education of math
The number of metaphor
types
The number of metaphors
produced
Ratio by the number of metaphors
Mathematics using the skills of mental processes
Puzzle (24), riddle (2), the path going to the same destination (2), cooking, photograph, Sudoku, reasoning with numbers, brain exercise, cycling of the brain, driving, science brain exercise, machine, chess
Crossword (6), puzzle (3), mental sports (2), chamomile fortunes (2), peas, chess, going to the market, race.
25 56 25.1
RESULTS In light of the findings of the research, seven categories were created from metaphors generated by preservice teachers with regard to mathematics and education of mathematics. There are 223 metaphors in 112 types in this category. These categories are the source of life-itself, mathematics using skills of mental processes, math facilitating the fun learning, cumulative math facilitates the life, complicated math difficult to learn and boring math. Considering the categories created, there are five positive and two negative categories. The rate of positive categories was calculated as 88.8%, while the rate of negative categories was 11.2%, respectively. The metaphors produced about the category of “Mathematics is the Source of Life” are given in Table 1. Considering the data given in Table 1, there are a total of 55 metaphors produced in 22 different from each other by prospective preschool teachers about the category of “Mathematics is the Source of Life”. In this category, the most-produced metaphors about mathematics were “life, tree and brain”. On the other hand, the most-produced metaphors about education of mathematics were “base, water, tree and life”. The metaphors developed by preservice teachers within this category are as follows:
For breath metaphor; “If we cannot imagine a life without breathing, then we cannot imagine a life without mathematics” (PT-25). For tree metaphor; “When you add water to a young tree, you can see how it grows.
Mathematics is like this and it is the base in the preschool period. This tree will grow with additions in the following years” (PT-43). The metaphors produced by prospective preschool teachers about the category of “Mathematics Using Skills of Mental Processes” are presented in Table 2.
There are a total of 82 metaphors produced in 26 different from each other by prospective preschool teachers about the category of “Mathematics Using Skills of Mental Processes”. In this category, the most-produced metaphors about mathematics were “puzzle, riddle and the path going to the same destination”. On the other hand, the most-produced metaphors about education of mathematics were “games, crossword and puzzle.” The metaphors developed by preservice teachers within this are as follows: For Sudoku metaphor; “when you get the logic of the game, and understand the operations, you solve the puzzle” (PT-53). For the game metaphor; “You are replacing numbers with each other, it is like a game” (PT-25). The metaphors produced by prospective preschool teachers about the category of “Mathematics Facilitating the Fun Learning” are presented in Table 3.
Considering the data given in Table 3, there are a total of 28 metaphors produced in 14 different from each other by prospective preschool teachers about the category of “Mathematics Facilitating the Fun Learning”. In this category, the most-produced metaphors about mathematics were “games, happiness and love”. On the

Keles et al. 1341 Table 3. The metaphors produced about the category of “mathematics facilitating the fun learning”.
Categories Metaphors related to math Metaphors produced related to the education of math
The number of metaphor
types
The number of metaphors produced
Ratio by the number of metaphors
Mathematics Facilitating the Fun Learning
Games (14), happiness (2), love (2), songs, fun visits, delight, drum, chocolate, shopping, music
Game (26), story reading, music, appetizers
15 54 24.2
Table 4. The metaphors produced about the category of “cumulative mathematics”.
Categories Metaphors related to math
Metaphors produced related to the education of math
The number of metaphor
types
The number of metaphors
produced
Ratio by the number of metaphors
Cumulative Math Constant dropping, chains, ladder, web, pulley, rapid succession
Ladder (3), organism, star, growing plants, chains
11 13 5.8
Table 5. The metaphors produced about the category of “mathematics facilitating the life”.
Categories Metaphors related to math Metaphors produced related to the education of math
The number of metaphor
types
The number of metaphors
produced
Ratio by the number of metaphors
Mathematics facilitating the life
Brother, friend, a new language, movie, elevator, trust, money, sports shoes, whole wheat bread, cake mold, investing in future
Drugs (3), problem solving (2), flotation ring, invention, trailer, pencil
17 20 9
other hand, the most-produced metaphors about education of mathematics were “reading stories, music and appetizers”. The metaphors developed by preservice teachers within this category are as follows: For the game metaphor: “Children have fun when they are learning and participate in the active learning process, they interact with numbers and concepts in math as they interact with their friends in games” (PT-72). For the appetizers metaphor, “It is both fun and useful” (PT-15). The metaphors produced by prospective preschool teachers about the category of “Cumulative Mathematics” are presented in Table 4.
There are a total of 13 metaphors produced in 11 different from each other by prospective preschool teachers about the category of “Cumulative Mathematics”. In this category, the participants produced 6 metaphors about mathematics. On the other hand, the most-produced metaphor about education of mathematics was “ladder”. The metaphors developed by preservice teachers within this category are as follows: For the sudden succession metaphor, “When you learn important points, formulas and methods, it comes
easily and quickly” (PT-127). For ladder metaphor, “children receive education in phases, they need more knowledge as they get higher on the ladder” (PT-145). The metaphors produced by prospective preschool teachers about the category of “Mathematics Facilitating the Life” are presented in Table 5.
Considering the data given in Table 5, there are a total of 20 metaphors produced in 17 different from each other by prospective preschool teachers about the category of “Mathematics Facilitating the Life”. In this category, the participants produced 11 metaphors about mathematics. On the other hand, the most-produced metaphors about education of mathematics were “drugs and problem solving”. The metaphors developed by preservice teachers within this are as follows: For elevator, “It facilitates life. You can take the stairs, but it consumes your time and wastes your energy” (PT-205). For pencil; “It can be needed anywhere anytime” (PT-221). For the metaphor of movie, “The movie starts after trailer as math education starts with small pieces and emerges slowly” (PT-198). The metaphors produced by prospective preschool teachers about the category of
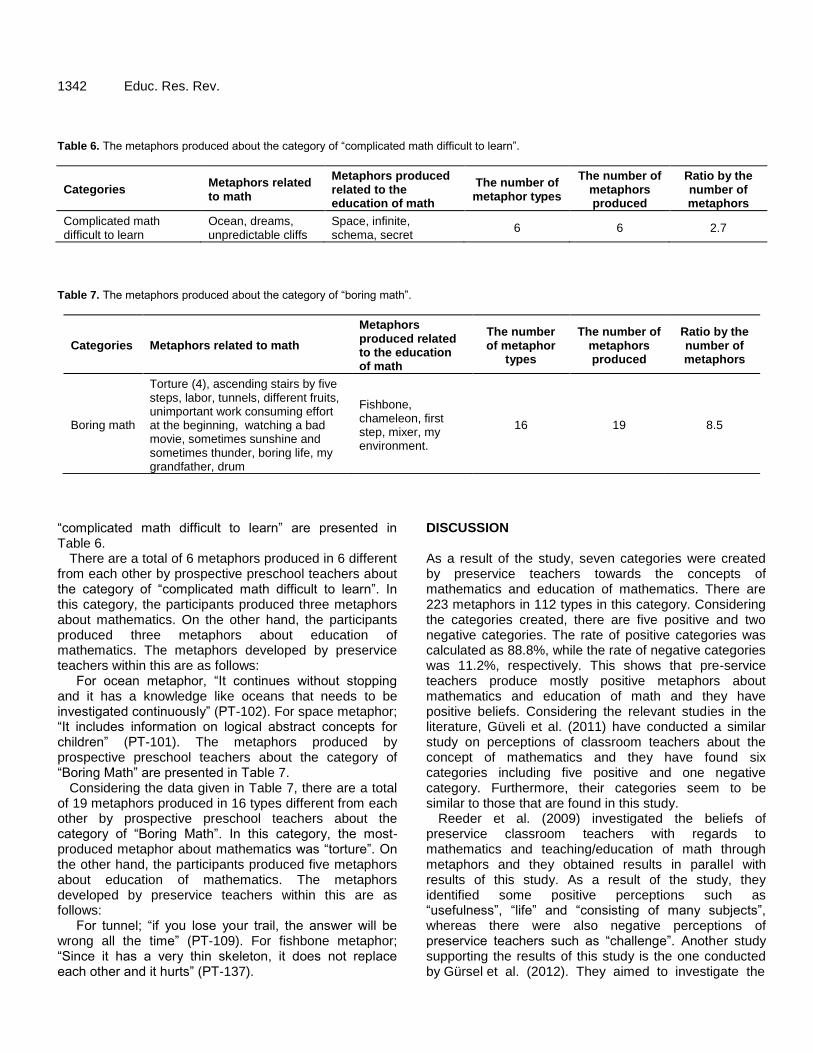
1342 Educ. Res. Rev. Table 6. The metaphors produced about the category of “complicated math difficult to learn”.
Categories Metaphors related to math
Metaphors produced related to the education of math
The number of metaphor types
The number of metaphors produced
Ratio by the number of metaphors
Complicated math difficult to learn
Ocean, dreams, unpredictable cliffs
Space, infinite, schema, secret
6 6 2.7
Table 7. The metaphors produced about the category of “boring math”.
Categories Metaphors related to math
Metaphors produced related to the education of math
The number of metaphor
types
The number of metaphors produced
Ratio by the number of metaphors
Boring math
Torture (4), ascending stairs by five steps, labor, tunnels, different fruits, unimportant work consuming effort at the beginning, watching a bad movie, sometimes sunshine and sometimes thunder, boring life, my grandfather, drum
Fishbone, chameleon, first step, mixer, my environment.
16 19 8.5
“complicated math difficult to learn” are presented in Table 6.
There are a total of 6 metaphors produced in 6 different from each other by prospective preschool teachers about the category of “complicated math difficult to learn”. In this category, the participants produced three metaphors about mathematics. On the other hand, the participants produced three metaphors about education of mathematics. The metaphors developed by preservice teachers within this are as follows: For ocean metaphor, “It continues without stopping and it has a knowledge like oceans that needs to be investigated continuously” (PT-102). For space metaphor; “It includes information on logical abstract concepts for children” (PT-101). The metaphors produced by prospective preschool teachers about the category of “Boring Math” are presented in Table 7.
Considering the data given in Table 7, there are a total of 19 metaphors produced in 16 types different from each other by prospective preschool teachers about the category of “Boring Math”. In this category, the most-produced metaphor about mathematics was “torture”. On the other hand, the participants produced five metaphors about education of mathematics. The metaphors developed by preservice teachers within this are as follows: For tunnel; “if you lose your trail, the answer will be wrong all the time” (PT-109). For fishbone metaphor; “Since it has a very thin skeleton, it does not replace each other and it hurts” (PT-137).
DISCUSSION As a result of the study, seven categories were created by preservice teachers towards the concepts of mathematics and education of mathematics. There are 223 metaphors in 112 types in this category. Considering the categories created, there are five positive and two negative categories. The rate of positive categories was calculated as 88.8%, while the rate of negative categories was 11.2%, respectively. This shows that pre-service teachers produce mostly positive metaphors about mathematics and education of math and they have positive beliefs. Considering the relevant studies in the literature, Güveli et al. (2011) have conducted a similar study on perceptions of classroom teachers about the concept of mathematics and they have found six categories including five positive and one negative category. Furthermore, their categories seem to be similar to those that are found in this study.
Reeder et al. (2009) investigated the beliefs of preservice classroom teachers with regards to mathematics and teaching/education of math through metaphors and they obtained results in parallel with results of this study. As a result of the study, they identified some positive perceptions such as “usefulness”, “life” and “consisting of many subjects”, whereas there were also negative perceptions of preservice teachers such as “challenge”. Another study supporting the results of this study is the one conducted by Gürsel et al. (2012). They aimed to investigate the

perceptions of preservice math teachers with regardd to mathematics. They concluded that the vast majority of preservice math teachers consider mathematics as an essential part of life, necessity, infinity and guidance. Schinck et al. (2008) aimed to determine perceptions of secondary education and undergraduate students about mathematics and concluded that they consider mathematics as “difficult”, “requiring work", "useful", "systematic", "hierarchical", "as an uncertain journey", "an entertaining voyage of discovery", “a vehicle” and a structure allowing students for active participation. In another study conducted by Özgün (2010), similar to the present results, they concluded that “consisting of many subjects”, “challenge”, “requiring hard work” and “usefulness for life” perceptions are important to mathematics as a type of food.
As a result, the findings of this research are in line with earlier studies. Prospective preschool teachers exhibit positive attitudes towards mathematics and mathematics education in general. These positive attitudes exhibited by preservice teachers will allow children to exhibit positive attitudes towards mathematics. Conflict of Interests The author has not declared any conflicts of interest. REFERENCES Akman B (2002). Okulöncesi dönemde matematik [Mathematics in
preschool period]. J. Haccettepe Univ. Educ. Fac. 23(23). Aslan D (2013). Comparison of pre- and in-service preschool teachers'
mathematical anxiety and beliefs about mathematics for preschoolers. Ac. Res. Int. 41:225-230.
Aslan D, Gürgah Oğul İ, Taş I (2013). The impacts of preschool teachers' mathematics anxiety and beliefs on children's mathematics achievement. Int. J. Hum. Soc. Sci. Inv. 2:45-49.
Aslan D, Aktaş Arnas Y (2015). The immediate impacts of preschool attendance on Turkish Children's mathematics achievement. Educ. Stud. 41: 231-243.
Güler G, Öçal MF, Akgün L (2011). Pre-service mathematics teachers’ metaphors about mathematics teacher concept. Proc. Soc. Beh. Sci. 15:327–330.
Gürsel GG, Öçal MF, Doruk M (2012). Matematik öğretmeni adaylarının matematik kavramına ilişkin sahip oldukları metaforlar [Pre-service mathematics teachers’ metaphors about mathematics concept]. J. Res. Educ. Teach. 1(2):25-29.
Güveli E, İpek AS, Atasoy E, Güveli H (2011). Sınıf öğretmeni adaylarının matematik kavramına yönelik metafor algıları [Prospective primary teachers’ metaphorical perceptions towards mathematics]. Turk. J. Comp. Math. Educ. 2(2):140-159.
Kılıç F, Arakan K (2010). Birinci sınıf velilerinin veli eğitimine ve çocuklarının okula başlamalarına ilişkin algılarının metaforlar (mecazlar) yardımıyla analizi [Investigation of the perceptions of the parents of first graders regarding parent education and their children's starting school with th help of metaphors (similes)]. 9. National Symposium of Teaching Primary Teacher, Elazığ, Turkey pp. 908-910.
Keles et al. 1343 Lakoff G, Johnson M (2005). Metaforlar hayat, anlam ve dil [Metaphors
we live by]. (Tranlated by G. Y. Demir). İstanbul: Paradigma Publishing.
Levine PM (2005). Metaphors and images of classrooms. Kapa Del. Pi Rec. 41(4):172-175.
Huberman AM, Miles M (1994). Data management and analysis methods. In N. Denzin & Y. Lincoln (eds.) Handbook of Qualitative Research, London: Sage. pp. 428-44.
Özdemir M (2012). Lise öğrencilerinin metaforik okul algılarının çeşitli değişkenler bakımından incelenmesi [Examination of high school students’ metaphorical school perceptions in terms of variousvariables]. Educ. 37(163).
Özgün KSA (2010). If mathematics were a color…. Ohio J. Sch. Math. 62:5-10.
Reeder S, Utley J, Cassel D (2009). Using metaphors as a tool for examining preservice elementary teachers’ beliefs about mathematics teaching and learning. Sch. Sci. Math. 109(3): 290–297.
Saban A (2009). Öğretmen adaylarının öğrenci kavramına ilişkin sahip oldukları zihinsel imgeler [Prospective teachers’ mental images about the concept of student]. J. Turkish Educ. Sci. 7(2):281-326.
Schinck AG, Neale HW, Pugalee DK, Cifarelli VV (2008). Using metaphors to unpack student beliefs about mathematics. School Sci. Mathe. 108(7):326-333.
Yalçınkaya E (2013). Tarih kavramına yönelik sınıf öğretmeni adaylarının ürettikleri metaforların incelenmesi [The investigation of the pre-service elementary teachers' metaphors for the concept of history]. J. World Turk. 5(3):95-112.
Yavuzer H (2007). Gençleri anlamak: ana-babaların en çok sorduğu sorular ve cevaplarıyla [Understanding youth: with questions parents most ask and with their responses]. İstanbul: Remzi Kitabevi.
Yıldırım A, Şimşek H (2008). Sosyal bilimlerde nitel araştırma yöntemleri [qualitative research methods in social science]. Ankara: Seçkin Yayınevi.

Vol. 11(14), pp. 1344-1350, 23 July, 2016
DOI: 10.5897/ERR2016.2794
Article Number: 27B423D59537
ISSN 1990-3839
Copyright © 2016
Author(s) retain the copyright of this article
http://www.academicjournals.org/ERR
Educational Research and Reviews
Full Length Research Paper
Pre- and In-service Preschool Teachers’ Science Teaching Efficacy Beliefs
Durmuş Aslan*, Işıl Taş and İrem Gürgah Oğul
Faculty of Education, Çukurova University, Turkey.
Received 30 March, 2016; Accepted 20 June, 2016
In this study, pre- and in-service preschool teachers’ science teaching efficacy beliefs were investigated. The sample included 100 pre-service (50 first grades and 50 last grades) and 73 in-service preschool teachers. As a data collection tool “Science Teaching Efficacy Belief Instrument” was used. Findings indicated that in-service teachers had higher science teaching efficacy belief score than pre-service teachers. Also, last grade pre-service teachers had higher science teaching efficacy belief score than first grade pre-service teachers. Moreover, pre-service teachers who graduated from mathematics and science departments at high school had more science teaching efficacy belief score than those who graduated from literature and mathematics department. Finally, teachers who have teaching experience of more than 10 years had higher level of science teaching efficacy beliefs than those who have less teaching experience. Key words: Preschool education, teacher, science teaching efficacy belief.
INTRODUCTION Children are born with the sense of wonder and they vary their exploration through their sense of taste, touch, sight, hearing and smell at early ages. The daily life experiences provide them many opportunities at perceiving and understanding the world (Balat, 2010). In enhancing children‟s daily life experiences, early childhood education has a significant role (Aktaş et al., 2012).
Science education in early childhood provides children an appropriate setting by supporting their curiosity. In addition, it forms a basis for exploration of similarities and differences by observing objects and events. Children can gain many skills needed in daily life through science education (Kandır et al., 2011). Science education given
at early ages help to improve observation skills, to be aware of the surrounding events, to develop positive attitudes towards their own body and to feel confident (Aktaş Arnas, 2003). On the other hand, science education consists of many abstract concepts that children can have difficulty in understanding. It is not easy to make science more understandable for children (Küçükturan, 2003). Teacher should prepare appropriate settings for children‟s observation and exploration rather than transferring knowledge to them directly. Teacher should support active involvement of children and he/she should not leave their questions unanswered (MEGEP [Development of Vocational Education Project], 2007).
*Corresponding author. E-mail: [email protected].
Authors agree that this article remain permanently open access under the terms of the Creative Commons Attribution
License 4.0 International License

Teacher should involve science activities as a guide, responder, facilitator and an observer (Worthman, 2006). Teacher should integrate science activities with other activities and take into account children‟s individual differences and developmental levels while preparing education programs (Genç Kumtepe, 2008).
Teachers should also be a model to children in gaining scientific attitude and concepts. Therefore, they should have sufficient pedagogical information (Davies and Home, 2003) and positive attitude towards science education (Genç Kumtepe, 2008). Their knowledge on science obtained from their past experiences influences not only their beliefs about science teaching efficacy and their attitudes toward science but also their practices (Özkan et al., 2002; Çakmak, 2006).
When studies related to teacher self-efficacy are investigated, it is seen that the psychological and educational studies are based on Bandura‟s social cognitive learning theory (Guo et al., 2010). Social cognitive learning theory explains the relationship between internal process such as beliefs, expectations and emotions and human behaviors (Jackson, 2002). According to this theory, individuals behave with the influence of both internal and external stimuli. External stimuli occur from environmental factors whereas internal stimuli include beliefs and emotions such as self-efficacy, dependency and success (Zengin, 2003).
Self-efficacy is identified as people's beliefs about their capabilities to produce designated levels of performance that exercise influence over events that affect their lives (Bandura, 1994). In other words self-efficacy, the conviction that one is or is not capable of successfully performing the behavior required to produce a certain outcome, affects whether or not a person will attempt a certain behavior and determines the effort expended and persistence levels (Bandura, 2006; Craft and Hogan, 1985). Self-efficacy beliefs can be defined as a person‟s beliefs on his own capacity of determined success (Akbulut, 2006). In other words, self-efficacy beliefs can be identified as being aware of own abilities for doing a task and believing on this (Zusho and Pientrich, 2003). Self-efficacy beliefs determine how people feel, think, motivate themselves and behave. Such beliefs produce several diverse effects through cognitive, motivational, affective and selection processes (Bandura, 1994).
According to social cognitive learning theory, people with a high sense of efficacy remain in the course in the face of difficulties and remain resilient to adversity. Conversely, people with a low sense of efficacy are easily convinced of the futility of effort in the face of difficulties. They quickly give up trying (Bandura, 2006). With reference to Bandura (1994), self-efficacy can be developed through mastery experiences. For instance, if people experience only easy successes they come to expect quick results and are easily discouraged by failure.
School is the place where children develop the
Aslan et al. 1345 cognitive competencies and acquire the knowledge and problem-solving skills essential for participating effectively in the larger society. Classroom structures affect the development of intellectual self-efficacy (Bandura, 1994). The task of creating productive learning environments rests heavily on the talents and efficacy of teachers. Teachers‟ beliefs in their instructional efficacy affect students‟ academic development and judgment of their intellectual capabilities and partly determine how they structure academic activities in their classrooms (Bandura, 2006). Teachers who have a high sense of efficacy about their teaching capabilities can motivate their students and enhance their cognitive development. Concordantly, those who have a low sense of efficacy favor a custodial orientation that relies heavily on negative sanctions to get students to study (Bandura, 1994). Some researchers (Schriver and Czerniak, 1999; Ashton and Webb, 1986; Harris, 2010) have reported that teachers‟ efficacy beliefs affect their practice in classroom. Schriver and Czerniak (1999) emphasized that teachers with high efficacy have more positive teacher behaviors like using more various teaching strategies.
Similar to Bandura (2006), previous studies have documented that there is a positive relationship between teachers' self-efficacy and students' academic performance (Anderson et al., 1988; Ross, 1994; Allinder, 1995; Goddard et al., 2000; Caprara et al., 2006; Tschannen-Moran and Barr, 2010). Anderson et al. (1988) who investigated the relationships among teachers‟ and students‟ sense of efficacy, thinking skills and student achievement, found significant relationship between teachers‟ sense of efficacy and students‟ achievement. Likewise, Goddard et al. (2000) reported that collective teacher efficacy is positively associated with students‟ math achievement in urban elementary schools. In another study conducted by Allinder (1995), it was shown that special education teachers with high personal and teaching efficacy increase their students‟ achievement. In addition, Ross (1994) highlighted positive effect of teacher efficacy on student achievement in middle school.
In the light of the definitions of self-efficacy, science teaching efficacy beliefs can be explained as teachers‟ judgments and beliefs about giving an effective and productive science education, being impressive on children‟s making a great success (Özkan et al., 2002). There have been increasing numbers of studies related with teachers‟ science self efficacy beliefs. These studies have investigated the science self efficacy beliefs of the preservice and inservice elementary (Enochs and Riggs, 1990; Velthuis et al., 2014), science (Önen and Muşlu Kaygısız, 2013) and preschool teachers (Ekinci Vural and Hamurcu, 2008). Recent evidence suggests that early childhood education professionals have low level of science efficacy beliefs in Turkey. Ayvacı et al. (2002) determined that preschool teachers had difficulties in

1346 Educ. Res. Rev. understanding science and natural events. In the same study, teachers believed that they could not conduct productive science activities.
Walan et al. (2014) investigated preschool and primary school teachers‟ self-efficacy and needs in relation to science teaching. Research indicated that even though the teachers had high self-efficacy, the needs of further education were expressed by the teachers to a large extent. In particular, the group of preschool teachers addressed the need for more content knowledge (CK) in physics and chemistry (>41%).
Similarly, Parlakyıldız and Aydın (2004) demonstrated that preschool teachers feel incompetent in having prerequisite knowledge about science. Karaer and Kösterelioğlu (2005) found that preschool teachers feel inadequate about science teaching.
Roehring et al. (2011) claimed that science is often avoided during early childhood education and as a result of preschool teachers‟ feelings of science anxiety, low self-efficacy with respect to teaching science, lack of experience participating in science activities as students, or the notion that literacy and language are more important during the early years. Leon (2014) found that science is an often neglected and misunderstood domain within early childhood education, many preschool teachers
avoid and/or miss science opportunities and have low self-efficacy in teaching science, and college level child development courses place little emphasis on the subject.
Recent studies conducted with pre-service preschool teachers have shown that the level of science teaching efficacy beliefs is increasing in parallel with their grade. Alabay (2006) for instance, found that the level of science teaching efficacy beliefs of first grade students was lower than the other graders. Similarly, Vural and Hamurcu (2008) detected that third graders had more level of science teaching efficacy beliefs than the first grade students.
In the literature review process, it was recognized that few writers have dealt with pre- and in-service teachers‟ science teaching efficacy beliefs. Wenner (2001) examined the differences between pre-service and in-service teachers‟ science and mathematics teaching efficacy. He found that 58% of pre-service and 71% of in-service teachers felt as though they could effectively teach science within their classrooms. Wenner (2001) also found that 93% of pre-service teachers welcomed science questions from students, but only 32% felt like they could answer them. In contrast, only 83% of in-service teachers welcomed students‟ questions about science, but 69% of them felt they could answer those questions correctly for their students. Azar (2010) conducted a study to compare the levels of pre-service and in-service secondary science teachers‟ efficacy beliefs relating to science teaching and to analyze the change of these beliefs according to their demographic characteristics such as gender, the graduate school type, teaching experience and major. According to the research
results, there was no significant difference between in-service and pre-service secondary science teachers‟ personal self efficacy beliefs. Moreover, he found that the self efficacy beliefs did not change relating to their gender, teaching experience, but they changed relating to their graduate school type and major.
In line with these findings, this study was conducted to investigate pre- and in-service preschool teachers‟ science teaching efficacy belief. METHODOLOGY Participants
The sample in this study included three groups: preschool teachers (n=73), first grade pre-service preschool teachers (n=50), last grade pre-service preschool teachers (n=50). Participants were selected via random sampling method. While the pre-service preschool teachers are having the preschool teachers program in Çukurova University, Adana, the in-service teachers are working in public preschools in Adana, Turkey.
Data collection tools Data were collected using “Science Teaching Efficacy Belief Instrument” which was developed by Riggs and Enochs (1990) and adapted to Turkish by Hazır Bıkmaz (2002).
Science Teaching Efficacy Belief Instrument consists of 21 items including positive and negative statements. These items are pointed through a five-point Likert scale: 1 (strongly disagree), 2 (disagree), 3 (neither agree nor disagree), 4 (agree), 5 (strongly agree). Respondents obtained a score between 21 (the lowest) and 105 (the highest).
Hazır Bıkmaz (2002) adapted the original instrument which has 23 items. Two items were removed and the equivalence coefficient was 0.68. Turkish form of the instrument was applied to 279 preservice elementary teachers studied at three different universities in Turkey. According to the result of factor analysis, a form with two factors structure similar to the original factor structure was obtained. After these procedures, Personal Science Teaching Self Efficacy Belief sub-scale consisted of 13 items (5 positive, 8 negative) while Science Teaching Outcome Expectancy sub-scale consisted of 8 items (7 positive, 1 negative). She reported that the reliability coefficients were 0.89 and 0.69 for the sub-scales, respectively. The reliability coefficient was found to be 0.85 for the whole instrument.
In the current study, Cronbach‟s Alpha value was calculated in order to determine the reliability of the assessment tool. Cronbach‟s Alpha value was 0.79 for Science Teaching Efficacy Belief Instrument.
Data collection
Data were collected in the second term of 2012-2013 academic year. Data collection tools were applied to pre-service preschool teachers in their university and to in-service teachers in the preschools that they worked.
Data analysis
Total scores that the participants obtained from “Science Teaching

Aslan et al. 1347
Table 1. The results of variance analysis on first and last grade pre-service and in-service teachers‟ scores in the science teaching efficacy belief instrument.
Source Sum of squares df Mean Square F P
Between Groups 2342.18 2 1171.09 16.71 0.001
Within Groups 11907.95 170 70.04
Total 14250.13 172
Table 2. The results of Tukey analysis on first and last grade pre-service and in-service teachers‟ scores in the science teaching efficacy belief instrument.
Group No. In-service teachers
First grade pre-service teachers
Last grade pre-service teachers
In-service teachers 73 - 8.81* 4.61*
First grade pre-service teachers 50 -8.81* - -4.20*
Last grade pre-service teachers 50 -4.61* 4.20* -
* p<.05, ** p<0.01.
Table 3. Mean science teaching efficacy belief scores for pre-service teachers who graduated from mathematics, science and literature, mathematics departments.
Task Groups
T df Mathematics and Science Department Literature and Mathematics Department
Science teaching efficacy 74.3 68.84 2.94* 94
(10.1) (8.01)
* = p < .05, ** = p < .001. Standard deviations appear in parentheses below means. Efficacy Belief Instrument” were calculated and analysis of variance (ANOVA) was conducted in order to determine whether there was a significant difference among groups. When a significant difference was found, Tukey's Post Hoc analysis was used to specify the source of the difference. Also, t-test was used to determine whether the differences between two groups were significant or not. RESULTS
Table 1 shows the results of variance analysis of the scores that the pre-and in-service teachers obtained from the Science Teaching Efficacy Belief Instrument.
It was found out that there was a statistically significant difference among the first and last grade pre-service and in-service teachers‟ scores in the Science Teaching Efficacy Belief Instrument (F(2.170)=16.71, p=0.001). The effect size for this analysis (d = 0.16) was found to exceed Cohen‟s (1988) convention for a small effect (d = 0.14).
The results of Tukey analysis conducted in order to define the source of the difference are shown in Table 2. The results suggested that there was a statistically significant difference among in-service teachers and first and last grade pre-service teachers in favour of in-service
teachers. These results indicate that in-service teachers had higher scores (M=76.71, SD=7.73) in the Science Teaching Efficacy Belief Instrument than first grade (M=67.9, SD=8.55) and last grade pre-service teachers (M=72.1, SD=9.04). Also, last grade pre-service teachers had significantly higher scores than first grade pre-service teachers in the Science Teaching Efficacy Belief Instrument.
Table 3 shows the t-test results for the scores and the pre-service teachers obtained on the Science Teaching Efficacy Belief Instrument according to the branch that they graduated from at high school. There was a statistically significant difference between the scores obtained on the Science Teaching Efficacy Belief Instrument (t(94)= 2.94, p <0.05). The effect size for this analysis was small (d=0.08). The scores of the pre-service teachers who graduated from Mathematics and Science department (M=74.3, SD=10.1) is higher than the scores of the pre-service teachers who graduated from Literature and Mathematics department (M=68.84, SD=8.01).
An independent-samples t-test was conducted to compare the scores on the Science Teaching Efficacy Belief Instrument between the in-service teachers who

1348 Educ. Res. Rev.
Table 4. Mean science teaching efficacy belief scores for in-service teachers who have teaching experience of 10 years and more and less than 10 years.
Task Groups
T df 10 years and more Less than 10 years
Science teaching efficacy 78.73 74.51 2.39* 71
(7.38) (7.61)
* = p < 0.05, ** = p < 0.001. Standard deviations appear in parentheses below means. than 10 years. The results of independent-samples t-test shown in Table 4 revealed a statistically significant difference t(71)= 2.39, p < 0.05. The effect size for this analysis was small (d=0.07). These results indicate that the in-service teachers who had teaching experience of 10 years and more had higher scores on the Science Teaching Efficacy Instrument (M=74.51, SD=7.61) than the in-service teachers who had teaching experience less than 10 years (M=78.73, SD=7.38). DISCUSSION This study was conducted to investigate pre-service and in-service preschool teachers‟ science teaching efficacy beliefs. The results showed that in-service teachers had higher science teaching efficacy belief than pre-service teachers. This result may be explained by the fact that teachers had more experiences on science teaching than pre-services. Bandura (1994) indicated that mastery experience is one of the most important factors that affect the self efficacy perception (Özerkan, 2007). Wenner (2001) found that in-service teachers feel more competent in science teaching than pre-service teachers. On the other hand, the result of the current study differs from that of Azar (2010) study that supported no significant difference between pre- and in-service teachers‟ science teaching efficacy beliefs. This situation may result from the grade of sample teachers‟ service. Also, last grade pre-service teachers had higher science teaching efficacy belief than first grade pre-service teachers. In contrast to the last graders, first grade pre-service teachers did not take „Science Teaching‟ course. The difference between the levels of knowledge about science teaching may create difference on teachers‟ science teaching efficacy beliefs. In the study of Rubek and Enochs (1990), they stated that the self efficacy beliefs of teachers with low field information is lower than those with high field information (Küçükyılmaz and Budan, 2006). The findings of the current study are consistent with the studies which found that increasing the level of science teaching efficacy beliefs of pre-service teachers is in parallel with their grades (Alabay, 2006; Vural and Hamurcu, 2008; Duban, Gökçakan, 2012; Kaya, 2013; Okur, 2015). Moreover, the current study found that pre-service teachers who graduated
from mathematics and science department at high school had more science teaching efficacy belief than those who graduated from literature and mathematics department. Those who graduated from mathematics and science department took more science courses. This may be a possible explanation of the difference in science teaching efficacy beliefs. Vural and Hamurcu (2008) carried out a study on preservice preschool teachers and determined that most of the self efficient preservice teachers thought that their efficacy arised from their graduation from mathematics and science department at high school.
Lastly, teachers who had experience in the field for 10 years and more had higher level of science teaching efficacy beliefs than those who had less teaching experience. This result may be derived from teachers‟ having more science teaching experience and more field experience. Cheung (2006) indicated that there are positive significant relationship between years of teaching experience and self efficacy perception. On the other hand, some researchers (Ekici, 2006; Saracaloğlu and Yenice, 2009) suggested that teaching experience is not effective on the level of efficacy beliefs. Moreover, another group of studies (Küçük et al., 2013) proposed that teachers who had less teaching experience had more science teaching efficacy beliefs. In fact, the studies which obtained these findings were conducted with primary, secondary and high school teachers. The difference between the present findings may result from the feature of the sample. Conclusıon The present study was designed to investigate the science teaching efficacy beliefs of pre- and in-service preschool teachers. As a result of the study, it was found that in-service teachers had higher level of science teaching efficacy beliefs than pre-service teachers. Furthermore, pre-service teachers at last grade had more science teaching efficacy beliefs than first graders. Besides, the level of science teaching efficacy beliefs of pre-services teachers who had mathematics and science background at high school is higher than pre-services‟ who had literature and mathematics background level. Lastly, teachers who had teaching experience of more than ten years had more science teaching efficacy belief

score than the others.
In line with these results, supporting pre-service preschool teachers and in-service teachers who have less teaching experience will be beneficial. It can provide more opportunities on teaching experience to pre-service teachers in teacher education programs in Turkey. In this study, the science teaching efficacy beliefs of pre- and in-service teachers were investigated. Further research might explore the effectiveness of teachers‟ science teaching efficacy beliefs on children‟s science achievement in preschool.
Conflict of Interests The authors have not declared any conflict of interests. REFERENCES Akbulut E (2006). Müzik öğretmeni adaylarının mesleklerine ilişkin öz
yeterlik inançları [Preservice music teachers‟ efficacy beliefs related to their job]. J. Yüzüncü Yıl Univ. Educ. Fac. 3(2):24-33.
Aktaş AY (2003). Okul öncesi dönemde fen eğitiminin amaçları [The aims of science education in preschool period]. J. Child Dev. Educ. 1(6-7):1-7.
Aktaş AY, Aslan D, Günay BR (2012). Okul öncesi dönemde fen eğitimi [Science education in preschool education]. Ankara: Vize Yayıncılık.
Alabay E (2006). İlköğretim okulöncesi öğretmen adaylarının fen ile ilgili öz yeterlik inanç düzeylerinin incelenmesi [Investigating preservice preschool teacher‟s efficacy beliefs related to science]. J. Yedi Tepe Univ. Educ. Fac. 2(1):35-39.
Allinder RM (1995). An examination of the relationship between teacher efficacy and curriculum based measurement and student achievement. Rem. Spec. Educ. 27:141-152.
Anderson RN, Greene ML, Loewen PS (1988). Relationships among teachers' and students' thinking skills, sense of efficacy, and student achievement. Alberta J. Educ. Res. 34(2):148-165.
Ashton P, Webb R (1986). Making a difference: Teacher sense of efficacy and student achievement. New York: Longman.
Ayvacı HŞ, Devecioğlu Y, Yiğit N (2002). Okulöncesi öğretmenlerinin fen ve doğa etkinliklerindeki yeterliliklerinin belirlenmesi [Determining efficacy of preschool teachers in science activities]. Paper presented at V. National Science and Mathematics Congress. September, Ankara.
Azar A (2010). In-service and pre-service secondary science teachers‟ self-efficacy beliefs about science teaching. Educ. Res. Rev. 5(4):175-188.
Bandura A (1994). Self-efficacy. In: V. S. Ramachaudran (Ed.), Encyclopedia of human behavior. New York: Academic Press 4:71-81.
Bandura A (2006). Adolescent development from an agentic perspective. In: F. Pajares & T. Urdan (Eds.). Self-efficacy beliefs of adolescents. Greenwich, CT: Information Age Publishing 5:1-43.
Caprara GV, Barbaranelli C, Steca P, Malone PS (2006). Teachers‟ self-efficacy beliefs as determinants of job satisfaction and students‟ academic achievement: A study at the school level. J. Sch. Psyc. 44:473-490.
Cheung HY (2006). The measurement of teacher efficacy: Hong Kong
primary in‐service teachers. J. Educ. Teach. 32(4):435-451. Craft DH, Hogan PI (1985). Development of self-concept and self-
efficacy: Considerations for mainstreaming. Adapt. Phys. Act. Quart. 2:320-327.
Çamlıbel ÇÖ (2006). Okul öncesi öğretmen adaylarının fene ve fen öğretimine yönelik tutumları ile bazı fen kavramlarını anlama düzeyleri arasındaki ilişkilerin incelenmesi [Investigating the relationship between preservice preschool teachers‟ attitudes towards science and science teaching and the level of understanding
Aslan et al. 1349
some science concepts]. Unpublished Master Dissertation, Abant İzzet Baysal University, Bolu, Turkey.
Davies D, Howe A (2003). Teaching science and design and technology in the early years. London: David Fulton Publishers.
Ekici G (2006). Meslek lisesi öğretmenlerinin öğretmen öz-yeterlik inançları üzerine bir araştırma [An investigation on vocational high school teachers‟ self-efficacy beliefs]. Euro. J. Educ. Res. 6(24):87-96.
Ekinci VD, Hamurcu H (2008). Preschool teacher candidates‟ self-efficacy beliefs regarding science teaching lesson and opinions about science. Elem. Educ. Online 7(2):456-467.
Enochs LG, Riggs IM (1990). Further development of an elementary science teaching efficacy belief instrument: A preservice elemantary scale. Sch. Sci. Math. 90(8):694-706.
Genç KE (2008). Okulöncesi eğitimde fen [Science in early childhood education]. In Yaşar Ş (Ed.) Okulöncesi fen ve matematik eğitimi [Early childhood science and mathematics education]. Eskişehir: Anadolu Üniversitesi Açıköğretim Fakültesi Yayınları pp. 151-174.
Goddard RD, Hoy WK, Woolfolk Hoy A (2000). Collective teacher efficacy: Its meaning, measure,and effect on student achievement. Am. Educ. Res. J. 37:479-507.
Guo Y, Piasta SB, Justice LM, Kaderavek JN (2010). Relations among preschool teachers' self-efficacy, classroom quality, and children's language and literacy gains. Teaching Teach. Educ. 26(4):1094-1103.
Harris M (2010). Teacher efficacy beliefs: understanding the relationship between efficacy and achievement in urban elementary schools. Unpublished Doctoral dissertation, University of California, Berkeley.
Hazır BF (2002). Fen öğretiminde öz-yeterlilik inancı ölçeği [The scale self-efficacy in teaching science]. Educ. Sci. Pract. 1(2):197-210.
Jackson JW (2002). Enhancing self-efficacy and learning performance. J. Exp. Educ. 70(3):243-254.
Kandır A, Can Yaşar M, Tuncer M (2011). Okul öncesi dönemde fen eğitimi [Science education in preschool period]. Ankara: Morpa.
Karaer H, Kösterelioğlu M (2005). Amasya ve Sinop illerinde çalışan okul öncesi öğretmenlerin fen kavramlarının öğretilmesinde kullandıkları yöntemlerin belirlenmesi [Determining the method that used by preschool teachers serviced in Amasya and Sinop provinces in science education]. J. Kastamonu Educ. 13(12):447-454.
Kaya S (2013). Sınıf öğretmeni adaylarının fen öğretimi öz-yeterlik inançlarının fenöğretimi dersine bağlı olarak değişimi [The change in elementary pre-service teachers‟ science teaching efficacy beliefs after science methods course]. Mustafa Kemal Univ. J. Inst. Soc. Sci. 10(21):55-69.
Küçük M, Altun E, Paliç G (2013). Sınıf öğretmenlerinin fen öğretimi öz-yeterlik inançlarının incelenmesi: Rize ili örneklemi [Investigating elementary teachers‟ science teaching efficacy beliefs: Sampling of Rize province]. J. Amasya Üniv. Educ. Fac. 2(1):45-70.
Küçükturan G (2003). Okulöncesi fen öğretiminde bir teknik: analoji [A technique in science education in early childhood: analogy]. Nat. Educ. 157:9-15.
Küçükyılmaz EA, Duban N (2006). Sınıf öğretmeni adaylarının fen öğretimi öz-yeterlik inançlarının artırılabilmesi için alınacak önlemlere ilişkin görüşleri [The opinions of primary teacher candidates on taking measures to increase science teaching self-efficacy beliefs]. J. Yüzüncüyıl Unv. Educ. Fac. 3(2):1-23
Leon K (2014). Do you see what i see? Exploring preschool teachers‟ science practices. Unpublished Mater dissertation California State University, Northridge. file:///C:/Users/Xx/Downloads/Leon_Katherine_thesis_2014.pdf
MEGEP [Development of Vocational Education Project] (2007). Çocuk gelişimi ve eğitimi fen ve doğa etkinlikleri [Child development and education science and nature activities]. Retrieved May 10, 2013, from http://hbogm.meb.gov.tr/modulerprogramlar/kursprogramlari/cocukgelisim/moduller/fenvedoga etkinlikleri.pdf
Okur AN (2015). The investigation of preschool teacher candidates‟ self-efficacy beliefs in science teaching accordıng to several variables. Route Educ. Soc. Sci. J. 2(4):255-262.
Önen F, Kaygısız GM (2013). Fen bilgisi öğretmen adaylarının 6-8.

1350 Educ. Res. Rev.
dönemler arasındaki fen öğretimine yönelik öz yeterlik inançları ve bu inanca ilişkin görüşleri [Prospective science teachers‟ self-efficacy beliefs about teaching science between 6-8 terms and the opinions on these beliefs]. Educ. Sci.: Theo. Prac. 13:2435-2453.
Özerkan E (2007). Öğretmenlerin öz-yeterlik algıları ile öğrencilerin sosyal bilgiler benlik kavramları arasındaki ilişki [the relationship between the teacher self-efficacy and the students social studies self-concept]. Unpublished Master Dissertation, Trakya University, Edirne, Turkey.
Özkan Ö, Tekkaya C, Çakıroğlu J (2002). Fen bilgisi aday öğretmenlerin fen kavramlarını anlama düzeyleri, fen öğretimine yönelik tutum ve öz yeterlik inançları [Pre-service science teachers‟ understanding level of science concepts, attitudes and self-efficacy beliefs towards teaching science]. Paper presented at V. Science and Mathematics Congress, Ankara.
Parlakyildiz B, Aydin F (2004). Okulöncesi dönem fen eğitiminde fen ve doğa köşesinin kullanımına yönelik bir inceleme [An investigation on usage of science corners in preschool science education]. Paper presented at 13th National Educational Sciences Congress, Malatya, Turkey.
Riggs IM, Enochs LG (1990). Toward the development of an elementary teachers‟ science teaching efficacy belief instrument. Sci. Educ. 74(6):625-637.
Roehring, GH, Dubosarsky M, Mason A, Carlson S, Murphy B (2011). We look more, listen more, notice more: impact of sustained professional development on head start teacher´s inquiry-based and culturally-relevant science teaching practices. J. Sci. Educ. Technol. 20(5):566-578.
Ross JA (1994). The impact of an inservice to promote cooperative learning on the stability of teacher efficacy. Teaching Teach. Educ. 10:381-394.
Saracaloğlu AS, Yenice N (2009). Investigating the self- efficacy beliefs of science and elementary teachers with respect to some variables. J. Theory Pract. Educ. 5(2):244-260.
Schriver M, Czerniak CM (1999). A comparison of middle and junior high science teachers levels of efficacy and knowledge of developmentally appropriate curriculum and instruction. J. Sci. Teach. Educ. 10(1):21-42.
Tschannen-Moran M, Barr M (2010). Fostering student learning: The relationship of collective teacher efficacy and student achievement. Leadersh. Policy Sch. 3:189-209.
Uyanık Balat G (2010). Fen nedir ve çocuklar feni nasıl öğrenir? [What is science and how do children learn science?]. In: Akman B, Uyanık Balat G, Güler T (Eds.) okul öncesi dönemde fen eğitimi [science education in preschool period]. Ankara: Pegem Akademi.
Velthuis C, Fisser P, Pieters J (2014). Teacher training and pre-service
primary teachers‟ self-efficacy for science teaching. J. Sci. Teach. Educ. 25(4):445-464.
Walan S, Chang RSN (2014) Investigating preschool and primary school teachers' self-efficacy and needs in teaching science: a pilot study - In: CEPS Journal 4 1, S. 51-67 - URN: urn:nbn:de:0111-opus-88792
Wenner G (2001). Science and mathematics efficacy beliefs held by practicing and prospective teachers: a 5-year perspective. J. Sci. Educ. Tech. 10(2):181-187.
Wortham SC (2006). Early childhood curriculum: developmental bases for learning and teaching. Upper Saddle River, NJ: Pearson Merrill Prentice Hall.
Yıldız Duban N, Nurcan G (2012). Sınıf öğretmeni adaylarının fen öğretimi öz-yeterlik inançları ve fen öğretimine yönelik tutumları [Elementary pre-service teachers‟ science teaching efficacy and attitudes towards teaching science]. J. Çukurova Unv. Soc. Sci. Enst. 21(1):267-280.
Zengin UK (2003). İlköğretim öğretmenlerinin öz yeterlilik algıları ve sınıf içi iletişim örüntüleri [Self efficacy and classroom communication patterns of primary teachers]. Unpublished Master Thesis, Dokuz Eylül University, İzmir.
Zusho A, Pintrich PR (2003). Skill and will: the role of motivation and cognition in the learning of college chemistry. Int. J. Sci. Educ. 25(9):1081-1094.

Educational Research
and Reviews
Related Journals Published by Academic Journals
■ African Journal of History and Culture
■ Journal of Media and Communication Studies
■ Journal of African Studies and Development
■ Journal of Fine and Studio Art
■ Journal of Languages and Culture
■ Journal of Music and Dance