review titration methodologies for monitoring of … · 2017-08-14 · journal of chemical...
TRANSCRIPT

Journal of Chemical Technology and Biotechnology J Chem Technol Biotechnol 79:1331–1341 (online: 2004)DOI: 10.1002/jctb.1143
ReviewTitration methodologies for monitoringof anaerobic digestion in developingcountries—a reviewO Lahav1∗ and BE Morgan2
1Faculty of Civil and Environmental Engineering, Technion—Israel Institute of Technology, Haifa, 32000, Israel2Department of Civil Engineering, University of Cape Town, Rondebosch 7700, South Africa
Abstract: An increase in volatile fatty acids (VFA) concentration (or the proportional decrease in carbonatealkalinity concentration) is the first practical measurable indication that an anaerobic treatment system isin a state of stress. If the system is not rectified at this early stage, failure is likely. Current methods for VFAmeasurement include distillation, colorimetry, gas chromatography and various titration techniques. Interms of simplicity, speed and cost-effectiveness it is generally accepted that titration methods are superiorfor the purpose of on-site routine monitoring and control, particularly in developing countries. This paperreviews the methods published in the last four decades concerning on-site titration measurement of VFAand carbonate alkalinity concentrations. The review encompasses the following: aquatic chemistry relatedto the theory on which most of the methods are based, and a detailed description of each of the principalmethods published followed by critical and comparative evaluation. 2004 Society of Chemical Industry
Keywords: volatile fatty acids; titration methods; anaerobic digester monitoring; developing countries
INTRODUCTIONStart-up and successful operation of anaerobic treat-ment facilities is a difficult and delicate process,requiring reasonably accurate and rapid monitoringtechniques. The control strategy is based on maintain-ing a low concentration of volatile fatty acids (VFA)and a pH in the range 6.6 < pH < 7.4. Normally inanaerobic reactors the carbonate system forms themain weak-acid system responsible for maintainingthe pH around neutral, while the VFAs (mainly acetic,propionic, and butyric acids) are the major cause for adecline, in pH.
Under stable operating conditions, the H2 andacetic acid formed by acidogenic and acetogenicbacterial activity are utilized immediately by themethanogens and converted to methane. Conse-quently, the VFA concentration in properly runninganaerobic digesters is typically fairly stable and low(typically 0.5–2.0 mmol dm−3),1 carbonate alkalinityis not consumed in excess and the pH is stable. Incontrast, under overload conditions or in the presenceof toxins or inhibitory substances, the activity of thesensitive methanogenic and acetogenic populationsis reduced, causing an accumulation of VFA which
in turn increases the total acidity in the digester, thusreducing the pH (the term ‘total acidity’ is used here todefine the total proton-donating capacity of a solution,including the contribution of all weak-acid subsystemspresent). The onset of reactor failure can have a spiral-ing effect on the methanogenic population,2 where thebuffering capacity cannot keep up with the increasingproduction of VFAs, causing further, and ultimately,complete, failure. The extent of the pH drop dependsprimarily on the H2CO3
∗ alkalinity concentration. Theterm H2CO3
∗ alkalinity is used here to define thetotal proton-accepting capacity of the carbonate weak-acid subsystem combined with the proton-acceptingcapacity of the water system3 (ie H2CO3
∗ alkalinity =2[CO3
2−] + [HCO3−] + [OH−] − [H+]). In terms of
routine monitoring, pH measurement cannot formthe sole indication of imminent failure, because inmedium or well-buffered waters high VFA concentra-tion would have to form in order to cause a detectabledrop in pH, by which time failure would already occur.Consequently, direct measurement of either (or both)VFA or H2CO3
∗ alkalinity concentration is necessary.Measurement of H2CO3
∗ alkalinity in a mixtureof weak-acid subsystems cannot be carried out via
∗ Correspondence to: O Lahav, Faculty of Civil and Environmental Engineering, Technion—Israel Institute of Technology, Haifa, 32000,IsraelE-mail: [email protected](Received 23 June 2004; revised version received 9 July 2004; accepted 19 July 2004)Published online 14 September 2004
2004 Society of Chemical Industry. J Chem Technol Biotechnol 0268–2575/2004/$30.00 1331

O Lahav, BE Morgan
the standard titration procedure to the H2CO3∗
equivalence point (pH 4.5) because (i) the point isnot defined sharply and (ii) titration to 4.5 doesnot account for all the proton-accepting capacity ofthe VFA system (ie the non-protonated forms ofacetate, butyrate and propionate). Characterization ofthe carbonate subsystem can be carried out using aninorganic carbon analyzer; however, this instrument,apart from not being generally available on-site, isprone to gross inaccuracy due to CO2 loss occurringbetween sampling and measurement. Therefore, anincrease in VFA concentration is the first practicalmeasurable indication that an anaerobic treatmentsystem is in a state of stress. If the system is notrectified at this early stage, failure is likely.
The demand for reliable VFA measurement hasincreased in recent years due to the introductionand widespread use of high-rate anaerobic treatmentprocesses, where more rigorous control is needed.4
In addition to conventional anaerobic digesters, othertreatment systems such as biological sulfate removalreactors and hydrolysis reactors (prefermenters)depend on VFA measurement as a principal meansof monitoring reactor performance. Furthermore,anaerobic treatment of municipal sewage has gainedpopularity recently as evidenced by the increasingintroduction of full-scale UASB reactors,5 particularlyin tropical areas—the majority of which are indeveloping countries where sophisticated technologytends to be unsuccessful.
Currently, VFA can be measured using straight dis-tillation, steam distillation, a colorimetric technique,gas chromatography, and titration techniques. Someof these methods are time consuming, others requireexpensive equipment and a dedicated operator, andoften, in particular in developing countries, the equip-ment is not available on-site.
Combining such factors as simplicity, speed andcost-effectiveness it is generally accepted that titrativemethods are superior for the purpose of routinemonitoring and control.6 While difficult to verify,it would appear that in developing countries thevast majority of anaerobic digesters are monitoredby various titration techniques. This also holds truefor many treatment plants in the developed world.
During the last four decades a considerable numberof quantitative and semi-quantitative titration methodshave been proposed for the measurement of eitherVFA or H2CO3
∗ concentrations or both. Thesetitrative methods can be roughly divided into threecategories of approaches:
1 Approximation of VFA concentration alone orapproximation of both VFA and H2CO3
∗ alkalinity,both by titration techniques.7–11
2 Measurement of H2CO3∗ alkalinity only by direct
titration, with or without an external measurementof VFA concentration using a different analyticalapproach.12–15
3 Accurate measurement of both VFA and H2CO3∗
alkalinity with differing levels of complexity and
accuracy using a titration technique followed by amathematical algorithm.16–19
In addition to these, automated, in-line methodsbased on one of the above are also found in theliterature.20,21
The multiplicity of methods available in theliterature and the large difference in approach andin the results obtained from each method emphasizesthe need for a comprehensive review of the subject,extending the review published by Moosbruggeret al in 1993.6 The current review encompasses thefollowing: aquatic chemistry theory on which most ofthe methods are based, and a detailed description ofeach of the principal methods published followed bycritical and comparative evaluation.
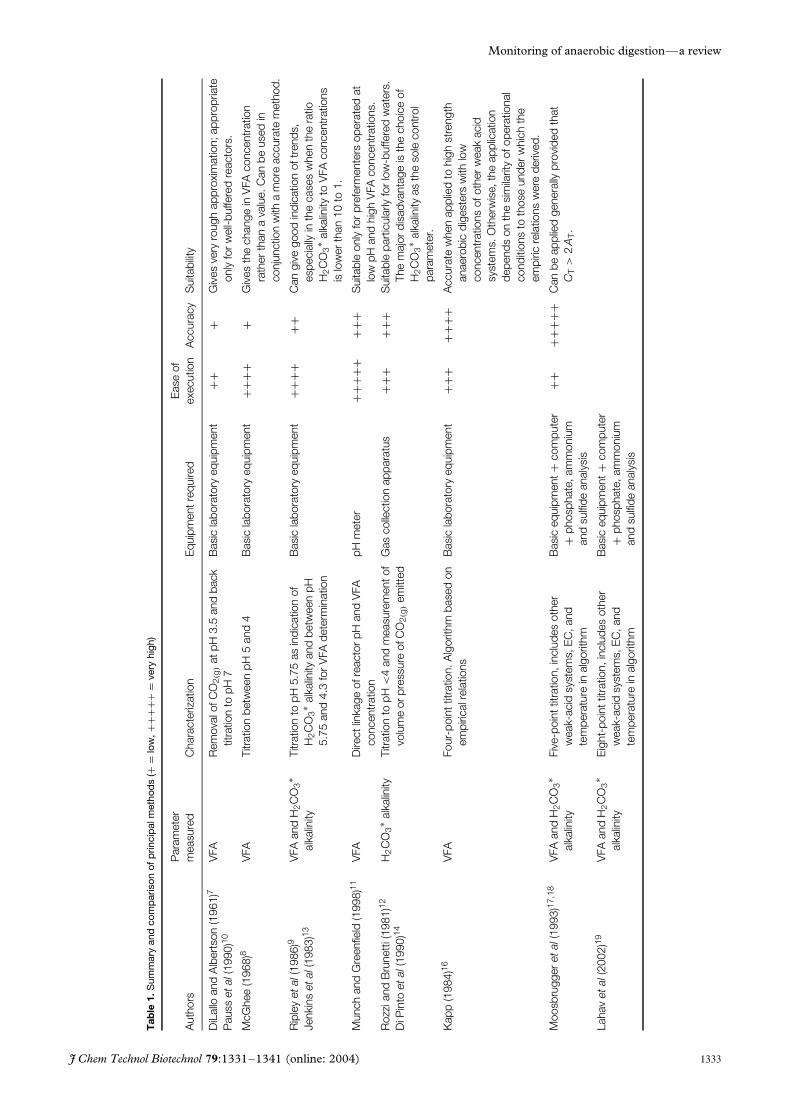
It is hoped that the review will provide assistanceto researchers, engineers, and laboratory techniciansin their quest for the most appropriate method forthe control of anaerobic processes. A list of the mainmethods covered, including characterization, ease ofexecution, and suitability for use as the monitoringtechnique is given in Table 1.
THEORY OF WEAK-ACID SYSTEMS ANDCORRESPONDING BUFFERING INTENSITY INANAEROBIC REACTORSAll the titrative procedures proposed for VFA andH2CO3
∗ determination stem from classical aqueoussolution weak-acid equilibrium theory. Thus, in orderto evaluate the various methods using commongrounds, a brief review of fundamental aquaticchemistry principles is given.
Acids or bases that dissociate only partially insolution are defined as ‘weak’. The principal weak-acidsubsystems commonly found in anaerobic reactors arethe carbonate, ammonium, phosphate, VFAs (namelyacetic, propionic and butyric acids), and sulfidesubsystems. The various species of these subsystemscan be represented as a function of the total speciesconcentration of a particular weak-acid subsystemand its apparent equilibrium constant adjusted fortemperature and Debye–Huckel effects. An exampleof such representation is given below for the carbonateand VFA subsystems.
The equilibrium and mass balance equations for thecarbonate subsystem are:
(H+) · [HCO3−]/[H2CO3
∗] = K ′C1 (1)
(H+) · [CO32−]/[HCO3
−] = K ′C2 (2)
CT = [H2CO3∗] + [HCO3
−] + [CO32−] (3)
Where () denotes activity, [] denotes molarity, K ′equals apparent equilibrium constant after adjustmentfor Debye–Huckel effects, and CT = total inorganiccarbon concentration (mol dm−3).
For the VFA subsystem (VFAs are commonlyconsidered to constitute a single weak-acid system
1332 J Chem Technol Biotechnol 79:1331–1341 (online: 2004)
Monitoring of anaerobic digestion—a review
Tab
le1.
Sum
mar
yan
dco
mp
aris
onof
prin
cip
alm
etho
ds
(+=
low
,+++
++=
very
high
)
Aut
hors
Par
amet
erm
easu
red
Cha
ract
eriz
atio
nE
quip
men
treq
uire
dE
ase
ofex
ecut
ion
Acc
urac
yS
uita
bilit
y
DiL
allo
and
Alb
erts
on(1
961)
7
Pau
sset
al(1
990)
10V
FAR
emov
alof
CO
2(g)
atpH
3.5
and
back
titra
tion
topH
7B
asic
labo
rato
ryeq
uipm
ent
+++
Giv
esve
ryro
ugh
appr
oxim
atio
n;ap
prop
riate
only
forw
ell-b
uffe
red
reac
tors
.
McG
hee
(196
8)8
VFA
Titr
atio
nbe
twee
npH
5an
d4
Bas
icla
bora
tory
equi
pmen
t++
+++
Giv
esth
ech
ange
inV
FAco
ncen
trat
ion
rath
erth
ana
valu
e.C
anbe
used
inco
njun
ctio
nw
itha
mor
eac
cura
tem
etho
d.
Rip
ley
etal
(198
6)9
Jenk
ins
etal
(198
3)13
VFA
and
H2C
O3∗
alka
linity
Titr
atio
nto
pH5.
75as
indi
catio
nof
H2C
O3∗
alka
linity
and
betw
een
pH5.
75an
d4.
3fo
rV
FAde
term
inat
ion
Bas
icla
bora
tory
equi
pmen
t++
++++
Can
give
good
indi
catio
nof
tren
ds,
espe
cial
lyin
the
case
sw
hen
the
ratio
H2C
O3∗
alka
linity
toV
FAco
ncen
trat
ions
islo
wer
than
10to
1.
Mun
chan
dG
reen
field
(199
8)11
VFA
Dire
ctlin
kage
ofre
acto
rpH
and
VFA
conc
entr
atio
npH
met
er++
+++
+++
Sui
tabl
eon
lyfo
rpr
efer
men
ters
oper
ated
atlo
wpH
and
high
VFA
conc
entr
atio
ns.
Roz
zian
dB
rune
tti(1
981)
12
DiP
into
etal
(199
0)14
H2C
O3∗
alka
linity
Titr
atio
nto
pH<
4an
dm
easu
rem
ento
fvo
lum
eor
pres
sure
ofC
O2(
g)em
itted
Gas
colle
ctio
nap
para
tus
+++
+++
Sui
tabl
epa
rtic
ular
lyfo
rlo
w-b
uffe
red
wat
ers.
The
maj
ordi
sadv
anta
geis
the
choi
ceof
H2C
O3∗
alka
linity
asth
eso
leco
ntro
lpa
ram
eter
.
Kap
p(1
984)
16V
FAFo
ur-p
oint
titra
tion.
Alg
orith
mba
sed
onem
piric
alre
latio
nsB
asic
labo
rato
ryeq
uipm
ent
+++
++++
Acc
urat
ew
hen
appl
ied
tohi
ghst
reng
than
aero
bic
dige
ster
sw
ithlo
wco
ncen
trat
ions
ofot
her
wea
kac
idsy
stem
s.O
ther
wis
e,th
eap
plic
atio
nde
pend
son
the
sim
ilarit
yof
oper
atio
nal
cond
ition
sto
thos
eun
derw
hich
the
empi
ricre
latio
nsw
ere
deriv
ed.
Moo
sbru
gger
etal
(199
3)17
,18
VFA
and
H2C
O3∗
alka
linity
Five
-poi
nttit
ratio
n,in
clud
esot
her
wea
k-ac
idsy
stem
s,E
C,a
ndte
mpe
ratu
rein
algo
rithm
Bas
iceq
uipm
ent+
com
pute
r+
phos
phat
e,am
mon
ium
and
sulfi
dean
alys
is
++++
+++
Can
beap
plie
dge
nera
llypr
ovid
edth
atC
T>
2A
T.
Laha
vet
al(2
002)
19V
FAan
dH
2C
O3∗
alka
linity
Eig
ht-p
oint
titra
tion,
incl
udes
othe
rw
eak-
acid
syst
ems,
EC
,and
tem
pera
ture
inal
gorit
hm
Bas
iceq
uipm
ent+
com
pute
r+
phos
phat
e,am
mon
ium
and
sulfi
dean
alys
is
J Chem Technol Biotechnol 79:1331–1341 (online: 2004) 1333

O Lahav, BE Morgan
with equilibrium constant K ′a because of the similarity
of their pK values):6
(H+) · [A−]/[HA] = K ′a (4)
AT = [HA] + [A−] (5)
where: AT = total VFA species concentration (moldm−3), HA represents the acidic, protonated speciesand A− the ionized form of each acid.
Representing the individual species of the carbonateand VFA subsystems as a function of CT, AT, andequilibrium constants:
[H2CO3∗] = CT/{1 + K ′
C1/(H+)
+ K ′C1 · K ′
C2/((H+))2} (6)
[HCO3−] = CT/{1 + K ′
C2/(H+) + (H+)/K ′C1} (7)
[CO32−] = CT · K ′
C2/{(H+) + K ′C2
+ ((H+))2/K ′C1} (8)
[A−] = AT · K ′a/{(H+) + Ka
′} (9)
[HA] = AT/{1 + Ka′/(H+)} (10)
Similar equations can be developed for the phos-phate, sulfide, and ammonium proton-acceptingspecies.
Buffer intensityThe buffering contribution of each subsystem can becalculated through a parameter called buffer intensity,defined as the slope of a titration curve plotted fromthe cumulative mass of strong acid (or base) added toa sample vs the change in pH:
β = −dMa/dpH = dMb/dpH (11)
where:
Ma, Mb = concentration of strong acid or strong base,respectively, added to 1 dm3 of solution(mol dm−3 solution).
β = buffer intensity index (mol dm−3 solution/�pH).
The equation for the calculation of the buffer inten-sity index for monoprotic weak-acid subsystems andfor diprotic weak-acid subsystems with dissociationconstants differing by four pH units or more is givenby the following term:22
β = 2.303 · [ATK ′a(H
+)]/[K ′a + (H+)]2 (12)
For the water subsystem the buffer intensity index isgiven by:
β = 2.303{(H+) + K ′W/(H+)} (13)
The overall buffer intensity index of a solutioncomposed of a number of weak-acid subsystems isthe sum of the buffer intensities of all the weak-acidsubsystems including the water subsystem.
pH—log species and pH—buffer intensity indexdiagramsUsing equations describing individual weak-acidspecies concentration (such as eqns (6)–(10)) andbuffer intensities (eqns (12) and (13)), ‘pH—logspecies’ and ‘pH—buffer intensity index’ diagramscan be plotted. In Fig 1 an example of such plot isgiven for a typical species concentration distributionencountered in anaerobic digesters. Using Fig 1 as itapplies to titration methods, a number of points canbe made:
1E-25
1E-23
1E-21
1E-19
1E-17
1E-15
1E-13
1E-11
1E-09
1E-07
1E-05
0.001
0.1
0 1 2 3 4 5 6 7 8 9 10 11 12 13 14
pH
Log
Spe
cies
0
0.005
0.01
0.015
0.02
0.025
0.03
Buf
fer
inte
nsity
(mol
/(l p
H))
HCO3−
H3PO4
PO43−
CO32−
HAcNH3
H2CO3HPO4
2−H2PO4−
Ac−
Actual bufferintensity
Carbonatebuffer intensity
VFA bufferintensity
Figure 1. pH–log species and buffer intensity index diagrams in a typical anaerobic digestion sample (CT = 1000 mg dm−3 as CaCO3,VFA = 100 mg dm−3 as HAc, total phosphate concentration (PT) = 50 mg dm−3 as P, total sulfide concentration (ST) = 20 mg dm−3 as S, and totalaqueous ammonium concentration (NT) = 50 mg dm−3 as N, temperature = 22 ◦C, TDS = 3000 mg dm−3). Actual buffer intensity is the sum ofbuffer intensity curves of all subsystems.
1334 J Chem Technol Biotechnol 79:1331–1341 (online: 2004)
Monitoring of anaerobic digestion—a review
• The magnitude of the (cumulative) curve at aparticular pH specifies the buffering capacity ofthe solution at that pH or in other words, its abilityto minimize a change in pH when strong acid orstrong base is added. For a titration between anytwo pH points, the area under the buffer intensitycurve equals the mass of strong acid (or base) thathas to be added to bring about the pH change.
• For a particular weak-acid subsystem, the bufferingintensity is maximal at the pK (pK = a pH valuewhere two species of a weak-acid subsystem areequal in concentration). On either side of the pK thebuffer intensity decreases sharply, becoming only1% of its maximal value within two pH units.
• The shape of the actual buffer intensity curve (iethe cumulative curve) depends on both the con-centrations and the respective apparent dissociationconstants of the weak-acid subsystems present in thewater. At the normal pH range maintained in anaer-obic reactors, the carbonate, sulfide and phosphatesubsystems can have a significant contribution tothe cumulative curve as their respective pK ′ valuesare close to the range 6.7 > pH <7.4. Typically,the carbonate subsystem is present at high con-centrations and thus its component has the mostsignificant effect on the cumulative buffer intensitycurve. The sulfide and phosphate concentrations areusually much lower compared with the carbonatesubsystem, but nevertheless neglecting their effectmay lead to an erroneous measurement. The pK ofthe ammonium subsystem (pKN ∼ 9.4) is such thatits contribution to the buffer intensity curve at therelevant pH range is very small up to relatively highconcentrations (around 1000 mg N dm−3).
• The VFA subsystem, which is invariably representedby the acetic acid subsystem, has a pK of 4.75and under normal operating conditions is presentat relatively low concentrations (typically AT <
2 mmol dm−3). Accordingly it has only a small effecton the cumulative buffer intensity curve at 6.7> pH <7.4 but a much larger effect is apparentat 4.25 < pH <5.25. On the other hand, giventhat the carbonate subsystem is present at highconcentrations relative to the VFA subsystem, itscontribution to the cumulative curve at this pHrange (4.25 < pH <5.25) may also be relatively high.The overlap between the buffering intensity curvesof the carbonate and VFA subsystems precludesthe use of the standard measurement of carbonatealkalinity (ie titration to an ‘end point’ near pH4.5) as a meaningful means of control for anaerobicreactors. In addition, acid-titration to two pH pointsaround the pK of the VFA system will producethe sum of the proton-accepting capacity of boththe VFA and carbonate subsystems between thetwo points, reducing the ability of this approach toserve as means of direct measurement of the VFAconcentration, particularly in cases where the ratioCT to AT is large (ie where the area under thebuffer intensity curves of the carbonate and VFA
subsystems between two pH values are of the sameorder of magnitude).
• From a technical standpoint, obtaining accuratetitrative results depends on the stability of the pHreadings. The stability of a reading at a givenpH, using an appropriate pH probe, depends onthe magnitude of the cumulative buffer intensitycurve at that pH and to a lesser degree on themixing conditions governing the exchange of volatilespecies such as CO2 and H2S with the atmosphere(such volatilization might introduce errors in low-pH titration point measurements). The magnitudeof the cumulative buffer capacity at any pH dependson the total species concentration and the proximityto a relevant pK ′ value. As a rule, the buffer intensityis highest close to the pK ′ values and lowest inbetween them. In a mixture of weak-acid systems ofunknown concentrations it is impossible to predict apriori the exact shape of the cumulative curve, but itis safe to assume that titration to pH values close tothe known pK ′ values would increase the reading’sstability and result in more accurate observations.
• The effect of the ionic strength and temperature ofthe tested solution on the pK values of the weak-acid systems, and thus on the shape of the bufferintensity curve is also noteworthy. Changes in thesalt composition and concentration (and to a lesserdegree in temperature) may shift the pK values byup to 0.5 pH units, changing the cumulative curvesignificantly. Therefore, neglecting these parameterscan lead to a large error in interpretation ofexperimental results.
• There are particular waters (eg agro-industrialwaters, distilleries, paper mills, landfill drainage) inwhich not all proton-accepting species can be readilyidentified (eg lignin fractions). If these species arepresent in significant concentrations, an assessmentis essential for correct interpretation of the titrationdata.
PUBLISHED METHODSAcknowledgment that monitoring of the carbonatealkalinity or VFA concentration (or preferably both)is crucial for control of anaerobic reactors has led,since the early 1960s, to the publication of a variety ofpractical procedures based upon titration techniques.In all cases the incentive was to develop a cheap,simple and rapid method to measure at least one ofthe two parameters, H2CO3
∗ alkalinity or VFA.In the following, these methods are grouped
according to the three categories outlined in theintroduction. Within the groups, the methods are byand large presented in chronological order of theirappearance in the literature.
Approximate measurement of VFA alone or bothVFA and H2CO3
∗ alkalinityThe first to propose a titration method for VFAmeasurement were DiLallo and Albertson.7 Their goal
J Chem Technol Biotechnol 79:1331–1341 (online: 2004) 1335

O Lahav, BE Morgan
was to develop a ‘reasonably accurate method’ forVFA determination using only equipment normallyfound in a treatment plant laboratory in order todecrease the time to obtain results and to gain betterreactor control. The authors developed a techniqueaimed at detecting the change in VFA concentrationsrather than measuring accurately their absolute value.Their fundamental idea was to circumvent the overlapbetween the buffer intensity curves of the carbonateand VFA systems by removing the inorganic carbonconcentration as CO2, thus isolating the VFA systemso that it can be measured directly through titration.‘Total alkalinity’ in their method was defined asthe proton-accepting capacity of the solution titrateddown to pH 4, at which pH it was assumed thatall carbonate species are in the form of CO2. Afterrecording the amount of standard acid added to pH4, the pH is lowered to between 3.3 and 3.5 andthe sample is boiled lightly for 3 min to completelyremove CO2. Thereafter, the amount of standard baserequired to elevate the pH from 4 to 7 is recorded.This value is considered in the method to consist80% of the VFA alkalinity (irrespective of the VFAconcentration). Because the acid titration at this pHrange also includes a ‘minor’ contribution of what istermed ‘base alkalinity’ (referring to proton-acceptingcapacity of subsystems such as the phosphate andsulfide subsystems), the VFA concentration is attainedby multiplying the titration results by a factor of1.5 when the method yields a VFA concentrationabove 180 mg dm−3. Below this value a factor of1.0 is used (ie no correction factor is applied). Thecarbonate alkalinity is calculated by subtracting theVFA alkalinity from the ‘total alkalinity’. The methodproposed by DiLallo and Albertson, although havingthe credit of being the first titrative method, suffersfrom a number of shortcomings. The method requiresthe compulsory addition of both standard acid andbase and the boiling of the sample, a step that tendsto be cumbersome. More importantly, several stepsin the procedure are prone to gross inaccuracy: First,boiling of the sample to remove CO2 can result in aloss of a fraction of the VFA due to stripping that willdepend on the VFA concentration and composition,and on the type of boiling. The authors suggest 3-min ‘gentle’ boiling, but such procedure can hardlybe standardized. Also, an unknown volume of wateris vaporized in the boiling procedure. Second, theback-titration between pH 4 and pH 7 is assumed inthe method to incorporate 80% of the VFA alkalinity.This value is a not a bad approximation since itsmagnitude is relatively insensitive to such factors asthe VFA concentration, the composition of the acids,and the ionic strength and temperature of the samplewhich affect the dissociation equilibrium constant.However, VFA concentration is calculated in themethod directly from the titration results for valueslower than 180 mg dm−3 VFA as CH3COOH (HAc)and multiplied by a factor of 1.5 above 180 mg dm−3.This approach almost invariably results in a large error:
for example, for a VFA concentration of 200 mg dm−3
as HAc with total phosphate of 150 mg dm−3 asP, the approximation results in 23% error in theVFA concentration (0.016 mg dm−3 instead of 0.013).Despite its faults, and considering that the procedurecan be modified to include externally measuredweak-acid subsystems (phosphate, sulfide, ammonia,etc), the method may be used to detect a largeupsurge in VFA concentrations, as intended by theauthors. Indeed, it is the most popular method inIsrael and it is also practiced in many other places.However, it should be noted that the method ispractical only where relatively large changes in VFAconcentration are not detrimental to the process,as might sometimes be the case in well-bufferedreactors.
Pauss et al10 proposed a similar back-titrationmethod in which bicarbonate alkalinity is the mon-itored parameter rather than VFA. In their method,the solution is first titrated from the initial pH to pH4.5–4.0 and CO2(g) is removed by vacuum boiling.Subsequently, the solution is back-titrated to the ini-tial pH and the bicarbonate concentration is calculatedby the difference between the acid and base titration.
McGhee8 presented a different approach to approx-imating VFA concentrations. He suggested determin-ing the slope of the titration curve between pH 5and pH 4 as a simple and rapid means of estimatingVFA concentrations. The sample is titrated rapidlyto pH 5.5, a short delay is given to allow CO2 toreach equilibrium with the atmosphere, and thereafterthe titration is continued drop-wise to a pH slightlyabove 5. From this point one records the amount ofadditional acid required and pH attained. The val-ues attained are then plotted, and the reciprocal ofthe slope is calculated. The method is based on theidea that for a given reactor, with a high and there-fore fairly constant carbonate alkalinity concentration,the amount of standard acid added to effect a pHchange between 5 and 4 reflects the change in VFAconcentration.
The author intended the approach to supplementbut not replace the more accurate methods for VFAdetermination such as chromatographic techniques.As such it has value, however, as a more generaltool the approach has several faults. First, it cannotserve as a tool for determining VFA concentrationbut simply to detect large changes in concentration.Second, even within this scope its application is limitedbecause the titration between pH 5 and 4 accountsfor only about 50% of the VFA alkalinity, and theeffect of the carbonate system on the proton-acceptingcapacity in this pH range is not negligible, especiallywhen the CT to AT ratio is high (above ten, as inmost anaerobic reactors). Furthermore, in anaerobicreactors any increase in VFA alkalinity is accompaniedby a similar decrease in carbonate alkalinity (and/orin the alkalinity of other proton-accepting speciessuch as the phosphate subsystem). As a result, anincrease in VFA concentration will not be represented
1336 J Chem Technol Biotechnol 79:1331–1341 (online: 2004)

Monitoring of anaerobic digestion—a review
proportionally in the amount of acid added betweenpH 5 and 4.
Ripley et al9 working on poultry manure treatment,suggested another way to monitor the biologicalstability of a high-strength anaerobic digester. Theyrecommended titration to two end points and theuse of the ratio PA (volume of strong acid requiredto titrate the solution down to pH 5.75) to IA(volume of strong acid required to titrate the solutionfrom pH 5.75 to pH 4.3) as a means of rapiddetection of possible stress (they suggested a valueexceeding 0.3 is indicative of stress). PA relatesroughly to bicarbonate alkalinity and the titrationfrom 5.75 to 4.3 (IA) approximates VFA alkalinity.The concept of titration to pH 5.75 as means ofestimating bicarbonate alkalinity was first introducedby Jenkins et al13 They claimed that 80% of thebicarbonate is converted to CO2 at pH 5.75 whileat the same pH only around 20% of the VFA willhave contributed to the alkalinity. Therefore, for thehigh alkalinity concentrations encountered in highstrength reactors, the effect of VFAs on the bicarbonatealkalinity (PA) value would be minor, even if the VFAreached high concentrations. Ripley et al9 added thattitration between 5.75 and 4.3 gives roughly the VFAconcentration, and so they assert that the ratio betweenthe two values is analogous to the ratio of VFA tocarbonate alkalinity.
The clear advantages of this method are simplicity,cost effectiveness, and rapidity. As the ratio PAto IA is dimensionless it does not require titrantstandardization nor sample volume measurement. Onthe other hand, because only about 65% of the VFA isrepresented in the titration between 5.75 and 4.25 andin reality less than 70% of the carbonate alkalinity istitrated at pH 5.75 (value calculated for samples withTDS higher than 3000 mg dm−3) the method lacksaccuracy and is somewhat insensitive to increase inVFA concentrations, especially in the case of high CT
to VFA ratios.A concept for approximation of VFA concentra-
tions in prefermenters (hydrolysis reactors), basedon pH reading only, was developed by Munch andGreenfield.11 In prefermenters, unlike typical anaer-obic reactors, the VFA are the desired products ofthe anaerobic activity and their build-up is a sign of ahealthy process. The typical operational pH range is5–6. The authors developed a mathematical func-tion relating the VFA concentration to pH usinga set of simplified assumptions. The value of thismethod is that without any additional work a simplepH reading from the working reactor can give a goodindication of the VFA concentration. The methodis only suitable for reactors working with high VFAconcentrations and low pH and providing that thesimplifying assumptions on which the model is basedare met. The major disadvantage of this approachappears to be the possible lack of reliable pH mea-surements emanating either from unaccounted CO2
supersaturation or from other pH probe inaccuracies.
It is therefore recommended to use the method inconjunction with (at least) a weekly analytical VFAmeasurement.
Measurement of H2CO3∗ alkalinity only by direct
titration, with or without an externalmeasurement of VFA concentrationTo overcome the shortcomings of using the conceptof total alkalinity (ie titration to pH 4.5) for anaerobicreactor monitoring, a number of modified alkalinityprocedures have been proposed.
Hattingth et al23 advocated the use of an alkalinityproton accepting capacity (PAC) value titrated downto pH 6 and expressed as HCO3
− alkalinity as arealistic measure of the available buffering capacity ofan anaerobic digester.
Rozzi and Brunetti12 proposed a method wherea digester sample is saturated with CO2 (to yieldPCO2 = 1 bar) and subsequently the pH is reduced to3.7 by the addition of standard acid. Such additionof CO2 does not alter the bicarbonate alkalinity.The volume of CO2(g) released from solution atpH 3.7 is then measured by a gas meter. As theloss of CO2(g) during titration is negligible andassuming that the original CO3
2− concentrationat the operational pH is very low, this measuredvolume of CO2(g) is proportional to the mass ofHCO3
− converted. Bicarbonate alkalinity (BA) is thusdetermined by:
BA(in mg dm−3as CaCO3)= (VCO2 − Vacid)/Vsample
× 50 000/22.4 × C) (14)
where:
VCO2 — volume of gaseous CO2 released at pH 3.7(dm3)
Vacid — volume of standard acid from initial pH topH 3.7 (dm3)
C—correction factor, which adjusts for temperature(T) and pressure (P) effects in the vessel:
C = T0
T· P − PV
P0(T0 = 273.16 and
P0 = 1.013 bar) (15)
Results from the proposed method were comparedwith results derived from total alkalinity minus theVFA concentration (calculated via chromatographictechniques) and found to be very accurate andreproducible in the presence and absence of VFA(±3%). It was therefore concluded that the initialCO2 bubbling does not cause volatile acid stripping.According to the authors, this method, in additionto the parallel method in which the CO2(g) pressurechange (rather than the volume released) is measuredfollowing titration to pH <4, is suitable for automatedcontrol of anaerobic reactors.24
It appears that from a theoretical standpoint bothmethods are robust and sound. Because the calculation
J Chem Technol Biotechnol 79:1331–1341 (online: 2004) 1337

O Lahav, BE Morgan
in the procedure is independent of equilibriumconstants and pH measurements, and no problematicsimplifying assumptions are made, the method shouldgive accurate results. However, on the negative side,the procedure is relatively complex and specificequipment (pressure vessel, gas flow meter or pressuregauge, CO2 bottle) is required in addition to thestandard laboratory equipment. On a more generalnote, concern for the usage of these methods (andsimilar procedures) may stem from the very choiceof bicarbonate alkalinity as the principal controlparameter in anaerobic reactors, especially where thetotal inorganic carbon concentration is much higherthan VFA concentration. In such cases a small changein the carbonate alkalinity could mean a large increase(percentage wise) in VFA concentration. Such smallchange may fall within the accuracy of the method andgo unnoticed, detracting from the effectiveness of theconcept.
Accurate measurement of both VFA and H2CO3∗
alkalinity with differing levels of complexity andaccuracyThis group of methods is composed of more complextitrative methods typically requiring several titrationpoints and computerized data interpretation.
Colin15 suggested an automated method based onacid and base titration to three endpoints. In thismethod, after measurement of the initial pH, thesample is divided in two. One part is acid-titratedto pH 2 and the other is base-titrated to pH >10.The sample that was acid-titrated to pH 2 was furtherbase-titrated up to pH >10. This procedure yieldsthree pairs of pH and Vx (acid dosage). Using thesethree pairs and the initial pH, CT, AT and NT
(total ammonium concentration) are obtained usingequilibrium equations and a computer program. Theauthor reports good accuracy as compared with VFAand CT values determined by analytical methods.However, proper evaluation of the advantages anddisadvantages of the method was not possible becausethe method lacks a sufficiently detailed description.
A different empirical-theoretical approach extend-ing the method suggested by McGhee was developedby Kapp.16,25 McGhee originally proposed that titra-tion from pH 5 to pH 4 can be considered propor-tional to the VFA concentration. Kapp accepted thisapproach but considered the carbonate subsystem toalso have PAC in the pH range between pH 5 and4, neglecting the sulfide, phosphate, and ammoniumsubsystems. Accordingly, the following equality holds:
VA5–4, VFA = VA5–4, measured − VA5–4, H2CO3∗ (16)
where:
VA5–4, VFA = volume of acid required to titratefrom pH 5 to pH 4 due to the VFAPAC
VA5–4, measured = volume of acid required to titratefrom pH 5 to 4
VA5–4, H2CO3∗ = volume of acid required to titrate
from pH 5 to pH 4 due to thecarbonate PAC
To develop an explicit and simple mathe-matical expression linking VFA concentration toVA5–4, measured Kapp conducted titration experimentsfor a broad VFA and CT concentration range andderived the following empiric equation linking volumeof titrant to VFA and H2CO3
∗ alkalinity concentra-tions:
VA5–4, VFA = 0.1/N · (−0.0283 + 0.09418 VFA/60)
× Vs/20 (17)
VA5–4, H2CO3∗ = 0.005 · (0.044875 + 0.00469
× [Alkmeasured]) · Vs/N (18)
where:
N = titrant concentration (eq dm−3)Vs = volume of sample (cm3)
[Alkmeasured] = total PAC as titrated to pH = 4.3 (eqdm−3)
Insertion of eqns (17) and (18) into eqn (16) andrearranging yields Kapp’s first approximation:
[VFA] = 127 416 · N · VA5–4, measured/Vs
− 2.99 · [Alkmeasured] − 10.6 (19)
where:[VFA] = VFA concentration (mg dm−3 as HAc)Using a further two assumptions, eqn (19) trans-
forms slightly yielding:
[VFA] = 131 340 · N · VA5–4, measured/Vs
− 3.08 · [Alkmeasured] − 10.9 (20)
Kapp’s approach involves three pH titration setpoints (pH 5.0, 4.3 and 4.0), in addition to the initialpH. Working on samples of digested sludge, Kappreported an accuracy of ±10% for VFA concentrationsabove 20 mg dm−3 as HAc. Baucher reported a similaraccuracy for samples of raw wastewater, primarysludge, and high- and low-load activated sludge.25
The major drawback of Kapp’s approach is thatit is based on empirical mathematical relationshipsthat were developed under unique conditions (ionicstrength, temperature, absence of other weak-acidsystems) that are not necessarily generally applicable.Its advantage stems from its relative simplicity—theVFA concentration is calculated using a singleequation, the apparatus needed is simple andlaboratory execution is easy and quick. The method isalso suitable for automated execution.
The most general method to date was presentedby Moosbrugger et al17,18 The authors developeda model based almost solely on aquatic chemistryconsiderations, with very few simplifying assumptions.
1338 J Chem Technol Biotechnol 79:1331–1341 (online: 2004)

Monitoring of anaerobic digestion—a review
Because of its importance the method is described indetail.
The authors developed a five-point method involv-ing equating a mass balance for alkalinity in terms ofvolume of titrant added (eqn (21)) to a mass balance ofalkalinity in terms of species concentration (eqn (22)).
Mtotal alk(x) = Ve · Ca − Vx · Ca (21)
where: Mtotal alk(x) = total mass of alkalinity after theaddition of Vx cm3 of standard strong acid (mol),Ve = the unknown volume of standard strong acid tobe added to the alkalimetric end point (dm3), Vx = thevolume of standard strong acid added to a point x withpH equal to pHx (dm3), and Ca = concentration ofstandard strong acid titrant (mol dm−3).
Mtotal alk(x) = {[HCO3−]x + 2[CO3
2−]x + [A−]x
+ [HS−]x + 2[S2−]x + [NH3]x + 3[PO43−]x
+ 2[HPO42−]x + [H2PO4
−]x
+ [OH−]x − [H+]x} · (Vx + Vs) (22)
Where [y]x indicates molar concentration of species yafter addition of x cm3 of standard acid (mol dm−3),[A−] = dissociated short chain VFA species concen-tration (mol dm−3) and Vs = volume of sample (dm3).
Equation (22) can be reformulated in terms of totalweak-acid species concentrations using equilibriumequations for the weak-acid systems and mass balanceequations for each of the weak-acid systems asrepresented in eqns (23)–(25) (For brevity only theVFA and carbonate subsystems are given. The othersubsystems follow the same approach.)
[HCO3−]x = CT · Vs/(Vx + Vs)/{1 + K ′
C2/(H+)x
+ (H+)x/K ′C1} (23)
[CO32−]x = CT · Vs/(Vx + Vs) · K ′
C2/{(H+)x + K ′C2
+ ((H+)x)2/K ′
C1} (24)
[A−]x = AT · Vs/(Vx + Vs) · K ′a/{(H+)x
+ K ′a} (25)
Similar equations can be developed for thephosphate, sulfide and ammonium proton-acceptingspecies. Substituting the equations for each speciesconcentration into eqn (22) (for example as given ineqns (23)–(25) for the carbonate and VFA subsys-tems) gives an equation for total mass of alkalinity interms of AT, CT, PT, NT, ST and pH:
Mtotal alk(x) = {CT · Vs/(Vs + Vx) · Fn1(pH)x
+ AT · Vs/(Vs + Vx) · Fn2(pH)x
+ PT · Vs/(Vs + Vx) · Fn3(pH)x
+ ST · Vs/(Vs + Vx) · Fn4(pH)x
+ NT · Vs/(Vs + Vx) · Fn5(pH)x + 10−(14−pHx)/fm
− 10−pHx/fm} · (Vs + Vx) (26)
where: PT, ST, and NT represent the total phos-phate, sulfide and ammonium concentrations, fm =monovalent activity coefficient, and Fn1 to Fn5 arefunctions of pHx and equilibrium constants for thecarbonate, acetate, phosphate, sulfide and ammoniumsubsystems respectively.
Equating eqns (21) and (26) gives the desiredequation linking the mass of alkalinity based on acidadded to the mass of alkalinity based on speciesconcentrations:
(Ve − Vx) · Ca = {CT · Vs/(Vs + Vx) · Fn1(pH)x
+ AT · Vs/(Vs + Vx) · Fn2(pH)x
+ PT · Vs/(Vs + Vx) · Fn3(pH)x
+ ST · Vs/(Vs + Vx) · Fn4(pH)x
+ NT · Vs/(Vs + Vx) · Fn5(pH)x
+ 10−(14−pHx)/fm − 10−pHx/fm} × ·(Vs + Vx) (27)
At each point in the titration (ie for each Vx
and corresponding pHx), eqn (27) includes threeunknowns: Ve, AT and CT. Thus, to solve for Ve,AT and CT only three data pairs (ie three valuesfor corresponding Vx and pHx pairs) need to beknown. This was found to lead to poor prediction.Moosbrugger et al found that the best first estimatefor AT and CT and can be obtained from four titrationdata points (ie two pairs of data points), each pairsymmetrical about pKC1 and pKa (they suggestedapproximately half a pH unit to either side of therespective pK values).17
When inserted into eqn (27), the data from thefour titration points give four equations. The pair ofobservations around pKa (ie the third and the fourthpoints) is in a region where the buffer capacity of theVFA system dominates that of the carbonate systemand vice versa for the first and second titration points.Consequently, subtracting the equation formed fromthe fourth data point from that derived from thethird, gives an equation in terms of CT and AT inwhich the VFA alkalinity term, ie the species [A−]x,dominates. Similarly, subtracting the equation formedfrom the second data point from that derived fromthe first, gives an equation in terms of CT and AT inwhich the H2CO3
∗ alkalinity term, namely [HCO3−]x,
significantly dominates. This technique enables arelative separation between the two subsystems inwhich the third and the fourth point are mainlyresponsible for the VFA derivation. Therefore, anerror in the first two pH observations would be largely‘absorbed’ by the carbonate subsystem, minimizing theeffect on the VFA calculation. The two new equationsare solved to produce the first estimate of AT and CT.
Modification of the first estimate in this approachis carried out as follows: a second estimate of AT
and CT is calculated by again taking two pH pairs:one symmetrical about pKa (ie pH3; pH4) butthe other asymmetrical about pKC1 (ie pH1; pH4).Subsequently, these two CT values (calculated in
J Chem Technol Biotechnol 79:1331–1341 (online: 2004) 1339

O Lahav, BE Morgan
the first and second estimate) are compared, and ifdifferent, all pH observations are adjusted by �pHand the calculation procedure is repeated (by changing�pH) until the difference between the two CT valuesis negligible. The DOS computer program requiredfor this method can be purchased from the WaterResearch Commission of South Africa at a cost ofapproximately $50.
The necessity for correcting observed pH values wasattributed by the authors to either a residual liquidjunction potential (error in pH measurements causedby differences in the dissolved solids concentrationbetween the buffer solution used to calibrate theprobe and the test solution), or from poor pH metercalibration.18 Execution of the five-point method isfacilitated by a computer program supplied by theauthors. The method was tested with results typicallywithin 2% accuracy.18,26,27 Application of the methodis restricted to cases where the CT is greater than twiceAT, otherwise the systematic pH correction does notconverge.
As mentioned above, the five-point method is themost ambitious effort thus far to include all systemcomponents in a single sophisticated, yet simple model(titration to five points is carried out rapidly and withease, because the selected pH points do not have tobe reached accurately and the selected pH areas arevery stable). However, the final step (correction of pHobservations) tends to detract from the theoreticaljustification of the method, and from its generalapplicability. With regard to errors emanating fromresidual liquid junction potential: the total dissolvedsolids concentrations in the samples tested in the five-point approach varied between 500 and 1000 mg dm−3
(after dilution), which is very close to the dissolvedsolids concentration in standard buffer solutions. Forthis reason and others it is very difficult to ascribea ‘systematic pH error correction’ to liquid junctioneffects.27
Lahav et al proposed a new eight-point titrationmethod for measuring both VFA and H2CO3
∗
alkalinity.19 As in the five-point method, executionis facilitated by a computer program (available freeof charge from the author). The model extends the‘five-point method’ by resolving the mathematical andanalytical problems which gave rise to the ‘systematicpH error’ of the Moosbrugger approach. In thismodification, total alkalinity (PAC of all species inthe sample) is measured accurately using the Grantitration technique,28 and this value is used, in additionto the first estimate of AT and CT, to give the finalresult. The Gran procedure requires a further threepairs of (Vx, pH) points taken in the pH range of2.4 < pH <2.7. The assessment of the first estimateof AT and CT is effected as follows: AT and CT,determined from the first estimate, and Ve, determinedfrom the Gran function analysis, are inserted ineqn (27) together with the initial pH value (ie whereVx = 0). Both AT and CT are now multiplied by aproportional term ‘x’, to account for inconsistencies in
pH observations yielding:
Ve · Ca = {x · CT · Fn1(pH0) + x · AT · Fn2(pH0)
+ Const} · Vs (28)
where: Const = a constant representing the proton-accepting term for the phosphate, sulfide, ammoniumand water subsystems at the initial pH (pH0).
Solving for x gives an assessment of the first estimatefor AT and CT. The closer x is to unity, the better thefirst estimate conforms to the accurately measuredVe. An acceptable value for x is a relative error(|(x − 1)| · 100) of less than 5%. The improved valuesfor AT and CT are then obtained by multiplying eachof the two parameters by x to conform to the accuratelymeasured Ve using the initial pH. For the final outputof the algorithm, the improved AT gives the finalvalue for VFA concentration and the improved CT isused to calculate the final value for H2CO3
∗ alkalinityusing the initial pH. Typical results obtained usingthe method on simulative and industrial effluents aresimilar to the five-point method, ie less than 2% error,but in contrast to the Moosbrugger approach, thismethod can be applied for any CT to AT ratio.19
It should be noted that in both the five-point and theeight-point methods, when the initial pH is lower thanabout 6.85, a known volume of standard base shouldbe added to the sample to allow acid titration to theprescribed pH points. In such cases the algorithm ischanged as follows: (i) Vs is modified by the volume ofNaOH addition; (ii) Ve is derived as before and thenmodified giving:
Ve (final) = (Ve (Gran function) · Ca − VNaOH
× CNaOH)/Ca (29)
where: VNaOH = volume of standard NaOH solu-tion added to lift pH above 6.85 dm3 andCNaOH = concentration of standard NaOH solution(mol dm−3).
The disadvantages of Lahav et al’s method includea more tedious titration procedure, the need formeasuring all weak-acid subsystems in addition to ECand temperature, and the need for using base titrant forsamples with initial pH lower than 6.85. Advantagesinclude high accuracy, and general applicability.
SUMMARYThis review examines multiple on-site, titrative mea-surement approaches to monitor anaerobic processes.The main objective is to clarify the theoretical basis onwhich the methods were developed, to discuss theiradvantages and disadvantages, and to allow the oper-ators to choose a method that is suitable for theirprocess needs.
Multipoint titration methods that take into accountthe various weak-acid subsystems and the importantparameters of EC and temperature are generic and
1340 J Chem Technol Biotechnol 79:1331–1341 (online: 2004)

Monitoring of anaerobic digestion—a review
highly accurate. It appears that there is little reason tochoose a more rudimentary approach with the currentavailability of relatively inexpensive computerizedand programmable titration equipment. However,even the more simple methods can be appliedsuccessfully provided that the operators understandthe assumptions and simplifications behind themethod, and provided that the accuracy level is suchthat it allows for proper detection of changes in VFAconcentrations and rapid intervention.
REFERENCES1 Van Haandel AC and Lettinga G, Anaerobic Sewage Treatment.
John Wiley & Sons Ltd, London (1994).2 Florencio L, Field JA and Lettinga G, Substrate competition
between methanogens and acetogens during the degradationof methanol in UASB. Wat Res 29:915–922 (1995).
3 Loewenthal RE, Wentzel MC, Ekama GA and Marais GvR,Mixed weak acid systems. Part 2: Dosing estimation, aqueousphase. Water SA 17:107–122 (1991).
4 Pretorious WA, pH controlled feed-on-demand for high rateanaerobic systems. Wat Sci Tech 30:1–8 (1994).
5 Seghezzo L, Zeeamn B, van Lier JB, Hamelers HVM andLettinga G, A review: the anaerobic treatment of sewage inUASB and EGSB reactors. Bioresource Technology 65:175–190(1998).
6 Moosbrugger RE, Wentzel MC, Ekama GA and Marais GvR,Weak acid/bases and pH control in anaerobic systems—areview. Water SA 19:1–10 (1993).
7 DiLallo R and Albertson OE, Volatile acids by direct titration.Journal WPCF 33:356–365 (1961).
8 McGhee J, A method for approximation of volatile acidconcentrations in anaerobic digesters. Water & Sewage Works115:162–166 (1968).
9 Ripley LE, Boyle WC and Converse JC, Improved alkalimetricmonitoring for anaerobic digestion of high strength wastes.Journal WPCF 58:406–411 (1986).
10 Pauss A, Rozzi A, Ledrut MJ, Naveau H and Nyns EJ, Bicar-bonate determination in complex acid–base solutions by aback-titration method. Environmental Technology 11:469–476(1990).
11 Munch E and Greenfield PF, Estimating VFA concentrationsin prefermenters by measuring pH. Wat Res 32:2431–2441(1998).
12 Rozzi A and Brunetti A, Direct bicarbonate determination inanaerobic digester liquors. Environmental Technology Letters2:385–392 (1981).
13 Jenkins SR, Morgan JM and Sawyer CL, Measuring anaerobicsludge digestion and growth by a simple alkalimetric titration.Journal WPCF 55:448–453 (1983).
14 Di Pinto AC, Limoni N, Passino R, Rozzi A and Tomei MC,Anaerobic process control by bicarbonate monitoring.
Abstract, 5th IAWPRC workshop on Instrumentation, Control,and Automation of Water and Wastewater Treatment. Yoka-homa, Kyoto, August (1990).
15 Colin F, Development of an automatic equipment for the studyof acid-base equilibria for the control of anaerobic digestion,in Anaerobic Digestion and Carbohydrate Hydrolysis of Waste, edby Ferrero GL, Ferraut MP and Naveau H. Elsevier Science,London, pp 381–393 (1984).
16 Kapp H, Schlammfaulung mit hohem Feststoffgehalt. StuttgarterBerichte zur Siedlungswasserwirtscaft, Band 86, OldenbourgVerlag, Munchen, 300 pp (1984).
17 Moosbrugger RE, Wentzel MC, Loewenthal RE, Ekama GAand Marais GvR, A 5-point titration method to determinethe carbonate and SCFA weak acid/bases in aqueoussolution containing also known concentrations of other weakacid/bases. Water SA 19:29–39 (1993).
18 Moosbrugger RE, Wentzel MC, Ekama GA and Marais GvR,A 5-point titration method for determining the carbonate andSCFA weak acid/bases in anaerobic systems. Wat Sci Tech28:237–245 (1993).
19 Lahav O, Morgan BE and Loewenthal RE, A rapid, simple andaccurate method for measurement of VFA and carbonatealkalinity in anaerobic reactors. Env Sci & Tech 36:2736–2741(2002).
20 Powell GE and Archer DB, On-line titration method formonitoring buffer capacity and total volatile fatty acidslevels in anaerobic digesters. Biotechnology and Bioengineering33:570–577 (1988).
21 Feitkenhauer H, von Sachs J and Meyer U, On-line titrationof volatile fatty acids for the process control of anaerobicdigestion plants. Wat Res 36:212–218 (2002).
22 Loewenthal RE and Marais GvR, Carbonate chemistry of highsalinity waters. Water Research Commission SA, ResearchReport No W46 (1983).
23 Hattingth WHJ, Kotze JP, Thiel PG, Toerien DF andSiebert ML, Biological changes during the adaptation of ananaerobic digester to a synthetic substrate. Wat Res 1:255–277(1967).
24 Rozzi A, Di Pinto AC and Brunetti A, Anaerobic process controlby bicarbonate monitoring. Environmental Technology Letters6:594–601 (1985).
25 Baucher K, A comparison of two simple titration procedures todetermine volatile fatty acids in influents to wastewater andsludge treatment processes. Water SA 24:49–56 (1998).
26 De Hass DW and Asam N, Use of simple titration procedureto determine H2CO3
∗ alkalinity and volatile fatty acidsfor process control in wastewater treatment. Water SA21:307–318 (1995).
27 Lahav O and Loewenthal RE, Measurement of VFA inanaerobic digestion: the five point titration method revisited.Water SA 26:389–391 (2000).
28 Gran G, Determination of the equivalence point in potentio-metric titrations. The Analyst 77:661–671 (1952).
J Chem Technol Biotechnol 79:1331–1341 (online: 2004) 1341