review of the foodaps 2012 sample design - usda … of the foodaps 2012 sample design vi...
TRANSCRIPT

Review of the FoodAPS 2012 Sample Design
Authors
Tom Krenzke
Jennifer Kali
December 21, 2016
Prepared for:
Economic Research Service
U.S. Department of Agriculture
355 E Street, SW
Washington, DC 20024-3221
Prepared by:
Westat
An Employee-Owned Research Corporation®
1600 Research Boulevard
Rockville, Maryland 20850-3129
(301) 251-1500

Review of the FoodAPS 2012 Sample Design iii
Table of Contents
Chapter Page
Acknowledgments .............................................................................................. vi
Executive Summary ............................................................................................ vii
1 Overview .............................................................................................................. 1
1.1 FoodAPS-1 Analytic Objectives ......................................................... 1 1.2 Description of FoodAPS-1 Sample Design ...................................... 3 1.3 Results from the Sample Design ......................................................... 10 1.4 Precision of Four Key Survey Estimates from the
FoodAPS-1 Survey................................................................................ 12
2 Design Effect Due to Unequal Weights ......................................................... 20 3 Design Effect Due to Clustering ...................................................................... 36 4 Design Effect Due to Stratification ................................................................. 43 5 Concluding Remarks .......................................................................................... 47 References ............................................................................................................ R-1
Appendixes
A Sampling Error Measures .................................................................................. A-1 B Intracluster Correlation Computations ........................................................... B-1
Tables
ES-1 Main study target group assignment and screener target group assignment agreement ........................................................................................ x
ES-2 Impact ratio due to stratification for outcome measures ............................. xi ES-3 Intracluster correlations for Primary Sampling Units (PSUs) and
Secondary Sampling Units (SSUs) .................................................................... xii 1-1 Distribution of population and planned sample by target group ................ 4

Review of the FoodAPS 2012 Sample Design iv
Contents (continued)
Tables Page
1-2 Definition of USDA Food and Nutrition Service (FNS) Administrative Regions ...................................................................................... 6
1-3 Planned and actual household sample sizes by target group ........................ 10 1-4 Estimates and sampling error measures by outcome of interest
and target groups ................................................................................................ 13 1-5 Estimates and sampling error measures by outcome of interest
and WIC household classification .................................................................... 14 1-6 Estimates and sampling error measures by outcome of interest
and metro/non-metro classification ................................................................ 14 1-7 Estimates and sampling error measures by outcome of interest
and rural/non-rural classification ..................................................................... 15 1-8 Estimated difference between Target Groups D and A, standard
error, and design effect by outcome ................................................................ 18 1-9 Estimated difference between Target Group C versus Target
Groups A, B, and D, standard error and design effect by outcome ............................................................................................................... 18
1-10 Estimated difference between Target Group D versus A, B, and
C, standard error and design effect by outcome ............................................ 18 2-1 Design effect at each stage of weighting for various analysis
domains ................................................................................................................ 21 2-2 Estimates of outcome variables across weighting stages .............................. 27 2-3 Screener target group assignment and SNAP list agreement ....................... 29 2-4 Main study target group assignment and SNAP list agreement .................. 29 2-5 Agreement rates with the SNAP list designation over time ......................... 30 2-6 Main study target group assignment and screener target group
assignment agreement ........................................................................................ 30

Review of the FoodAPS 2012 Sample Design v
Contents (continued)
Tables Page
2-7 Weight variation within target group assignment .......................................... 33 2-8 ANOVA results on screener and main study target group
assignments .......................................................................................................... 34 3-1 Intracluster correlations for PSUs and SSUs .................................................. 37
3-2 Values of for outcome variables, by subgroups ........................ 40 4-1 Impact ratio due to stratification for outcome measures, overall................ 44 4-2 Impact ratio due to stratification for outcome measures, by target
group ..................................................................................................................... 44 4-3 Impact ratio due to stratification for outcome measures, by WIC
household classification ..................................................................................... 45 4-4 Impact ratio due to stratification for outcome measures, by
metro/non-metro classification ........................................................................ 45 4-5 Impact ratio due to stratification for outcome measures, by
rural/non-rural classification............................................................................. 46
Figure
2-1 Box-and-whisker plot of final weights by target group assigned at screener for households in Target Group D, as assigned in main study ...................................................................................................................... 35
Review of the FoodAPS 2012 Sample Design vi
Acknowledgments
The authors are grateful to Westat Senior Statistical Fellows Graham Kalton and Bob Fay for their
guidance and valuable comments and insights during the development of the work and the writing
of the report.
Preferred citation:
Krenzke, T., and Kali, J. (2016). Review of the FoodAPS 2012 Sample Design. Prepared for the
Economic Research Service, U.S. Department of Agriculture. Washington, D.C.
This report is part of a series of five reports. The citations for the other reports are as follows:
Li, J., Van de Kerckhove, W., and Krenzke, T. (2016). Review of the FoodAPS 2012 Imputation
Approaches for Income and Price Data. Prepared for the Economic Research Service, U.S. Department of Agriculture. Washington, D.C.
Maitland, A., and Li, L. (2016). Review of the Completeness and Accuracy of FoodAPS 2012 Data. Prepared for the Economic Research Service, U.S. Department of Agriculture. Washington, D.C.
Petraglia, E., Van de Kerckhove, W., and Krenzke, T. (2016). Review of the Potential for Nonresponse Bias in FoodAPS 2012. Prepared for the Economic Research Service, U.S. Department of Agriculture. Washington, D.C.
Yan, T., and Maitland, A. (2016). Review of the FoodAPS 2012 Instrument Design, Response Burden, Use of Incentives, and Response Rates. Prepared for the Economic Research Service, U.S. Department of Agriculture. Washington, D.C.

Review of the FoodAPS 2012 Sample Design vii
Executive Summary
The 2012 National Household Food Acquisition and Purchase Survey (FoodAPS) (hereafter
referred to as “FoodAPS-1”) is a household survey fielded primarily in 2012 and designed to capture
detailed information on the food acquisitions of U.S. households. FoodAPS-1 was sponsored by the
U.S. Department of Agriculture (USDA) and managed by its Economic Research Service (ERS). In
2015, ERS contracted with Westat to conduct an independent assessment of the quality of the
FoodAPS-1 sample design, instrumentation, data collection procedures, and resulting data. This
report is part of a series of five reports that constitute that assessment.
This report presents an evaluation of the sample design for FoodAPS-1. The evaluation focused on
the resulting precision of estimates and the sources of impact that may cause the variances to be
higher than expected. The FoodAPS-1 survey was designed by the survey contractor Mathematica
Policy Research (Mathematica) to provide nationally representative estimates of adequate precision
of food expenditures and other outcome variables for certain target groups, and to conduct
comparisons with minimum detectable differences. The key domains of interest, referred to as target
groups, were defined as:
Group A. Households with income less than the poverty guideline not receiving Supplemental Nutrition Assistance Program (SNAP) benefits;
Group B. Households with income greater than or equal to 100 percent and less than 185 percent of the poverty guideline not receiving SNAP benefits;
Group C. Households with income greater or equal to 185 percent of the poverty guideline not receiving SNAP benefits; and
Group D. Households receiving SNAP benefits.
An important objective was to compare food acquisitions for (1) SNAP and non-SNAP households;
(2) SNAP and non-participating SNAP-eligible households; and (3) all low-income (SNAP and non-
SNAP) and higher income households. Of interest is to understand the reasons some low-income
households do not participate in government programs such as SNAP.
The sampling plan took into account the complex features of the design, including assumptions on
the impact that clustering and differential sampling rates (and sampling weights) would have on the
precision of estimates. This impact on variances is commonly addressed through estimating design
effects. The design effect is the increase in sample size needed under a complex design (which

Executive Summary
Review of the FoodAPS 2012 Sample Design viii
includes clustering, differential sampling rates, stratification) in order to achieve the same precision
under simple random sampling. The effective sample size is the actual sample size divided by the
design effect. It reflects the sample size under simple random sampling that is needed to attain the
precision that resulted from the complex design.
Westat examined the impact of the sample design on the precision of some key survey estimates for
each target group individually and also for comparisons between the groups. The outcomes
evaluated were (1) total amount spent on food consumed at home (FAH) events, (2) total spent on
food away from home (FAFH) events, (3) total number of free events, and (4) a measure of food
insecurity. The subgroups of interest for the evaluation included (1) the four target groups, (2)
Special Supplemental Nutrition Program For Women, Infants, and Children (WIC) household
classification, (3) metro/non-metro classification (designated by county), and (4) rural/non-rural
classification (designated by Census tract).
The contractor provided broad ranges of the expected precision in terms of the design effect,
effective sample sizes, and minimum detectable differences (MDDs) that are used when making
comparisons between two subgroups. In general, the resulting measures of precision look reasonable
at the national level (i.e., for the total sample). The effective sample sizes exceeded the upper bound
on the range of expected effective sample size for two of the four outcome measures. For Target
Group C, while the actual sample size surpassed the targeted sample size, the upper bound of the
effective sample size was exceeded by two of the outcome measures, however, for one outcome
measure the effective sample size was closer to the lower bound. For SNAP (Target Group D),
while the actual sample size was about the same as planned, the effective sample size was closer to
the lower bound for two (and marginally for three) of the outcome measures. When comparing
groups with the largest sample sizes, that is, comparing Target Group C with Target Groups A, B,
and D, the actual MDD was sometimes lower than the expected MDD lower bound.
It is for the smaller subgroups, such as the Target Groups A and B, where effective sample sizes
were smaller than desired for FAH and FAFH expenditures, and where sample design
improvements may be helpful. That being said, although these effective sample sizes were smaller
than expected, when making comparisons with Target Group D, the large sample size in Target
Group D helped the resulting actual MDDs to fall into the broad range of expected MDDs.
The results in terms of total variance and variance components from a prior survey usually can help
improve the sample design in future cycles of the survey, leading to larger effective sample sizes for
subgroup analyses. The total variance can be decomposed into components of variance (such as the

Executive Summary
Review of the FoodAPS 2012 Sample Design ix
impact due to differential sampling rates [or weights], clustering, and stratification) so that reasons
for larger unexpected variation can be determined. This report investigates the components of
variance toward improving the sample design for the next main survey of FoodAPS.
In this review of the sample design, larger-than-expected variability in the weights was observed,
which impacted the resulting precision of estimates. Variability across target groups is by design, but
a great amount of within-group variability is problematic. Part of the weight variation issue is
misclassification (discussed below), and the way the sample was released. Also, the design proved
challenging as illustrated by the actual sample sizes for Target Groups A and B falling far short of
the target sample sizes.
As mentioned above, one particular point of focus is on misclassification of the target groups.
Households were classified into target groups at three different points in time:
SNAP list designation at the time of sampling addresses within Secondary Sampling
Units (SSUs);
Classification based on responses to the screener; and
Classification based on responses to the initial interview, combined with a second more-timely SNAP list match, and imputation due to nonresponse to the interview.
The switching of target group classifications between their SNAP list designation and their screener
classification, and between the screener classification and the initial interview (combined with a
second, more timely SNAP list match and imputations), can have an increasing effect on the
variation of weights. That is, when analyzing a group of records from within a final target group
designation, the respondents arrive in that group by several different ways, varying widely as to their
probabilities of selection, which causes variation among the weights. Table ES-1 demonstrates the
level of agreement between the target group assigned at the screener at the final target group
designation from the main study. Agreement between the two target group assignments is quite low,
at 64 percent overall. Agreement is highest with Target Group D (those on the SNAP list) with
84 percent agreement. All other group assignments are quite poor, ranging from 52 to 60 percent
agreement between the two target group assignments with Target Group C having the lowest rates
of agreement.

Executive Summary
Review of the FoodAPS 2012 Sample Design x
Table ES-1. Main study target group assignment and screener target group assignment
agreement
Main study target
group assignment
Screener target
group assignment Frequency In-cell agreement Overall agreement
A A 173 57% 64%
A B 103
A C 12
A D 14
B A 232 60%
B B 445
B C 51
B D 17
C A 157 52%
C B 664
C C 903
C D 19
D A 110 84%
D B 106
D C 17
D D 1,188
Note: This table was process for the 22 states with PSU sample that provided SNAP lists.
Consistency of the screener target group assignment with designations from the SNAP list and the
main survey can have a large impact on weight variation and, consequently, on the variances of the
estimates. Therefore, as explained above, there is a lot of weight variation within the main study
target group assignment. The standard deviation of the weights is larger than the mean for every
target group. The maximum weight in target group ranges from 7.5 to 11.7 times the mean for that
cell. This misclassification and its impact on variances are explored further in the report.
After a review of the sample design that was implemented, three main aspects of the design were
studied: (1) stratification, (2) clustering, and (3) weight variation, where the first one has potential to
decrease the variance, and the last two introduce an increase in variance.
In general, as seen in Table ES-2, the stratification impact results were mixed; however, future
design work should explore the benefits of explicit stratification of Primary Sampling Units (PSUs)
versus the use of the composite measure of size (MOS). The composite MOS is used to select PSUs
and SSUs with probability proportionate-to-size. The MOS is a function of planned sampling rates
and estimated population in each target group. The numerator of the impact ratio includes the strata
in the estimates of variance. The denominator is the variance computed without using the strata in
the computations. Lower values of the index indicate that stratification had a greater effect in
lowering standard errors. The ratio that is used as the evaluation measure is likely to overstate the
impact (i.e., be lower) because the denominator is likely an overestimate. That is, the units were

Executive Summary
Review of the FoodAPS 2012 Sample Design xi
selected with implicit stratification, and so the FoodAPS-1 PSUs are dispersed more than if selected
without stratification.
Table ES-2. Impact ratio due to stratification for outcome measures
Outcome/
statistic of interest Estimate
Standard error
(with stratification)
Standard error
(without stratification)
Impact
ratio
Average Spent on FAH $105.72 2.90 3.48 0.69
Average Spent on FAFH $56.52 1.61 2.64 0.37
Average Number of Free
Events
3.02 0.14 0.11 1.53
Proportion Food Insecurity 0.16 0.01 0.01 0.79
The sorting variables used in FoodAPS-1 were metro status and Food and Nutrition Service (FNS)
region. Use of other potential stratification variables, such as percentage in poverty, may provide a
better chance at arriving at desired sample sizes for Target Groups A (where a shortfall occurred)
and B, and may provide more potential to reduce the resulting variance to get more power out of
the survey cases. Future design work should explore the benefits of using the composite MOS, as
well as the best sources for the stratification and MOS variables.
The clustering amounts in FoodAPS-1 are about as expected, as shown in Table ES-3. The sizes of
the FoodAPS-1 PSUs and SSUs are among the largest in use by in-person surveys in terms of both
geographic and population size, which results in low impact on variances from clustering. That is,
observations within a PSU or SSU are not as correlated among households than if smaller
geographic areas were formed. However, the geographic size also increases travel time by
interviewers and may increase costs as well as decrease response rates. In terms of PSUs and SSUs,
future design work should:
Incorporate the estimated intracluster correlations shown in Table ES-3 to gauge the
number to select. The expected intraPSU correlations were expected to be between 0.01 and 0.05. The estimated correlations among the survey outcomes variables were in that range. This report also extends the investigation into subgroups (i.e., WIC), and intraSSU correlations, which range from 0.05 to 0.10, sometimes a bit higher;
Take into consideration response rates and interviewer travel time when determining other ways to form PSUs; and
Consider the number of degrees of freedom for statistical analysis because it is related to the number of first-stage units. That is, increasing the number of PSUs will increase the degrees of freedom, which provides greater stability of variances especially among subgroups, which reduces the widths of confidence intervals, and it allows for better estimates of the clustering impact.

Executive Summary
Review of the FoodAPS 2012 Sample Design xii
Table ES-3. Intracluster correlations for Primary Sampling Units (PSUs) and Secondary Sampling
Units (SSUs)
Outcome/statistic
Intracluster correlation
IntraPSU correlation ( ) IntraSSU correlation ( )
Average Spent on FAFH 0.00 0.05
Average Spent on FAH 0.01 0.10
Average Number of Free Events 0.02 0.08
Proportion Food Insecurity 0.02 0.10
Among the three main aspects that impact the resulting variances, the most potential for
improvement lies in reducing the weight variation. Future design work should ensure protocols to
eliminate or limit the increased amount of weight variation when handling drop points in the address
lists, updating the address lists for new construction or coverage issues with the lists, and addressing
shortfalls in sample yield, especially when releasing reserve sample. Ways should be sought to reduce
weight variation within target groups through the sampling process (especially release of replicates)
and to minimize screener misclassification. As mentioned above, a large contributor to weight
variation is misclassification among the target groups. In addition, other domains, such as
incorporating WIC in the definition of target groups, will be explored with the assignment of
sampling rates in the sampling plan for the next main survey.

Review of the FoodAPS 2012 Sample Design 1
The 2012 National Household Food Acquisition and Purchase Survey (hereafter referred to as
“FoodAPS-1”) gathered detailed information about household food acquisitions from April 2012 to
mid-January 2013. The survey was sponsored by the U.S. Department of Agriculture (USDA) and
developed and fielded by Mathematica Policy Research (Mathematica). The nationally representative
sample consisted of nearly 5,000 households that completed the FoodAPS-1 final interview. In 2015,
Economic Research Service (ERS) of USDA contracted with Westat to conduct an independent
assessment of the quality of the FoodAPS-1 sample design, instrumentation, data collection
procedures, and resulting data. This report is part of a series of five reports that constitute that
assessment. As part of the effort, Westat conducted an independent assessment of the sample design
for the FoodAPS-1. This document presents the results of the evaluation of the FoodAPS-1 sample
design.
1.1 FoodAPS-1 Analytic Objectives
The FoodAPS-1 survey was designed to provide nationally representative estimates of adequate
precision of expenditures for both food at home (FAH) and food away from home (FAFH), as well
as other outcome variables for certain target groups. The target groups were defined in terms of
participation in the Supplemental Nutrition Assistance Program (SNAP), household size, and total
reported household income (which was used in determining a household’s income in relation to the
poverty guidelines), namely:
A. Households with income less than the poverty guideline not receiving SNAP benefits;
B. Households with income greater than or equal to 100 percent and less than 185 percent of the poverty guideline not receiving SNAP benefits;
C. Households with income greater or equal to 185 percent of the poverty guideline not receiving SNAP benefits, and
D. Households receiving SNAP benefits.
Another important objective was to compare food acquisitions for (1) SNAP and non-SNAP
households; (2) SNAP and non-participating SNAP-eligible households; and (3) all low-income
Overview 1
Review of the FoodAPS 2012 Sample Design 2
Overview 1
(SNAP and non-SNAP) and higher income households. Of interest is to understand the reasons
some low-income household do not participate in government programs, such as SNAP.
We examine the impact of the sample design on the precision of some key survey estimates for each
target group individually and also for comparisons between the groups. The outcomes of interest
were:
Total amount spent on food consumed at home (FAH) events (derived from
TOTALPAID for FAH);
Total spent on food away from home (FAFH) events (derived from TOTALPAID for FAFH);
Total number of free events (derived from FREE for FAH and FAFH), and
Indicator for food insecurity (defined as having low or very low food insecurity, derived from ADLTFSCAT).
The subgroups of interest were:
Target groups;
Special Supplemental Nutrition Program For Women, Infancts, and Children (WIC) household classification;
Metro/non-metro classification (designated by county); and
Rural/non-rural classification (designated by Census tract).
The sample design plan took into account complex features, including assumptions on the impact
that clustering and differential sampling rates (and sampling weights) would have on the precision of
estimates. This impact on variances is commonly addressed through estimating design effects. The
design effect is the increase in sample size needed under a complex design (includes clustering,
differential sampling rates, stratification) in order to achieve the same precision under simple
random sampling. The effective sample size is the actual sample size divided by the design effect. It
reflects the sample size under simple random sampling to attain the precision that resulted from the
complex design. This report provides actual design effects and effective sample sizes, and explores
the reasons why some results were not as expected.

Review of the FoodAPS 2012 Sample Design 3
Overview 1
One particular point of focus is on misclassification. Households were classified into target groups
at three different points in time:
1. SNAP list designation at the time of sampling addresses within secondary sampling
units (SSUs);
2. Classification based on responses to the screener; and
3. Classification based on responses to the initial interview, combined with a second, more timely SNAP list match, and imputation due to nonresponse to the interview.
The switching of target group classifications between their SNAP list designation and their screener
classification, and between the screener classification and the initial interview (combined with a
second, more timely SNAP list match and imputations), can have an increasing effect on the
variation of weights. This misclassification (sometimes referred to as stratum jumping) and its
impact on variances are explored further.
1.2 Description of FoodAPS-1 Sample Design
FoodAPS-1 employed a stratified three-stage cluster sample design. All areas in the contiguous
United States had a non-zero probability of selection. The stages of selection included:
1. 50 primary sampling units (PSUs), where the PSUs were single counties or groups of
counties;
2. 8 SSUs per PSU, where the SSUs were block groups; and
3. A sample of addresses within each SSU, with all households at selected addresses being included in the screening phase of the survey.
As shown in Table 1-1, the target sample sizes for Target Groups A through D were 800 (16% of
the total sample), 1,200 (24%), 1,500 (30%), and 1,500 (30%), respectively. An estimated population
distribution is provided. The estimated population proportions for A and D are extracted from
Table 3.6 in the internal draft Survey Design report (Cole, et al., 2016) written by Mathematica,
hereafter referred to as the “Mathematica Design Report.” Mathematica explains that
The SNAP measure used for post-stratification is RSNAPNow (the respondent report of SNAP on the Initial Interview adjusted by the results of the administrative match). Note: External control totals are weighted counts from the 2013 CPS, except for “SNAP Participation and Poverty

Review of the FoodAPS 2012 Sample Design 4
Overview 1
Level” and “Whether one or more people 60 years and over reside in household,” which are based on the 2012 ACS data adjusted to match the 2013 CPS total number of households.
The national percentages reported for Target Groups A, combined B/C, and D were 7.6 percent,
78.8 percent, and 13.6 percent, respectively. The estimated combined total for B and C was reported,
and we used proportional allocation using the estimated population proportions in Hall, Denbaly,
and Weidman (2012) to estimate the percentages in B and C. The large amount of oversampling
conducted for Target Groups A, B and D reflects the objectives of FoodAPS-1 and the high interest
in those subgroups, as well as the comparisons among them.
Table 1-1. Distribution of population and planned sample by target group
Target group
Estimated population distribution
(survey design report) (%)*
Planned
Sample size Percent (%)
A 7.6 800 16.0
B 12.7 1,200 24.0
C 66.0 1,500 30.0
D 13.6 1,500 30.0
Total 100 5,000 100.0
* The estimated population proportions for A and D are extracted from Mathematica’s draft Survey Design report. The estimated
combined total for B and C was reported, and we used proportional allocation using the estimated population proportions in Hall,
Denbaly and Weidman (2012) to estimate the percentages in B and C.
Selection of PSUs
The first stage of selection involved the formation of the PSUs and the assignment of a measure of
size (MOS) to be used in sampling the PSUs with probability proportional to size (PPS). The PSUs
were divided into strata (certainty and non-certainty), and non-certainty PSUs were selected by PPS
using implicit stratification.
There were 948 PSUs formed within the contiguous United States by using data from the Public Use
Microdata Sample (PUMS) from the 3-year American Community Survey (ACS) (2006–08). The
PUMS records were identified with Public Use Microdata Areas (PUMAs), which have at least
100,000 people. The FoodAPS-1 PSUs were mainly (1) single counties, (2) groups of counties in a
PUMA, or (3) groups of PUMAs sharing counties. In this manner, the PUMS estimates at the
PUMA level could be combined with the county-based SNAP file to help form the MOS when

Review of the FoodAPS 2012 Sample Design 5
Overview 1
selecting PSUs. We also note that some Metropolitan Statistical Areas (MSA)1 were split into
multiple PSUs.
The sources for the data used to derive the MOS were the 2006–08 3-year ACS PUMS and a list of
counties with estimated total population and SNAP participants compiled by the New York Times
(NYT). The NYT data were obtained from state SNAP agencies.2 The derivation of the estimated
number of households in each target group was complex. The Mathematica Design Report’s
Appendix B outlines the steps to create PSU-level estimates of 2009 household counts, as follows:
Used the PUMS files to create estimates of average number of persons per household
for the SNAP and non-SNAP groups;
Used these estimates of persons per household to create estimates of numbers of 2009 SNAP and non-SNAP households in the different target groups; and
Adjusted the PUMs 2008 estimated totals for households to match our estimate of 2009 households by SNAP and non-SNAP status.
Following Folsom et al. (1987), the MOS assigned to each PSU was a function of the estimated
number of households in each target group and the overall sampling rates of addresses within the
PSU for each target group. The goal of assigning the MOS in this manner was to arrive at the target
sampling rates by target group, and to arrive at equal selection probabilities within groups.
Due to a large MOS, there was one PSU identified as a certainty selection (probability of selection
equal to one). As described in Hall, Denbaly, and Weidman (2012), the other 49 PSUs were selected
with probability proportionate to MOS from the remaining 947 non-certainty PSUs (specifically,
Chromy’s method of sequential random sampling was used as available in SAS Proc SurveySelect).
Prior to selection, the PSUs were sorted by metropolitan status and region (as defined below). Using
a sort order introduces an implicit stratification, which is done to help reduce the variances of survey
estimates. The metropolitan status was (1) metro, (2) non-metro, or (3) mixed (included counties in
an MSA and counties not in an MSA). Among the sample of 50 PSUs, 34 were metro PSUs, 10 were
non-metro PSUs, and 6 were mixed PSUs. Region was defined by 7 USDA Food and Nutrition
Service (FNS) administrative regions, as shown in Table 1-2. The number of selected PSUs in each
FNS region varied from 4 to 11. An investigation of the stratification impact is explored in
Chapter 4.
1 See Federal Register, Vol. 75, No. 123, June 28, 2010, for more information.
2 Accessed at http://www.nytimes.com/interactive/2009/11/28/us/20091128-foodstamps.html.

Review of the FoodAPS 2012 Sample Design 6
Overview 1
Table 1-2. Definition of USDA Food and Nutrition Service (FNS) Administrative Regions
Region States/Territories included in FNS administrative regions
Mid-Atlantic Delaware, District of Columbia, Maryland, New Jersey, Pennsylvania, Puerto Rico, Virgin
Islands, Virginia, West Virginia
Midwest Illinois, Indiana, Michigan, Minnesota, Ohio, Wisconsin
Mountain Plains Colorado, Iowa, Kansas, Missouri, Montana, Nebraska, North Dakota, South Dakota, Utah,
Wyoming
Northeast Connecticut, Maine, Massachusetts, New Hampshire, New York, Rhode Island, Vermont
Southeast Alabama, Florida, Georgia, Kentucky, Mississippi, North Carolina, South Carolina,
Tennessee
Southwest Arkansas, Louisiana, New Mexico, Oklahoma, Texas
Western Alaska, American Samoa, Arizona, California, Guam, Hawaii, Idaho, Northern Mariana
Islands, Nevada, Oregon, Washington
Some of the PSUs that were selected were found to be geographically large. Therefore, in nine PSUs
that contained more than five counties, a subset of the counties was selected.
Selection of SSUs
The second stage of selection involved the formation and selection of SSUs. The SSUs consisted of
Census Block Groups (BGs), or multiple contiguous BGs if the BG was expected to contain fewer
than 50 survey-eligible households.
The MOS for selecting the SSUs was constructed in the same way as the composite MOS for PSUs.
However, it was derived using 5-year ACS data that were available for BGs. The 400 SSUs were
selected with probability proportionate to the MOS from a list of SSUs sorted by county (relevant
only in multi-county PSUs). Address-based sampling (ABS), a methodology in which addresses are
sampled from the U.S. Postal Service (USPS) Delivery Sequence File (DSF), was applied in most
SSUs; however, as described in Section 3.3.1 in Mathematica’s Design Report, “14 SSUs either
contained no ABS addresses or a large number of ABS addresses that are not useful for locating
households (P.O. Boxes, Rural Delivery).” These 14 SSUs were identified as needing traditional
listing procedures. For the 14 SSUs, an average of four Census Blocks were selected for field-listing
using probability proportionate to size.

Review of the FoodAPS 2012 Sample Design 7
Overview 1
Selection of Addresses
The third stage of selection involved the creation of a sampling frame of addresses, stratification,
and selection of addresses that serve as the screening sample for the ultimate selection of the
households in the four target groups. The sampling frame of addresses within selected SSUs was
created from different sources, including lists of addresses from the USPS DSF (referred to as
“ABS” for address-based sampling), traditional listing of addresses (field listed), and a list of
addresses for households receiving SNAP benefits in February 2012 from state agencies (SNAP
lists). SNAP lists for sampled PSUs were received from 22 of the 27 states that had sampled PSUs in
time for sampling purposes. There were three combinations of address sources that constituted the
sampling frames within SSUs:
ABS and SNAP listings (315 SSUs);
ABS only (71 SSUs), and
Field listed only (14 SSUs).
In SSUs where SNAP listings existed, SNAP addresses were matched to the ABS list to stratify the
addresses into those on the SNAP list and those not on the SNAP list. Probabilistic matching
methods were utilized to compare the SNAP list to the ABS frame. Comparing addresses is a
difficult task, and it is likely that some addresses on the SNAP frame were duplicated on the final
ABS frame, or that mismatches occurred (more discussion in Section 3.3.2 in Mathematica’s Design
Report).
In SSUs where SNAP listings did not exist, no stratification occurred. With the required
oversampling of SNAP households, selection of SNAP addresses from the SNAP list can greatly
reduce the number of addresses to screen. In SSUs where SNAP lists existed, the goal was equal
overall probabilities for addresses in the SNAP list stratum across SSUs and PSUs, and equal overall
probabilities for addresses in the non-SNAP stratum across SSUs. In SSUs with ABS or field listed
only, the sampling rates within SSUs were set with the goal of equal overall probabilities of selection
across such SSUs.
In some instances, multiple units existed within a selected address. Section 3.3.5 of the Mathematica
Design Report discusses the approach for dealing with multi-unit addresses as follows: “Where a
sampled address included only one housing unit, that unit was included in the sample; if it contained
more than one unit, one or more units (up to six) were sampled at the address.” This approach

Review of the FoodAPS 2012 Sample Design 8
Overview 1
effectively retains the goal of equal selection probabilities within target groups for addresses with up
to six units.
In other instances, some addresses were drop points in the ABS frame rather than individual units.
The post office delivers mail at a drop point for two or more units to a common location.
Mathematica’s Design Report discusses the approach to handle drop points in Section 3.3.3 as
follows:
Because the sampling frame included drop points, we assigned a measure of size to each address in the frame. The MOS is equal to the number of housing units at the address. MOS is equal to one for single-family residences and for units in multi-unit buildings with individual unit numbers; MOS is greater than one for multi-unit buildings identified as drop points. Drop points were handled in one of two ways in the sampling frame: a. Buildings with two or three units and no unit numbers (NUN) – we
constructed “dummy units” as instructions for field staff of the form: “NUN TAKE 1st UNIT,” “NUN TAKE 2nd UNIT,” “NUN TAKE 3rd UNIT.” Specific instructions for identifying the 1st, 2nd, and 3rd units were provided in the Training Manual and at training. 201 “dummy units” were released to the field.
Buildings with more than three units – we sampled with MOS equal to the number of units. Thirty-one such multi-unit buildings were sampled and field listed to obtain unit numbers (with an average size of 35 units). Twenty-two of these 31 buildings were selected with certainty, and 8 of these 31 buildings were found during listing to be ineligible (group homes or non-existent addresses).
A reserve sample of addresses was selected at the same time as the main sample. The reserve sample
consisted of 70 release groups (called replicates). After 4 months, due to an expected shortfall in
Target Groups A and B, a supplemental reserve sample comprising 41 release groups was selected
for the non-SNAP component. In the end, among the main sample and reserve samples, 42,143
addresses were selected, and 20,084 were released to the field. Section 3.3.6 of the Mathematica
Design Report adds:
Replicates 71-111 were constructed to have the same properties as the original ABS sample. For the SNAP frame, the probability of selection was based on the selections in replicates 1 through 70 only. For the ABS frame, the probability of selection was based on the selections in replicates 1

Review of the FoodAPS 2012 Sample Design 9
Overview 1
through 111. For the latter, we treated all selections as concurrent for purposes of the weights.3
Due to uncertainty in the assumptions (e.g., vacancy rates, percentages across the target groups,
response rates), the release groups were managed closely throughout the data collection period.
Each release group had associated open/closed flags that were assigned by combinations of Target
Groups and SSUs and the observed shortfalls. More details are provided in Section 3.4 of the
Mathematica Design Report.
A screener questionnaire was administered to selected households. Screener items related to income,
household size, and receipt of SNAP were asked so that households could be categorized in the four
target groups. If determined to be in an “open” target group, as assigned among the release groups,
the household was eligible to participate in the study. If the household was in a closed group, the
household was screened out.
Lastly, in mid-October 2012, a sample of the 985 addresses, across all PSUs, that had been initially
closed out as nonrespondents were given a second chance for extra attempts. About 14 percent (138
cases) were randomly selected, 89 percent non-SNAP and 11 percent SNAP, and re-released to the
field for up to 10 additional contact attempts. The effort resulted in 12 completed final interviews
that were added to the 4,814 completed households. In total, 4,826 households completed the
FoodAPS-1 survey.
3 Calculating overall selection probabilities when going back in for a second round of sampling is not straightforward when selections are made with PPS. The probability of a non-certainty address being selected within an SSU (or TSU) in the second round (P2) is dependent on not being selected in the first round (1 - P1), and that depends on the measures of size of those addresses actually selected in the first round. Thus, we made the assumption for weighting that the value of P1 was fixed, as most addresses had a measure of size of 1. This assumption simplifies the overall
probability of selection, P = P1 + (1-P1) P2, to ( ) ∑ ⁄ , where and are the number of non-certainty addresses selected within SSU/TSU in the first and second rounds, respectively.

Review of the FoodAPS 2012 Sample Design 10
Overview 1
1.3 Results from the Sample Design
The above paragraphs provide the most important features of the sample design. There were several
complicating factors in the assignment of selection probabilities to account for special circum-
stances, which include the:
Subsampling of counties in some PSUs;
Subsampling of blocks within some SSUs;
Selecting the dwelling units within large drop points;
Subsampling of nonrespondents for extra screener attempts; and
Assignment of open/closed designations, and release groups.
Further details about the special situations related to the sample design can be found in the
unpublished Mathematica Design Report. The latter two factors were attempts to address shortfalls
in the sample. The first four factors above can be easily handled; however, it is likely that the fifth
factor has the most potential of affecting the precision of the estimates. Table 1-3 provides the
resulting actual sample sizes. The deviations in actual sample sizes from the planned sample sizes
shown in Table 1-3, such as 346 for Target Group A when targeting 800 households, is a result of
the challenges of conducting surveys for the subgroups of interest in FoodAPS even after extra
efforts were attempted.
Table 1-3. Planned and actual household sample sizes by target group
Target group
Planned Actual
Sample
size
Percent
(%)
Sample
size
Percent
(%)
A: Non-SNAP households with income less than the poverty
guideline
800 16.0 346 7.2
B: Non-SNAP households with income greater than or equal
to 100 percent and less than 185 percent of the poverty
guideline
1,200 24.0 851 17.6
C: Non-SNAP households with income greater than or equal
to 185 percent of the poverty guideline
1,500 30.0 2,048 42.4
D: SNAP households 1,500 30.0 1,581 32.8
Total 5,000 100.0 4,826 100.0

Review of the FoodAPS 2012 Sample Design 11
Overview 1
The FoodAPS-1 sample design results discussed in this report can help to provide information
leading to a more efficient sample design in the next main survey. Key aspects to improving the
design are:
Limiting the impact of sampling decisions, such as the administration of release groups,
on the variation in the sampling rates and the sampling weights;
Understanding the amount of misclassification (e.g., screening classification versus final classification) and its impact on the precision of estimates;
Evaluating the impact of clustering the dwelling unit sample within selected areas on precision of estimates;
Determining the numbers of PSUs and SSUs to select, and assessing the impact of increasing number of degrees of freedom on analyses; and
Investigating the impact of stratification.
Attempts to gauge the quality of the undercoverage of the lists were described in Section 3.6 of the
Mathematica Design Report, as follows:
The accuracy of the frame was assessed during the study by the half-open interval frame-linking procedure (Kish, 1965). By checking for units between a sampled address and the next address on the frame, addresses not on the frame are given a chance of being selected for the sample. The procedure thus increases coverage within areas that have some addresses on the sampling frame. Every sample address was assigned “adjacent address information” to be verified by field staff. Adjacent addresses were identified from the full sample frame prior to sampling. We sorted the frame by USPS delivery point barcode (DPBC) and selected the next address as the adjacent address. If the “next” address was not in the same block (9-digit ZIP code), the adjacent address was identified as the prior address. If there were no addresses on the same block, the adjacent address was identified as “None.” 4 We identified “adjacent address information” for every sample address: 93.7 percent of sample addresses were assigned adjacent address information containing an address or number of units requiring verification; 6.3 percent of sample addresses were assigned “None”, indicating that field staff needed to verify the lack of another residential address on the same block.
4 The DPBC enables automated mail sorting that corresponds to the walk sequence of letter carriers. The last 4 digits of the 9-digit ZIP code identify a segment or one side of a street: http://faq.usps.com/eCustomer/iq/usps/request.do?create=kb%3AUSPSFAQ&view()=c%5bc_usps0901%5d.
Review of the FoodAPS 2012 Sample Design 12
Overview 1
More details are given in the Mathematica Design Report. The results of the investigation were
provided as follows:
Overall, the findings of the adjacent address check did not identify a substantial number of units absent from the sampling frame (most errors in the frame identified units that didn’t exist) so [an] additional sample was not selected from the adjacent address verification results.
An important part of the sample design when ABS lists are used is to conduct quality control on the
lists received from the various sources, as was done here with the half-open interval method. In
general, an address list enhancement should be done to reduce the coverage bias. Other aspects,
such as investigating the choice of PSUs and SSUs, the measures of size used for selecting PSUs and
SSUs to focus the sample on the subgroups of interest, or planning the sample for WIC as a key
sampling domain, will be addressed in the sampling plan for the next main study.
1.4 Precision of Four Key Survey Estimates from the FoodAPS-1
Survey
The FoodAPS-1 complex sample design was investigated as to the impact on the precision of the
sample estimates. Estimates and sampling error measures, including standard errors (SEs),
coefficients of variation (CV), design effects, and effective sample sizes, were computed for average
expenditures on FAH events, on FAFH events, the average number of free events per household,
and the proportion food insecure, overall, by target group (Table 1-4), by WIC household
classification (Table 1-5), by metro/nonmetro status (Table 1-6) and by rural/non-rural status (Table
1-7). The sampling error measures were computed using the stratified jackknife replicate weights and
are described in Appendix A.
Among Tables 1-4 through 1-7, the SEs for the marginals (full sample) were smaller, sometimes
much smaller, than the SEs for subgroups. This is mostly due to the larger effective sample size in
the full sample.
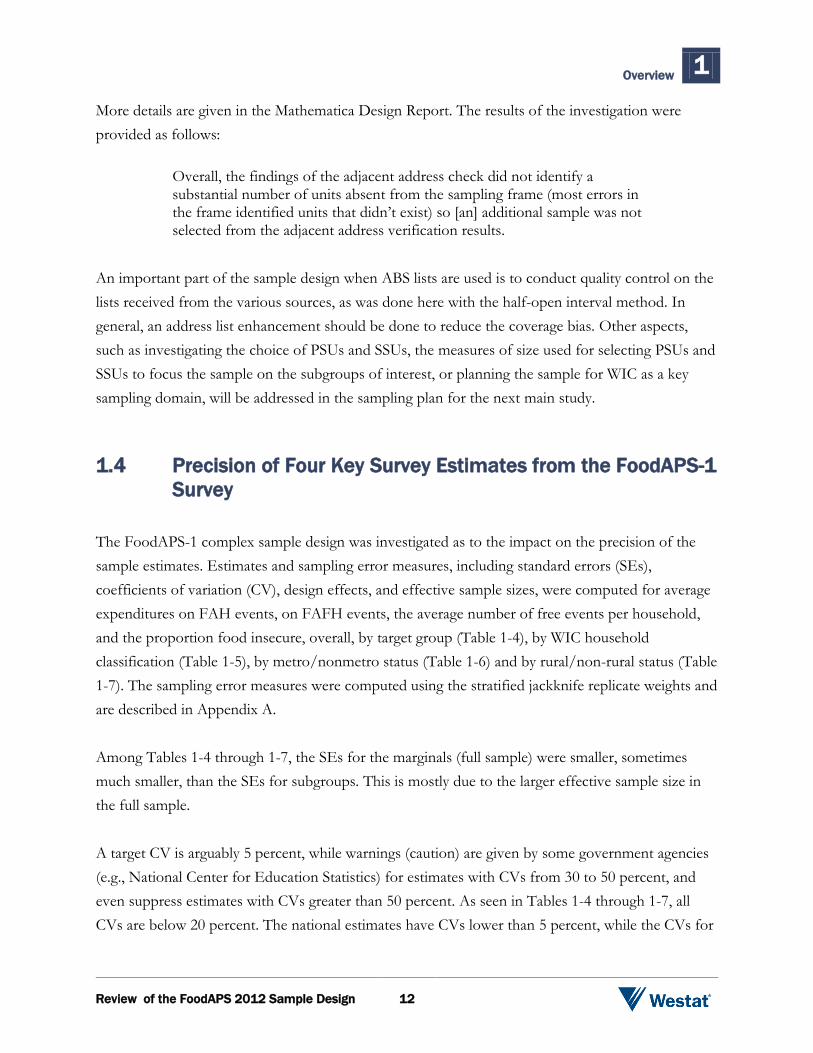
A target CV is arguably 5 percent, while warnings (caution) are given by some government agencies
(e.g., National Center for Education Statistics) for estimates with CVs from 30 to 50 percent, and
even suppress estimates with CVs greater than 50 percent. As seen in Tables 1-4 through 1-7, all
CVs are below 20 percent. The national estimates have CVs lower than 5 percent, while the CVs for

Review of the FoodAPS 2012 Sample Design 13
Overview 1
subgroups are higher (up to 18.2 percent). The indicators of precision suggest that some
improvements in the sample design may be helpful. This report will help to explore reasons for the
higher CVs and SEs, and considerations for ways to reduce them.
Table 1-4. Estimates and sampling error measures by outcome of interest and target groups
Outcome of interest Estimate1 SE DEFF CV
Sample
size
Effective
sample
size
Total FAH per week
Group A $67.51 5.61 2.262 8.3 330 146
Group B $72.55 3.25 1.723 4.5 829 481
Group C $116.67 3.89 2.447 3.3 2,011 822
Group D $94.14 4.03 2.208 4.3 1,529 692
Marginal $105.72 2.83 3.342 2.7 4,699 1,406
Total FAFH per week
Group A $30.43 5.09 3.335 16.7 328 98
Group B $34.37 2.96 2.766 8.6 825 298
Group C $67.55 2.00 1.350 3.0 1,975 1,463
Group D $30.99 2.03 1.980 6.6 1,532 774
marginal $56.52 1.45 1.896 2.6 4,660 2,458
Total Free Events
Group A 2.47 0.35 2.283 14.0 339 149
Group B 2.61 0.22 1.949 8.3 839 431
Group C 2.95 0.17 3.03 5.7 2,034 671
Group D 3.96 0.17 1.402 4.4 1,527 1,089
marginal 3.02 0.13 3.85 4.3 4,739 1,231
Food Insecurity
Group A 0.42 0.04 1.834 8.5 346 189
Group B 0.24 0.02 1.291 6.9 851 659
Group C 0.07 0.01 1.577 10.3 2,048 1,299
Group D 0.45 0.02 2.558 4.4 1,581 618
marginal 0.16 0.01 1.269 3.7 4,826 3,803
1 The estimates are means, except for food insecurity (proportions).
Review of the FoodAPS 2012 Sample Design 14
Overview 1
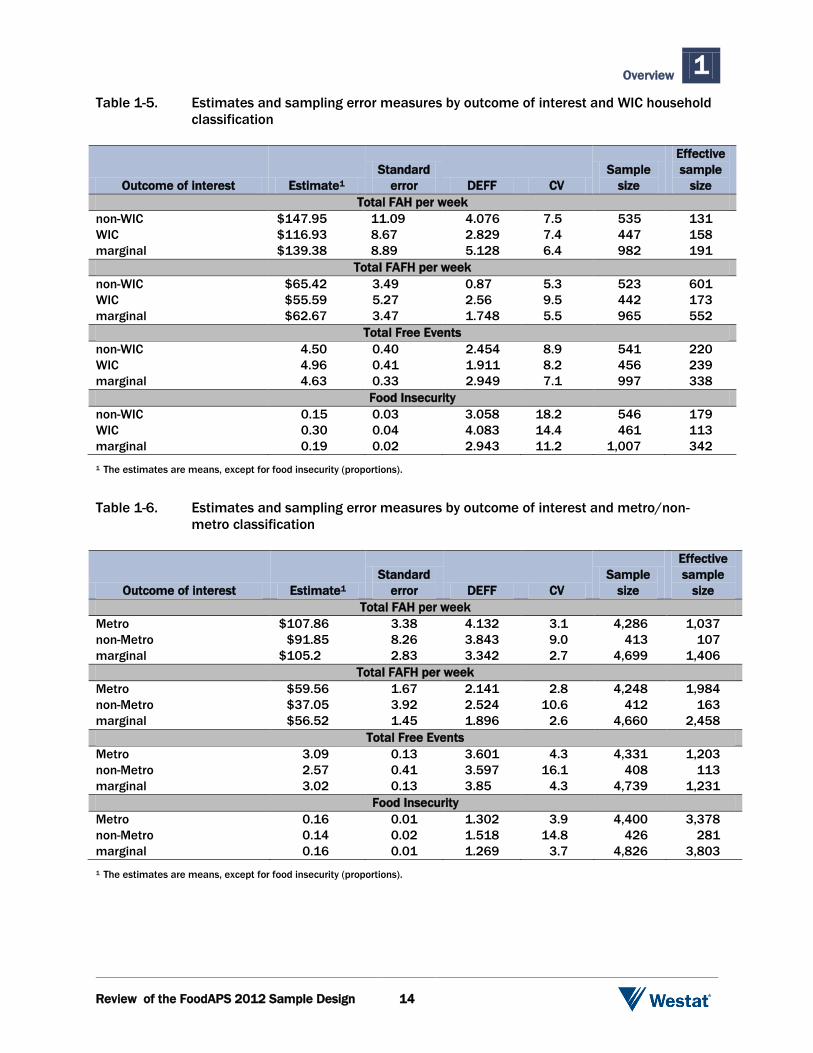
Table 1-5. Estimates and sampling error measures by outcome of interest and WIC household
classification
Outcome of interest Estimate1
Standard
error DEFF CV
Sample
size
Effective
sample
size
Total FAH per week
non-WIC $147.95 11.09 4.076 7.5 535 131
WIC $116.93 8.67 2.829 7.4 447 158
marginal $139.38 8.89 5.128 6.4 982 191
Total FAFH per week
non-WIC $65.42 3.49 0.87 5.3 523 601
WIC $55.59 5.27 2.56 9.5 442 173
marginal $62.67 3.47 1.748 5.5 965 552
Total Free Events
non-WIC 4.50 0.40 2.454 8.9 541 220
WIC 4.96 0.41 1.911 8.2 456 239
marginal 4.63 0.33 2.949 7.1 997 338
Food Insecurity
non-WIC 0.15 0.03 3.058 18.2 546 179
WIC 0.30 0.04 4.083 14.4 461 113
marginal 0.19 0.02 2.943 11.2 1,007 342
1 The estimates are means, except for food insecurity (proportions).
Table 1-6. Estimates and sampling error measures by outcome of interest and metro/non-
metro classification
Outcome of interest Estimate1
Standard
error DEFF CV
Sample
size
Effective
sample
size
Total FAH per week
Metro $107.86 3.38 4.132 3.1 4,286 1,037
non-Metro $91.85 8.26 3.843 9.0 413 107
marginal $105.2 2.83 3.342 2.7 4,699 1,406
Total FAFH per week
Metro $59.56 1.67 2.141 2.8 4,248 1,984
non-Metro $37.05 3.92 2.524 10.6 412 163
marginal $56.52 1.45 1.896 2.6 4,660 2,458
Total Free Events
Metro 3.09 0.13 3.601 4.3 4,331 1,203
non-Metro 2.57 0.41 3.597 16.1 408 113
marginal 3.02 0.13 3.85 4.3 4,739 1,231
Food Insecurity
Metro 0.16 0.01 1.302 3.9 4,400 3,378
non-Metro 0.14 0.02 1.518 14.8 426 281
marginal 0.16 0.01 1.269 3.7 4,826 3,803
1 The estimates are means, except for food insecurity (proportions).

Review of the FoodAPS 2012 Sample Design 15
Overview 1
Table 1-7. Estimates and sampling error measures by outcome of interest and rural/non-rural
classification
Outcome of interest Estimate1
Standard
error DEFF CV
Sample
size
Effective
sample
size
Total FAH per week
non-Rural $104.29 3.09 2.805 3.0 3,420 1,219
Rural $108.53 5.48 3.619 5.1 1,279 353
marginal $105.72 2.83 3.342 2.7 4,699 1,406
Total FAFH per week
non-Rural $59.68 1.93 2.172 3.2 3,395 1,563
Rural $50.328 2.69 2.414 5.3 1,265 524
marginal $56.52 1.45 1.896 2.6 4,660 2,458
Total Free Events
non-Rural 3.04 0.15 3.527 4.9 3,452 979
Rural 2.98 0.25 4.333 8.4 1,287 297
marginal 3.02 0.13 3.85 4.3 4,739 1,231
Food Insecurity
non-Rural 0.18 0.01 1.625 4.6 3,515 2,163
Rural 0.13 0.01 2.155 10.7 1,311 608
marginal 0.16 0.01 1.269 3.7 4,826 3,803
1 The estimates are means, except for food insecurity (proportions).
Among target groups, Target Group A has the highest CVs ranging from 8.3 to 16.7 percent across
the outcome variables. While there is interest within target groups by WIC, non-metro, and rural
classifications, the sample sizes and degrees of freedom become small, and, therefore, the
classifications are studied without regard to target group. Because of the large sample sizes, the
results for metro and non-rural classifications align closely with the full sample results, and,
therefore, we discuss only non-metro and rural results.
Among WIC households, as shown in Table 1-5, food insecurity has the highest CV (14.4%) and
FAH has the lowest (7.4%). The sample sizes for the WIC classification of WIC/nonWIC are
smaller than for other groups, because the questionnaire items from which the estimates were
derived were only asked of households with someone in HH AGE = 14 - 49 and SEX = 2 and
ANYPREGNANT = 1, or if someone in the household was under age 5. Among non-metro areas,
as shown in Table 1-6, the estimate for free items has the highest CV (16.1%) and FAH has the
lowest (9.0%). Among rural areas, as shown in Table 1-7, food insecurity has the highest CV (10.7%)
and FAH has the lowest (5.1%).

Review of the FoodAPS 2012 Sample Design 16
Overview 1
The impact of the sample design on the above measures of precision can be studied by computing
the design effect ( ). The is a useful quantity to examine when comparing alternative
designs. The is computed as:
Since the FoodAPS design consists of a multistage cluster sample, the is typically larger than
under . One interpretation of says that if , the sample size needs to be
doubled in order to achieve the same precision as from an . Another interpretation is that if the
resulting sample size from the complex sample is 5,000 respondents, then with a , the
effective sample size is 2,500.
Overall, the s range from 1.3 for food insecurity to 3.8 for free items. DEFFs very much
depends on the requirements for the sample design. As given in the OMB Part B document, based
on assumptions on design effects from clustering and differential sampling rates, a broad range of
DEFFs was expected for overall estimates (2.99 to 8.93) for national estimates. Our impression is
that DEFF estimates are a bit noisy, but look reasonable, especially when compared to expectations.
The effective sample size ranges from 1,231 for free items to 3,803 for food insecurity. Differences
between resulting values of can be the result of the following:
1. Sample size;
2. Differential sampling rates, and variation in the sample weights (investigated in Section 2);
3. Clustering (Section 3); and
4. Stratification (Section 4).
There is no pattern in the across target groups, with the exception that the for
Target Group A are slightly higher than the other groups, ranging from 1.8 for food insecurity and
3.3 for FAFH. Target Group A has the lowest effective sample sizes, with the lowest being 98 for
FAH, while Target Group C has the highest effective sample sizes, with the highest being 1,463 for
FAFH.
Among WIC households, as shown in Table 1-5, the range from 1.9 for free items to 4.1 for
food insecurity. The effective sample size ranges from 113 for food insecurity to 239 for free items.
Among non-metro areas, as shown in Table 1-6, the range from 1.5 for food insecurity to
Review of the FoodAPS 2012 Sample Design 17
Overview 1
3.8 for FAH. The effective sample size ranges from 107 for FAH to 281 for food insecurity. Among
rural areas, as shown in Table 1-7, the range from 2.1 for food insecurity to 4.3 for free
items. The effective sample size ranges from 297 for free items to 608 for food insecurity.
In terms of the effective sample sizes, at the national level, they exceeded the upper bound on the
range of expected effective sample size for two of the four outcome measures. For Target Group C,
while the actual sample size surpassed the targeted sample size, the upper bound of the effective
sample size was exceeded by two of the outcome measures. However, for one outcome measure, the
effective sample size was closer to the lower bound. For SNAP (Target Group D), while the actual
sample size was about the same as planned, the effective sample size was closer to the lower bound
for two (and marginally for three) of the outcome measures. It is for the smaller subgroups, such as
the Target Groups A and B, where effective sample sizes were smaller than desired.
Typically DEFFs for subgroups should be less than DEFFs for national estimates. This is because
less clustering and less variation in sampling weights are expected for subgroups5. However, in
FoodAPS, the DEFFs for subgroups are roughly at about the same level as for the national
estimates. The indicators of precision (SEs, DEFF, CV, effective sample sizes) are at reasonable
levels for national estimates, but there are indications that there may be ways to improve the sample
design for subgroups.
We investigated the impact of the FoodAPS-1 sample design on key comparisons of interest..
Having clusters that include participating households from both groups being compared reduces the
associated variance of the estimated difference due to the covariance of the two estimates
introduced by the cluster sampling. That is, for example, because each PSU and many SSUs likely
had participants from both Target Groups A and D, the clusters act as a controlling factor, and the
variance of the difference is lower than if the two groups came from two independent samples.6 We
define a to be the ratio of the estimated variance under the FoodAPS-1 complex design,
taking into account the covariance between A and D, to the variance estimate of the difference
under the assumption of SRS and the samples for A and D are independent. The results in Table 1-8
show that the range from 1.68 for total free events to 2.82 for FAFH expenditures.
5 This expectation is illustrated in the FoodAPS-1 OMB Part B document.
6 However, a design that aims to arrive at precise estimates for only A or D would require less of a sample than if the design were to aim for precise estimates for comparisons between A and D.

Review of the FoodAPS 2012 Sample Design 18
Overview 1
Table 1-8. Estimated difference between Target Groups D and A, standard error, and design
effect by outcome
Difference: Target groups A and D Estimate SE DEFF
Total Food At Home 26.64 6.756 2.15
Total Food Away from Home 0.56 5.27 2.82
Total Free Events 1.48 0.353 1.68
Food Security 0.03 0.041 1.95
Similarly, aligning with the FoodAPS-1 study objectives, comparisons also were made between
Target Groups A, B, D with C in Table 1-9 and Target Groups A, B, C with D in Table 1-10. The
were greater than 1 in all cases as expected. The magnitude of the for the
comparisons are in general slightly lower than the computed in Tables 1-4 through 1-7 for
groups by themselves (without the comparisons) due to the covariances.
Table 1-9. Estimated difference between Target Group C versus Target Groups A, B, and D,
standard error and design effect by outcome
Difference: Target groups C-ABD Estimate SE DEFF
Total Food At Home 35.58 4.269 2.01
Total Food Away from Home 35.26 2.38 1.41
Total Free Events -0.21 0.222 2.62
Food Security -0.29 0.017 2.60
Table 1-10. Estimated difference between Target Group D versus A, B, and C, standard error and
design effect by outcome
Difference: Target groups D-ABC Estimate SE DEFF
Total Food At Home -13.36 4.855 2.16
Total Food Away from Home -29.58 2.018 1.07
Total Free Events 1.08 0.194 1.38
Food Security 0.34 0.022 2.65
The contractor provided broad ranges in the Office of Management and Budget (OMB) Part B
document of the expected precision. In general, the resulting measures of precision look reasonable
at the national level (i.e., for the total sample). For example, as discussed in the OMB Part B
document, for the amount spent on food at home (FAH), the projected 95 percent confidence
intervals (half-widths) for total weekly food expenditures were expected to range at the national level
from $5.11 to $8.83. For comparison with the actual results, multiply the SEs in Table 1-4 by 2 to
compare to the expected half-width confidence interval values. For FAH, the half-width is about
$5.66 (2 multiplied by 2.83).

Review of the FoodAPS 2012 Sample Design 19
Overview 1
For the purpose of comparing two groups, minimum detectable differences (MDDs) were estimated
with 80 percent power and 95 percent confidence during the design phase, which took into account
assumptions about the impact of the complex design. In general, the resulting measures of precision
for the comparisons look reasonable. For example, when comparing FAH expenditures between the
largest groups (Target Group C with Target Groups A, B, D), the resulting detectable difference is
approximately $8.54 (given in Table 1-9 by multiplying the SE by 2), which is actually lower than the
lower bound on the expected MDDs, which ranged from $10.49 to $15.64 depending on the design
effect assumptions. For the smaller subgroups, such as the Target Groups A and B where effective
sample sizes were smaller than desired for FAH and FAFH expenditures, when making comparisons
with Target Group D, the large sample size in Target Group D helped the resulting actual MDDs to
fall into the broad range of expected MDDs.
The results from Tables 1-4 through 1-10 led to an investigation into the causes of the magnitudes
of the and the resulting decreases in the effective sample sizes for subgroups, which may
prove beneficial in developing a sample design that results in higher effective sample sizes for key
domains of interest and key comparisons of interest.
The total variance of an estimate can be decomposed into components of variance (such as the
impact due to differential sampling rates [or weights], clustering, and stratification) so that reasons
for larger unexpected variation can be determined. In general, the overall is sometimes
expressed as the product of two components: , which is due to differential sampling rates
(or unequal weighting), and , which is due to clustering. That is,
. This multiplicative model, given by Kish (1995), is a common model for the handling of
ways to extract the differential weighting impact from the clustering impact. This report investigates
the components of variance toward recommendations for improving the sample design for the next
main survey of FoodAPS. In the following sections, the impact of the sample design on the total
variance is examined through parsing out the main contributing factors: differential weights
(Chapter 2), clustering (Chapter 3), and stratification (Chapter 4). We conclude with further
discussion and recommendations in Chapter 5.

Review of the FoodAPS 2012 Sample Design 20
When planning a sample, the due to differential sampling rates, as given in Kish (1965), can
be expressed as (∑
)(∑ ), where, = , = total population size,
= population size for stratum , and = sampling rate within stratum . Using this expression
and the sample and population proportions given in Table 1-1 (from which sampling rates are
inferred), the planned due to differential sampling rates was 1.62 for FoodAPS-1.
However, the weight adjustments are another source of variation beyond the differential sampling
rates, and therefore the expression for is most usefully expressed as , as given in
Kish (1992), where the of the weights is the standard deviation of the weights relative to the
average weight.
To systematically show the impacts of the sample design, sampling-related decisions to address
shortfalls in the sample yield, and weight adjustments, the were computed by Westat for
the base weights and most steps in the weight process to investigate their impact. Table 2-1 provides
estimates of the at each stage of weights for the sample groups of interest (i.e., the
study’s four target groups, WIC households, and households classified by metro and rural location).
Additionally, to examine the effect of misclassification into target group at the screener level,
were also computed for the target group that was assigned during the screener. Results
shown in Table 2-1 will be discussed in detail throughout this chapter.
Design Effect Due to Unequal Weights 2

De
sig
n E
ffect D
ue
to U
ne
qu
al W
eig
hts
2
Re
vie
w o
f the
Fo
od
AP
S 2
01
2 S
am
ple
De
sig
n
21
Table 2-1. Design effect at each stage of weighting for various analysis domains
Analysis domain
Screener base
weight
Screener
nonresponse
adjusted weight
Screener
deselection
weight
Extended
nonresponse
adjusted weight
Final raked
weight
Overall 1.59 1.60 2.12 2.60 2.67
Final Target Group (after extended survey)
Group A 1.53 1.48 1.61 1.81 2.30
Group B 1.41 1.40 1.65 2.11 2.39
Group C 1.47 1.46 1.74 2.07 2.01
Group D 1.77 1.85 2.45 2.78 2.47
Interim Target Group (as defined by screener)
Group A 1.57 1.56 1.56 1.75 2.34
Group B 1.43 1.43 1.43 1.91 2.02
Group C 1.46 1.43 1.37 1.57 1.50
Group D 1.82 1.92 2.55 2.73 2.57
WICHH
non-WIC 1.49 1.59 2.16 2.37 2.40
WIC 1.53 1.60 2.02 2.73 2.37
Metro/nonmetro
Metro 1.51 1.53 2.03 2.47 2.58
non-Metro 1.60 1.66 2.25 2.68 2.70
Rural
non-Rural 1.46 1.49 1.89 2.34 2.50
Rural 1.70 1.72 2.37 2.34 2.78

Design Effect Due to Unequal Weights 2
Review of the FoodAPS 2012 Sample Design 22
Base Weights
The base weights are computed as the inverse of the overall probability of selection of addresses
released to the field. The impacts due to deselection and misclassification are not reflected at this
first step in the weighting.
Beyond the oversampling of addresses on SNAP lists, the base weights may vary due to the various
sampling activities summarized in Section 1.3 that led to the addresses selected for the screener
questionnaire. It is not clear why excess weight variation would result, because ways exist to limit the
amount of weight variation when handling drop points, and when reducing costs by subsampling
counties within some PSUs and subsampling blocks within some SSUs. In addition, sampling-related
decisions to address shortfalls in sample yield during the data collection period may cause a potential
increase to the variation in the base weights (even when misclassification and deselection is not yet
contributing to the at this step). These attempts include the SSU- and target group-specific
releases of replicate samples, and the nonresponse followup adjustment associated with the two-
phase sampling.
As is shown in Table 2-1, the for the base weights overall is 1.59. This is not yet
comparable to the originally planned design effect of 1.62 because the base weight does not account
for the deselection for target group sampling rates after the screener responses are known. For the
four outcomes of interest presented in the table (food insecurity, total amount spent on food
consumed at home events, total spent on food away from home events, and total number of free
events), the ranged from 1.41 to 1.77. The biggest differences in occur across
target group with Target Groups B and C having the smallest and Target Group D having
the largest. Generally, and not surprisingly, the for the screener target groups are similar to
the for the main study target groups because the deselection rate is not yet accounted for in
the base weights step.
The sampling plan for the next main survey can use the information above to ensure that weight
variation is reduced or eliminated in certain sample design features discussed in Sections 1.1 and 1.2,
such as protocols related to release groups and other subsampling occurrences.

Design Effect Due to Unequal Weights 2
Review of the FoodAPS 2012 Sample Design 23
Screener Nonresponse Adjustment
The screener nonresponse adjusted weights in Table 2-1 account for the weight adjustments for
unknown address occupancy status and for nonresponse to the screener. Within cells, the screener
base weights of sampled addresses where occupancy status was unknown were adjusted by a factor
equal to the inverse of the weighted proportion of cases for which occupation status was
determined. Then the weights of screener respondents were adjusted by a factor equal to the inverse
of the weighted proportion of occupied households that completed the screener. The weighting cells
for the occupancy and screener nonresponse adjustments were defined by Mathematica based on
the results of a classification tree analysis. The analysis evaluated the relationship of a set of auxiliary
variables to occupancy status and screener response status, respectively. The auxiliary variables
included sampling frame information (whether the address came from the SNAP list, ABS list, or
field listing and whether the PSU was in a metropolitan area) and area-level variables related to
vacancy rates, SNAP participation, poverty status, race/ethnicity, and other demographics.
An increase to the can be expected after nonresponse adjustments because of the trade-
off between the reduction in bias due to nonresponse with an increase to variance in the weights.
The more the adjustment factor varies among weighting cells, the higher the likelihood that bias is
reduced, provided that the weighting cells are related to the outcome of interest. That being said, the
screener nonresponse adjustment had very little impact on the overall . The for
the subgroups of the outcomes of interest also increased slightly for all outcomes except for target
group. Among groups the decreased after the nonresponse adjustment for Target
Groups B and C and increased for Target Groups A and D. This is true for both the screener and
main study target group.
Post-Screener Deselection
Initial weights for households selected for the initial interview accounted for cases that were
deselected after the screener by using the open/closed sampling flags, which were assigned by target
groups and by SSUs to control the sample yield after screener responses were provided. The result
of the adjustment is the “main study base weight,” which is the product of the screener nonresponse
adjusted weight and the inverse of the inclusion probability for the initial interview. As discussed in
Appendix D of the FoodAPS-1 User Manual, as part of this step, weights were adjusted to include

Design Effect Due to Unequal Weights 2
Review of the FoodAPS 2012 Sample Design 24
80 cases that should have been dropped as a result of the quota group subsampling, but they were
nonetheless included among the completed cases.7
Screener deselection had a significant impact on the . After screener deselection, the
overall increased from 1.60 to 2.12, an increase of 32 percent. This large increase was
true for every grouping in the table. The value of 2.12 is most comparable to the planned due
to differential sampling rates. As mentioned above, using the planned sample sizes, and the
population proportions from the Mathematica Design Report, as shown in Table 2-1, the
(due to differential sampling rates) = 1.62, which implies a 62 percent increase to variances on
national estimates. The OMB Part B document assumes = 1.5 overall, and lower for
subgroups, such as 1.07 among SNAP households, and among non-SNAP lower than the 185
percent poverty guideline.
The largest increases were in the rural and non-metro subgroups, increasing by 38 and 35 percent,
respectively. The smallest increase was in main study Target Group A, with only a 9 percent
increase. It is interesting that when looking at the interim (or screener) target group classification,
there was very little change in as seen in the “after the screener deselection” column for
any subgroup except for Target Group D. That is, disregarding Target Group D, if the initial target
group was the true target group, which assumes that there were not any misclassification errors
between the screener and final target group assignments, the deselection would have had a very
minimal impact on the . For Target Group D for the initial target group, the
increased by 33 percent due to misclassification between the SNAP list designation and the screener
designation.
Main Study Nonresponse Adjustment
The weight adjustment for nonresponse to the main study (initial interview, diary, final interview)
was conducted within 36 weighting cells provided by Mathematica. Mathematica defined the cells
based on a classification tree analysis of the relationship between the main study response status and
several auxiliary variables. The auxiliary variables included interviewer observations on age, gender,
7 These 80 residential units were eligible for the survey in all respects except the quota group subsampling, which was designed to more efficiently use survey resources by not interviewing all the households in easier-to-locate quota groups. Once the 80 units were erroneously included, there was no reason not to keep them in the sample with sample weights appropriately adjusted.

Design Effect Due to Unequal Weights 2
Review of the FoodAPS 2012 Sample Design 25
and race, screener information on SNAP participation and language, sampling frame information on
whether the PSU was in a metropolitan area, and area-level variables related to vacancy rates, SNAP
participation, poverty status, race/ethnicity, and other demographics. The main study base weights
of the final survey respondent households were adjusted by a factor equal to inverse of the weighted
proportion of households that completed the survey, among households selected for the main study.
Adjusting for nonresponse for the main study had a large increase on the , though not
quite as large of an impact as the screener deselection adjustment. The nonresponse adjustment
increased the from 2.12 to 2.60, a 23 percent increase. The increased in every
subgroup of the outcomes of interest except for rural households, which had a very minor decrease
in . The largest increase in was in the WIC households and also Target Group
B for the main study, with increases of 35 and 33 percent, respectively.
The large increase in was likely due to the large nonresponse adjustment factors in some
of the adjustment cells. In one extreme case, the nonresponse adjustment factor was 9.6. In contrast,
the largest adjustment factor for the screener nonresponse adjustment step, which had a very minor
impact on the , was only 2.6. Large adjustment factors occur within adjustment cells with
low response rates. Collapsing of cells in this type of scenario is often utilized to avoid large
adjustment factors that lead to large weight variations. However, collapsing cells reduces the
homogeneity of the adjustment cells and reduces the amount of potential bias reduction, so there is
a trade-off to be considered.
Among respondents, misclassification is an important cause of weight variation. Further discussion
on misclassification is provided after discussing the final weights.
Final Weight
The final weights for FoodAPS-1 resulted from a sequence of adjustments that included a raking
adjustment, followed by a weight trimming procedure and a final raking. Weights were calibrated to
population control totals for race/ethnicity of respondent, income, receipt of SNAP, household size,
number of children in the household, and presence of a member age 60 or older. A weight trimming
adjustment was performed within sampling domains, where initial raked weights above a threshold
were trimmed down to the threshold, and the trimmed portion was redistributed to the other

Design Effect Due to Unequal Weights 2
Review of the FoodAPS 2012 Sample Design 26
weights in the sampling domain. Lastly, final weights for analysis were computed by re-raking the
trimmed weights to the population control totals.
The impact of the calibration procedure is similar to the impact from stratification. The aim of the
calibration is to use variables in an iterative poststratification process that related to the survey
outcomes to reduce the variances of resulting estimates. In doing so, the adjustment may cause some
increase to the variation in the weights. The impact of the weight trimming is to reduce the variation
in the weights, and to protect from large weights dominating survey estimates, at the expense of a
small increase in bias.
The overall impact on the design effect for the raking/trimming/raking steps that resulted in the
final weights was minor. The increased from 2.60 to 2.67, an increase of only 3 percent.
However, the impact on the varied a lot by subgroup of interest. The variation was most
dramatic for target groups. There was a decrease in of 11 percent for the main study
Target Group D and an increase in of 27 percent for Target Group A. Similar patterns
were seen for both screener and main study target groups. Other outcomes had more modest
changes in as a result of raking and trimming except for rural households, in which the
increased by 19 percent.
Table 2-2 provides a summary of the weights adjustments’ impact on outcome statistics. It is noted
that, with the exception of the screener nonresponse adjustment, the weight adjustment steps made
an impact on the estimates. For example, for all outcome statistics except total free items, the
deselection adjustment made an important correction for the composition of the resulting sample.
The extended nonresponse adjustment also made some impact; however, it is unclear that the
impact on the potential bias outweighed the impact on the weight variation created by the
adjustment. Lastly, with regards to the raking step, with FoodAPS sample size being lower than
5,000 households, the assumption for raking is that the larger survey (source of the control totals) is
more accurate. Therefore, the raking adjustment is assumed to reduce the overall mean square error
(variance + bias2). The impact on the variation of the weights is assumed to be a result of a positive
overall impact on the accuracy of the FoodAPS estimates.

De
sig
n E
ffect D
ue
to U
ne
qu
al W
eig
hts
2
Re
vie
w o
f the
Fo
od
AP
S 2
01
2 S
am
ple
De
sig
n
27
Table 2-2. Estimates of outcome variables across weighting stages
Outcome of interest
Screener base
weight
Screener nonresponse
adjusted weight
Screener
deselection weight
Extended nonresponse
adjusted weight
Final raked
weight
Total FAH per week
Weighted Mean 50.067 50.954 56.421 59.041 56.518
Relative Difference of Mean from
Previous Weight Stage (%) 1.77 10.72 4.64 -4.27
Total FAFH per week
Weighted Mean 105.304 105.522 112.694 114.118 105.724
Relative Difference of Mean from
Previous Weight Stage (%) 0.21 6.80 1.26 -7.36
Total Free Events
Weighted Mean 3.444 3.425 3.384 3.292 3.020
Relative Difference of Mean from
Previous Weight Stage (%) -0.55 -1.20 -2.72 -8.26
Food Insecurity
Weighted Proportion 0.235 0.233 0.187 0.174 0.159
Relative Difference of Proportion
from Previous Weight Stage (%) -0.85 -19.74 -6.95 -8.62

Review of the FoodAPS 2012 Sample Design 28
Design Effect Due to Unequal Weights 2
Misclassification
Recall that the four target groups are defined as follows:
Group A. Non-SNAP households with income less than the poverty guidelines;
Group B. Non-SNAP households with income greater than or equal to 100 percent and less than 185 percent of the poverty guidelines;
Group C. Non-SNAP households with income greater or equal to 185 percent of the poverty guidelines; and
Group D. Households receiving SNAP benefits.
The SNAP list was used to sample SNAP households within sampled SSUs. At the time of the
screener, a series of questions was used to determine target group. After the screener, households
were subsampled based on their target group designation. During the main survey, a more
comprehensive series of questions was used to determine the main study target group. The target
group assigned during the main survey was updated based on an up-to-date SNAP list to create the
final target group, assigning to SNAP anyone on the SNAP list or who indicated SNAP usage on the
main survey. The corrected main study designation of target group should be the most accurate.
Ideally, every household designated as a SNAP household on the SNAP list would be categorized as
a SNAP household at both the screener and final target group designation (Target Group D), and
there would be perfect agreement between the screener and final target group designations.
However, in practice, there was misclassification (sometimes referred to as stratum jumpers [Rivest
(1999]), and these misclassifications led to increased variation in the final weights.
Tables 2-3 and 2-4 show agreement rates between the SNAP list and the screener and main study
designations of target group. Target Group D includes households on SNAP, and all other target
groups are not on SNAP. Overall, there is a fairly high agreement between the SNAP list and the
screener and corrected main study target group assignments, at 84 and 85 percent, respectively. The
SNAP list seems to have better accuracy designating households that are not SNAP households with
86 percent agreement for the screener and 88 percent agreement for the main study. Conversely,
when used to identify SNAP households, the SNAP list is only in agreement with the screener target
group for 80 percent of households, and for the corrected main study target group designation it is
only 77 percent of households. Only 22 of the 27 states in the PSU sample provided SNAP lists, and
these tables include data only from those 22 states.

Review of the FoodAPS 2012 Sample Design 29
Design Effect Due to Unequal Weights 2
Table 2-3. Screener target group assignment and SNAP list agreement
Screener target group
assignment SNAP list Frequency In-cell agreement Overall agreement
A, B, C Not SNAP 2,545 86% 84%
A, B, C SNAP 428
D Not SNAP 243 80%
D SNAP 995
Note: Only 22 of the 27 states in the PSU sample provided SNAP lists, and this table includes data only from those 22 states.
Table 2-4. Main study target group assignment and SNAP list agreement
Main survey target
group assignment SNAP list Frequency In-cell agreement Overall agreement
A, B, C Not SNAP 2,468 88% 85%
A, B, C SNAP 322
D Not SNAP 320 77%
D SNAP 1,101
Note: Only 22 of the 27 states in the PSU sample provided SNAP lists, and this table includes data only from those 22 states.
One possible reason for disagreement with the SNAP list designation was the time that had elapsed
until the interview occurred. The SNAP lists were provided by state agencies in February 2012 prior
to sampling households. Data collection occurred over a series of months, with the last interviews
occurring many months (nearly a year) after the creation of the SNAP list. Table 2-5 shows the
agreement counts and rates between corrected main study target group and the SNAP list
throughout the 10 months of data collection. Agreement varies between 79 and 87 percent over the
course of the months, with a slight decrease over time. However, among those identified on the
SNAP administrative records, the percentage determined to be on SNAP ranges from 77 percent to
83 percent in the first 3 months, and ranges from 62 percent to 72 percent in the last 3 months. The
rates may fluctuate due to small sample sizes, and, therefore, if one were to combine months
together, the percentages determined to be on SNAP are 82 percent, 75 percent, and 74 percent for
April through June, July through September, and October through January, respectively. From this
table it does not appear that the timing of the interview is a large source of misclassification,
however there would be some benefit to consideration of a refreshed SNAP list.

De
sig
n E
ffect D
ue
to U
ne
qu
al W
eig
hts
2
Re
vie
w o
f the
Fo
od
AP
S 2
01
2 S
am
ple
De
sig
n
30
Table 2-5. Agreement rates with the SNAP list designation over time
Main study
target group SNAP list Apr May Jun Jul Aug Sept Oct Nov Dec Jan
Not SNAP Not SNAP 37 229 247 419 485 372 360 215 66 38
Not SNAP SNAP 7 47 41 15 48 30 53 58 13 10
In cell agreement 84% 83% 86% 97% 91% 93% 87% 79% 84% 79%
SNAP Not SNAP 3 34 39 58 63 45 51 17 6 4
SNAP SNAP 24 220 196 51 147 83 198 132 34 16
In cell agreement 89% 87% 83% 47% 70% 65% 80% 89% 85% 80%
Among SNAP list,
what percentage was
determined to be on SNAP?
77% 82% 83% 77% 75% 73% 79% 69% 72% 62%
Overall agreement 86% 85% 85% 87% 85% 86% 84% 82% 84% 79%
Note: Only 22 of the 27 states in the PSU sample provided SNAP lists, and this table includes data only from those 22 states.

Review of the FoodAPS 2012 Sample Design 31
Design Effect Due to Unequal Weights 2
Table 2-6 demonstrates the level of agreement between the target group assigned at the screener and
the corrected main study target group designation. Agreement between the two target group
assignments is quite low, at 64 percent overall. Agreement is highest with group D (those on the
SNAP list) with 84 percent agreement. All other group assignments are quite poor, ranging from
52 to 60 percent agreement between the two target group assignments, with group C having the
lowest rates of agreement.
Table 2-6. Main study target group assignment and screener target group assignment
agreement
Main study target
group assignment
Screener target
group assignment Frequency In-cell agreement Overall agreement
A A 173 57% 64%
A B 103
A C 12
A D 14
B A 232 60%
B B 445
B C 51
B D 17
C A 157 52%
C B 664
C C 903
C D 19
D A 110 84%
D B 106
D C 17
D D 1,188
Note: This table was process for the 22 states with PSU sample that provided SNAP lists.
Incorrect screener target group assignment can have a large impact on weight variation. Table 2-7
shows weight variations within target group assignments overall and within screener group
assignments. Within the corrected main study target group assignment, there is a lot of weight
variation. The standard deviation of the weights is larger than the mean for every target group. The
maximum weight in target group ranges from 7.5 to 11.7 times the mean for that cell.
Looking at screener target group assignment cells within corrected main study target group
assignment reduces the variability by quite a bit for some of the cells, especially within screener
Target Group C. For example, for main study Target Group D, the maximum weight is 8.1 times
the mean and the standard deviation is 21 percent larger than the mean. Looking only at screener
Target Group C within main study Target Group D, we see that the maximum weight is only 2.2
times the mean and the standard deviation is nearly half the size of the mean. Table 2-6 shows that

Review of the FoodAPS 2012 Sample Design 32
Design Effect Due to Unequal Weights 2
Target Group C has the lowest rates of agreement between the two target group designation, which
may explain the findings in Table 2-7.
However, the misclassification does not explain all weight variation within the main study target
group cells. For example, consider Target Group D, which has the lowest rates of misclassification
between the screener and corrected main study designation, as is shown in Table 2-5. The standard
error for screener target group D within corrected main study Target Group D is 22 percent higher
than the mean, slightly higher than it is for the corrected main study target group overall. The
maximum weight for screener Target Group D within corrected main study Target Group D is 8.3,
slightly higher than it is for the corrected main study target group overall. Similar mixed results are
found for the various other cells.
An ANOVA was performed on the data presented in Table 2-7 to examine the weight variation
within corrected main study target group. A generalized linear model was fit to the equation
(household weight = screener target group) within each corrected main study target group. Table 2-8
shows the R2 values for each main study target group model. The R2 values indicate that the weight
variation due to misclassification is highest in Target Groups B and C. For example, given the
variation in the weights observed within Target Group C, the screener target group designation
explains 31 percent of that variation.

De
sig
n E
ffect D
ue
to U
ne
qu
al W
eig
hts
2
Re
vie
w o
f the
Fo
od
AP
S 2
01
2 S
am
ple
De
sig
n
33
Table 2-7. Weight variation within target group assignment
N Mean Std dev Min Max Std dev/mean Min/mean Max/mean
Overall
Target Group A 346 17,176 19,549 990 143,689 2.295 1.138 0.058 8.366
Target Group B 851 18,263 21,501 1,105 213,519 2.386 1.177 0.061 11.691
Target Group C 2,048 41,150 41,287 1,019 310,558 2.007 1.003 0.025 7.547
Target Group D 1,581 10,563 12,820 836 85,627 2.473 1.214 0.079 8.107
Target group A
Screener Group A 203 15,341 16,820 990 143,689 2.202 1.096 0.065 9.366
Screener Group B 115 16,473 18,850 1,245 128,890 2.309 1.144 0.076 7.824
Screener Group C 13 43,392 26,672 15,979 106,446 1.378 0.615 0.368 2.453
Screener Group D 15 24,680 32,887 1,792 87,285 2.776 1.333 0.073 3.537
Target group B
Screener Group A 258 12,394 12,622 1,105 84,961 2.037 1.018 0.089 6.855
Screener Group B 513 16,842 17,428 1,268 155,577 2.071 1.035 0.075 9.237
Screener Group C 62 56,119 39,484 4,713 213,519 1.495 0.704 0.084 3.805
Screener Group D 18 12,503 10,896 2,513 37,217 1.759 0.871 0.201 2.977
Target group C
Screener Group A 180 19,257 22,267 1,238 174,168 2.337 1.156 0.064 9.044
Screener Group B 782 16,742 15,691 1,019 205,899 1.878 0.937 0.061 12.299
Screener Group C 1,064 63,186 44,628 4,528 310,558 1.499 0.706 0.072 4.915
Screener Group D 22 22,100 26,167 1,829 120,841 2.402 1.184 0.083 5.468
Target group D
Screener Group A 126 8,892 9,401 836 79,001 2.118 1.057 0.094 8.884
Screener Group B 128 10,253 11,847 1,052 78,300 2.335 1.155 0.103 7.637
Screener Group C 18 38,320 20,263 10,553 84,847 1.280 0.529 0.275 2.214
Screener Group D 1,309 10,372 12,657 940 85,627 2.489 1.220 0.091 8.256

Review of the FoodAPS 2012 Sample Design 34
Design Effect Due to Unequal Weights 2
Table 2-8. ANOVA results on screener and main study target group assignments
Final target group R2
A: Non-SNAP households with income less than the poverty guideline 0.080
B: Non-SNAP households with income greater than or equal to 100 percent
and less than 185 percent of the poverty guideline
0.253
C: Non-SNAP households with income greater than or equal to 185 percent of
the poverty guideline
0.309
D: SNAP households 0.055
The lower R2 values for Target Group A and D indicate that the between-screener group variation is
low among A and among D. For example, 5.5 percent of the variation among the weights for cases
classified into corrected main study Target Group D can be explained by the misclassification
(difference in screener vs. corrected main study classification). Figure 2-1 is a box-and-whisker plot
that illustrates the variation in the weights for corrected main study Target Group D by their
screener group designation. Table 2-6 shows that the screener group with the most cases (therefore,
most impactful) is D. The figure shows a large number of cases with weights greater than the 75th
percentile. One interesting finding is the large number of outliers in the weights for those
households categorized as group D in both the screener and corrected main study, which we
attempt to explain further below.

Review of the FoodAPS 2012 Sample Design 35
Design Effect Due to Unequal Weights 2
Figure 2-1. Box-and-whisker plot of final weights by target group assigned at screener for
households in Target Group D, as assigned in main study
Note: HHWGT is the final household sample weight.
Further investigation reveals that the mean weight for the SNAP households sampled via ABS is
larger than the mean weight for the SNAP households sampled via the SNAP list by a factor of 4.9.
Correspondingly, the mean household weight for the SNAP households sampled in states that did
not provide lists of SNAP households is larger than the mean weight for SNAP households sampled
in states that did provide SNAP lists by a factor of 2.9. For the households that were classified as
Target Group D for both the screener and the corrected main study, 91 percent of the weights
greater than the 75th percentile were sampled from the ABS frame (the sampling rates differed
between the SNAP and ABS frames). To control variation in weights, it is beneficial to capture
SNAP households via the SNAP frame as often as possible. One way to aid in this is to emphasize
the importance to obtain lists of SNAP households from all states. Additionally, the matching
algorithm that compares the SNAP household lists to the ABS frame should be reviewed to ensure
the matching algorithm was optimized to ensure adequate removal of SNAP households from the
ABS frame prior to sampling. A review of evaluations of the screener items may also be helpful.

FoodAPS-1 Imputation Evaluation 36
In the three-stage design for FoodAPS-1, following Hanson, Hurwitz and Madow (1953, Volume 1,
Chapter 9, Section 17), the due to clustering may be expressed approximately as:
( ) ( ) (1)
where,
= average number of responding households (HHs) per PSU;
= intracluster correlation that measures the homogeneity of the characteristic being measured for HHs within the PSUs;
= average number of responding HHs per SSU; and
= intracluster correlation for HHs within SSUs.
For FoodAPS-1, the intracluster correlation is a measure of similarity among HHs within a cluster. It
is helpful to compute the intracluster correlation for designing a more efficient sample. For
FoodAPS-1, due to the three-stage design, there are two stages of interest: the intracluster
correlation among HHs within PSUs, and the intracluster correlation among HHs within SSUs. In
the case of , it is a measure of how alike HHs are within PSUs. The value provides the proportion
of the variation explained by between PSU variance. In the case of , it measures how alike HHs
are within SSUs. The value provides the proportion of the variation (within SSU variance + between
SSU variance) explained by between SSU variance. A technical discussion on the computation of
and is provided in Appendix B.
The intracluster correlations for PSUs and SSUs were computed and the results are shown in
Table 3-1, overall, and by subgroup for each outcome variable. The values of and can be
negative, partly due to the instability of the estimates of the components of variance. Due to the
instability, the estimates of and may have rather large SEs associated with them, especially due
to low numbers of degrees of freedom. To explore the sensitivity of the method to extract the
differential weighting impact from the clustering impact, there are two different approaches used.
For the first approach, as described in Appendix B, for the computation of , the between PSU
variance is divided by the variation among the PSU household average weights. For the computation
of , the between SSU variance is divided by the variation among the average weight for each SSU.
For comparison’s sake, a second method simply uses equal weights (average) assigned to all
Design Effect Due to Clustering 3

De
sig
n E
ffect D
ue
To
Clu
ste
ring
3
Re
vie
w o
f the
Fo
od
AP
S 2
01
2 S
am
ple
De
sig
n
37
Table 3-1. Intracluster correlations for PSUs and SSUs
Subgroup Outcome
Adjustment for weight variation Cases assigned average weight
Overall
FAFH 0.00 0.05 0.01 0.05
FAH 0.01 0.10 0.00 0.07
Free items 0.02 0.08 0.01 0.03
Food insecurity 0.02 0.10 0.02 0.06
Target Group
A FAFH -0.09 0.29 -0.05 0.05
B FAFH 0.03 0.38 -0.01 0.02
C FAFH 0.01 0.07 0.01 0.03
D FAFH 0.02 0.14 0.01 0.05
A FAH 0.13 0.38 0.06 0.20
B FAH 0.05 0.14 0.01 0.05
C FAH 0.01 0.16 -0.01 0.11
D FAH 0.02 0.12 0.01 0.06
A Free items 0.07 0.34 -0.05 0.21
B Free items 0.07 0.14 0.03 0.05
C Free items 0.04 0.18 0.01 0.08
D Free items 0.00 0.09 0.02 0.01
A Food insecurity 0.02 0.12 0.03 0.05
B Food insecurity -0.01 0.18 -0.01 0.12
C Food insecurity 0.02 0.11 0.01 0.01
D Food insecurity 0.02 0.12 -0.01 0.04
WIC HH Classification
Non-WIC FAFH -0.03 0.33 -0.03 0.07
WIC FAFH 0.07 0.23 0.00 0.03
Non-WIC FAH 0.13 0.55 0.00 0.16
WIC FAH 0.21 0.38 0.05 0.06
Non-WIC Free items 0.11 0.28 0.04 0.00
WIC Free items 0.02 0.30 0.00 0.12
Non-WIC Food insecurity 0.05 0.29 0.02 0.06
WIC Food insecurity 0.22 0.27 0.16 0.01
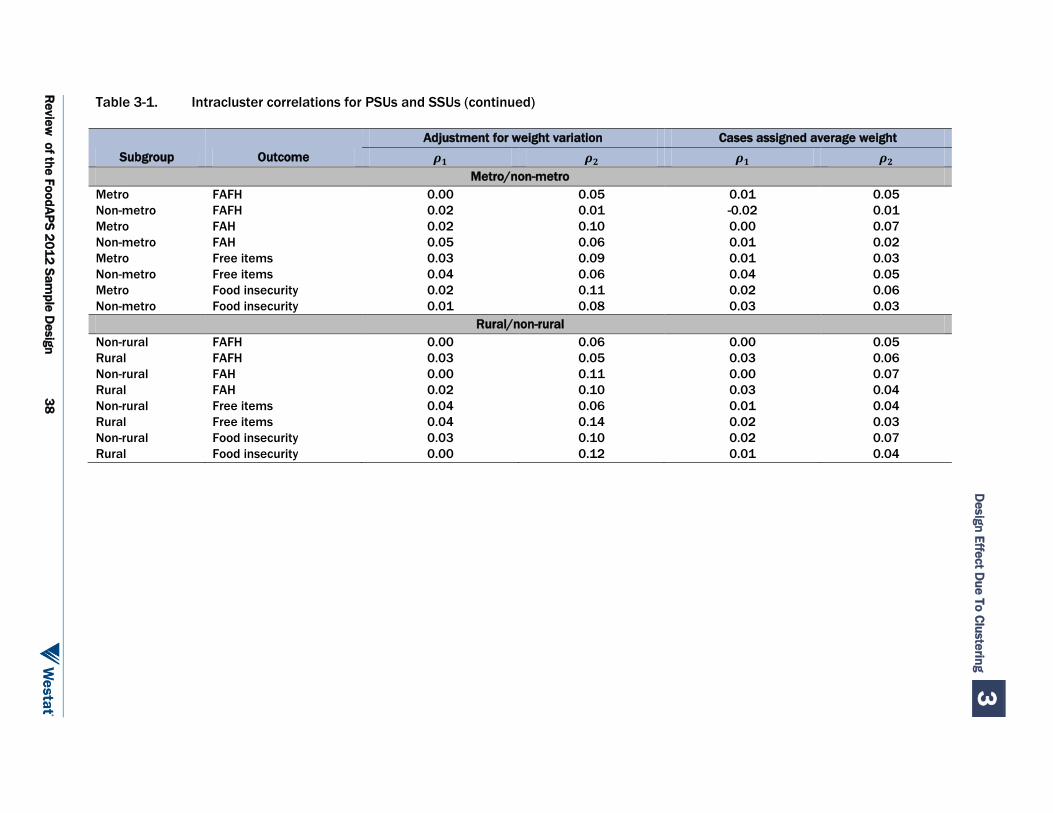
De
sig
n E
ffect D
ue
To
Clu
ste
ring
3
Re
vie
w o
f the
Fo
od
AP
S 2
01
2 S
am
ple
De
sig
n
38
Table 3-1. Intracluster correlations for PSUs and SSUs (continued)
Subgroup Outcome
Adjustment for weight variation Cases assigned average weight
Metro/non-metro
Metro FAFH 0.00 0.05 0.01 0.05
Non-metro FAFH 0.02 0.01 -0.02 0.01
Metro FAH 0.02 0.10 0.00 0.07
Non-metro FAH 0.05 0.06 0.01 0.02
Metro Free items 0.03 0.09 0.01 0.03
Non-metro Free items 0.04 0.06 0.04 0.05
Metro Food insecurity 0.02 0.11 0.02 0.06
Non-metro Food insecurity 0.01 0.08 0.03 0.03
Rural/non-rural
Non-rural FAFH 0.00 0.06 0.00 0.05
Rural FAFH 0.03 0.05 0.03 0.06
Non-rural FAH 0.00 0.11 0.00 0.07
Rural FAH 0.02 0.10 0.03 0.04
Non-rural Free items 0.04 0.06 0.01 0.04
Rural Free items 0.04 0.14 0.02 0.03
Non-rural Food insecurity 0.03 0.10 0.02 0.07
Rural Food insecurity 0.00 0.12 0.01 0.04
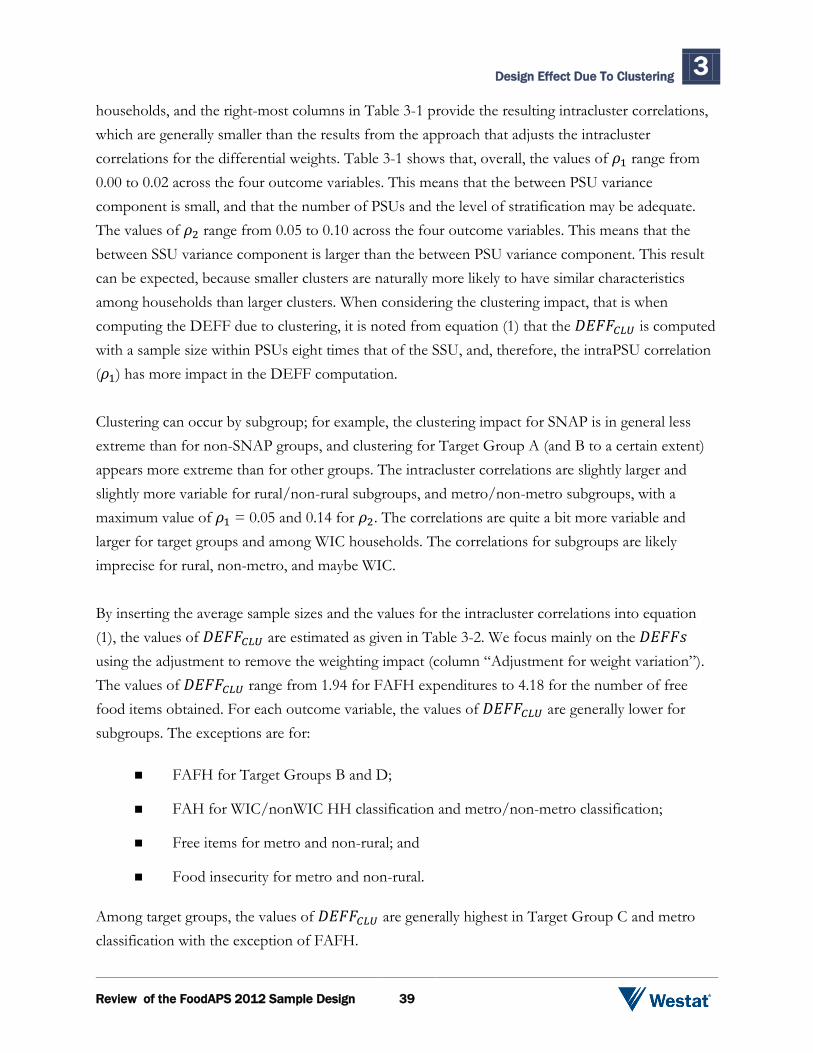
Review of the FoodAPS 2012 Sample Design 39
Design Effect Due To Clustering 3
households, and the right-most columns in Table 3-1 provide the resulting intracluster correlations,
which are generally smaller than the results from the approach that adjusts the intracluster
correlations for the differential weights. Table 3-1 shows that, overall, the values of range from
0.00 to 0.02 across the four outcome variables. This means that the between PSU variance
component is small, and that the number of PSUs and the level of stratification may be adequate.
The values of range from 0.05 to 0.10 across the four outcome variables. This means that the
between SSU variance component is larger than the between PSU variance component. This result
can be expected, because smaller clusters are naturally more likely to have similar characteristics
among households than larger clusters. When considering the clustering impact, that is when
computing the DEFF due to clustering, it is noted from equation (1) that the is computed
with a sample size within PSUs eight times that of the SSU, and, therefore, the intraPSU correlation
( ) has more impact in the DEFF computation.
Clustering can occur by subgroup; for example, the clustering impact for SNAP is in general less
extreme than for non-SNAP groups, and clustering for Target Group A (and B to a certain extent)
appears more extreme than for other groups. The intracluster correlations are slightly larger and
slightly more variable for rural/non-rural subgroups, and metro/non-metro subgroups, with a
maximum value of = 0.05 and 0.14 for . The correlations are quite a bit more variable and
larger for target groups and among WIC households. The correlations for subgroups are likely
imprecise for rural, non-metro, and maybe WIC.
By inserting the average sample sizes and the values for the intracluster correlations into equation
(1), the values of are estimated as given in Table 3-2. We focus mainly on the
using the adjustment to remove the weighting impact (column “Adjustment for weight variation”).
The values of range from 1.94 for FAFH expenditures to 4.18 for the number of free
food items obtained. For each outcome variable, the values of are generally lower for
subgroups. The exceptions are for:
FAFH for Target Groups B and D;
FAH for WIC/nonWIC HH classification and metro/non-metro classification;
Free items for metro and non-rural; and
Food insecurity for metro and non-rural.
Among target groups, the values of are generally highest in Target Group C and metro
classification with the exception of FAFH.

De
sig
n E
ffect D
ue
To
Clu
ste
ring
3
Re
vie
w o
f the
Fo
od
AP
S 2
01
2 S
am
ple
De
sig
n
40
Table 3-2. Values of for outcome variables, by subgroups
Subgroup Outcome
Sample
size
Number of PSUs with
respondent HHs
Number of SSUs with
respondent HHs
Average
number of
HHs per
PSU
Average
number of HHs
per SSU
Adjustment
for weight
variation
Cases
assigned
average
weight
Overall
FAFH 4,660 50 395 93.2 11.8 1.94 2.11
FAH 4,699 50 395 94.0 11.9 2.78 1.95
Free items 4,739 50 395 94.8 12.0 4.18 2.58
Food insecurity 4,826 50 395 96.5 12.2 3.67 3.27
Target Group
A FAFH 328 47 192 7.0 1.7 0.66 0.76
B FAFH 825 50 309 16.5 2.7 2.12 0.83
C FAFH 1,975 50 369 39.5 5.4 1.88 1.40
D FAFH 1,532 50 333 30.6 4.6 1.99 1.52
A FAH 330 47 192 7.0 1.7 2.08 1.53
B FAH 829 50 309 16.6 2.7 2.05 1.24
C FAH 2,011 50 369 40.2 5.4 2.25 1.24
D FAH 1,529 50 333 30.6 4.6 1.96 1.51
A Free items 339 47 192 7.2 1.8 1.71 0.87
B Free items 839 50 309 16.8 2.7 2.37 1.62
C Free items 2,034 50 369 40.7 5.5 3.34 1.83
D Free items 1,527 50 333 30.5 4.6 1.48 1.74
A Food insecurity 346 47 192 7.4 1.8 1.21 1.21
B Food insecurity 851 50 309 17.0 2.8 1.15 1.09
C Food insecurity 2,048 50 369 41.0 5.6 2.25 1.39
D Food insecurity 1,581 50 333 31.6 4.7 1.92 0.89
WIC HH Classification
Non-WIC FAFH 523 50 253 10.5 2.1 1.08 0.82
WIC FAFH 442 50 217 8.8 2.0 1.79 1.03
Non-WIC FAH 535 50 253 10.7 2.1 2.88 1.22
WIC FAH 447 50 217 8.9 2.1 3.06 1.44
Non-WIC Free items 541 50 253 10.8 2.1 2.36 1.45
WIC Free items 456 50 217 9.1 2.1 1.47 1.13
Non-WIC Food insecurity 546 50 253 10.9 2.2 1.84 1.23
WIC Food insecurity 461 50 217 9.2 2.1 3.10 2.31

De
sig
n E
ffect D
ue
To
Clu
ste
ring
3
Re
vie
w o
f the
Fo
od
AP
S 2
01
2 S
am
ple
De
sig
n
41
Table 3-2. Values of for outcome variables, by subgroups (continued)
Subgroup Outcome
Sample
size
Number of PSUs with
respondent HHs
Number of SSUs with
respondent HHs
Average
number of
HHs per
PSU
Average
number of HHs
per SSU
Adjustment
for weight
variation
Cases
assigned
average
weight
Metro/non-metro
Metro FAFH 4,248 50 349 85.0 12.2 1.84 2.12
Non-metro FAFH 412 14 45 29.4 9.2 1.68 0.63
Metro FAH 4,286 50 349 85.7 12.3 3.51 2.15
Non-metro FAH 413 14 45 29.5 9.2 2.79 1.34
Metro Free items 4,331 50 349 86.6 12.4 4.28 2.47
Non-metro Free items 408 14 45 29.1 9.1 2.62 2.54
Metro Food insecurity 4,400 50 349 88.0 12.6 4.38 3.70
Non-metro Food insecurity 426 14 45 30.4 9.5 2.04 2.19
Rural/non-rural
Non-rural FAFH 3,395 48 283 70.7 12.0 1.33 1.61
Rural FAFH 1,265 37 128 34.2 9.9 2.60 2.50
Non-rural FAH 3,420 48 283 71.3 12.1 2.32 2.05
Rural FAH 1,279 37 128 34.6 10.0 2.52 2.23
Non-rural Free items 3,452 48 283 71.9 12.2 4.31 2.21
Rural Free items 1,287 37 128 34.8 10.1 3.65 1.74
Non-rural Food insecurity 3,515 48 283 73.2 12.4 4.33 3.61
Rural Food insecurity 1,311 37 128 35.4 10.2 2.11 1.70

Review of the FoodAPS 2012 Sample Design 42
Design Effect Due To Clustering 3
The results of the clustering impact analysis shows a non-negligible impact of clustering, which
exists in other in-person household surveys. A large value of the intracluster correlation for PSUs
would point to the need for more PSUs, and/or larger PSUs, in the sample. Likewise, if the
intracluster correlation for SSUs is large, then a larger number of SSUs, and/or larger SSUs, may be
considered. The population and geographic sizes of the PSUs and SSUs for FoodAPS-1 are at about
the maximum size used in surveys, and, therefore, the choice is whether or not to increase the
numbers of PSUs and the numbers of SSUs to reduce clustering. Another key factor in arriving at
the number of PSUs and SSUs is cost, such as the cost of travel within clusters by interviewers and
the hiring of more interviewers.
Overall, when considering the values of the intracluster correlations and design effects due to
clustering, the size and number of PSUs and SSUs appear to be reasonable. Likewise, by subgroups,
especially by target group and for WIC household classification, the size and number of PSUs and
SSUs appear to be reasonable. To reduce the clustering in metro areas, more SSUs could be selected.
There are several trade-offs to consider. If the stratification of PSUs can be improved, forming small
PSUs may be justified, which would help to decrease cost and potentially improve response rates
due to less travel within the PSU. However, the instability of the intracluster correlations remains a
concern due to the low numbers of degrees of freedom, which is driven by the number of PSUs.

Review of the FoodAPS 2012 Sample Design 43
The FoodAPS-1 non-certainty PSUs were selected systematically from a sorted list with probability
proportionate to size. The list was sorted by metropolitan status and region, which acts as implicit
stratification, which typically will reduce the between PSU variance if the sort order variables are
associated with the outcome variables. To evaluate the impact of stratification, the impact ratio was
defined as:
Impact ratio =
In general, if stratification were effective, the impact ratio as defined above would have values less
than 1. Estimation of the numerator was facilitated by the actual variance estimation codes in
FoodAPS. That is, the numerator was estimated using Taylor Linearization using the FoodAPS-1
variance estimation codes for strata (JKSTRATA) and clusters (JKPSU). In this manner, the strata
reflect the certainty PSU, as well as the pairing of noncertainty PSUs according to the sort order of
PSU selection. Due to the odd number of non-certainty PSUs, there was one variance strata with
three PSUs. For the certainty PSU, the variance units were the eight SSUs. The variance units were
the PSUs in the noncertainty strata.
The denominator was estimated by redefining the variance strata to produce variance estimates as if
no stratification were done. That is, there were two variance strata assigned: one reflected the
certainty PSU, and the second was made up of the set of noncertainty PSUs. As above, for the
certainty PSU, the variance units were the eight SSUs. In the single noncertainty stratum, the
variance units were the PSUs. With this approach, however, we caution that the impact rate will
overestimate the denominator due to the designed dispersion caused from the selection of the PSUs.
Tables 4-1 through 4-5 provide the impact ratios due to stratification for each outcome measure,
overall, and by each subgroup.
Design Effect Due to Stratification 4

Review of the FoodAPS 2012 Sample Design 44
Design Effect Due to Stratification 4
Table 4-1. Impact ratio due to stratification for outcome measures, overall
Outcome of interest Estimate
Standard error
(with stratification)
Standard error
(without stratification)
Impact
ratio
Total Food At Home 105.72 2.90 3.48 0.69
Total Food Away from Home 56.52 1.61 2.64 0.37
Total Free Events 3.02 0.14 0.11 1.53
Food Insecurity 0.16 0.01 0.01 0.79
Table 4-2. Impact ratio due to stratification for outcome measures, by target group
Outcome of interest Estimate
Standard error
(with stratification)
Standard error
(without stratification)
Impact
ratio
Total Food At Home
Group A 67.51 6.24 6.01 1.08
Group B 72.55 3.48 3.72 0.87
Group C 116.67 3.73 4.14 0.81
Group D 94.14 4.06 4.43 0.84
Total Food Away from Home
Group A 30.43 4.80 5.00 0.92
Group B 34.37 3.00 3.32 0.81
Group C 67.55 2.20 3.19 0.48
Group D 30.99 2.14 2.30 0.86
Total Free Events
Group A 2.47 0.35 0.35 0.98
Group B 2.61 0.22 0.18 1.47
Group C 2.96 0.17 0.15 1.31
Group D 3.96 0.18 0.20 0.84
Food Insecurity
Group A 0.42 0.03 0.04 0.54
Group B 0.03 0.02 0.02 0.61
Group C 0.07 0.01 0.01 1.23
Group D 0.45 0.02 0.02 0.90

Review of the FoodAPS 2012 Sample Design 45
Design Effect Due to Stratification 4
Table 4-3. Impact ratio due to stratification for outcome measures, by WIC household
classification
Outcome of interest Estimate
Standard error
(with stratification)
Standard error
(without stratification)
Impact
ratio
Total Food At Home
non-WIC 147.95 10.85 11.06 0.96
WIC 116.93 8.77 8.01 1.20
Total Food Away from Home
non-WIC 65.42 3.95 4.49 0.77
WIC 55.59 5.42 4.86 1.24
Total Free Events
non-WIC 4.50 0.41 0.35 1.37
WIC 4.96 0.40 0.44 0.83
Food Insecurity
non-WIC 0.15 0.03 0.03 1.19
WIC 0.30 0.04 0.04 1.32
Universe: someone in HH AGE = 14 – 49 and SEX = 2 and ANYPREGNANT = 1, or someone in the household under age 5.
Table 4-4. Impact ratio due to stratification for outcome measures, by metro/non-metro
classification
Outcome of interest Estimate
Standard error
(with stratification)
Standard error
(without stratification)
Impact
ratio
Total Food At Home
non-Metro 107.87 3.49 3.98 0.77
Metro 91.85 7.58 6.53 1.35
Total Food Away from Home
non-Metro 59.56 1.71 2.60 0.43
Metro 37.06 3.20 3.16 1.03
Total Free Events
non-Metro 3.09 0.14 0.11 1.47
Metro 2.57 0.35 0.34 1.04
Food Insecurity
non-Metro 0.16 0.01 0.01 0.18
Metro 0.14 0.02 0.02 0.33
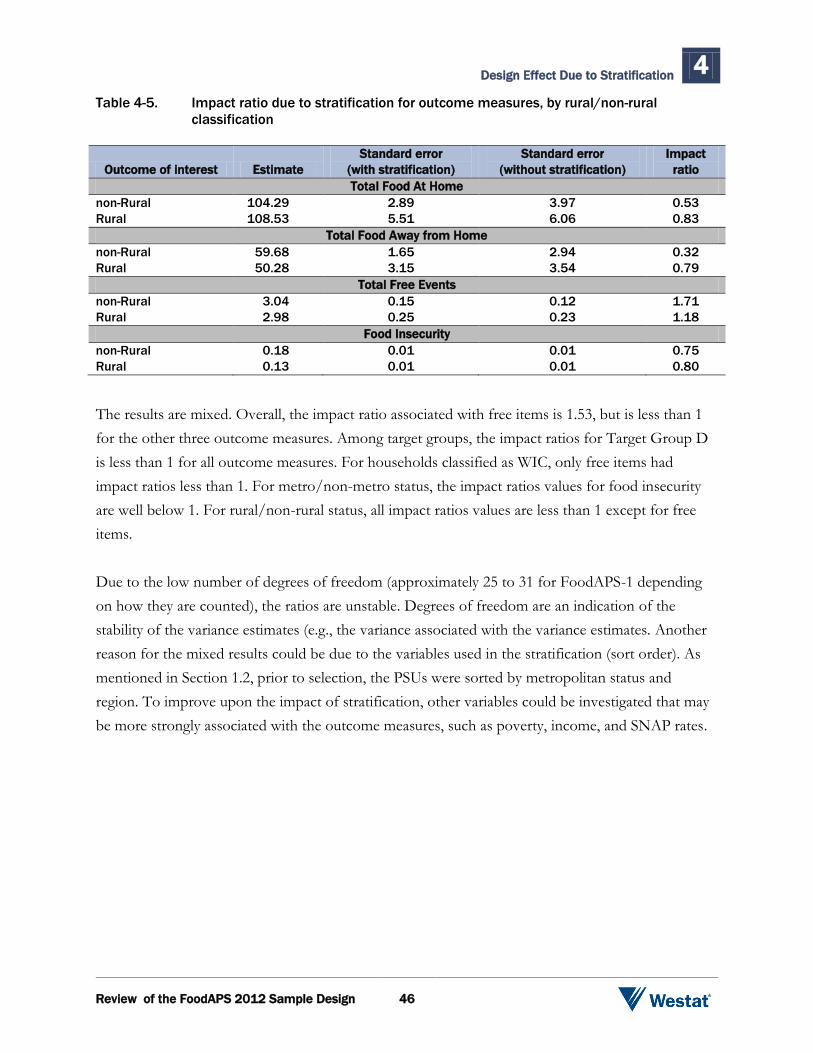
Review of the FoodAPS 2012 Sample Design 46
Design Effect Due to Stratification 4
Table 4-5. Impact ratio due to stratification for outcome measures, by rural/non-rural
classification
Outcome of interest Estimate
Standard error
(with stratification)
Standard error
(without stratification)
Impact
ratio
Total Food At Home
non-Rural 104.29 2.89 3.97 0.53
Rural 108.53 5.51 6.06 0.83
Total Food Away from Home
non-Rural 59.68 1.65 2.94 0.32
Rural 50.28 3.15 3.54 0.79
Total Free Events
non-Rural 3.04 0.15 0.12 1.71
Rural 2.98 0.25 0.23 1.18
Food Insecurity
non-Rural 0.18 0.01 0.01 0.75
Rural 0.13 0.01 0.01 0.80
The results are mixed. Overall, the impact ratio associated with free items is 1.53, but is less than 1
for the other three outcome measures. Among target groups, the impact ratios for Target Group D
is less than 1 for all outcome measures. For households classified as WIC, only free items had
impact ratios less than 1. For metro/non-metro status, the impact ratios values for food insecurity
are well below 1. For rural/non-rural status, all impact ratios values are less than 1 except for free
items.
Due to the low number of degrees of freedom (approximately 25 to 31 for FoodAPS-1 depending
on how they are counted), the ratios are unstable. Degrees of freedom are an indication of the
stability of the variance estimates (e.g., the variance associated with the variance estimates. Another
reason for the mixed results could be due to the variables used in the stratification (sort order). As
mentioned in Section 1.2, prior to selection, the PSUs were sorted by metropolitan status and
region. To improve upon the impact of stratification, other variables could be investigated that may
be more strongly associated with the outcome measures, such as poverty, income, and SNAP rates.

Review of the FoodAPS 2012 Sample Design 47
The evaluation of the FoodAPS-1 sample design serves the purpose of informing an improved
design for the next survey. In general, large variability in the weights was observed, which impacted
the resulting precision of estimates. Variability across target groups is by design, but a great amount
of within-group variability is problematic. Part of the weight variation issue is misclassification
(differences in classification among the SNAP lists, screener, and main study), and the way the
sample was released. Also, the design proved challenging as illustrated by the actual sample sizes for
Target Groups A and B falling far short of the target sample sizes. The evaluation was organized by
three main aspects of the design: (1) stratification, (2) clustering, and (3) differential weights.
In general, the stratification impact was mixed; however, future design work should explore the
benefits of explicit stratification of PSUs versus the use of the composite MOS. The sorting
variables used in FoodAPS-1 were metro status and FNS region. Use of other potential stratification
variables, such as percentage in poverty, may provide a better chance at arriving at desired sample
sizes for Target Groups A and B, and may provide more potential to reduce the resulting variance to
get more power out of the survey cases. Future design work should explore the benefits of using the
composite MOS, as well as the best sources for the stratification and MOS, variables. The planning
should explore the pros and cons of the composite MOS, when stratification of SNAP lists will
occur within the SSUs.
The clustering amounts in FoodAPS-1 are about as expected. The size of the FoodAPS-1 PSUs and
SSUs are among the largest in use by in-person surveys, which results in low impact on variances
from clustering. However, it also increases travel time by interviewers and may increase costs as well
as decrease response rates. In terms of PSUs and SSUs, future design work should incorporate the
estimated intracluster correlations in this report to gauge the number to select, and take into
consideration other ways to form PSUs. For example, PSUs can be formed from counties where
contiguous counties can be combined to reach a minimum population size of 15,000. In addition,
the number of degrees of freedom for statistical analysis should be taken into consideration, which
can be increased by increasing the number of first-stage units.
Among the three main aspects that impact the resulting variances, the most potential for
improvement is by reducing the weight variation. Future design work should ensure protocols to
Concluding Remarks 5

Concluding Remarks 5
Review of the FoodAPS 2012 Sample Design 48
eliminate or limit the increased amount of weight variation when handling drop points in the ABS,
updating the address lists, and when releasing reserve sample to address shortfalls. Ways should be
sought to reduce weight variation within target groups through the sampling process and minimizing
misclassification. In addition, other domains, such as incorporating WIC in the definition of target
groups, will be explored with the assignment of sampling rates in the sampling plan for the next
main survey.

Review of the FoodAPS 2012 Sample Design R-1
References
Cole, N., Hall, J., Baxter, C., Redel, N., and Sukasih, A. (2016). National Household Food Acquisition and
Purchase Survey: Survey design. Draft report submitted by Mathematica to Economic Research Service.
Folsom, R., Potter, F., and Williams, S. (1987). Notes on a composite size measure for self-weighting samples in multiple domains. Proceedings of the American Statistical Association, Section of Survey Research Methods, Alexandria, VA.
Hall, J.W., Denbaly, M., and Weidman, P. (2012). A design to oversample low-income households for a study of food acquisitions. Proceedings of the American Statistical Association, H2R 2012, Survey Methods for Hard-to-Reach Populations.
Hanson, M., Hurwitz, W., and Madow, W. (1953). Sample survey methods and theory, Volume I. New York: John Wiley & Sons.
Kish, L. (1995). Methods for design effects. Journal of Official Statistics. 11, 55-77.
Kish, L. (1992). Weighting for unequal . Journal of Official Statistics, 8(2), 183-200.
Kish, L. (1965). Survey sampling. New York: John Wiley & Sons.
Leftin, J., and Wolkowitz, K. (2009, June). Trends in Supplemental Nutrition Assistance Program participation rates: 2000 to 2007. Final report submitted to the U.S. Department of Agriculture, Food and Nutrition Service. Washington, DC: Mathematica Policy Research.
Rivest, L.-P. (1999). Stratum jumpers: Can we avoid them? Proceedings of the Section on Survey Methods Research of the American Statistical Association (64-72).

Appendix A
Sampling Error Measures

Review of the FoodAPS 2012 Sample Design A-1
Appendix A
Sampling Error Measures
There are several measures of precision used for evaluating sample designs and variances. The
standard error ( ), or the square root of the estimated variance of the point estimate, is a basic
measure of the sampling error. Under simple random sampling ( ), for an estimate of a
proportion , the is computed as ( ) √ ( ) , where is the sample size. The
formula given above is for but in practice, large-scale national surveys, such as FoodAPS-1,
typically employ complex sample designs. Conceptually, the formula for needs to be
multiplied by the square root of the design effect ( ) to give the under the complex design.
The is a useful quantity to examine when comparing alternative designs. The is
computed as:
Since the FoodAPS-1 design consists of a multistage cluster sample, the is typically larger than
under . One interpretation of says that if , the sample size needs to be
doubled to achieve the same precision as from an . Another interpretation is that if the resulting
sample size from the complex sample is 5,000 respondents, then with a , the effective
sample size is 2,500. Another way of way of looking at it, if the variance is estimated with an SRS
formula, and if DEFF = 2, then the resulting SE needs to be increased by about 41 percent.
The CV is another common measure of precision, which is sometimes referred to as the relative
standard error. The CV is computed as the ratio of the standard error to the point estimate (e.g., p).
The CV is especially useful when estimating means, but it is a bit problematic when estimating low
or high proportions. For example, under SRS of size 100, for an estimated proportion p = 0.025 for
a particular attribute, the SE is 0.016, and the CV is 62.4 percent. However, for the complement of
the attribute (1-p) equaling 0.975, the SE is still 0.016, and the CV is only 1.6 percent.

Appendix B
Intracluster Correlation Computations

Review of the FoodAPS 2012 Sample Design B-1
Appendix B
Intracluster Correlation Computations
To estimate and , we first decompose the total variance into three between-variance terms
attributable to Primary Sampling Units (PSUs), Secondary Sampling Units (SSUs), and households
(HHs) as follows:
( ) ( )
The intracluster correlation within the PSU is computed as:
( )
( )
The intracluster correlation for individuals within the SSU is computed as:
( )
( ) ( )
The following explains how to compute the terms in the above formulas for the intracluster
correlations. The variance of an estimate ( ) can be decomposed as:
( )
( )
( )
(2)
The first term in (2) is:
( )
( )
, and therefore
( )
( )
where,
( )
( )
, where ( )
is the sampling variance of among non-self-
representing PSUs, and

Appendix B
Intracluster Correlation Computations
Review of the FoodAPS 2012 Sample Design B-2
( )
( )
, where ( )
is the between SSU variance of .
The variance ( )
was estimated among the 49 non-certainty PSUs using Taylor
Linearization with the variance strata assigned using the available JKSTRATA variable, and the
variance units assigned as the PSUs, as given in the JKPSU variable. The JKSTRATA variable
mainly comprises PSUs paired in the sorted order of selection.
The variance ( )
was estimated among the 50 PSUs using Taylor Linearization with the
variance strata assigned as PSUs, and the variance units assigned as the SSUs.
For the second term in (2),
( )
( )
( )
, and therefore,
( ) ( )
( )
where,
( )
( )
, where ( )
is the between HH variance of .
The variance ( )
was estimated among the 50 PSUs using Taylor Linearization with the
variance strata assigned as SSUs, and the variance units assigned as the HHs.
For the third term in (2), ( )
( )
, and therefore,
( ) ( )
.
As shown above, the variance component at each stage was divided by the component.
The component was computed as a function of the variance of the average weight at
each stage. That is, at each stage of selection, the design effect due to the weight variation was
computed as follows:
( )

Appendix B
Intracluster Correlation Computations
Review of the FoodAPS 2012 Sample Design B-3
where,
( ) ∑ ( )
,
∑
, and where
At the second stage,
( )
,
where,
( ) ∑ ( )
,
∑
, and where
.
At the third stage,
( )
where,
( ) ∑ ( )
, and
∑
.