review article comprehensive assessment of fluid status by
TRANSCRIPT

Comprehensive Assessment of Fluid Status byPoint-of-Care UltrasonographyEduardo R. Argaiz ,1 Abhilash Koratala ,2 and Nathaniel Reisinger 3
AbstractThemanagementof complexfluidandelectrolytedisorders is central to thepracticeofnephrologists.Thesensitivityof physical examination alone to determine fluid status is limited, precluding accurate clinical decision making.Point-of-careultrasonography(POCUS) isemergingasavaluable,noninvasive,bedsidediagnostic tool forobjectiveevaluationofphysiologic andhemodynamicparameters related tofluidstatus, tolerance, andresponsiveness.Rapidbedside sonographic evaluation canobtainqualitative data on cardiac function andquantitativedata onpulmonarycongestion. Advanced POCUS, including goal-directed Doppler echocardiography, provides additionalquantitative information, including flow velocities and pressures across the cardiac structures. Recently, abnormalDoppler flow patterns in abdominal organs secondary to increased right atrial pressure have been linked tocongestiveorgandamage, addinganothercomponent to thehemodynamicassessment. IntegratingPOCUSfindingswith clinical and laboratory data can further elucidate a patient’s hemodynamic status. This drives decisionsregarding crystalloid administration or, conversely, diuresis or ultrafiltration and allows tailored therapy forindividualpatients. In this article,weprovideanoverviewof the focusedassessment of cardiovascular functionandpulmonary and venous congestion using POCUS and review relevant literature.
KIDNEY360 2: 1326–1338, 2021. doi: https://doi.org/10.34067/KID.0006482020
CaseA 63-year-old man with a medical history of hyperten-sion, obesity, and heart failure (HF) with reducedejection fraction presents to the nephrology clinic forassessment of an elevated serum creatinine.His baselineserum creatinine was approximately 0.6–0.8 mg/dl. Hecomplains of abdominal distension, loose stools, anddyspnea on exertion. Medications include carvedilol,lisinopril, isosorbide mononitrate, and hydralazine.Diuretics were held by the referring physician due to arise in creatinine. Physical examination demonstratesBP of 92/59mmHgwith a heart rate of 65 bpm. Cardio-pulmonary exam reveals pedal edema, but no obviousjugular venous distention, rales, or third heart sound.Urine sediment is bland. Review of chest roentgeno-gram obtained in the primary care setting shows noevidence of pulmonary edema or pleural effusions. Lab-oratory studies show stable serum creatinine 1.4 mg/dlafter discontinuation of diuretics. What is the next step?
IntroductionAssessment of fluid and hemodynamic status is a
critical skill for nephrologists, central to almost everyconsult from hypertension and electrolyte disorders tomanagement ofAKI andESKD. Fluid status assessmenthas a storied tradition in which physical exam signs ofjugular venous distention, third heart sounds, rales,and peripheral edema have been learned and
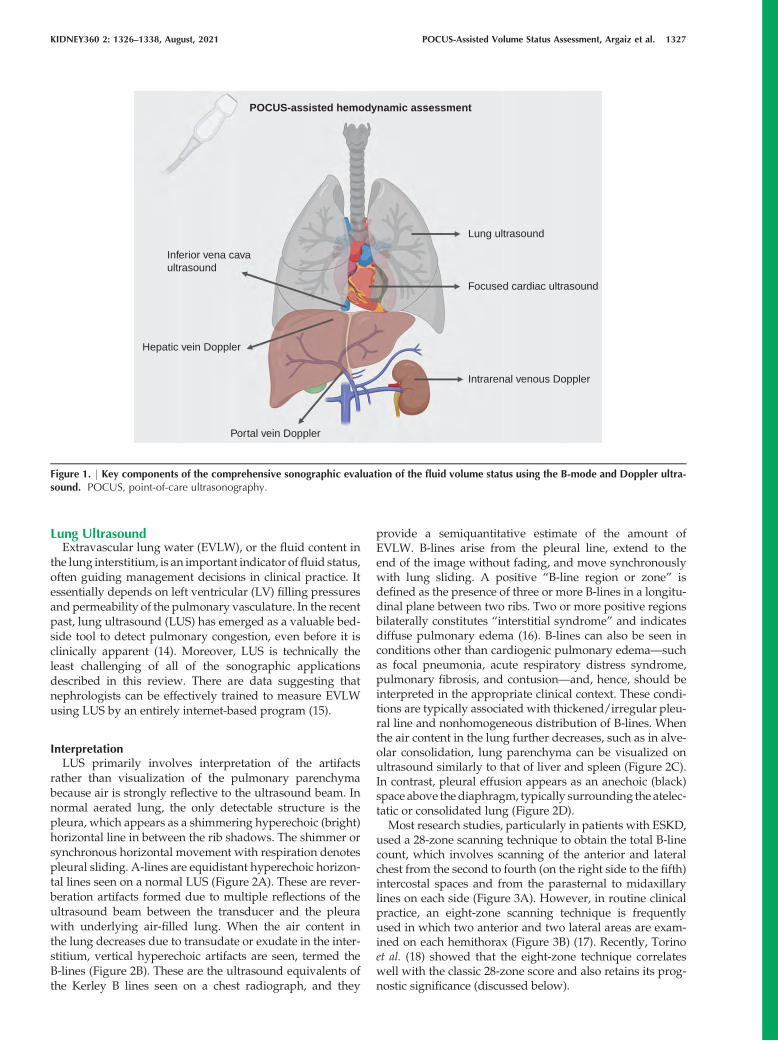
reproduced by generations of physicians. These signsare helpful in extreme cases, but are insensitive for thedetection of volume overload (1). Radiographic signsof volume overload, such as pleural effusions and Ker-ley B lines, aid in fluid status assessment, but lack sen-sitivity (2). Natriuretic peptides and pulmonary arterycatheters also have limitations (3,4). In the past 30 years,point-of-care ultrasonography (POCUS) has expandedfrom a niche subspecialty skill to a cornerstone of bed-side diagnosis (5,6). Ultrasound allows us to directlyvisualize the body in away thatwas previously inacces-sible. POCUS involves answering focused clinical ques-tions using bedside ultrasonography and increases thesensitivity of the conventional physical examination(7–12). As we move forward, ultrasonographic indica-tors of fluid status are being developed and validated.Some are intuitive to our understanding of physiology,and others are novel markers of previously unknownsignificance (Figure 1). Having said that, POCUS find-ings should be interpreted in conjunction with otherclinical parameters—such as vital signs, body weight,mucous membrane examination, capillary refill time,and axillary moisture—and not viewed as an alterna-tive to physical examination or standard imaging stud-ies.Wedescribe themostwell-validated indices offluidstatus: focused sonographic assessment of the heart,abdominal veins, and lungs (the pump-pipes-leaksapproach) (13) to gain insight into systemic hemody-namics and guide fluid management decisions.
1National Institute of Medical Sciences and Nutrition Salvador Zubir�an, Mexico City, Mexico2Medical College of Wisconsin, Milwaukee, Wisconsin3University of Pennsylvania, Philadelphia, Pennsylvania
Correspondence: Dr. Abhilash Koratala, Medical College of Wisconsin, 8701 W Watertown Plank Rd., Division of Nephrology, Room A7633, Wauwatosa, WI 53226. Email: [email protected]
1326 Copyright # 2021 by the American Society of Nephrology www.kidney360.org Vol 2 August, 2021
Review Article
Lung UltrasoundExtravascular lung water (EVLW), or the fluid content in
the lung interstitium, is an important indicator offluid status,often guiding management decisions in clinical practice. Itessentially depends on left ventricular (LV) filling pressuresand permeability of the pulmonary vasculature. In the recentpast, lung ultrasound (LUS) has emerged as a valuable bed-side tool to detect pulmonary congestion, even before it isclinically apparent (14). Moreover, LUS is technically theleast challenging of all of the sonographic applicationsdescribed in this review. There are data suggesting thatnephrologists can be effectively trained to measure EVLWusing LUS by an entirely internet-based program (15).
InterpretationLUS primarily involves interpretation of the artifacts
rather than visualization of the pulmonary parenchymabecause air is strongly reflective to the ultrasound beam. Innormal aerated lung, the only detectable structure is thepleura, which appears as a shimmering hyperechoic (bright)horizontal line in between the rib shadows. The shimmer orsynchronous horizontal movement with respiration denotespleural sliding. A-lines are equidistant hyperechoic horizon-tal lines seen on a normal LUS (Figure 2A). These are rever-beration artifacts formed due to multiple reflections of theultrasound beam between the transducer and the pleurawith underlying air-filled lung. When the air content inthe lung decreases due to transudate or exudate in the inter-stitium, vertical hyperechoic artifacts are seen, termed theB-lines (Figure 2B). These are the ultrasound equivalents ofthe Kerley B lines seen on a chest radiograph, and they
provide a semiquantitative estimate of the amount ofEVLW. B-lines arise from the pleural line, extend to theend of the image without fading, and move synchronouslywith lung sliding. A positive “B-line region or zone” isdefined as the presence of three or more B-lines in a longitu-dinal plane between two ribs. Two or more positive regionsbilaterally constitutes “interstitial syndrome” and indicatesdiffuse pulmonary edema (16). B-lines can also be seen inconditions other than cardiogenic pulmonary edema—suchas focal pneumonia, acute respiratory distress syndrome,pulmonary fibrosis, and contusion—and, hence, should beinterpreted in the appropriate clinical context. These condi-tions are typically associated with thickened/irregular pleu-ral line and nonhomogeneous distribution of B-lines. Whenthe air content in the lung further decreases, such as in alve-olar consolidation, lung parenchyma can be visualized onultrasound similarly to that of liver and spleen (Figure 2C).In contrast, pleural effusion appears as an anechoic (black)space above thediaphragm, typically surrounding the atelec-tatic or consolidated lung (Figure 2D).Most research studies, particularly in patients with ESKD,
used a 28-zone scanning technique to obtain the total B-linecount, which involves scanning of the anterior and lateralchest from the second to fourth (on the right side to the fifth)intercostal spaces and from the parasternal to midaxillarylines on each side (Figure 3A). However, in routine clinicalpractice, an eight-zone scanning technique is frequentlyused in which two anterior and two lateral areas are exam-ined on each hemithorax (Figure 3B) (17). Recently, Torinoet al. (18) showed that the eight-zone technique correlateswell with the classic 28-zone score and also retains its prog-nostic significance (discussed below).
POCUS-assisted hemodynamic assessment
Lung ultrasound
Focused cardiac ultrasound
Portal vein Doppler
Hepatic vein Doppler
Inferior vena cavaultrasound
Intrarenal venous Doppler
Figure 1. | Key components of the comprehensive sonographic evaluation of the fluid volume status using the B-mode and Doppler ultra-sound. POCUS, point-of-care ultrasonography.
KIDNEY360 2: 1326–1338, August, 2021 POCUS-Assisted Volume Status Assessment, Argaiz et al. 1327

Diagnostic PerformanceThe diagnostic performance of LUS to detect pulmonary
congestion is far superior compared with auscultation. Forexample, in a study including 79 patients receiving hemodi-alysis who were deemed to be at higher cardiovascular risk,only about half of those with severe congestion on LUS(defined as .30 B-lines on a 28-zone scan) had crackles onlung auscultation. Likewise, in patients with moderate con-gestion on LUS (15 to,30 B-lines), the prevalence of crackleswas only 31% (1).In patients with acute decompensated heart failure, LUS
was shown to be more sensitive for detection of pulmonaryedema than chest radiography, which is the typicalfirst-line imaging (2). In addition, LUS has demonstratedsubstantial correlation with cardiac catheterization–derivedLV end-diastolic pressure, making it a valuable adjunct toechocardiography and clinical variables in the managementof patients with HF (19).
Prognostic SignificanceLUS-detected pulmonary congestion is associated with
adverse outcomes, even in patients who are asymptomatic.For instance, in a multicenter observational study including392 patients with ESKD who were on hemodialysis, thosewith very severe congestion (.60 B-lines on a 28-zonescan) had a 4.2-fold risk of death (hazard ratio, 4.20; 95%CI, 2.45 to 7.23) and a 3.2-fold risk of cardiac events (hazardratio, 3.20; 95% CI, 1.75 to 5.88) after adjusting for HF classand other risk factors compared with those having mild orno congestion (,15 B-lines) (20).
Analogously, in the context of HF, residual lung conges-tion at hospital discharge and in the outpatient clinic hasbeen shown to be a strong predictor of outcome (21–23).
Role in Guiding the TherapyBecause LUS provides dynamic information, the change
in B-line count can be used to monitor the effectiveness ofdecongestive/ultrafiltration therapy and titrate it accord-ingly (24–27). In a recent randomized controlled trialincluding 71 patients with ESKD who were “clinicallyeuvolemic,” those who underwent prehemodialysis, LUS-guided, dry-weight reduction achieved a greater reductionin weight compared with those receiving standard care,correlating with the change in number of B-lines (–5.3 inactive group versus12.2 in controls). In addition, the mag-nitude of 48-hour ambulatory BP reduction was signifi-cantly greater in the active group at 8 weeks (systolic–6.61 versus –0.67 mm Hg and diastolic –3.85 versus–0.55, P50.03) (28).
Similarly, in patients with acute exacerbation of HF,B-line count has been shown to consistently decreasewith diuretic therapy soon after presentation, therebyguiding further management (29). In ambulatory patientswith chronic HF, an eight-zone, LUS-guided diuretic ther-apy was associated with a significant reduction inHF-related urgent care visits compared with standardcare (30). Clinical trials are in progress that may providefurther insights into long-term outcomes of LUS-guidedtherapy (31).
A B
C D
Figure 2. | Common lung ultrasound findings. Sonographic images demonstrating (A) normal lung with A-lines (arrows); (B) vertical B-lines(arrows), indicating interstitial edema. Arrowhead points to the pleural line. (C) Consolidated lung (arrow); (D) pleural effusion (asterisk) abovethe diaphragm (a rrow). 'LOGIQ P9' and the letter 'P' in the images indicate ultrasound screen orientation markers.
1328 KIDNEY360

Focused Cardiac AssessmentHemodynamic assessment is predicated on the basic
knowledge of cardiac function and the presence of patholo-gies. In contrast to referral echocardiography, focusedcardiac ultrasound (FOCUS) is a limited study aimed atanswering specific questions, such as evaluation of the leftand right ventricular function and presence or absence ofpericardial effusions. Most commonly, FOCUS consists of aseries of five, two-dimensional, echocardiographic clipswithout spectral Doppler, in which images of the heart areobtained in orthogonal planes to provide the relevant phys-iologic information (detailed in Figure 4) (32,33). Furtherclues to fluid status can be gleaned from additional studiesusing Doppler ultrasonography. Table 1 summarizes theimage acquisition of basic echocardiographic views, com-mon structures visualized, sonographic parameters, andpathologies assessed in each view. A brief note on commonpathologies is provided below.
Pericardial EffusionPericardial effusion is an important cause of hypotension
and hemodynamic compromise, which can be quickly iden-tified on FOCUS. It appears as an anechoic (black) spacebetween the two pericardial layers. Parasternal long-axisand subcostal views allow better visualization of theeffusion, although it is generally identifiable on all of thestandardFOCUSviews (Figure 5A). In terms of severity, sep-aration between the pericardial layers in diastole of,1 cm isconsidered mild, whereas 1–2 cm is considered moderateand.2 cm is considered severe effusion (34).
LV Systolic DysfunctionQualitative estimation or “eyeballing” of the LV ejection
fraction is another key component of FOCUS,which involvesobserving wall thickening and motion during the cardiaccycle. In general, the LV walls should approximate by onefourth or more in parasternal views. In patients withdepressed LV function, both wall thickening and inwardmotion are decreased. Conversely, a hyperdynamic ventri-cle, i.e., where ventricular walls/papillary muscles in theparasternal short axis view almost touch at end-systole, isindicative of volume depletion in the appropriate clinicalcontext.
Relative Chamber SizeA normal right ventricle (RV) cavity diameter is less than
two thirds of the LV and can quickly dilate with pressureor volume overload. Apical four-chamber and parasternalshort axis views are good for assessing this. With volumeoverload, the RV becomes dilated, and the interventricularseptum is flattened in diastole, giving the appearance of“D” to the LV in the parasternal short axis view. This is calledthe “D-sign” (Figure 5B). Although such patients are hypo-tensive, empirically administering intravenous fluids causesfurther compromise of the LV cavity and reduced cardiacoutput.
Right Atrial PressureInferior vena cava (IVC) ultrasound is used to estimate
right atrial pressure (RAP) and get an idea of the resistanceto venous return. In patients who are spontaneously
A B
Figure 3. | Lung ultrasound technique. (A) The 28- and (B) eight-zone lung ultrasound scanning techniques. Lower panel demonstrates thetransducer position, which should be perpendicular to the chest wall, following its curvature to obtain optimal images. ICS, intercostal space.Human body photograph obtained from Shutterstock; photo credit, Albina Glisic. Illustration made using Biorender.
KIDNEY360 2: 1326–1338, August, 2021 POCUS-Assisted Volume Status Assessment, Argaiz et al. 1329

breathing, the IVC collapses during inspiration due to nega-tive intrathoracic pressure. An IVC diameter of#2.1 cm andcollapsibility of.50%with a sniff indicates normal RAP of 3mm Hg (0–5 mm Hg), an IVC diameter of .2.1 cm with,50% inspiratory collapse indicates high RAP of 15 mmHg (10–20 mm Hg), and scenarios in between correspond
to an intermediate value of 8mmHg (5–10mmHg) (35). Fig-ure 5, C and D, demonstrates sonographic images of largeand small IVC obtained from a patient with HF and volumedepletion, respectively. However, these cutoffs cannot beapplied in patients who are mechanically ventilated becausethe IVC is dilated at baseline due to positive pressure
Table 1. Summary of the basic echocardiographic views
FOCUS View Image Acquisition Structures Key Assessments Common Pathologies
PSLA Parasternal third to fifthintercostal space,
indicator to patient’sright shoulder
RV, LV, LA, LVOT, AV,MV, descending aorta
Visual assessment of LVEF
LV dysfunction,pericardial effusion,left-sided pleural
effusion posterior todescending aorta
PSSA Second to fourthintercostal space,
indicator to left shoulder
RV, LV, interventricularseptum
Visual assessment of LVEF and LV shape
LV dysfunction, septalflattening, or shiftindicative of RVdysfunction,
pericardial effusionApical Point of maximum
impulse, indicator to leftaxilla
RA, LA, RV, LV, LVOT,MV, TV
RV/LV comparison,color Doppler of
tricuspid and mitralvalves
RV failure, pericardialeffusion, valvular
regurgitation
SX Below the xiphoidprocess, indicator to
patient’s L
RA, LA, RV, LV Pericardium Pericardial effusion,LV dysfunction
Table includes the image acquisition, common structures, sonographic parameters, and pathologies assessed in each view. Note thatthis list of assessments/pathologies is not exhaustive, and each pathology can be seen in multiple views. FOCUS, focused cardiacultrasound; PSLA, parasternal long axis view; RV right ventricle; LV left ventricle; LA left atrium; LVOT, left ventricular outflow tract;AV aortic valve; MV mitral valve; EF, ejection fraction; PSSA, parasternal short axis view; RA, right atrium; TV, tricuspid valve; SXsubxiphoid view.
A
E
B
C
D
Figure 4. | Basic echocardiographic views. (A) Parasternal long axis; (B) parasternal short axis; (C) apical four-chamber; (D) subxiphoid; (E)inferior vena cava. Green arrows indicate the direction of the transducer orientation marker. IVC, inferior vena cava; LA, left atrium; LV,left ventricle; RA, right atrium; RV, right ventricle. Human body illustration obtained from Shutterstock; photo credit, Albina Glisic.
1330 KIDNEY360

ventilation and may not collapse at all during respiration.Although novice POCUS users are enthusiastic about IVCultrasound because it is relatively easy to learn, interpretingit in isolation is subject to numerous pitfalls. For example,small collapsible IVC is seen in normal state of health andequating it with volume depletion, without considering theclinical context, leads to unnecessary fluid administration.Moreover, the magnitude of the respiratory effort signifi-cantly affects collapsibility (for example, a frail elderlywoman versus amuscular youngman), altering the interpre-tation. Furthermore, technical factors—such as obesity,surgical dressings, increased intra-abdominal pressure, ormistaking aorta or dilated bowel for IVC—can result inerrors. Depending on how the ultrasound beam is aimed, itmay not depict the true diameter of the vessel. Notably, stud-ies demonstrate moderate to poor inter-rater agreementbetween IVC measurements (36,37). Although IVC is agood indicator of central venous pressure (CVP), it is not reli-able to assess fluid responsiveness (38). Therefore, IVC ultra-sound should be interpreted in conjunction with otherPOCUS findings and the overall clinical picture.Users with further training in Doppler echocardiography
assess additional parameters, such as cardiac output andits response to fluid administration, LV filling pressures,and right ventricular filling pressures at the bedside (39).
Venous DopplerOrgan dysfunction in HF is closely related to venous con-
gestion (40). CVP is the strongest hemodynamic determinant
for the development of worsening renal function in patientswith decompensated HF (41). Normal and abnormal pat-terns of flow in abdominal and central veins result from ret-rograde transmission of CVP (42). POCUS can enhance theclinical evaluation of venous congestion using venousDopp-ler in addition to IVC ultrasound (43,44). Figure 6 illustratesthe technique of obtaining the sonographic images ofhepatic, portal, and intrarenal veins.
Hepatic Vein DopplerBlood flow in the hepatic veins (HVs) is pulsatile, and
changes in its velocity reflect changes in RAP. The normalHV flow pattern consists of two antegrade waves (a largersystolic [S] and a smaller diastolic [D] wave correspondingto CVP “X” and “Y” descent, respectively) and one or tworetrograde waves (a larger “A” wave and smaller “V”wave corresponding to CVP “A” and “V” waves, respec-tively). Frequently, the V wave is not seen (Figure 7A) (26).Understanding the origin of hepatic flow waves aids inunderstanding commonpathologic alterations. For example,severe pulmonary hypertension can manifest as prominentA waves and/or decreased D wave amplitude because ofan increase in RV end-diastolic pressure (45). Systolic dys-function of theRVand tricuspid regurgitation (TR) both alterthe RAP during ventricular systole, leading to progressivedecrease in the peak velocity of the S wave (46). In addition,severe TR can cause S wave reversal (Figure 7B) (47). Thus,HV Doppler provides relevant information about the fillingpattern of the RA.
A B
C D
Figure 5. | Common findings on focused cardiac ultrasound. (A) Pericardial effusion (asterisk) surrounding the heart, seen from the subcostalwindow. (B) D-sign: interventricular septal flattening seen from the parasternal short axis view. (C) Plethoric IVC (arrow). (D) Small IVC (arrow).
KIDNEY360 2: 1326–1338, August, 2021 POCUS-Assisted Volume Status Assessment, Argaiz et al. 1331

Portal Vein DopplerAs opposed to HV flow, the splanchnic circulation is an
isolated vascular unit protected from the systemic circulationby the resistance of postsinusoidal sphincters (48). Thus, nor-mal portalflow is continuous or onlymildly pulsatile (Figure7A) (49). However, pathologic increases in RAP can be trans-mitted through liver sinusoids into the portal vein (Figure7B) (50). Portal vein pulsatility was originally described inpatients with severe TR (51), but has now been describedin multiple conditions associated with increased RAP(52,53). Increased pulsatility in portal venous flow has beenassociated with a higher N-terminal pro–brain natriureticpeptide (54), higher systolic pulmonary artery pressures(55), positive fluid balance (56), and RV dysfunction(56,57). Portal vein flow alterations can be quantified by thepulsatility fraction (100[(Vmax2Vmin)/Vmax]); a pulsatilityfraction $30% is considered mild, whereas $50% is consid-ered severely elevated (54).There are a few studies evaluating the relationship
between portal vein pulsatility and patient outcomes in thesetting of HF. In a landmark study by Beaubien-Souligny etal. (54), a portal vein pulsatility fraction of.50% and severealterations in intrarenal venous flow (IRVF) were associatedwith an increased risk of AKI in patients who underwentcardiac surgery. The inclusion of portal vein Doppler signif-icantly improved AKI risk prediction. Furthermore,alterations in portal vein flow have been associated withthe development of congestive hepatopathy (58), encepha-lopathy (59), and major complications in patients undergo-ing cardiac surgery (56), and may be a useful prognosticmarker in patients hospitalized for acute HF (60). Together,these data suggest that sonographic evaluation of portal
vein pulsatility could become a useful tool for the diagnosisand management of venous congestion. In our experience,increased portal vein pulsatility fraction associatedwith vol-umeoverloadoften improveswithdiuretic treatment (61,62).
Although a plethoric, noncollapsible IVC indicates venouscongestion, cautionmust be exercisedwhen interpreting it inpatients with cardiac conditions impeding venous return(chronic RV dysfunction/TR, RVmyocardial infarction, car-diac tamponade); these patients may be fluid responsivedespite IVC plethora (63). The evaluation of hemodynamicAKI in these conditions can be enhanced by assessing portalveinflow; increasedportal pulsatility is suggestiveof conges-tive AKI, which can potentially improve with decongestivetherapy (62). A case of portal vein flow normalization withdiuresis, even in the presence of persistent severe TR, is pre-sented in Figure 7C.
Portal venous flow cannot be relied upon in patients withcirrhosis because both absent pulsatility in the presence ofsevere congestion and increased pulsatility unrelated toRAP can occur (64–67). Occasionally, portal vein pulsatilitycan be seen in individuals who are thin and healthy (68).Given these limitations, portal vein pulsatility fractionshould not be interpreted in isolation. A recent study evalu-ating IVC size and hepatic, portal, and intrarenal veinDoppler flow patterns found increased specificity using thecombination of multiple POCUS markers to identify clini-cally significant venous congestion (69).
Intrarenal Venous DopplerSimilar to the portal vein, the flow pattern in intrarenal
(arcuate and interlobar) veins depends on the surroundingrenal parenchymal histology as much as right atrium
A B
Figure 6. Components of sonographic venous congestion assessment. | (A) IVC and hepatic veins (arrowheads) in long and transverse axes,visualized from the subxiphoid scan position. (B) Top shows the hepatic veins (arrowheads) and portal vein from the lateral scan planeobtained by placing the transducer along the anterior axillary line with the orientation marker facing supero-anteriorly. Bottom shows the colorDoppler image of the kidney obtained by placing the transducer along the midaxillary line with the orientation marker facing supero-posteriorly. Illustrations made using Biorender.
1332 KIDNEY360

function (70). Iida et al. (71) usedDoppler imaging to evaluateIRVF patterns in patients with HF. IRVF waveforms weredivided into three flow patterns: continuous, biphasic, andmonophasic (Figure 7D). The IRVF profile was altered byincreases in RAP, butwas not associatedwith changes in car-diac index. Themonophasic pattern was associated with sig-nificant TR. IRVF strongly correlated with clinical outcomes,including death from cardiovascular disease or unplannedhospitalization for HF. This correlation was independent ofRAP. Similar results were obtained by Puzzovivo and col-leagues (72).Supporting the role of IRVF alterations as a marker of
venous congestion, experimental fluid expansion worsenedthe IRVF pattern and correlated with less diuretic efficiencyin patients with HF with preserved ejection fraction (73). Arecent study in patients with pulmonary hypertension alsoshowed adverse outcomes were associated with IRVF alter-ations (74). Three patients from this study who developedsevere AKI with diuretic-resistant fluid overload andrequired RRT exhibited a monophasic IRVF pattern.Whereas HV Doppler mainly reflects the right atrium fill-
ing pattern, portal and intrarenal venous Doppler provideadditional information about right atrial filling pressureand its correlation with congestive organ injury (43).Whether interventions aimed at addressing abnormal organflow patterns can improve relevant outcomes in patientswith venous congestion remains unknown. Moreover, thecause-effect relationship between sonographic markers of
venous congestion and AKI remains elusive at this timeand must be evaluated by larger studies. POCUS alterationsthat occur in venous congestion are summarized in Figure 8.
Going Back to the CaseFOCUS revealed severely decreased LV ejection fraction
anddilatedRVwith significantly reduced function.Numerousbilateral B-lineswere present on LUS. IVCwas 2.4 cm in diam-eterwith no respiratoryvariation and therewere no significantascites (Figure 9A). These findings were compatible with HFwith reduced ejection fraction and severeRV failure, andmod-erate pulmonary congestion. To evaluate for the presence ofsystemic venous congestion, a bedside Doppler ultrasonogra-phy was performed. HV Doppler demonstrated decreased Dwave amplitude (seen in severe pulmonary hypertensionand abnormal RV relaxation), portal vein pulsatility fractionof 100%, and a monophasic IRVF (Figure 9B). Although a ple-thoric IVC was suggestive of venous congestion, the presenceof severeRVdysfunction and significant pulmonaryhyperten-sion makes it less reliable (can be chronically dilated) and thepatient might still be fluid responsive. However, both portaland IRVF patterns indicated that backward transmission ofRAP was significant enough to lead to abdominal organ con-gestion, suggesting congestive kidney injury.
Treatment and OutcomeGiven these findings, diuretic therapy was restarted with
dose intensification. On follow-up, the patient showed a
A
D
B CCVCVCV
A
YYYY XX
VVC CAA
AA
CVP
Hepatic
Portal
Normal
Not Congestive
Intra-renalvein
Moderate Congestive Severe Congestive
Continuous Biphasic Monophasic
Severe TRBefore Diuresis
Severe Tricuspid Regurgitation
PV
HV
After Diuresis
Vein(HV)
Vein(PV)
Figure 7. Venous congestion assessment using pulsed wave Doppler. | (A) Central venous pressure (CVP) waveform, hepatic vein (HV) andportal vein (PV) Doppler in a healthy person and (B) in a patient with severe biventricular failure, tricuspid regurgitation (TR), and venous con-gestion. HV flow mirrors changes in CVP waveform. Transmission of right atrial pressure to PV is only seen in the presence of severe venouscongestion. Arrows in figure 7B are used to show the correlation of the phases of cardiac cycle between HV and PV. (C) HV and PV Doppler ina patient with pulmonary arterial hypertension and severe TR before and after diuretic therapy. Note the improvement in PV pulsatility fractionwhile HV alterations from severe TR remained unchanged. (D) Intrarenal venous (IRV) flow alterations in venous congestion. Waveform abovethe baseline corresponds to intrarenal arterial flow, whereas the waveform below the baseline depicts intrarenal venous flow. D, diastolic; S,syst olic; A, atrial contraction.
KIDNEY360 2: 1326–1338, August, 2021 POCUS-Assisted Volume Status Assessment, Argaiz et al. 1333

steady decrease in weight (approximately 10 kg) and notice-able improvement in symptoms. Although his serum creati-nine worsened from 1.4 to 1.8 mg/dl initially, it improvedand stabilized at 0.6 mg/dl with continued diuresis.Follow-up POCUS evaluation of venous congestion showedmarkedly improvedflowpatterns onbothportal vein (pulsa-tility fraction532% ) and IRVF (biphasic pattern) (Figure 9C).
POCUS Education and Program DevelopmentDespite the stated advantages of POCUS and growing
interest among nephrologists to acquire this skill, training
opportunities remain sparse at this time. Workshops andshort courses organized by professional societies, such asthe National Kidney Foundation and the American Societyof Nephrology, provide an introduction to the techniqueand interpretation, but continued practice, preferably undersupervision, is vital to achieve mastery. Longitudinal curric-ula are shown to have a favorable effect on long-term skillretention (75,76); as such, integrating POCUS training intothe 2-year nephrology fellowship offers a conceivable advan-tage. Nevertheless, only a few nephrology programs cur-rently train their fellows beyond kidney ultrasound (77),the key problem being lack of trained faculty. We suggest
IVC
Not Congestive Severe Congestion
HepaticVein
Portal Vein
Intra-RenalVein
Figure 8. | Summary of POCUS alterations that occur in venous congestion. IVC size increases with an increase in RAP, and reaches its max-imum compliance after a certain point. HV waveform initially shows both systolic and diastolic components and, as the congestion worsens,the systolic component reverses, leaving only the diastolic wave below the baseline. By convention, above the baseline represents flow towardthe transducer, and below the baseline represents flow away from the transducer (toward the heart in this case). The normal portal vein wave-form is continuous and above the baseline. As the severity of congestion increases, it becomes pulsatile and flow reversal (below the baseline)is seen in systole, with further elevations in RAP. Normal intrarenal vein Doppler is similar to that of the portal vein, except that it is below thebaseline (flow away from the transducer). As the congestion worsens, it becomes increasingly pulsatile, leaving only the diastolic componentbelow the baseline in severe cases. Above the baseline tracing represents intrarenal arterial flow, which is helpful to identify systolic and dia-stolic phases.
A B C
Figure 9. | Case POCUS findings. (A) IVC, lung ultrasound (LUS), parasternal long axis (PLAx), and apical four-chamber (A4ch) views. (B)Venous Doppler obtained before restarting diuretics. (C) IVC and venous Doppler on follow-up after restarting diuretics. Ao, ascending aorta;B, B-line; IRV, intrarenal vein; PV, portal vein.
1334 KIDNEY360

that nephrologydivisions identify faculty interested in learn-ing/teaching POCUS and support them to pursue a struc-tured, multicomponent certification program such as theone offered by the American College of Chest Physicians(78). Thereafter, multispecialty collaboration at the institu-tional level, with specialties such as emergency medicineand radiology, facilitates organizing the curriculum, trainingmore faculty, and quality assurance. In addition, takingadvantage of the online POCUS educational tools built fornephrologists, such as NephroPOCUS.com, minimizes theneed to create newdidacticmaterial by individual fellowshipprograms. Furthermore, forming an expert panel and put-ting forward consensus guidelines by nephrology profes-sional organizations would help standardize POCUStraining.
ConclusionPhysical examination is limited in determination of fluid
status. Augmented examination using POCUS is gainingpopularity as a noninvasive bedside tool that provides adetailed insight into cardiovascular physiology and hemo-dynamic determinants of fluid status. Evaluation of cardiacfunction by FOCUS, pulmonary congestion by LUS, and sys-temic venous congestion by abdominal venous Doppler canguide management by providing information on fluid toler-ance and responsiveness. Thorough multiorgan assessmentshould be undertaken to offset the limitations of individualPOCUS applications. Integrating POCUS findings with clin-ical and laboratory data allows decisions regarding crystal-loid administration or diuresis to be tailored according tothe individual physiology with a risk-benefit analysis ofthe preferred therapeutic strategy. Further studies areneeded todeterminewhethermanagement guided byabnor-malities detected on POCUS translates to improved clinicaloutcomes. On a note of caution, POCUS is not a replacementto clinical judgment and is susceptible to limitations like anyother technology. Improper technique,wrong interpretation,and over-reliance on an isolated finding can potentially leadtomismanagement of the patient. Therefore, the nephrologycommunity should focus on developing POCUS trainingstandards anda robust certificationprocess to ensure quality.
DisclosuresAll autho rs have nothing to disclose.
FundingNone.
Author ContributionsE. R. Argaiz, A. Koratala, and N. Reisinger conceptualized the
study, wrote the original draft, and reviewed and edited the manu-script; and A. Koratala provided supervision.
References1. Torino C, Gargani L, Sicari R, Letachowicz K, Ekart R, Fliser D,
Covic A, Siamopoulos K, Stavroulopoulos A, Massy ZA, Fiacca-dori E, Caiazza A, Bachelet T, Slotki I, Martinez-Castelao A,Coudert-Krier MJ, Rossignol P, Gueler F, Hannedouche T, Pani-chi V, Wiecek A, Pontoriero G, Sarafidis P, Klinger M, Hojs R,Seiler-Mussler S, Lizzi F, Siriopol D, Balafa O, Shavit L, Tripepi R,Mallamaci F, Tripepi G, Picano E, London GM, Zoccali C: The
agreement between auscultation and lung ultrasound in hemo-dialysis patients: The LUST study. Clin J Am Soc Nephrol 11:2005–2011, 2016 https://doi.org/10.2215/CJN.03890416
2. Maw AM, Hassanin A, Ho PM, McInnes MDF, Moss A, Juarez-Colunga E, Soni NJ, Miglioranza MH, Platz E, DeSanto K, SertichAP, Salame G, Daugherty SL: Diagnostic accuracy of point-of-care lung ultrasonography and chest radiography in adults withsymptoms suggestive of acute decompensated heart failure: Asystematic review and meta-analysis. JAMA Netw Open 2:e190703, 2019 https://doi.org/10.1001/jamanetworkopen.2019.0703
3. Goetze JP, Bruneau BG, Ramos HR, Ogawa T, de Bold MK, deBold AJ: Cardiac natriuretic peptides. Nat Rev Cardiol 17: 698–717, 2020 https://doi.org/10.1038/s41569-020-0381-0
4. Binanay C, Califf RM, Hasselblad V, O’Connor CM, Shah MR,Sopko G, Stevenson LW, Francis GS, Leier CV, Miller LW;ESCAPE Investigators and ESCAPE Study Coordinators: Evalua-tion study of congestive heart failure and pulmonary arterycatheterization effectiveness: The ESCAPE trial. JAMA 294:1625–1633, 2005 https://doi.org/10.1001/jama.294.13.1625
5. Moore CL, Copel JA: Point-of-care ultrasonography.N Engl J Med364: 749–757, 2011 https://doi.org/10.1056/NEJMra0909487
6. Solomon SD, Saldana F: Point-of-care ultrasound in medicaleducation–stop listening and look. N Engl J Med 370: 1083–1085, 2014 https://doi.org/10.1056/NEJMp1311944
7. Vieillard-Baron A, Millington SJ, Sanfilippo F, Chew M, Diaz-Gomez J, McLean A, Pinsky MR, Pulido J, Mayo P, Fletcher N: Adecade of progress in critical care echocardiography: A narrativereview [published correction appears in Intensive Care Med 45:911, 2019]. Intensive Care Med 45: 770–788, 2019 https://doi.org/10.1007/s00134-019-05604-2
8. Marbach JA, Almufleh A, Di Santo P, Jung R, Simard T, McInnesM, Salameh JP, McGrath TA, Millington SJ, Diemer G, West FM,Domecq MC, Hibbert B: Comparative accuracy of focused car-diac ultrasonography and clinical examination for left ventriculardysfunction and valvular heart disease: A systematic review andmeta-analysis. Ann Intern Med 171: 264–272, 2019 https://doi.org/10.7326/M19-1337
9. Lichtenstein D, Goldstein I, Mourgeon E, Cluzel P, Grenier P,Rouby JJ: Comparative diagnostic performances of auscultation,chest radiography, and lung ultrasonography in acute respiratorydistress syndrome. Anesthesiology 100: 9–15, 2004 https://doi.org/10.1097/00000542-200401000-00006
10. Cox EGM, Koster G, Baron A, Kaufmann T, Eck RJ, Veenstra TC,Hiemstra B, Wong A, Kwee TC, Tulleken JE, Keus F, Wiersema R,van der Horst ICC; SICS Study Group: Should the ultrasoundprobe replace your stethoscope? A SICS-I sub-study comparinglung ultrasound and pulmonary auscultation in the critically ill.Crit Care 24: 14, 2020 https://doi.org/10.1186/s13054-019-2719-8
11. Panoulas VF, Daigeler AL, Malaweera AS, Lota AS, Baskaran D,Rahman S, Nihoyannopoulos P: Pocket-size hand-held cardiacultrasound as an adjunct to clinical examination in the hands ofmedical students and junior doctors. Eur Heart J CardiovascImaging 14: 323–330, 2013 https://doi.org/10.1093/ehjci/jes140
12. Di Bello V, La Carrubba S, Conte L, Fabiani I, Posteraro A,Antonini-Canterin F, Barletta V, Nicastro I, Mariotti E, Severino S,Caso P, Benedetto F, Savino K, Carerj S; SIEC (Italian Society ofCardiovascular Echography): Incremental value of pocket-sizedechocardiography in addition to physical examination duringinpatient cardiology evaluation: A multicenter Italian study(SIEC). Echocardiography 32: 1463–1470, 2015 https://doi.org/10.1111/echo.12910
13. Koratala A, Kazory A: Point of care ultrasonography for objectiveassessment of heart failure: Integration of cardiac, vascular, andextravascular determinants of volume status. Cardiorenal Med11: 5–17, 2021 https://doi.org/10.1159/000510732
14. Picano E, Scali MC, Ciampi Q, Lichtenstein D: Lung ultrasoundfor the cardiologist. JACC Cardiovasc Imaging 11: 1692–1705,2018 https://doi.org/10.1016/j.jcmg.2018.06.023
15. Gargani L, Sicari R, Raciti M, Serasini L, Passera M, Torino C,Letachowicz K, Ekart R, Fliser D, Covic A, Balafa O, Stavroulo-poulos A, Massy ZA, Fiaccadori E, Caiazza A, Bachelet T, Slotki I,Shavit L, Martinez-Castelao A, Coudert-Krier MJ, Rossignol P,Kraemer TD, Hannedouche T, Panichi V, Wiecek A, Pontoriero
KIDNEY360 2: 1326–1338, August, 2021 POCUS-Assisted Volume Status Assessment, Argaiz et al. 1335

G, Sarafidis P, Klinger M, Hojs R, Seiler-Mußler S, Lizzi F, Ono-friescu M, Zarzoulas F, Tripepi R, Mallamaci F, Tripepi G, PicanoE, London GM, Zoccali C: Efficacy of a remote web-based lungultrasound training for nephrologists and cardiologists: A LUSTtrial sub-project. Nephrol Dial Transplant 31: 1982–1988, 2016https://doi.org/10.1093/ndt/gfw329
16. Volpicelli G, Elbarbary M, Blaivas M, Lichtenstein DA, Mathis G,Kirkpatrick AW,Melniker L, Gargani L, Noble VE, Via G, Dean A,Tsung JW, Soldati G, Copetti R, Bouhemad B, Reissig A, AgricolaE, Rouby JJ, Arbelot C, Liteplo A, Sargsyan A, Silva F, HoppmannR, Breitkreutz R, Seibel A, Neri L, Storti E, Petrovic T; Interna-tional Liaison Committee on Lung Ultrasound (ILC-LUS) forInternational Consensus Conference on Lung Ultrasound (ICC-LUS): International evidence-based recommendations for point-of-care lung ultrasound. Intensive Care Med 38: 577–591, 2012https://doi.org/10.1007/s00134-012-2513-4
17. Gargani L, Volpicelli G: How I do it: Lung ultrasound. CardiovascUltrasound 12: 25, 2014 https://doi.org/10.1186/1476-7120-12-25
18. Torino C, Tripepi R, Loutradis C, Sarafidis P, Tripepi G, Malla-maci F, Zoccali C: Can the assessment of ultrasound lung water inhaemodialysis patients be simplified? [published online ahead ofprint December 29, 2020]. Nephrol Dial Transplant 2020 10.1093/ndt/gfaa285
19. Hubert A, Girerd N, Le Breton H, Galli E, Latar I, Fournet M,Mabo P, Schnell F, Leclercq C, Donal E: Diagnostic accuracy oflung ultrasound for identification of elevated left ventricular fill-ing pressure. Int J Cardiol 281: 62–68, 2019 https://doi.org/10.1016/j.ijcard.2019.01.055
20. Zoccali C, Torino C, Tripepi R, Tripepi G, D’Arrigo G, PostorinoM, Gargani L, Sicari R, Picano E, Mallamaci F; Lung US in CKDWorking Group: Pulmonary congestion predicts cardiac eventsand mortality in ESRD. J Am Soc Nephrol 24: 639–646, 2013https://doi.org/10.1681/ASN.2012100990
21. Coiro S, Rossignol P, Ambrosio G, Carluccio E, Alunni G, Mur-rone A, Tritto I, Zannad F, Girerd N: Prognostic value of residualpulmonary congestion at discharge assessed by lung ultrasoundimaging in heart failure. Eur J Heart Fail 17: 1172–1181, 2015https://doi.org/10.1002/ejhf.344
22. Platz E, Campbell RT, Claggett B, Lewis EF, Groarke JD, DochertyKF, Lee MMY, Merz AA, Silverman M, Swamy V, Lindner M,Rivero J, Solomon SD, McMurray JJV: Lung ultrasound in acuteheart failure: Prevalence of pulmonary congestion and short- andlong-term outcomes. JACC Heart Fail 7: 849–858, 2019 https://doi.org/10.1016/j.jchf.2019.07.008
23. Platz E, Lewis EF, Uno H, Peck J, Pivetta E, Merz AA, Hempel D,Wilson C, Frasure SE, Jhund PS, Cheng S, Solomon SD: Detectionand prognostic value of pulmonary congestion by lung ultra-sound in ambulatory heart failure patients. Eur Heart J 37: 1244–1251, 2016 https://doi.org/10.1093/eurheartj/ehv745
24. Koratala A, Chamarthi G, Kazory A: Point-of-care ultrasonogra-phy for objective volume management in end-stage renal dis-ease. Blood Purif 49: 132–136, 2020 https://doi.org/10.1159/000503000
25. Jiang C, Patel S, Moses A, DeVita MV, Michelis MF: Use of lungultrasonography to determine the accuracy of clinically esti-mated dry weight in chronic hemodialysis patients. Int UrolNephrol 49: 2223–2230, 2017 https://doi.org/10.1007/s11255-017-1709-5
26. Noble VE, Murray AF, Capp R, Sylvia-Reardon MH, Steele DJR,Liteplo A: Ultrasound assessment for extravascular lung water inpatients undergoing hemodialysis. Time course for resolution.Chest 135: 1433–1439, 2009 https://doi.org/10.1378/chest.08-1811
27. Arun Thomas ET, Mohandas MK, George J: Comparison betweenclinical judgment and integrated lung and inferior vena cavaultrasonography for dry weight estimation in hemodialysispatients. Hemodial Int 23: 494–503, 2019 https://doi.org/10.1111/hdi.12762
28. Loutradis C, Sarafidis PA, Ekart R, Papadopoulos C, SachpekidisV, Alexandrou ME, Papadopoulou D, Efstratiadis G, PapagianniA, London G, Zoccali C: The effect of dry-weight reductionguided by lung ultrasound on ambulatory blood pressure inhemodialysis patients: A randomized controlled trial. Kidney Int
95: 1505–1513, 2019 https://doi.org/10.1016/j.kint.2019.02.018
29. Cortellaro F, Ceriani E, Spinelli M, Campanella C, Bossi I,Coen D, Casazza G, Cogliati C: Lung ultrasound formonitoring cardiogenic pulmonary edema. Intern EmergMed 12: 1011–1017, 2017 https://doi.org/10.1007/s11739-016-1510-y
30. Rivas-Lasarte M, �Alvarez-Garc�ıa J, Fern�andez-Mart�ınez J, Mae-stro A, L�opez-L�opez L, Sol�e-Gonz�alez E, Pirla MJ, Mesado N,Mirabet S, Fluvi�a P, Brossa V, Sionis A, Roig E, Cinca J: Lungultrasound-guided treatment in ambulatory patients with heartfailure: A randomized controlled clinical trial (LUS-HF study).Eur J Heart Fail 21: 1605–1613, 2019 https://doi.org/10.1002/ejhf.1604
31. Lung Water by Ultrasound Guided Treatment in HemodialysisPatients (The Lust Study), 2014. Available at: Https://clinicaltrials.gov/show/nct02310061. Accessed June 14, 2021
32. Cardenas-Garcia J, Mayo PH: Bedside ultrasonography for theintensivist. Crit Care Clin 31: 43–66, 2015 https://doi.org/10.1016/j.ccc.2014.08.003
33. Labovitz AJ, Noble VE, Bierig M, Goldstein SA, Jones R, Kort S,Porter TR, Spencer KT, Tayal VS, Wei K: Focused cardiac ultra-sound in the emergent setting: A consensus statement of theAmerican Society of Echocardiography and American College ofEmergency Physicians. J Am Soc Echocardiogr 23: 1225–1230,2010 https://doi.org/10.1016/j.echo.2010.10.005
34. P�erez-Casares A, Cesar S, Brunet-Garcia L, Sanchez-de-Toledo J:Echocardiographic evaluation of pericardial effusion and cardiactamponade. Front Pediatr 5: 79, 2017 https://doi.org/10.3389/fped.2017.00079
35. Rudski LG, Lai WW, Afilalo J, Hua L, Handschumacher MD,Chandrasekaran K, Solomon SD, Louie EK, Schiller NB: Guide-lines for the echocardiographic assessment of the right heart inadults: A report from the American Society of Echocardiographyendorsed by the European Association of Echocardiography, aregistered branch of the European Society of Cardiology, and theCanadian Society of Echocardiography. J Am Soc Echocardiogr23: 685–713, quiz 786–788, 2010 https://doi.org/10.1016/j.echo.2010.05.010
36. Bowra J, Uwagboe V, Goudie A, Reid C, Gillett M: Interrateragreement between expert and novice in measuring inferior venacava diameter and collapsibility index. Emerg Med Australas 27:295–299, 2015 https://doi.org/10.1111/1742-6723.12417
37. Akkaya A, Yesilaras M, Aksay E, Sever M, Atilla OD: The inter-rater reliability of ultrasound imaging of the inferior vena cavaperformed by emergency residents. Am J Emerg Med 31: 1509–1511, 2013 https://doi.org/10.1016/j.ajem.2013.07.006
38. Kory P: COUNTERPOINT: Should acute fluid resuscitation beguided primarily by inferior vena cava ultrasound for patients inshock? No. Chest 151: 533–536, 2017 https://doi.org/10.1016/j.chest.2016.11.017
39. Koratala A: Utilizing point-of-care ultrasound in the cardiorenalclinic to enhance patient care. J Bras Nefrol 43: 135–136, 202110.1590/2175-8239-JBN-2020-0234
40. Rosenkranz S, Howard LS, Gomberg-Maitland M, Hoeper MM:Systemic consequences of pulmonary hypertension and right-sided heart failure. Circulation 141: 678–693, 2020 https://doi.org/10.1161/CIRCULATIONAHA.116.022362
41. Mullens W, Abrahams Z, Francis GS, Sokos G, Taylor DO,Starling RC, Young JB, Tang WHW: Importance of venous con-gestion for worsening of renal function in advanced decompen-sated heart failure. J Am Coll Cardiol 53: 589–596, 2009 https://doi.org/10.1016/j.jacc.2008.05.068
42. Smith HJ, Grøttum P, Simonsen S: Ultrasonic assessment ofabdominal venous return. I. Effect of cardiac action and respira-tion on mean velocity pattern, cross-sectional area and flow inthe inferior vena cava and portal vein. Acta Radiol Diagn(Stockh) 26: 581–588, 1985 https://doi.org/10.1177/028418518502600514
43. Tang WHW, Kitai T: Intrarenal venous flow: A window into thecongestive kidney failure phenotype of heart failure? JACC HeartFail 4: 683–686, 2016 https://doi.org/10.1016/j.jchf.2016.05.009
44. Reynolds T, Appleton CP: Doppler flow velocity patterns of thesuperior vena cava, inferior vena cava, hepatic vein, coronary
1336 KIDNEY360

sinus, and atrial septal defect: A guide for the echocardiographer.J Am Soc Echocardiogr 4: 503–512, 1991 https://doi.org/10.1016/S0894-7317(14)80386-6
45. Zhang A, Himura Y, Kumada T, Hayashida W, Ishikawa N, NodaM, Kohno F, Kambayashi M, Kawai C: The characteristics ofhepatic venous flow velocity pattern in patients with pulmonaryhypertension by pulsed Doppler echocardiography. Jpn Circ J 56:317–324, 1992 https://doi.org/10.1253/jcj.56.317
46. Wranne B, Pinto FJ, Hammarstr€om E, St Goar FG, Puryear J, PoppRL: Abnormal right heart filling after cardiac surgery: Time courseand mechanisms. Br Heart J 66: 435–442, 1991 https://doi.org/10.1136/hrt.66.6.435
47. Shapira Y, Porter A, Wurzel M, Vaturi M, Sagie A: Evaluation oftricuspid regurgitation severity: Echocardiographic and clinicalcorrelation. J Am Soc Echocardiogr 11: 652–659, 1998 https://doi.org/10.1016/S0894-7317(98)70042-2
48. Mitzner W: Hepatic outflow resistance, sinusoid pressure, andthe vascular waterfall. Am J Physiol 227: 513–519, 1974 https://doi.org/10.1152/ajplegacy.1974.227.3.513
49. Taylor KJW, Burns PN: Duplex Doppler scanning in the pelvisand abdomen. Ultrasound Med Biol 11: 643–658, 1985 https://doi.org/10.1016/0301-5629(85)90036-5
50. Greenway CV, Lautt WW: Distensibility of hepatic venousresistance sites and consequences on portal pressure. Am JPhysiol 254: H452–H428, 1988 https://doi.org/10.1152/ajpheart.1988.254.3.H452
51. Abu-Yousef MM, Milam SG, Farner RM: Pulsatile portal veinflow: A sign of tricuspid regurgitation on duplex Dopplersonography. AJR Am J Roentgenol 155: 785–788, 1990 https://doi.org/10.2214/ajr.155.4.2119108
52. Catalano D, Caruso G, DiFazzio S, Carpinteri G, Scalisi N, Tro-vato GM: Portal vein pulsatility ratio and heart failure. J ClinUltrasound 26: 27–31, 1998 https://doi.org/10.1002/(SICI)1097-0096(199801)26:1,27::AID-JCU6.3.0.CO;2-L
53. Shih CY, Yang SS, Hu JT, Lin CL, Lai YC, Chang CW: Portal veinpulsatility index is a more important indicator than congestionindex in the clinical evaluation of right heart function. World JGastroenterol 12: 768–771, 2006 https://doi.org/10.3748/wjg.v12.i5.768
54. Beaubien-Souligny W, Benkreira A, Robillard P, BouabdallaouiN, Chass�e M, Desjardins G, Lamarche Y, White M, Bouchard J,Denault A: Alterations in portal vein flow and intrarenal venousflow are associated with acute kidney injury after cardiac surgery:A prospective observational cohort study. J Am Heart Assoc 7:e009961, 2018 https://doi.org/10.1161/JAHA.118.009961
55. Beaubien-SoulignyW, Rh�eaumeM, Blondin MC, El-BarnachawyS, Fortier A, �Ethier J, Legault L, Denault AY: A simplified approachto extravascular lung water assessment using point-of-careultrasound in patients with end-stage chronic renal failureundergoing hemodialysis. Blood Purif 45: 79–87, 2018 https://doi.org/10.1159/000481768
56. Eljaiek R, Cavayas YA, Rodrigue E, Desjardins G, Lamarche Y,Toupin F, Denault AY, Beaubien-SoulignyW: High postoperativeportal venous flow pulsatility indicates right ventricular dys-function and predicts complications in cardiac surgery patients.Br J Anaesth 122: 206–214, 2019 https://doi.org/10.1016/j.bja.2018.09.028
57. Singh NG, Kumar KN, Nagaraja PS, Manjunatha N: Portal venouspulsatility fraction, a novel transesophageal echocardiographicmarker for right ventricular dysfunction in cardiac surgicalpatients. Ann Card Anaesth 23: 39–42, 2020 https://doi.org/10.4103/aca.ACA_250_18
58. Styczynski G, Milewska A, Marczewska M, Sobieraj P, Sobc-zynska M, Dabrowski M, Kuch-Wocial A, Szmigielski C:Echocardiographic correlates of abnormal liver tests in patientswith exacerbation of chronic heart failure. J Am Soc Echocar-diogr 29: 132–139, 2016 https://doi.org/10.1016/j.echo.2015.09.012
59. Benkreira A, Beaubien-Souligny W, Mailhot T, Bouabdallaoui N,Robillard P, Desjardins G, Lamarche Y, Cossette S, Denault A:Portal hypertension is associated with congestive encephalopa-thy and delirium after cardiac surgery. Can J Cardiol 35: 1134–1141, 2019 https://doi.org/10.1016/j.cjca.2019.04.006
60. Kuwahara N, Honjo T, Kaihotsu K, Kamemura K, Nakayama K,Imanishi J, Sone N, Iwahashi M: The clinical impact of portal vein
pulsatility on the prognosis of hospitalized acute heart failurepatients. J Am Coll Cardiol 75: 940, 2020 https://doi.org/10.1016/S0735-1097(20)31567-9
61. Singh S, Koratala A: Utility of Doppler ultrasound derived hepaticand portal venous waveforms in the management of heart failureexacerbation. Clin Case Rep 8: 1489–1493, 2020 https://doi.org/10.1002/ccr3.2908
62. Argaiz ER, Rola P, Gamba G: Dynamic changes in portalvein flow during decongestion in patients with heart failureand cardio-renal syndrome: A POCUS case series. Cardi-orenal Med 11: 59–66, 2021 https://doi.org/10.1159/000511714
63. Via G, Tavazzi G, Price S: Ten situations where inferior venacava ultrasound may fail to accurately predict fluid respon-siveness: A physiologically based point of view. Intensive CareMed 42: 1164–1167, 2016 https://doi.org/10.1007/s00134-016-4357-9
64. Loperfido F, Lombardo A, Amico CM, Vigna C, Testa M, Rossi E,Costalunga A, Pennestri F, Biasucci LM: Doppler analysis ofportal vein flow in tricuspid regurgitation. J Heart Valve Dis 2:174–182, 1993
65. Baikpour M, Ozturk A, Dhyani M, Mercaldo ND, Pierce TT,Grajo JR, Samir AE: Portal venous pulsatility index: A novelbiomarker for diagnosis of high-risk nonalcoholic fatty liver dis-ease. AJR Am J Roentgenol 214: 786–791, 2020 https://doi.org/10.2214/AJR.19.21963
66. Gorka W, Gorka TS, Lewall DB: Doppler ultrasound evaluationof advanced portal vein pulsatility in patients with normalechocardiograms. Eur J Ultrasound 8: 119–123, 1998 https://doi.org/10.1016/S0929-8266(98)00060-3
67. Wachsberg RH, Needleman L, Wilson DJ: Portal vein pulsatilityin normal and cirrhotic adults without cardiac disease. J ClinUltrasound 23: 3–15, 1995 https://doi.org/10.1002/jcu.1870230103
68. Gallix BP, Taourel P, Dauzat M, Bruel JM, Lafortune M: Flowpulsatility in the portal venous system: A study of Dopplersonography in healthy adults. AJR Am J Roentgenol 169: 141–144, 1997 https://doi.org/10.2214/ajr.169.1.9207514
69. Beaubien-SoulignyW, Rola P, Haycock K, Bouchard J, LamarcheY, Spiegel R, Denault AY: Quantifying systemic congestion withPoint-Of-Care ultrasound: Development of the venous excessultrasound grading system. Ultrasound J 12: 16, 2020 https://doi.org/10.1186/s13089-020-00163-w
70. Jeong SH, Jung DC, Kim SH, Kim SH: Renal venous Dopplerultrasonography in normal subjects and patients with diabeticnephropathy: Value of venous impedance index measurements. JClin Ultrasound 39: 512–518, 2011 https://doi.org/10.1002/jcu.20835
71. Iida N, Seo Y, Sai S, Machino-Ohtsuka T, Yamamoto M, Ishizu T,Kawakami Y, Aonuma K: Clinical implications of intrarenalhemodynamic evaluation by doppler ultrasonography in heartfailure. JACC Heart Fail 4: 674–682, 2016 https://doi.org/10.1016/j.jchf.2016.03.016
72. Puzzovivo A, Monitillo F, Guida P, Leone M, Rizzo C, Grande D,Ciccone MM, Iacoviello M: Renal venous pattern: A newparameter for predicting prognosis in heart failure outpatients. JCardiovasc Dev Dis 5: 52, 2018 https://doi.org/10.3390/jcdd5040052
73. Nijst P, Martens P, Dupont M, Tang WHW, Mullens W: Intrare-nal flow alterations during transition from euvolemia to intra-vascular volume expansion in heart failure patients. JACC HeartFail 5: 672–681, 2017 https://doi.org/10.1016/j.jchf.2017.05.006
74. Husain-Syed F, Birk HW, Ronco C, Sch€ormann T, Tello K,Richter MJ, Wilhelm J, Sommer N, Steyerberg E, Bauer P,Walmrath HD, Seeger W, McCullough PA, Gall H, Ghofrani HA:Doppler-derived renal venous stasis index in the prognosis ofright heart failure. J Am Heart Assoc 8: e013584, 2019 https://doi.org/10.1161/JAHA.119.013584
75. Kelm DJ, Ratelle JT, Azeem N, Bonnes SL, Halvorsen AJ, Oxen-tenko AS, Bhagra A: Longitudinal ultrasound curriculumimproves long-term retention among internal medicine residents.J Grad Med Educ 7: 454–457, 2015 https://doi.org/10.4300/JGME-14-00284.1
KIDNEY360 2: 1326–1338, August, 2021 POCUS-Assisted Volume Status Assessment, Argaiz et al. 1337

76. Hempel D, Stenger T, Campo Dell’ Orto M, Stenger D, Seibel A,R€ohrig S, Heringer F, Walcher F, Breitkreutz R: Analysis oftrainees’ memory after classroom presentations of didacticalultrasound courses. Crit Ultrasound J 6: 10, 2014 https://doi.org/10.1186/2036-7902-6-10
77. Koratala A, Segal MS, Kazory A: Integrating point-of-care ultra-sonography into nephrology fellowship training: A model cur-riculum. Am J Kidney Dis 74: 1–5, 2019 https://doi.org/10.1053/j.ajkd.2019.02.002
78. American College of Chest Physicians: Point-of-care ultra-sound certification program. Available at: https://www.chestnet.org/Education/Advanced-Clinical-Training/Certificate-of-Completion-Program/SHM-COC. AccessedMarch 29. 2021
Received October 30, 2020 Accepted May 26, 2021
1338 KIDNEY360