ret summer internship program unt, 2009 funded by nsf grants: nsf iis-0844342 dlr 0431818, ci-team...
TRANSCRIPT

Wireless Sensor Networking
RET Summer Internship Program UNT, 2009 Funded by NSF Grants:
NSF IIS-0844342DLR 0431818,
CI-TEAM 0636421, CRI 0709285
Dawn ChegwiddenSharon Wood

IntroductionWireless Sensor Network (WSN) technology has a broad range of present and
future applications for monitoring environmental conditions in the field. Applications may include water quality, soil moisture, rain events, medical
monitoring, sprinkler systems, agriculture, and volcanic activity [1],[4],The advantages of these WSN systems are that they can be set up in the field
and remotely monitored from a laptop or office computer. A working system is cost effective and should require only periodic maintenance.Some potential problems that need to be considered when deploying a WSN
system include vegetation humidity, temperature, weather, and topographyEnvironmental conditions affect the sensor networks thus affecting robustness of
the network system overall Some of the sensor issues when deploying the WSN in the field are: receiver
signal strength (RSS), packet receiver rate (PRR), battery power and hopping distance between nodes. [4]

Distance Effects on Received Signal Strength(RSS) and Packet Receiver Rate (PRR)
Our research will take place at two sites: (1) Discovery Park and (2) Pecan Creek Wastewater Treatment Facility
Due to the importance of WSN and PRR in the design and implementation of a WSN in the field, our research will focus on: How does distance between motes affect RSS and PRR?How does topology effect the RSS and PRR? Does temperature and humidity affect the RSS and/or PRR?

Receiver Signal Strength (RSS)Receiver signal strength is important in WSN deploymentRSS is a measure of the received radio frequency (RF) signalRF sensitivity is represented by the lowest RSS signal that retrieves complete data
from a neighboring nodeField tests are necessary to determine the “best” range for sensor topologyEnvironmental habitats vary in topography and vegetationThis can present a problem when deploying nodes in the fieldTherefore, an evaluation of the relationship between RSS ,PRR and distance can
help determine the placement of nodes in the field.

Packet Receiver Rate (PRR)Packet receiver rate is an indicator of the % data received from a neighboring node.The % of data being received is related to the RSS and the distance between
sensor nodes.Data retrieval is critical in maintaining a workable WSN system If transmission strength is weak then the PRR will decrease and data could be lost
and energy consumption will be higher due to re-transmissionThe goal is to find a balance between RSS, PRR, and distance so that data retrieval
is close to 100%

Our Wireless Sensor TechnologyWireless sensors are small and compact. They contain a data acquisition board (small
computer) and sensor boardThe sensor board contains various sensors for
measuring temperature, humidity, RSS, PRR, and battery voltage
Panasonic Alkaline Plus AA batteries were used to power the sensors in the field
Solar panels have been used to extend battery life though they were not used in this experiment
With duty cycling, the sensor alternates between an awake and sleep period which can extend the life of the sensor’s batteries.
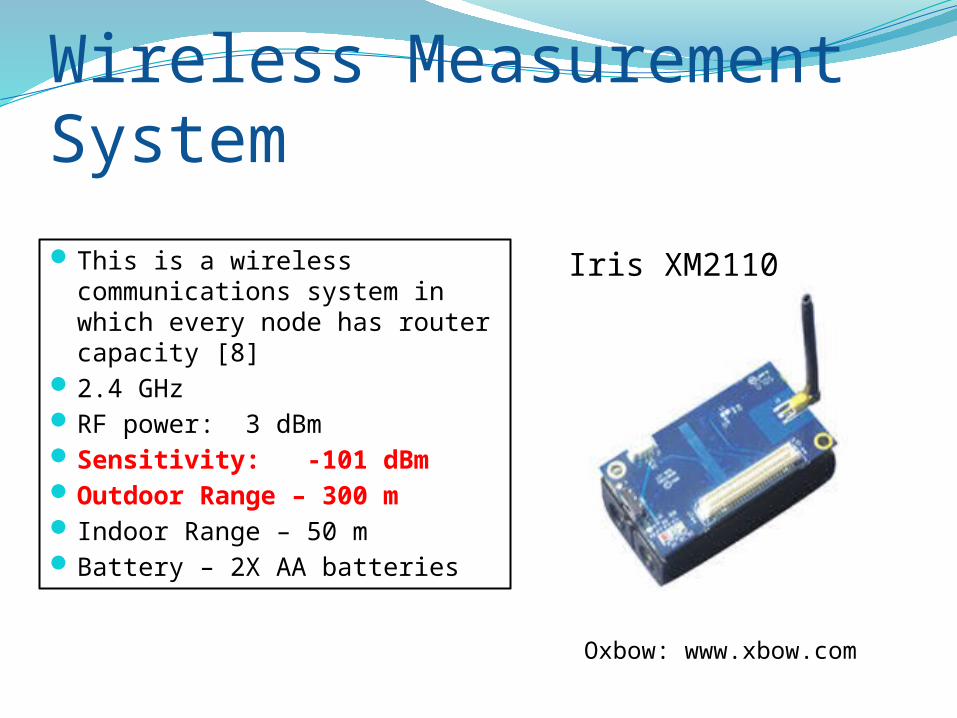
Wireless Measurement System
This is a wireless communications system in which every node has router capacity [8]
2.4 GHzRF power: 3 dBmSensitivity: -101 dBmOutdoor Range – 300 m Indoor Range – 50 mBattery – 2X AA batteries
Iris XM2110
Oxbow: www.xbow.com

WSN Sensor Mote: Data Acquisition BoardFeatures: MDA 300
A multi-functional board with temperature and humidity sensor
It is designed to be used as the primary interface between iris board and external sensors
It can be used for environmental and habitat monitoring such as humidity, temperature, and soil moisture. [8]
Crossbow: www.xbow.com
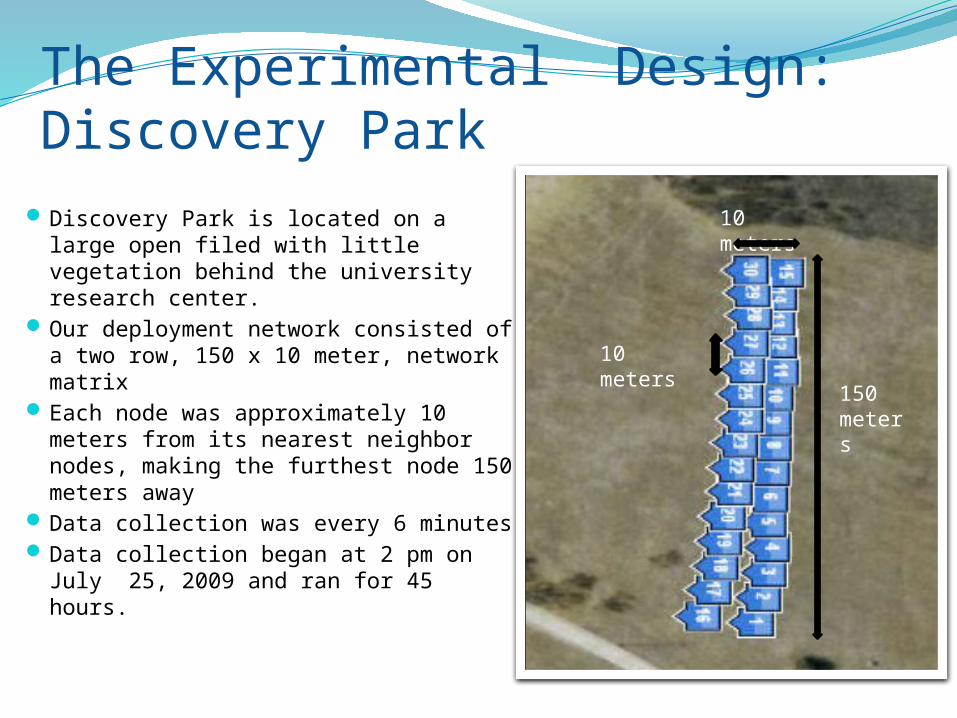
The Experimental Design: Discovery ParkDiscovery Park is located on a large open filed
with little vegetation behind the university research center.
Our deployment network consisted of a two row, 150 x 10 meter, network matrix
Each node was approximately 10 meters from its nearest neighbor nodes, making the furthest node 150 meters away
Data collection was every 6 minutesData collection began at 2 pm on July 25, 2009
and ran for 45 hours.
10 meters
10 meters
150 meters

Discovery Park WSN Deployment Pictures
•WSN nodes were deployed in two rows of 15 •10 meters apart and 10 meters across.
•Nodes were set out July 24th•Due to a “bug” in the program, nodes were brought back in on July 25thafter 12:00 noon•They were re-programmed and then deployed on July 26, at 2 pm

Experimental Design- Discovery Park
15 14 13 12 11 10 9 8 7 6 5 4 3 2 1
30*
29* 28 27 26 25 24 23
*22* 21 20 19 18 17 16
*
non-transparent lid,
transparent lid,
*Experimental data was retrieved and analyzed from nodes 16,22, 23, 29 and 30
Slide adapted with permission from Laura De Lemos
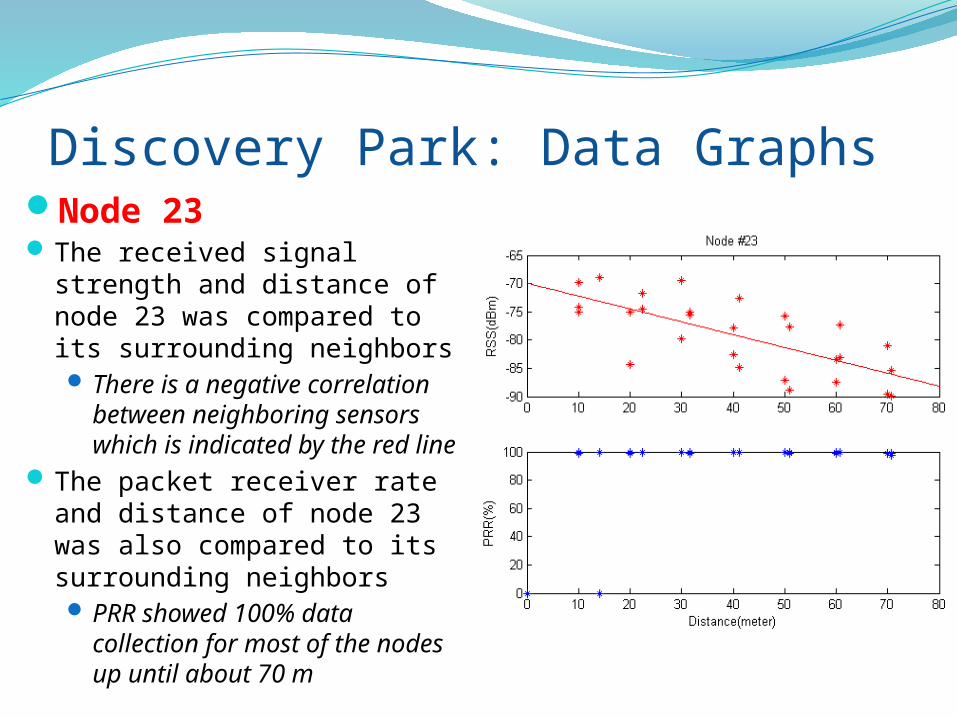
Discovery Park: Data GraphsNode 23The received signal strength and distance
of node 23 was compared to its surrounding neighbors There is a negative correlation between
neighboring sensors which is indicated by the red line
The packet receiver rate and distance of node 23 was also compared to its surrounding neighbors PRR showed 100% data collection for
most of the nodes up until about 70 m

Discovery Park: Data GraphsNode 23 This graph demonstrates how
temperature and humidity will affect RSS
Higher temperature can lead to a slight decrease in RSS
There was a 2-5 dBm RSS loss as temperature goes from 25 0C to 45 0C.
As humidity increases, the RSS becomes stronger.

Discovery Park: Data GraphsNode 23This graph looks at the RSS from node
23 to its three neighbors (29,22, 16)It appears that on 8 PM on Sunday,
July 27, there was 2-4 dBm jumpNode 23 did not receive a signal from
node 16 until 8 PM It is not clear why signal from node
was not received until after 8:00 PM. One possibility might be an increase
humidity and decreased temperature due to rain

Discovery Park: Data GraphsNode 23This graph compares the trend between
temperature, humidity, and battery voltageAs temperature decreased humidity
increasedBattery voltage dropped from 3.0 V to 2.6 VConclusion: Voltage drops due to usage but
does not appear to be significantly affected by temperature or humidity

Discovery Park: Data GraphsNode 30 This graph is similar to Node 23The RSS drops to -90 after 120
meters The PRR is not stable after 90 meters

Result Discussions:Evaluating the data, we conclude that a compromise between distance,
RSS and PRR would result in the following: Experimental data seems to show that the RSS like cool, wet weather and as opposed to warm, dry
weather This being the case, recommended distance between nodes would be 50 meters in areas with low
vegetation RSS sensitivity -85 dBm or less for better PRR Using the recommended distance would allow for variable environmental factors associated with
Texas summers

Part 2: Experimental Goals: Pecan Creek Wastewater Treatment Facility
To measure the signal transmission strength and packet receiver rate and determine how it is affected by distance.
To determine if temperature and humidity affect the signal transmission strength and packet receiver rate
To compare the results between our initial tests at Discovery Park with data collected at Pecan Creek
Recent data collected from Greenbelt Corridor was compared as well

Experimental Design: Pecan CreekWe deployed 8 nodes and one gateway at
Pecan Creek in an area with moderate vegetation
The nodes were set up in a clearing beyond already existing nodes that were currently being used in another experiment.
Nodes were set up randomly Sensor # 1 was used as our gateway
sensor.The nodes were activated at Thursday, 9
AM, July 30, 2009Nodes were collected on Monday, 9 AM,
August 3, 2009
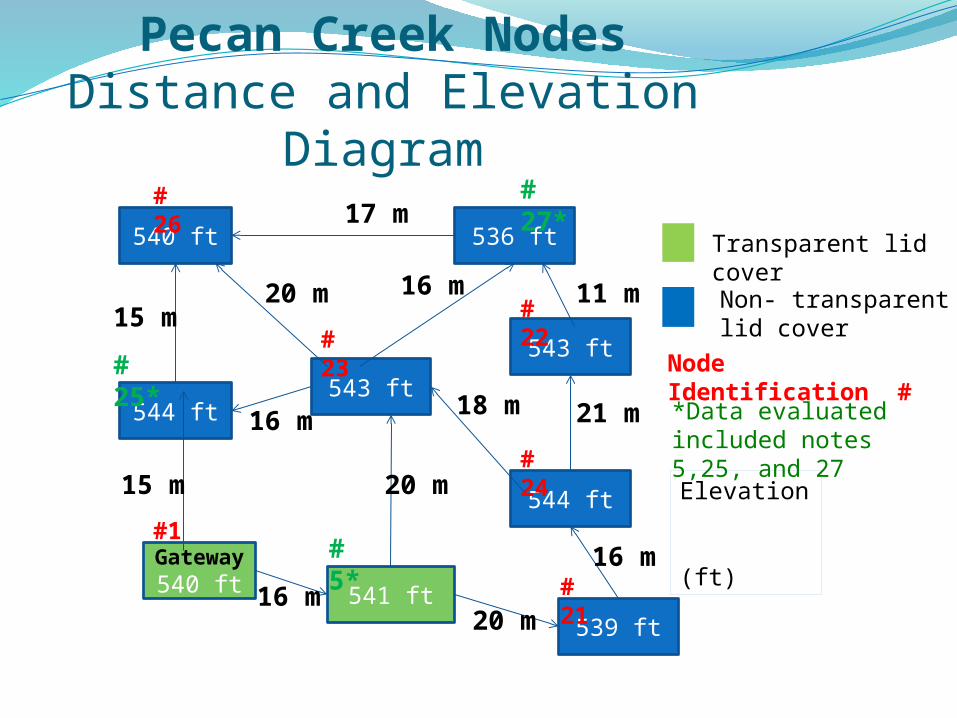
Pecan Creek NodesDistance and Elevation Diagram
Gateway
540 ft
543 ft
539 ft541 ft
536 ft540 ft
543 ft
544 ft
544 ft
Transparent lid cover
Non- transparent lid cover
15 m
16 m
20 m
15 m
20 m
17 m
16 m
21 m
16 m 11 m
18 m
20 m
16 m
Elevation (ft)
# 26
# 25*
#1
# 23
# 27*
# 5* #
21
# 24
# 22
Node Identification #*Data evaluated included notes 5,25, and 27

ID #1 N33.19587-W097.07283
5N33.19585-W097.07265
21N33.19581-W097.07244
24N33.19595-W097.07250
22N33.19609-W097.07257
27N33.19618-W097.07266
26N33.19615-W097.07284
25N33.19601-W097.07284
23N33.19603-W097.07267
1 16 36 32 34 37 31 15 23
5 16 20 17 27 36 37 25 20
21 36 20 16 33 45 53 43 32
24 32 17 16 21 29 38 32 18
22 34 27 33 21 13 26 26 11
27 37 36 45 29 13 17 25 16
26 31 37 53 38 26 17 15 20
25 15 25 43 32 26 25 15 16
23 23 20 32 18 11 16 20 16
Distance between nodes at Pecan Creek using GPS Coordinates
Data evaluated from nodes 5, 21, 25, 26,and 27

Data Graph Comparison: RSS/PRR and Distance•Discovery Park- little vegetation •Pecan Creek - mixed vegetation and clearings•Greenbelt Corridor - dense vegetation
D.P.* Node 23
P.C*. Node 27
* D. P (Discovery Park, P.C (Pecan Creek), GBC. (Green Belt Corridor)
GBC*, Node 4 Dense Vegetation

Data Graph Comparison: RSS, Temperature and Humidity
P.C. Node 27D.P. Node 23
Discovery Park:•2- 4 temperature dBm drop•4 – 6 % humidity increase•Temperature range: 30 0C to 45 0C
Pecan Creek•1 -2 dBm temperature drop•1 – 2 % humidity increase•Temperature range: 20 0C to 40 0C
GBC. Node 4
Greenbelt Corridor (Dense Vegetation)•There was not a significant decrease in RSS due to temperature•No significant increase in RSS in increased humidity

Data Graph Comparisons: RSS Over Time
P.C. Node 27D.P. Node 23 GBC. Node 4
•Data graphs indicate that the RSS varies over time..•Temperature, humidity, weather, and vegetation can affect the signal strength•The graphs below are an interesting comparison between low, moderate, and dense vegetation•It indicates the importance of distance and vegetation with respect to both RSS and PRR

Related WorkOutdoor research in the Sonoran Desert showed a reduction in RSS during the
hottest times of the day. There was also a noticeable daily variation in the signal strength. A linear decrease of about a 8 dBm was noted in RSS for the transition from 25 C to 65 C. While Texas temperature ranges were similar to the Sonoran Desert, there was significantly less humidity and different vegetation.[1]
Research on potato fields also concludes that radio waves propagate better with high humidity (i.e. night and rain). [4]
UNT research at the Greenbelt Corridor ( area of dense vegetation) indicated that nodes can transmit 30 m with 95% PRR and 50 m with 80% PRR .Seasonal variations can also affect the RSS and PRR.[5]
Greenbelt Corridor – Jue (Jerry) Yang set out 15 nodes in the Greenbelt after examining our Discovery Park data. It was interesting to note that the graph for dense vegetation showed that RSS and PRR became unstable at 30 meters or less. [6]

Conclusions and RecommendationsPecan Creek and the Greenbelt are the areas being monitored by the TEO site .Both sites hope to expand their sensors to over 100 for monitoring temperature,
humidity, and soil moisture.Discovery Park helped establish base line data in an area with very little vegetation
and interferenceThe Pecan site has some trees closer to the gateway and a wide clearing further away.The Greenbelt has many trees and few real clearings.Experimental data showed a distance between nodes of 70 meters at the Discovery
Park and 45 meters at Pecan Creek.We suggest that due to the variable temperatures and humidity during Texas summers
that the distance between motes should be 30 meters or less in forested areas and 50 meters in clearings.
Data indicates that the next step should be to deploy a network using the above distances and evaluate the relationship between RSS and PRR while collecting real-time environmental data such as soil moisture

References: [1] Gupta, Sandeep, Gianni Giorgetti and Kenneth Bannister. "Wireless Sensor Networking for "Hot"
Applications: Effects of Temperature on Signal Strength, Data collection and Localization." HotEmNets (2008).
[2] Holland, Matthew M., Ryan G. Aures and Wendi B. Heinzelman. Experimental Investigation of Radio Performance in Wireless Sensor Networks. Rochester, New York: University of Rochester.
[3] Srinivasan, Kannan and Philip Levis. RSSI is Under Appreciated. Stanford, CA: Stanford University. [4] Thelen, John, Dann Goense and Koen Langendoen. Radio Wave Propagation in Potato Fields. July
2009 <http://www.st.ewi.tudelft.nl/~koen/papers/winmee.pdf>. [5] Yang, Jue, et al. Integration of Wireless Sensor Networks in Environmental Monitoring Cyber
Infrastructure. Denton, Texas. [6] Yang, Jue. " “Greenbelt Corridor Data” Denton, TX, August 2009. [7]Fernandez-Martinez, Roberto, J, Ordieres and A Gonzales-Marcos. "Low Power Wireless Sensor
Networks in Industrial Environment." 12th WSEAS International Conference on SYSTEMS (2008): 643-648.
[8] Iris XM 2110/MDA 300 Data Sheets, http://www. xbow.com [9] Hussain, Sajid, and Md Shafayat Rahman. Received Signal Strength Indicator to Detect Node
Replacement and Replication Attacks in Wireless Sensor Networks. Wolfville, NS, Canada, Acadia University.

Acknowledgements:We started out as two non-technical science teachers . However,
through the course of this internship we learned a lot. Not just about the technical aspects of wireless sensors, but about doing a research experiment, evaluating data, and presenting our conclusions, The hands-on approach was extremely valuable not only for us, but for our students. We truly want to thank the Electrical Engineering Department for the very unique experience. We plan to carry this back to our individual campuses and hopefully encourage high school students to consider a careers in electrical engineering.

Heartfelt thanks for making this experience possible:Dr. Miguel Acevedo, Interim Chair, Mechanical and Energy, EngineeringDr. Shenli Fu, Professor, Electrical EngineeringDr. Oscar Garcia, Professor and Founding Dean of Electrical Engineering Dr. Rubio Garcia, Associate Dean of Outreach and Public RelationsDr. Xinrong Li, Professor, Electrical EngineeringDr. Yan Huang, Associate Professor, Computer Science and EngineeringDr. Murali Varanasi, Professor and Department Chair, Electrical EngineeringMitchell Horton, Graduate StudentNing (Martin) Xu, Graduate StudentNitya Kmdukuri, Technical Support

Special Thanks to Jue (Jerry) YangWithout your help this learning experience would not have been
possible.
Jerry – You’re the BEST!