results of selfmonitoring on glucometer systems
TRANSCRIPT

127
RESULTS OF SELFMONITORING ON GLUCOMETER SYSTEMS ADVANCE AND OPTIUM IN DAILY ROUTINE
Rudolf Chlupa, b, Martin Paynec, Jana Zapletalovád, Stanislav Komendad, Blanka Doubravováe, Martina Řezníčkováa, Ludmila Chlupováf, Pavel Sečkařg
a Institute of Physiology, Faculty of Medicine, Palacký University, Olomouc b IInd Dept. of Medicine, Faculty of Medicine, Palacký University & Teaching Hospital, Olomoucc Hypoguard Limited, Woodbridge, United Kingdomd Department of Biometrics, Faculty of Medicine, Palacký University, Olomouce Institute of Neurology and Geriatrics, Moravský Beroun, Czech Republicf Department of Special Education, Pedagogical Faculty, Palacký University, Olomoucg Department of Health Insurance, Teaching Hospital Olomouc, Czech Republic
Received: April 10, 2005; Accepted (with revisions): May 18, 2005
Key words: Glucometer Advance/Glucometer Optium/Selfmonitoring/Precision/Software Glucobalance/Software PC-Link
The aim of this prospective clinical study was to compare the results of B-glucose estimations performed simul-taneously on glucometer Advance (with Micro-draw strips) and Optium (G3 strips) by lay healthy volunteers under non-standardized conditions of everyday life, to assess the difficulties dealing with lay – handling of these systems and to demonstrate the possibilities of the software Glucobalance (Hypoguard) and PC-Link (Medisense/Abbott) for the analysis of selfmonitoring. In the course of 5 days, a total of 721 pairs of measurements were carried out on 10 pairs of glucometer Advance and Optium by 10 healthy volunteers aged 16–40 years. The data transfer of all values into computer from glucometer Advance using the Glucobalance software and from glucometer Optium using the PC-Link was carried out to determine the results. The correlation of B-glucose measured on the glucometer Advance and Optium was strong (r = 0.73). Glucometer Advance brings values about 0.21 ± 0.06 mmol/l lower than gluco-meter Optium. The average difference found within each pairs of glucometers Advance – Optium varied. Nevertheless, these differences are acceptable for routine selfmonitoring. The handling of glucometer Advance is not difficult for lay persons. The Glucobalance software simplifies the result evaluation by each tested person. Even though there are some advantages in comparison with the PC-Link, it should be further developed.
INTRODUCTION
Blood glucose selfmonitoring has become a prerequi-site in the successful treatment of both type 1 and type 2 diabetes mellitus3, 4, 13, 15, 22. In this regard different types of glucometers are marketed to cover increasing demands11, 24. The Glucometer Advance (Hypoguard, Great Britain) and the recently developed new generation of capillary strips (Micro-draw) comprise an approved B-glucose self-monitoring system (GSS) which is ready to use in many countries. Glucometer Optium (Medisense/Abbott) and G 3 strips are already known to produce acceptable results from several years experience14.
The aim of this prospective clinical study was:1. to compare the results of B-glucose estimations per-
formed simultaneously on glucometer Advance (with Micro-draw strips) and Optium (G3 strips) by lay healthy volunteers under the non-standardized condi-tions of everyday life;
2. to assess the difficulties dealing with lay – handling of these systems;
3. to demonstrate the possibilities of the software Glu-cobalance (Hypoguard) and PC-Link (Medisense/Ab-bott) for the analysis of selfmonitoring.
METHODS
Tested persons Ten healthy volunteers aged between16 and 40 years
(students, nurses, laboratory assistants) having no person-al experience with GSS Advance or Optium entered the study. Informed consent was obtained from all of them. Everyone received one glucometer Advance, one gluco-meter Optium and two packages of strips per glucometer (Table 1). All volunteers were given a 30 min training in selfmonitoring. None of the glucometers with the excep-tion of Optium No 6 had been used before.
Study designAll measurements were performed in July 2003 in the
course of one week, usually at home, at work, in a hospi-
Biomed. Papers 149(1), 127–139 (2005) © R. Chlup, M. Payne, J. Zapletalová, S. Komenda, B. Doubravová, M. Řezníčková, L. Chlupová, P. Sečkař
128 R. Chlup, M. Payne, J. Zapletalová, S. Komenda, B. Doubravová, M. Řezníčková, L. Chlupová, P. Sečkař
tal ward or on a trip. The weather conditions were good, temperatures mostly in between 15–30 °C.
Each volunteer was encouraged to perform B-glucose selfmonitoring at breakfast and at dinner, according to the following 7-point schedule: before the meal (time 0) and 15, 30, 45, 60, 90 and 120 min following the start of the meal. In this way, everyone was performing 14 estima-tions per day.
In selfmonitoring, capillary blood was obtained from a finger by means of a lancing device; the first drop was put on a strip G3 (Optium) and, immediately afterwards, the second drop was put on a Micro-draw strip (Advance). The volunteer registered all results read on the displays of both glucometers in the protocol.
At the end of the one-week test period each volunteer was asked to describe the positive and the negative fea-tures of individual tested systems.
Statistical analysisThe data were transferred by means of respective soft-
ware (Glucobalance or PC-Link) from the glucometers to a PC.
The program MS Excel and the statistical package SPSS, v. 10.1, were used for analyzing the results: t-test for matched observations, Correlation Analyses a Analyses of Variance were applied to evaluate the data. The level of significance p < 0.05 was taken.
RESULTS
In the course of 5 days, a total of 721 pairs of measurements were carried out on 10 pairs of gluco meter Advance and Optium by 10 volunteers. One measurement showed an extreme BG value of 42.8 mmo/l; as this val-ue exceeded the declared range of glucometer (1.1–33.3 mmol/l), the pair concerned was not considered for sta-tistical analysis.
For the results of measurements from individual glu-cometers see Table 2. Occasionally there were some high (>14.0 mmol/l) or low (<3.3 mmol/l) B-glucose values measured on both glucometers Advance and Optium. There is no explanation for these unusual values.
There was a strong correlation between the B-glucose values measured on all glucometers Advance and Optium (r = 0.73, see Fig. 1). However, the correlation coefficients of the individual pairs of glucometers differed (r = 0.58 to r = 0.91, see Table 3).
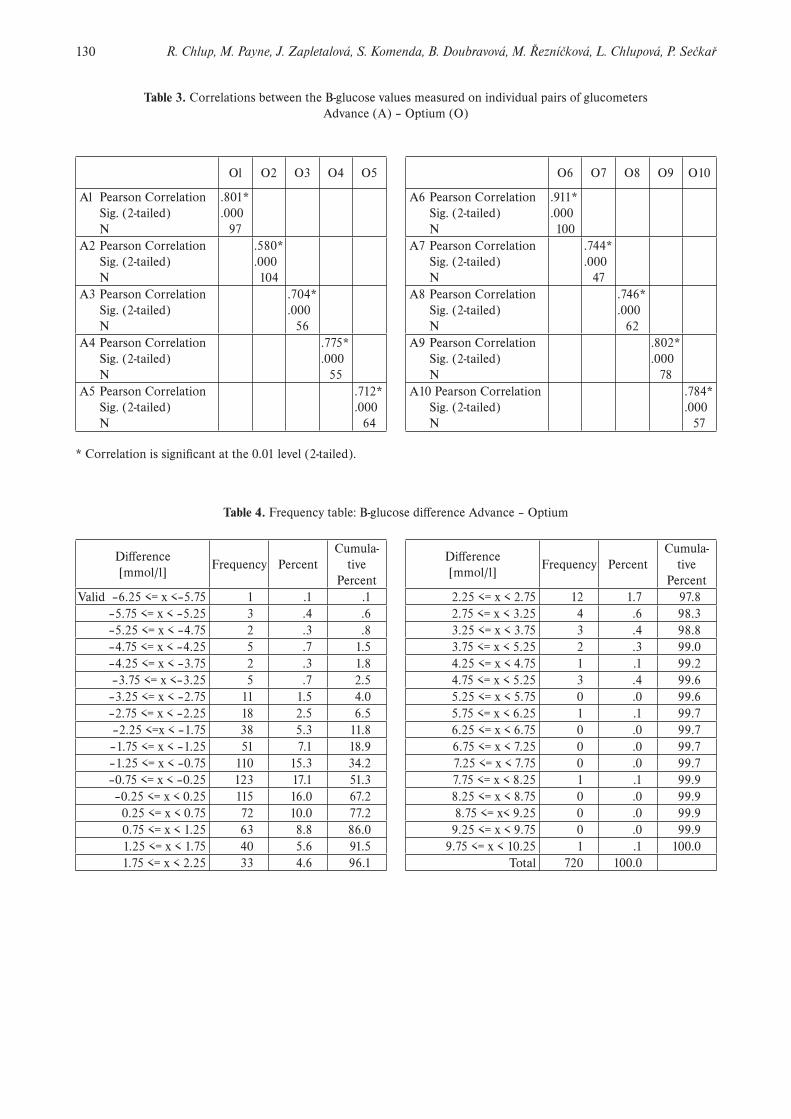
For the frequency of B-glucose differences in all 10 pairs of glucometers (Advance – Optium) see the histo-gram in Fig. 2. The majority of all differences (96,1 %) was within ± 2.25 mmol/l. Extreme differences were registered only rarely (Table 4).
For the results of statistical analysis see Table 5: the B-glucose values on the Advance glucometers were lower about 0.21 ± 0.06 mmol/l (x ± SE), i.e. 2.998 %, than the values measured on the glucometer Optium. This differ-ence did not depend on the absolute B-glucose concentra-tion (Fig. 3).
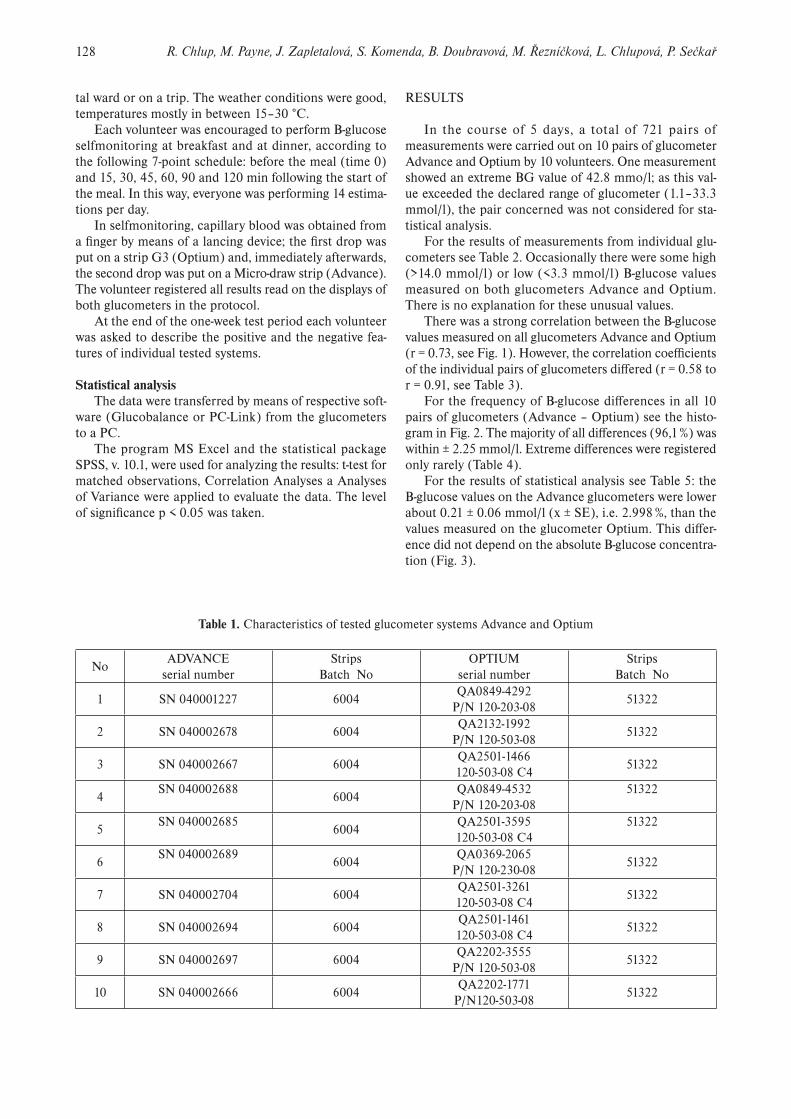
Table 1. Characteristics of tested glucometer systems Advance and Optium
NoADVANCE
serial numberStrips
Batch NoOPTIUM
serial numberStrips
Batch No
1 SN 040001227 6004QA0849-4292
P/N 120-203-0851322
2 SN 040002678 6004QA2132-1992
P/N 120-503-0851322
3 SN 040002667 6004QA2501-1466120-503-08 C4
51322
4SN 040002688
6004QA0849-4532
P/N 120-203-0851322
5SN 040002685
6004QA2501-3595120-503-08 C4
51322
6SN 040002689
6004QA0369-2065
P/N 120-230-0851322
7 SN 040002704 6004QA2501-3261120-503-08 C4
51322
8 SN 040002694 6004QA2501-1461120-503-08 C4
51322
9 SN 040002697 6004QA2202-3555
P/N 120-503-0851322
10 SN 040002666 6004QA2202-1771
P/N120-503-0851322

129Results of selfmonitoring on glucometer systems Advance and Optium in daily routine
The results of analysis of variance of the differences of each glucometer is shown in Table 6: mean B-glucose dif-ferences within individual pairs of glucometers are often significantly different.
The volunteers agreed that the usage of both types of glucometers was simple. The glucometer Advance was appreciated for its small, handy size, the option of going through the memory results forwards and backwards and the very small amount of blood needed for one measure-ment. On the other hand, the large strip packages didn’t fit into the box together with the glucometer and this was seen as a disadvantage.
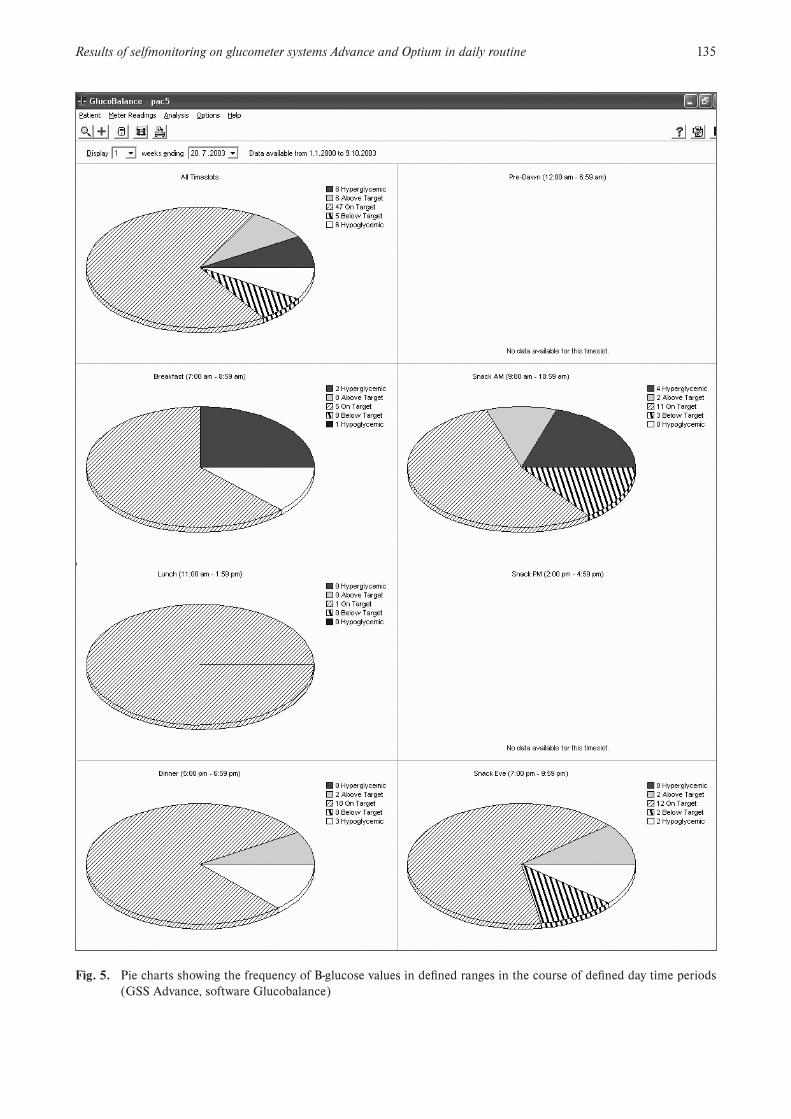
The data transfer of all values into computer from glu-cometer Advance using the Glucobalance software and from glucometer Optium using the PC-link was carried out by a professional. The Glucobalance and PC-link ena-bled as to see the results of an individual volunteer sepa-rately. One of the advantages of the Glucobalance is the ability to edit histograms (Fig. 4), pie charts (Fig. 5) and statistics (Fig. 6) for individually set day time periods. The modal day (Fig. 7) and time trends (Fig. 8) are similar to those of the PC Link. None of the programs enables to compare the data interindividually. None of the programs comes in a Czech version.
Table 2. Results of measurements from individual pairs of glucometers Advance (A) and Optium (O)
PROBAND ADVANCE OPTIUM A-O
1 N 97 97 97Minimum 3.3 4.00 -3.09Maximum 15.1 13.00 5.16Median 8.400 7.5600 .8300Mean 8.493 7.5919 .9009Std. Deviation 2.561 2.2967 1.5508
2 N 104 104 104Minimum 1.4 3.56 -4.79Maximum 10.0 10.89 2.56Median 5.600 5.9700 -.5900Mean 5.565 6.0994 -.5340Std. Deviation 1.255 1.0781 1.0807
3 N 56 56 56Minimum 3.6 4.61 -1.62Maximum 10.0 9.78 2.19Median 6.850 5.8900 .7300Mean 6.827 6.1836 .6432Std. Deviation 1.127 1.2812 .9365
4 N 55 55 55Minimum 1.9 3.44 -5.88Maximum 12.3 12.50 .69Median 5.300 7.2200 -1.6800Mean 5.338 7.1251 -1.7869Std. Deviation 2.258 2.1265 1.4753
5 N 64 64 64Minimum 1.2 3.72 -5.67Maximum 21.6 13.39 9.82Median 6.050 6.9400 -1.1300Mean 6.470 7.4472 -.9769Std. Deviation 3.068 1.8851 2.1749
PROBAND ADVANCE OPTIUM A-O
6 N 100 100 100Minimum 3.0 3.17 -3.47Maximum 13.9 14.50 1.83Median 6.50 6.9150 -.5600Mean 6.96 7.5274 -.5684Std. Deviation 2.00 2.0497 .8567
7 N 47 47 47Minimum 1.1 4.06 -4.70Maximum 11.3 10.83 1.13Median 5.00 6.1700 -1.0800Mean 5.31 6.6472 -1.3366Std. Deviation 1.63 1.6876 1.1886
8 N 62 62 62Minimum 2.5 4.33 -3.39Maximum 11.7 10.83 3.93Median 6.80 6.6150 -.1900Mean 6.70 6.6485 .0482Std. Deviation 1.65 1.4717 1.1254
9 N 78 78 78Minimum 3.7 3.28 -1.63Maximum 18.8 12.39 8.02Median 6.45 6.5600 .1150Mean 7.04 6.7637 .2760Std. Deviation 2.34 1.9786 1.3998
10 N 57 57 57Minimum 3.9 3.67 -1.34Maximum 9.0 9.39 2.76Median 6.50 5.5600 .6800Mean 6.66 5.9556 .7058Std. Deviation 1.30 1.5020 .9407
Total N 720 720 720Minimum 1.1 3.17 -5.88Maximum 21.6 14.50 9.82Median 6.30 6.5600 -.2800Mean 6.64 6.8471 -.2053Std. Deviation 2.23 1.8838 1.5462
130 R. Chlup, M. Payne, J. Zapletalová, S. Komenda, B. Doubravová, M. Řezníčková, L. Chlupová, P. Sečkař
Table 3. Correlations between the B-glucose values measured on individual pairs of glucometers Advance (A) – Optium (O)
Ol O2 O3 O4 O5
Al Pearson Correlation Sig. (2-tailed)
N
.801*
.00097
A2 Pearson Correlation Sig. (2-tailed)
N
.580*
.000104
A3 Pearson Correlation Sig. (2-tailed)
N
.704*
.00056
A4 Pearson Correlation Sig. (2-tailed)N
.775*
.00055
A5 Pearson Correlation Sig. (2-tailed)
N
.712*
.00064
* Correlation is significant at the 0.01 level (2-tailed).
O6 O7 O8 O9 O10
A6 Pearson Correlation Sig. (2-tailed)N
.911*
.000100
A7 Pearson Correlation Sig. (2-tailed)N
.744*
.00047
A8 Pearson Correlation Sig. (2-tailed)N
.746*
.00062
A9 Pearson Correlation Sig. (2-tailed)N
.802*
.00078
A10 Pearson Correlation Sig. (2-tailed)N
.784*
.00057
Table 4. Frequency table: B-glucose difference Advance – Optium
Difference[mmol/l]
Frequency PercentCumula-
tivePercent
Valid –6.25 <= x <–5.75 1 .1 .1–5.75 <= x < –5.25 3 .4 .6–5.25 <= x < –4.75 2 .3 .8–4.75 <= x < –4.25 5 .7 1.5–4.25 <= x < –3.75 2 .3 1.8–3.75 <= x <–3.25 5 .7 2.5–3.25 <= x < –2.75 11 1.5 4.0–2.75 <= x < –2.25 18 2.5 6.5–2.25 <=x < –1.75 38 5.3 11.8–1.75 <= x < –1.25 51 7.1 18.9–1.25 <= x < –0.75 110 15.3 34.2–0.75 <= x < –0.25 123 17.1 51.3–0.25 <= x < 0.25 115 16.0 67.2
0.25 <= x < 0.75 72 10.0 77.20.75 <= x < 1.25 63 8.8 86.01.25 <= x < 1.75 40 5.6 91.51.75 <= x < 2.25 33 4.6 96.1
Difference[mmol/l]
Frequency PercentCumula-
tivePercent
2.25 <= x < 2.75 12 1.7 97.82.75 <= x < 3.25 4 .6 98.33.25 <= x < 3.75 3 .4 98.83.75 <= x < 5.25 2 .3 99.04.25 <= x < 4.75 1 .1 99.24.75 <= x < 5.25 3 .4 99.65.25 <= x < 5.75 0 .0 99.65.75 <= x < 6.25 1 .1 99.76.25 <= x < 6.75 0 .0 99.76.75 <= x < 7.25 0 .0 99.77.25 <= x < 7.75 0 .0 99.77.75 <= x < 8.25 1 .1 99.98.25 <= x < 8.75 0 .0 99.98.75 <= x< 9.25 0 .0 99.99.25 <= x < 9.75 0 .0 99.9
9.75 <= x < 10.25 1 .1 100.0Total 720 100.0

131Results of selfmonitoring on glucometer systems Advance and Optium in daily routine
Table 5. Statistical evaluation of the B-glucose difference Advance – Optium (all results)
One-Sample Statistics
N Mean Std. Deviation Std. Error Mean
A_O Difference 720 – .205 1.5461 .0576
One-Sample Test
Test Value = 0
t dfSig.
(2-tailed)Mean
Difference
95% Confidence Interval of the Difference
Lower Upper
A_O Difference –3.562 719 .0004 – .205 – .318 – .092
Table 6. Statistical evaluation of the B-glucose difference Advance – Optium (ANOVA – multiple comparisons of indi-vidual patients i.e. pairs of glucometers)
(1) PROBAND (J) PROBANDMean
Difference(I–J)
Std.Error
Sig.
95% ConfidenceInterval
LowerBound
UpperBound
1 2 1.435* .186 .000 1.070 1.8003 .258 .221 .244 -.176 .691
4 2.688* .222 .000 2.252 3.124
5 1.878* .212 .000 1.462 2.294
6 1.469* .188 .000 1.101 1.838
7 2.238* .234 .000 1.778 2.697
8 .853* .214 .000 .432 1.273
9 .625* .200 .002 .232 1.018
10 .195 .220 .375 -.236 .626
2 3 -1.177* .218 .000 -1.606 -.7494 1.253* .219 .000 .822 1.684
5 .443* .209 .035 .032 .8536 .034 .184 .852 -.328 .396
7 .803* .231 .001 .348 1.257
8 -.582* .211 .006 -.997 -.168
9 -.810* .197 .000 -1.197 -.423
10 -1.240* .217 .000 -1.666 -.814
* The mean difference is significant at the .05 level.

132 R. Chlup, M. Payne, J. Zapletalová, S. Komenda, B. Doubravová, M. Řezníčková, L. Chlupová, P. Sečkař
(1) PROBAND (J) PROBANDMean
Difference(I–J)
Std.Error
Sig.
95% ConfidenceInterval
LowerBound
UpperBound
3 4 2.430* .250 .000 1.940 2.9215 1.620* .241 .000 1.147 2.093
6 1.212* .220 .000 .780 1.643
7 1.980* .260 .000 1.469 2.491
8 .595* .243 .014 .119 1.0719 .367 .231 .112 -.085 .820
10 -.063 .248 .801 -.549 .424
4 5 -.810* .242 .001 -1.285 -.335
6 -1.219* .221 .000 -1.652 -.785
7 -.450 .261 .085 -.964 .063
8 -1.835* .244 .000 -2.314 -1.356
9 -2.063* .232 .000 -2.518 -1.608
10 -2.493* .249 .000 -2.981 -2.004
5 6 -.408 .211 .053 -.822 .005
7 .360 .253 .155 -.137 .856
8 -1.025* .235 .000 -1.486 -.565
9 -1.253* .222 .000 -1.689 -.817
10 -1.683* .240 .000 -2.153 -1.212
6 7 .768* .233 .001 .311 1.225
8 -.617* .213 .004 -1.034 -.199
9 -.844* .199 .000 -1.235 -.454
10 -1.274* .218 .000 -1.703 -.845
7 8 -1.385* .255 .000 -1.885 -.885
9 -1.613* .243 .000 -2.090 -1.135
10 -2.042* .259 .000 -2.552 -1.533
8 9 -.228 .224 .309 -.668 .212
10 -.658* .242 .007 -1.132 -.183
9 10 -.430 .229 .061 -.880 .021
* The mean difference is significant at the .05 level.
Table 6 cont.

133Results of selfmonitoring on glucometer systems Advance and Optium in daily routine
OPTIUM BG [mmol/l]
20151050
BG
diff
eren
ce A
DV
AN
CE
-OP
TIU
M
[mm
ol/l]
12
8
4
0
-4
-8
-12
r = - 0.164
Fig. 1. Correlation between the B-glucose values measured on all glucometers Advance and Optium
Fig. 3. Correlation between the B-glucose dfference Ad-vance – Optium and the B-glucose value measured on glucometer Optium
Fig. 2. Histogram: frequency (number of observations) of individual B-glucose differences Advance – Optium; total number of comparisons n = 720

134 R. Chlup, M. Payne, J. Zapletalová, S. Komenda, B. Doubravová, M. Řezníčková, L. Chlupová, P. Sečkař
Fig. 4. Histograms of B-glucose values from the defined day time periods in one tested person (GSS Advance, software Glucobalance)
135Results of selfmonitoring on glucometer systems Advance and Optium in daily routine
Fig. 5. Pie charts showing the frequency of B-glucose values in defined ranges in the course of defined day time periods (GSS Advance, software Glucobalance)

136 R. Chlup, M. Payne, J. Zapletalová, S. Komenda, B. Doubravová, M. Řezníčková, L. Chlupová, P. Sečkař
Fig. 6. Statistics (GSS Advance, software Glucobalance)
Fig. 7. Modal day: all B-glucose values measured in the course of several days drawn into the time coordinates of one day (GSS Advance, software Glucobalance)

137Results of selfmonitoring on glucometer systems Advance and Optium in daily routine
Fig. 8. Trend chart: all B-glucose values drawn in chronological order (GSS Advance, software Glucobalance)
Fig. 9. Clarke Error Grid Analysis of Capillary finger-prick data from persons with type 1 diabetes; investigations were performed in Ipswitch Hospital Diabetic clinics, Great Britain (2003–2004) (ref.20)

138 R. Chlup, M. Payne, J. Zapletalová, S. Komenda, B. Doubravová, M. Řezníčková, L. Chlupová, P. Sečkař
DISCUSSION
The results of B-glucose selfmonitoring depend on the quality of the glucometer, on the quality of strips and on various preanalytical and analytical factors such as tem-perature, humidity17, amount of blood19, B-glucose conce-tration and other physical-chemical parameters (including the presence of drugs etc.) influencing the activity of the glucosoxidase and the size of the developing electrical flow6, 7, 8, 16, 18. The registered B-glucose values collected to check the function of the glucometer system Advance was influenced by all above mentioned factors. In addition to it, the person performing the selfmonitoring is one of the inevitable parts of the whole procedure.
The laboratory regulations dealing with the accuracy of the glucometers demand that the value measured is not different from the values estimated using the approved analyzer more than by 15 % (ref.2, 5, 9, 10). The accuracy of both glucometers Advance and Optium has been evalu-ated by several researches1, 12, 14, 21, 23.
In this user-oriented study it was not possible to carry out measurements on an approved analyzer and therefore it is not possible to produce regarding evidence which kind of glucometer is more accurate. On the other hand it is possible to conclude that the average difference of B-glu-cose measured on glucometers Advance differs from the glucometer Optium. The magnitude of difference Advance – Optium does not seem to be dependent on the absolute B-glucose value. However, this assessment is limited, as the estimations were performed only in the B/glucose concentration range from 3.17 to 14.50 mmol/l. The well known glucometer Optium was considered to be “empiri-cally competent” to be used as a reference glucometer; nevertheless, it should be taken into consideration that the differences could be due to inaccuracy and impreci-sion of both glucometers, i.e., Optium and Advance14. In addition, the importance of various differences of separate pairs of glucometers is limited, because each pair was tested by a different person and under different circum-stances. The outcome for the praxis is that each person should always perform selfmonitoring with the same type of the personal glucometer. Results of individual pairs of glucometers are shown (Table 1 and Table 2) to demon-strate the variability of estimations as it may be expected by the physician in daily routine.
The software Glucobalance was not used in the Czech Republic before the year 2003 and no references describ-ing some experience with it could be found. Therefore, Fig. 4–8 was included into this paper to mention and assess its advantages and disadvantages.
In a recent Advance Micro-draw study20, the quality of the GSS was evaluated using persons with diabetes at-tending Ipswich Hospital Diabetic clinics from December 2003 till January 2004. Capillary blood was obtained di-rectly from finger-pricks. Results were compared to a YSI reference analyser (Fig. 9). All data is presented without any recognised outlier removals. Very low (< 2.8 mmol/l) glucose results were obtained using capillary blood that was incubated to lower glucose content prior to meter
measurement. Data was evenly stratified across the blood glucose measurement range. There was no screening of patients attending the diabetic outpatients clinic. There was no limitation made on drug therapy/interferences that may have been present in the blood and no limitation on the hematocrit of any patient entering the study. (A to-tal of 8 meters were involved in these clinical measure-ments).
In conclusions in may be said: 1. The results of B-glucose selfmonitoring by means of
both tested glucometer systems Advance and Optium under non-standardized conditions of daily life appears to be reliable. The correlation of B-glucose measured on the glucometer Advance and Optium was strong (r = 0.73). Glucometer Advance produce values about 0.21 ± 0.06 mmol/l lower than glucometer Optium. The average difference found within each pairs of glucometers Advance – Optium varied, nevertheless, these differences are acceptable for the routine self-monitoring.
2. The handling of glucometer Advace is not difficult for lay persons.
3. The Glucobalance software simplifies the result evalu-ation by each tested person. Even though there are some advantages in comparison with the PC-Link, it should be further developed.
ACKNOWLEDGEMENTS
This study was supported by research projects IGA Nr 7825-3, Ministry of Health, MSM 151100005 and Minis-try of Education Youth and Sports, Czech Republic.
REFERENCES
1. Alamia V Jr, Jaekle R, Royek A, Meyer BA. (1998) Accuracy of portable glucose meters for rapid determination of amniotic fluid glukose levels. J Maternal – Fetal Med 7, 183–189.
2. American Diabetes Association. (2002) Tests of glycemia in dia-betes. Diabetes Care 25, 597–599.
3. American Diabetes Association. (1994) Self-monitoring of blood glucose (Consensus Statement). Diabetes Care 17, 81–86.
4. Dillon AE, Menard MK, Rust P, Newman RB, VanDorsten JP. (1997) Glucometer analysis of one-hour glucose challenge samples. Am J Obstet Gynecol 177, 1120–1123.
5. Dohnal L, Frýdecký B, Zima T, Kalla K, Škrha J. (2000) Doporučení č. 2 České společnosti klinické biochemie ČLS JEP, Referenční laboratoře pro klinickou biochemii MZ ČR a České diabetologické společnosti: Zabezpečování jakosti měření glukom-etry při použití v režimu point-of-care testing. Klin Bioch Met 9/30, 78–79.
6. Dybkaer R. (1999) From total allowable error via metrological traceability to uncertainly of measurement of unbiased results. Ac-cred Qual Assur 6, 401–405.
7. Fazel A, Koutoubi Z, Sorg TB, Mehrotra B. (1996) Influence of sample temperature on reflectance photometry and electrochemical glucometer measurements. Diabetes Care 10, 771–774.
139Results of selfmonitoring on glucometer systems Advance and Optium in daily routine
8. Fink KS, Christensen DB, Ellsworth A. (2002) Effect of high at-titude on blood glucose meter performance. Diab Technol Therap 4, 627–635.
9. Fogh-Andersen N, D’Oratio P, Kunze K, Kuelpmann W, Mager G, Latson L. Recommendation on reporting results for blood glucose. http://www.ifcc.org/ejifcc/voll2no4/voll2no4a4.htm
10. Frýdecký B. (2001) Laboratorní diagnostika diabetu a požadavky na měření koncentrace glukózy. Klin Bioch Met 9/30, 173–177.
11. Goldstein DE, Little RR, Lorenz RA, Malone JI, Nathan D, Peter-son CM. (1995) Test of glycemia in diabetes (Technical Review). Diabetes Care 18, 896–909.
12. Haag BL, Leed I. (1999) Suceptibility of two new glucose test strips to testing errors. Diabetes 48 (Suppl. 1), A415.
13. Chee F, Fernando T, van Heerden PV. (2003) Closed-loop glucose control in critically ill patients using continuous glucose monitor-ing systém (CGMS) in real time. IEEE Transaction on Information Technology in Biomedicine 7, 43–53.
14. Chlup R., Bartek J, Malá E, Doubravová B, Pukowietz L, Zatloukal P, Chlupová L, Zapletalová J. (2004): Uživatelská studie o správnos-ti a přesnosti měření glukometrů Advance, Card a Optium (User-oriented study on accuracy and precision of glucometer systems Advance, Card and Optium). Klin Bioch Metabol 12, 171–178.
15. Karter AJ, Ackerson LM, Darbinian JA, D’Agostino RB Jr, Ferrara A, Liu J, Selby JV. (2001) Self-monitoring of blood glucose levels and glycemic control: the Northern California Kaiser Permanent Diabetes Registry. Am J Med 111, 1–9.
16. Kellner A, Waldenstroem J. (1999) Estimation of total uncertainly of glucose measurements. Clin Chem Lab Med 37, Spec. Suppl. S14.
17. King JM, Eigenmann CA, Colagiuri S. (1995) Effect of ambient temperature and humidity on performance of blood glucose meters. Diab Med 12, 337–340.
18. Kurahashi K, Maruta H, Usuda Y, Ohtsuka M. (1997) Influence of blood sample oxygen tension on blood glucose concentration measured using an enzyme-electrode method (comment). Critic Care Med 25, 231–235.
19. Lewandrowaki KB, Dan L. (2002) Effects of small sample volume and interfering substances on two glucose meters (Vliv malého objemu krve v testovaném vzorku a obsahu příměsi na dva měřicí přístroje pro diabetiky). Diabetes 48 (Suppl.1), A387.
20. Payne M. (2004) Hypoguard Advance Micro-draw Performance. Klin Bioch Metabol 12, 202.
21. Puentmann I, Wosniok W, Haeckel R. (2003) Comparison of sev-eral point-of-care testing (POCT) glucometers with an established laboratory procedure for the diagnosis of type 2 diabetes using the discordance rate. A new statistical approach. Clin Chem Lab Med 41, 809–820.
22. Rumley AG (1997) Improving the quality of near-patient blood glucose measurement (comment). Annals Clin Bioch 34 (Pt 3), 281–286.
23. Stahl M, Jorgensen LGM, Hyltoft Petersen P, Branslund I et al (2001) Optimization of preanalytical conditions and analysis of plasma glucose. 1. Impact of the new WHO and ADA recommen-dations on diagnosis of diabetes mellitus. Scand J Clin Lab Invest 61, 169–180.
24. Thai AC, Ng WY, Lui KF, Yeo PP (1989) Three new glucose re-flectance meters: Diascan, Glucometer II, and Reflolux II. Diabetes Res Clin Pract 7, 75–81.