results from the swedish national screening programme 2010 · results from the swedish national...
TRANSCRIPT

REPORT
Results from the Swedish
National Screening Programme 2010
Subreport 3. Pharmaceuticals
The report approved: 2011-12-16
John Munthe Vice President, Research
Jerker Fick, Richard H. Lindberg, Umeå University
Lennart Kaj, Eva Brorström-Lundén, IVL B2014
December 2011

Organization
IVL Swedish Environmental Research Institute Ltd.
Report Summary
Project title
Screening 2010 Address
P.O. Box 21060 SE-100 31 Stockholm Project sponsor
Swedish Environmental Protection Agency
Telephone
+46 (0)8-598 563 00
Author
Jerker Fick, Richard H. Lindberg, Lennart Kaj, Eva Brorström-Lundén
Title and subtitle of the report
Results from the Swedish National Screening Programme 2010
Subreport 3. Pharmaceuticals Summary
A screening study has been performed concerning pharmaceuticals. A total of 101 pharmaceuticals and 54 samples were included in the national programme and 67 samples were included in the regional programme. The sampling programme was focused on diffuse emissions from urban areas reflected in samples from waste water treatment plants (WWTPs) and their receiving waters. Biota samples (perch) from two background lakes and two of the receiving waters and also drinking water from two cities were also included. Of the 101 pharmaceuticals included 92 were detected in the WWTP influent of at
least one WWTP, in levels that ranged from low ng/L up to 540 µg/L, with a median concentration of
53 ng/L. 66 pharmaceuticals were detected in the surface water samples in the range from low ng/L up to 1.8 µg/L. Measured surface water concentrations were evaluated by comparing them to critical environmental concentrations, i.e. the water concentration that is expected to cause a pharmacological effect in fish. This evaluation showed that five pharmaceuticals in these samples are expected to cause a pharmacological response in fish exposed to these waters. 23 pharmaceuticals were detected in seven biota (perch) samples. Low levels (low ng/L range) of 26 pharmaceuticals were detected in drinking water samples. Keyword
pharmaceuticals , screening, waste water treatment plant, WWTP, sludge, surface water, biota, critical environmental concentration, CEC Bibliographic data
IVL Report B2014
The report can be ordered via Homepage: www.ivl.se, e-mail: [email protected], fax+46 (0)8-598 563 90, or via IVL, P.O. Box 21060, SE-100 31 Stockholm Sweden

Results from the Swedish National Screening Programme 2010 IVL report B2014 Subreport 3. Pharmaceuticals
1
Summary
A screening study has been performed concerning Pharmaceuticals. Selection of pharmaceuticals included in the screening was based on ecotoxicological criteria, primarily potency and potential to bioconcentrate. In addition, antibiotics and some pharmaceuticals that have been included in previous screening programmes were also included. A total of 101 pharmaceuticals and 54 samples were included in the national programme and 67 samples were included in the regional programme. The sampling programme was focused on diffuse emissions from urban areas reflected in samples from waste water treatment plants (WWTPs) and their receiving waters. Biota samples (perch) from two background lakes and two of the receiving waters and also drinking water from two cities were also included.
Of the 101 pharmaceuticals included in this study 92 were detected in the WWTP influent of at least one WWTP, in levels that ranged from low ng/L up to 540 µg/L, with a median concentration of 53 ng/L. Paracetamol was the pharmaceutical that was detected in highest amounts, up to 540 µg/L. 85 of the 101 pharmaceuticals included in this study were detected in the effluent of at least one WWTP, in levels that ranged from low ng/L up to 4 µg/L, with a median concentration of 35 ng/L. Diclofenac was the pharmaceutical that was detected in highest amounts (3.9 µg/L) in the effluent. Removal efficiencies and sludge concentrations from all four WWTPs are also presented. Of the 101 pharmaceuticals included in this study 66 were detected in the surface water samples in the range from low ng/L up to 1.8 µg/L. Measured surface water concentrations were evaluated by comparing them to critical environmental concentrations, i.e. the water concentration that is expected to cause a pharmacological effect in fish. This evaluation showed that five pharmaceuticals in these samples are expected to cause a pharmacological response in fish exposed to these waters. In this study 23 pharmaceuticals were detected in the seven biota (perch) samples. Concentrations were in the low µg/Kg range and highest detected levels were found in the perch caught in close proximity to the discharge point of WWTP Kungsängsverket (Uppsala) in River Fyris. Detected pharmaceuticals in biota correlate to the surface water concentrations and previous reports on the occurrence of pharmaceuticals in biota. Low levels (low ng/L range) of 26 pharmaceuticals were detected in the drinking water samples. There was significant difference between the two drinking waters; only two pharmaceuticals could be detected in the samples from Umeå, carbamazepine and trimethoprim, while 26 pharmaceuticals were detected in the Stockholm samples.

Results from the Swedish National Screening Programme 2010 IVL report B2014 Subreport 3. Pharmaceuticals
2
Sammanfattning
En screeningundersökning av läkemedel har utförts. Urvalet av läkemedel i denna studie gjordes utifrån ekotoxikologiska kriterier, främst potens och potential att biokoncentrera. Som komplement till detta urval inkluderades också några antibiotika och några läkemedel som ingått i tidigare screeningundersökningar. Totalt 101 läkemedel och 54 prover ingick i den nationella screeningen och 67 prover ingick i den regionala screeningen. Screeningundersökningen fokuserade på diffusa emissioner från tätbebyggda områden med betoning på inkommande och utgående avloppsvatten från avloppsreninsverk (ARV) och deras recipienter. Biotaprover (abborre) ingick också från två kontrollsjöar och två av recipienterna samt dricksvatten från två städer.
Av de 101 läkemedel som ingick i studien detekterades 92 i inkommande avloppsvatten i minst ett ARV, i halter mellan låga ng/L upp till 540 µg/L, median koncentration var 53 ng/L. Paracetamol uppmättes i högst halter, 540 µg/L. Av 101 läkemedel detekterades 85 i utgående avloppsvatten i minst ett ARV, i halter mellan låga ng/L upp till 4 µg/L, median-koncentration var 35 ng/L. Diklofenak uppmättes i högst halter (3.9 µg/L) i utgående avloppsvatten. Avskiljningsgrad och koncentrationer i slam från alla fyra ARV presenteras också. Av läkemedlen uppmättes 66 i ytvatten (låga ng/l upp till 1.8 µg/L) och de uppmätta halterna utvärderades genom att jämföra dem med kritiska miljökoncentrationer; dvs. den vattenkoncentration som förväntas orsaka en farmakologisk respons i fisk. Denna utvärdering visade att fem av läkemedlen uppmättes i halter som sannolikt orsakar en farmakologisk respons i fisk som exponeras för detta vatten. I de sju biotaproverna detekterades totalt 23 läkemedel. Koncentrationerna var låga (låga µg/Kg) och de högsta detekterade halterna fanns i fisk fångad i närheten av Kungsängs-verkets ARV (Uppsala) utsläppspunkt i Fyrisån. Uppmätta läkemedel i biota korrelerar med uppmätta halter i ytvattnet och med tidigare publicerade data av läkemedelsrester i biota. I de sex dricksvattenproverna detekterades totalt 26 läkemedel (låga ng/L). Det var en signifikant skillnad mellan dricksvattnet i de bägge städerna, bara två läkemedel kunde detekteras i dricksvattnet från Umeå, karbamazepin och trimetoprim, medan 26 läkemedel detekterades i dricksvattenproverna från Stockholm.

Results from the Swedish National Screening Programme 2010 IVL report B2014 Subreport 3. Pharmaceuticals
3
Table of contents 1 Introduction ...............................................................................................................................4 2 Pharmaceuticals as environmental pollutants ........................................................................5
2.1 Background ........................................................................................................................5 2.2 Selection of pharmaceuticals to include in the screening ............................................5
3 Sampling strategy and study sites ............................................................................................6 3.1 National screening program ............................................................................................6 3.2 Regional screening program ............................................................................................7
4 Methods ......................................................................................................................................8 4.1 Sampling .............................................................................................................................8 4.2 Analysis ...............................................................................................................................8
4.2.1 Chemicals ...................................................................................................................8 4.2.2 Sample preparation ...................................................................................................8 4.2.3 Instrumental analysis ................................................................................................9 4.2.4 Quality control ........................................................................................................ 10
5 Results and discussion, national program ........................................................................... 10 5.1 Background areas ........................................................................................................... 10 5.2 Sewage treatment plants ................................................................................................ 11
5.2.1 WWTP influent ...................................................................................................... 11 5.2.2 WWTP effluent ...................................................................................................... 13 5.2.3 Removal efficiency ................................................................................................. 15 5.2.4 WWTP sludge ......................................................................................................... 17
5.3 Surface water ................................................................................................................... 19 5.4 Biota ................................................................................................................................. 23 5.5 Drinking water ................................................................................................................ 25
6 Results, regional program ...................................................................................................... 27 7 Conclusions ............................................................................................................................. 28 8 Acknowledgement .................................................................................................................. 29 References ........................................................................................................................................ 29 Appendix 1 Sample table, National screening Appendix 2 Sample table, Regional screening Appendix 3 Limit of quantification, water samples Appendix 4 Limit of quantification, sludge and biota samples Appendix 5 Measured concentrations in surface water Appendix 6 Measured concentrations in biota Appendix 7 Measured concentrations in incoming sewage water Appendix 8 Measured concentrations in sewage effluent Appendix 9 Removal efficiencies Appendix 10 Measured concentrations in sludge Appendix 11 Calculated concentration ratios Appendix 12 Measured concentrations in drinking water Appendix 13 Results from the Regional Screening (7 pharmaceuticals) Appendix 14 Results from the Regional Screening (101 pharmaceuticals)

Results from the Swedish National Screening Programme 2010 IVL report B2014 Subreport 3. Pharmaceuticals
4
1 Introduction
As an assignment from the Swedish Environmental Protection Agency, screening studies of Polychlorinated naphtalenes (PCN), Fluorescent whitening agents (FWA) and Pharmaceuticals have been performed during 2010/2011. The overall objectives of the screening studies are to determine concentrations of the selected substances in a variety of media in the Swedish environment, to highlight important transport pathways, and to assess the possibility of current emissions in Sweden. The results are presented in three separate reports according to Table 1.
Table 1. Substance groups included in the screening.
Substance group Sub-report #
Polychlorinated naphtalenes (PCN) 1
Fluorescent whitening agents 2
Pharmaceuticals 3
The screening study has been carried out by Swedish Environmental Research Institute (IVL) together with Umeå University (UmU). The chemical analyses of the fluorescent whitening agents were undertaken at IVL, PCN and pharmaceuticals were analysed at UmU.
This sub-report concerns the screening of pharmaceuticals.

Results from the Swedish National Screening Programme 2010 IVL report B2014 Subreport 3. Pharmaceuticals
5
2 Pharmaceuticals as environmental
pollutants
2.1 Background
Pharmaceuticals have been found in various environmental matrices worldwide in concentrations that range from low nanogram up to milligram per liter (Loos et al. 2009; Segura et al. 2009; Fatta-Kassinos et al. 2011, Santos et al. 2011). Pharmaceuticals enter the environment through our sewage system since many pharmaceuticals are not metabolized completely but excreted unchanged (Martindale 2011). Some point sources, such as pharmaceutical production units, can cause extremely elevated levels of pharmaceuticals in certain regions (Fick et al. 2009; Phillips et al. 2010), which has been shown to result in clear environmental impacts (Carlsson et al. 2010; Sanchez et al. 2011). Pharmaceuticals are potent, biologically active chemicals and there is an increased focus on the potentially negative effects of pharmaceuticals in the environment. Numerous laboratory studies on aquatic organisms have illustrated that various pharmaceuticals can cause negative effects on growth, development and reproduction (Lange et al. 2001; Fent et al. 2006; Kidd et al. 2007; Zeilinger et al. 2009; Santos et al. 2010). One effect that has been studied in detail is reproductive disorders in fish and it has been shown for example that ethinylestradiol causes severe reproductive disorders at low ng/L concentrations (Lange et al. 2001; Kidd et al. 2007). Levonorgestrel, a synthetic gestagen which is commonly used in oral contraceptives, was shown to inhibit reproduction in fathead minnow at concentrations below 1 ng/L (Zeilinger et al. 2009). Since raw sewage and wastewater effluent is a major source of the pharmaceuticals detected in the environment, a lot of researchers has studied the characteristics of the removal processes in laboratory, semi and full scale (Lindberg et al. 2005; Vieno et al. 2005; Lindberg et al 2010; Gros et al. 2010; Jelic et al. 2011 Fatta-Kassinos et al. 2011, Santos et al. 2011).
2.2 Selection of pharmaceuticals to include in the screening
There is a wide range of pharmaceuticals available globally, e.g. to date there are more than 6000 pharmaceuticals on the global market (Martindale 2011). Therefore various prioritization approaches is used in order to select which pharmaceuticals that should be included in monitoring schemes. Different strategies have been applied; including usage of sales statistics and more rational strategies for example mode-of-action based tests (Huggett et al. 2003; Sanderson et al. 2004; Besse and Garric, 2008). One useful approach was suggested by Huggett et al. (Huggett et al. 2003) and has been named “the fish plasma model”. This model is based on the assumption that if two species share the same drug target, the pharmaceuticals are expected to activate this target at roughly the same plasma

Results from the Swedish National Screening Programme 2010 IVL report B2014 Subreport 3. Pharmaceuticals
6
concentration. The fish plasma model generates a concentration ratio (CR) between the human therapeutic plasma concentrations (HTPC) and a measured, or theoretically predicted, fish steady state plasma concentration (FSSPC). If the concentration ratio is < 1 then the plasma concentration in the exposed fish is equal to, or higher, than the plasma concentration that is known to cause a pharmacological response in humans. A lower ratio thus reflects a higher risk. One major benefit of this model is that it enables theoretical risks to be calculated for the great majority of pharmaceuticals, since human therapeutic plasma concentrations are readily available in the literature.
Fick et al (Fick et al. 2010) recently calculated the surface water concentration for 500 pharmaceuticals that theoretically would result in a pharmacologically relevant fish steady state plasma concentration. This surface water concentration was described as the “critical environmental concentration” and was derived from theoretically predicted FSSPCs and published human therapeutic plasma concentrations. By combining predicted or measured environmental concentrations, with the CEC values for these pharmaceuticals it is possible to predict or calculate CRs in a specific region.
Selection of pharmaceuticals included in the screening was based on this concept; in addition, antibiotics and some pharmaceuticals that have been included in previous screening programmes were also included. The majority of the samples (n=55) in the regional screening program (3.2) were analyzed for only seven of these substances.
3 Sampling strategy and study sites
3.1 National screening program
A sampling strategy was developed in order to determine concentrations of pharmaceuticals in the Swedish environment and to study the removal effiency of four Swedish wastewater treatment plants (WWTPs). The sampling programme was focused on diffuse emissions from urban areas and distribution from WWTPs and their receiving waters. The sampling programme also included samples from non-urban areas without direct impact of WWTPs, and drinking water. Biota samples (fish) from surface water that receive sewage effluent as well as samples from locations not affected by sewage effluent were also included. Individual samples are listed in Appendix 1.
The measurements from the WWTPs included influent, effluent and sludge. Surface water samples upstream and at several locations downstream of two of the included WWTPs, Stadskvarn, Skövde and Kungsängsverket, Uppsala, were analysed. The sampling program is summarized in Table 2.

Results from the Swedish National Screening Programme 2010 IVL report B2014 Subreport 3. Pharmaceuticals
7
Table 2. Samples included in the national screening program.
Type WWTP
influent WWTP
effluent WWTP sludge
Surface water
Drinking water
Biota Total
Background areas
Lakes 2 2 4
Urban areas
Skövde, Stadskvarn WWTP 3 3 1 7 Stockholm, Henriksdal WWTP 3 3 1 7 Umeå, Öhn WWTP 3 3 1 7 Uppsala, Kungsängsv. WWTP 3 3 1 7 Skövde 6 2 8 Uppsala 5 3 8 Drinking water, Stockholm 3 3 Drinking water, Umeå 3 3 Total 12 12 4 13 6 7 54
3.2 Regional screening program
In addition to the national screening program Swedish county administrative boards had the opportunity to collect and send samples for analysis. Several administrative counties participated and samples included effluent and sludge from municipal WWTPs, surface water and biota, Table 3.
Table 3 Samples included in the regional screening program. The number of samples are shown as x+y were x was analyzed for 101 substances and y for seven substances.
Type WWTP
Influent WWTP
Effluent WWTP Sludge
Surface water
Biota Sediment Total
WWTPs 0+9 1+18 1+12 2+39
Rivers and lakes 2+8 8+5 0+3 10+16
Total 9 19 13 10 13 3 12+55

Results from the Swedish National Screening Programme 2010 IVL report B2014 Subreport 3. Pharmaceuticals
8
4 Methods
4.1 Sampling
Surface waters were sampled directly into 1 litre polyethene (PE) bottles at approximately 0.5 m depth using a telescopic bottle holder. The staff at the different WWTPs collected influent and effluent water samples in 1 litre PE bottles and de-watered sludge from the anaerobic chambers into PE jars. The samples were stored frozen (-18°C) until analysis. Fish were caught using fishing net and stored frozen. Perch was chosen in Skövde and Uppsala because it is one of the most stationary fish species in both investigated areas. Fish muscle was dissected from the dorsal muscle using solvent washed scalpels. A composite sample from around ten individuals from each site was prepared.
4.2 Analysis
4.2.1 Chemicals All pharmaceutical reference standards were classified as analytical grade (>98%). Sulphuric acid (99.999%) were purchased from Sigma-Aldrich (Steinheim, Germany) and ethyl acetate (Analytical reagent, 99.8%) were purchased from Labscan Ltd., (Dublin, Ireland). 2H6
-amitriptyline, 2H10-carbamazepine, 13C315N-ciprofloxacin , 2H5-fluoxetine, 13C6-
sulfamethoxazole, , 13C2H3-tramadol and 13C3-trimethoprim were bought from Cambridge Isotope Laboratories (Andover, MA, USA). 2H5-oxazepam, 2H7-promethazine, 2H4-risperidone, and 13C2
15N-tamoxifen were bought from Sigma-Aldrich (Steinheim, Germany). Methanol and acetonitrile were purchased in LC/MS grade quality (Lichrosolv - hypergrade, Merck, Darmstadt, Germany). The purified water was prepared by an Milli-Q Gradient ultrapure water system (Millipore, Billerica, USA), equipped with a UV radiation source. The buffering of the mobile phases was performed by addition of 1ml of formic acid (Sigma-Aldrich, Steinheim, Germany) to 1 L of solvent.
4.2.2 Sample preparation All water samples (incoming sewage, treated effluent, surface and drinking water) (100 mL) were filtered through a 0.45 µm membrane filter (MF, Millipore, Sundbyberg, Sweden) and acidified to pH 3 using sulfuric acid. Then 50 ng of each of the 12 isotopically labelled pharmaceuticals used as internal and surrogate standards were added to each sample. Solid phase extraction (SPE) columns (Oasis HLB, 200mg, Waters Corporation, Milford, MA, USA) were pre-conditioned and equilibrated with 5.0 mL of methanol and 5.0 mL of de-ionized water. Samples were applied to the SPE columns at a flow rate of 5 mL min-1. Water with 5 % methanol was used to wash the SPE column before eluting with 5 mL of methanol. Eluates were collected in 10 mL vials, evaporated to 20 µL under a gentle air stream, and dissolved in 5 % acetonitrile in water to a final volume of 1.0 mL.

Results from the Swedish National Screening Programme 2010 IVL report B2014 Subreport 3. Pharmaceuticals
9
Sludge samples were first freeze dried and 0.1 g (dry weight) were used for extration. Before extraction 50 ng of each internal and surrogate standard were added to the sludge. Extraction was sequentially performed first using 1.5 ml ethylacetate and methanol (1:1 mixture) followed by 1.5 ml methanol and water (7:3 mixture) with 5% triethylamine. Samples were homogenized for four minutes at 42 000 oscillations per minute, using a Mini Beadbeater (Biospec. Bartlesville, USA) with zirconium beads and then centrifuged at 14 000 revolutions per minute for 10 min. This protocol was followed for both eluent
mixtures and the supernatants were combined, evaporated to 20 L and reconstituted in 1 ml water and acetonitrile (95:5 mixture) with 0.1% formic acid. Fish muscle samples (0.1 g) were extracted sequentially after addition of 50 ng of each internal and surrogate standard. Three sequential extractions were done; 1.5 ml methanol and water (7:3) with 0.1% formic acid; 1.5 ml acetonitrile and 1.5 ml acetonitrile. Samples were homogenized for four minutes at 42 000 oscillations per minute, using a Mini Beadbeater (Biospec. Bartlesville, USA) with zirconium beads and then centrifuged at 14 000 revolutions per minute for 10 min. This protocol was followed for all three eluent
mixtures individually and the supernatants were combined, evaporated to 20 L and reconstituted in 1 ml water and acetonitrile (95:5 mixture) with 0.1% formic acid.
4.2.3 Instrumental analysis The same methodology as that reported by Grabic et al. (2011) was used for this analysis. In short, a triple stage quadrupole MS/MS TSQ Quantum Ultra EMR (Thermo Fisher Scientific, San Jose, CA, USA) coupled with an Accela LC pump (Thermo Fisher Scientific, San Jose, CA, USA) and a PAL HTC autosampler (CTC Analytics AG, Zwingen, Switzerland) were used as analytical system. Sample (20 µL) was loaded onto a Hypersil GOLD aQ TM column (50 mm x 2.1 mm ID, 5 µm particles, Thermo Fisher Scientific, San Jose, CA, USA) preceded by a guard column (2 mm×2.1 mm i.d, 5 µm particles) of the same packing material and from the same manufacturer. A gradient of flow and methanol and acetonitrile in water (all solvents buffered by 0.1% formic acid) was used for elution of analytes. The elution conditions were programmed as follows: 200 µL min-1 10% methanol in water for 1 min isocratically, then composition is changed to 30/10/60 water/ acetonitrile / methanol and flow of 250 µL min-1 at 8 min. Then the column was washed by mixture ACN/ methanol 60/40 and flow of 300 µl min-1 in 9 minutes. These parameters were kept for 1 min and then they were switched to starting conditions and equilibrated for 4 min before next run. Heated electrospray (HESI) and atmospheric pressure photo ionization (APPI) in positive and negative mode was used for ionisation of target compounds. Both first and third quadrupole were operated at resolution 0.7 FMWH, and two or three SRM transitions were monitored for each analyte. The setting of key parameters, SRM transitions, absolute recoveries, etc is stated in Grabic et al. (2011). Samples were quantified using internal standard method. Several calibration standards covering all concentration range were measured before, in the middle and at the end of

Results from the Swedish National Screening Programme 2010 IVL report B2014 Subreport 3. Pharmaceuticals
10
sample sequences. The maximum difference between results at quantification and qualification mass transition was set to 30% as criterion for positive identification.
4.2.4 Quality control Possible memory effects were evaluated by a blank injection of Milli-Q water after standard samples of varying concentrations. Field and laboratory blank samples were included in each batch. Standards were analyzed in a wide concentration range (0.005 ng ml-1 to 5000 ng ml-1) and were used for evaluating the linearity, sensitivity - quantification limit (LOQ) defined as 10 times the standard deviation of the blank, reproducibility of retention, precision as repeatability, and column stability. Method recoveries were determined by spiking the standard solution to matrix at the following concentration levels: milliQ water (100 ng L-1), surface water (100 ng L-1) and sewage effluent (1000 ng L-1). Analyte addition was made with the criteria that the spiking would be at a level at least three times the original concentration in surface water and sewage effluent, respectively.
5 Results and discussion, national program
No pharmaceuticals were detected in the laboratory blank samples and in the blank injections of Milli-Q water. Limit of quantification of the used methods are presented in appendix 3 and 4. The results of the measurements of the pharmaceuticals are presented in detail in Appendix 5-12 where the concentrations of the individual pharmaceuticals are given. All results from the regional screening program are presented in Appendix 13 and 14.
5.1 Background areas
Several pharmaceuticals were detected in surface water and biota from freshwater background lakes. Low ng/L levels of 33 pharmaceuticals were detected in Lake Älgsjön (sample N1, appendix 6) and 27 pharmaceuticals were detected in Lake Tärnan (sample N2, appendix 6). Trace amounts of two pharmaceuticals were detected in fish from Lake Älgsjön (sample N3, appendix 7) and five pharmaceuticals in fish from Lake Tärnan (sample N4, appendix 7). These lakes represent background surface water with no connection to effluent from WWTPs, only direct antropogenic contamination from people in the region. This diffuse direct contamination produces a pattern that differs from the concentrations in treated effluent. For example common painkillers, e.g. paracetamol, that are removed to a large extent in WWTPs, can be found in relatively high amounts in diffuse contaminated locations , which has been seen in previous Swedish screening studies (Andersson et al. 2006; Remberger et al. 2009).
Results from the Swedish National Screening Programme 2010 IVL report B2014 Subreport 3. Pharmaceuticals
11
5.2 Sewage treatment plants
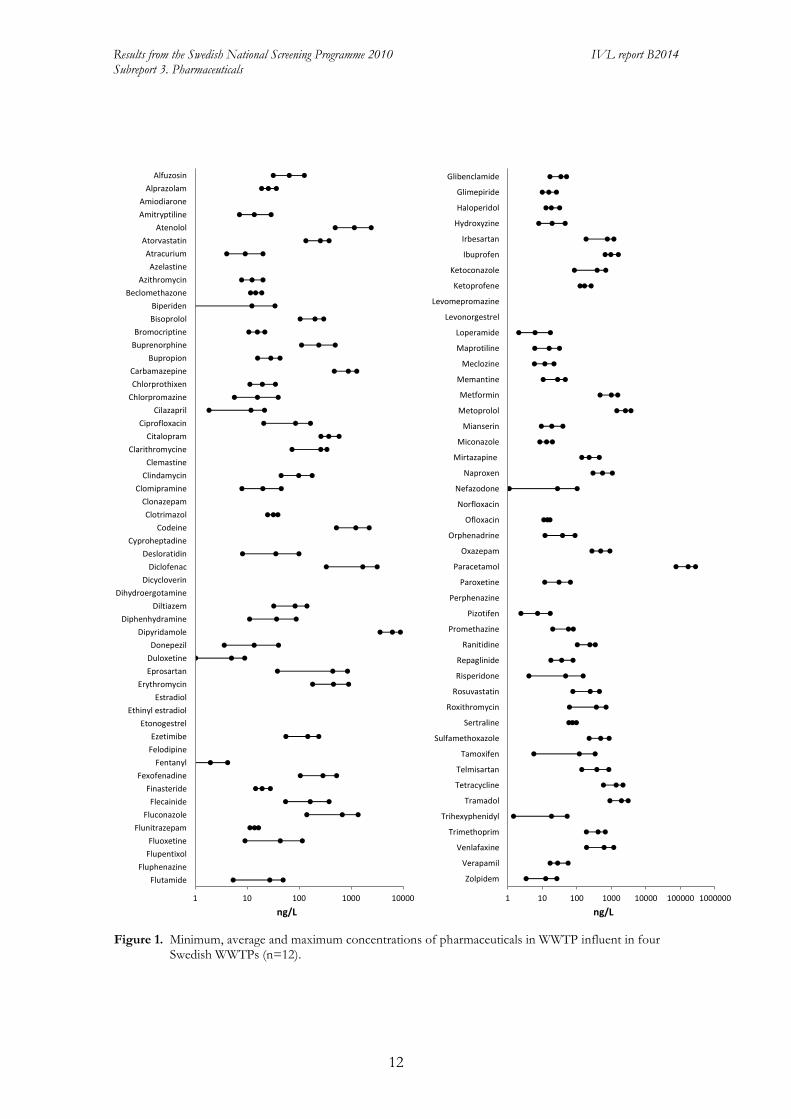
5.2.1 WWTP influent Levels of pharmaceuticals were measured on three consecutive days in influent water to the WWTPs, with the exception of WWTP Kungsängsverket in Uppsala where the tree sampling days were taken once weekly for three weeks. The WWTPs in Skövde (Stadskvarn), Stockholm (Henriksdal), Umeå (Ön) and Uppsala (Kungsängsverket), are all relatively large, treating water from approximately 57 000, 835 000, 100 000 and 160 000 person equivalents respectively. Of the 101 pharmaceuticals included in this study 92 were detected in the WWTP influent
of at least one WWTP, see appendix 7. Levels ranged from low ng/L up to 540 g/L, with a median concentration of 53 ng/L. Paracetamol was the pharmaceutical that was detected
in highest amounts, up to 540 g/L. Maximum, minimum and median concentrations of all detected pharmaceuticals in the studied WWTP influents are shown in figure 1. Measured levels in this study correlate to measured levels in the literature (eg. Santos et al 2010; Gros et al. 2011 ) as well as to the levels in a study made by the Swedish environmental protection agency (SEPA 2008) and previous national screening studies (Andersson et al. 2006; Woldegiorgis et al. 2007; Remberger et al. 2009). For example, thirty-one pharmaceuticals were included in both the SEPA report and this screening and most levels correlate, some variations can be seen eg. measured ibuprofen levels are lower and the diclofenac levels are higher in this screening (SEPA 2008).
Results from the Swedish National Screening Programme 2010 IVL report B2014 Subreport 3. Pharmaceuticals
12
Figure 1. Minimum, average and maximum concentrations of pharmaceuticals in WWTP influent in four
Swedish WWTPs (n=12).
1 10 100 1000 10000
Alfuzosin
Alprazolam
Amiodiarone
Amitryptiline
Atenolol
Atorvastatin
Atracurium
Azelastine
Azithromycin
Beclomethazone
Biperiden
Bisoprolol
Bromocriptine
Buprenorphine
Bupropion
Carbamazepine
Chlorprothixen
Chlorpromazine
Cilazapril
Ciprofloxacin
Citalopram
Clarithromycine
Clemastine
Clindamycin
Clomipramine
Clonazepam
Clotrimazol
Codeine
Cyproheptadine
Desloratidin
Diclofenac
Dicycloverin
Dihydroergotamine
Diltiazem
Diphenhydramine
Dipyridamole
Donepezil
Duloxetine
Eprosartan
Erythromycin
Estradiol
Ethinyl estradiol
Etonogestrel
Ezetimibe
Felodipine
Fentanyl
Fexofenadine
Finasteride
Flecainide
Fluconazole
Flunitrazepam
Fluoxetine
Flupentixol
Fluphenazine
Flutamide
ng/L
1 10 100 1000 10000 100000 1000000
Glibenclamide
Glimepiride
Haloperidol
Hydroxyzine
Irbesartan
Ibuprofen
Ketoconazole
Ketoprofene
Levomepromazine
Levonorgestrel
Loperamide
Maprotiline
Meclozine
Memantine
Metformin
Metoprolol
Mianserin
Miconazole
Mirtazapine
Naproxen
Nefazodone
Norfloxacin
Ofloxacin
Orphenadrine
Oxazepam
Paracetamol
Paroxetine
Perphenazine
Pizotifen
Promethazine
Ranitidine
Repaglinide
Risperidone
Rosuvastatin
Roxithromycin
Sertraline
Sulfamethoxazole
Tamoxifen
Telmisartan
Tetracycline
Tramadol
Trihexyphenidyl
Trimethoprim
Venlafaxine
Verapamil
Zolpidem
ng/L

Results from the Swedish National Screening Programme 2010 IVL report B2014 Subreport 3. Pharmaceuticals
13
5.2.2 WWTP effluent Levels of pharmaceuticals were measured on three consecutive days in effluent sewage from the WWTPs, with the exception of WWTP Kungsängsverket in Uppsala where the tree sampling days were taken once weekly for three weeks. Of the 101 pharmaceuticals included in this study 85 were detected in the effluent of at
least one WWTP, see appendix 8. Levels ranged from low ng/L up to 4 g/L, with a median concentration of 35 ng/L. Diclofenac was the pharmaceutical that was detected in
highest amounts, up to 3.9 g/L. Levels of paracetamol, the pharmaceutical that was detected in the highest amounts in WWTP influent, was dramatically reduced and did not exceed 580 ng/L. Maximum, minimum and median concentrations of all detected pharmaceuticals in the studied WWTP effluents are shown in figure 2. Measured levels of pharmaceuticals in the treated effluent correlate to measured levels in the literature (eg. Santos et al 2010; Gros et al. 2011) as well as to the levels in previous screening studies (Andersson et al. 2006; Woldegiorgis et al. 2007; Remberger et al. 2009). Of the thirty-one pharmaceuticals that were included in both this screening campaign and the SEPA report, most levels correlate, some variations can be seen eg. measured ibuprofen levels are lower in effluent as well and the diclofenac levels are higher in this screening (SEPA 2008).

Results from the Swedish National Screening Programme 2010 IVL report B2014 Subreport 3. Pharmaceuticals
14
Figure 2. Minimum, average and maximum concentrations of pharmaceuticals in treated sewage effluent in
four Swedish WWTPs (n=12).
1 10 100 1000 10000
Alfuzosin
Alprazolam
Amiodiarone
Amitryptiline
Atenolol
Atorvastatin
Atracurium
Azelastine
Azithromycin
Beclomethazone
Biperiden
Bisoprolol
Bromocriptine
Buprenorphine
Bupropion
Carbamazepine
Chlorprothixen
Chlorpromazine
Cilazapril
Ciprofloxacin
Citalopram
Clarithromycine
Clemastine
Clindamycin
Clomipramine
Clonazepam
Clotrimazol
Codeine
Cyproheptadine
Desloratidin
Diclofenac
Dicycloverin
Dihydroergotamine
Diltiazem
Diphenhydramine
Dipyridamole
Donepezil
Duloxetine
Eprosartan
Erythromycin
Estradiol
Ethinyl estradiol
Etonogestrel
Ezetimibe
Felodipine
Fentanyl
Fexofenadine
Finasteride
Flecainide
Fluconazole
Flunitrazepam
Fluoxetine
Flupentixol
Fluphenazine
Flutamide
ng/L
1 10 100 1000 10000
Glibenclamide
Glimepiride
Haloperidol
Hydroxyzine
Irbesartan
Ibuprofen
Ketoconazole
Ketoprofene
Levomepromazine
Levonorgestrel
Loperamide
Maprotiline
Meclozine
Memantine
Metformin
Metoprolol
Mianserin
Miconazole
Mirtazapine
Naproxen
Nefazodone
Norfloxacin
Ofloxacin
Orphenadrine
Oxazepam
Paracetamol
Paroxetine
Perphenazine
Pizotifen
Promethazine
Ranitidine
Repaglinide
Risperidone
Rosuvastatin
Roxithromycin
Sertraline
Sulfamethoxazole
Tamoxifen
Telmisartan
Tetracycline
Tramadol
Trihexyphenidyl
Trimethoprim
Venlafaxine
Verapamil
Zolpidem
ng/L

Results from the Swedish National Screening Programme 2010 IVL report B2014 Subreport 3. Pharmaceuticals
15
5.2.3 Removal efficiency Removal efficiencies were calculated according to the equation ( (Infl – Effl) / Infl ) and were based on the average values from the three sampling days, average from all four WWTPs are presented in Table 4.
Removal efficiencies in this study can be compared to the calculated removal efficiencies that were done in a SEPA report (SEPA 2008) and that were based on measured data from 2003-2008 from 43 Swedish WWTPs, see Table 4. This report uses a classification system where the removal rates are classified from A to F; A > 95%, B 94-80 %, C 79-50%, D 49-10%, E 9-0%, F < 0% (SEPA 2008). Only three pharmaceuticals, dipyradimole, paracetamol and tetracycline were classified as belonging to group A. Five pharmaceuticals, buprenorphine, flupentixol, fluphenazine, perphenazine and ranitidine were classified as belonging to group B, eighteen pharmaceuticals were classified to belong to group C and forty-two pharmaceuticals to group D. Seven pharmaceuticals were not removed at all and were classified as group E. Seventeen pharmaceuticals had negative removal rates and were classified as Group F.
Two pharmaceuticals that are commonly included in studies of removal efficiencies are diclofenac and carbamazepine, these had removal rates that ranged from negative values up to 64 and 33% respectively, which corresponds to removal rates previously measured in WWTPs (Vieno et al., 2007; Zhang et al., 2008, Zorita et al. 2009). Removal efficiencies in this study also correlate to values in previous screening studies (Andersson et al. 2006; Woldegiorgis et al. 2007; Remberger et al. 2009). Direct comparisons can be complicated, partly due to the fact that for pharmaceuticals that could only be detected in influent and not effluent, removal efficiencies were calculated using the LOQ and the analytical methods used have different LOQs.
Measurements of the removal efficiencies of the individual WWTPs are presented in appendix 9. These values vary a lot between the different pharmaceuticals and the different WWTPs, some like pharmaceuticals like paracetamol and naproxen have more or less the same removal efficiency in all investigated WWTPs but other pharmaceuticals like haloperidol have a removal rate of >90% in one WWTP and a negative removal rate in another. Pharmaceuticals have been shown to have large variations in different studies at different WWTPs (eg. Lindberg et al. 2005; Vieno et al. 2005; Zorita et al. 2009; Gros et al. 2010; Jelic et al. 2011) and this can be partially be explained by seasonal changes, individually treatment optimizations at each WWTPs, different conditions and loads of the WWTPs, etc.

Results from the Swedish National Screening Programme 2010 IVL report B2014 Subreport 3. Pharmaceuticals
16
Table 4. Average removal efficiencies (RR) and classifications into groups: A > 95%, B 94-80 %, C 79-50%, D 49-10%, E 9-0%, F < 0% (SEPA 2008)
This study SEPA 2008 This study SEPA 2008
RR(%) Group RR(%) Group RR(%) Group RR(%) Group
Alfuzosin -2.1 F Fluoxetine 13 D -184 F
Alprazolam > 38 > D Flupentixol 80 B
Amiodiarone Fluphenazine 84 B
Amitryptiline -12 F Flutamide > 3.0 > E
Atenolol 51 C 9 D Glibenclamide -67 F
Atorvastatin > 67 > C 96 A Glimepiride -44 F
Atracurium 26 D Haloperidol 28 D
Azelastine 49 D Hydroxyzine 50 C
Azithromycin -21 F Ibuprofen 71 C >85 > B
Beclomethazone > 29 > D Irbesartan 36 D
Biperiden 36 D Ketoconazole > 62 > C > 89 > B
Bisoprolol 39 D Ketoprofene 36 D >51 > C
Bromocriptine > 65 > C Levomepromazine
Buprenorphine 87 B Levonorgestrel
Bupropion 24 D Loperamide -72 F
Carbamazepine -3 F -40 F Maprotiline > -2.7 > F
Chlorprothixen > 8.0 > E Meclozine 2 E
Chlorpromazine > 34 > D Memantine 11 D
Cilazapril > 34 > D Metformin > 61 > C 70 C
Ciprofloxacin 61 C 69 C Metoprolol 31 D -24 F
Citalopram 11 D -62 F Mianserin -28 F
Clarithromycine 54 C Miconazole 36 D
Clemastine -12 F Mirtazapine 14 D
Clindamycin -73 F Naproxen 72 C >69 > C
Clomipramine 52 C Nefazodone 2 E
Clonazepam Norfloxacin > 17 > D > 21 > D
Clotrimazol 30 D Ofloxacin > 7.0 > E > 80 > B
Codeine 68 C 71 C Orphenadrine 44 D
Cyproheptadine 49 D Oxazepam -6 F >-11 > F
Desloratidin 15 D Paracetamol 100 A
Diclofenac 28 D 11 D Paroxetine > 43 > D > 4.1 E
Dicycloverin -50 F Perphenazine 89 B
Dihydroergotamine Pizotifen 30 D
Diltiazem 42 D Promethazine 51 C
Diphenhydramine 16 D Ranitidine 85 B -431 F
Dipyridamole > 99 A Repaglinide 60 C
Donepezil 30 D Risperidone -101 F
Duloxetine > 29 > D Rosuvastatin > 63 > C
Eprosartan 46 D Roxithromycin > 39 > D
Erythromycin 43 D > 28 > D Sertraline 71 C 18 D
Estradiol >72 > C Sulfamethoxazole 73 C >48 > D
Ethinyl estradiol > 42 > D Tamoxifen > 26 > D
Etonogestrel Telmisartan 58 C
Ezetimibe > 45 > D Tetracycline > 96 A >80 > B
Felodipine -2 F Tramadol -3 F
Fentanyl -30 F Trihexyphenidyl 40 D
Fexofenadine 37 D Trimethoprim 39 D >-17 > F
Finasteride 6 E Venlafaxine 21 D
Flecainide 0 E Verapamil 26 D
Fluconazole 33 D Zolpidem -7 F 23 D
Flunitrazepam > 27 > D
Several pharmaceuticals show negative removal rates, which indicate an increase in concentration in the treated effluent compared to the influent (Table 3 and appendix 9). Negative removal rates are often encountered in removal efficiencies studies and several researchers have reported this (Vieno et al. 2007; Zorita et al. 2009; Gros et al. 2010; Jelic et al. 2011). Negative removal can be explained, to some extent by the deconjugation of metabolites, such as eg. glucuronide conjugates, that are converted back to the original

Results from the Swedish National Screening Programme 2010 IVL report B2014 Subreport 3. Pharmaceuticals
17
compound in the WWTPs. Unless specific gluconiride conjugates are included in the screening this deconjugation will appear as negative removal. This variation can also be caused by variations in the consumption and the sampling protocol applied in this investigation, 24 hour composite samples for three consecutive days, are considered to be a robust strategy but it is not fool proof and sudden spikes could be missed.
5.2.4 WWTP sludge Levels of pharmaceuticals in digested dewatered sludge from all four WWTPs were measured and the results are presented in figure 3 and appendix 10. Seventy-three pharmaceuticals were detected at levels range from low ng/Kg up to mg/Kg. The pharmaceutical that was detected at the highest level, 1.8 mg/Kg, was ketoconazole, an antimycotic, and similar levels have been detected previously in a Swedish screening study (Lindberg et al. 2010). Measured concentrations correlate to previously published levels (Lindberg et al. 2005; Andersson et al. 2006; Woldegiorgis et al. 2007; SEPA 2008; Jelic et al. 2011) with the exception of the fluoroquinolone antibiotic ciprofloxacin. In this study, levels of ciprofloxacin were an order of magnitude lower than in previous Swedish studies (Lindberg et al. 2005; SEPA 2008). This decrease can not be explained by a reduced usage or seasonal variations (data not shown).

Results from the Swedish National Screening Programme 2010 IVL report B2014 Subreport 3. Pharmaceuticals
18
Figure 3. Detected pharmaceuticals ( g/Kg) in dewatered digested sludge from the WWTPs Stadskvarn,
Skövde (N29), Henriksdal, Stockholm (N30), Ön, Umeå (N31) and Kungsängsverket, Uppsala (N32).
0 200 400 600 800 1000 1200 1400 1600 1800
AlfuzosinAlprazolam
AmitryptilineAtenolol
AtorvastatinAtracurium
AzithromycinBiperidenBisoprolol
BromocriptineBuprenorphine
BupropionCarbamazepineChlorpromazine
CilazaprilCiprofloxacin
CitalopramClarithromycine
ClemastineClindamycin
ClomipramineClonazepamClotrimazol
CodeineCyproheptadine
DesloratidinDiclofenac
DiphenhydramineDipyridamole
DonepezilDuloxetineEprosartan
ErythromycinFentanyl
FexofenadineFinasterideFlecainide
FluconazoleFlunitrazepam
FluoxetineHaloperidol
HydroxyzineIbuprofenIrbesartan
KetoconazoleLoperamideMaprotiline
MeclozineMemantineMetoprolol
MianserinMiconazole
MirtazapineNaproxen
NefazodoneNorfloxacin
OfloxacinOrphenadrine
OxazepamParacetamol
ParoxetinePizotifen
PromethazineRepaglinideRisperidone
RosuvastatinSertraline
SulfamethoxazoleTamoxifen
TelmisartanTetracycline
TramadolTrihexyphenidyl
TrimethoprimVenlafaxine
VerapamilZolpidem
µg/kg dw
N29
N30
N31
N32
Results from the Swedish National Screening Programme 2010 IVL report B2014 Subreport 3. Pharmaceuticals
19
5.3 Surface water
Of the 101 pharmaceuticals included in this study 66 were detected in the surface water
samples in the range of low ng/l up to 1.8 g/L, figures 4 and 5 (appendix 5). Detected levels are comparable with the lower ranges found in a European-wide survey that included samples from 122 Rivers in 27 European countries (Loos et al. 2009) and levels found in previous screening studies (Andersson et al. 2006; Woldegiorgis et al. 2007; Remberger et al. 2009; Daneshvar et al. 2010). A total of 13 surface samples were analyzed, two samples (N1 and N2) were taken at lakes in a background area in Södermanland County (see 5.1. Background areas) and 11 samples were taken up- and downstream of the WWTPs Stadskvarn (Skövde) and Kungsängsverket (Uppsala). These two WWTPs both receive hospital wastewater and both discharge their treated effluent in small/moderate Rivers. Samples taken downstream of these WWTPs, N35-N38 and N40-N43, can therefore be considered to be effluent-dominated surface water samples. Effluent from WWTP Stadskvarn, Skövde, discharges into the creek Mörkebäcken. The average effluent flow 2010 was 13 100 m3/day (546 m3/h). The natural flow in Mörkebäcken varies but is almost always considerably lower. The creek empties via Svesån and Örnboån into Ösan which eventually empties in Lake Vänern (Bratt 2011). Surface water was sampled at two sites upstream the effluent discharge point; -5 km (N34, Ösan), -1 m (N33) and at four points downstream; 5 m (N35), 50 m (N36), 500 m (N37), (all in Mörkebäcken) and 5 km (N38, Ösan). The sampling was done in November when the flow in Mörkebäcken was relatively high, resulting in an initial dilution factor of around two. There were also high flows from several covered trenches leading to further dilution between the sampling sites N36 and N37. Several pharmaceuticals were detected at the two upstream sites and the pattern, high levels of common antibiotics and NSAIDs, indicate that this is caused by diffuse anthropogenic influence, Figure 4. Levels at site N35, 5 m downstream, is consistently lower that at site N36 50 m downstream, which indicate insufficient mixing prior sampling site N35. Elevated levels of some common antibiotics and NSAIDs at sites N37 and N38 indicates that these sites are influenced by both sewage effluent and diffuse anthropogenic sources.

Results from the Swedish National Screening Programme 2010 IVL report B2014 Subreport 3. Pharmaceuticals
20
Figure 4. Detected pharmaceuticals (ng/L) in surface water samples from Skövde (N33 – N38).
The effluent from WWTP Kungsängsverket, Uppsala, discharges into River Fyris. Surface water was sampled upstream the sewage effluent discharge point; -1.7 km (N39) and at four points downstream; 5 m (N40), 150 m (N41), 3.5 km (N42) and 4.6 km (N43). Concentrations of pharmaceuticals clearly increased in the first downstream sample and then sequentially decreased in the following samples (Figure 5). The annual average flow in Fyrisån is 8.6 m3/s and the average effluent flow from WWTP Kungsängsverket is 2 200 m3/h (Uppsala vatten, 2011), i.e. a mean dilution factor of 14.
0 200 400 600 800 1000
Glibenclamide
Haloperidol
Hydroxyzine
Ibuprofen
Irbesartan
Ketoprofene
Loperamide
Meclozine
Memantine
Metoprolol
Mianserin
Miconazole
Mirtazapine
Naproxen
Nefazodone
Orphenadrine
Oxazepam
Paracetamol
Pizotifen
Ranitidine
Repaglinide
Risperidone
Rosuvastatin
Roxithromycin
Sertraline
Sulfamethoxazole
Tamoxifen
Telmisartan
Tramadol
Trihexyphenidyl
Trimethoprim
Venlafaxine
Verapamil
Zolpidem
ng/L
N33
N34
N35
N36
N37
N38
1100
0 200 400 600 800 1000
Alfuzosin
Alprazolam
Atenolol
Atracurium
Azithromycin
Biperiden
Bisoprolol
Buprenorphine
Bupropion
Carbamazepine
Cilazapril
Ciprofloxacin
Citalopram
Clarithromycine
Clemastine
Clindamycin
Clomipramine
Clotrimazol
Codeine
Desloratidin
Diclofenac
Diltiazem
Diphenhydramine
Eprosartan
Erythromycin
Etonogestrel
Fentanyl
Fexofenadine
Finasteride
Flecainide
Fluconazole
Fluoxetine
Flupentixol
ng/L

Results from the Swedish National Screening Programme 2010 IVL report B2014 Subreport 3. Pharmaceuticals
21
Figure 5. Detected pharmaceuticals (ng/L) in surface water samples from Uppsala (N39 – N43).
One way to evaluate the pharmaceuticals potential to cause adverse effects at given water concentrations is to compare the measured levels to the corresponding critical environmental concentration (CEC) values for each pharmaceutical (Fick et al. 2010). CEC is calculated as the water concentration that would elevate the plasma concentration in ex-posed fish to a level equal to the human therapeutic plasma concentration. Concentration ratios (CEC to measured concentration) of 1 or below indicate that the measured level of that pharmaceutical is expected to cause a pharmacological effect in fish. However, it should be stressed that concentration ratios only reflect the probability for pharmacological interactions to occur, and not whether the interactions would be adverse or not. A total of 465 observations of pharmaceuticals in surface water were made in this study, distributed between 66 pharmaceuticals and 13 samples (appendix 11). Out of these 465 observations, 13 (3 %) had a concentration ratio below 1, i.e. the water concentration of the specific pharmaceutical in these samples are expected to cause a pharmacological
0 200 400 600 800 1000
Glibenclamide
Haloperidol
Hydroxyzine
Ibuprofen
Irbesartan
Ketoprofene
Loperamide
Meclozine
Memantine
Metoprolol
Mianserin
Miconazole
Mirtazapine
Naproxen
Nefazodone
Orphenadrine
Oxazepam
Paracetamol
Pizotifen
Ranitidine
Repaglinide
Risperidone
Rosuvastatin
Roxithromycin
Sertraline
Sulfamethoxazole
Tamoxifen
Telmisartan
Tramadol
Trihexyphenidyl
Trimethoprim
Venlafaxine
Verapamil
Zolpidem
ng/L
N39
N40
N41
N42
N43
1840
1200
0 200 400 600 800 1000
Alfuzosin
Alprazolam
Atenolol
Atracurium
Azithromycin
Biperiden
Bisoprolol
Buprenorphine
Bupropion
Carbamazepine
Cilazapril
Ciprofloxacin
Citalopram
Clarithromycine
Clemastine
Clindamycin
Clomipramine
Clotrimazol
Codeine
Desloratidin
Diclofenac
Diltiazem
Diphenhydramine
Eprosartan
Erythromycin
Etonogestrel
Fentanyl
Fexofenadine
Finasteride
Flecainide
Fluconazole
Fluoxetine
Flupentixol
ng/L

Results from the Swedish National Screening Programme 2010 IVL report B2014 Subreport 3. Pharmaceuticals
22
response in fish exposed to these waters and 57 (12 %) had a concentration ratio between 1 and 10, figure 6.
. Figure 6. Histogram of concentration ratios in surface water samples N1, N2, N33 – N43. Number of
observations in each class are; <1 = 13 (2.8%), 1-10 = 57 (12%), 11-100 = 93 (20%), 101-1000 = 96 (21%), >1000 = 206 (44%).
Five pharmaceuticals were detected at levels below their CEC value. Three were measured in the most polluted surface water samples; the antidepressant citalopram (at sites N36 and N40), the antipsychotic drug flupentixol (at sites N35, N36 and N40), the hypertension drug irbesartan (at sites N35, N36 and N40-N42) and two at the background areas; the opioid buprenorphine (at site N1), the antihistamine meclozine (at sites N1 and N2). Buprenorphine was only detected in surface water at one site and the measured level of 15 ng/L was close to the LOQ of 10 ng/L. Buprenorphine was also detected in one of the three drinking water samples from Stockholm, which implies that these results could be analytical artefacts. It should be emphasized however, that no pharmaceuticals were detected in the laboratory blank samples or the preceeding blank injections of Milli-Q water. Meclozine however, was detected in surface water at levels, 59 ng/L and 25 ng/L in N1 and N2 respectively, which is well above the detection limit of 5 ng/L. Ten additional pharmaceuticals were detected at levels that were between 1-10 of their CEC values; alprazolam, bupropion, clarithromycine, clemastine, diclofenac, haloperidol, loperamide, sertraline, tramadol and verapamil. 11 of the 70 observations of with a concentration ratio < 10, were made in the background area samples and nine were made in the upstream samples. Some of these observations were close to the detection limit and the results should not be extrapolated to far, but these findings suggest that diffuse anthropogenic sources can cause elevated levels of pharmaceuticals, at specific sites, that could cause adverse effects.

Results from the Swedish National Screening Programme 2010 IVL report B2014 Subreport 3. Pharmaceuticals
23
It should be emphasized that the pharmaceuticals that were included in this screening were selected based on their potential to be present in Swedish surface waters in concentrations close to their CEC values. The fact that 15 pharmaceuticals out of 101 were detected at concentrations expected to cause a pharmacological effect in fish can therefore not be extrapolated to pharmaceuticals in general. CEC values can also be used to evaluate the relevancy of the LOQs of the analytical methods used in a screening. When comparing the CEC values with the LOQs for all pharmaceuticals, nine pharmaceuticals were shown to have a LOQ that was higher than the CEC value. This implies that levels of these pharmaceuticals that are expected to cause a pharmacological effect in fish could be reported as below LOQ and these findings would go undetected. Azelastine, buprenorphine, estradiol, ethinyl estradiol, felodipine, flupentixol, levomepromazine, meclozine and perphenazine all have inadequate LOQs.
5.4 Biota
In this study 23 pharmaceuticals were detected in the seven biota (perch) samples, figure 7 (appendix 6). Samples were taken from perch caught in; Älgsjön (N3), Lake Tärnan (N4), upstream (N50) and downstream (N51) WWTP Stadskvarn, Skövde, upstream (N52) and (N53, N54) downstream WWTP Kungsängsverket, Uppsala (appendix 1). Concentrations
were in the low g/Kg range and highest detected levels were found in the perch (N53) caught in close proximity to the WWTP Kungsängsverkets (Uppsala) discharge point in River Fyris, figure 7 (appendix 6). Most of the pharmaceuticals detected in the biota samples are directly correlated to the levels in corresponding surface water, (appendix 5 and appendix 6). Studies of pharmaceutical accumulation in fish in effluent-dominated rivers in the US have shown similar levels of diphenhydramine, sertraline and fluoxetine (Brooks et al. 2005; Ramirez et al. 2009; Schultz et al. 2010).

Results from the Swedish National Screening Programme 2010 IVL report B2014 Subreport 3. Pharmaceuticals
24
Figure 7. Detected pharmaceuticals (µg/Kg) in biota samples N3, N4, N50 – N54.
0 1 2 3 4 5 6 7 8 9 10 11 12 13 14 15 16 17 18 19 20
Alfuzosin
Biperiden
Clomipramine
Clotrimazol
Codeine
Diphenhydramine
Flecainide
Fluoxetine
Glibenclamide
Haloperidol
Hydroxyzine
Irbesartan
Memantine
Nefazodone
Orphenadrine
Oxazepam
Paroxetine
Pizotifen
Risperidone
Sertraline
Sulfamethoxazole
Tamoxifen
Trihexyphenidyl
µg/kg wt
N3
N4
N50
N51
N52
N53
N54

Results from the Swedish National Screening Programme 2010 IVL report B2014 Subreport 3. Pharmaceuticals
25
5.5 Drinking water
Low levels (low ng/L range) of 26 pharmaceuticals were detected in the drinking water samples, figure 8 (appendix 12). There was a significant difference between the drinking water in Stockholm (N44-N46) and Umeå (N47-N49). Only two pharmaceuticals could be detected in the samples from Umeå, carbamazepine and trimethoprim, while 26 pharmaceuticals were detected in the Stockholm samples. Surface water from Lake Mälaren is used as drinking water source in Stockholm while artificial bank filtrated ground-water is used as drinking water source in Umeå, which could explain this difference. Diclofenac was detected in fairly high concentrations in one of the three drinking water samples from Stockholm and the possibility of a contaminated sample can not be excluded even though no pharmaceuticals could be found in the corresponding laboratory blanks. Several pharmaceuticals have been detected in drinking water world-wide, typically in the low ng/L range (Jones et al. 2005; Benotti et al. 2009; Huerta-Fontela et al. 2011; Santos et al: 2011). The World Health Organization recently presented a technical report on the presence of pharmaceuticals in drinking water (WHO 2011). Their conclusion was that adverse human health impacts are very unlikely from exposure of pharmaceutical residues in drinking water and that it is not necessary to implement routine monitoring programmes (WHO 2011).

Results from the Swedish National Screening Programme 2010 IVL report B2014 Subreport 3. Pharmaceuticals
26
Figure 8. Detected pharmaceuticals (ng/L) in drinking water samples from Stockholm (N44 – N46) and
Umeå (N47 – N49).
0 5 10 15 20 25 30 35 40 45
Buprenorphine
Bupropion
Carbamazepine
Citalopram
Diclofenac
Diltiazem
Diphenhydramine
Eprosartan
Flecainide
Fluconazole
Irbesartan
Meclozine
Memantine
Metoprolol
Mianserin
Naproxen
Nefazodone
Norfloxacin
Ofloxacin
Oxazepam
Paracetamol
Repaglinide
Risperidone
Trimethoprim
Venlafaxine
Zolpidem
ng/L
N44
N45
N46
N47
N48
N49
140

Results from the Swedish National Screening Programme 2010 IVL report B2014 Subreport 3. Pharmaceuticals
27
6 Results, regional program
WWTP influents (n=9) were analysed for seven substances. Carbamazepine, ketoconazole and sertraline were found in most waters but not in concentrations higher than in the national program. In the national program metformin was found in influents to Umeå and Uppsala WWTPs, but not in influents to Skövde or Henriksdal (Stockholm). However, metformin was found in all regional samples in concentrations similar to Umeå and Uppsala. WWTP effluents (n=19) were analysed for seven substances. Carbamazepine was found in all samples but in concentrations in the lower range of what was found nationally. In the national program metformin was found only in effluent from Umeå WWTP. Regionally it was found in 13 out of 19 effluents, the concentrations were highest in Skelleftå and Piteå. One effluent (Visby) was analysed for 101 substances. The results were for most substances in the lower range of the national results. One substance (clonazepam) was detected in this sample only, not in any of the national effluents. In the sludge samples (n=12) analysed for seven substances carbamazepine and ketoconazole was found in the same concentration range as in the national program. Concentrations of sertraline in sludge from Skellefteå and Sundsvall were somewhat higher than found nationally. Sludge from Visby was analysed for 101 substances. Concentrations of dipyridamole and trihexyphenidyl were higher than found nationally. Eight surface waters were analysed for seven substances. The sample from Varnumsviken, Kristinehamn stood out as showing the highest results for carbamazepine and sertraline. Ketoconazole and metformin was found in this, but not in any other surface water. Surface water from Gothemsån and Djupasjön was analysed for 101 substances. Buprenorphine was detected in both but not in any other surface water. Three substances (dicycloverin, hydroxyzine, perphenazine) was found in Gothemsån in higher concentrations than in any other surface water. Six substances (buprenorphine, nefazodone, paroxetine, pizotifen, tetracycline, trihexyphenidyl) were found in Djupasjön in higher concentrations than in any other surface water. Five perch samples was analysed for seven substances. None of these were detected. In the eight biota samples analysed for 101 substances, four were detected that was not found in the national samples; carbamazepin in the eel from Askeröfjorden, buprenorphine in the roach from Djupasjön, bupropion in the mussel from downstream Ryaverket WWTP and fluconazole in the perch from Runn, Falun. None of the remaining substances were found in a higher concentration than in the national program. The highest number of substances (10) was found in the eel from Askeröfjorden.

Results from the Swedish National Screening Programme 2010 IVL report B2014 Subreport 3. Pharmaceuticals
28
7 Conclusions
Most of the pharmaceuticals in the screening (91%) were detected in WWTP influent clearly showing that this is the primary source of environmental residues of pharmaceuticals in Sweden.
Most of the pharmaceuticals in the screening (84%) were also detected in WWTP effluent and the median concentration dropped by one third from WWTP influent (53 ng/L) to WWTP effluent (35 ng/L).
Several pharmaceuticals were detected in high levels in sewage sludge.
Two thirds of the pharmaceuticals (65%) were detected in the surface water samples; in the range low ng/L to 1.8 µg/L. Highest detected levels were found in close proximity to discharge points of WWTPs. In this study 15 out of 101 pharmaceuticals were detected at such levels that they are expected to cause a pharmacological response in fish exposed to these waters.
Several pharmaceuticals (23%) were detected in the biota samples. Concentrations were in the low µg/Kg range. Highest detected levels were found in the perch caught in close proximity to the WWTP Kungsängsverkets (Uppsala) discharge point in River Fyris. This indicates that effluent-dominated surface water in Sweden cause uptake of pharmaceuticals in fish.
Several pharmaceuticals (26%) were detected in drinking water samples. However, recent WHO guidelines clearly indicates that adverse human health impacts are very unlikely from exposure of pharmaceutical residues in drinking water at the detected levels (low ng/L range) and that it is not necessary to include pharmaceuticals in routine monitoring programmes for drinking water.
Suggestions for further studies:
As some of the pharmaceuticals were found in lakes with no load from WWTP effluents, at environmental relevant concentrations, further studies of lakes affected by private sewers only would be interesting
High levels of several pharmaceuticals were detected in the four sewage samples included in this study and the use of sludge in agriculture and for other purposes makes it interesting to study life-time and mobility of pharmaceuticals in this matrix.
The particle bound fraction of pharmaceuticals was not explicitly investigated in this study but is important for uptake in biota and would be of great interest to study further.

Results from the Swedish National Screening Programme 2010 IVL report B2014 Subreport 3. Pharmaceuticals
29
8 Acknowledgement
The staff at the municipal sewage treatment plants are acknowledged for their help during sampling. Fish tissue from background lakes was provided by The Swedish Museum of Natural History. Field sampling was done by Tomas Viktor and Mikael Remberger, IVL.
This study was funded by the Swedish Environmental Protection Agency.
References
Andersson, J., Woldegiorgis, A., Remberger, M., Kaj. L., Ekheden, Y., Dusan, B., Svenson, A., Brorström-Lunden, E., Dye, C., Schlabach, M. 2006. Results from the Swedish National Screening Programme 2005. Subreport 1: Antibiotics, Anti-inflammatory substances and Hormones.
Benotti, M.J., Trenholm, R.A., Vanderford, B.J., Holady, J.C., Stanford, B.D., Snyder, S.A. 2009. Pharmaceuticals and Endocrine Disrupting Compounds in US Drinking Water. Environmental Science & Technology 43 (3), 597-603.
Besse, J.P. and Garric, J. 2008. Human pharmaceuticals in surface waters implementation of a prioritization methodology and application to the French situation. Toxicology Letters 176 (2), 104-123.
Bratt, Pernilla 2011 WWTP Stadskvarn, personal communication
Brooks, B.W., Chambliss, C.K., Stanley, J.K., Ramirez, A., Banks, K.E., Johnson, R.D., Lewis, R.J. 2005. Determination of select antidepressants in fish from an effluent-dominated stream. Environmental Toxicology and Chemistry 24 (2), 464-469.
Carlsson, G., Örn, S., Larsson, D.G.J. 2009. Effluent from Bulk Drug Production Is Toxic to Aquatic Vertebrates. Environmental Toxicology and Chemistry 28 (12), 2656-2662.
Daneshvar, A., Svanfelt, J., Kronberg, L., Prevost, M., Weyhenmeyer, G.A. 2010. Seasonal variations in the occurrence and fate of basic and neutral pharmaceuticals in a Swedish river-lake system. Chemosphere 80 (3), 301-309.
Fatta-Kassinos, D., Meric, S., Nikolaou, A. 2011. Pharmaceutical residues in environmental waters and wastewater: current state of knowledge and future research. Analytical and Bioanalytical Chemistry 399 (1), 251-275.
Fent, K., Weston, A.A., Caminada, D., 2006. Ecotoxicology of human pharmaceuticals. Aquatic Toxicology 76 (2), 122-159.
Fick, J., Söderstrom, H., Lindberg, R.H., Phan, C., Tysklind, M., Larsson, D.G.J., 2009. Contamination of Surface, Ground, and Drinking Water from Pharmaceutical Production. Environ Toxicol Chem 28, 2522-2527.
Fick, J., Lindberg, R.H., Tysklind, M., Larsson, D.G.J. 2010. Predicted critical environmental concentrations for 500 pharmaceuticals. Regulatory Toxicology and Pharmacology 58 (3), 516-523.

Results from the Swedish National Screening Programme 2010 IVL report B2014 Subreport 3. Pharmaceuticals
30
Grabic, R., Fick, J., Lindberg, R.H., Fedorova, G., Tysklind, M., 2011. Multi-residue method for trace level determination of 100 pharmaceuticals in environmental samples by liquid chromatography coupled to triple quadrupole mass spectrometry. Submitted
Gros, M., Petrovic, M., Ginebreda, A., and Barcelo, D., 2010. Removal of pharmaceuticals during wastewater treatment and environmental risk assessment using hazard indexes. Environment International 36 (1), 15-26.
Huerta-Fontela, M., Galceran, M.T., Ventura, F. 2011. Occurrence and removal of pharmaceuticals and hormones through drinking water treatment. Water Research 45 (3), 1432-1442.
Huggett, D.B., Cook, J.C., Ericson, J.F., Williams, R.T. 2003., A theoretical model for utilizing mammalian pharmacology and safety data to prioritize potential impacts of human pharmaceuticals to fish. Hum Ecol Risk Assess 9, 1789-1799.
Jelic, A.,Gros, M., Ginebreda, A., Cespedes-Sanchez, R., Ventura, F., Petrovic, M., Barcelo, D. 2011. Occurrence, partition and removal of pharmaceuticals in sewage water and sludge during wastewater treatment. Water research 45:1165-1176
Jones, O.A., Lester, J.N., Voulvoulis, N. 2005. Pharmaceuticals: a threat to drinking water? Trends in Biotechnology 23 (4), 163-167.
Kidd, K.A., Blanchfield, P.J., Mills, K.H., Palace, V.P., Evans, R.E., Lazorchak, J.M., and Flick,R.W. (2007) Collapse of a fish population after exposure to a synthetic estrogen. Proceedings of the National Academy of Sciences of the United States of America 104 (21), 8897-8901.
Lange, R., Hutchinson, T.H., Croudace, C.P., Siegmund, F., Schweinfurth, H., Hampe, P., Panter, G.H., and Sumpter, J.P. (2001) Effects of the synthetic estrogen 17 alpha-ethinylestradiol on the life-cycle of the fathead minnow (Pimephales promelas). Environmental Toxicology and Chemistry 20 (6), 1216-1227.
Lindberg, R.H., Wennberg, P., Johansson, M.I., Tysklind, M., Andersson, B.A.V. 2005. Screening of human antibiotic substances and determination of weekly mass flows in five sewage treatment plants in Sweden. Environmental Science & Technology 39 (10), 3421-3429.
Lindberg, R.H., Fick, J., Tysklind, M. 2010. Screening of antimycotics in Swedish sewage treatment plants - Waters and sludge. Water Research 44 (2), 649-657.
Loos, R., Gawlik, B.M., Locoro, G., Rimaviciute, E., Contini, S., Bidoglio, G., 2009. EU-wide survey of polar organic persistent pollutants in European river waters. Environ Pollut 157, 561-568.
Martindale S. C. Sweetman (Ed), Martindale: The Complete Drug Reference. Pharmaceutical Press. Electronic version, , London, 2011
Phillips, P.J., Smith, S.G., Kolpin, D.W., Zaugg, S.D., Buxton, H.T., Furlong, E.T., Esposito, K., Stinson, B. 2010. Pharmaceutical Formulation Facilities as Sources of Opioids and Other Pharmaceuticals to Wastewater Treatment Plant Effluents. Environmental Science & Technology 44 (13), 4910-4916.

Results from the Swedish National Screening Programme 2010 IVL report B2014 Subreport 3. Pharmaceuticals
31
Ramirez, A.J., Brain, R.A., Usenko, S., Mottaleb, M.A., O'Donnell, J.G., Stahl, L.L., Wathen, J.B., Snyder, B.D., Pitt, J.L., Perez-Hurtado, P., Dobbins, L.L., Brooks, B.W., Chambliss, C.K. 2009. Occurrence of Pharmaceuticals and Personal Care Products in Fish: Results of A National Pilot Study in the United States. Environmental Toxicology and Chemistry 28 (12), 2587-2597.
Remberger, M., Wiklund, P., Woldegiorgis, A., Viktor, T., Kaj. L., Brorström-Lunden, E. 2009. Anti-inflammatory and analgesic drugs in WWTP influent and effluent streams and the occurrence in the aquatic environment.
Sanderson, H., Johnson, D.J., Reitsma, T., Brain, R.A., Wilson, C.J., Solomon, K.R. 2004. Ranking and prioritization of environmental risks of pharmaceuticals in surface waters. Regulatory Toxicology and Pharmacology 39 (2), 158-183.
Santos, L.H.M.L., Araujo, A.N., Fachini, A., Pena,A., Delerue-Matos, C., Montenegro, M.C.B.S. 2010. Ecotoxicological aspects related to the presence of pharmaceuticals in the aquatic environment. Journal of Hazardous Materials 175 (1-3), 45-95.
Sanchez, W., Sremski, W., Piccini, B., Palluel, O., Maillot-Marechal, E., Betoulle, S., Jaffal, A., Ait-Aissa, S., Brion, F., Thybaud, E., Hinfray, N., Porcher, J-M Adverse effects in wild fish living downstream from pharmaceutical manufacture discharges Environment International 37:1342-1348
Schultz, M.M., Furlong, E.T., Kolpin, D.W., Werner, S.L., Schoenfuss, H.L., Barber, L.B., Blazer, V.S., Norris, D.O., Vajda, A.M. 2010. Antidepressant Pharmaceuticals in Two US Effluent-Impacted Streams: Occurrence and Fate in Water and Sediment, and Selective Uptake in Fish Neural Tissue. Environmental Science & Technology 44 (6), 1918-1925.
Segura, P.A., Francois, M., Gagnon, C., Sauve, S., 2009. Review of the Occurrence of Anti-infectives in Contaminated Wastewaters and Natural and Drinking Waters. Environmental Health Perspectives 117, 675-684.
SEPA 2008. Avloppsreningsverkens förmåga att ta hand om läkemedelsrester och andra farliga ämnen. Naturvårdsverket Rapport 5794 (in Swedish).
Uppsala Vatten 2011 Miljörapport 2010 Kungsängsverket http://www.uppsalavatten.se/sv/omoss/Anlaggningar/VA-anlaggningar/Avloppsreningsverk/
WHO 2011. Pharmaceuticals in Drinking-water. WHO reference number: WHO/HSE/WSH/11.05
Woldegiorgis, A., Green, J., Remberger, M., Kaj. L., Brorström-Lunden, E., Dye, C., Schlabach, M. 2007. Results from the Swedish National Screening Programme 2006. Subreport 4: Pharmaceuticals.
Vieno, N.M., Tuhkanen, T., Kronberg, L., 2005. Seasonal variation in the occurrence of pharmaceuticals in effluents from a sewage treatment plant and in the recipient water. Environmental Science and Technology 39(21), 8220-8226
Vieno, N.M., Tuhkanen, T., Kronberg, L., 2007. Elimination of pharmaceuticals in sewage treatment plants in Finland. Water Research 41 (5), 1001-1012.

Results from the Swedish National Screening Programme 2010 IVL report B2014 Subreport 3. Pharmaceuticals
32
Zeilinger, J., Steger-Hartmann, T., Maser, E., Goller, S., Vonk, R., Lange, R., 2009. Effects of synthetic gestagens on fish reproduction. Environmental Toxicology and Chemistry 28 (12), 2663-2670.
Zhang, Y. J., Geissen, S. U., Gal, C., 2008. Carbamazepine and diclofenac: Removal in wastewater treatment plants and occurrence in water bodies. Chemosphere 73(8), 1151-1161.
Zorita, S., Martensson, L., Mathiasson, L., 2009. Occurrence and removal of pharmaceuticals in a municipal sewage treatment system in the south of Sweden. Science of the Total Environment 407 (8), 2760-2770.

Results from the Swedish National Screening Programme 2010 IVL report B2014 Subreport 3. Pharmaceuticals
1
Appendix 1 Sample table, National screening
Type Municipality Site Matrix Sampling date Coord. RT90
N1 Katrineholm Älgsjön Surface water 2010-09-08 6552912 1532301
N2 Vallentuna Tärnan Surface water 2011-02-13 6608668 1644632
N3 Katrineholm Älgsjön, Perch Biota 2010-09-08 6552912 1532301
N4 Vallentuna Tärnan, Perch Biota 2010-09-07 6608668 1644632
N5 Skövde WWTP Stadskvarn, 24 h composite Influent 2010-11-15 6475757 1387219
N6 Skövde WWTP Stadskvarn, 24 h composite Influent 2010-11-16 6475757 1387219
N7 Skövde WWTP Stadskvarn, 24 h composite Influent 2010-11-17 6475757 1387219
N8 Stockholm WWTP Henriksdal, 24 h composite Influent 2010-11-29 6578812 1631124
N9 Stockholm WWTP Henriksdal, 24 h composite Influent 2010-11-30 6578812 1631124
N10 Stockholm WWTP Henriksdal, 24 h composite Influent 2010-12-01 6578812 1631124
N11 Umeå WWTP Ön, 24 h composite Influent 2010-10-19 7085160 1720924
N12 Umeå WWTP Ön, 24 h composite Influent 2010-10-20 7085160 1720924
N13 Umeå WWTP Ön, 24 h composite Influent 2010-10-21 7085160 1720924
N14 Uppsala WWTP Kungsängsverket, 24 h composite Influent 2010-10-28 6637475 1603969
N15 Uppsala WWTP Kungsängsverket, 24 h composite Influent 2010-11-24 6637475 1603969
N16 Uppsala WWTP Kungsängsverket, 24 h composite Influent 2010-12-01 6637475 1603969
N17 Skövde WWTP Stadskvarn, 24 h composite Effluent 2010-11-16 6475757 1387219
N18 Skövde WWTP Stadskvarn, 24 h composite Effluent 2010-11-17 6475757 1387219
N19 Skövde WWTP Stadskvarn, 24 h composite Effluent 2010-11-18 6475757 1387219
N20 Stockholm WWTP Henriksdal, 24 h composite Effluent 2010-11-29 6578812 1631124
N21 Stockholm WWTP Henriksdal, 24 h composite Effluent 2010-11-30 6578812 1631124
N22 Stockholm WWTP Henriksdal, 24 h composite Effluent 2010-12-01 6578812 1631124
N23 Umeå WWTP Ön, 24 h composite Effluent 2010-10-19 7085160 1720924
N24 Umeå WWTP Ön, 24 h composite Effluent 2010-10-20 7085160 1720924
N25 Umeå WWTP Ön, 24 h composite Effluent 2010-10-21 7085160 1720924
N26 Uppsala WWTP Kungsängsverket, 24 h composite Effluent 2010-10-28 6637475 1603969
N27 Uppsala WWTP Kungsängsverket, 24 h composite Effluent 2010-11-24 6637475 1603969
N28 Uppsala WWTP Kungsängsverket, 24 h composite Effluent 2010-12-01 6637475 1603969
N29 Skövde WWTP Stadskvarn Sludge 2010-11-17 6475757 1387219
N30 Stockholm WWTP Henriksdal Sludge 2010-12-01 6578812 1631124
N31 Umeå WWTP Ön Sludge 2010-10-21 7085160 1720924
N32 Uppsala WWTP Kungsängsverket Sludge 2010-10-29 6637475 1603969
N33 Skövde Skövde WWTP upstream, Mörkebäcken, -1 m Surface water 2010-11-17 6475757 1387219
N34 Skövde Skövde WWTP upstream, Ösan, Varola, -5 km Surface water 2010-11-17 6476381 1401322
N35 Skövde Skövde WWT downstream, 1, 5 m Surface water 2010-11-17 6475629 1387439
N36 Skövde Skövde WWTP downstream, 50 m Surface water 2010-11-17 6475593 1387509
N37 Skövde Skövde WWTP downstream, 500 m Surface water 2010-11-17 6475829 1388063
N38 Skövde Skövde WWTP downstream, Ösan, 5 km Surface water 2010-11-17 6483623 1389635
N39 Uppsala Upstream WWTP Kungsängsv., Islandsfallet, -1.7 km Surface water 2010-10-26 6638712 1602921
N40 Uppsala Downstream WWTP Kungsängsv. 5 m Surface water 2010-10-26 6637312 1603770
N41 Uppsala Downstream WWTP Kungsängsv. 150 m Surface water 2010-10-26 6637256 1603806
N42 Uppsala Downstream WWTP Kungsängsv., Ultuna, 3.5 km Surface water 2010-10-26 6634102 1604680
N43 Uppsala Downstream WWTP Kungsängsv. Flottsund, 4.6 km Surface water 2010-10-26 6631161 1604268
N44 Stockholm Drinking water, Valhallavägen 81 Drinking water 2010-10-22 6582765 1629037
N45 Stockholm Drinking water, Valhallavägen 81 Drinking water 2010-10-25 6582765 1629037
N46 Stockholm Drinking water, Valhallavägen 81 Drinking water 2010-10-27 6582765 1629037
N47 Umeå Drinking water, Umeå University Drinking water 2010-10-21 7086879 1721726
N48 Umeå Drinking water, Umeå University Drinking water 2010-10-23 7086879 1721726
N49 Umeå Drinking water, Umeå University Drinking water 2010-10-25 7086879 1721726
N50 Skövde WWTP Skövde biota upstream Ösan, Varola, -5 km Biota 2010-11-19 6469683 1392843
N51 Skövde WWTP Skövde biota downstream, 5 km Biota 2010-11-19 6483263 1389635
N52 Uppsala WWTP Kungsängsverket biota upstream, Perch Biota 2010-09-28 6624246 1612705
N53 Uppsala WWTP Kungsängsverket biota downstream 1, Perch Biota 2010-10-26 6637197 1603849
N54 Uppsala WWTP Kungsängsverket biota downstream 2, Perch Biota 2010-10-26 6624074 1603970

Results from the Swedish National Screening Programme 2010 IVL report B2014 Subreport 3. Pharmaceuticals
2
Appendix 2 Sample table, Regional screening Type Municipality Site Matrix Sampling date Coord. RT90
R1 Borlänge WWTP Borlänge Effluent 2010-09-27 - 10-03 6705951 1482832
R2 Falun WWTP Främby, week composite Effluent 2010-11-1 to 7 6718593 1491668
R3 Falun Runn, Främbyviken, Perch Biota 2010-09-24 6718593 1491668
R4 Gotland WWTP Visby, 24 h composite Effluent 2010-10-26 6391515 1647282
R5 Gotland WWTP Visby Sludge 2010-10-26 6391515 1647282
R6 Gotland Gothemsån, Åminne Surface water 2010-10-25 6391370 1676270
R7 Alvesta WWTP Alvesta, 24 h composite Influent 2010-10-6 6307670 1423430
R8 Alvesta WWTP Alvesta, 24 h composite Effluent 2010-10-6 6307670 1423430
R9 Lessebo WWTP Lessebo, 24 h composite Influent 2010-12-13 6291100 1466460
R10 Lessebo WWTP Lessebo, 24 h composite Effluent 2010-12-13 6291100 1466460
R11 Ljungby WWTP Ljungby, 24 h composite Influent 2010-12-13 6300900 1385300
R12 Ljungby WWTP Ljungby, 24 h composite Effluent 2010-12-13 6300900 1385300
R13 Markaryd WWTP Markaryd, 24 h composite Influent 2010-10-14 6262850 1362850
R14 Markaryd WWTP Markaryd, 24 h composite Effluent 2010-10-14 6262850 1362850
R15 Tingsryd WWTP Tingsryd, 24 h composite Influent 6264950 1449750
R16 Tingsryd WWTP Tingsryd, 24 h composite Effluent 6264950 1449750
R17 Uppvidinge WWTP Uppvidinge, grab sample Influent 2010-11-10 6337800 1473850
R18 Uppvidinge WWTP Uppvidinge, 24 h composite Effluent 2010-11-10 6337800 1473850
R19 Växjö WWTP Växjö Influent 2010-10-28 6303900 1436200
R20 Växjö WWTP Växjö Effluent 2010-10-28 6303900 1436200
R21 Växjö WWTP Växjö Sludge 2010-10-28 6303900 1436200
R22 Älmhult WWTP Älmhult, 24 h composite Influent 2010-10-12 6268000 1396200
R23 Älmhult WWTP Älmhult, 24 h composite Effluent 2010-10-12 6268000 1396200
R24 Luleå WWTP Uddebo Effluent 2010-10-5 7287600 1795760
R25 Luleå WWTP Uddebo, 24 h composite Sludge 2010-09 7287600 1795760
R26 Piteå WWTP Sandholmens Effluent 2010-09-14 7254300 1764000
R27 Piteå WWTP Sandholmens, 24 h composite Sludge 2010-09-14 7254300 1764000
R28 Katrineholm Djulösjön Sediment 2010-09-23 6538709 1524632
R29 Katrineholm Djulösjön, Perch Biota 2010-10 6538709 1524632
R30 Katrineholm Djulösjön Surface water 2010-09-23 6538709 1524632
R31 Eskilstuna WWTP Ekeby, 24 h composite Influent 2010-09-22
R32 Eskilstuna WWTP Ekeby, 24 h composite Effluent 2010-09-22
R33 Eskilstuna WWTP Ekeby, after wetland,24 h composite Effluent 2010-09-22
R34 Eskilstuna WWTP Ekeby Sludge 2010-09-22
R35 Eskilstuna Eskilstunaån Sediment 2010-09-23 6585808 1537404
R36 Eskilstuna Eskilstunaån, Perch Biota 2010 v37-40 6585808 1537404
R37 Eskilstuna Eskilstunaån Surface water 2010-09-23 6585808 1537404
R38 Nyköping Mellanfjärden Sediment 2010-09-23 6514178 1573670
R39 Nyköping Mellanfjärden, Perch Biota 2010-06 6514178 1573670
R40 Nyköping Mellanfjärden Surface water 2010-09-23 6514178 1573670
R41 Strängnäs WWTP Strängnäs, 24 h composite Effluent 2010-09-21
R42 Strängnäs WWTP Strängnäs Sludge 2010-09-21
R43 Arvika Kyrkviken1, Kinna Surface water 2010-09-29 6618369 1316821
R44 Arvika Kyrkviken2, Djupviken Surface water 2010-09-29 6616973 1317110
R45 Arvika Kyrkviken3, Djuphålan Surface water 2010-09-29 6617758 1318778
R46 Arvika Kyrkviken4, Utlopp reningsverk Surface water 2010-09-29 6618513 1319506
R47 Arvika Kyrkviken 5, Perch Biota 2010-09-17 6619017 1318691
R48 Kristinehamn WWTP Fiskartorpet, 24 h composite Effluent 2010-09-30
R49 Kristinehamn WWTP Fiskartorpet Sludge 2010-09-30
R50 Kristinehamn Varnumsviken, Perch Biota 2010-09-16 6643965 1313873
R51 Kristinehamn Varnumsviken Surface water 2010-09-28 6579200 1401400
R52 Säffle WWTP Säffle Sludge 2010-09-21
R53 Lycksele WWTP Lycksele, 24 h composite Effluent 2010-10-20
R54 Lycksele WWTP Lycksele Sludge 2010-10-20
R55 Skellefteå WWTP Tuvan, 24 h composite Effluent 2010-10-12
R56 Skellefteå WWTP Tuvan Sludge 2010-10-18
R57 Sundsvall WWTP Fillanverken Sludge 2011-01-03
R58 Sundsvall WWTP Tivoliverket Sludge 2011-01-03
R59 Örnsköldsvik WWTP Knorthem Sludge 2010-12-23
R60 Borås Djupasjön, downstream Gässlösa, Eel Biota 2010-09-16 6400298 1327321
R61 Borås Djupasjön, downstream Gässlösa, Perch Biota 2010-09-16 6400298 1327321

Results from the Swedish National Screening Programme 2010 IVL report B2014 Subreport 3. Pharmaceuticals
3
Type Municipality Site Matrix Sampling date Coord. RT90
R62 Borås Djupasjön, downstream Gässlösa, Roach Biota 2010-09-16 6400298 1327321
R63 Borås Djupasjön, downstream Gässlösa Surface water 2010-09-16 - 17 6400298 1327321
R64 Stenungsund Askeröfjorden, Eel Biota 2010-11-17 6448922 1264844
R65 Stenungsund Askeröfjorden, Flounder Biota 2010-11-17 6448096 1264885
R66 Stenungsund Askeröfjorden, Common mussel Biota 2010-10-18 6448420 1264813
R67 Göteborg Ryaverket, 6,5 km downstream effluent outlet, Common mussel Biota 2010-10-05 6402890 1260750
Appendix 3. Limit of quantification in surface, sewage and drinking water of the used analytical method. Name LOQ Name LOQ Name LOQ
ng/L ng/L ng/L
Alfuzosin 0.1 Diphenhydramine 0.1 Memantine 0.5
Alprazolam 10 Dipyridamole 50 Metformin 100
Amiodiarone 50 Donepezil 0.5 Metoprolol 5.0
Amitryptiline 5.0 Duloxetine 1.0 Mianserin 1.0
Atenolol 5.0 Eprosartan 5.0 Miconazole 5.0
Atorvastatin 50 Erythromycin 50 Mirtazapine 10
Atracurium 0.5 Estradiol 10 Naproxen 10
Azelastine 5.0 Ethinyl estradiol 10 Nefazodone 0.5
Azithromycin 5.0 Etonogestrel 0.5 Norfloxacin 10
Beclomethazone 10 Ezetimibe 50 Ofloxacin 10
Biperiden 0.1 Felodipine 10 Orphenadrine 0.1
Bisoprolol 0.1 Fentanyl 0.5 Oxazepam 5.0
Bromocriptine 5.0 Fexofenadine 5.0 Paracetamol 10
Buprenorphine 10 Finasteride 10 Paroxetine 10
Bupropion 0.1 Flecainide 0.1 Perphenazine 10
Carbamazepine 1.0 Fluconazole 0.5 Pizotifen 0.5
Chlorprothixen 10 Flunitrazepam 10 Promethazine 10
Chlorpromazine 5.0 Fluoxetine 5.0 Ranitidine 5.0
Cilazapril 1.0 Flupentixol 5.0 Repaglinide 0.5
Ciprofloxacin 10 Fluphenazine 10 Risperidone 0.1
Citalopram 5.0 Flutamide 5.0 Rosuvastatin 10
Clarithromycine 1.0 Glibenclamide 10 Roxithromycin 50
Clemastine 0.5 Glimepiride 10 Sertraline 10
Clindamycin 1.0 Haloperidol 0.1 Sulfamethoxazole 5.0
Clomipramine 0.5 Hydroxyzine 0.5 Tamoxifen 5.0
Clonazepam 5.0 Ibuprofen 0.5 Telmisartan 50
Clotrimazol 1.0 Irbesartan 10 Tetracycline 50
Codeine 0.5 Ketoconazole 50 Tramadol 0.5
Cyproheptadine 5.0 Ketoprofene 10 Trihexyphenidyl 0.1
Desloratidin 0.5 Levomepromazine 100 Trimethoprim 0.1
Diclofenac 10 Levonorgestrel 10 Venlafaxine 0.5
Dicycloverin 5.0 Loperamide 0.5 Verapamil 10
Dihydroergotamine 50 Maprotiline 5.0 Zolpidem 0.5
Diltiazem 0.5 Meclozine 5.0

Results from the Swedish National Screening Programme 2010 IVL report B2014 Subreport 3. Pharmaceuticals
4
Appendix 4. Limit of quantification in sludge samples of the used analytical method. Name LOQ Name LOQ Name LOQ
g/Kg g/Kg g/Kg
Alfuzosin 0.1 Diphenhydramine 0.1 Memantine 0.5
Alprazolam 10 Dipyridamole 50 Metformin 100
Amiodiarone 50 Donepezil 0.5 Metoprolol 5.0
Amitryptiline 5.0 Duloxetine 1.0 Mianserin 1.0
Atenolol 5.0 Eprosartan 5.0 Miconazole 5.0
Atorvastatin 50 Erythromycin 50 Mirtazapine 10
Atracurium 0.5 Estradiol 10 Naproxen 10
Azelastine 5.0 Ethinyl estradiol 10 Nefazodone 0.5
Azithromycin 5.0 Etonogestrel 0.5 Norfloxacin 10
Beclomethazone 10 Ezetimibe 50 Ofloxacin 10
Biperiden 0.1 Felodipine 10 Orphenadrine 0.1
Bisoprolol 0.1 Fentanyl 0.5 Oxazepam 5.0
Bromocriptine 5.0 Fexofenadine 5.0 Paracetamol 10
Buprenorphine 10 Finasteride 10 Paroxetine 10
Bupropion 0.1 Flecainide 0.1 Perphenazine 10
Carbamazepine 1.0 Fluconazole 0.5 Pizotifen 0.5
Chlorprothixen 10 Flunitrazepam 10 Promethazine 10
Chlorpromazine 5.0 Fluoxetine 5.0 Ranitidine 5.0
Cilazapril 1.0 Flupentixol 5.0 Repaglinide 0.5
Ciprofloxacin 10 Fluphenazine 10 Risperidone 0.1
Citalopram 5.0 Flutamide 5.0 Rosuvastatin 10
Clarithromycine 1.0 Glibenclamide 10 Roxithromycin 50
Clemastine 0.5 Glimepiride 10 Sertraline 10
Clindamycin 1.0 Haloperidol 0.1 Sulfamethoxazole 5.0
Clomipramine 0.5 Hydroxyzine 0.5 Tamoxifen 5.0
Clonazepam 5.0 Ibuprofen 0.5 Telmisartan 50
Clotrimazol 1.0 Irbesartan 10 Tetracycline 50
Codeine 0.5 Ketoconazole 50 Tramadol 0.5
Cyproheptadine 5.0 Ketoprofene 10 Trihexyphenidyl 0.1
Desloratidin 0.5 Levomepromazine 100 Trimethoprim 0.1
Diclofenac 10 Levonorgestrel 10 Venlafaxine 0.5
Dicycloverin 5.0 Loperamide 0.5 Verapamil 10
Dihydroergotamine 50 Maprotiline 5.0 Zolpidem 0.5
Diltiazem 0.5 Meclozine 5.0

Results from the Swedish National Screening Programme 2010 IVL report B2014 Subreport 3. Pharmaceuticals
5
Appendix 5. Surface water from Katrineholm (N1), Vallentuna (N2), Skövde (N33-38) and Uppsala (N39-43). N1 N2 N33 N34 N35 N36 N37 N38 N39 N40 N41 N42 N43
ng/L ng/L ng/L ng/L ng/L ng/L ng/L ng/L ng/L ng/L ng/L ng/L ng/L
Name
Alfuzosin 2.9 1.1 0.26 0.22 20 28 0.56 0.45 1.3 33 6.5 3.7 2.1
Alprazolam 17 <LOQ <LOQ <LOQ <LOQ <LOQ <LOQ <LOQ <LOQ <LOQ <LOQ <LOQ <LOQ
Amiodiarone <LOQ <LOQ <LOQ <LOQ <LOQ <LOQ <LOQ <LOQ <LOQ <LOQ <LOQ <LOQ <LOQ
Amitryptiline <LOQ <LOQ <LOQ <LOQ <LOQ <LOQ <LOQ <LOQ <LOQ <LOQ <LOQ <LOQ <LOQ
Atenolol <LOQ <LOQ 11 11 230 390 35 97 24 360 100 62 79
Atorvastatin <LOQ <LOQ <LOQ <LOQ <LOQ <LOQ <LOQ <LOQ <LOQ <LOQ <LOQ <LOQ <LOQ
Atracurium 2.9 <LOQ 9.9 1.6 1.7 2.6 3.2 2.7 1.1 0.66 0.55 <LOQ <LOQ
Azelastine <LOQ <LOQ <LOQ <LOQ <LOQ <LOQ <LOQ <LOQ <LOQ <LOQ <LOQ <LOQ <LOQ
Azithromycin <LOQ <LOQ 27 <LOQ <LOQ <LOQ 5.4 <LOQ <LOQ <LOQ <LOQ <LOQ <LOQ
Beclomethazone <LOQ <LOQ <LOQ <LOQ <LOQ <LOQ <LOQ <LOQ <LOQ <LOQ <LOQ <LOQ <LOQ
Biperiden 1.4 6.4 <LOQ <LOQ <LOQ <LOQ <LOQ <LOQ <LOQ <LOQ <LOQ <LOQ <LOQ
Bisoprolol <LOQ 0.63 0.18 0.1 100 150 5.5 3.4 1.2 59 18 4.7 10
Bromocriptine <LOQ <LOQ <LOQ <LOQ <LOQ <LOQ <LOQ <LOQ <LOQ <LOQ <LOQ <LOQ <LOQ
Buprenorphine 15 <LOQ <LOQ <LOQ <LOQ <LOQ <LOQ <LOQ <LOQ <LOQ <LOQ <LOQ <LOQ
Bupropion 5.6 2.5 0.46 0.45 16 19 1.3 0.81 0.37 14 3 4.5 1.3
Carbamazepine 12 9.4 8.8 4.9 470 550 40 22 29 760 190 110 87
Chlorprothixen <LOQ <LOQ <LOQ <LOQ <LOQ <LOQ <LOQ <LOQ <LOQ <LOQ <LOQ <LOQ <LOQ
Chlorpromazine <LOQ <LOQ <LOQ <LOQ <LOQ <LOQ <LOQ <LOQ <LOQ <LOQ <LOQ <LOQ <LOQ
Cilazapril 4 1.5 <LOQ <LOQ <LOQ <LOQ <LOQ <LOQ <LOQ <LOQ <LOQ <LOQ <LOQ
Ciprofloxacin <LOQ 12 380 160 26 52 230 110 64 14 10 12 <LOQ
Citalopram 16 18 27 12 140 210 17 8.5 6.6 190 29 38 18
Clarithromycine <LOQ 39 1100 3.7 59 87 330 24 3.5 2.1 <LOQ <LOQ 3.3
Clemastine 0.68 <LOQ <LOQ <LOQ <LOQ <LOQ <LOQ <LOQ <LOQ <LOQ <LOQ <LOQ <LOQ
Clindamycin <LOQ <LOQ 4.2 <LOQ 60 87 6.5 5.4 3.1 140 34 15 18
Clomipramine 0.64 <LOQ 0.54 <LOQ 0.52 <LOQ <LOQ <LOQ <LOQ 1 <LOQ <LOQ <LOQ
Clonazepam <LOQ <LOQ <LOQ <LOQ <LOQ <LOQ <LOQ <LOQ <LOQ <LOQ <LOQ <LOQ <LOQ
Clotrimazol <LOQ <LOQ <LOQ 1 1.9 1.2 2.1 <LOQ <LOQ 1.9 1.6 3.1 1.1
Codeine <LOQ 2.4 1.2 <LOQ 82 120 6.2 2.8 10 340 93 57 50
Cyproheptadine <LOQ <LOQ <LOQ <LOQ <LOQ <LOQ <LOQ <LOQ <LOQ <LOQ <LOQ <LOQ <LOQ
Desloratidin <LOQ <LOQ <LOQ <LOQ 3.3 4.4 <LOQ <LOQ <LOQ 6 0.68 <LOQ <LOQ
Diclofenac <LOQ <LOQ <LOQ <LOQ 230 70 21 <LOQ <LOQ 880 290 28 90
Dicycloverin <LOQ <LOQ <LOQ <LOQ <LOQ <LOQ <LOQ <LOQ <LOQ <LOQ <LOQ <LOQ <LOQ
Dihydroergotamine <LOQ <LOQ <LOQ <LOQ <LOQ <LOQ <LOQ <LOQ <LOQ <LOQ <LOQ <LOQ <LOQ
Diltiazem <LOQ <LOQ <LOQ <LOQ 9.7 12 0.56 0.5 0.55 20 5.9 7.1 4.3
Diphenhydramine 0.15 <LOQ 0.066 0.32 4.2 6.3 0.089 0.26 0.054 11 2.2 1.2 1.1
Dipyridamole <LOQ <LOQ <LOQ <LOQ <LOQ <LOQ <LOQ <LOQ <LOQ <LOQ <LOQ <LOQ <LOQ
Donepezil <LOQ <LOQ <LOQ <LOQ <LOQ <LOQ <LOQ <LOQ <LOQ <LOQ <LOQ <LOQ <LOQ
Duloxetine <LOQ <LOQ <LOQ <LOQ <LOQ <LOQ <LOQ <LOQ <LOQ <LOQ <LOQ <LOQ <LOQ
Eprosartan 8.5 <LOQ 9.3 7 26 35 <LOQ 7.5 12 21 12 5.6 7.2
Erythromycin <LOQ <LOQ <LOQ 57 55 65 <LOQ <LOQ <LOQ <LOQ <LOQ <LOQ <LOQ
Estradiol <LOQ <LOQ <LOQ <LOQ <LOQ <LOQ <LOQ <LOQ <LOQ <LOQ <LOQ <LOQ <LOQ
Ethinyl estradiol <LOQ <LOQ <LOQ <LOQ <LOQ <LOQ <LOQ <LOQ <LOQ <LOQ <LOQ <LOQ <LOQ
Etonogestrel <LOQ <LOQ <LOQ <LOQ <LOQ <LOQ <LOQ <LOQ <LOQ <LOQ <LOQ <LOQ <LOQ
Ezetimibe <LOQ <LOQ <LOQ <LOQ <LOQ <LOQ <LOQ <LOQ <LOQ <LOQ <LOQ <LOQ <LOQ
Felodipine <LOQ <LOQ <LOQ <LOQ <LOQ <LOQ <LOQ <LOQ <LOQ <LOQ <LOQ <LOQ <LOQ
Fentanyl <LOQ <LOQ 4 0.91 <LOQ <LOQ 2.2 1.7 1.7 0.92 <LOQ 0.78 3
Fexofenadine <LOQ <LOQ <LOQ <LOQ 51 66 6.9 4.7 7.6 150 65 19 16
Finasteride 42 12 <LOQ <LOQ <LOQ <LOQ <LOQ <LOQ <LOQ <LOQ <LOQ <LOQ <LOQ
Flecainide 2.1 9.5 0.93 0.88 32 47 2.9 2.2 2.5 130 32 29 19
Fluconazole 4.6 1.8 110 16 83 100 30 11 11 290 43 21 21
Flunitrazepam <LOQ <LOQ <LOQ <LOQ <LOQ <LOQ <LOQ <LOQ <LOQ <LOQ <LOQ <LOQ <LOQ
Fluoxetine <LOQ <LOQ <LOQ <LOQ <LOQ <LOQ <LOQ <LOQ <LOQ 32 6.3 <LOQ <LOQ
Flupentixol <LOQ <LOQ <LOQ <LOQ 6.9 8.7 <LOQ <LOQ <LOQ 12 <LOQ <LOQ <LOQ
Fluphenazine <LOQ <LOQ <LOQ <LOQ <LOQ <LOQ <LOQ <LOQ <LOQ <LOQ <LOQ <LOQ <LOQ
Flutamide <LOQ <LOQ <LOQ <LOQ <LOQ <LOQ <LOQ <LOQ <LOQ <LOQ <LOQ <LOQ <LOQ
Glibenclamide <LOQ <LOQ <LOQ 19 29 25 24 13 <LOQ <LOQ <LOQ <LOQ <LOQ
Glimepiride <LOQ <LOQ <LOQ <LOQ <LOQ <LOQ <LOQ <LOQ <LOQ <LOQ <LOQ <LOQ <LOQ

Results from the Swedish National Screening Programme 2010 IVL report B2014 Subreport 3. Pharmaceuticals
6
N1 N2 N33 N34 N35 N36 N37 N38 N39 N40 N41 N42 N43
ng/L ng/L ng/L ng/L ng/L ng/L ng/L ng/L ng/L ng/L ng/L ng/L ng/L
Name
Haloperidol <LOQ <LOQ 2.8 0.93 2.2 2 1.1 0.67 0.24 1.4 0.7 3 0.47
Hydroxyzine 2.3 1.5 <LOQ 0.57 4.8 2.9 1 2.1 4.1 2.1 1.8 2.7 <LOQ
Ibuprofen 34 65 100 69 140 40 36 180 <LOQ 120 140 69 21
Irbesartan 16 2.2 2 3.3 100 130 12 3.1 8 430 120 52 37
Ketoconazole <LOQ <LOQ <LOQ <LOQ <LOQ <LOQ <LOQ <LOQ <LOQ <LOQ <LOQ <LOQ <LOQ
Ketoprofene <LOQ <LOQ <LOQ <LOQ 41 42 13 <LOQ 15 110 26 13 24
Levomepromazine <LOQ <LOQ <LOQ <LOQ <LOQ <LOQ <LOQ <LOQ <LOQ <LOQ <LOQ <LOQ <LOQ
Levonorgestrel <LOQ <LOQ <LOQ <LOQ <LOQ <LOQ <LOQ <LOQ <LOQ <LOQ <LOQ <LOQ <LOQ
Loperamide 3.6 2.1 2.2 0.87 1.2 1.6 1.9 2.7 0.67 1.6 2.5 3.6 0.58
Maprotiline <LOQ <LOQ <LOQ <LOQ <LOQ <LOQ <LOQ <LOQ <LOQ <LOQ <LOQ <LOQ <LOQ
Meclozine 59 25 <LOQ <LOQ <LOQ <LOQ <LOQ <LOQ <LOQ <LOQ <LOQ <LOQ <LOQ
Memantine 0.63 0.74 0.59 0.62 5.1 6.5 <LOQ 0.6 <LOQ 15 3.5 2.3 1.6
Metformin <LOQ <LOQ <LOQ <LOQ <LOQ <LOQ <LOQ <LOQ <LOQ <LOQ <LOQ <LOQ <LOQ
Metoprolol <LOQ 6.1 12 <LOQ 680 950 57 37 51 1200 370 130 200
Mianserin <LOQ <LOQ <LOQ <LOQ 2.8 6.7 <LOQ <LOQ <LOQ 6.3 2.7 2.7 <LOQ
Miconazole 19 <LOQ <LOQ <LOQ <LOQ <LOQ <LOQ <LOQ <LOQ <LOQ <LOQ <LOQ <LOQ
Mirtazapine <LOQ <LOQ <LOQ <LOQ 120 130 <LOQ <LOQ <LOQ 210 36 23 19
Naproxen <LOQ 41 28 45 130 98 44 11 20 77 38 27 38
Nefazodone 0.71 <LOQ <LOQ <LOQ <LOQ <LOQ <LOQ <LOQ <LOQ <LOQ <LOQ <LOQ <LOQ
Norfloxacin <LOQ <LOQ <LOQ <LOQ <LOQ <LOQ <LOQ <LOQ <LOQ <LOQ <LOQ <LOQ <LOQ
Ofloxacin <LOQ <LOQ <LOQ <LOQ <LOQ <LOQ <LOQ <LOQ <LOQ <LOQ <LOQ <LOQ <LOQ
Orphenadrine 0.47 <LOQ <LOQ <LOQ 4.7 5.7 0.93 0.63 1.2 28 5.9 4.4 1.5
Oxazepam 9.6 <LOQ 21 10 230 310 28 15 16 580 130 69 59
Paracetamol 12 19 150 83 26 87 100 45 190 52 53 37 36
Paroxetine <LOQ <LOQ <LOQ <LOQ <LOQ <LOQ <LOQ <LOQ <LOQ <LOQ <LOQ <LOQ <LOQ
Perphenazine <LOQ <LOQ <LOQ <LOQ <LOQ <LOQ <LOQ <LOQ <LOQ <LOQ <LOQ <LOQ <LOQ
Pizotifen 0.71 <LOQ <LOQ <LOQ <LOQ <LOQ <LOQ <LOQ <LOQ 1 <LOQ <LOQ 0.74
Promethazine <LOQ <LOQ <LOQ <LOQ <LOQ <LOQ <LOQ <LOQ <LOQ <LOQ <LOQ <LOQ <LOQ
Ranitidine <LOQ <LOQ <LOQ <LOQ 5.4 6.8 <LOQ <LOQ <LOQ 110 15 <LOQ <LOQ
Repaglinide 54 1.6 5.6 11 5.7 8 13 9.7 2.5 16 15 23 4.5
Risperidone <LOQ <LOQ 1.6 1.9 1.1 2.1 <LOQ <LOQ 9.4 1.6 2.1 8.6 1.7
Rosuvastatin <LOQ <LOQ <LOQ <LOQ 30 61 <LOQ <LOQ <LOQ <LOQ <LOQ 11 <LOQ
Roxithromycin <LOQ <LOQ 1100 <LOQ 50 <LOQ 240 <LOQ <LOQ <LOQ <LOQ <LOQ <LOQ
Sertraline <LOQ <LOQ 11 <LOQ 11 <LOQ <LOQ <LOQ <LOQ 28 18 <LOQ <LOQ
Sulfamethoxazole <LOQ 91 620 230 54 50 120 69 90 150 18 <LOQ <LOQ
Tamoxifen <LOQ <LOQ <LOQ <LOQ <LOQ <LOQ <LOQ <LOQ 13 <LOQ <LOQ <LOQ <LOQ
Telmisartan <LOQ <LOQ <LOQ <LOQ <LOQ <LOQ <LOQ <LOQ <LOQ 110 <LOQ <LOQ <LOQ
Tetracycline <LOQ <LOQ <LOQ <LOQ <LOQ <LOQ <LOQ <LOQ <LOQ <LOQ <LOQ <LOQ <LOQ
Tramadol 6 <LOQ 2.3 1.4 650 870 46 27 51 1800 520 290 250
Trihexyphenidyl <LOQ <LOQ 0.45 1.9 <LOQ 0.75 0.85 1.3 1.6 1.4 3.3 0.5 0.91
Trimethoprim 15 6.8 110 34 140 170 52 22 18 210 50 39 23
Venlafaxine 36 16 6 11 140 130 15 8.6 17 440 150 55 69
Verapamil 20 <LOQ <LOQ <LOQ <LOQ <LOQ <LOQ <LOQ 19 <LOQ <LOQ <LOQ <LOQ
Zolpidem 2.1 2.5 0.53 0.56 2.4 3.1 0.51 <LOQ 0.6 6 1.8 1.7 1.1

Results from the Swedish National Screening Programme 2010 IVL report B2014 Subreport 3. Pharmaceuticals
7
Appendix 6. Biota samples from Katrineholm (N3), Vallentuna (N4), Skövde (N50, 51) and Uppsala (N52-54). N3 N4 N50 N51 N52 N53 N54
g/Kg g/Kg g/Kg g/Kg g/Kg g/Kg g/Kg
Name
Alfuzosin <LOQ <LOQ <LOQ <LOQ <LOQ <LOQ 0.11
Alprazolam <LOQ <LOQ <LOQ <LOQ <LOQ <LOQ <LOQ
Amiodiarone <LOQ <LOQ <LOQ <LOQ <LOQ <LOQ <LOQ
Amitryptiline <LOQ <LOQ <LOQ <LOQ <LOQ <LOQ <LOQ
Atenolol <LOQ <LOQ <LOQ <LOQ <LOQ <LOQ <LOQ
Atorvastatin <LOQ <LOQ <LOQ <LOQ <LOQ <LOQ <LOQ
Atracurium <LOQ <LOQ <LOQ <LOQ <LOQ <LOQ <LOQ
Azelastine <LOQ <LOQ <LOQ <LOQ <LOQ <LOQ <LOQ
Azithromycin <LOQ <LOQ <LOQ <LOQ <LOQ <LOQ <LOQ
Beclomethazone <LOQ <LOQ <LOQ <LOQ <LOQ <LOQ <LOQ
Biperiden <LOQ 0.1 <LOQ 0.14 <LOQ 0.54 0.24
Bisoprolol <LOQ <LOQ <LOQ <LOQ <LOQ <LOQ <LOQ
Bromocriptine <LOQ <LOQ <LOQ <LOQ <LOQ <LOQ <LOQ
Buprenorphine <LOQ <LOQ <LOQ <LOQ <LOQ <LOQ <LOQ
Bupropion <LOQ <LOQ <LOQ <LOQ <LOQ <LOQ <LOQ
Carbamazepine <LOQ <LOQ <LOQ <LOQ <LOQ <LOQ <LOQ
Chlorprothixen <LOQ <LOQ <LOQ <LOQ <LOQ <LOQ <LOQ
Chlorpromazine <LOQ <LOQ <LOQ <LOQ <LOQ <LOQ <LOQ
Cilazapril <LOQ <LOQ <LOQ <LOQ <LOQ <LOQ <LOQ
Ciprofloxacin <LOQ <LOQ <LOQ <LOQ <LOQ <LOQ <LOQ
Citalopram <LOQ <LOQ <LOQ <LOQ <LOQ <LOQ <LOQ
Clarithromycine <LOQ <LOQ <LOQ <LOQ <LOQ <LOQ <LOQ
Clemastine <LOQ <LOQ <LOQ <LOQ <LOQ <LOQ <LOQ
Clindamycin <LOQ <LOQ <LOQ <LOQ <LOQ <LOQ <LOQ
Clomipramine <LOQ 0.83 <LOQ <LOQ <LOQ 8.1 1
Clonazepam <LOQ <LOQ <LOQ <LOQ <LOQ <LOQ <LOQ
Clotrimazol <LOQ <LOQ 1.3 <LOQ 1.5 14 <LOQ
Codeine <LOQ <LOQ 0.84 <LOQ <LOQ <LOQ <LOQ
Cyproheptadine <LOQ <LOQ <LOQ <LOQ <LOQ <LOQ <LOQ
Desloratidin <LOQ <LOQ <LOQ <LOQ <LOQ <LOQ <LOQ
Diclofenac <LOQ <LOQ <LOQ <LOQ <LOQ <LOQ <LOQ
Dicycloverin <LOQ <LOQ <LOQ <LOQ <LOQ <LOQ <LOQ
Dihydroergotamine <LOQ <LOQ <LOQ <LOQ <LOQ <LOQ <LOQ
Diltiazem <LOQ <LOQ <LOQ <LOQ <LOQ <LOQ <LOQ
Diphenhydramine <LOQ 0.1 <LOQ <LOQ <LOQ 0.089 <LOQ
Dipyridamole <LOQ <LOQ <LOQ <LOQ <LOQ <LOQ <LOQ
Donepezil <LOQ <LOQ <LOQ <LOQ <LOQ <LOQ <LOQ
Duloxetine <LOQ <LOQ <LOQ <LOQ <LOQ <LOQ <LOQ
Eprosartan <LOQ <LOQ <LOQ <LOQ <LOQ <LOQ <LOQ
Erythromycin <LOQ <LOQ <LOQ <LOQ <LOQ <LOQ <LOQ
Estradiol <LOQ <LOQ <LOQ <LOQ <LOQ <LOQ <LOQ
Ethinyl estradiol <LOQ <LOQ <LOQ <LOQ <LOQ <LOQ <LOQ
Etonogestrel <LOQ <LOQ <LOQ <LOQ <LOQ <LOQ <LOQ
Ezetimibe <LOQ <LOQ <LOQ <LOQ <LOQ <LOQ <LOQ
Felodipine <LOQ <LOQ <LOQ <LOQ <LOQ <LOQ <LOQ
Fentanyl <LOQ <LOQ <LOQ <LOQ <LOQ <LOQ <LOQ
Fexofenadine <LOQ <LOQ <LOQ <LOQ <LOQ <LOQ <LOQ
Finasteride <LOQ <LOQ <LOQ <LOQ <LOQ <LOQ <LOQ
Flecainide <LOQ <LOQ <LOQ <LOQ <LOQ 0.19 0.12
Fluconazole <LOQ <LOQ <LOQ <LOQ <LOQ <LOQ <LOQ
Flunitrazepam <LOQ <LOQ <LOQ <LOQ <LOQ <LOQ <LOQ
Fluoxetine <LOQ <LOQ <LOQ <LOQ <LOQ 6.7 <LOQ
Flupentixol <LOQ <LOQ <LOQ <LOQ <LOQ <LOQ <LOQ
Fluphenazine <LOQ <LOQ <LOQ <LOQ <LOQ <LOQ <LOQ
Flutamide <LOQ <LOQ <LOQ <LOQ <LOQ <LOQ <LOQ
Glibenclamide <LOQ <LOQ <LOQ <LOQ <LOQ 19 <LOQ
Glimepiride <LOQ <LOQ <LOQ <LOQ <LOQ <LOQ <LOQ

Results from the Swedish National Screening Programme 2010 IVL report B2014 Subreport 3. Pharmaceuticals
8
N3 N4 N50 N51 N52 N53 N54
g/Kg g/Kg g/Kg g/Kg g/Kg g/Kg g/Kg
Name
Haloperidol <LOQ <LOQ 0.24 0.12 <LOQ 0.42 0.19
Hydroxyzine <LOQ <LOQ <LOQ <LOQ <LOQ 8.3 1.5
Ibuprofen <LOQ <LOQ <LOQ <LOQ <LOQ <LOQ <LOQ
Irbesartan <LOQ <LOQ 0.78 <LOQ <LOQ 1.3 <LOQ
Ketoconazole <LOQ <LOQ <LOQ <LOQ <LOQ <LOQ <LOQ
Ketoprofene <LOQ <LOQ <LOQ <LOQ <LOQ <LOQ <LOQ
Levomepromazine <LOQ <LOQ <LOQ <LOQ <LOQ <LOQ <LOQ
Levonorgestrel <LOQ <LOQ <LOQ <LOQ <LOQ <LOQ <LOQ
Loperamide <LOQ <LOQ <LOQ <LOQ <LOQ <LOQ <LOQ
Maprotiline <LOQ <LOQ <LOQ <LOQ <LOQ <LOQ <LOQ
Meclozine <LOQ <LOQ <LOQ <LOQ <LOQ <LOQ <LOQ
Memantine <LOQ <LOQ <LOQ 0.76 <LOQ 0.78 1.3
Metformin <LOQ <LOQ <LOQ <LOQ <LOQ <LOQ <LOQ
Metoprolol <LOQ <LOQ <LOQ <LOQ <LOQ <LOQ <LOQ
Mianserin <LOQ <LOQ <LOQ <LOQ <LOQ <LOQ <LOQ
Miconazole <LOQ <LOQ <LOQ <LOQ <LOQ <LOQ <LOQ
Mirtazapine <LOQ <LOQ <LOQ <LOQ <LOQ <LOQ <LOQ
Naproxen <LOQ <LOQ <LOQ <LOQ <LOQ <LOQ <LOQ
Nefazodone <LOQ <LOQ <LOQ 1.3 <LOQ <LOQ <LOQ
Norfloxacin <LOQ <LOQ <LOQ <LOQ <LOQ <LOQ <LOQ
Ofloxacin <LOQ <LOQ <LOQ <LOQ <LOQ <LOQ <LOQ
Orphenadrine 0.19 0.18 <LOQ 0.13 0.23 2.2 0.74
Oxazepam <LOQ <LOQ <LOQ <LOQ <LOQ 9.6 <LOQ
Paracetamol <LOQ <LOQ <LOQ <LOQ <LOQ <LOQ <LOQ
Paroxetine <LOQ <LOQ <LOQ <LOQ <LOQ 17 <LOQ
Perphenazine <LOQ <LOQ <LOQ <LOQ <LOQ <LOQ <LOQ
Pizotifen <LOQ <LOQ <LOQ <LOQ <LOQ 4.5 0.5
Promethazine <LOQ <LOQ <LOQ <LOQ <LOQ <LOQ <LOQ
Ranitidine <LOQ <LOQ <LOQ <LOQ <LOQ <LOQ <LOQ
Repaglinide <LOQ <LOQ <LOQ <LOQ <LOQ <LOQ <LOQ
Risperidone <LOQ <LOQ 0.32 0.2 0.29 0.36 <LOQ
Rosuvastatin <LOQ <LOQ <LOQ <LOQ <LOQ <LOQ <LOQ
Roxithromycin <LOQ <LOQ <LOQ <LOQ <LOQ <LOQ <LOQ
Sertraline <LOQ <LOQ <LOQ <LOQ <LOQ 14 <LOQ
Sulfamethoxazole <LOQ <LOQ <LOQ <LOQ <LOQ 13 <LOQ
Tamoxifen <LOQ 7.1 <LOQ <LOQ <LOQ 6.3 <LOQ
Telmisartan <LOQ <LOQ <LOQ <LOQ <LOQ <LOQ <LOQ
Tetracycline <LOQ <LOQ <LOQ <LOQ <LOQ <LOQ <LOQ
Tramadol <LOQ <LOQ <LOQ <LOQ <LOQ <LOQ <LOQ
Trihexyphenidyl 0.12 <LOQ <LOQ <LOQ 0.12 <LOQ <LOQ
Trimethoprim <LOQ <LOQ <LOQ <LOQ <LOQ <LOQ <LOQ
Venlafaxine <LOQ <LOQ <LOQ <LOQ <LOQ <LOQ <LOQ
Verapamil <LOQ <LOQ <LOQ <LOQ <LOQ <LOQ <LOQ
Zolpidem <LOQ <LOQ <LOQ <LOQ <LOQ <LOQ <LOQ
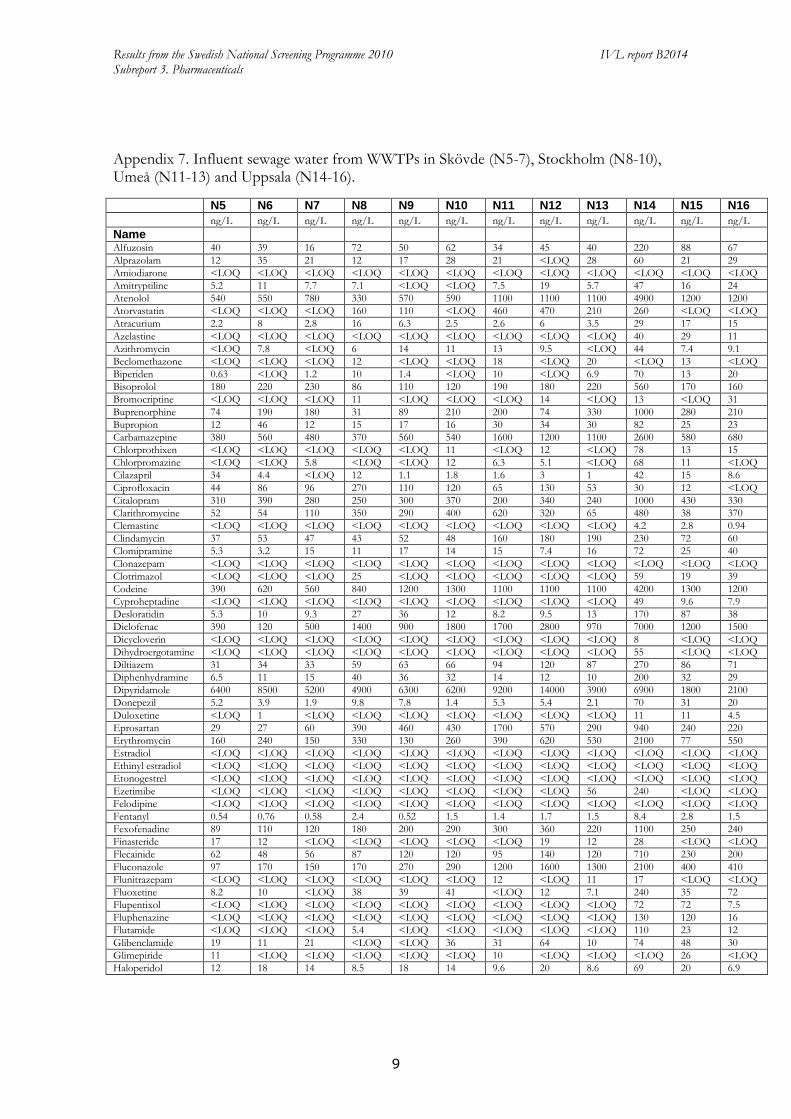
Results from the Swedish National Screening Programme 2010 IVL report B2014 Subreport 3. Pharmaceuticals
9
Appendix 7. Influent sewage water from WWTPs in Skövde (N5-7), Stockholm (N8-10), Umeå (N11-13) and Uppsala (N14-16).
N5 N6 N7 N8 N9 N10 N11 N12 N13 N14 N15 N16
ng/L ng/L ng/L ng/L ng/L ng/L ng/L ng/L ng/L ng/L ng/L ng/L
Name
Alfuzosin 40 39 16 72 50 62 34 45 40 220 88 67
Alprazolam 12 35 21 12 17 28 21 <LOQ 28 60 21 29
Amiodiarone <LOQ <LOQ <LOQ <LOQ <LOQ <LOQ <LOQ <LOQ <LOQ <LOQ <LOQ <LOQ
Amitryptiline 5.2 11 7.7 7.1 <LOQ <LOQ 7.5 19 5.7 47 16 24
Atenolol 540 550 780 330 570 590 1100 1100 1100 4900 1200 1200
Atorvastatin <LOQ <LOQ <LOQ 160 110 <LOQ 460 470 210 260 <LOQ <LOQ
Atracurium 2.2 8 2.8 16 6.3 2.5 2.6 6 3.5 29 17 15
Azelastine <LOQ <LOQ <LOQ <LOQ <LOQ <LOQ <LOQ <LOQ <LOQ 40 29 11
Azithromycin <LOQ 7.8 <LOQ 6 14 11 13 9.5 <LOQ 44 7.4 9.1
Beclomethazone <LOQ <LOQ <LOQ 12 <LOQ <LOQ 18 <LOQ 20 <LOQ 13 <LOQ
Biperiden 0.63 <LOQ 1.2 10 1.4 <LOQ 10 <LOQ 6.9 70 13 20
Bisoprolol 180 220 230 86 110 120 190 180 220 560 170 160
Bromocriptine <LOQ <LOQ <LOQ 11 <LOQ <LOQ <LOQ 14 <LOQ 13 <LOQ 31
Buprenorphine 74 190 180 31 89 210 200 74 330 1000 280 210
Bupropion 12 46 12 15 17 16 30 34 30 82 25 23
Carbamazepine 380 560 480 370 560 540 1600 1200 1100 2600 580 680
Chlorprothixen <LOQ <LOQ <LOQ <LOQ <LOQ 11 <LOQ 12 <LOQ 78 13 15
Chlorpromazine <LOQ <LOQ 5.8 <LOQ <LOQ 12 6.3 5.1 <LOQ 68 11 <LOQ
Cilazapril 34 4.4 <LOQ 12 1.1 1.8 1.6 3 1 42 15 8.6
Ciprofloxacin 44 86 96 270 110 120 65 130 53 30 12 <LOQ
Citalopram 310 390 280 250 300 370 200 340 240 1000 430 330
Clarithromycine 52 54 110 350 290 400 620 320 65 480 38 370
Clemastine <LOQ <LOQ <LOQ <LOQ <LOQ <LOQ <LOQ <LOQ <LOQ 4.2 2.8 0.94
Clindamycin 37 53 47 43 52 48 160 180 190 230 72 60
Clomipramine 5.3 3.2 15 11 17 14 15 7.4 16 72 25 40
Clonazepam <LOQ <LOQ <LOQ <LOQ <LOQ <LOQ <LOQ <LOQ <LOQ <LOQ <LOQ <LOQ
Clotrimazol <LOQ <LOQ <LOQ 25 <LOQ <LOQ <LOQ <LOQ <LOQ 59 19 39
Codeine 390 620 560 840 1200 1300 1100 1100 1100 4200 1300 1200
Cyproheptadine <LOQ <LOQ <LOQ <LOQ <LOQ <LOQ <LOQ <LOQ <LOQ 49 9.6 7.9
Desloratidin 5.3 10 9.3 27 36 12 8.2 9.5 13 170 87 38
Diclofenac 390 120 500 1400 900 1800 1700 2800 970 7000 1200 1500
Dicycloverin <LOQ <LOQ <LOQ <LOQ <LOQ <LOQ <LOQ <LOQ <LOQ 8 <LOQ <LOQ
Dihydroergotamine <LOQ <LOQ <LOQ <LOQ <LOQ <LOQ <LOQ <LOQ <LOQ 55 <LOQ <LOQ
Diltiazem 31 34 33 59 63 66 94 120 87 270 86 71
Diphenhydramine 6.5 11 15 40 36 32 14 12 10 200 32 29
Dipyridamole 6400 8500 5200 4900 6300 6200 9200 14000 3900 6900 1800 2100
Donepezil 5.2 3.9 1.9 9.8 7.8 1.4 5.3 5.4 2.1 70 31 20
Duloxetine <LOQ 1 <LOQ <LOQ <LOQ <LOQ <LOQ <LOQ <LOQ 11 11 4.5
Eprosartan 29 27 60 390 460 430 1700 570 290 940 240 220
Erythromycin 160 240 150 330 130 260 390 620 530 2100 77 550
Estradiol <LOQ <LOQ <LOQ <LOQ <LOQ <LOQ <LOQ <LOQ <LOQ <LOQ <LOQ <LOQ
Ethinyl estradiol <LOQ <LOQ <LOQ <LOQ <LOQ <LOQ <LOQ <LOQ <LOQ <LOQ <LOQ <LOQ
Etonogestrel <LOQ <LOQ <LOQ <LOQ <LOQ <LOQ <LOQ <LOQ <LOQ <LOQ <LOQ <LOQ
Ezetimibe <LOQ <LOQ <LOQ <LOQ <LOQ <LOQ <LOQ <LOQ 56 240 <LOQ <LOQ
Felodipine <LOQ <LOQ <LOQ <LOQ <LOQ <LOQ <LOQ <LOQ <LOQ <LOQ <LOQ <LOQ
Fentanyl 0.54 0.76 0.58 2.4 0.52 1.5 1.4 1.7 1.5 8.4 2.8 1.5
Fexofenadine 89 110 120 180 200 290 300 360 220 1100 250 240
Finasteride 17 12 <LOQ <LOQ <LOQ <LOQ <LOQ 19 12 28 <LOQ <LOQ
Flecainide 62 48 56 87 120 120 95 140 120 710 230 200
Fluconazole 97 170 150 170 270 290 1200 1600 1300 2100 400 410
Flunitrazepam <LOQ <LOQ <LOQ <LOQ <LOQ <LOQ 12 <LOQ 11 17 <LOQ <LOQ
Fluoxetine 8.2 10 <LOQ 38 39 41 <LOQ 12 7.1 240 35 72
Flupentixol <LOQ <LOQ <LOQ <LOQ <LOQ <LOQ <LOQ <LOQ <LOQ 72 72 7.5
Fluphenazine <LOQ <LOQ <LOQ <LOQ <LOQ <LOQ <LOQ <LOQ <LOQ 130 120 16
Flutamide <LOQ <LOQ <LOQ 5.4 <LOQ <LOQ <LOQ <LOQ <LOQ 110 23 12
Glibenclamide 19 11 21 <LOQ <LOQ 36 31 64 10 74 48 30
Glimepiride 11 <LOQ <LOQ <LOQ <LOQ <LOQ 10 <LOQ <LOQ <LOQ 26 <LOQ
Haloperidol 12 18 14 8.5 18 14 9.6 20 8.6 69 20 6.9
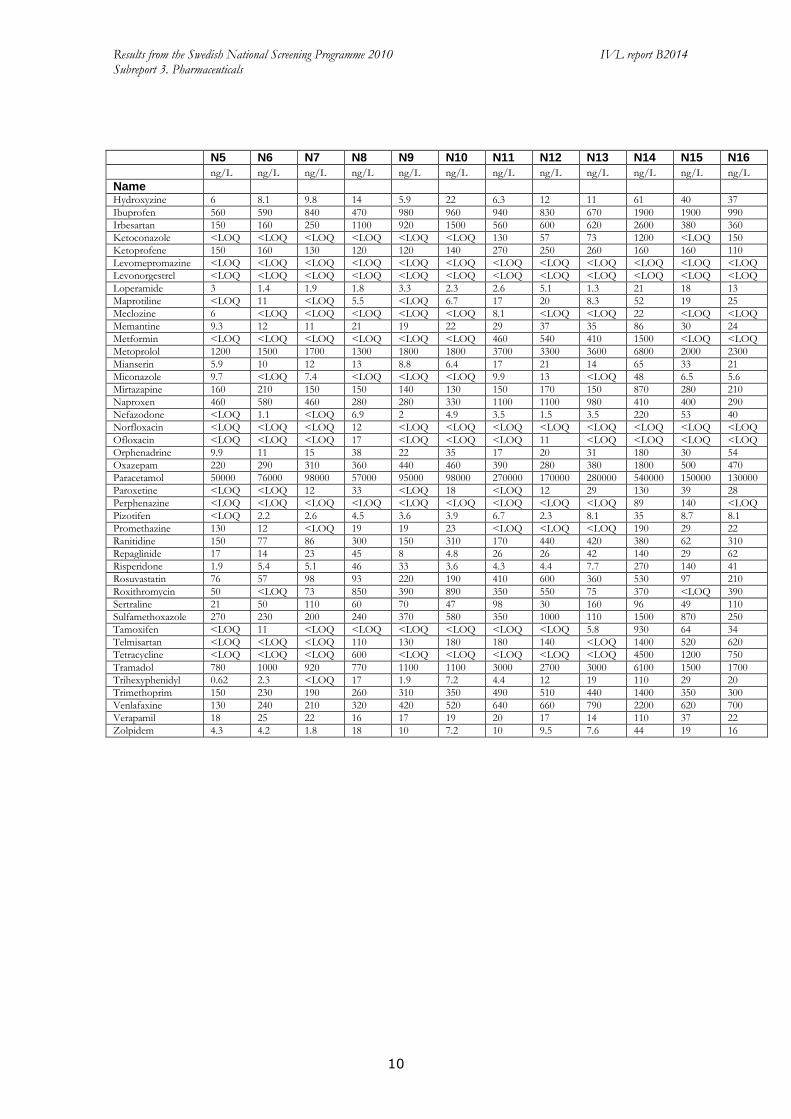
Results from the Swedish National Screening Programme 2010 IVL report B2014 Subreport 3. Pharmaceuticals
10
N5 N6 N7 N8 N9 N10 N11 N12 N13 N14 N15 N16
ng/L ng/L ng/L ng/L ng/L ng/L ng/L ng/L ng/L ng/L ng/L ng/L
Name
Hydroxyzine 6 8.1 9.8 14 5.9 22 6.3 12 11 61 40 37
Ibuprofen 560 590 840 470 980 960 940 830 670 1900 1900 990
Irbesartan 150 160 250 1100 920 1500 560 600 620 2600 380 360
Ketoconazole <LOQ <LOQ <LOQ <LOQ <LOQ <LOQ 130 57 73 1200 <LOQ 150
Ketoprofene 150 160 130 120 120 140 270 250 260 160 160 110
Levomepromazine <LOQ <LOQ <LOQ <LOQ <LOQ <LOQ <LOQ <LOQ <LOQ <LOQ <LOQ <LOQ
Levonorgestrel <LOQ <LOQ <LOQ <LOQ <LOQ <LOQ <LOQ <LOQ <LOQ <LOQ <LOQ <LOQ
Loperamide 3 1.4 1.9 1.8 3.3 2.3 2.6 5.1 1.3 21 18 13
Maprotiline <LOQ 11 <LOQ 5.5 <LOQ 6.7 17 20 8.3 52 19 25
Meclozine 6 <LOQ <LOQ <LOQ <LOQ <LOQ 8.1 <LOQ <LOQ 22 <LOQ <LOQ
Memantine 9.3 12 11 21 19 22 29 37 35 86 30 24
Metformin <LOQ <LOQ <LOQ <LOQ <LOQ <LOQ 460 540 410 1500 <LOQ <LOQ
Metoprolol 1200 1500 1700 1300 1800 1800 3700 3300 3600 6800 2000 2300
Mianserin 5.9 10 12 13 8.8 6.4 17 21 14 65 33 21
Miconazole 9.7 <LOQ 7.4 <LOQ <LOQ <LOQ 9.9 13 <LOQ 48 6.5 5.6
Mirtazapine 160 210 150 150 140 130 150 170 150 870 280 210
Naproxen 460 580 460 280 280 330 1100 1100 980 410 400 290
Nefazodone <LOQ 1.1 <LOQ 6.9 2 4.9 3.5 1.5 3.5 220 53 40
Norfloxacin <LOQ <LOQ <LOQ 12 <LOQ <LOQ <LOQ <LOQ <LOQ <LOQ <LOQ <LOQ
Ofloxacin <LOQ <LOQ <LOQ 17 <LOQ <LOQ <LOQ 11 <LOQ <LOQ <LOQ <LOQ
Orphenadrine 9.9 11 15 38 22 35 17 20 31 180 30 54
Oxazepam 220 290 310 360 440 460 390 280 380 1800 500 470
Paracetamol 50000 76000 98000 57000 95000 98000 270000 170000 280000 540000 150000 130000
Paroxetine <LOQ <LOQ 12 33 <LOQ 18 <LOQ 12 29 130 39 28
Perphenazine <LOQ <LOQ <LOQ <LOQ <LOQ <LOQ <LOQ <LOQ <LOQ 89 140 <LOQ
Pizotifen <LOQ 2.2 2.6 4.5 3.6 3.9 6.7 2.3 8.1 35 8.7 8.1
Promethazine 130 12 <LOQ 19 19 23 <LOQ <LOQ <LOQ 190 29 22
Ranitidine 150 77 86 300 150 310 170 440 420 380 62 310
Repaglinide 17 14 23 45 8 4.8 26 26 42 140 29 62
Risperidone 1.9 5.4 5.1 46 33 3.6 4.3 4.4 7.7 270 140 41
Rosuvastatin 76 57 98 93 220 190 410 600 360 530 97 210
Roxithromycin 50 <LOQ 73 850 390 890 350 550 75 370 <LOQ 390
Sertraline 21 50 110 60 70 47 98 30 160 96 49 110
Sulfamethoxazole 270 230 200 240 370 580 350 1000 110 1500 870 250
Tamoxifen <LOQ 11 <LOQ <LOQ <LOQ <LOQ <LOQ <LOQ 5.8 930 64 34
Telmisartan <LOQ <LOQ <LOQ 110 130 180 180 140 <LOQ 1400 520 620
Tetracycline <LOQ <LOQ <LOQ 600 <LOQ <LOQ <LOQ <LOQ <LOQ 4500 1200 750
Tramadol 780 1000 920 770 1100 1100 3000 2700 3000 6100 1500 1700
Trihexyphenidyl 0.62 2.3 <LOQ 17 1.9 7.2 4.4 12 19 110 29 20
Trimethoprim 150 230 190 260 310 350 490 510 440 1400 350 300
Venlafaxine 130 240 210 320 420 520 640 660 790 2200 620 700
Verapamil 18 25 22 16 17 19 20 17 14 110 37 22
Zolpidem 4.3 4.2 1.8 18 10 7.2 10 9.5 7.6 44 19 16

Results from the Swedish National Screening Programme 2010 IVL report B2014 Subreport 3. Pharmaceuticals
11
Appendix 8. Effluent from WWTPs in Skövde (N17-19), Stockholm (N20-22), Umeå (N23-25) and Uppsala (N26-28). N17 N18 N19 N20 N21 N22 N23 N24 N25 N26 N27 N28
ng/L ng/L ng/L ng/L ng/L ng/L ng/L ng/L ng/L ng/L ng/L ng/L
Name
Alfuzosin 24 43 40 34 66 38 77 38 58 110 62 110
Alprazolam 13 <LOQ 19 <LOQ <LOQ <LOQ <LOQ <LOQ 18 14 11 31
Amiodiarone <LOQ <LOQ <LOQ <LOQ <LOQ <LOQ <LOQ <LOQ <LOQ <LOQ <LOQ <LOQ
Amitryptiline <LOQ <LOQ <LOQ <LOQ 14 <LOQ 18 6.1 <LOQ 16 22 28
Atenolol 300 520 670 130 150 130 920 550 920 600 300 350
Atorvastatin <LOQ <LOQ <LOQ <LOQ <LOQ <LOQ 210 <LOQ 110 <LOQ <LOQ <LOQ
Atracurium 1.2 1.5 3.2 0.72 16 1.1 2.8 2.7 3.6 27 18 19
Azelastine <LOQ <LOQ <LOQ <LOQ 30 <LOQ <LOQ <LOQ <LOQ 9.8 9.4 22
Azithromycin <LOQ 6.6 5.1 22 27 17 17 <LOQ 8.2 23 10 17
Beclomethazone <LOQ <LOQ <LOQ <LOQ <LOQ <LOQ <LOQ <LOQ <LOQ <LOQ <LOQ <LOQ
Biperiden 0.57 0.62 1.3 1.8 12 0.15 0.84 1.8 0.92 26 6.9 38
Bisoprolol 100 170 250 67 86 69 150 94 120 110 59 88
Bromocriptine <LOQ <LOQ <LOQ <LOQ <LOQ <LOQ <LOQ <LOQ <LOQ <LOQ <LOQ 5.6
Buprenorphine 10 12 42 20 11 22 47 36 23 38 12 16
Bupropion 12 25 41 9.1 13 11 33 18 19 21 17 27
Carbamazepine 460 750 930 550 610 600 1100 660 860 1100 790 990
Chlorprothixen <LOQ <LOQ <LOQ <LOQ <LOQ <LOQ <LOQ <LOQ <LOQ <LOQ <LOQ 36
Chlorpromazine <LOQ <LOQ <LOQ <LOQ 7.1 <LOQ <LOQ <LOQ <LOQ 10 6 20
Cilazapril <LOQ 2.5 <LOQ <LOQ 6.7 <LOQ <LOQ <LOQ <LOQ 8.3 3.9 28
Ciprofloxacin 18 10 19 28 42 49 23 46 65 12 <LOQ <LOQ
Citalopram 170 260 360 240 280 230 480 260 370 350 250 300
Clarithromycine <LOQ 42 16 35 45 110 200 88 780 47 42 77
Clemastine <LOQ <LOQ <LOQ 0.52 15 <LOQ <LOQ <LOQ <LOQ 2.9 1.8 4.2
Clindamycin 62 110 160 79 100 90 280 150 230 200 140 160
Clomipramine 1.6 2.3 2.4 2 30 1.3 5.2 0.81 1.3 29 15 49
Clonazepam <LOQ <LOQ <LOQ <LOQ <LOQ <LOQ <LOQ <LOQ <LOQ <LOQ <LOQ <LOQ
Clotrimazol <LOQ <LOQ <LOQ 5.5 29 <LOQ 3.8 2.2 1.8 28 20 35
Codeine 110 180 250 78 110 78 780 540 670 580 450 600
Cyproheptadine <LOQ <LOQ <LOQ <LOQ 6.5 <LOQ 6.6 <LOQ <LOQ <LOQ 5.4 17
Desloratidin 8 10 15 6 30 8.4 6.5 10 8.9 81 42 67
Diclofenac 280 410 590 420 450 590 1300 430 1000 3900 1500 2100
Dicycloverin <LOQ <LOQ <LOQ <LOQ 5.8 <LOQ <LOQ <LOQ <LOQ <LOQ <LOQ 12
Dihydroergotamine <LOQ <LOQ <LOQ <LOQ <LOQ <LOQ <LOQ <LOQ <LOQ <LOQ <LOQ <LOQ
Diltiazem 11 17 24 44 55 39 100 54 80 40 30 46
Diphenhydramine 13 7.7 11 36 44 28 13 9.2 10 54 26 43
Dipyridamole <LOQ <LOQ <LOQ <LOQ <LOQ <LOQ <LOQ <LOQ <LOQ <LOQ <LOQ <LOQ
Donepezil 0.8 1.4 1.7 0.95 24 0.6 2.4 1 3.3 22 16 32
Duloxetine <LOQ <LOQ <LOQ 2.7 14 <LOQ 14 4 <LOQ 2.1 1.5 7.7
Eprosartan 36 20 12 210 340 230 870 580 550 98 69 85
Erythromycin 73 250 120 100 230 110 420 150 530 94 53 220
Estradiol <LOQ <LOQ <LOQ <LOQ <LOQ <LOQ <LOQ <LOQ <LOQ <LOQ <LOQ <LOQ
Ethinyl estradiol <LOQ <LOQ <LOQ <LOQ <LOQ <LOQ <LOQ <LOQ <LOQ <LOQ <LOQ <LOQ
Etonogestrel <LOQ <LOQ <LOQ <LOQ <LOQ <LOQ <LOQ <LOQ <LOQ <LOQ <LOQ <LOQ
Ezetimibe <LOQ <LOQ <LOQ <LOQ <LOQ <LOQ <LOQ <LOQ <LOQ <LOQ <LOQ <LOQ
Felodipine <LOQ <LOQ <LOQ <LOQ <LOQ <LOQ <LOQ <LOQ <LOQ <LOQ <LOQ <LOQ
Fentanyl 1.1 <LOQ 0.54 1.5 3.7 1.1 1.3 2.7 2.2 4.9 3.1 6.3
Fexofenadine 62 87 94 110 140 140 270 110 170 370 220 290
Finasteride 17 <LOQ 20 <LOQ <LOQ <LOQ <LOQ 20 12 <LOQ <LOQ 14
Flecainide 51 62 90 130 150 130 140 97 120 230 160 220
Fluconazole 72 140 170 140 180 170 1100 660 980 520 280 390
Flunitrazepam <LOQ <LOQ <LOQ <LOQ <LOQ <LOQ <LOQ <LOQ <LOQ <LOQ <LOQ <LOQ
Fluoxetine 12 <LOQ 5.2 17 63 15 13 6.8 11 81 47 94
Flupentixol 10 11 12 <LOQ <LOQ <LOQ 40 35 35 8.6 8.6 13
Fluphenazine <LOQ <LOQ <LOQ <LOQ 11 <LOQ <LOQ <LOQ <LOQ <LOQ <LOQ 14
Flutamide <LOQ <LOQ <LOQ <LOQ <LOQ <LOQ <LOQ <LOQ <LOQ 34 <LOQ 64
Glibenclamide 42 53 28 <LOQ 71 <LOQ 57 53 46 41 41 44
Glimepiride 14 <LOQ 13 <LOQ <LOQ <LOQ 26 39 15 11 <LOQ 11
Haloperidol 1.7 0.97 1.5 2 22 0.88 20 39 11 7.1 9.5 14

Results from the Swedish National Screening Programme 2010 IVL report B2014 Subreport 3. Pharmaceuticals
12
N17 N18 N19 N20 N21 N22 N23 N24 N25 N26 N27 N28
ng/L ng/L ng/L ng/L ng/L ng/L ng/L ng/L ng/L ng/L ng/L ng/L
Name
Hydroxyzine 1.8 2.4 2.4 2.9 21 1.6 5.8 3.8 4.6 22 16 51
Ibuprofen 120 73 84 110 42 210 480 990 490 140 110 100
Irbesartan 100 160 220 490 560 630 460 200 300 1100 530 640
Ketoconazole <LOQ <LOQ <LOQ <LOQ <LOQ <LOQ <LOQ <LOQ <LOQ 120 <LOQ <LOQ
Ketoprofene 62 120 110 18 29 29 220 200 160 170 120 120
Levomepromazine <LOQ <LOQ <LOQ <LOQ <LOQ <LOQ <LOQ <LOQ <LOQ <LOQ <LOQ <LOQ
Levonorgestrel <LOQ <LOQ <LOQ <LOQ <LOQ <LOQ <LOQ <LOQ <LOQ <LOQ <LOQ <LOQ
Loperamide 1.3 1.5 0.94 0.89 28 0.5 4 3.4 3.5 14 19 25
Maprotiline <LOQ <LOQ <LOQ <LOQ 13 <LOQ 19 6.3 <LOQ 18 21 27
Meclozine <LOQ 7.9 5.8 <LOQ <LOQ <LOQ 15 13 9.8 <LOQ <LOQ 5.1
Memantine 6.5 8.9 13 13 20 13 43 29 51 31 25 45
Metformin <LOQ <LOQ <LOQ <LOQ <LOQ <LOQ 370 <LOQ 290 <LOQ <LOQ <LOQ
Metoprolol 680 1100 1700 1400 1500 1400 2800 1600 2300 2000 1400 1800
Mianserin 7.2 8.6 6.8 5.2 16 5.6 61 24 45 35 26 42
Miconazole <LOQ 7.4 <LOQ <LOQ <LOQ <LOQ 9.2 8.4 5.9 <LOQ <LOQ 7.4
Mirtazapine 130 180 200 120 170 100 180 81 130 410 230 330
Naproxen 110 230 180 42 30 26 450 490 300 130 69 82
Nefazodone <LOQ 0.96 1.6 1 22 0.81 1.9 <LOQ 2.1 16 10 70
Norfloxacin <LOQ <LOQ <LOQ <LOQ <LOQ <LOQ <LOQ <LOQ <LOQ <LOQ <LOQ <LOQ
Ofloxacin <LOQ <LOQ <LOQ <LOQ <LOQ <LOQ <LOQ <LOQ 14 <LOQ <LOQ <LOQ
Orphenadrine 5.6 7.5 12 13 22 14 9.7 5.7 8 81 35 62
Oxazepam 250 340 540 490 440 500 450 280 340 730 530 660
Paracetamol 390 100 120 580 99 17 230 160 48 410 11 15
Paroxetine <LOQ <LOQ <LOQ <LOQ <LOQ <LOQ <LOQ <LOQ <LOQ 33 <LOQ 44
Perphenazine <LOQ <LOQ <LOQ <LOQ 17 <LOQ <LOQ <LOQ <LOQ <LOQ <LOQ 13
Pizotifen 0.98 1.7 0.62 0.75 7.3 <LOQ 0.96 3.8 <LOQ 19 6.5 22
Promethazine 12 <LOQ <LOQ <LOQ 11 <LOQ <LOQ <LOQ <LOQ 61 33 86
Ranitidine <LOQ 6.8 16 21 20 23 32 9.1 34 150 36 77
Repaglinide 9.8 6.9 11 3 11 4.3 10 13 4.9 40 17 51
Risperidone 2.6 1.8 2 5.2 79 7.2 74 14 3.3 130 85 160
Rosuvastatin 25 42 52 <LOQ <LOQ <LOQ 540 220 350 15 <LOQ 42
Roxithromycin <LOQ <LOQ <LOQ <LOQ 80 <LOQ 220 87 980 90 <LOQ 60
Sertraline <LOQ 22 12 28 <LOQ 19 28 <LOQ 13 25 15 32
Sulfamethoxazole 36 30 31 190 170 290 78 53 140 280 110 130
Tamoxifen <LOQ <LOQ <LOQ <LOQ 29 <LOQ 5.1 9 <LOQ 12 45 210
Telmisartan <LOQ <LOQ <LOQ 75 98 52 120 56 73 180 120 250
Tetracycline <LOQ <LOQ <LOQ <LOQ <LOQ <LOQ <LOQ <LOQ <LOQ <LOQ <LOQ <LOQ
Tramadol 730 1100 1300 1200 1500 1300 3000 1700 2300 2800 2100 2600
Trihexyphenidyl 0.57 1.7 0.86 1.3 17 1.1 2.5 1.6 3.5 47 13 58
Trimethoprim 120 210 220 60 84 81 510 320 420 350 190 210
Venlafaxine 120 160 240 330 460 350 680 470 580 660 500 700
Verapamil <LOQ 11 <LOQ 13 29 <LOQ 15 20 11 18 14 25
Zolpidem 2.9 3.9 4.8 7.6 20 7.8 18 6.2 8.4 19 16 41

Results from the Swedish National Screening Programme 2010 IVL report B2014 Subreport 3. Pharmaceuticals
13
Appendix 9. Removal efficiencies in four Swedish WWTPs (%). Skövde
a Stockholm
b Umeå
c Uppsala
d
(%) (%) (%) (%)
Name
Alfuzosin -13 25 -45 25
Alprazolam 29 > 47 27 49
Amiodiarone
Amitryptiline > 37 -97 -12 24
Atenolol 20 72 28 83
Atorvastatin > 63 58 > 81
Atracurium 55 28 25 -5
Azelastine 49
Azithromycin 25 -113 -12 17
Beclomethazone > 17 > 47 > 23
Biperiden 9 18 86 31
Bisoprolol 17 30 38 71
Bromocriptine > 55 > 64 75
Buprenorphine 86 84 82 96
Bupropion -11 31 26 50
Carbamazepine -51 -20 33 25
Chlorprothixen > 9 > 17 -2
Chlorpromazine > 13 41 > 12 70
Cilazapril 87 -35 > 46 39
Ciprofloxacin 79 76 46 43
Citalopram 19 18 -42 49
Clarithromycine 60 82 -6 81
Clemastine e -12
Clindamycin -142 -88 -25 -38
Clomipramine 73 21 81 32
Clonazepam
Clotrimazol 31 e 29
Codeine 66 92 40 76
Cyproheptadine e e 49
Desloratidin -34 41 17 36
Diclofenac -27 64 50 23
Dicycloverin e -50
Dihydroergotamine > 9.1
Diltiazem 47 27 22 73
Diphenhydramine 2 0 11 53
Dipyridamole > 99 > 99 > 99 > 99
Donepezil 65 -34 48 42
Duloxetine > 0.1 e 57
Eprosartan 41 39 22 82
Erythromycin 19 39 29 87
Estradiol
Ethinyl estradiol
Etonogestrel
Ezetimibe > 11 > 79
Felodipine
Fentanyl -31 -43 -35 -13
Fexofenadine 24 42 38 45
Finasteride -28 -3 50
Flecainide -22 -25 -1 46
Fluconazole 8 33 33 59
Flunitrazepam > 13 > 41
Fluoxetine 5 19 -8 36
Flupentixol e e 80
Fluphenazine e 84
Flutamide > 7.4 -1
Glibenclamide -141 -97 -49 17
Glimepiride -23 -167 58
Haloperidol 91 39 -83 68
Hydroxyzine 72 39 52 36
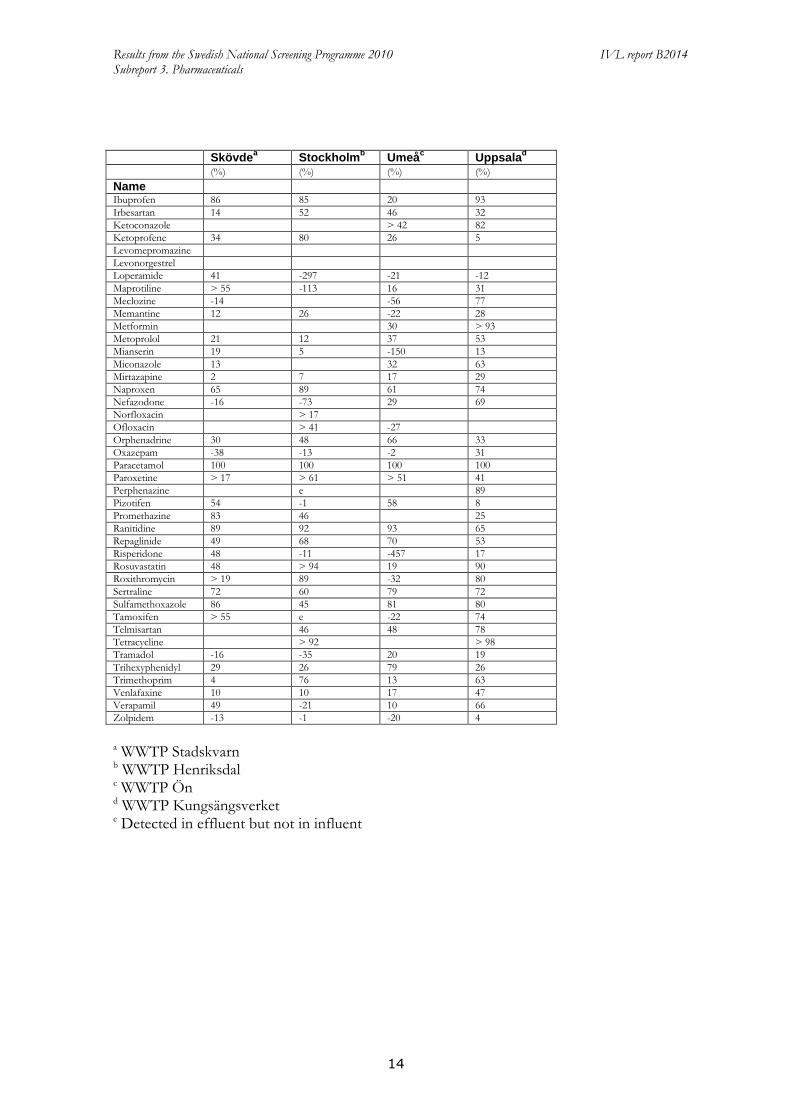
Results from the Swedish National Screening Programme 2010 IVL report B2014 Subreport 3. Pharmaceuticals
14
Skövdea Stockholm
b Umeå
c Uppsala
d
(%) (%) (%) (%)
Name
Ibuprofen 86 85 20 93
Irbesartan 14 52 46 32
Ketoconazole > 42 82
Ketoprofene 34 80 26 5
Levomepromazine
Levonorgestrel
Loperamide 41 -297 -21 -12
Maprotiline > 55 -113 16 31
Meclozine -14 -56 77
Memantine 12 26 -22 28
Metformin 30 > 93
Metoprolol 21 12 37 53
Mianserin 19 5 -150 13
Miconazole 13 32 63
Mirtazapine 2 7 17 29
Naproxen 65 89 61 74
Nefazodone -16 -73 29 69
Norfloxacin > 17
Ofloxacin > 41 -27
Orphenadrine 30 48 66 33
Oxazepam -38 -13 -2 31
Paracetamol 100 100 100 100
Paroxetine > 17 > 61 > 51 41
Perphenazine e 89
Pizotifen 54 -1 58 8
Promethazine 83 46 25
Ranitidine 89 92 93 65
Repaglinide 49 68 70 53
Risperidone 48 -11 -457 17
Rosuvastatin 48 > 94 19 90
Roxithromycin > 19 89 -32 80
Sertraline 72 60 79 72
Sulfamethoxazole 86 45 81 80
Tamoxifen > 55 e -22 74
Telmisartan 46 48 78
Tetracycline > 92 > 98
Tramadol -16 -35 20 19
Trihexyphenidyl 29 26 79 26
Trimethoprim 4 76 13 63
Venlafaxine 10 10 17 47
Verapamil 49 -21 10 66
Zolpidem -13 -1 -20 4
a WWTP Stadskvarn b WWTP Henriksdal c WWTP Ön d WWTP Kungsängsverket e Detected in effluent but not in influent
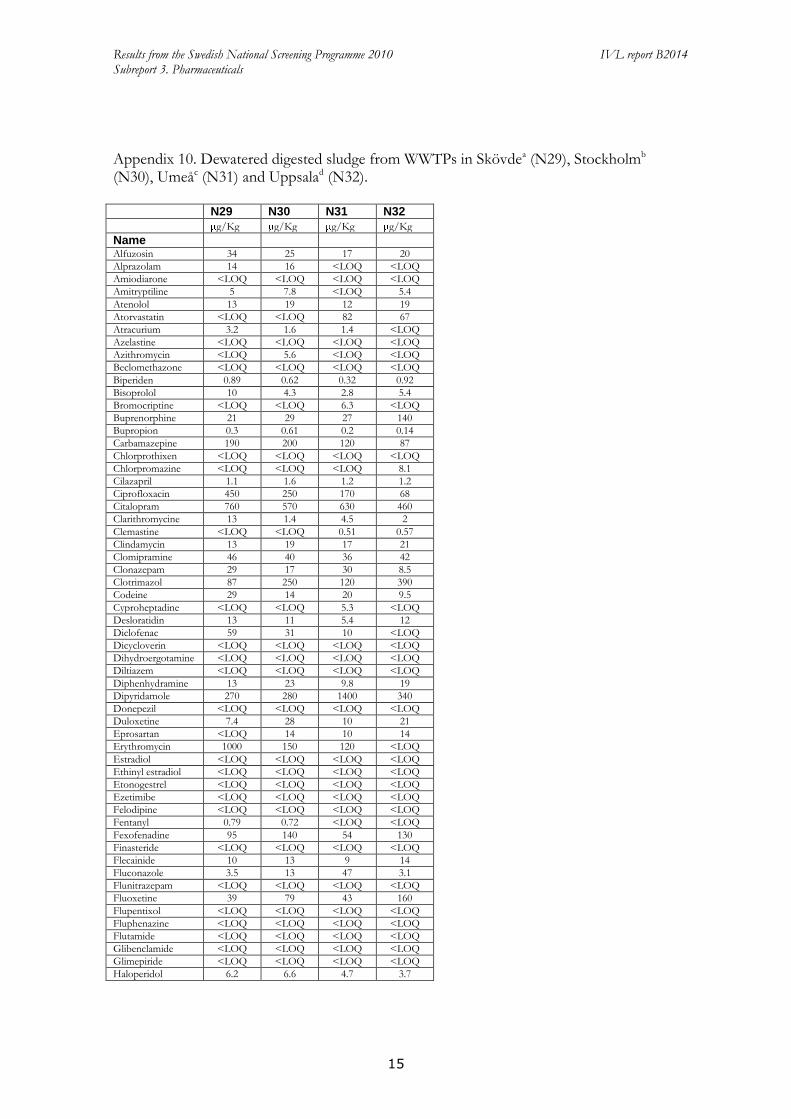
Results from the Swedish National Screening Programme 2010 IVL report B2014 Subreport 3. Pharmaceuticals
15
Appendix 10. Dewatered digested sludge from WWTPs in Skövdea (N29), Stockholmb (N30), Umeåc (N31) and Uppsalad (N32). N29 N30 N31 N32
g/Kg g/Kg g/Kg g/Kg
Name
Alfuzosin 34 25 17 20
Alprazolam 14 16 <LOQ <LOQ
Amiodiarone <LOQ <LOQ <LOQ <LOQ
Amitryptiline 5 7.8 <LOQ 5.4
Atenolol 13 19 12 19
Atorvastatin <LOQ <LOQ 82 67
Atracurium 3.2 1.6 1.4 <LOQ
Azelastine <LOQ <LOQ <LOQ <LOQ
Azithromycin <LOQ 5.6 <LOQ <LOQ
Beclomethazone <LOQ <LOQ <LOQ <LOQ
Biperiden 0.89 0.62 0.32 0.92
Bisoprolol 10 4.3 2.8 5.4
Bromocriptine <LOQ <LOQ 6.3 <LOQ
Buprenorphine 21 29 27 140
Bupropion 0.3 0.61 0.2 0.14
Carbamazepine 190 200 120 87
Chlorprothixen <LOQ <LOQ <LOQ <LOQ
Chlorpromazine <LOQ <LOQ <LOQ 8.1
Cilazapril 1.1 1.6 1.2 1.2
Ciprofloxacin 450 250 170 68
Citalopram 760 570 630 460
Clarithromycine 13 1.4 4.5 2
Clemastine <LOQ <LOQ 0.51 0.57
Clindamycin 13 19 17 21
Clomipramine 46 40 36 42
Clonazepam 29 17 30 8.5
Clotrimazol 87 250 120 390
Codeine 29 14 20 9.5
Cyproheptadine <LOQ <LOQ 5.3 <LOQ
Desloratidin 13 11 5.4 12
Diclofenac 59 31 10 <LOQ
Dicycloverin <LOQ <LOQ <LOQ <LOQ
Dihydroergotamine <LOQ <LOQ <LOQ <LOQ
Diltiazem <LOQ <LOQ <LOQ <LOQ
Diphenhydramine 13 23 9.8 19
Dipyridamole 270 280 1400 340
Donepezil <LOQ <LOQ <LOQ <LOQ
Duloxetine 7.4 28 10 21
Eprosartan <LOQ 14 10 14
Erythromycin 1000 150 120 <LOQ
Estradiol <LOQ <LOQ <LOQ <LOQ
Ethinyl estradiol <LOQ <LOQ <LOQ <LOQ
Etonogestrel <LOQ <LOQ <LOQ <LOQ
Ezetimibe <LOQ <LOQ <LOQ <LOQ
Felodipine <LOQ <LOQ <LOQ <LOQ
Fentanyl 0.79 0.72 <LOQ <LOQ
Fexofenadine 95 140 54 130
Finasteride <LOQ <LOQ <LOQ <LOQ
Flecainide 10 13 9 14
Fluconazole 3.5 13 47 3.1
Flunitrazepam <LOQ <LOQ <LOQ <LOQ
Fluoxetine 39 79 43 160
Flupentixol <LOQ <LOQ <LOQ <LOQ
Fluphenazine <LOQ <LOQ <LOQ <LOQ
Flutamide <LOQ <LOQ <LOQ <LOQ
Glibenclamide <LOQ <LOQ <LOQ <LOQ
Glimepiride <LOQ <LOQ <LOQ <LOQ
Haloperidol 6.2 6.6 4.7 3.7

Results from the Swedish National Screening Programme 2010 IVL report B2014 Subreport 3. Pharmaceuticals
16
N29 N30 N31 N32
g/Kg g/Kg g/Kg g/Kg
Name
Hydroxyzine 29 39 22 29
Ibuprofen <LOQ <LOQ <LOQ <LOQ
Irbesartan 37 280 67 75
Ketoconazole 510 1200 1100 1800
Ketoprofene <LOQ <LOQ <LOQ <LOQ
Levomepromazine <LOQ <LOQ <LOQ <LOQ
Levonorgestrel <LOQ <LOQ <LOQ <LOQ
Loperamide 6.9 17 4.5 11
Maprotiline <LOQ 5.2 <LOQ <LOQ
Meclozine 12 13 13 16
Memantine 1.9 0.91 3.1 2.1
Metformin <LOQ <LOQ <LOQ <LOQ
Metoprolol 180 410 210 190
Mianserin 16 11 94 25
Miconazole 180 340 210 410
Mirtazapine 120 66 57 110
Naproxen <LOQ <LOQ <LOQ <LOQ
Nefazodone 0.8 0.81 2.9 2.3
Norfloxacin 62 84 16 30
Ofloxacin <LOQ 27 17 <LOQ
Orphenadrine 13 22 10 8.8
Oxazepam 43 18 12 18
Paracetamol 73 11 <LOQ <LOQ
Paroxetine 25 24 <LOQ 24
Perphenazine <LOQ <LOQ <LOQ <LOQ
Pizotifen <LOQ 1.6 3.7 2.6
Promethazine 55 64 45 88
Ranitidine <LOQ <LOQ <LOQ <LOQ
Repaglinide 0.84 1.2 <LOQ 1.3
Risperidone 1.2 2.1 1.9 0.75
Rosuvastatin <LOQ 28 <LOQ <LOQ
Roxithromycin <LOQ <LOQ <LOQ <LOQ
Sertraline 440 380 420 770
Sulfamethoxazole 8.8 12 <LOQ 11
Tamoxifen 6.7 13 7.5 9.6
Telmisartan 130 450 180 1400
Tetracycline <LOQ <LOQ 100 79
Tramadol <LOQ 68 <LOQ 57
Trihexyphenidyl 2.7 2.5 1.3 0.54
Trimethoprim 27 2.2 2.5 1.1
Venlafaxine 86 310 150 140
Verapamil <LOQ <LOQ 18 <LOQ
Zolpidem 7.7 8.3 3.2 5.9
a WWTP Stadskvarn b WWTP Henriksdal c WWTP Ön d WWTP Kungsängsverket

Results from the Swedish National Screening Programme 2010 IVL report B2014 Subreport 3. Pharmaceuticals
17
Appendix 11. Calculated concentration ratios (CR) in Katrineholm (N1), Vallentuna (N2), Skövde (N33-38) and Uppsala (N39-43). See 2.2 and 5.3 for aditional information. N1 N2 N33 N34 N35 N36 N37 N38 N39 N40 N41 N42 N43
Name
Alfuzosin 344 908 3842 4541 50 36 1784 2220 768 30 154 270 476
Alprazolam 3
Atenolol 72030 72030 3445 2032 22638 8168 33014 2201 7923 12780 10030
Atracurium b b b b b b b b b b
Azithromycin 48 241
Biperiden 66 15
Bisoprolol 5486 19200 34560 35 23 628 1016 2880 59 192 735 346
Buprenorphine 0.1
Bupropion 21 46 252 258 7.3 6.1 89 143 314 8.3 39 26 89
Carbamazepine 28875 36861 39375 70713 737 630 8662 15750 11948 456 1824 3150 3983
Cilazapril 125 334
Ciprofloxacin 2E+06 50000 1E+05 7E+05 4E+05 82609 2E+05 3E+05 1E+06 2E+06 2E+06
Citalopram 8.8 7.8 5.2 12 1.0 0.7 8.3 17 21 0.7 4.9 3.7 7.8
Clarithromycine 186 7 1964 123 84 22 303 2076 3460 2202
Clemastine 1.1
Clindamycin 31313 2192 1512 20233 24354 42424 939 3868 8768 7306
Clomipramine 17 20 21 11
Clotrimazol b b b b b b b b
Codeine 11092 22183 325 222 4294 9507 2662 78 286 467 532
Desloratidin 96 72 53 465
Diclofenac 20 65 217 5 16 163 51
Diltiazem 2875 2324 49793 55768 50698 1394 4726 3927 6485
Diphenhydramine 13567 30833 6359 485 323 22865 7827 37685 185 925 1696 1850
Eprosartan b b b b b b b b b b b
Erythromycin b b b
Fentanyl 8.3 36 15 19 19 36 42 11
Fexofenadine 397 306 2931 4303 2661 135 311 1064 1264
Finasteride 6.7 23
Flecainide 940 208 2124 2244 62 42 681 898 790 15 62 68 104
Fluconazole 1E+06 3E+06 45455 3E+05 60241 50000 2E+05 5E+05 5E+05 17241 1E+05 2E+05 2E+05
Fluoxetine 15 78
Flupentixol 0.6 0.45 0.3
Glibenclamide 6.4 4.2 4.8 5.0 9.3
Haloperidol 2.3 7.0 3.0 3.3 5.9 10 27 4.6 9.3 2.2 14
Hydroxyzine 3122 4787 12598 1496 2476 7181 3420 1751 3420 3989 2660
Ibuprofen 5727 2996 1947 2822 1391 4868 5409 1082 1623 1391 2822 9272
Irbesartan 3.1 23 25 15 0.5 0.4 4.2 16 6.3 0.1 0.4 1.0 1.4
Ketoprofene 1195 1166 3768 3265 445 1884 3768 2041
Loperamide 1.9 3.2 3.0 7.7 5.6 4.2 3.5 2.5 10 4.2 2.7 1.9 12
Meclozine 0.07 0.16
Memantine 3540 3014 3780 3597 437 343 3717 149 637 970 1394
Metoprolol 2523 1283 23 16 270 416 302 13 42 118 77
Mianserin 97 41 43 101 101
Miconazole b
Mirtazapine 116 107 67 388 607 735
Naproxen 20195 29571 18400 6369 8449 18818 75273 41400 10753 21789 30667 21789
Nefazodone 24
Orphenadrine 3494 349 288 1766 2606 1368 59 278 373 1095
Oxazepam 3200 1463 3072 134 99 1097 2048 1920 53 236 445 521
Paracetamol 2E+06 1E+06 2E+05 3E+05 9E+05 3E+05 2E+05 5E+05 1E+05 5E+05 5E+05 6E+05 7E+05
Pizotifen 12 8.5 11
Ranitidine 43140 34258 2118 15530
Repaglinide b b b b b b b b b b b b b
Risperidone 81 68 117 61 14 81 61 15 76
Rosuvastatin 39 19 107
Roxithromycin 295 6488 1352
Sertraline 4.6 4.6 1.8 2.8
Sulfamethoxazole 1E+06 2E+05 4E+05 2E+06 2E+06 8E+05 1E+06 1E+06 7E+05 5E+06
Tamoxifen b

Results from the Swedish National Screening Programme 2010 IVL report B2014 Subreport 3. Pharmaceuticals
18
N1 N2 N33 N34 N35 N36 N37 N38 N39 N40 N41 N42 N43
Name
Telmisartan b
Tramadol 800 2087 3428 7.4 5.5 104 178 94 2.7 9.2 17 19
Trihexyphenidyl 191 45 115 101 66 54 61 26 172 95
Trimethoprim 2E+05 5E+05 30000 97059 23571 19412 63462 2E+05 2E+05 15714 66000 84615 1E+05
Venlafaxine 170 382 1019 556 44 47 407 711 360 14 41 111 89
Verapamil 1.2 1.3
Zolpidem 448 376 1774 1679 392 303 1843 1567 157 522 553 855
Appendix 12. Drinking water from Stockholm (N44-46) and Umeå (N47-49). N44 N45 N46 N47 N48 N49
ng/L ng/L ng/L ng/L ng/L ng/L
Name
Alfuzosin <LOQ <LOQ <LOQ <LOQ <LOQ <LOQ
Alprazolam <LOQ <LOQ <LOQ <LOQ <LOQ <LOQ
Amiodiarone <LOQ <LOQ <LOQ <LOQ <LOQ <LOQ
Amitryptiline <LOQ <LOQ <LOQ <LOQ <LOQ <LOQ
Atenolol <LOQ <LOQ <LOQ <LOQ <LOQ <LOQ
Atorvastatin <LOQ <LOQ <LOQ <LOQ <LOQ <LOQ
Atracurium <LOQ <LOQ <LOQ <LOQ <LOQ <LOQ
Azelastine <LOQ <LOQ <LOQ <LOQ <LOQ <LOQ
Azithromycin <LOQ <LOQ <LOQ <LOQ <LOQ <LOQ
Beclomethazone <LOQ <LOQ <LOQ <LOQ <LOQ <LOQ
Biperiden <LOQ <LOQ <LOQ <LOQ <LOQ <LOQ
Bisoprolol <LOQ <LOQ <LOQ <LOQ <LOQ <LOQ
Bromocriptine <LOQ <LOQ <LOQ <LOQ <LOQ <LOQ
Buprenorphine 16 <LOQ <LOQ <LOQ <LOQ <LOQ
Bupropion 0.91 <LOQ 1 <LOQ <LOQ <LOQ
Carbamazepine 19 14 11 4 7.2 2.2
Chlorprothixen <LOQ <LOQ <LOQ <LOQ <LOQ <LOQ
Chlorpromazine <LOQ <LOQ <LOQ <LOQ <LOQ <LOQ
Cilazapril <LOQ <LOQ <LOQ <LOQ <LOQ <LOQ
Ciprofloxacin <LOQ <LOQ <LOQ <LOQ <LOQ <LOQ
Citalopram 6.6 <LOQ <LOQ <LOQ <LOQ <LOQ
Clarithromycine <LOQ <LOQ <LOQ <LOQ <LOQ <LOQ
Clemastine <LOQ <LOQ <LOQ <LOQ <LOQ <LOQ
Clindamycin <LOQ <LOQ <LOQ <LOQ <LOQ <LOQ
Clomipramine <LOQ <LOQ <LOQ <LOQ <LOQ <LOQ
Clonazepam <LOQ <LOQ <LOQ <LOQ <LOQ <LOQ
Clotrimazol <LOQ <LOQ <LOQ <LOQ <LOQ <LOQ
Codeine <LOQ <LOQ <LOQ <LOQ <LOQ <LOQ
Cyproheptadine <LOQ <LOQ <LOQ <LOQ <LOQ <LOQ
Desloratidin <LOQ <LOQ <LOQ <LOQ <LOQ <LOQ
Diclofenac 140 <LOQ <LOQ <LOQ <LOQ <LOQ
Dicycloverin <LOQ <LOQ <LOQ <LOQ <LOQ <LOQ
Dihydroergotamine <LOQ <LOQ <LOQ <LOQ <LOQ <LOQ
Diltiazem <LOQ 7.9 <LOQ <LOQ <LOQ <LOQ
Diphenhydramine 0.82 <LOQ <LOQ <LOQ <LOQ <LOQ
Dipyridamole <LOQ <LOQ <LOQ <LOQ <LOQ <LOQ
Donepezil <LOQ <LOQ <LOQ <LOQ <LOQ <LOQ
Duloxetine <LOQ <LOQ <LOQ <LOQ <LOQ <LOQ
Eprosartan <LOQ <LOQ 5.1 <LOQ <LOQ <LOQ
Erythromycin <LOQ <LOQ <LOQ <LOQ <LOQ <LOQ
Estradiol <LOQ <LOQ <LOQ <LOQ <LOQ <LOQ
Ethinyl estradiol <LOQ <LOQ <LOQ <LOQ <LOQ <LOQ
Etonogestrel <LOQ <LOQ <LOQ <LOQ <LOQ <LOQ
Ezetimibe <LOQ <LOQ <LOQ <LOQ <LOQ <LOQ
Felodipine <LOQ <LOQ <LOQ <LOQ <LOQ <LOQ
Fentanyl <LOQ <LOQ <LOQ <LOQ <LOQ <LOQ
Fexofenadine <LOQ <LOQ <LOQ <LOQ <LOQ <LOQ
Finasteride <LOQ <LOQ <LOQ <LOQ <LOQ <LOQ

Results from the Swedish National Screening Programme 2010 IVL report B2014 Subreport 3. Pharmaceuticals
19
N44 N45 N46 N47 N48 N49
ng/L ng/L ng/L ng/L ng/L ng/L
Name
Flecainide 2.5 1.1 5.3 <LOQ <LOQ <LOQ
Fluconazole 3.3 1.4 3.2 <LOQ <LOQ <LOQ
Flunitrazepam <LOQ <LOQ <LOQ <LOQ <LOQ <LOQ
Fluoxetine <LOQ <LOQ <LOQ <LOQ <LOQ <LOQ
Flupentixol <LOQ <LOQ <LOQ <LOQ <LOQ <LOQ
Fluphenazine <LOQ <LOQ <LOQ <LOQ <LOQ <LOQ
Flutamide <LOQ <LOQ <LOQ <LOQ <LOQ <LOQ
Glibenclamide <LOQ <LOQ <LOQ <LOQ <LOQ <LOQ
Glimepiride <LOQ <LOQ <LOQ <LOQ <LOQ <LOQ
Haloperidol <LOQ <LOQ <LOQ <LOQ <LOQ <LOQ
Hydroxyzine <LOQ <LOQ <LOQ <LOQ <LOQ <LOQ
Ibuprofen <LOQ <LOQ <LOQ <LOQ <LOQ <LOQ
Irbesartan 2.8 1.3 0.86 <LOQ <LOQ <LOQ
Ketoconazole <LOQ <LOQ <LOQ <LOQ <LOQ <LOQ
Ketoprofene <LOQ <LOQ <LOQ <LOQ <LOQ <LOQ
Levomepromazine <LOQ <LOQ <LOQ <LOQ <LOQ <LOQ
Levonorgestrel <LOQ <LOQ <LOQ <LOQ <LOQ <LOQ
Loperamide <LOQ <LOQ <LOQ <LOQ <LOQ <LOQ
Maprotiline <LOQ <LOQ <LOQ <LOQ <LOQ <LOQ
Meclozine 5.2 <LOQ <LOQ <LOQ <LOQ <LOQ
Memantine 4.1 1.4 2.9 <LOQ <LOQ <LOQ
Metformin <LOQ <LOQ <LOQ <LOQ <LOQ <LOQ
Metoprolol 7.9 16 5.1 <LOQ 9.1 <LOQ
Mianserin <LOQ 2.2 <LOQ <LOQ <LOQ <LOQ
Miconazole <LOQ <LOQ <LOQ <LOQ <LOQ <LOQ
Mirtazapine <LOQ <LOQ <LOQ <LOQ <LOQ <LOQ
Naproxen 40 23 45 <LOQ <LOQ <LOQ
Nefazodone <LOQ <LOQ <LOQ <LOQ <LOQ <LOQ
Norfloxacin <LOQ 11 <LOQ <LOQ <LOQ <LOQ
Ofloxacin <LOQ 22 14 <LOQ <LOQ <LOQ
Orphenadrine <LOQ <LOQ <LOQ <LOQ <LOQ <LOQ
Oxazepam 11 6.9 14 <LOQ <LOQ <LOQ
Paracetamol <LOQ 11 15 <LOQ <LOQ <LOQ
Paroxetine <LOQ <LOQ <LOQ <LOQ <LOQ <LOQ
Perphenazine <LOQ <LOQ <LOQ <LOQ <LOQ <LOQ
Pizotifen <LOQ <LOQ <LOQ <LOQ <LOQ <LOQ
Promethazine <LOQ <LOQ <LOQ <LOQ <LOQ <LOQ
Ranitidine <LOQ <LOQ <LOQ <LOQ <LOQ <LOQ
Repaglinide 2.3 3.6 2.9 <LOQ <LOQ <LOQ
Risperidone 14 17 16 <LOQ <LOQ <LOQ
Rosuvastatin <LOQ <LOQ <LOQ <LOQ <LOQ <LOQ
Roxithromycin <LOQ <LOQ <LOQ <LOQ <LOQ <LOQ
Sertraline <LOQ <LOQ <LOQ <LOQ <LOQ <LOQ
Sulfamethoxazole <LOQ <LOQ <LOQ <LOQ <LOQ <LOQ
Tamoxifen <LOQ <LOQ <LOQ <LOQ <LOQ <LOQ
Telmisartan <LOQ <LOQ <LOQ <LOQ <LOQ <LOQ
Tetracycline <LOQ <LOQ <LOQ <LOQ <LOQ <LOQ
Tramadol <LOQ <LOQ <LOQ <LOQ <LOQ <LOQ
Trihexyphenidyl <LOQ <LOQ <LOQ <LOQ <LOQ <LOQ
Trimethoprim 4.7 6.2 2.3 5.9 6.8 6.6
Venlafaxine 8.6 7.8 7 <LOQ <LOQ <LOQ
Verapamil <LOQ <LOQ <LOQ <LOQ <LOQ <LOQ
Zolpidem 0.94 0.84 <LOQ <LOQ <LOQ <LOQ
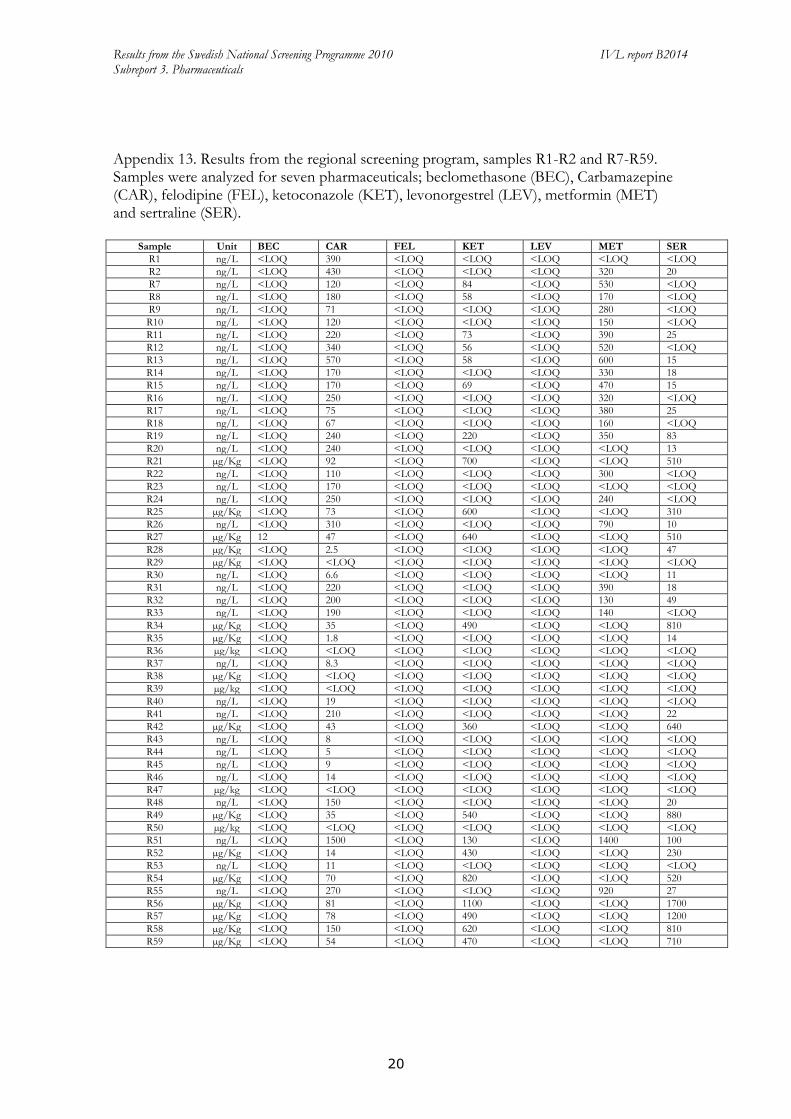
Results from the Swedish National Screening Programme 2010 IVL report B2014 Subreport 3. Pharmaceuticals
20
Appendix 13. Results from the regional screening program, samples R1-R2 and R7-R59. Samples were analyzed for seven pharmaceuticals; beclomethasone (BEC), Carbamazepine (CAR), felodipine (FEL), ketoconazole (KET), levonorgestrel (LEV), metformin (MET) and sertraline (SER).
Sample Unit BEC CAR FEL KET LEV MET SER
R1 ng/L <LOQ 390 <LOQ <LOQ <LOQ <LOQ <LOQ
R2 ng/L <LOQ 430 <LOQ <LOQ <LOQ 320 20
R7 ng/L <LOQ 120 <LOQ 84 <LOQ 530 <LOQ R8 ng/L <LOQ 180 <LOQ 58 <LOQ 170 <LOQ R9 ng/L <LOQ 71 <LOQ <LOQ <LOQ 280 <LOQ R10 ng/L <LOQ 120 <LOQ <LOQ <LOQ 150 <LOQ R11 ng/L <LOQ 220 <LOQ 73 <LOQ 390 25
R12 ng/L <LOQ 340 <LOQ 56 <LOQ 520 <LOQ
R13 ng/L <LOQ 570 <LOQ 58 <LOQ 600 15
R14 ng/L <LOQ 170 <LOQ <LOQ <LOQ 330 18
R15 ng/L <LOQ 170 <LOQ 69 <LOQ 470 15
R16 ng/L <LOQ 250 <LOQ <LOQ <LOQ 320 <LOQ
R17 ng/L <LOQ 75 <LOQ <LOQ <LOQ 380 25
R18 ng/L <LOQ 67 <LOQ <LOQ <LOQ 160 <LOQ
R19 ng/L <LOQ 240 <LOQ 220 <LOQ 350 83
R20 ng/L <LOQ 240 <LOQ <LOQ <LOQ <LOQ 13
R21 µg/Kg <LOQ 92 <LOQ 700 <LOQ <LOQ 510
R22 ng/L <LOQ 110 <LOQ <LOQ <LOQ 300 <LOQ R23 ng/L <LOQ 170 <LOQ <LOQ <LOQ <LOQ <LOQ R24 ng/L <LOQ 250 <LOQ <LOQ <LOQ 240 <LOQ R25 µg/Kg <LOQ 73 <LOQ 600 <LOQ <LOQ 310
R26 ng/L <LOQ 310 <LOQ <LOQ <LOQ 790 10
R27 µg/Kg 12 47 <LOQ 640 <LOQ <LOQ 510
R28 µg/Kg <LOQ 2.5 <LOQ <LOQ <LOQ <LOQ 47
R29 µg/Kg <LOQ <LOQ <LOQ <LOQ <LOQ <LOQ <LOQ
R30 ng/L <LOQ 6.6 <LOQ <LOQ <LOQ <LOQ 11
R31 ng/L <LOQ 220 <LOQ <LOQ <LOQ 390 18
R32 ng/L <LOQ 200 <LOQ <LOQ <LOQ 130 49
R33 ng/L <LOQ 190 <LOQ <LOQ <LOQ 140 <LOQ
R34 µg/Kg <LOQ 35 <LOQ 490 <LOQ <LOQ 810
R35 µg/Kg <LOQ 1.8 <LOQ <LOQ <LOQ <LOQ 14
R36 µg/kg <LOQ <LOQ <LOQ <LOQ <LOQ <LOQ <LOQ R37 ng/L <LOQ 8.3 <LOQ <LOQ <LOQ <LOQ <LOQ R38 µg/Kg <LOQ <LOQ <LOQ <LOQ <LOQ <LOQ <LOQ R39 µg/kg <LOQ <LOQ <LOQ <LOQ <LOQ <LOQ <LOQ R40 ng/L <LOQ 19 <LOQ <LOQ <LOQ <LOQ <LOQ R41 ng/L <LOQ 210 <LOQ <LOQ <LOQ <LOQ 22
R42 µg/Kg <LOQ 43 <LOQ 360 <LOQ <LOQ 640
R43 ng/L <LOQ 8 <LOQ <LOQ <LOQ <LOQ <LOQ R44 ng/L <LOQ 5 <LOQ <LOQ <LOQ <LOQ <LOQ R45 ng/L <LOQ 9 <LOQ <LOQ <LOQ <LOQ <LOQ R46 ng/L <LOQ 14 <LOQ <LOQ <LOQ <LOQ <LOQ R47 µg/kg <LOQ <LOQ <LOQ <LOQ <LOQ <LOQ <LOQ R48 ng/L <LOQ 150 <LOQ <LOQ <LOQ <LOQ 20
R49 µg/Kg <LOQ 35 <LOQ 540 <LOQ <LOQ 880
R50 µg/kg <LOQ <LOQ <LOQ <LOQ <LOQ <LOQ <LOQ
R51 ng/L <LOQ 1500 <LOQ 130 <LOQ 1400 100
R52 µg/Kg <LOQ 14 <LOQ 430 <LOQ <LOQ 230
R53 ng/L <LOQ 11 <LOQ <LOQ <LOQ <LOQ <LOQ
R54 µg/Kg <LOQ 70 <LOQ 820 <LOQ <LOQ 520
R55 ng/L <LOQ 270 <LOQ <LOQ <LOQ 920 27
R56 µg/Kg <LOQ 81 <LOQ 1100 <LOQ <LOQ 1700
R57 µg/Kg <LOQ 78 <LOQ 490 <LOQ <LOQ 1200
R58 µg/Kg <LOQ 150 <LOQ 620 <LOQ <LOQ 810
R59 µg/Kg <LOQ 54 <LOQ 470 <LOQ <LOQ 710

Results from the Swedish National Screening Programme 2010 IVL report B2014 Subreport 3. Pharmaceuticals
21
Appendix 14. Results from the regional screening program, samples R3-R6 and R60-R67. Samples were analyzed for 101 pharmaceuticals.
R3 R4 R5 R6 R60 R61 R62 R63 R64 R65 R66 R67
g/Kg ng/L g/Kg ng/L g/Kg g/Kg g/Kg ng/L g/Kg g/Kg g/Kg g/Kg
Name
Alfuzosin <LOQ 18 10 1.1 <LOQ <LOQ <LOQ 3.1 <LOQ <LOQ 0.1 0.2
Alprazolam <LOQ <LOQ <LOQ <LOQ <LOQ <LOQ <LOQ <LOQ <LOQ <LOQ <LOQ <LOQ
Amiodiarone <LOQ <LOQ <LOQ <LOQ <LOQ <LOQ <LOQ <LOQ <LOQ <LOQ <LOQ <LOQ
Amitryptiline <LOQ <LOQ <LOQ <LOQ <LOQ <LOQ <LOQ <LOQ <LOQ <LOQ <LOQ <LOQ
Atenolol <LOQ 460 38 19 <LOQ <LOQ <LOQ 25.1 <LOQ <LOQ <LOQ <LOQ
Atorvastatin <LOQ <LOQ <LOQ <LOQ <LOQ <LOQ <LOQ <LOQ <LOQ <LOQ <LOQ <LOQ
Atracurium <LOQ 2.6 0.8 0.8 <LOQ <LOQ <LOQ 1.5 <LOQ <LOQ <LOQ <LOQ
Azelastine <LOQ <LOQ <LOQ <LOQ <LOQ <LOQ <LOQ <LOQ <LOQ <LOQ <LOQ <LOQ
Azithromycin <LOQ <LOQ <LOQ <LOQ <LOQ <LOQ <LOQ <LOQ <LOQ <LOQ <LOQ <LOQ
Beclomethazone <LOQ <LOQ <LOQ <LOQ <LOQ <LOQ <LOQ <LOQ <LOQ <LOQ <LOQ <LOQ
Biperiden <LOQ 0.6 0.2 <LOQ <LOQ <LOQ <LOQ 1.4 <LOQ <LOQ <LOQ <LOQ
Bisoprolol <LOQ 38 4.3 0.4 <LOQ <LOQ <LOQ 3.4 <LOQ <LOQ <LOQ <LOQ
Bromocriptine <LOQ <LOQ <LOQ <LOQ <LOQ <LOQ <LOQ <LOQ <LOQ <LOQ <LOQ <LOQ
Buprenorphine <LOQ 64 100 33 <LOQ <LOQ 17 29 <LOQ <LOQ <LOQ <LOQ
Bupropion <LOQ 2.7 0.5 0.7 <LOQ <LOQ <LOQ 0.9 <LOQ <LOQ <LOQ 0.15
Carbamazepine <LOQ 290 89 7.4 <LOQ <LOQ <LOQ 39 1.0 <LOQ <LOQ <LOQ
Chlorprothixen <LOQ <LOQ <LOQ <LOQ <LOQ <LOQ <LOQ <LOQ <LOQ <LOQ <LOQ <LOQ
Chlorpromazine <LOQ <LOQ <LOQ <LOQ <LOQ <LOQ <LOQ <LOQ <LOQ <LOQ <LOQ <LOQ
Cilazapril <LOQ 2.8 2.6 <LOQ <LOQ <LOQ <LOQ <LOQ <LOQ <LOQ <LOQ <LOQ
Ciprofloxacin <LOQ <LOQ 120 <LOQ <LOQ <LOQ <LOQ <LOQ <LOQ <LOQ <LOQ <LOQ
Citalopram <LOQ 116 500 <LOQ <LOQ <LOQ <LOQ <LOQ <LOQ <LOQ <LOQ <LOQ
Clarithromycine <LOQ 1.8 <LOQ <LOQ <LOQ <LOQ <LOQ <LOQ <LOQ <LOQ <LOQ <LOQ
Clemastine <LOQ 1.8 1.0 3.4 <LOQ <LOQ <LOQ <LOQ <LOQ <LOQ <LOQ <LOQ
Clindamycin <LOQ 31 5.9 <LOQ <LOQ <LOQ <LOQ <LOQ <LOQ <LOQ <LOQ <LOQ
Clomipramine <LOQ 1.2 42 <LOQ <LOQ <LOQ <LOQ 1.4 0.64 <LOQ <LOQ <LOQ
Clonazepam <LOQ 17 19 <LOQ <LOQ <LOQ <LOQ <LOQ <LOQ <LOQ <LOQ <LOQ
Clotrimazol <LOQ 3.8 92 2.4 <LOQ <LOQ <LOQ 5.1 1.0 <LOQ <LOQ <LOQ
Codeine <LOQ 230 16 8.0 <LOQ <LOQ <LOQ 6.2 <LOQ <LOQ <LOQ <LOQ
Cyproheptadine <LOQ 11 <LOQ <LOQ <LOQ <LOQ <LOQ <LOQ <LOQ <LOQ <LOQ <LOQ
Desloratidin <LOQ 1.7 11 1.1 <LOQ <LOQ <LOQ 3.5 <LOQ <LOQ <LOQ <LOQ
Diclofenac <LOQ <LOQ 20 <LOQ <LOQ <LOQ <LOQ <LOQ <LOQ <LOQ <LOQ <LOQ
Dicycloverin <LOQ <LOQ <LOQ 6.2 <LOQ <LOQ <LOQ <LOQ <LOQ <LOQ <LOQ <LOQ
Dihydroergotamine <LOQ <LOQ <LOQ <LOQ <LOQ <LOQ <LOQ <LOQ <LOQ <LOQ <LOQ <LOQ
Diltiazem <LOQ 15.0 0.8 <LOQ <LOQ <LOQ <LOQ 0.6 <LOQ <LOQ <LOQ <LOQ
Diphenhydramine <LOQ 7.4 10 0.4 <LOQ <LOQ <LOQ 2.1 <LOQ <LOQ <LOQ <LOQ
Dipyridamole <LOQ <LOQ 4000 <LOQ <LOQ <LOQ <LOQ <LOQ <LOQ <LOQ <LOQ <LOQ
Donepezil <LOQ <LOQ <LOQ <LOQ <LOQ <LOQ <LOQ <LOQ <LOQ <LOQ <LOQ <LOQ
Duloxetine <LOQ <LOQ 15 <LOQ <LOQ <LOQ <LOQ <LOQ <LOQ <LOQ <LOQ <LOQ
Eprosartan <LOQ 17 <LOQ <LOQ <LOQ <LOQ <LOQ <LOQ <LOQ <LOQ <LOQ <LOQ
Erythromycin <LOQ <LOQ 550 <LOQ <LOQ <LOQ <LOQ <LOQ <LOQ <LOQ <LOQ <LOQ
Estradiol <LOQ <LOQ <LOQ <LOQ <LOQ <LOQ <LOQ <LOQ <LOQ <LOQ <LOQ <LOQ
Ethinyl estradiol <LOQ <LOQ <LOQ <LOQ <LOQ <LOQ <LOQ <LOQ <LOQ <LOQ <LOQ <LOQ
Etonogestrel <LOQ <LOQ <LOQ <LOQ <LOQ <LOQ <LOQ <LOQ <LOQ <LOQ <LOQ <LOQ
Ezetimibe <LOQ <LOQ <LOQ <LOQ <LOQ <LOQ <LOQ <LOQ <LOQ <LOQ <LOQ <LOQ
Felodipine <LOQ <LOQ <LOQ <LOQ <LOQ <LOQ <LOQ <LOQ <LOQ <LOQ <LOQ <LOQ
Fentanyl <LOQ 0.8 <LOQ <LOQ <LOQ <LOQ <LOQ 1.0 <LOQ <LOQ <LOQ <LOQ
Fexofenadine <LOQ 11 43 <LOQ <LOQ <LOQ <LOQ 9.5 <LOQ <LOQ <LOQ <LOQ
Finasteride <LOQ <LOQ <LOQ <LOQ <LOQ <LOQ <LOQ <LOQ <LOQ <LOQ <LOQ <LOQ
Flecainide <LOQ 19 6.1 0.2 <LOQ <LOQ <LOQ 2.7 <LOQ <LOQ 0.1 <LOQ
Fluconazole 0.9 55 2.6 3.9 <LOQ <LOQ <LOQ 6.4 <LOQ <LOQ <LOQ <LOQ
Flunitrazepam <LOQ <LOQ <LOQ <LOQ <LOQ <LOQ <LOQ <LOQ <LOQ <LOQ <LOQ <LOQ
Fluoxetine <LOQ <LOQ 55 <LOQ <LOQ <LOQ <LOQ <LOQ <LOQ <LOQ <LOQ <LOQ
Flupentixol <LOQ 6.8 <LOQ <LOQ <LOQ <LOQ <LOQ 6.3 <LOQ <LOQ <LOQ <LOQ
Fluphenazine <LOQ <LOQ <LOQ <LOQ <LOQ <LOQ <LOQ <LOQ <LOQ <LOQ <LOQ <LOQ
Flutamide <LOQ <LOQ <LOQ <LOQ <LOQ <LOQ <LOQ <LOQ <LOQ <LOQ <LOQ <LOQ
Glibenclamide <LOQ <LOQ <LOQ 14.6 <LOQ <LOQ <LOQ <LOQ <LOQ <LOQ <LOQ <LOQ
Glimepiride <LOQ 10.2 <LOQ <LOQ <LOQ <LOQ <LOQ <LOQ <LOQ <LOQ <LOQ <LOQ

Results from the Swedish National Screening Programme 2010 IVL report B2014 Subreport 3. Pharmaceuticals
22
R3 R4 R5 R6 R60 R61 R62 R63 R64 R65 R66 R67
g/Kg ng/L g/Kg ng/L g/Kg g/Kg g/Kg ng/L g/Kg g/Kg g/Kg g/Kg
Name
Haloperidol 0.13 1.5 4.4 1.5 0.16 <LOQ 0.16 0.4 0.15 <LOQ 0.13 0.52
Hydroxyzine <LOQ 9.9 22 19 <LOQ <LOQ <LOQ 12 2. 9 <LOQ <LOQ <LOQ
Ibuprofen <LOQ 39.1 <LOQ 47.4 <LOQ <LOQ <LOQ 41.9 <LOQ <LOQ <LOQ <LOQ
Irbesartan <LOQ 19 8.7 3.9 <LOQ <LOQ <LOQ 12 0.66 <LOQ <LOQ <LOQ
Ketoconazole <LOQ <LOQ 550 <LOQ <LOQ <LOQ <LOQ <LOQ <LOQ <LOQ <LOQ <LOQ
Ketoprofene <LOQ 184.1 <LOQ <LOQ <LOQ <LOQ <LOQ 11.2 <LOQ <LOQ <LOQ <LOQ
Levomepromazine <LOQ <LOQ <LOQ <LOQ <LOQ <LOQ <LOQ <LOQ <LOQ <LOQ <LOQ <LOQ
Levonorgestrel <LOQ <LOQ <LOQ <LOQ <LOQ <LOQ <LOQ <LOQ <LOQ <LOQ <LOQ <LOQ
Loperamide <LOQ 0.8 5.5 <LOQ <LOQ <LOQ <LOQ 1.5 <LOQ <LOQ <LOQ <LOQ
Maprotiline <LOQ <LOQ <LOQ <LOQ <LOQ <LOQ <LOQ <LOQ <LOQ <LOQ <LOQ <LOQ
Meclozine <LOQ <LOQ 16 <LOQ <LOQ <LOQ <LOQ <LOQ <LOQ <LOQ <LOQ <LOQ
Memantine <LOQ 11 2.9 1.6 <LOQ <LOQ <LOQ 1.4 1.1 0.65 <LOQ <LOQ
Metformin <LOQ 230 <LOQ <LOQ <LOQ <LOQ <LOQ <LOQ <LOQ <LOQ <LOQ <LOQ
Metoprolol <LOQ 1400 130 85 <LOQ <LOQ <LOQ 90 <LOQ <LOQ <LOQ <LOQ
Mianserin <LOQ 4.1 32 3.1 <LOQ <LOQ <LOQ 2.6 <LOQ <LOQ <LOQ <LOQ
Miconazole <LOQ <LOQ 170 <LOQ <LOQ <LOQ <LOQ <LOQ <LOQ <LOQ <LOQ <LOQ
Mirtazapine <LOQ 35 47 <LOQ <LOQ <LOQ <LOQ <LOQ <LOQ <LOQ <LOQ <LOQ
Naproxen <LOQ 236.5 <LOQ 21.8 <LOQ <LOQ <LOQ 49 <LOQ <LOQ <LOQ <LOQ
Nefazodone <LOQ 2.9 0.9 2.8 <LOQ <LOQ <LOQ 5.9 <LOQ <LOQ <LOQ <LOQ
Norfloxacin <LOQ <LOQ 19 <LOQ <LOQ <LOQ <LOQ <LOQ <LOQ <LOQ <LOQ <LOQ
Ofloxacin <LOQ <LOQ <LOQ <LOQ <LOQ <LOQ <LOQ <LOQ <LOQ <LOQ <LOQ <LOQ
Orphenadrine <LOQ 4.6 13 0.9 <LOQ <LOQ <LOQ 0.5 0.32 <LOQ <LOQ <LOQ
Oxazepam <LOQ 140 14 <LOQ <LOQ <LOQ <LOQ 39 6.7 <LOQ <LOQ <LOQ
Paracetamol <LOQ 320 15 22 <LOQ <LOQ <LOQ 90 <LOQ <LOQ <LOQ <LOQ
Paroxetine <LOQ <LOQ 26 <LOQ <LOQ <LOQ <LOQ 30 <LOQ <LOQ <LOQ <LOQ
Perphenazine <LOQ 12 <LOQ 19.5 <LOQ <LOQ <LOQ <LOQ <LOQ <LOQ <LOQ <LOQ
Pizotifen <LOQ <LOQ 0.9 <LOQ <LOQ <LOQ 0.89 2.5 0. 7 <LOQ <LOQ <LOQ
Promethazine <LOQ <LOQ 47 <LOQ <LOQ <LOQ <LOQ <LOQ <LOQ <LOQ <LOQ <LOQ
Ranitidine <LOQ <LOQ <LOQ <LOQ <LOQ <LOQ <LOQ <LOQ <LOQ <LOQ <LOQ <LOQ
Repaglinide <LOQ 1.0 0.8 1.6 <LOQ <LOQ <LOQ 0.7 <LOQ <LOQ <LOQ <LOQ
Risperidone 0.12 5.0 0.7 8.6 <LOQ <LOQ <LOQ 12 <LOQ <LOQ 0.22 0.13
Rosuvastatin <LOQ <LOQ <LOQ <LOQ <LOQ <LOQ <LOQ 10.2 <LOQ <LOQ <LOQ <LOQ
Roxithromycin <LOQ <LOQ <LOQ <LOQ <LOQ <LOQ <LOQ <LOQ <LOQ <LOQ <LOQ <LOQ
Sertraline <LOQ <LOQ 320 <LOQ <LOQ <LOQ <LOQ <LOQ <LOQ <LOQ <LOQ <LOQ
Sulfamethoxazole <LOQ 100 <LOQ 17 <LOQ <LOQ <LOQ 44 <LOQ <LOQ <LOQ <LOQ
Tamoxifen <LOQ <LOQ 7.0 11 <LOQ <LOQ <LOQ 6.0 <LOQ <LOQ <LOQ <LOQ
Telmisartan <LOQ <LOQ <LOQ <LOQ <LOQ <LOQ <LOQ <LOQ <LOQ <LOQ <LOQ <LOQ
Tetracycline <LOQ <LOQ <LOQ <LOQ <LOQ <LOQ <LOQ <LOQ <LOQ <LOQ <LOQ <LOQ
Tramadol <LOQ 300 <LOQ <LOQ <LOQ <LOQ <LOQ <LOQ <LOQ <LOQ <LOQ <LOQ
Trihexyphenidyl <LOQ 0.4 9.0 <LOQ <LOQ <LOQ 0.15 2.1 0.14 <LOQ <LOQ <LOQ
Trimethoprim <LOQ 50 1.6 8.4 <LOQ <LOQ <LOQ 5.0 <LOQ <LOQ <LOQ <LOQ
Venlafaxine <LOQ 170 150 17 <LOQ <LOQ <LOQ 47 <LOQ <LOQ <LOQ <LOQ
Verapamil <LOQ <LOQ <LOQ <LOQ <LOQ <LOQ <LOQ <LOQ <LOQ <LOQ <LOQ <LOQ
Zolpidem <LOQ 2.3 3.2 <LOQ <LOQ <LOQ <LOQ <LOQ <LOQ <LOQ <LOQ <LOQ