results and discussion - inflibnetshodhganga.inflibnet.ac.in/bitstream/10603/29464/9/09... ·...
TRANSCRIPT

Results and Discussion
A. Fungal Diversity During Different Seasons
1. Summer season
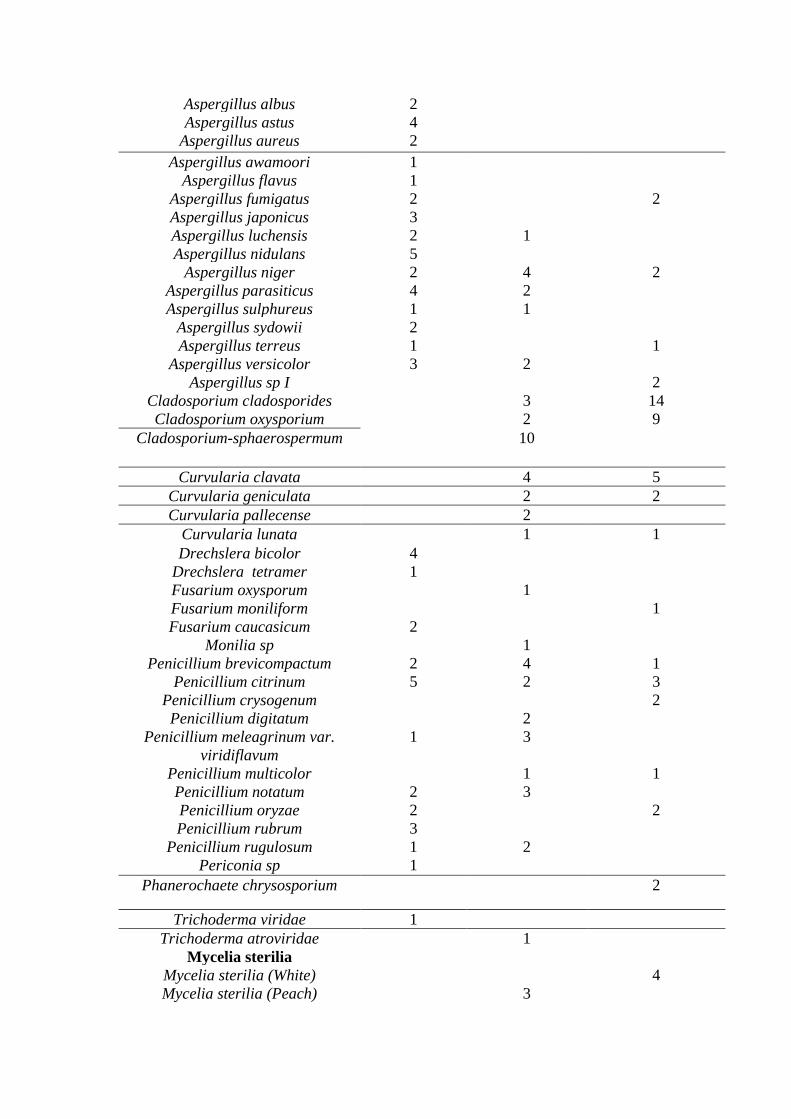
A total of 54 species belonging to 16 genera and two sterile mycelia were isolated.
Among them Deuteromycotina fungi dominated over the member of Ascomycotina and
Zygomycotina. Out of total isolates 4 species (3 genera) belong to Zygomycotina, 2 species
(2 genera) belong to Ascomycotina and 48 species (12 genera) belong to Deuteromycotina.
(Table-1).
In the cave Aspergillus taxa were found dominant. The genus Aspergillus were
represented by 16 species, Penicillium was represented by 10 species, Curvularia by 4
species, Fusarium and Cladosporium by 3 species, Alternaria, Dreshclera, Rhizopus,
Trichoderma by 2 species and Periconia, Monilia, Mucor, Choanephora cucurbatarum,
Emericella nidulans, Phanerochaete chrysosporium, Talaromyces flavus represented by one
species.
From different sources maximum diversity was found from guano deposits (29
species from 65 colonies) followed by leaf litter deposits (25 species from 62 colonies) and
logs and twigs deposits (22 species from 61 colonies).
Table – 1: Fungal isolates from different sources (summer season).
Name Of Fungi Guano
deposits
Leaf litter
deposits
Log and twig
deposits
Zygomycotina Colony
number
Colony
number
Colony number
Choanephora Cucurbitarum 1
Mucor hemalis 2
Rhizopus oryzae 1
Rhizopus stolonifer 1
Ascomycotina
Emericella nidulans 1 1
Talaromyces flavus 2
Deuteromycotina
Alternaria alternata 2 1 4
Alternaria crassa 1
Aspergillus albus 2
Aspergillus astus 4
Aspergillus aureus 2
Aspergillus awamoori 1
Aspergillus flavus 1
Aspergillus fumigatus 2 2
Aspergillus japonicus 3
Aspergillus luchensis 2 1
Aspergillus nidulans 5
Aspergillus niger 2 4 2
Aspergillus parasiticus 4 2
Aspergillus sulphureus 1 1
Aspergillus sydowii 2
Aspergillus terreus 1 1
Aspergillus versicolor 3 2
Aspergillus sp I 2
Cladosporium cladosporides 3 14
Cladosporium oxysporium 2 9
Cladosporium-sphaerospermum 10
Curvularia clavata 4 5
Curvularia geniculata 2 2
Curvularia pallecense 2
Curvularia lunata 1 1
Drechslera bicolor 4
Drechslera tetramer 1
Fusarium oxysporum 1
Fusarium moniliform 1
Fusarium caucasicum 2
Monilia sp 1
Penicillium brevicompactum 2 4 1
Penicillium citrinum 5 2 3
Penicillium crysogenum 2
Penicillium digitatum 2
Penicillium meleagrinum var.
viridiflavum
1 3
Penicillium multicolor 1 1
Penicillium notatum 2 3
Penicillium oryzae 2 2
Penicillium rubrum 3
Penicillium rugulosum 1 2
Periconia sp 1
Phanerochaete chrysosporium 2
Trichoderma viridae 1
Trichoderma atroviridae 1
Mycelia sterilia
Mycelia sterilia (White) 4
Mycelia sterilia (Peach) 3

Fig- 1: Species count in summer season.
Fig – 2: Dominant fungal groups in summer season.
Fig – 3: Colony count in summer season.
2. Post rainy season
0
5
10
15
20
25
30
Guano Deposit
Leaf Litter
deposit
log and twig
deposits Sp
ecie
s co
un
t in
su
mm
er
seaso
n
Sample name
species count
7%
3%
86%
4%
Dominant fungal groups in summer season
Zygomycotina Ascomycotina
Deuteromycotina Mycelia sterilia
38%
33%
29%
Colony count of fungi in summer season
Guano Deposit Leaf Litter deposit log and twig deposits
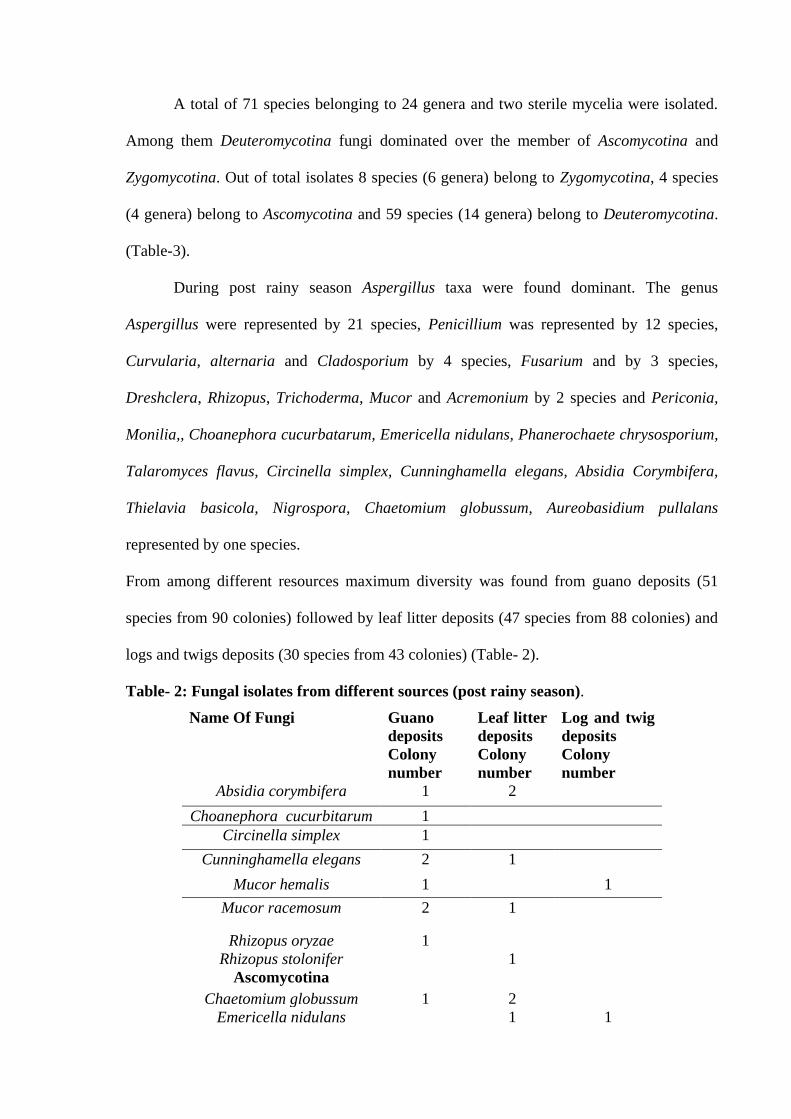
A total of 71 species belonging to 24 genera and two sterile mycelia were isolated.
Among them Deuteromycotina fungi dominated over the member of Ascomycotina and
Zygomycotina. Out of total isolates 8 species (6 genera) belong to Zygomycotina, 4 species
(4 genera) belong to Ascomycotina and 59 species (14 genera) belong to Deuteromycotina.
(Table-3).
During post rainy season Aspergillus taxa were found dominant. The genus
Aspergillus were represented by 21 species, Penicillium was represented by 12 species,
Curvularia, alternaria and Cladosporium by 4 species, Fusarium and by 3 species,
Dreshclera, Rhizopus, Trichoderma, Mucor and Acremonium by 2 species and Periconia,
Monilia,, Choanephora cucurbatarum, Emericella nidulans, Phanerochaete chrysosporium,
Talaromyces flavus, Circinella simplex, Cunninghamella elegans, Absidia Corymbifera,
Thielavia basicola, Nigrospora, Chaetomium globussum, Aureobasidium pullalans
represented by one species.
From among different resources maximum diversity was found from guano deposits (51
species from 90 colonies) followed by leaf litter deposits (47 species from 88 colonies) and
logs and twigs deposits (30 species from 43 colonies) (Table- 2).
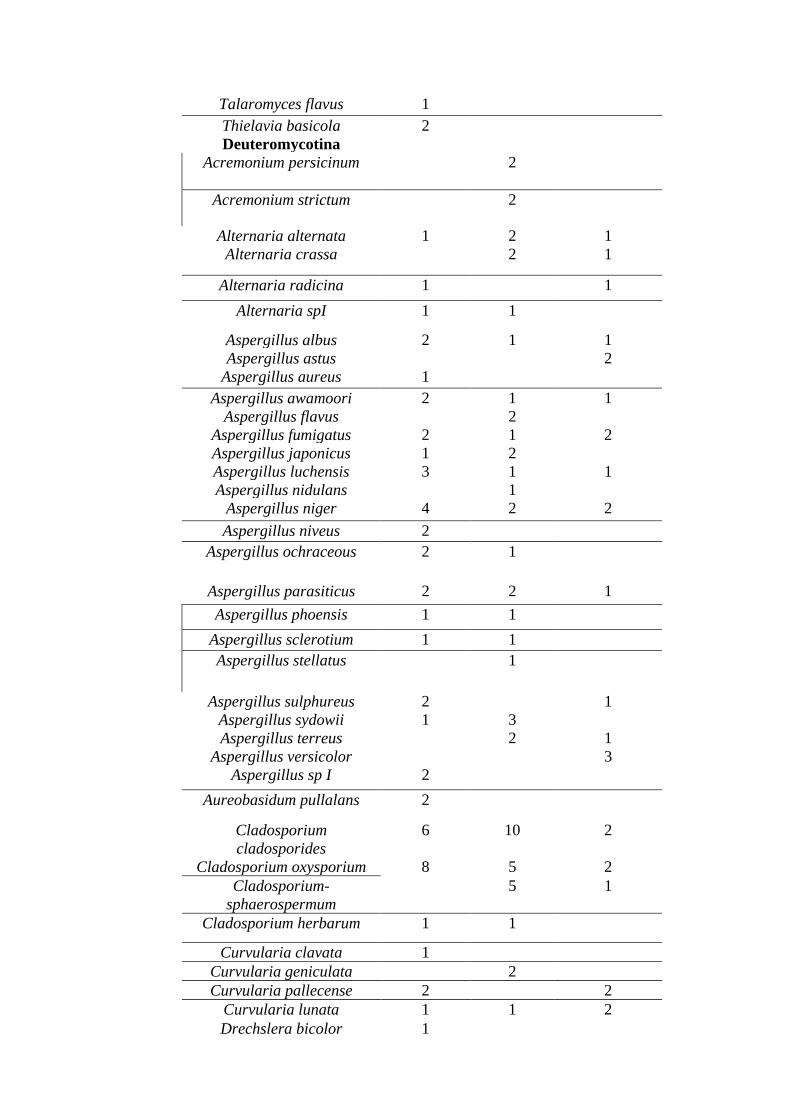
Table- 2: Fungal isolates from different sources (post rainy season).
Name Of Fungi Guano
deposits
Leaf litter
deposits
Log and twig
deposits
Colony
number
Colony
number
Colony
number
Absidia corymbifera 1 2
Choanephora cucurbitarum 1
Circinella simplex 1
Cunninghamella elegans 2 1
Mucor hemalis 1 1
Mucor racemosum 2 1
Rhizopus oryzae 1
Rhizopus stolonifer 1
Ascomycotina
Chaetomium globussum 1 2
Emericella nidulans 1 1
Talaromyces flavus 1
Thielavia basicola 2
Deuteromycotina
Acremonium persicinum
2
Acremonium strictum 2
Alternaria alternata 1 2 1
Alternaria crassa 2 1
Alternaria radicina 1 1
Alternaria spI 1 1
Aspergillus albus 2 1 1
Aspergillus astus 2
Aspergillus aureus 1
Aspergillus awamoori 2 1 1
Aspergillus flavus 2
Aspergillus fumigatus 2 1 2
Aspergillus japonicus 1 2
Aspergillus luchensis 3 1 1
Aspergillus nidulans 1
Aspergillus niger 4 2 2
Aspergillus niveus 2
Aspergillus ochraceous 2 1
Aspergillus parasiticus 2 2 1
Aspergillus phoensis 1 1
Aspergillus sclerotium 1 1
Aspergillus stellatus 1
Aspergillus sulphureus 2 1
Aspergillus sydowii 1 3
Aspergillus terreus 2 1
Aspergillus versicolor 3
Aspergillus sp I 2
Aureobasidum pullalans 2
Cladosporium
cladosporides
6 10 2
Cladosporium oxysporium 8 5 2
Cladosporium-
sphaerospermum
5 1
Cladosporium herbarum 1 1
Curvularia clavata 1
Curvularia geniculata 2
Curvularia pallecense 2 2
Curvularia lunata 1 1 2
Drechslera bicolor 1

Fig- 4: Species count in post rainy season.
0
10
20
30
40
50
60
Guano Deposit Leaf Litter deposit
log and twig deposits
Sp
ecie
s co
un
t in
Po
st r
ain
y
seaso
n
Sample name
Drechslera tetramer 1
Fusarium oxysporum 1
Fusarium moniliform 1 1
Fusarium caucasicum 1
Monilia sp 1 1 1
Nigrospora oryzae 2
Penicillium brevicompactum 2 2 2
Penicillium citrinum 3 4 1
Penicillium crysogenum 2
Penicillium digitatum 2
Penicillium meleagrinum
var. viridiflavum
3 1 2
Penicillium multicolor 2 1
Penicillium notatum 1
Penicillium oryzae 2
Penicillium oxalicum 2
Penicillium purpogenum 1
Penicillium rubrum 2 2
Penicillium rugulosum 2
Periconia sp 1
Phanerochaete
chrysosporium
2 3
Trichoderma viridae 1 2
Trichoderma atroviridae 1 1
Mycelia sterilia
Mycelia sterilia (White) 2 1
Mycelia sterilia (Orange) 1

Fig- 5: Dominant fungal groups in post rainy season.
Fig – 6: Colony count of fungi in post rainy season.
3. Winter season
A total of 59 species belonging to 21 genera and four sterile mycelia were isolated.
Among them Deuteromycotina fungi dominated over the member of Ascomycotina and
Zygomycotina. Out of total isolates 4 species (4 genera) belong to Zygomycotina, 4 species
(4 genera) belong to Ascomycotina and 51 species (13 genera) belong to Deuteromycotina.
(Table- 2).
During post rainy season Aspergillus taxa were found dominant. The genus Aspergillus
were represented by 17 species, Penicillium was represented by 12 species, Curvularia by 4
species, Alternaria and Fusarium by 3 species, Cladosporium, Acremonium and
11% 5%
81%
3%
Dominant fungal groups in post rainy
season Zygomycotina Ascomycotina Deuteromycotina Mycelia sterilia
43%
37%
20%
Colony count of fungi in post rainy
season Guano Deposit Leaf Litter deposit log and twig deposits

Trichoderma by 2 species, Dreshclera, Rhizopus, Trichoderma, Mucor and Acremonium by
2 species and Monilia, Emericella nidulans, Phanerochaete chrysosporium, Talaromyces
flavus, Circinella simplex, Cunninghamella elegans, Absidia Corymbifera, Thielavia
basicola, Nigrospora, Chaetomium globussum and Aureobasidium pullalans represented by
one species.
From among different resources maximum diversity was found from guano deposits (46
species from 81colonies) followed by leaf litter deposits (40 species from 91 colonies) and
logs and twigs deposits (21 species from 31 colonies) (Table – 3).
Table-3: Fungal isolates from different sources (winter season).
Name Of Fungi Guano
deposits
Leaf Litter
deposits
Log and twig
deposits
Zygomycotina Colony
number
Colony
number
Colony
number
Absidia corymbifera 1 `
Circinella simplex 2 1
Cunninghamella elegans 1
Mucor hemalis 1 2
Ascomycotina
Chaetomium globussum 1
Emericella nidulans 2 2
Talaromyces flavus 1
Thielavia basicola 1
Deuteromycotina
Acremonium persicinum 1
Acremonium strictum 1 1
Alternaria alternata 1 2 2
Alternaria crassa 2 1 1
Alternaria radicina 2
Aspergillus albus 1 1
Aspergillus astus 2
Aspergillus aureus 2 1
Aspergillus awamoori 2 2 1
Aspergillus flavus 1
Aspergillus fumigatus 2 3 2
Aspergillus japonicus 1 1
Aspergillus luchensis 2 2 1
Aspergillus nidulans 2
Aspergillus niger 1 3 1

Aspergillus ochraceous 1 1
Aspergillus phoensis 2 2
Aspergillus sclerotium 1
Aspergillus stellatus 2
Aspergillus sulphureus 1 1 1
Aspergillus terreus 1
Aspergillus versicolor 1
Aureobasidum pullalans 1
Cladosporium oxysporium 5 5
Cladosporium herbarum 10 5
Curvularia clavata 3 2
Curvularia geniculata 3
Curvularia pallecense 1 2 1
Curvularia lunata 2 2
Drechslera bicolor 1 2
Drechslera tetramer 1 4
Fusarium oxysporum 1 2
Fusarium moniliform 2 1
Fusarium caucasicum 1 2
Monilia sp 3
Nigrospora oryzae 1
Penicillium brevicompactum 1
Penicillium citrinum 2 2 1
Penicillium crysogenum 3 2
Penicillium digitatum 2
Penicillium meleagrinum var.
viridiflavum
3 4 3
Penicillium multicolor 2 2 1
Penicillium notatum 2
Penicillium oryzae 1 3
Penicillium oxalicum 1 1
Penicillium purpogenum 1
Penicillium rubrum 2 1
Penicillium rugulosum 1 1
Phanerochaete chrysosporium 2
Trichoderma viridae 2 1 2
Trichoderma atroviridae 3 2
Mycelia sterilia
Mycelia sterilia (White) 2
Mycelia sterilia (Orange) 2
Mycelia sterilia (Peach)
1
Mycelia sterilia (Dull White) 2

Fig – 7: Species count in winter season.
Fig – 8: Dominant fungal groups in winter season .
Fig- 9: Colony count in winter season.
Percentage Frequency
0
10
20
30
40
50
Guano Deposit Leaf Litter
deposit log and twig deposits S
pec
ies
cou
nt
in w
inte
r se
aso
n
Sample name
7% 6%
81%
6%
Dominant fungal groups in Winter
Season
Zygomycotina Ascomycotina
Deuteromycotina Mycelia sterilia
40%
45%
15%
Colony count of fungi in winter
season
Guano Deposit Leaf Litter deposit log and twig deposits

During study maximum percentage frequency was shown by Alternaria alternata,
Aspergillus niger and penicillium citrinum (100%) followed by Penicillium meleagrinum
var. viridiflavum and Aspergillus fumigatus (90%), Penicillium brevicompactum,
Curvularia lunata, Cladosporium oxysporium, Aspergillus awamoori, Aspergillus
sulphureus (78%), Alternaria crassa, Emercilla nidulans (66%), Emericella nidulans and
Penicillium rugulosum (66%) Curvularia clavata, Cladosporium cladosporides, Aspergillus
parasiticus and penicillium rugulosum (57%). Rest fungal species had shown below 50% of
frequency.
Fig – 10: Percentage frequency of fungal species in all three seasons.
Percentage Density
During study maximum percentage density had shown by Cladosporium oxysporium
(5.88%) ,Cladosporium cladosporides (5.71%), penicillium citrinum (3.75%), Aspergillus
niger (3.43%), Penicillium meleagrinum var. viridiflavum (3.26%), Alternaria alternata and
Aspergillus fumigatus (2.61%), Curvularia clavata (2.45%), Penicillium brevicompactum
(2.28%), Aspergillus awamoori and Aspergillus parasiticus (1.79%), Curvularia lunata
0%
20%
40%
60%
80%
100%
120%
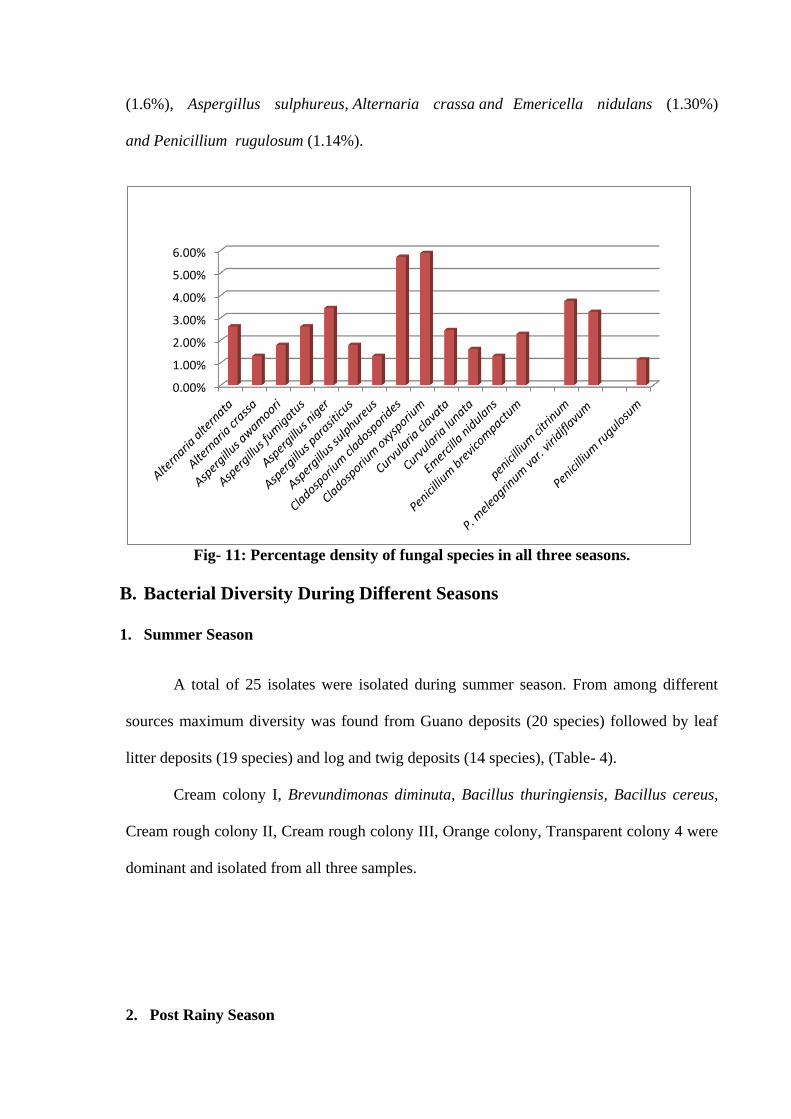
(1.6%), Aspergillus sulphureus, Alternaria crassa and Emericella nidulans (1.30%)
and Penicillium rugulosum (1.14%).
Fig- 11: Percentage density of fungal species in all three seasons.
B. Bacterial Diversity During Different Seasons
1. Summer Season
A total of 25 isolates were isolated during summer season. From among different
sources maximum diversity was found from Guano deposits (20 species) followed by leaf
litter deposits (19 species) and log and twig deposits (14 species), (Table- 4).
Cream colony I, Brevundimonas diminuta, Bacillus thuringiensis, Bacillus cereus,
Cream rough colony II, Cream rough colony III, Orange colony, Transparent colony 4 were
dominant and isolated from all three samples.
2. Post Rainy Season
0.00%
1.00%
2.00%
3.00%
4.00%
5.00%
6.00%

A total of 32 isolates were isolated during post rainy season. From among different
sources maximum diversity was found from Guano deposits (25 species) followed by leaf
litter deposits (23species) and log and twig deposits (19 species), (Table- 4).
Cream colony I, Brevundimonas diminuta, Bacillus thuringiensis, Bacillus cereus,
Transparent colony II, Whitish cream colony, Creamish yellow colony II, Lemon yellow
colony I and Transparent colony 4 were dominant and isolated from all three samples.
3. Winter Season
A total of 28 isolates were isolated during post rainy season. From among different
source maximum diversity was found from Guano deposits (22 species) followed by leaf
litter deposits (21species) and log and twig deposits (13 species), (Table- 4).
Cream colony I, Brevundimonas diminuta, Bacillus thuringiensis, Bacillus cereus,
Transparent colony 4, Light yellow colony II, White colony III, Yellowish rough colony
were dominant and isolated from all three samples.
Table- 4: Bacterial isolates from different sources in different seasons
Isolated
Bacteria
Summer season Post rainy season Winter season
Number of colony
Number of colony
Number of
colony
Guano
deposits
Leaf
litter
deposits
Log and
twig
deposits
Guano
deposits
Leaf
litter
deposits
Log and
twig
deposits
Guano
deposits
Leaf
litter
deposits
Log and
twig
deposits
Bacillius
cereus
++ + ++ ++ ++ + ++ +
Bacillus
thuringiensis
++ +++ ++ ++++
Brevundimona
s diminuta
++++ ++ + + +++ + ++ ++ ++
Brown smooth + ++ + +

colony
Cream colony
4
+ +
Cream colony
I
++ ++ ++ +++ + + + ++ +
Cream colony
II +++ + ++ + +
Cream colony
III
+ +++ ++
Cream rough
colony I
++ + +++ +
Cream rough
colony II
+ + + ++ + ++
Cream rough
colony III
++ + ++ +++ ++ ++ +
Creamish
yellow colony
+ ++ + ++++ +++ +
Creamish
yellow colony
II
+ + ++ ++
Lemon yellow
colony I
++ ++++ + ++ + +
Lemon yellow
colony II
++ + ++ + + +
Light pink
colony
+ +
Light yellow
colony I
+ +
Light yellow
type II
+++ + + ++ + +
Milky white
colony
++ ++ ++
Orange colony + + + ++ ++
Pink colony + + +
Transparent
colony 4
+ ++ + + + + + + +
Transparent
colony I
++ ++ + +
Transparent
colony II
++ +++ ++ ++ + ++ +
Transparent
colony III
+ ++ ++ +
White colony I ++ + + +
White colony
II
++ +++ ++ ++
White colony
III
++ + ++ ++ +
White rough
colony
+ + ++ +
Whitish cream
colony
++ ++ + + ++ ++ +
Yellowish
rough colony
++ ++ ++ + + ++ +
Yellowish
smooth colony
+ + + ++ + + +
+ = poor, ++ = moderate, +++ = good, ++++ = excellent.
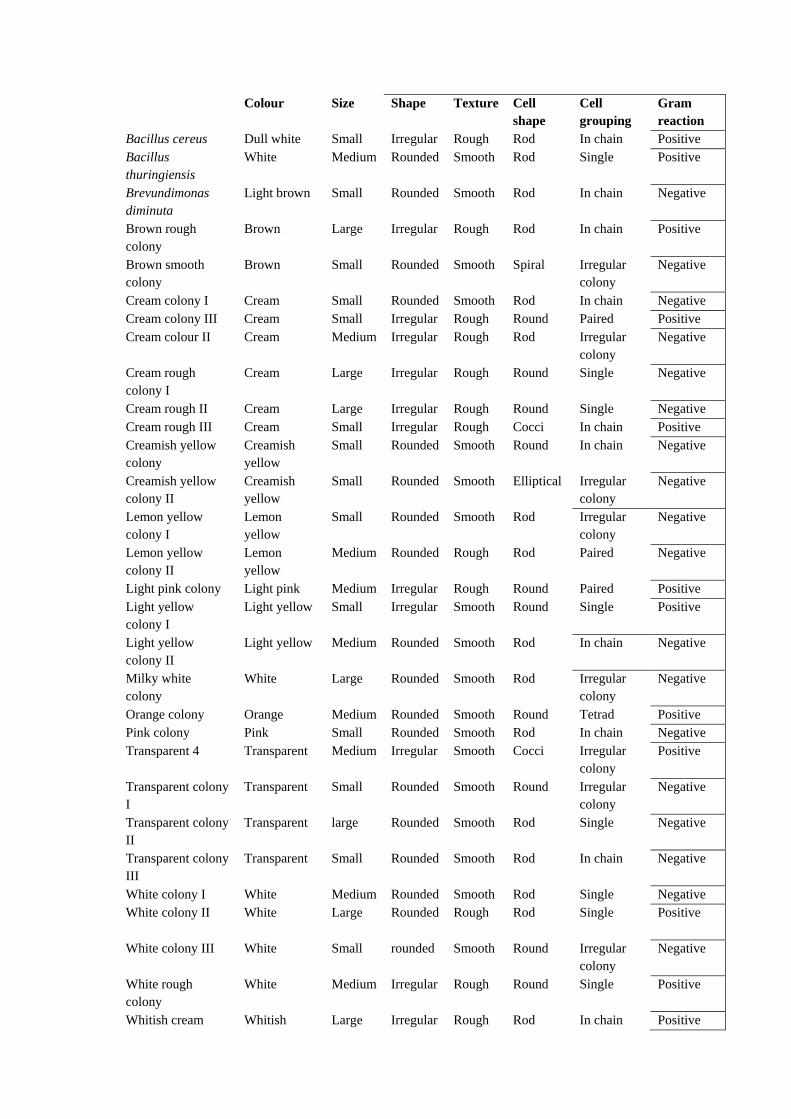
Table – 5: Colony morphology and cell morphology of isolated bacteria Isolated bacteria Colony morphology Cell morphology
Colour Size Shape Texture Cell
shape
Cell
grouping
Gram
reaction
Bacillus cereus Dull white Small Irregular Rough Rod In chain Positive
Bacillus
thuringiensis
White Medium Rounded Smooth Rod Single Positive
Brevundimonas
diminuta
Light brown Small Rounded Smooth Rod In chain Negative
Brown rough
colony
Brown Large Irregular Rough Rod In chain Positive
Brown smooth
colony
Brown Small Rounded Smooth Spiral Irregular
colony
Negative
Cream colony I Cream Small Rounded Smooth Rod In chain Negative
Cream colony III Cream Small Irregular Rough Round Paired Positive
Cream colour II Cream Medium Irregular Rough Rod Irregular
colony
Negative
Cream rough
colony I
Cream Large Irregular Rough Round Single Negative
Cream rough II Cream Large Irregular Rough Round Single Negative
Cream rough III Cream Small Irregular Rough Cocci In chain Positive
Creamish yellow
colony
Creamish
yellow
Small Rounded Smooth Round In chain Negative
Creamish yellow
colony II
Creamish
yellow
Small Rounded Smooth Elliptical Irregular
colony
Negative
Lemon yellow
colony I
Lemon
yellow
Small Rounded Smooth Rod Irregular
colony
Negative
Lemon yellow
colony II
Lemon
yellow
Medium Rounded Rough Rod Paired Negative
Light pink colony Light pink Medium Irregular Rough Round Paired Positive
Light yellow
colony I
Light yellow Small Irregular Smooth Round Single Positive
Light yellow
colony II
Light yellow Medium Rounded Smooth Rod In chain Negative
Milky white
colony
White Large Rounded Smooth Rod Irregular
colony
Negative
Orange colony Orange Medium Rounded Smooth Round Tetrad Positive
Pink colony Pink Small Rounded Smooth Rod In chain Negative
Transparent 4 Transparent Medium Irregular Smooth Cocci Irregular
colony
Positive
Transparent colony
I
Transparent Small Rounded Smooth Round Irregular
colony
Negative
Transparent colony
II
Transparent large Rounded Smooth Rod Single Negative
Transparent colony
III
Transparent Small Rounded Smooth Rod In chain Negative
White colony I White Medium Rounded Smooth Rod Single Negative
White colony II White Large Rounded Rough Rod Single Positive
White colony III White Small rounded Smooth Round Irregular
colony
Negative
White rough
colony
White Medium Irregular Rough Round Single Positive
Whitish cream Whitish Large Irregular Rough Rod In chain Positive

colony yellow
Yellowish rough
colony
Yellowish Medium Rounded Rough Round Single Positive
Yellowish smooth
colony
Yellowish Small Rounded Smooth Round In chain Negative
Fig-12: Species count in summer season from different sources.
Fig-13: Species count in post rainy season from different sources.
0
5
10
15
20
25
Guano deposits
leaf litter deposits
Log and twig deposits Sp
eci
es
Co
un
t In
Su
mm
er
Seas
on
Sample Name
0
5
10
15
20
25
30
Guano deposits leaf litter deposits
Log and twig deposits
Sp
ecie
s co
un
t in
po
st r
ain
y
seaso
n
Sample Name

Fig-14: Species count in winter season from different sources.
Fig-15: Percentage occurrence of gram negative and positive bacteria.
Percentage Frequency
During study maximum percentage frequency was shown by Bacillus cereus,
Bacillus thuringiensis, Brevundimonas diminuta, Cream colony I and Transparent colony 4
(100%) followed by Yellowish rough colony, Yellowish smooth colony, Whitish cream
colony, Transparent colony II and Cream rough colony III (78%), Cemon yellow colony I,
Lemon Yellow colony II, Light yellow colony II, Cream rough colony II and Creamish
yellow colony (66%). Result Bacterial species had shown below than 50% of frequency.
0
5
10
15
20
25
Guano deposits leaf litter deposits Log and twig deposits
Sp
ecie
s co
un
t in
win
ter
seaso
n
Sample name
59%
41%
Percentage occurence of gram
negative and positive bacteria
Gram negative bacteria Gram positive bacteria
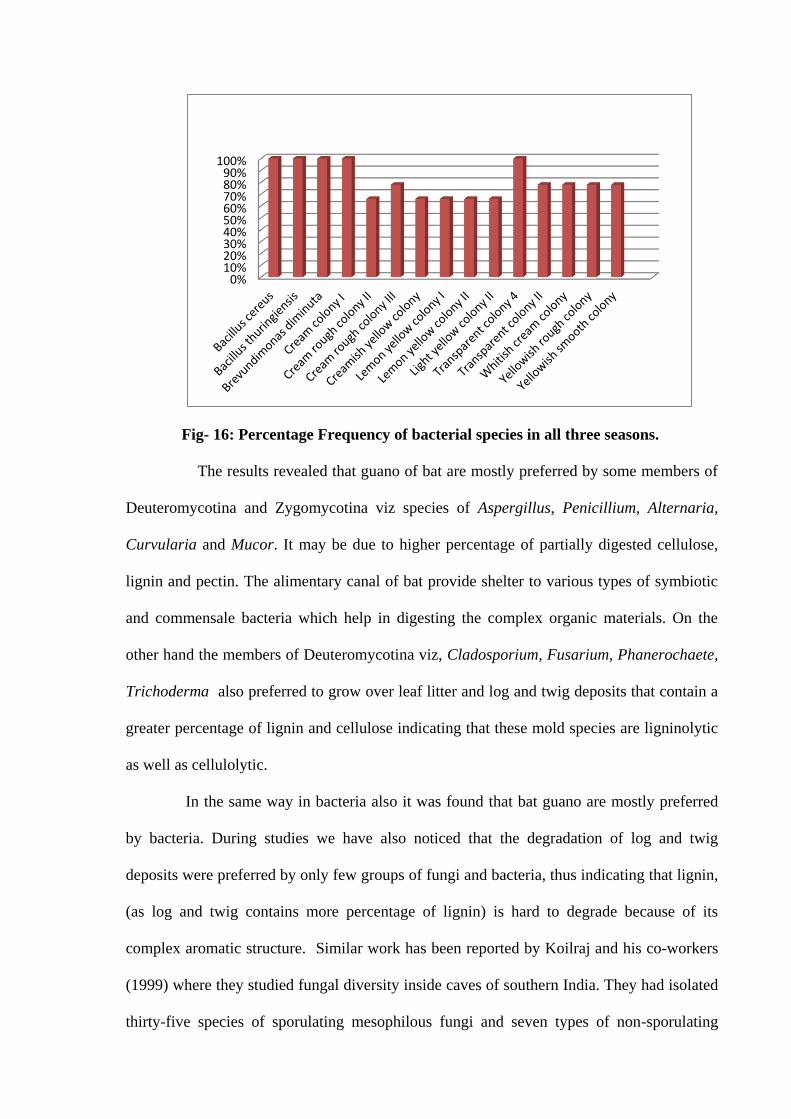
Fig- 16: Percentage Frequency of bacterial species in all three seasons.
The results revealed that guano of bat are mostly preferred by some members of
Deuteromycotina and Zygomycotina viz species of Aspergillus, Penicillium, Alternaria,
Curvularia and Mucor. It may be due to higher percentage of partially digested cellulose,
lignin and pectin. The alimentary canal of bat provide shelter to various types of symbiotic
and commensale bacteria which help in digesting the complex organic materials. On the
other hand the members of Deuteromycotina viz, Cladosporium, Fusarium, Phanerochaete,
Trichoderma also preferred to grow over leaf litter and log and twig deposits that contain a
greater percentage of lignin and cellulose indicating that these mold species are ligninolytic
as well as cellulolytic.
In the same way in bacteria also it was found that bat guano are mostly preferred
by bacteria. During studies we have also noticed that the degradation of log and twig
deposits were preferred by only few groups of fungi and bacteria, thus indicating that lignin,
(as log and twig contains more percentage of lignin) is hard to degrade because of its
complex aromatic structure. Similar work has been reported by Koilraj and his co-workers
(1999) where they studied fungal diversity inside caves of southern India. They had isolated
thirty-five species of sporulating mesophilous fungi and seven types of non-sporulating
0% 10% 20% 30% 40% 50% 60% 70% 80% 90%
100%

fungi from the soil samples collected at the entrance, twilight and dark zones of six caves.
Novakova (2009) also studied diversity of fungi from Domica cave system where they have
isolated total of 195 fungal taxa from various cave substrates. Similarly diversity of
thermophilous soil microfungi in forest and cave ecosystems of Taiwan has also been
studied by Hsu and coworkers (2001). Rajput et al. (2012) isolated bacterial species from
different sediments of Kotomsar cave of Bastar, Chhattisgarh. Adetutu et al. (2011) studied
fungal diversity in areas accessible and not accessible to tourists at Naracoorte caves.
Fusarium sp., Trichoderma sp. and Neonectria sp. were only cultured form tourist
inaccessible area. Shapiro and Pringle (2010) isolated different fungal species (Bionectria,
Cladophora, Fusarium, Hypocrea, Mortierella, Paraconiothyrium, Penicillium and
Podospora) from caves in Kentucky and Tennessee.
A. Evaluation of Pectin Degradation Potency of Fungal Isolates:
To acertain pectin degradation potency of fungal isolates the organisms were first
grown separately on Hankin agar plates containing citrus pectin as sole carbon source and
incubated for 5 days. Three replicates of each organism were taken and average of growth /
digestion zone diameter were considered. To get mycelial dry weight the organisms were
grown separately in Hankin broth media containing citrus pectin as sole carbon source and
incubated for 5 days. The results are shown in Table – 6.
Table – 6: Zone of digestion and mycelial dry weight in pectin media.
Isolated fungi Zone of
digestion
(diameter)
Mycelial dry
weight per 50ml
Mycelial dry
weight per 1000ml
Alternaria alternata 40.26 mm 0.34gm 6.8 gm
Alternaria radicina 28 mm 0.12gm 2.4 gm
Aspergillus awamoori 26.74 mm 0.09gm 1.8 gm
Aspergillus japonicas 28.6 mm 0.11gm 2.2 gm
Aspergillus fumigatus 31.76 mm 0.18gm 3.6 gm
Aspergillus luchensis 30.16 mm 0.14gm 2.8 gm

Aspergillus niger 28.7 mm 0.12gm 2.4 gm
Aspergillus ochraceous 36.76mm .23gm 4.6 gm
Aspergillus parasiticus 27.5 mm 0.10gm 2.0 gm
Aspergillus stellatus 28.51mm 0.11gm 2.2 gm
Aspergillus versicolor 32.5mm 0.16gm 3.2 gm
Curvularia clavata 25.4 mm 0.07gm 1.4 gm
Curvularia lunata 26.12 mm 0.08gm 1.6 gm
Curvularia pallesence 25.4 mm 0.06gm 1.2 gm
Penicillium citrinum 36.26 mm 0.26gm 5.2 gm
Penicillium digitatum 27.43mm 0.12gm 2.4 gm
Penicillium meleagrinum var.
viridiflavum
37.5 mm 0.29gm 5.8 gm
Penicillium multicolor 29.19mm 0.14gm 2.8gm
Penicillium notatum 27.2 mm 0.10gm 2.0 gm
Penicillium oryzae 21.1 mm 0.05gm 1.0 gm
Penicillium rugulosum 20.46 mm 0.04gm 0.08gm
Phoma shorgina 21.51 mm 0.05gm 1.0gm
Phoma exigua 22.44 mm 0.06gm 1.2 gm
Phanerochaete crysosporium 28.4 mm 0.09gm 1.8 gm
Trichoderma viridae 31.22 mm 0.10gm 2.0 gm
Results show that out of total species studied 25 species were found to produce
pectin degrading enzyme in substantial tune. Out of 25 species, best grown species were
Alternaria alternata (plate- 2.1 and 8.1), Penicillium mealagrinum var. viridiflavum (plate-
2.3 and 8.3), Penicillium. citrinum (plate- 2.2 and 8.2), Aspergillus ochraceous, Aspergillus
fumigatus Aspergillus niger and Phanerochaete chyrsosporium. They exhibited greater
zone of digestion and highest mycelial weight, when compared with other pectinase
producing fungi.
Dube and gour (1975) studied extracellular pectic enzymes produced by
Macrophomina phaseolina on Richard's solution containing sucrose, Richard's solution
containing pectin and potato pectin medium. They found that organisms showed maximum
pectolytic enzyme secretion in the media containing pectin. Thus it indicates that pectolytic
enzymes are inductive in nature. Fonseca and Said (1999) studied effect of pectinases,
produced by Penicillium frequentans on pectin. The fungus was found to secrete one endo
and one exopolygalacturonase during the first 10 hr of incubation either in media
supplemented with pectin or in the absence of carbohydrate source. Phutela et al. (2005)

screened 120 different fungal isolates for pectinase and polygalacturonase production and
found that Aspergillus fumigatus was best for pectinase and polygalacturonase production
where as Akbar et al. (2012) isolated and screened different fungal strains from agro
industrial waste products and performed plate assay method by using pectin as sole carbon
source as well as quantitative estimation. According to their result Aspergillus carbonarius
showed maximum pectolytic activity. Patil and Choudhary (2010) worked on pectinase
producing microorganisms and observed that Pencillium sp are potent polygalacturonase
producer. In the same way Banu et al. (2010) also isolated ten fungi from municipal waste
soil samples and screened for pectinase production. They observed maximum pectinase
production by Penicillium chrysogenum. Abassi and Fazeilpoor (2010) found Aspergillus
niger as better pectinase producer then Trichoderma reesi. Akhter et al. (2011) also carried
solid state fermentation with 7 fungal strains and among them Aspergillus niger was found
as effective pectinase producer. Adeleke et al. (2012) evaluated the potency of fungi to
produce pectinase and cellulase by using orange peels as substrate. They used CMC and
citrus pectin as sole carbon source and their study showed that Penicillium atroventum,
Aspergillus Flavus and Aspergillus oryzae were highest pectinase and cellulase producer.
Okafor et al. (2010) studied pectolytic activity on Aspergillus clavatus, Aspergillus niger,
Fusarium sp., Penicillium chrysogenum and Trichoderma sp. using citrus pectin as sole
carbon source. They observed maximum pectinase production by Aspergillus niger and
Penicillium chrysogenum. Desouky (2007) isolated five fungi and screened for their ability
to produce pectinolytic and cellulolytic activity using quantitative and qualitative analysis.
They identified Penicillium hordei as best cellulase producer and Aspergillus ustus as best
pectinase producer.
B. Evaluation of Cellulose Degradation Potency of Fungal Isolates

The organisms were grown on basal agar plates containing CMC (sole carbon source)
to study zone of digestion and then grown in basal media containing CMC as sole carbon
source to obtain mycelial dry weight. Incubation period of 7 days were given for all the test
organisms. Averages of three replicates were considered for each organism. The results are
shown in Table – 7.
Table – 7: Zone of digestion / mycelial dry weight in cellulose media.
Isolated Fungi Zone of
digestion
(diameter)
Mycelial dry
weight per 50 ml
Mycelial dry
weight per
1000ml
Alternaria alternata 36.56 mm 0.08gm 1.6 gm
Alternaria crassa 27.12 mm 0.03gm 0.6 gm
Aspergillus fumigatus 32.42mm 0.06gm 1.2 gm
Aspergillus luchensis 25.4 mm 0.02gm 0.4 gm
Aspergillus niger 34.67mm 0.06gm 1.2 gm
Aspergillus ochraceous 25.4mm 0.03gm 0.6gm
Aspergillus parasiticus 32.4mm 0.05gm 1.0 gm
Curvularia lunata 26.67mm 0.03gm 0.6 gm
Penicillium brevicompactum 26.62mm 0.03gm 0.6 gm
Penicillium citrinun 42.16mm 0.14gm 2.8 gm
Penicillium crysogenum 27.49mm 0.03gm 0.6 gm
Penicillium meleagrinum var.
viridiflavum
43.26mm 0.15gm 3.0gm
Penicillium notatum 34.24mm 0.05gm 1.00 gm
Penicillium rubrum 29.62mm 0.04gm 0.8 gm
Phoma exigua 25.4mm 0.028gm 0.56 gm
Trichoderma atro
viridae
44.24mm 0.17gm 3.4 gm
Trichoderma viridae 45.22mm 0.19gm 3.8gm
Results show that out of total species studied 17 species were found to produce
cellulose degrading enzyme in substantial tune. Present studies revealed that Trichoderma
viridae, Trichoderma atroviridae, Penicillium meleagrinum var. viridiflavum (plate- 3.3 and
9.3), Penicillium citrinum (plate- 3.2 and 9.2), and Alternaria alternata (plate-3.1and 9.1)
possess greater cellulolytic potency as they exhibited greater zone of digestion and highest
mycelial dry weight as compared to rest of the isolated organisms. Hankin and Anagnostakis
(1976), using same method, also reported cellulolytic ability of some fungi viz.
Trichoderma viridae, Penicillium sp, Peziza ostracoderma and fusarium sp. and some

bacteria like Streptomyces, Cellulomonas etc. Kasana et al. (2008) also screened cellulase-
producing microorganisms that was routinely done on carboxymethylcellulose (CMC)
plates and were flooded either with 1% hexadecyltrimethyl ammonium bromide or with
0.1% Congo red followed by 1 M NaCl. Ghanbary et al. (2010) working on laboratory
stimulation of cellulose degradation by soil Aspergilli reported that A.niger and A.niveus
had highest ability for cellulose degradation. In present studies also 5 species of Aspergillus
were found to have cellulose degradation ability to a moderate extent. Picart et al (2008)
isolated and characterized a new fungal strain from a rotten rag, and identified it as
Stachybotrys atra. The production of cellulases by this strain was analyzed and
characterized. Ahmed et al. (2009) partially purified three cellulases namely exoglucanase
(EXG), endoglucanase (EG) and β-glucosidase (BGL) from Trichoderma harzianum.
Cellulase production by different species of Trichoderma, Fusarium, Aspergillus,
Penicillium and Alternaria alternata (mutant) were also reported by Macris (1983), Sazci et
al. (1986) and Jahangeer et al. (2005). Present studies also revealed that two species viz
Penicillium meleagrinum var. viridiflavum and p. citrinum, which were not reported earlier
as cellulase producer were found to be potent cellulose degraders. Sridevi et al. (2009)
tested Aspergillus niger for production of cellulase from sawdust, wheat straw, sugarcane
bagasse and ricebran, and concluded that wheat bran had yielded more cellulase whereas
Juwaied et al. (2011) used Aspergillus niger and Trichoderma viridae and reported
sugarcane as a potential substrate for production of cellulase. Ikeda et al. (1967, 1973) had
also reported the isolation of a homogeneous cellulolytic enzyme from A. niger.
C. Evaluation of Lignin Degradation Potency of Fungal Isolates
The organisms were grown on basal agar plates containing lignin as sole carbon source
to study colonial growth and then grown in basal media containing lignin sulphonic acid
sodium salt as sole carbon source to obtain mycelial dry weight. Incubation period of 9 days

were given for all the test organisms. Averages of three replicates were considered for each
organism. The results are shown in Table–8.
Table – 8: mycelial growth / mycelial dry weight in lignin media.
Name of fungi Growth rate Mycelial dry
weight per 50 ml
Mycelia dry weight
per 1000ml
Alternaria alternata ++ 0.10gm 2.0gm
Aspergillus fumigatus + 0.04gm 0.8 gm
Aspergillus luchensis + 0.028gm 0.56 gm
Aspergillus niger + 0.036gm 0.72 gm
Curvularia lunata + 0.03gm 0.6 gm
Fusarium caucassam + 0.02gm 0.4 gm
Penicillium citrinum ++ 0.08gm 1.6 gm
Penicillium meleagrinum
var. viridiflavum
++ 0.11gm 2.2 gm
Phanerochaete
chrysosporium
+++ 0.12gm 2.4 gm
+ = poor, ++ = moderate, +++ = good, ++++ = excellent.
In ligninolytic test total 9 species grown well in media containing lignin as sole
carbon source. Phanerochaete crysosporium showed best ligninolytic activity, followed by
Penicillium mealagrinum var. viridiflavum (plate – 4.3 and 10.3) ,Alternaria alternata
(plate- 4.1 and 10.1) and Penicillium citrinum (plate- 4.2 and 10.2).
Wu et al. (2005) explored lignin-degrading capacity of attached-growth white-rot
fungi. Three white-rot fungi, P. chrysosporium, P. ostreatus and S22, showed high capacity
for lignin degradation. Kalmis et al. (2008) reported ligninolytic enzyme activities of
different fungal species (six commercial and 13 wild) in solid and liquid culture media.
Among the wild strains, only Pleurotus ostreatus-1 (MCC45), P. ostreatus-2 (MCC40),
Pleurotus eryngii-1 (MCC25) and P. eryngii-2 (MCC26), and commercial strains P.
ostreatus, P. sajor-caju, P. eryngii presented lignin peroxidase (LiP) activity. Pant and
Adholeya (2007) isolated two fungal strains producing ligninolytic enzymes and having the
potential to decolorize distillery effluent from the soil of a distillery effluent contaminated
site. The correlation between decolorization and ligninolytic abilities of white-rot fungi has

been commented upon by several authors (Banat et al. (1996), Revankar and Lele (2006)
and Zhang et al. (2006) ). MnP activity was reported in Alternaria alternata with a possible
role in humic acid degradation by Rezacova et al. (2006), Since, it has been reported that
fungal ligninolytic enzymes play a major role in humic acid and melanoidin decolorization,
by Blondeau (1989), different Penicillium sp have also been reported, to produce
ligninolytic enzymes, by Sack and Gunther (1993) though its degrading mechanism is
considered to be different from that of the white-rot fungi (Hy et al. 2005). Cadmaleiv et al.
(2005) isolated two extracellular oxidases (laccases) from the extracellular fluid of the
fungus Panus (Lentinus) tigrinus cultivated in low-nitrogen medium supplemented with
birch sawdust. Dhouib et al. (2005) reported the ability of autochthonous fungi from Tunisia
to produce ligninolytic enzymes and these fungal strains were firstly screened on solid
media containing Poly R-478 or ABTS as indicator compounds that enabled the detection of
lignin-modifying enzymes as specific color reaction whereas Ching et al. (2006) also
studied laccase activities of Penicillium simplicissimum H5 during solid-state fermentation
with rice straw. Mabrouk et al. (2010) studied lignin degradation on marine ascomycetes
and concluded that Trematosphaeria mangrovei showed highest ligninolytic activity.
D. Evaluation of Pectin Degradation by Bacterial Isolates
The organisms were grown on basal agar plates containing citrus pectin as sole
carbon source to study colonial growth and then grown in basal media containing citrus
pectin as sole carbon source to obtain colonial dry weight. Incubation period of 3 days were
given for all the test organisms. Average of three replicates was considered for each
organism. The results are shown in Table- 9.
Table- 9: Colonial growth and mycelial weight in pectin media.
Isolated Bacteria Growth rate Colonial dry weight per 50 ml
Colonial dry weight per 1000 ml
Bacillus cereus +++ 0.11gm 2.2 gm Bacillus thuringiensis +++ 0.12 gm 2.4 gm Brevundimonas diminuta ++++ 0.14 gm 2.8 gm

Cream colony I ++ 0.08 gm 0.16 gm Cream colony II + 0.03 gm 0.06 gm Cream rough colony II ++ 0.07 gm 0.14 gm Cream rough colony II + 0.04 gm 0.08 gm Cream rough colony III ++ 0.06 gm 0.12 gm Creamish yellow colony I ++ 0.08 gm 0.16 gm Creamish yellow colony II ++ 0.068 gm 0.136 gm Lemon yellow colony I + 0.03 gm 0.06gm Lemon yellow colony II ++ 0.07gm 0.14 gm Orange colony + 0.05 gm 0.10gm Transparent colony 4 + 0.029 gm 0.058 gm Transparent colony II ++ 0.06 gm 0.12 gm White colony II + 0.04 gm 0.08 gm Whitish cream colony + 0.03 gm 0.06 gm Yellowish rough colony ++ 0.07 gm 0.14 gm
+ = poor, ++ = moderate, +++ = good, ++++ = excellent.
Out of 32 species 18 species grown well in media containing pectin as sole
carbon source, but Brevundimonas diminuta (plate- 5.1 and 11.1), Bacillus thuringiensis
(plate- 5.2 and 11.2), Bacillus cereus (plate- 5.3 and 11.3), Cream colony I, Lemon yellow
colony and Yellowish rough colony were proved to be best pectinase producer as their
growth rate in pectin media was more as compared to other bacteria and even they showed
highest dry weight. Kobayashi et al. (2000) purified the first bacterial exo-poly
galacturonases from Bacillus sp. strain KSM-P443. Mohmoud et al. (2008) studied
pectinolytic enzymes and their production, characterization and applications and isolated
fifty two bacterial isolates, out of which Paenibacillus polymyxa showed the highest
pectinolytic activities and the exo-polygalactouronase was found to play major role.
Bayoumi et al. (2008) reported the nutritional and environmental condition requirements for
production of Polygalacturonase by Bacillus firmus-I-4071 under solid state fermentation
conditions using potato peels. These results are connected with that recorded by Kapoor et
al. (2000) who found that, Bacillus sp. MG-CP-2 produce an alkaline and thermostable
Polygalacturonase in degumming of ramie (Boehmeria nivea) and Sunn hemp (Crotalaria
juncea). Kapoor et al. (2000) and Bayoumi et al. (2008) reported that maximum
polygalacturonase production were achieved when media were supplemented with citrus
pectin as sole carbon source. However Beg et al. (2000a, 2000b) found that, pectinase

production from Streptomyces sp. QG-11-3 was enhanced by wheat bran. Geetha et al.
(2012) worked on bacterial species for pectinase production and identified them as Bacillus
sp. and Pseudomonas sp. According to them Bacillus sp. showed best pectinase activity
when grown in media with one percent pectin concentration. Kumar et al. (2012) studied
pectinase production by bacteria and observed that Bacillus sp MFW7 showed best
pectolytic activity. Janani et al. (2011) also studied pectinase producing bacteria from
agricultural waste dump soils and isolated ten bacterial strains. Three best pectinase
producing strains were identified as Bacillus sp whereas Kumar and Sharma (2012) reported
Cocci sp. as potent producer for pectinase production.
E. Evaluation of Cellulose Degradation by Bacterial Isolates
The organisms were grown on basal agar plates containing CMC (sole carbon
source) to study zone of digestion and then grown in basal media containing CMC as sole
carbon source to obtain mycelial dry weight. Incubation period of 5 days were given for all
the test organisms. Average of three replicates were considered for each organism. The
results are shown in Table –10.
Table- 10: Colonial growth and dry weight in cellulose media
Isolated Bacteria Growth rate Colonial dry
weight per 50 ml
Colonial dry
weight per 1000 ml
Bacillus cereus ++ 0.08 gm 0.16 gm
Bacillus thuringiensis ++ 0.07gm 0.14gm
Brevundimonas diminuta ++ 0.09 gm 0.18 gm
Cream colony I + 0.02 gm 0.04 gm
Cream rough colony II + 0.04 gm 0.08 gm
Cream rough colony III + 0.035 gm 0.07 gm
Creamish yellow colony I + 0.04 gm 0.08 gm
Lemon yellow colony II + 0.028 gm 0.56 gm
Transparent colony II + 0.03 gm 0.06 gm
Yellowish rough colony ++ 0.02gm 0.04gm
+ = poor, ++ = moderate, +++ = good, ++++ = excellent.

From total isolated species of bacteria, 10 species grown well on media containing
CMC as sole carbon source, thus giving an impression that 10 species of bacteria are potent
degraders. According to the result, Brevundimonas diminuta (plate- 6.1 and 12.1), Bacillus
thuringiensis (plate- 6.2 and 12.2), Bacillus cereus (plate- 6.3 and 12.3)and yellowish rough
colony were found to grow best in CMC media and showed highest dry weight. Wj et al.
(2005) also isolated 15 mesophilic cellulose-degrading bacteria from flower stalks-vegetable
waste co-composting system. Bacillus pasteurii and Bacillus cereus, Halobacillus,
Aeromicrobium and Brevibacterium showed high cellulase activity. Wongwilaiwalin et al.
(2010) also analysed thermophilic lignocellulose degrading microbial consortium with the
co-existence of eight major microbes, comprising anaerobic bacterial genera Clostridium
and Thermoanaerobacterium along with aerobic/facultative anaerobic Rhodocyclaceae
bacterium, bacilli, and uncultured bacteria. The microbial consortium showed efficient
degradation activity of cellulose as substrate. Ariffin et al. (2006) screened bacteria for
production of cellulase and used CMC as substrate. They got better production of cellulase
by Bacillus pumilus whereas Kim et al. (2012) observed three strains of bacteria showing
higher potential for cellulose degradation and identified them as Bacillus subtilis strains. Bai
et al. (2012) isolated bacteria from cowdung and analyzed their ability to produce cellulase.
Their study revealed that Bacillus subtilis strain (CELPTKL) was found as potent cellulase
producer.
F. Evaluation of Lignin Degradation by Bacterial Isolates
The organisms were grown on basal agar plates containing lignin sulphonic acid
sodium salt as sole carbon source to study colonial growth and then grown in basal media
containing lignin as sole carbon source to obtain colonial dry weight. Incubation period of 7
days were given for all the test organisms. Average of three replicates were considered for
each organism. The results are shown in Table–11.

Table- 11: Colonial growth and dry weight in lignin media
Isolated bacteria Growth rate Colonial dry weight
per 50 ml
Colonial dry weight per
1000 ml
Bacillus cereus + 0.03 gm 0.6 gm
Bacillus thuringiensis + 0.04 gm 0.08 gm
Brevundimonas
diminuta
+ 0.06 gm 1.2 gm
Cream colour I + 0.02 gm 0.4 gm
Creamish yellow
colony II
+ 0.02 gm 0.4 gm
Transparent colony II + 0.01 gm 0.2 gm
+ = poor, ++ = moderate, +++ = good, ++++ = excellent.
From total isolated species of bacteria, 6 species grown well on media containing
lignin as sole carbon source, thus giving an impression that 6 species of bacteria are potent
degraders. According to the result, Brevundimonas diminuta (plate- 7.1 and 13.1), Bacillus
thuringiensis (plate- 7.2 and 13.2), Bacillus cereus (plate- 7.3 and 13.3) and Creamish
yellow colony II were found to grow best in lignin media and showed highest dry weight.
Gonzalez et al. (1986) used lignin related compounds as a sole carbon source. They
isolated bacterial strains and tested their ability to proliferate in lignin media. Deschamps et
al. (2004) isolated lignin degrading bacteria directly by an enrichment culture technique
using an industrial kraft lignin (Indulin AT) as the sole carbon source. According to their
result, Aeromonas sp. degraded 98% of lignin (1g/l) after 5 days of incubation. Our studies
revealed that Brevundimonas diminuta degraded lignin upto .6g/l after 7 days of incubation.
Thus to some extent it agrees with the results of Aeromonas sp. Hassan and Hanafy 2009
studied biodegradation of lignin by Bacillus species. They also used lignin as sole carbon
source. They identified different genera including Corynebacterium, Agrobacterium,
Pseudomonas, Aeromonas, Klebsiella and Enterobacter. Mandryk et al. (2009) also used
lignin to support the growth and production of antimicrobial substances by 19
microorganisms and organisms from seven genera: Bacillus, Pseudomonas, Streptomyces,
Beauveria, Paecilomyces, Trichoderma and Trichosporon grew on the tested media. P.
aurantiaca S-1 has only shown to grow well in lignin media. Odier et al. (1981) selected
eleven gram-negative aerobic bacteria out of 122 isolates for their ability to assimilate
poplar dioxane lignin isolated from the soil and without a co substrate. Lignin degradation
was confirmed by Pseudomonas sp.
From above results we have observed that some of the species are very good
degraders particularly of cellulose like Trichoderma viridae and T.atroviridae but had not
shown that much potency for pectin and lignin. In the same way Phanerochaete
crysosporium was proved to be a very good lignin degrader, but not as a cellulose and pectin
degrader. But we observed that some species had shown moderate to good degradation in all
three media, and thus proved to be ligninolytic, cellulolytic as well as pectolytic. Penicillium
mealagrinum var. viridiflavum, Alternaria alternata, Penicillium citrinum, Aspergillus
fumigatus, Aspergillus niger had shown positive result equally in all three media. In the
same way Brevundimonas diminuta, Bacillus thuringiensis and Bacillus cereus were found
to be comparatively potent degrader of lignin, cellulose as well as pectin.
Quantitative Test for Pectin, Cellulose and Lignin Utilization by Selected
Isolates.
After evaluating bacteria and fungi for their capacity to degrade lignin, cellulose and
pectin, the target microorganisms were further selected for quantitative estimation. The
selection of the organisms were done on the basis of their comparatively higher degradative
potency on lignin, pectin and cellulose as compared to other studied organisms. Out of total
degraders best three fungal and three bacterial potent degraders were selected. To confirm
utilization of pectin, cellulose and lignin the test organisms were grown in respective basal
broth media. After stipulated incubation period the filtrates were studied for absorbancy
using spectrophotometer and absorbancy were matched with standard solutions of different
concentrations. Results were shown in Table-12 and Table-13 as follows:
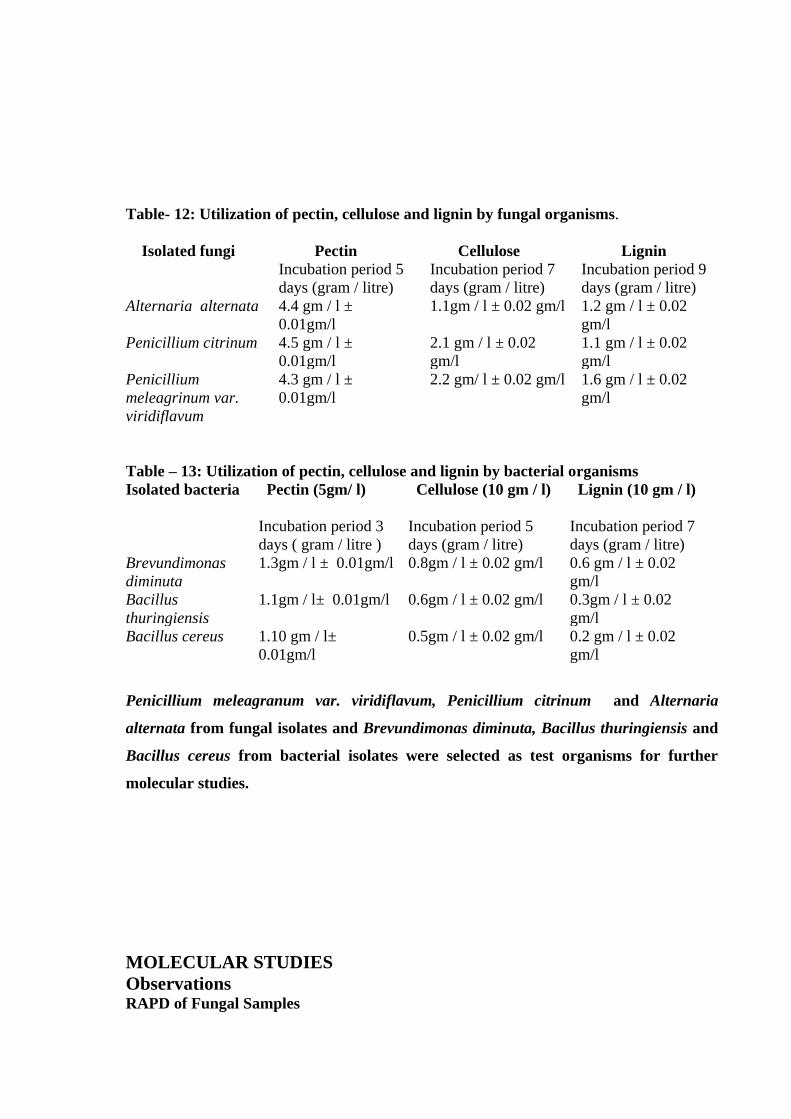
Table- 12: Utilization of pectin, cellulose and lignin by fungal organisms.
Isolated fungi Pectin
Incubation period 5
days (gram / litre)
Cellulose
Incubation period 7
days (gram / litre)
Lignin
Incubation period 9
days (gram / litre)
Alternaria alternata 4.4 gm / l ±
0.01gm/l
1.1gm / l ± 0.02 gm/l 1.2 gm / l ± 0.02
gm/l
Penicillium citrinum 4.5 gm / l ±
0.01gm/l
2.1 gm / l ± 0.02
gm/l
1.1 gm / l ± 0.02
gm/l
Penicillium
meleagrinum var.
viridiflavum
4.3 gm / l ±
0.01gm/l
2.2 gm/ l ± 0.02 gm/l 1.6 gm / l ± 0.02
gm/l
Table – 13: Utilization of pectin, cellulose and lignin by bacterial organisms
Isolated bacteria Pectin (5gm/ l)
Incubation period 3
days ( gram / litre )
Cellulose (10 gm / l)
Incubation period 5
days (gram / litre)
Lignin (10 gm / l)
Incubation period 7
days (gram / litre)
Brevundimonas
diminuta
1.3gm / l ± 0.01gm/l 0.8gm / l ± 0.02 gm/l 0.6 gm / l ± 0.02
gm/l
Bacillus
thuringiensis
1.1gm / l± 0.01gm/l 0.6gm / l ± 0.02 gm/l 0.3gm / l ± 0.02
gm/l
Bacillus cereus 1.10 gm / l±
0.01gm/l
0.5gm / l ± 0.02 gm/l 0.2 gm / l ± 0.02
gm/l
Penicillium meleagranum var. viridiflavum, Penicillium citrinum and Alternaria
alternata from fungal isolates and Brevundimonas diminuta, Bacillus thuringiensis and
Bacillus cereus from bacterial isolates were selected as test organisms for further
molecular studies.
MOLECULAR STUDIES
Observations RAPD of Fungal Samples

Fig - 17: PCR amplification of fungi.
Identification Report
Consolidated fungal identification report by RAPD

RAPD of Bacterial Samples

Fig.-19: PCR amplification of bacteria
Identification Report


Consolidated bacterial identification report by RAPD

RFLP of fungal samples

Fig – 21: PCR product of fungal isolates.
Fig – 22: RFLP of PCR product of fungal isolates.
RFLP of bacterial samples
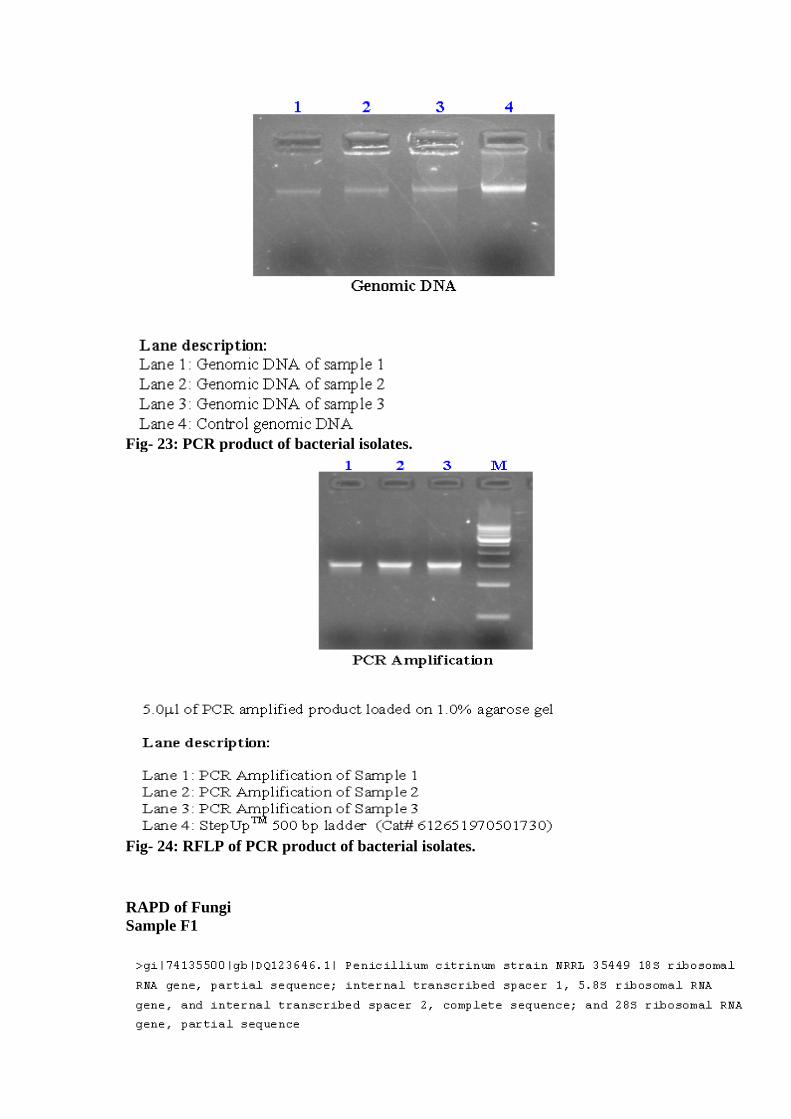
Fig- 23: PCR product of bacterial isolates.
Fig- 24: RFLP of PCR product of bacterial isolates.
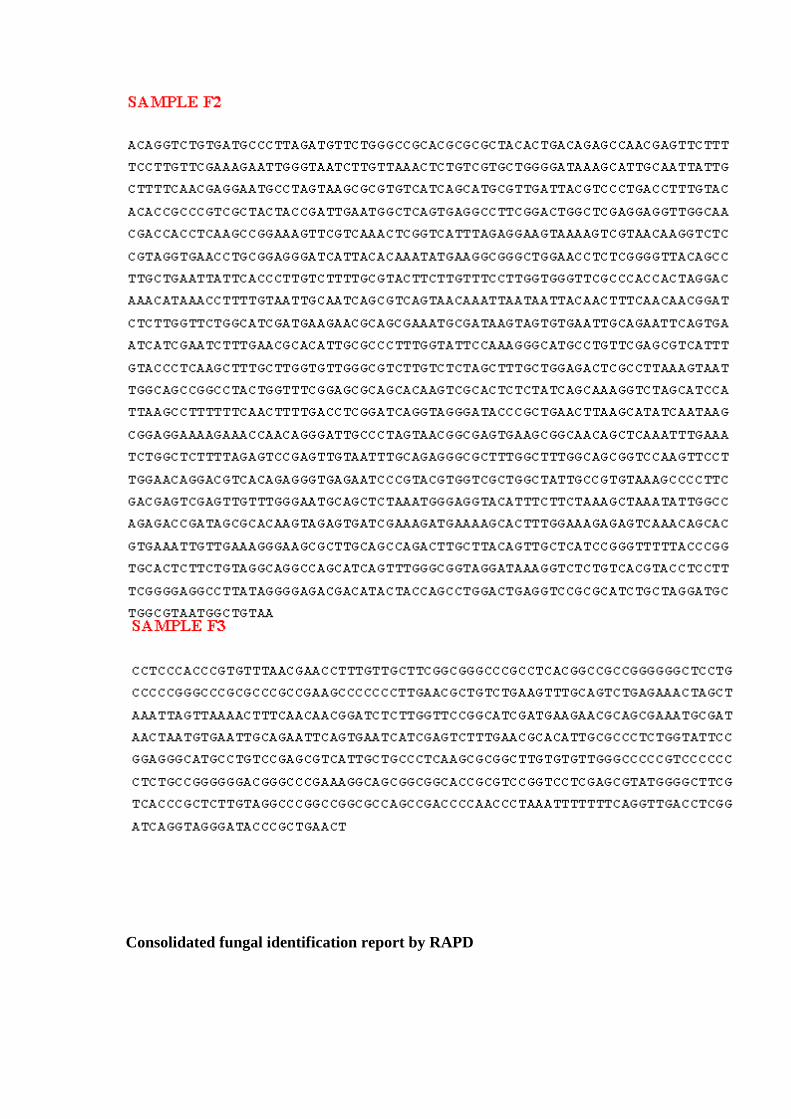
RAPD of Fungi Sample F1
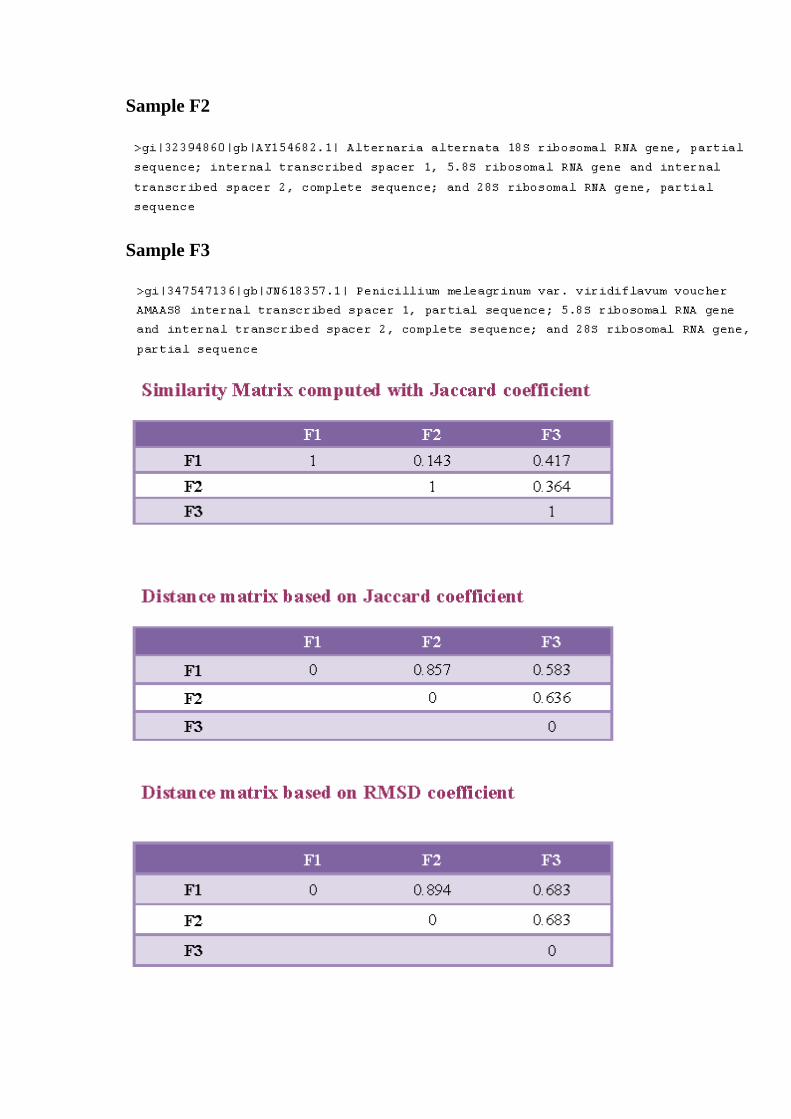
Sample F2
Sample F3

Above complete molecular analysis of three fungal samples from the cave Mandeepkhol,
revealed abundance of Penicillium citrinum (NRRL 35449), Alernaria alternata and
Penicillium meleagrinum var.viridiflavum. Dendogram of all three fungi shows that
Alernaria alternata and Penicillium meleagrinum var. viridiflavum are phylogenetically
more closure than Penicillium citrinum.
RAPD of Bacteria
Sample –B1

Sample- B2
Sample –B3


Above molecular analysis revealed that the bacterial strain reported from cave Mandeepkhol
where Brevundimonas diminuta (B34), Bacillus thuringiensis (YY23) and Bacillus cereus
(DS 16) and Bacillus thuringiensis and Bacillus cereus are phylogenetically more closure
than Brevundimonas diminuta.
RFLP of Fungi

We conclude that finding of RFLP for all three samples of fungi are inconclusive and needs
larger size analysis.
RFLP of Bacteria
We conclude that finding of RFLP for all three samples of bacteria are inconclusive and
needs larger size analysis.
Investigation of the microbial ecology of natural and anthropogenically influenced
environments on the basis of culture and colony characteristics are important methods, but
they are extremely biased in their evaluation of microbial genetic diversity due to the
selection of a particular population of microorganisms. The adversity in ascribing an
organism to a biologically meaningful category should be well considered before the use of
any molecular identification tool. One has to be aware of the evolutionary history and
taxonomic position of the specimen under study. It is very important to understand the order
of branching and ages of divergence (phylogeny) of the organisms in examination and to be

familiarized with the nomenclatures used in earliers studies. Terminologies such as “strain”,
“ ariant”, “subspecies” or “breed” could be highly nonobjective in some situations and can
be used as synonymous terms by different investigators to describe the same biological
entity. Many biochemical and molecular methods has been applied to reveal the microbial
community composition over time and space. These new approaches allow linkage between
ecological processes in the environment with specific microbial populations and help us to
acknowledge and resolve many important questions in microbial ecology such as what
factors and resources govern the enormous genetic and metabolic diversity in an
environment. With the advent of recent advances in genomics and sequencing technologies,
microbial community analyses using culture-independent molecular techniques have
initiated a new era of microbial ecology.
In modern taxonomic studies, methods for the identification of species that rely on
DNA or protein sequence analysis presuppose the neutral theory of molecular evolution, in
which different lineages diverge over evolutionary times by the accumulation of molecular
changes (most of them neutral) (Kimura, 1968). These methods are based on the assumption
that individuals from a same species carry specific DNA (or protein) sequences that are
different from those found in individuals from other species. However, the distribution of a
given molecular variant in time and in space will be influenced by the reproductive success
of individuals, migratory events and random genetic drift. Therefore, it should be realized
that a continuous genetic variability does exist among individuals of a species. The level of
intra-species diversity in the locus under study has to be properly assessed before
undertaking any taxonomic identification in order to guarantee that there is no overlap
between intra-species variation and interspecies divergence. Furthermore, different loci have
variable rates of evolution owing to the action of processes such as mutation and
recombination (Sunnucks, 2000). Therefore, to choose the appropriate loci is vital to the
success of the identification.

Molecular techniques are the major tools for the analysis of microorganisms from various
sources. The techniques provide ways to screen for a vast array of agents in a single test
(Field and Wills, 1998). The food industries, water processors, agronomical agencies and
analytical laboratories have taken up these methods for rapid differentiation of species,
strain identification and definition of strain relatedness from infected samples. Molecular
methods vary with respect to discriminatory power, reproducibility, ease of use, and ease of
interpretation (Lasker, 2002).
Molecular analyses of environmental communities have revealed that the cultivable
fraction represents less than one percent of the total number of prokaryotic species present
in any given sample. Various molecular methods based on direct isolation and analysis of
nucleic acids, proteins, and lipids from environmental samples are available that are capable
of revealing structural and functional information about microbial communities. Molecular
techniques such as genetic fingerprinting, metagenomics, metaproteomics,
metatranscriptomics, and proteogenomics are nowadays becoming vital for discovery and
characterization of vast microbial diversity and also important for understanding their
interactions with biotic and abiotic environmental factors. Majority of microbial
communities in nature have not been cultured in the laboratory. Thus the primary source of
information for these uncultured but viable organisms is their biomolecules like nucleic
acids, lipids, and proteins. Techniques like culture-independent nucleic acid approaches
include, “analyses of whole genomes or selected genes such as 16S for prokaryotes and 18S
rRNA (ribosomal RNA) for eukaryotes.” omparati e analyses of rRNA signatory
molecules, have classified the cellular life into two primary domains, viz. eukaryotic
(Eukarya) and prokaryotic (Bacteria and Archaea) (Hugenholtz 2002). The field of
microbial ecology has seen tremendous progress for a while, and a varied number of
molecular techniques have been developed for describing and characterizing the
phylogenetic and functional diversity of microorganisms (Fig.). Depending on their

capability of revealing the microbial diversity structure and function, these techniques have
been broadly classified into, partial community analysis approaches and whole community
analysis approaches.
Fig: Molecular tools for characterization of structural and functional diversity of
microbes in the environment.
Source: Gurdeep Rastogi and Rajesh K. Sani. Molecular Techniques to Assess Microbial Community
Structure, Function, and Dynamics in the Environment. Chapter:2. I. Ahmad et al. (eds.), Microbes
and Microbial Technology: 29 Agricultural and Environmental Applications, Springer Science+Busi
ness Media, LLC 2011.
Traditional methods of bacterial enumeration and typing are often insufficient for the
identification of specific strains in complex, mixed-strain microbial consortia. The aim of
typing is to identify stable sub-groups or clones within the same species using markers that
are reproducible, accurate and conveniently detected.
Several kinds of molecular techniques have been used to study genetic diversity, for
example, labeled probes to detect restriction fragment length polymorphism (RFLP)
(Hegedeus and Khachatourians, 1993; Maurer et al., 1997) and methods based on the
polymerase chain reaction (PCR) such as the use of random amplified polymorphic DNA
(RAPD) (Fegan et al., 1993; Bidochka et al., 1994; Piatti et al., 1998; Freire, 2001; Jensen

et al., 2001; Gaitan et al., 2002), simple sequences repeat (SSR or microsatellites) analysis
(Kretzner et al., 2000; Enkerli et al., 2001, 2005) and internal transcribed spacer (ITS)-
rDNA sequence RFLP analysis (Rakotonirainy et al., 1994; Buscot et al., 1996; Coates et
al., 2002a). Even though they have different and complementary discriminatory power
RAPD, SSR and RFLP analysis have been very effective in detecting genetic diversity in
several species (Couteaudier et al., 1998; Glare and Inwood, 1998; Coates et al., 2002b;
Enkerli et al., 2005). In Chile, however, there has been no previous molecular
characterization of entomopathogenic fungi populations. The PCR technique combined with
RAPD analysis (Welsh and McClelland, 1990; Williams et al., 1990) has been extensively
used to determine the genetic diversity of various entomopathogenic fungi (Cobb and
Clarkson, 1993; Bidochka et al., 1994; Neuvéglise et al., 1994; Neuvéglise and Brygoo,
1994; Bidochka et al., 1995; Hodge et al., 1995; Fungaro et al., 1996; Maurer et al., 1997)
including Metarhizium (Fegan et al., 1993; Leal et al., 1994) and to relate genetic diversity
to pathogenicity index (Bridge et al., 1997) and to identify strains (Milner et al., 2002).
Using DNA-fingerprinting techniques like randomly amplified polymorphic DNA
(RAPD), RFLP, ribotyping and DNA (or RNA)-sequencing, microorganisms can be
identified up to strain level (Anderson and Kohn, 1995; Anderson et al., 1992; Appel and
Gordon, 1996).
The basic principle of molecular biology used in a variety of methods with possible
applications in microbial species identification includes hybridization of complementary DN
A oligonucleoti des (DNA hybridization). Some of the early assays were based on solid-
phase hybridizations performed on nitrocellulose or nylon membranes between whole
genomic or synthetic DNA probes of known origin and DNA extracted from the target
sample (Falkow and Moseley, 1982; Scholl and Jollick, 1987; Torok et al., 1995). The
RFLP analysis is widely used for the detection of interspecies variation at the DNA
sequence level which is consised in the generation of species-specific band profiles through

the digestion of DNA with one or more restriction endonucleases (Botstein et al., 1980).
The distinctive and exclusive RFLP profile of each species is the resultant of the unique
genomic distribution of recognition sites (generated or removed by single-base substitution
reactions) and the distance between them (that varies due to large genomic rearrangements,
such as translocations, transposable elements or tandem duplications). On the other hand,
RAPD profiles are generated by the random PCR amplification of DNA segments using
short primers of arbitrary nucleotide sequence of usually 9 to 10 nucleotides long (Livak et
al., 1992; Williams et al., 1990). Different fingerprinting techniques are based on the use of
primers that are specifically designed to hybridize within repetitive genomic regions. The
differential genomic distribution of repetitive elements between species is responsible for
species-specific profiles. These repetitive regions includes, mammalian-wide interspersed
repeats (MIR) (Buntjer and Lenstra, 1998; Jurka et al., 1995; Melancon et al., 1996),
repetitive extragenic palindromic sequences (REP) (Versalovic et al., 1991) and
enterobacterial repetitive intergenic consensus sequences (ERIC) (Hulton et al., 1991). The
RAPD method does not require prior sequence information for PCR primer design but is
extremely dependent on variations in laboratorial conditions (such as template DNA
concentration, PCR and electrophoretic settings, etc), requiring carefully developed
laboratory protocols to be reproducible. An imperfect hybridization between the primer and
the target site may result in a completely different banding profile.
The choice of genetic marker can have a substantial impact on the analysis and
interpretation of data. For questions relating to the roles played by population size, mating
systems, and gene flow, selectively neutral genetic markers are preferred. For questions
relating to the effects of selection, selected markers should be used. An exception to these
guidelines exists when working with fungi that reproduce predominantly asexually,
producing a population structure that is composed largely of clonal lineages. In such cases, a
neutral marker such as a DNA fingerprint may be used to address questions about selection

because of the complete correspondence between genotype (e.g., DNA fingerprint) and
phenotype (selected marker, e.g., pathotype). However, a complete correspondence between
genotype and phenotype may not always be assumed, because several studies have shown
that different pathotypes can arise within the same clonal lineage (Drenth et al., 1996;
Goodwin et al., 1995) usually as a result of selection. Although the advantages and
disadvantages of different types of genetic markers have been discussed elsewhere (Kohn,
1992; McDonald and McDermott, 1993; Rosewich and McDonald, 1994). In population
genetics, the best genetic markers are those which are selectively neutral, highly
informative, reproducible, and relatively easy to assay. RFLPs, and RAPDs have been used
extensively in eukaryotes. The majority of fungal studies currently are conducted with
DNA-based genetic markers. If the organism in under consideration can be grown in pure
culture on artificial media, the choice of DNA marker is open but if the organism cannot be
grown on artificial media, then polymerase chain reaction (PCR)-based methods are likely
to be more appropriate due to limitations on the amount of tissue that can be isolated for
DNA extraction. Different categories of genetic markers provide widely varying
interpretations of the genetic structure of populations. In case of Mycosphaerella
graminicola, there is a large amount of diversity for nuclear RFLP loci, which suggests high
levels of gene diversity and random mating populations (McDonald et al., 1995). DNA
fingerprints based on hybridization of one probe to repetitive DNA sequences had greater
resolution to differentiate clones then multilocus haplotypes based on hybridization of many
single-copy probes for M. graminicola and Phaeosphaeria nodorum (Boeger et al., 1993;
McDonald et al., 1994). The greater resolution of DNA fingerprints in these cases likely
reflects the larger number of loci assayed by the repetitive probes. Generally it is best to use
the widest practical array of genetic markers to obtain the most comprehensive
understanding of the genetic structure of populations.

Randomly amplified polymorphic DNA (RAPD) technique is amplification-based
nucleic acid fingerprinting techniques (concurrent detection of multiple loci without
assignment of a genotype) that use an in vitro enzymatic reaction to specifically amplify a
multiplicity of target sites in one or more nucleic acid molecules (Micheli et al., 1994). The
amplification reaction is generally carried out by short synthetic oligonucleotides of
arbitrary or semi-arbitrary sequence that produce a collection of amplified products of
largely non-allelic nature. Several authors have reported on the application of RAPD
technique in microorganisms (Babalola, 2002). It uses random primers (Williams et al.,
1990) and can be applied to any species without requiring any information about the
nucleotide sequence. The amplification products from the analysis exhibited polymorphism
and thus can be used as genetic markers. Since presence of a RAPD band, does not provide
any distinction between hetero -and homozygous states, the fragments are scored as
dominant Mendelian elements. Nowrouzian et al., in 2001, designed a RAPD typing method
for the identification of E. coli strains in normal human intestinal microflora. The band
pattern generated in the analysis represents genome characterization of a particular bacterial
strain (Welsh and McClelland, 1990). Also RAPD has the potential for analyzing
phylogenetic relationships among closely related species (Williams et al., 1990) and can
distinguish between strains within a species.
RAPD markers (Williams et al., 1990) have become popular because this PCR
technology is relatively easy to implement. RAPDs can be assayed by using very small
amounts of fungal biomass, which makes them an ideal tool for obligate biotrophs. Since a
large number of amplicons can be screened in a relatively short period of time, RAPDs are
especially useful in differentiating clonal lineages for fungi that reproduce asexually.
Further, RAPD data are convinient to interpret because they are based on amplification or
non-amplification of specific DNA sequences (amplicons), producing a binary data set that
is easy to enter into a spreadsheet for analysis. But RAPDs have many drawbacks despite

their relative ease of use. There are several technical limitations associated with RAPDs that
make them difficult to reproduce between labs and sometimes within labs. Some of these
limitations can be overcome with proper controls, like replicate DNA preparations, Southern
analysis, and conversion of RAPD amplicons into sequence characterized amplified regions
(SCARs) (Paran and Michelmore, 1993). There also are analytical problems associated with
RAPDs (Lynch and Milligan, 1994). RAPDs have only two alleles (amplification or non-
amplification) for each amplicon locus. This condition is ideal for genetic mapping, but it is
a drawback for the measurement of genetic diversity affected by the number of alleles at a
locus. RAPDs are dominant markers, therefore they cannot differentiate between
homozygotes and heterozygotes without a progeny test. This is not a case with haploid
fungi, but it can be a problem with many basidiomycetes and oomycetes that are
heterokaryons, diploid or polyploid. Some of the analytical problems resulting from
dominance and two alleles per locus can be overcome by increasing the number of
individuals assayed (by 2 to 10x compared to isozymes and RFLPs) and using only RAPD
amplicon loci that have intermediate allele frequencies (Lynch and Milligan, 1994). In spite
of their drawbacks, RAPDs are powerful tools that are especially useful for fungi that are
obligate parasites or that have a population structure composed of clonal lineages. Through
advanced PCR-based markers it may become possible to amplify specific DNA sequences
from soil or root samples and make a direct assessment of the genetic structure of
populations of soil borne fungi without first making pure cultures. But if a fungus can be
cultured readily on artificial media, then RFLPs offer many advantages for population
genetics studies.
RFLPs in nuclear and mitochondrial genomes have been used in many studies of
plant-pathogenic fungi. Since RFLPs are based on DNA-DNA hybridization, they are
technically more difficult than RAPDs but they offer the advantage of being more
reproducible as compared to RAPDs and yet, like RAPDs, RFLPs are easy to interpret. In
addition, they are co-dominant markers and exhibit a potentially unlimited number of alleles
per locus. One disadvantage of RFLPs is that they require relatively large amounts (5 to 10
μg) of DNA from each indi idual, so the fungus must be grown in pure culture prior to
DNA extraction. RFLP analysis requires more technical expertise, including cloning,
Southern blotting, and labeling of probes. RFLPs are most useful for fungi that can be
grown easily in pure culture. Since probes can be chosen to show a high degree of
specificity to the target fungus, some contamination by DNA from other fungi, or bacteria
can be tolerated. The properties of co-dominance and multiple alleles make RFLP markers
advantageous compared to RAPDs for most studies in population genetics.
RFLP fingerprinting technique is regarded as the most sensitive method for strain
identification and several bacterial strains have been widely studied using this technique.
Kabadjova et al., in 2002, devised a rapid PCR-RFLP-based identification scheme for four
closely related Carnobacterium species (C. divergens, C. piscicola, C. gallinarum, and C.
mobile) that are of interest to the food industry. By this method, three of the isolates that
were previously incorrectly identified as C. divergens (INRA 508, INRA 586, and INRA
515) were reclassified as C. piscicola. Similarly, four isolates previously misidentified as C.
piscicola (INRA 545, INRA 572, INRA 722, and ENSAIA 13) were reclassified as C.
divergens based on the patterns obtained by the 16S-23S ISR-RFLP methods. Wang et al.,
in 2000 and Penrose et al., in 2000, have already proved the role of PCR and Southern
hybridization in assessment of the effect of introduction of 1-aminocyclopropane-1-
carboxylic acid deaminase genes on disease-suppressive capabilities of Pseudomonas
fluorescens strain CHAO. Manceau and Horvais, 1997, used RFLP analysis of rRNA
operons to assess phylogenetic diversity among strains of Pseudomonas syringae pv.
tomato. They successfully established the close relationships existing between P. syringae
and P. viridiflava species.

The nucleotide sequence of 16S rDNA has been wide accustomed perceive
phylogenetic relationships among prokaryotes (Barry et al., 1990; Weisburg et al., 1991).
Graham et al., 1991 applied phylogenetic relationships to species-specific identification of
bacterium by hybridizing between DNA and 16S rRNA, and orientating the nucleotide
sequences of 16S rDNA. The phylogenetic relationships of assorted true bacteria (Vibrio)
species have additionally been characterised thoroughly by using the sequences of 16S
rDNA (Dorsch et al., 1992; Kita-Tsukamoto et al., 1993). However, these processes are
certainly inappropriate for routine identification of microbial strains because of the length of
time needed. Therefore, restriction fragment length polymorphism (RFLP), by utilizing 16S
rDNA genes amplified by polymerase chain reaction (PCR), has been introduced for speedy
and accurate identification of bacterium at the species level (Ralph et al., 1993; Choudhury
et al., 1994; Moyer et al., 1994; Urakawa et al., 1999). The randomly amplified polymorphic
DNA (RAPD) PCR technique, developed to be used in the detection of V. vulnificus, also
clearly differentiated this true bacteria (Vibrio) species from the other members of the genus
Vibrio (Warner and oliver, 1999).
Molecular biological methods that utilize 16S ribosomal ribonucleic acid (rRNA)
gene sequences are commonly used for the identification and classification of
microorganisms. rRNA sequences are primarily used in ranking biological phylogenetic
nomenclature including that of microorganisms (Hwang et al., 2011). 16S rRNA is a type of
RNA that plays a major role in synthesis of protein macromolecules (Jayaraman et al.,
1981). Since the mechanism of protein synthesis does not differ much from one organism to
another, the RNA that assists the protein production also does not vary allot. The variations
generally occur in predictable locations. It is observed that the nucleotide sequences of some
portions of the 16S ribosomal deoxyribonucleic acid (rDNA) are highly conserved. An
advantage of sequencing ribosomal RNA (rRNA) genes is that the presence of preserved
region (for instance, 18S rRNA in eukaryotes and the 16S rRNA in prokaryotes) adjacent

with extremely variable segments (such because the internal transcribed spacers) permitting
the resolution of relationships among each distantly and closely organic process connected
species, respectively.
Banking on above information and large scale finding of different authors, we
conclude that recognition of all three bacteria (Brevundimonas diminuta, Bacillus
thuringiensis and Bacillus cereus) and all three fungi (Penicillium citrinum, Alterneria
alternata and Penicillium meleagrinum var. viridiflavum) from the Mandeepkhol cave are
justified. The phylogenetic relationships of organism are also scientifically justified. Thus
we conclude that the cave is plenty of microbial diversity irrespective of spleleological
conditions. This is indication of old existence of the cave which needs further geological
investigation.

Conclusion
Speleology is one of the most interesting field in science that is attracting attention
of a large number of researchers all over the world. Each cave, whether it is frequently
visited by visitors or remain untraversed , has got its own unique ecological niche. Every
cave has got its own geographical, geological, atmospheric and biological features on the
basis of which they differ from one another.
In present studies, the selected Mandeepkhol cave, located in deep forest and not
frequently visited by human population, provides shelter to a large number of bats and
receives a huge amount of dried plant parts alongwith water streams from surrounding hilly
area. The guano and plant parts, deposited inside the cave, serve as substrates for the growth
of variety of molds and bacterial decomposers which degrade the complex materials at quite
faster rate in an atmosphere where 100% humidity and a temperature of 26 ºC -28 ºC prevail
almost throughout the year.
Present studies, related to microbial diversity, revealed that Mandeepkhol cave
provides shelter to variety of microorganisms. Our study in this cave will help a
microbiologist to know about the diversity of fungi and bacteria present inside cave. During
study we have got different species of bacteria and fungi which were further evaluated for
their potency to degrade pectin, cellulose and lignin. Results showed that among fungi -
Alternaria alternata , Penicillium citrinum , Penicillium meleagrinum var. viridiflavum,and
bacteria - Brevundimonas diminuta, Bacillus cereus, Bacillus thuringiensis showed quite
higher potency for degradation of pectin, cellulose and lignin. Through molecular studies
(RFLP/ RAPD) microorganisms got genetically marked. Use of these microorganisms will
help in faster degradation of complex compounds and plant biomass in mesophilic
conditions, thus may help in waste management and recycling of carbon compounds. In this
way these organisms may be instrumental in organic farming in mesophilic conditions, as
organic farming requires faster rate of degradation for manure formation.

These studies will pave ways for genetic manipulation in these potent decomposers and will
be helpful in raising such strains which can degrade variety of complex compounds.