residential use of shallow geothermal and solar energy in...
TRANSCRIPT

Copyright UCT
i
Residential use of Shallow Geothermal and Solar Energy in South Africa: A comparative
analysis
Research Report Proposal
Presented to:
The Graduate School of Business
University of Cape Town
In partial fulfilment
Of the requirements for the
Masters of Business Administration Degree
by
Gerhard Maritz
December 2011
Supervisor: Barry Standish

Copyright UCT
i
Abstract
“Renewable energy, once the only source of energy available to humans, is currently
undergoing a renaissance” (Nadaï & van der Horst, 2010, p. 144). Climate change is the
most urgent current and future challenge facing humanity. National and supra-national
energy policies are at the core of the strategies developed in order to face it (Nadaï & van der
Horst, 2010, p. 144). Global utilisation of fossil fuels or energy needs is rapidly resulting in
critical environmental problems throughout the world (Demirbas, 2009).
Today, we have mainly three energy sources available to humankind, fossil, renewable and
fissile. Renewable energy if employed correctly is the only completely sustainable energy
and an infinite resource of primary energy. Petroleum reserves are estimated to be depleted
in less than 50 years at the present rate of consumption (Sheehan, Cambreco, Duffield,
Garboski, & Shapouri, 1998). The declining availability of fossil fuels will cause increases in
energy costs, and the scarcity of energy could lead to great societal unrest. Energy is
considered a prime agent in the generation of wealth and a significant factor in economic
development in that there is a strong relationship between the availability of energy and
economic activity (Kalogirou, 2004; Halliday, Beggs, & Sleigh, 2002). To continue to grow
and improve as a global society, we need to find the answers to tomorrow’s energy needs.
Renewable energy as an alternative to fossil fuel based energy is becoming more feasible and
attractive as an alternative by the day. Costs of renewables are on the decrease as technology
advances, their efficiencies are increasing, and the more the fossil fuel based energy costs
increases, the more resources will be poured into research and development of renewable
energy sources. This will make renewable energies ever more competitive and cost effective.
The research area focussed on two renewable energy sources as sustainable and clean energy
alternatives for the future. The focus of this report was to determine the viability of these
renewable energies on the residential household or small commercial application.
Conventional means of generating electricity are becoming ever more expensive. The South
African economy has had to endure far above inflation increases to their energy bills, and
these increases lead to renewable energy sources becoming ever more attractive to the end
user, despite in many cases substantial initial costs.

Copyright UCT
ii
This report proves that renewable energy is the way for the future. It does this by justifying
the substantial initial installation costs of renewable energy systems and proving that these
costs, recovered over the long term, is a much cheaper, cleaner and better alternative to that
of conventianal energy means.

Copyright UCT
iii
PlagiarismDecleration
I know that plagiarism is wrong. Plagiarism is to use another’s work and pretend that it is
one’s own.
I have used the APA convention for citation and referencing. Each contribution to, and
quotation in, this report from the work(s) of other people has been attributed, and has been
cited and referenced.
I certify that this submission is my own work.
I have not allowed, and will not allow, anyone to copy my work with the intention of passing
it off as his or her own work.
G. Maritz

Copyright UCT
iv
Contents
Abstract ....................................................................................................................................... i
Plagiarism Decleration ............................................................................................................. iii
Contents .................................................................................................................................... iv
List of Tables ........................................................................................................................... vii
List of Figures ........................................................................................................................... ix
List of Abbreviations ................................................................................................................. x
1 Introduction ........................................................................................................................ 1
1.1 Research area and problem ......................................................................................... 2
1.2 Research questions and scope ..................................................................................... 3
1.3 Research assumptions ................................................................................................. 4
2 Literature Review............................................................................................................... 4
2.1 Why Renewable Energy? ............................................................................................ 6
2.2 The Six Main Technologies ........................................................................................ 8
2.2.1 Bioenergy ............................................................................................................. 9
2.2.2 Direct solar energy ............................................................................................. 10
2.2.3 Geothermal Energy ............................................................................................ 10
2.2.4 Hydropower and Ocean Energy ......................................................................... 11
2.2.5 Wind Energy ...................................................................................................... 11
2.3 Geothermal Energy and Shallow Geothermal Technology ....................................... 12
2.3.1 Shallow Geothermal Technology ...................................................................... 13
2.3.2 Main Geothermal Heat Pump Systems .............................................................. 14
2.3.3 Heat Pumps ........................................................................................................ 15
2.3.4 How it works ...................................................................................................... 15
2.4 Direct Solar Energy ................................................................................................... 17
2.4.1 Solar as Electricity ............................................................................................. 18
2.4.2 Solar Irradiance .................................................................................................. 19

Copyright UCT
v
2.4.3 Solar Efficiency ................................................................................................. 20
2.4.4 Solar as Heating and Cooling ............................................................................ 21
2.5 The South African Power Sector ............................................................................... 25
2.5.1 Present structure of the Electricity Supply Industry (ESI)................................. 25
2.5.2 NERSA and its role in South Africa .................................................................. 26
2.5.3 Context for renewables in South Africa ............................................................. 27
2.5.4 Renewable Energy Feed-In Tariff (REFIT) ....................................................... 27
2.6 Conclusion ................................................................................................................. 28
3 Research Methodology .................................................................................................... 29
3.1 Research approach and strategy ................................................................................ 29
3.2 Research assumptions ............................................................................................... 29
3.3 Research design, data collection methods and research instruments ........................ 30
3.4 Sampling.................................................................................................................... 31
3.5 Research criteria ........................................................................................................ 31
3.6 Data Analysis Methods ............................................................................................. 32
3.7 Limitations ................................................................................................................ 33
4 Research Findings, Analysis and Discussion................................................................... 34
4.1 Cost Calculations....................................................................................................... 35
4.1.1 Electricity Costs ................................................................................................. 35
4.1.2 Geothermal Costs ............................................................................................... 39
4.1.3 Photovoltaic Costs ............................................................................................. 43
4.2 Financial Analyses .................................................................................................... 46
4.3 Sensitivity analyses ................................................................................................... 54
4.4 Cost Benefit Analysis ................................................................................................ 62
4.4.1 Background ........................................................................................................ 62
4.4.2 Steps in CBA...................................................................................................... 62
4.4.3 Prices in CBA .................................................................................................... 63

Copyright UCT
vi
4.4.4 Social discount rate ............................................................................................ 64
4.4.5 Costs relating to CBA ........................................................................................ 64
4.4.6 Benefits .............................................................................................................. 65
4.4.7 CBA Calculations .............................................................................................. 66
4.5 Research limitations .................................................................................................. 69
5 Research Conclusions ...................................................................................................... 69
6 Future Research ................................................................................................................. I
Appendices ................................................................................................................................ II
Appendix A ........................................................................................................................... II
Appendix B ........................................................................................................................... V
Appendix C .......................................................................................................................... VI
7 Bibliography .................................................................................................................. VII

Copyright UCT
vii
ListofTables
Table 1: End use electricity usage in South Africa (Government Gazette, 2008) ................... 26
Table 2: Assumptions in calculating costs ............................................................................... 35
Table 3: NERSA tariff block benchmarks (NERSA, 2010) .................................................... 36
Table 4: Revised benchmark weights (NERSA, 2010) ........................................................... 36
Table 5: Residential inclining block tariffs for Eskom residential customers (NERSA, 2010b).
.................................................................................................................................................. 37
Table 6: Price calculation legend (NERSA, 2010) .................................................................. 37
Table 7: Electricity percentage increase calculation ................................................................ 38
Table 8: Electricity price increase by block ............................................................................. 39
Table 9: Typical hot water geyser statistics (Kwikot, 2010) ................................................... 41
Table 10: Typical heating and cooling capacities of a split type air conditioner (Chigo South
Africa, 2011) ............................................................................................................................ 42
Table 11: Shallow Geothermal Statistics, adapted from (Kyasol, 2011), (Carrier, 2011) ....... 43
Table 12: PV cost calculation assumptions ............................................................................. 45
Table 13: PV Energy system requirements .............................................................................. 46
Table 14: Shallow Geothermal financial projections ............................................................... 48
Table 15: Electric Geyser financial projections ....................................................................... 49
Table 16: Air Conditioning financial projections .................................................................... 50
Table 17: PV financial projections (REFIT and no REFIT) .................................................... 51
Table 18: Shallow Geothermal financial viability calculation ................................................ 52
Table 19: Shallow Geothermal sensitivity analysis for 2 hours per day utilisation ................. 55
Table 20: Air conditioning and geyser system sensitivity analysis for 2 hours per day
utilisation.................................................................................................................................. 57
Table 21: Total cost per m2 over life of system ....................................................................... 57
Table 22: Total cost per m2 over life of system ....................................................................... 58
Table 23: Steps in CBA (Mullins, Gehrig, Mokaila, Mosaka, Mulder, & van Dijk, 2006, p.
61) ............................................................................................................................................ 63
Table 24: Environmental considerations per 1 kWh electricity generation ............................. 65
Table 25: Environmental costs of coal fired electricity generation ......................................... 66
Table 26: CBA values .............................................................................................................. 67
Table 27: Shallow geothermal CBA results ............................................................................. 68
Table 28: PV CBA results........................................................................................................ 68

Copyright UCT
viii
Table 29: BCR Results............................................................................................................. 69
Table 30: Summary of Tariff objectives (Government Gazette, 2008) ................................... IV
Table 31: Determination of the municipal tariff guideline and the revision of municipal tariff
benchmarks (NERSA, 2010) .................................................................................................... V
Table 32: Average daylight hours and sunset times for Johannesburg, South Africa (South
African Astronomical Observatory (SAAO), 2011) ................................................................ VI

Copyright UCT
ix
ListofFigures
Figure 2-1: Global CO2 emissions (Boden & Marland, 2010) .................................................. 5
Figure 2-2: Share of primary energy sources in world electricity generation in 2008
(International Energy Agency, 2010) ........................................................................................ 8
Figure 2-3: Shares of energy sources in total global primary energy supply in 2008 (IPCC,
2011). ......................................................................................................................................... 9
Figure 2-4: Closed loop heat pump systems, vertical and horizontal applications (IEA Heat
pump centre) ............................................................................................................................ 16
Figure 2-5: Solar electricity generation ................................................................................... 18
Figure 2-6: The global average solar irradiance (W/m2) at the earth’s surface (a) December,
January and February, and (b) June, July and August (ISCCP Data Products, 2006). ............ 20
Figure 2-7: Illustration of a flat plate collector (Arvizu, et al., 2011) ..................................... 24
Figure 5-1: Cumulative financial projections (Shallow Geothermal vs. Geyser and Air
conditioner) .............................................................................................................................. 53
Figure 5-2: Cost per area compared to utilisation time ............................................................ 59
Figure 5-3: Cost per area of geothermal, air conditioning and geysers as a function of
utilisation time ......................................................................................................................... 60
Figure 5-4: Sensitivity of Geothermal cost vs. PV night usage hours ..................................... 61
Figure 8-1: Break-even points of different systems ................................................................. 70
Copyright UCT
x
ListofAbbreviations
BCR - Benefit cost ratio
CBA - Cost benefit analysis
COP - Coefficient of performance
CPI - Consumer price index
CSP - Concentrated solar power
DME - Department of energy
ESI - Electricity supply industry
GHG - Greenhouse gas emissions
GHP - Geothermal heat pump
GSHP - Ground source heat pump
GW - Giga watt
GWh - Giga watt hours
IPCC - Intergovernmental panel on climate change
IPP - Independent power producer
IRP - Integrated resource plan of 2010
IRR - Internal rate of return
kW - Kilo watt
kWh - Kilo watt hours
kWp - Kilowatt peak
MFMA - Municipal Finance Management Act
MTBPS - Medium Term Budget Policy statement
MW - Megawatt
NERSA - National energy regulator of South Africa
NPV - Net present value
PV - Photovoltaic
RE - Renewable energy
REFIT - Renewable energy feed-in tariff
SRREN - Special report on Renewable energy sources

Copyright UCT
1
1 Introduction
“Renewable energy, once the only source of energy available to humans, is currently
undergoing a renaissance. The international Kyoto process and the work of the Inter-
governmental Panel on Climate Change (IPCC) have progressively presented the evidence of
global warming as the future and most urgent challenge for humanity. National and supra-
national energy policies are at the core of the strategies developed in order to face it.
Officially driven by a range of objectives, such as the security of the energy supply,
environmental concerns, the development of export technologies or rural development, state
support for renewable energies has been greatly increased in most developed countries and
many developing countries too” (Nadaï & van der Horst, 2010, p. 144).
Today, we have mainly three energy sources available to humankind, fossil, renewable and
fissile. Typical examples of fossil sources are coal, petroleum, natural gas, bitumen’s, oil
shale and tar sands. Renewable energy sources are biomass, solar energy, wind energy,
geothermal energy and hydropower. Fissile energy refers to uranium and thorium. Fossil
fuel, of which oil is by far the most important component, is a finite resource. Renewable
energy on the other hand, if employed correctly is completely sustainable and an infinite
resource of primary energy. According to Sheehan et al. (1998) petroleum reserves are
estimated to be depleted in less than 50 years at the present rate of consumption. The global
peak in oil production has been estimated between 1996 and 2035; we are in the middle of
this estimate at the moment (Demirbas, 2009). If the global growth rate of about 2% a year
of primary energy use continues, it will mean a doubling of energy consumption by 2035
relative to 1998, and a tripling by 2055 (UNDP, 2000).
A very negative by product of energy production from fossil fuels is greenhouse gasses.
These gasses are harmful to the environment and have contributed greatly to global warming.
This is echoed by Demirbas (2009) “Global utilisation of fossil fuels or energy needs is
rapidly resulting in critical environmental problems throughout the world.”
Furthermore, the declining availability of fossil fuels will cause increases in energy costs, and
the scarcity of energy could lead to great societal unrest.

Copyright UCT
2
Renewable energy is at present a sustainable answer to the growing problem of fossil fuels.
They are clean, inexhaustible primary energy sources. The literature suggests that already in
2001 biomass, wind and geothermal energy have been commercially competitive
(Friedleifsson, 2001). Energy is a very important factor in society’s development, and will
continue to be so. Energy is considered a prime agent in the generation of wealth and a
significant factor in economic development in that there is a strong relationship between the
availability of energy and economic activity (Kalogirou, 2004; Halliday, Beggs, & Sleigh,
2002). Thus to continue to grow and improve as a global society, we need to find the
answers to tomorrow’s energy needs.
1.1 Researchareaandproblem
The research area focussed on two renewable energy sources as sustainable and clean energy
alternatives for the future. A comparison was made between the two on a number of criteria
to evaluate and determine the most effective and advantageous option for residential
households in South Africa. It is important to relate these technologies in terms of cost
effectiveness and economic viability to that of current energy costs, i.e. mostly fossil fuel
based energy generation, which is pertinent to the South African case. The background being
laid, the two technologies being focused on and compared will be discussed and analysed in
depth. Geothermal energy, which is essentially energy from the earth; and in particular
shallow geothermal energy through shallow geothermal heat pumps will be related to direct
solar energy, which is essentially energy from the sun, being used in heating and cooling.
The Intergovernmental panel on climate change (IPCC) assesses renewable energy sources as
mitigation to climate change. Within their report, Special Report on Renewable Energy
Sources (SRREN) (IPCC, 2011) they look at a range of aspects concerning each renewable
energy source. These include resource potential, technology and applications, status of the
current global market, environmental and social impacts, and prospects for technology
improvement, cost trends and potential deployment. This report will look at similar aspects
to that of the IPCC, and in particular endeavours to determine the economic and financial
feasibility of shallow geothermal and direct solar energy.

Copyright UCT
3
1.2 Researchquestionsandscope
The focus of this report was to determine the viability of these renewable energies on the
residential household or small commercial application. Large scale energy generation
projects will not form part of the scope of this research report. Traditional geothermal energy
(as compared to shallow geothermal heat pumps) generation compared to large photovoltaic
solar energy farms will be a better comparison in this regard.
The two renewable energy sources can be used in a variety of ways. The specific means of
application pertinent to this research report, and which is also the most common application
of these energies, will be direct space or water heating and cooling. More specifically
looking at either just direct heating and cooling of households through shallow geothermal
technology or through solar energy or through electricity generation through solar energy
technology and then indirect heating and cooling of these households.
The main fields of technology within geothermal and solar energy are shallow geothermal
heat pump technology and secondly electricity generation through photovoltaic solar thermal
conversion or direct heating and cooling applications from solar energy.
Renewable energy as an alternative to fossil fuel based energy is becoming more feasible and
attractive as an alternative by the day. Costs of renewables are on the decrease as technology
advances, their efficiencies are increasing, and the more the fossil fuel based energy
increases, the more resources will be poured into research and development of renewable
energy sources. This will make renewable energies ever more competitive and cost effective.
In South Africa electricity costs have increased 3 to 4 times that of inflation, and will
continue to do so for the next two to three years (NERSA, 2010b). NERSA, the National
Energy Regulator of South Africa, approved increases of 24.8% for 2011, 25.8% for 2012
and 25.9% for 2013, an increase from 41.57 c/kWh to 65.85 c/kWh (Eskom, 2011). These
are crippling increases for the South African economy, and these increases lead to renewable
energy sources becoming ever more attractive to the end user, despite in many cases
substantial initial costs.
The research is limited in scope in the fact that it doesn’t take all renewable energies into
consideration. The purpose of this report was only to ascertain whether geothermal and solar
energy is a viable option for heating and cooling in the residential household. A number of
other technologies might be viable, or even more suitable in this particular application.
Copyright UCT
4
Further limitations are the fact that this is limited to the South African case, where sunlight is
abundant and therefore solar energy is a viable option. This is not the case in many countries,
and the report will not prove beneficial to these environments.
1.3 Researchassumptions
The main assumptions being made in this research report are that fossil fuel based energy is
becoming more expensive, as demand increases and supply decreases. This is due to the fact
that it is assumed, fairly, that fossil fuel sources are a finite source, which has been
substantiated in the literature on various occasions. Another assumption being made is that
due to the fact that fossil fuel based energy is increasing in cost, alternatives such as
renewable energy are becoming more competitive. Also, as the costs of fossil fuels increase
and in turn increase energy generated from them, so would the amount of resources increase
to research and further develop renewable energy technologies. This will effectively bring
down the costs of these renewable technologies. Furthermore, there is continuously
increasing pressure on governments and societies to be more environmentally astute. This
social pressure would favour renewable energies.
2 LiteratureReview
The purpose of this section is to explore what the literature suggests with regards to
renewable energies, firstly from a broad perspective and then by narrowing down to the
renewable energy technologies under comparison. Furthermore, the literature will be able to
give meaningful background, both technological and commercial, on a number of aspects
regarding the two technologies. The literature could open up new avenues of thought,
previously not taken into consideration, or guide this research into a more focused area.
Either way, the literature will make it possible to make a more informed and relevant
comparison with a credible outcome.
The literature section will firstly look at all the different renewable energy technologies
available. Secondly, this section will guide the reader through the shallow geothermal and
solar photovoltaic (PV) energy technologies. Their advantages and disadvantages will be
discussed, their functionality explained, and lastly their suitability to heating and cooling will
be explained.

Copyright UCT
5
Renewable energy is becoming increasingly more important in our basket of energy
generation. There are a variety of reasons to lend importance to renewable energy and they
range from a finite and depleting fossil fuel source to concerns about global warming and its
consequences.
The Working Group III Special Report on Renewable Energy Sources and Climate Change
Mitigation (SRREN) presents an assessment of the literature on the scientific, technological,
environmental, economic and social aspects of the contribution of six renewable energy (RE)
sources to the mitigation of climate change. These six RE sources are bioenergy, direct solar
energy, geothermal energy, hydropower, ocean energy and wind energy. Of particular
importance to this research topic is the source of geothermal energy and direct solar energy.
This will be further discussed, compared and narrowed down later on in the literature review.
There is increasing demand for energy and all its associated services. All societies require
energy services to meet basic human needs. These range from lighting and cooking to
mobility and communication. The quality of energy is important to the development process
of societies (Cleveland, Costanza, Hall, & Kaufmann, 1984). Since the dawn of the industrial
age global use of fossil fuels have dominated the energy supply. This has led to a rapid
growth in carbon dioxide emissions over the years as shown in Figure 2-1.
Figure 2-1: Global CO2 emissions (Boden & Marland, 2010)
Greenhouse gas emissions (GHG) contribute greatly to climate change and the IPCC Fourth
Assessment Report concluded that “Most of the observed increase in global average
temperature since the mid-20th century is very likely due to the observed increase in
Copyright UCT
6
anthropogenic greenhouse gas concentrations.” Concentrations of CO2 had reached levels of
390 ppm or 39% of that of pre-industrial levels at the end of 2010. There are a number of
options for lowering GHG emissions. These options include energy conservation and
efficiency, fossil fuel switching, renewable energies and nuclear and carbon capture and
storage (IPCC, 2011). Renewable energy is an ideal technology to cope with reducing and
even eliminating GHG emissions, thereby mitigating climate change. Apart from this there
are a wider range of benefits associated with renewable energies which may, if implemented
properly, contribute to social and economic development, energy access, a secure energy
supply, and reducing negative impacts on the environment and health (IPCC, 2011).
2.1 WhyRenewableEnergy?
Energy is the lifeline of modern society. Without the ever increasing reliance on renewable
sustainable energy sources society will run out of sources of energy as traditional fossil fuels
will eventually be depleted. Society is becoming ever more aware of our environment and
the need for a green and sustainable reality, is playing at the minds of all citizens of this
global world of today. Renewable energy has the potential to solve a range of problems
facing society today (Guardiola, Gabay, & Moskowitz, 2009). The international Kyoto
process and the work of the Inter-governmental Panel on Climate Change (IPCC) have
progressively presented the evidence of global warming as the future and most urgent
challenge for humanity. National and supra-national renewable energy policies are at the core
of the strategies developed in order to face it (Nadaï & van der Horst, 2010).
“Renewable energy solves problems ranging from environmental safety to economic security.
Many people are beginning to seek alternative methods of fuelling their homes, cars, and
businesses, substantial conservation and transitioning toward using renewable energy may aid
the environment. When executed sufficiently well, the use of renewable energy can forestall
economic crises that come from accelerated demand of a scarce resource in times of
uncertainty. However, those methods must not only be good for the environment, but they
must also meet the economic demands and emotional considerations of today’s consumers”
(Guardiola, Gabay, & Moskowitz, 2009, p. 254).
The literature suggests a whole range of reasons to justify the increasing importance of
renewable energy to ensure the continued longevity of our society and our ever increasing

Copyright UCT
7
hunger for energy. “Traditional fuels are becoming increasingly scarce and prices more
unpredictable” (Kaygusuz, 2008, p. 348). The need to regulate and curb the increase in
greenhouse gas emissions is becoming ever more relevant and urgent. With current
technology that leaves us as a modern society and the total global population with only two
choices, either renewable energy or nuclear energy (Kaygusuz, 2008). Of these two options,
renewable energy plays an integral role in sustainable energy for future generations to come.
The literature has varying opinions about nuclear energy. “Advocates of nuclear power argue
that it is a proven technology that can provide cheap and reliable energy without contributing
to climate change. Opponents disagree and argue that it is better to invest in conservation and
alternative energy sources given the pollution, risks and costs associated with the mining,
storage, shipping and disposal of radioactive fuels and waste. Both positions should be
examined carefully” (Taylor, 2007). Nuclear energy would be a step backwards that would
leave a toxic legacy for future generations (O’Brien & O'Keefe, 2006). Nonetheless, the
purpose of this section is only to make the reader aware that there is continuing debate over
renewables and nuclear energy. Both have a role to play in the energy basket of the future.
However, nuclear energy would not be an entirely renewable energy source, due to the fact
that radioactive waste does get produced in the process. This radioactive waste currently has
no means of disposal other than storage. Nuclear energy will therefore be an unsustainable
option according to the original definition of sustainability. The definition goes back to the
Bruntland Commission (1987; reinforced at the Rio 1991 and Kyoto 1997 Summits):
“Meeting the needs of the present generation without compromising the needs of future
generations.”
Moomaw, et al., (2011) states that for development to be sustainable, delivery of energy
services needs to be secure and have low environmental impacts. Sustainable social and
economic development requires assured and affordable access to the energy resources
necessary to provide essential and sustainable energy services. This may mean the application
of different strategies at different stages of economic development.
Nfah, et al., (2007) and Kankam and Boon (2009) states that a major shift in how energy is
produced and utilized is necessary to maintain both a sustainable economy that is capable of
providing essential goods and services to the citizens of both developed and developing
countries, and to maintain a supportive global climate system. According to the IPCC Fourth
Assessment Report (AR4), fossil fuels provided 85% of the total primary energy.

Copyright UCT
8
Furthermore, the combustion of fossil fuels accounted for 56.6% of all anthropogenic
greenhouse gas emissions (GHG) Rogner et al., 2007). Renewable energy technologies,
which release much lower amounts of CO2 than fossil fuels are growing and contributes
15.9% to the world primary energy source supply and constitutes 19% of global electricity
energy usage (International Energy Agency, 2010).
Figure 2-2: Share of primary energy sources in world electricity generation in 2008 (International Energy Agency, 2010)
2.2 TheSixMainTechnologies
Renewable energies are used in a number of ways. Renewable energies can supply
electricity, thermal energy or mechanical energy as well as produce fuels that are able to
satisfy multiple energy service needs. “Renewable energy is any form of energy from solar,
geophysical or biological sources that is replenished by natural processes at a rate that equals
or exceeds its rate of use. Renewable energy is obtained from the continuing or repetitive
flows of energy occurring in the natural environment and includes resources such as biomass,
solar energy, geothermal heat, hydropower, tide and waves and ocean thermal energy, and
wind energy. However, it is possible to utilise biomass at a greater rate than it can grow, or to
draw heat from a geothermal field at a faster rate than heat flows can replenish it” (Moomaw,
et al., 2011). By utilising energy at a greater rate than it can grow or be replenished, it will be
utilised in an unsustainable manner, as is the case with fossil fuels. On the other hand, direct

Copyright UCT
9
solar energy is completely sustainable as the utilisation of this technology has no bearing on
the rate at which it reaches the earth.
Various types of renewable energies can supply electricity, thermal energy and mechanical
energy, as well as produce fuels that are able to satisfy multiple energy service needs. They
can be applied in small or large scales, centralized or decentralized and in rural or urban
areas. Renewable energies are in varying phases of technical maturity, some are
commercially deployed and some service special niche markets. The contribution of each of
these renewable energies to the global energy supply is illustrated in Figure 2-3.
Figure 2-3: Shares of energy sources in total global primary energy supply in 2008 (IPCC, 2011).
2.2.1 Bioenergy
Bioenergy is a renewable energy produced from biomass. This is by far the largest
contributor to the total global energy supply of the renewable energies in use today and
contributes 10.2% (Figure 2-3) to the world’s energy basket. Biomass is typically organic
material such as trees, plants and waste materials such as wood waste from mills, municipal
wastes, manure, landfill gas, and methane from wastewater treatment facilities known as
feedstocks. Through a variety of processes, these feedstocks can be directly used to produce
electricity or heat, or can be used to create gaseous, liquid, or solid fuels. The range of
bioenergy technologies is broad and the technical maturity varies substantially.
Copyright UCT
10
2.2.2 Directsolarenergy
Solar energy is abundant and a virtually inexhaustible resource of energy. Direct solar
energy technologies harness the energy of solar irradiance to produce electricity using
photovoltaic and concentrating solar power, to produce thermal energy through either heating
or cooling, which is also the main application of geothermal energy, and lastly it can be used
to meet direct lighting needs. Solar energy has a very small environmental impact and offers
opportunities for positive social impacts.
Public policies have in many cases aided the potential to make using solar energy more
attractive through cost reductions. An added advantage of solar technology is that it can be
used at both centralised and decentralised applications, i.e. large solar power generating
stations to the individual household applicant.
Based on futuristic trends, Muneer et al. (2005) are of the opinion that it is foreseen that by
the year 2025, PV electricity would be more economical than fossil fuel electricity. PV, and
inherently all renewable energies will therefore start playing a very important role in the
basket of a balanced energy portfolio. As fossil fuels costs increase, solar energy generation
will inherently become more competitive, as at the time of writing solar energy still cannot
compete directly with fossil fuels on a financial basis. However, fossil fuel resources are of a
finite extent, and as resources become more scarce, costs will rise accordingly, making the
solar energy alternative increasingly attractive. Fossil fuels are converted into energy
through combustion, which in turn gives you greenhouse gases and other harmful
environmental pollutants. In direct contrast to this, solar photons are infinite and are
abundant all over the world. The use of solar energy as an energy source does not threaten
health or the micro and macro climates. “The solar resource's magnitude, wide availability,
versatility, and benign effect on the environment and climate make it an appealing energy
source” (Crabtree & Lewis, 2007, p. 38).
2.2.3 GeothermalEnergy
The ultimate basis of geothermal energy is the immense heat store in the earth’s interior.
This heat is extracted from geothermal reservoirs beneath the surface of the earth by a variety

Copyright UCT
11
of means. Once this heat has been brought to the surface, this heat energy can be used to
generate electricity, or at a smaller scale for heating and cooling purposes.
Geothermal energy can be utilised in a sustainable manner, but can also be over utilised,
making it unsustainable. Geothermal energy extracted from reservoirs can be done at a rate
that cannot be sustained for long periods of time. A balance needs to exist between the
surface discharge of the heat and the rate at which the fluid is reheated naturally at depth.
“Any balanced fluid/heat production by a geothermal utilisation scheme, i.e. which does not
produce more than the natural recharge resupplies, can be considered as fully renewable”
(Stefansson, 2000).
Hydrothermal power plants used with geothermal energy are mature technologies and
produce a constant power output, unlike solar energy which is cyclical.
2.2.4 HydropowerandOceanEnergy
Although hydropower and ocean energy don’t form part of the scope of this report, it is
regarded as one of the renewable technologies that could successfully form part of an energy
portfolio. Hydropower is an energy source where power is derived from the energy of water
moving from higher to lower elevations. It is a proven, mature, predictable and typically price
competitive technology. Hydropower has among the best conversion efficiencies of all
known energy sources (about 90% efficiency, water to wire) (Kumar, et al., 2011).
The ocean is vast and powerful and has huge potential stores of energy in the form of heat,
currents, waves and tides to meet worldwide demand for power. The energy can be extracted
and transformed to provide electricity, thermal energy or potable water. Unfortunately there
are huge challenges associated to extracting this potential energy from the oceans to make it
viable. To date ocean energy only supplies a miniscule proportion of the worldwide demand
(Pelc & Fujita, 2002).
2.2.5 WindEnergy
Power generation through wind energy is at a technological mature stage, which leads to
good infrastructure and at many sites can compete on cost in relation to traditional fossil
fuels.

Copyright UCT
12
Wind energy is created by utilising wind turbines to convert the kinetic energy of the wind
into mechanical energy and then converting the mechanical energy into electrical energy.
The mechanical energy is produced by large rotating blades of a turbine that is rotated by the
wind.
These turbines can be located on a variety of sites, and up to date have predominantly been
used at only on shore locations. There is huge potential in offshore wind energy technology
and this is currently an area of continued technical advancement (IPCC, 2011). Wind energy
is a variably and relatively unpredictable energy source, similar to solar energy, but offshore
wind farms do reduce this variability due to greater consistency in wind found offshore.
2.3 GeothermalEnergyandShallowGeothermalTechnology
Geothermal systems occur in a number of geological environments, with variations in the
temperatures and depths of these reservoirs. The geothermal systems can be divided into
three main categories according to their temperature and then further divided into the way the
heat exchange takes place within these systems to facilitate heat transfer and subsequent
energy conversion or electricity generation. Geothermal fields can be found as either high-,
intermediate or low temperature fields (Goldstein, et al., 2011).
The high temperature fields, with temperatures in excess of 180°C, are usually associated
with hydrothermal systems that have experienced recent volcanic activity, or are found at
crustal and mantle hot spot anomalies. The intermediate (100 to 180°C) and low temperature
systems (<100°C) are also found in continental settings, where above-normal heat production
through radioactive isotope decay increases terrestrial heat flow or where aquifers are
charged by water heated through circulation along deeply penetrating fault zones (Goldstein,
et al., 2011). It is possible for all three these geothermal fields to be utilised for both power
generation and the direct use of heat (Tester, Drake, Golay, Driscoll, & Peters, 2005)
Geothermal systems can be divided into either convective or hydrothermal systems,
conductive systems and deep aquifers. Examples of hydrothermal systems are liquid and
vapour or steam dominated types whereas conductive systems include hot rock and magma
over a range of temperatures (Mock, Tester, & Wright, 1997). Deep aquifers contain

Copyright UCT
13
circulating fluids in porous media or fracture zones, but lack a localized magmatic heat
source (Goldstein, et al., 2011).
Geothermal energy can be utilised and is only currently practically useable in mainly two
ways, and only differing in the way they extract heat from the earth. These are for electrical
power generation, for direct use of heat, or for combined heat and power cogeneration
(Goldstein, et al., 2011). Geothermal heat pump technologies are a further application of
direct use, and it is this type of use that this report focuses on. In theory, by utilising the
direct use of the heat, electrical power costs can be saved. Geothermal heat pump technology
is the only technology viable for the individual household, as all the other forms of
geothermal technology are huge undertakings, both from a financial and technological point
of view.
2.3.1 ShallowGeothermalTechnology
The only viable option from geothermal technology that makes economic and practical sense
for the individual household or small commercial user is shallow geothermal technology, also
known as geothermal heat pumps (GHP) or ground source heat pumps (GSHP). GSHP
technology extracts heat from the earth at very shallow depths as compared to traditional
geothermal energy generation projects. These shallow depths make it economically
accessible for individuals to employ this technology. Traditional geothermal energy
generation projects extracts heat from the earth where figures of a few thousand meters are
common depths. The reason for this is that for large energy generation projects, a large
difference in temperatures between the source and the generation is needed. On the contraire,
individual households do not require these large temperature differences to facilitate heating
and cooling.
Geothermal heat pump technology isn’t necessarily a true geothermal technology, but rather a
combination of geothermal and solar energy technology. The reason for this is that the
ground source heat pumps are applied at very shallow ground levels, so in essence use the
indirect heat from the sun as it in turn heats up the ground. Nevertheless, it is still classified
as geothermal technology rather than solar technology. GSHP is the fastest growing form of
all geothermal direct use and provides a new and clean way of heating buildings. This is
reiterated by “Geothermal (ground-source) heat pumps (GHP) are one of the fastest growing

Copyright UCT
14
applications of renewable energy in the world, with annual increases of 10% in about 30
countries over the past 10 years. Its main advantage is that it uses normal ground or
groundwater temperatures (between about 5ºC and 30ºC), which are available in all countries
of the world” (Curtis, Lund, Sanner, Rybach, & Hellström, 2008).
This technology is one of the most energy efficient ways of heating buildings (Omer, 2008).
GSHP contributed 70% (35.2 GWth) of the worldwide installed geothermal heating capacity
in 2009 (Rybach, 2005) (Lund, Freeston, & Boyd, 2010). They can be installed in a wide
range of building types and do not require geothermal energy such as hot rocks to be viable.
They are viable all over the world, and are not particularly sensitive to different climates
(Omer, 2008). The only energy needed in the application of GSHP technology is electricity
to power the heat pumps. In general, such a system would provide three to four times as
much thermal energy as when compared to an equivalent energy intensive conventional
electric system.
Geothermal heat pump (GHP) technology is based on the relatively constant ground or
groundwater temperature and makes use of renewable energy stored within the ground. This
temperature ranges from 4°C to 30°C to provide space heating, cooling and domestic hot
water for all types of buildings (Goldstein, et al., 2011). When this energy is extracted from
the ground during heating periods, cooling of the ground takes place and vice versa when
heat is stored underground during cooling periods in the summer months. This effect can be
reduced by increasing the number of depth probes in order to avoid possible harmful impacts
that this abnormal ground temperature can have to the immediate area.
2.3.2 MainGeothermalHeatPumpSystems
Geothermal heat pump technology comes in two main systems or applications: A closed loop
and an open loop system. A closed loop system only facilitates heat exchange without any
fluid transfer taking place, whereas an open loop system facilitates the heat exchange through
a physical medium or fluid exchange taking place with the environment. Generally speaking,
the closed loop system is a more sustainable system if implemented correctly, so as not to
introduce unsustainably large temperature fluctuations within the surrounding area of the
application. The closed loop system is implemented in either a horizontal network of pipes at
1 to 2 m of depth, or alternatively can be implemented vertically in for instance a borehole as
far down as 250 m (Goldstein, et al., 2011). The heat exchange takes place through a water-

Copyright UCT
15
antifreeze solution, or some other saline solution that enhances heat exchange which is
circulated through the pipe. It is a very simple process in theory, in summer heat is rejected
into the ground, as the ground will be cooler than the atmosphere, and in winter heat is
collected from the ground. An open loop system on the other hand uses lakes, ponds or other
forms of groundwater directly as a heat exchanger (Goldstein, et al., 2011).
2.3.3 HeatPumps
Heat pumps are one of the most energy efficient ways to facilitate heating. Heat pumps are
effectively similar to the common refrigeration unit with heat rejected in the condenser used
for heating, or extracted in the evaporator used for cooling. So in essence they use electrical
energy to reverse the natural flow of environmental heat from cold to hot.
A typical example of how efficient a heat pump works can be described as follows. “A
typical heat pump requires only 100kWh of electrical power to turn 200kWh of freely
available environmental heat into 300kWh of useful heat. In every case, the useful heat
output will be greater than the energy required to operate the pump itself” (Omer, 2008). In
short, this means that a heat pump uses a third of the electricity that a direct electricity
facilitated heater would use to produce the same amount of useful heat. A further advantage
to heat pumps is the fact that they have a relatively low CO2 (Carbon dioxide), less than half
of the electric equivalent (Omer, 2008). The technology is an established technology, and is
tried and tested in Europe through hundreds of thousands of units or installations (Allan &
Philippacopoulos, 1999).
2.3.4 Howitworks
As mentioned earlier, GSHPs transfer heat from the ground into a building to provide space
heating. The system comprises three important elements namely the ground loop, or heat
exchange element, comprising a closed or open loop as discussed earlier, a heat pump and
lastly the heat distribution system within the building.

Copyright UCT
16
Theground looporheatexchangeelement
The heat exchange element is implanted into the ground, either horizontally or vertically. A
typical illustration of a vertical heat exchange element setup can be seen in
Figure 2-4.
Figure 2-4: Closed loop heat pump systems, vertical and horizontal applications (IEA Heat pump centre)
Theheatpump

Copyright UCT
17
The heat pump comprises three main parts, the evaporator, compressor and the condenser. In
its simplest form, the heat pump process works in the following way. The evaporator takes
the heat from the water or solution in the ground loop. The compressor then compresses the
gaseous refrigerant to the temperature needed for the heat distribution and the condenser then
gives up the heat to a hot water tank, which feeds the distribution system.
Theheating/coolingdistribution system
This is the way in which the heat is distributed throughout the building. This could be in the
form of under floor heating, or radiators for space heating and/or cooling. A number of
applications can be used here though, including in some cases heating water for hot water
supply through a simple heat exchanger.
2.4 DirectSolarEnergy
The sun has produced energy for billions of years. There is enough energy to keep the whole
earth life system going, from the great oceanic and atmospheric currents to the devastating
typhoons and hurricanes we bear witness to. Solar energy is a completely renewable energy
source. Solar energy, along with other renewable energy sources, has the answers to a lot of
the problems we currently face with the depleting fossil fuel reserves and ever increasing
greenhouse gas emissions associated with fossil fuels.
Solar energy is created, or rather converted, by using the radiation from the sun that reaches
the earth and then utilising this energy in a variety of different ways to take advantage of this
solar energy. The primary solar technologies are photovoltaic technology, concentrating
solar power, and solar heating and cooling systems (Balat, 2006). The solar heating and
cooling systems can be used as an alternative to the shallow geothermal heat pump systems
explained earlier. A further alternative would be to create electricity through solar energy,
and then using this electric energy to facilitate heating and cooling.
The sun delivers 1.2 × 10⁵ terawatts of energy, and this far outweighs any other energy
source, renewable or non-renewable (Crabtree & Lewis, 2007). The entire global civilisation
uses and produces only in the order of 13 terawatts of energy (Crabtree & Lewis, 2007), a
mere one thousandth of the potential of the sun. To put these figures into perspective

Copyright UCT
18
Crabtree & Lewis (2007) have drawn some comparisons to figures that we can relate to.
“The San Francisco earthquake of 1906, with magnitude 7.8, released an estimated 1017
joules of energy, the amount the sun delivers to the earth in one second. Earth's ultimate
recoverable resource of oil, estimated at 3 trillion barrels, contains 1.7 × 10²² joules of
energy, which the sun supplies to earth in 1.5 days. The amount of energy humans use
annually, about 4.6 × 10²⁰ joules, is delivered to earth by the sun in one hour” (Crabtree &
Lewis, 2007).
The main challenge with solar energy is the enormous gap between the potential of solar
energy and the cost and conversion capacity of solar energy as compared to fossil fuel based
energy (Crabtree & Lewis, 2007, p. 38).
2.4.1 SolarasElectricity
There are two main applications of solar energy which concerns this research article. The
first is the electricity generation from solar energy and the second is either the direct or
indirect heating or cooling of space and/or water systems.
Direct solar energy conversion to electricity is typically done by use of photovoltaic cells.
These cells make use of the photovoltaic effect (PV) to convert thermal energy into
electricity. The PV effect depends on interaction of photons, with energy equal to, or more
than the band-gap of PV materials (Balat, 2006). “The solar cells capture photons by exciting
electrons across this band-gap of a semiconductor, which creates electron-hole pairs that are
then charge separated, typically by p-n junctions introduced by doping. The space charge at
the p-n junction interface drives electrons in one direction and holes in the other, which
creates at the external electrodes a potential difference equal to the band-gap” (Crabtree &
Lewis, 2007, p. 38). An illustration of this phenomenon can be seen in Figure 2-5. This is
very similar to the concept of a semiconductor diode, with the exception that electrons and
holes are introduced by photon excitation and are removed at the electrodes (Crabtree &
Lewis, 2007, p. 38).

Copyright UCT
19
Figure 2-5: Solar electricity generation
Electricity is generated through the PV effect without emitting any noise, vibration or
greenhouse gasses, so it is a very favourable process in electricity generation where the
environment is concerned.
2.4.2 SolarIrradiance
Solar energy as a resource can be utilised by all countries and regions across the world, but
the amount of solar irradiance experienced will differ from region to region (see Figure 2-6).
Solar irradiance is described as the electromagnetic radiation emitted by the sun (Iqbal, 1984,
p. 390). Outside the atmosphere the solar irradiance on a surface perpendicular to the sun is
constant throughout the year and its value is accepted to be 1 367 W/m2 (Bailey, Brinker,
Curtis, Jenkins, & Scheiman, 1997). This is reduced to roughly 1 000 W/m2 at the earth’s
surface, where we can utilise it. The irradiance experienced is electromagnetic waves,
fluctuations in electric and magnetic fields (Arvizu, et al., 2011). These wavelengths range
from 0.25 to 3 μm and are a function of the sun’s surface temperature, which is estimated to
be in the order of 5800K. Solar irradiance is experienced in a variety of different forms.
About 40% is visible light, 10% is ultraviolet radiation and 50% is infrared radiation (Arvizu,
et al., 2011). “However, at the Earth’s surface, evaluation of the solar irradiance is more
difficult because of its interaction with the atmosphere, which contains clouds, aerosols,
water vapour and trace gases that vary both geographically and temporally.
Copyright UCT
20
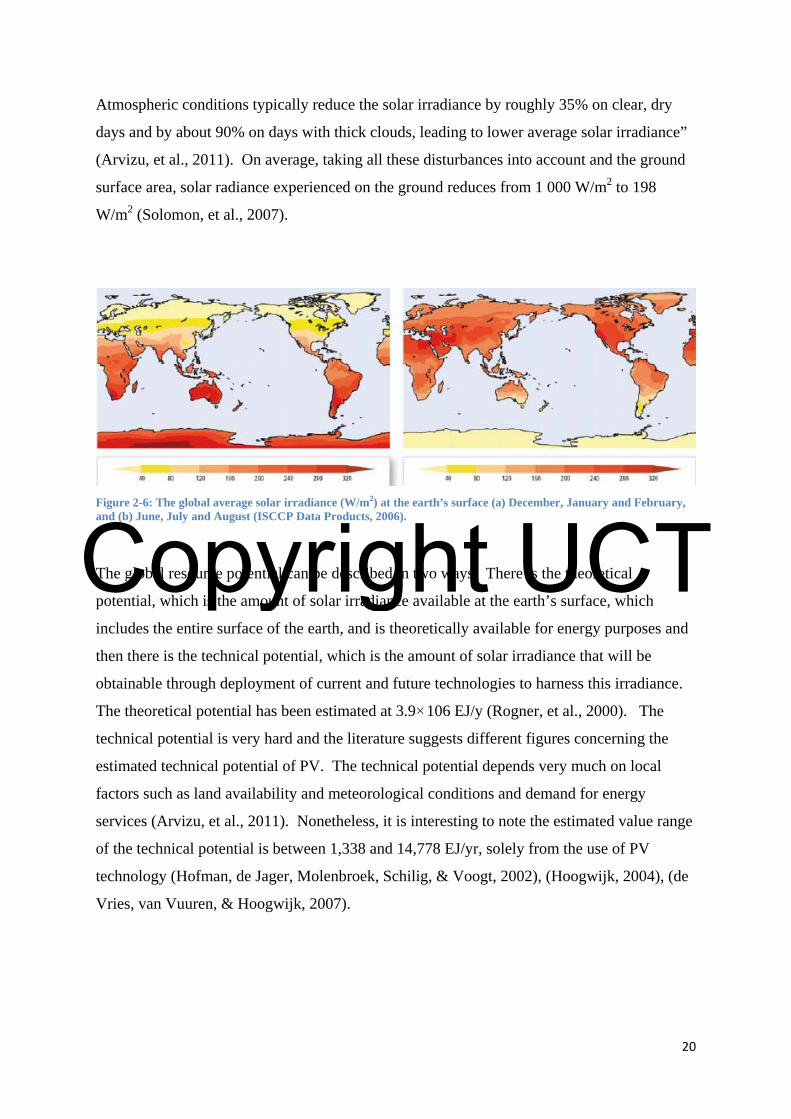
Atmospheric conditions typically reduce the solar irradiance by roughly 35% on clear, dry
days and by about 90% on days with thick clouds, leading to lower average solar irradiance”
(Arvizu, et al., 2011). On average, taking all these disturbances into account and the ground
surface area, solar radiance experienced on the ground reduces from 1 000 W/m2 to 198
W/m2 (Solomon, et al., 2007).
Figure 2-6: The global average solar irradiance (W/m2) at the earth’s surface (a) December, January and February, and (b) June, July and August (ISCCP Data Products, 2006).
The global resource potential can be described in two ways. There is the theoretical
potential, which is the amount of solar irradiance available at the earth’s surface, which
includes the entire surface of the earth, and is theoretically available for energy purposes and
then there is the technical potential, which is the amount of solar irradiance that will be
obtainable through deployment of current and future technologies to harness this irradiance.
The theoretical potential has been estimated at 3.9×10⁶ EJ/y (Rogner, et al., 2000). The
technical potential is very hard and the literature suggests different figures concerning the
estimated technical potential of PV. The technical potential depends very much on local
factors such as land availability and meteorological conditions and demand for energy
services (Arvizu, et al., 2011). Nonetheless, it is interesting to note the estimated value range
of the technical potential is between 1,338 and 14,778 EJ/yr, solely from the use of PV
technology (Hofman, de Jager, Molenbroek, Schilig, & Voogt, 2002), (Hoogwijk, 2004), (de
Vries, van Vuuren, & Hoogwijk, 2007).

Copyright UCT
21
2.4.3 SolarEfficiency
Solar energy conversion efficiency has not produced highly efficient figures, nonetheless it is
still a workable technology. To date the highest efficiency recorded in laboratory conditions
has been an efficiency of 32%, with practical applications being lower than this. In practice,
the best commercial solar cells based on single-crystal silicon technology are about 18%
efficient (Crabtree & Lewis, 2007, p. 38). Furthermore, PV modules require a large surface
area for small amounts of energy generation (Topcu & Ulengin, 2004). One technique being
used to increase the efficiencies is by using a multijunction approach (Arvizu, et al., 2011).
A number of different absorber materials are stacked onto each other, and thereby collect
more of the solar spectrum since each material can collect solar photons at different
wavelengths. Increasing efficiency will reduce costs and increase capacity, all contributing to
the financial and economic competitiveness as compared to traditional fossil fuel based
energy.
2.4.4 SolarasHeatingandCooling
Solar heating and cooling has been on the agenda of the International Energy Agency (IEA)
since 1977 (International Energy Agency, 2006). The research and development in this field
only really gathered momentum after 2000, with the increasing fossil fuel costs and ever
increasing attentiveness to environmental impact. The solar heating and cooling process will
work slightly differently to that discussed in the shallow geothermal technology, but serves
similar needs.
Solar energy can be utilised to facilitate cooling through air conditioning units in two ways,
photovoltaic power generation as already discussed under Solar as Electricity earlier and
secondly via solar thermal processes, (Naukkarinen, 2009) which is what will be discussed in
this chapter, this is known as thermally driven cooling systems. By utilising PV energy
conventional air conditioning systems can be coupled to the PV system. This is however not
a viable option, due to the low efficiencies and high prices of PV electricity conversion
(Naukkarinen, 2009, p. 95). This is further substantiated by Henning (2007) who states that
solar electrical air-conditioning, powered by PV panels, is of minor interest from a systems
perspective, unless there is an off-grid application. “This is because in industrialized
countries, which have a well-developed electricity grid, the maximum use of photovoltaics is
achieved by feeding the produced electricity into the public grid” (Arvizu, et al., 2011). In

Copyright UCT
22
South Africa’s case this may or may not be the case, depending on the direction Eskom
wishes to go concerning feedback to grid options.
2.4.4.1 Cooling
Cooling through the use of solar energy has been and still is a challenging journey. For the
most part, significant progress has been made for large buildings, such as hotels and office
blocks, up to a point where it is ready to be rolled out commercially on large scale (Balaras,
2006). For low power cooling systems, such as individual households, which are the focus of
this study, commercial technologies are available on a limited basis. Solar cooling is a very
complex system, complex beyond the scope of this study. However, an overview of the
respective technologies is important to be able to compare it to the geothermal systems.
There are basically two main technologies being used, similar to those in the geothermal
systems. These are open loop and closed loop systems. With regards to open loop systems
desiccant systems are most commonly in use, and for the most part the only open loop system
given significant attention in the literature. The open loop system is “used to indicate that the
refrigerant is discarded from the system after providing the cooling effect, and new
refrigerant is supplied in its place in an open-ended loop” (Balaras, 2006, p. 14). The closed
loop systems can either be an absorption or an adsorption cycle. They produce chilled water
that can be used in combination with a number of air conditioning systems (Balaras, 2006).
Absorptionchiller
Solar thermal air-conditioning consists of solar heat powering an absorption chiller and it can
be used in buildings (Henning, 2007). “An absorption chiller consists of a generator,
condenser, absorber and an evaporator. The absorption process uses a working pair of liquids
(liquid - liquid working pair) that enable heat absorption. Lithium–bromide (Li-Br) is
commonly used for cooling applications and provides chilled water at 5◦C. Ammonium
water working pairs are used in refrigeration and can provide chilled water below 0◦C”
(Naukkarinen, 2009, p. 96).
Absorption chillers are commercially available. They range in capacity from medium to high
capacity, typically in the order of 40kW to 300kW. These have been installed in commercial

Copyright UCT
23
and industrial applications and are proving to be very successful (Balaras, 2006). Balaras
(2006) further states that the required solar collector area is approximately 3m2 to 4m2 per
kW (in hot and sunny climates) of cooling required. Smaller units are mostly still in the
research and development stage (Balat, 2006), which is the units we would have liked to
compare to the geothermal energy systems. These smaller units (typically less than 10kW or
34,000 Btu) will be installed in residential and small size buildings. A 10kW chiller would
be able to easily keep a typical living room under South African conditions cool during the
summer months. Balat (2006) is of the opinion that these smaller units could be ready for
commercial use within a decade.
Adsorptionchillers
An adsorption chiller works on the principle of a liquid – solid working pair, unlike the
absorption chillers which work on the basis of a liquid – liquid working pair. The only
commercially available working pair is water and silica gel (Altener Project, 2002). They
consist of only two sorbent compartments, a condenser and an evaporator. Adsorption
chillers have a higher efficiency than absorption chillers at low driving temperatures. The
driving temperature is the average temperature of the heating fluid at the inlet and outlet of
the system. The reason for this is that the cycle does not have any moving parts. The
disadvantage of adsorption chillers however are that it is a more complex system design and
operational control, due to the fact that it operates on a periodic cycle. A further
disadvantage is that they are physically bigger in size, and they are more expensive per kW of
cooling capacity. Lastly, they are not readily available, as there are only a few manufacturers
producing these systems (Balaras, 2006).
DesiccantCycle
Desiccant cooling is a combination of evaporative cooling and desiccant dehumidification.
This process is ideally suited to solar applications. The system works by first humidifying
outdoor air so that evaporative cooling for heat rejection can be utilised without over
humidifying the air supply (Altener Project, 2002).
The dehumidification can take place through two desiccants or a combination thereof. These
are either through a solid or liquid, or a combination of solid and liquid desiccants. Desiccant
cooling systems are available in smaller kW capacities than that of adsorption chillers. They
are available in a range from 20kW to 350kW (Delorme, et al., 2004). The working fluids in

Copyright UCT
24
these systems typically are salts such as lithium or calcium chloride dissolved in water
(Naukkarinen, 2009). “Liquid desiccant systems can store cooling capacity by concentrating
the salt solution. Therefore, the system can regenerate when solar energy is available and
utilise it when cooling is required independent of the heat supply. The storage capacity is that
of compact form, indefinite in storage time and requires no insulation is the key advantage of
desiccant cooling systems” (Naukkarinen, 2009, p. 97).
Furthermore, these air conditioning systems need a good control system. This ensures year
round operation, air conditioning in summer and heating and humidification in winter
(Balaras, 2006).
2.4.4.2 Heating
A solar heating system in its most basic form is a solar collector that transforms solar
irradiance into heat and uses some sort of fluid to transfer this heat to where it is needed.
This need can be either for space heating or water heating. There are a variety of solar
collectors that come in many shapes and forms but essentially they should be chosen
according to either the service they will be providing or according to the desired range of
temperatures of the carrier fluid (Arvizu, et al., 2011).
Figure 2-7: Illustration of a flat plate collector (Arvizu, et al., 2011)
There are essentially two main solar thermal collectors. They are flat plate collectors and
evacuated tube collectors. For the purposes of residential solar water and space heating

Copyright UCT
25
systems, the flat plate collectors are most commonly used (Arvizu, et al., 2011). Flat plate
collectors are also used in air heating systems. Flat plate collectors consist of “of an
absorber, a header and riser tube arrangement or a single serpentine tube, a transparent cover,
a frame and insulation” (Arvizu, et al., 2011). This is neatly illustrated in Figure 2-7. Flat
plate collectors have a competitive price/performance ratio, as well as a broad range of
mounting possibilities, making it viable for residential households (Arvizu, et al., 2011).
Evacuated tube solar collectors have been around and commercially available for many years.
They have however not provided any real competition to flat plate collectors (Balat, 2006).
2.5 TheSouthAfricanPowerSector
South Africa experienced significant power outages during 2008 due to load shedding as
electricity demand outstripped supply. This energy crisis gave rise to a multitude of policy
changes within the energy sector. An Integrated Resource Plan (IRP) of 2010 was developed
to determine the future energy requirements of this country as well as a solution to address
these needs. The plan addresses the countries needs for the next 20 years, and is the energy
master plan for South Africa. An integral part of this plan is the focus on renewable energy
sources, most notably solar energy.
2.5.1 PresentstructureoftheElectricitySupplyIndustry(ESI)
More than 90% of South Africa’s electricity is generated from the burning of coal. Eskom,
South Africa’s state-owned utility, has 27 operational stations in South Africa that make up
40.7 GW of the country’s capacity (Eskom, 2009). Imports and IPP’s contribute a further 2.8
GW to achieve a total capacity of 43.5 GW, which aims to supply the forecasted peak
demand of 36 GW (over 220 TWh) (Edkins, Marquard, & Winkler, 2010).
.
The South African electricity supply industry is essentially vertically integrated with Eskom
generating 96% of the current requirements, municipalities 1% and independent power
producers (IPP’s) producing the outstanding 3% (Government Gazette, 2008).
The South African electricity sector is divided into two sections, the transmission, and the
distribution of electricity. Eskom is the only transmission licensee and therefore they are
responsible for all transmitted electricity within South Africa.
The responsibility of the distribution of the electricity generated takes on a different structure,
where it is shared between Eskom, the municipalities and the IPP’s. There are roughly 180

Copyright UCT
26
municipalities that distribute 40% of the electricity to 60% of the customer base (Government
Gazette, 2008). Table 1 illustrates the electricity usage weighting per sector in South Africa.
User Percentage
Domestic 17.2 %
Agriculture 2.6 %
Mining 15 %
Commercial 12.6 %
Transport 2.6
General 12.3 %
Table 1: End use electricity usage in South Africa (Government Gazette, 2008)
South Africa's capacity reserve margin has fallen sharply in recent years to around 8%. This
has placed considerable pressure on the industry. In response to these developments Eskom
has undertaken new projects and are expanding their electricity generation capacity, primarily
through coal fired plants at Medupi and Kusile, as well as 1.2 GW from the Ingula pumped
storage scheme (Edkins, Marquard, & Winkler, 2010, p. 1). The price of electricity hasn’t
allowed for the recovery of costs incurred in these projects, nor did it cover the costs of
maintaining their current asset base (Eskom, 2009b). These new projects and lack of
maintenance over the years have caused far above inflation price increases being
implemented to the end user across all sectors.
2.5.2 NERSAanditsroleinSouthAfrica
Over the past few years previously unseen tariff increases have been granted to Eskom by
NERSA (National Energy Regulator of South Africa). Eskom is the sole South African
transmitter of electricity to South Africa and holds monopoly status within South Africa in
this regard. NERSA has to approve any price increases before they can come into effect in
the economy. Therefore, before Eskom can implement any increase, they have to get
approval from NERSA before the increase can be implemented. The increase is based on a
revenue allowance, and the percentage increase passed to the consumer is then based on this
projected revenue increase. A complete tariff principle increase as stipulated in Section 16 of
the Electricity Regulation Act of 2006 can be seen in Appendix A.

Copyright UCT
27
NERSA publishes a comprehensive report, “Indicative municipal tariff guideline,
benchmarks and proposed timelines for municipal tariff approval process for the 2011/2012
financial year”, (NERSA, 2010) on the future price projections, the reasons for the increases
and the reasons for different increases across different sectors of society. The basic findings
of the report can be seen in Appendix B. This report was used as the basis for the future
electricity cost calculations for the next 15 years (see section 4.1).
2.5.3 ContextforrenewablesinSouthAfrica
Although South Africa has very good solar and wind resources the deployment of renewable
energy technologies has been slow to take off. The energy crisis of 2008 forced the
government to start considering and planning the role of renewable energy sources for future
electricity generation. The Department of Energy (DME) has set a target for renewable
energy to contribute 10,000 giga watt hours (GWh) of final energy consumption by
December 2013. Solar water heating could contribute up to 23% towards this target (Eskom,
2007).
The IRP of 2010 shows that renewable energy sources play in integral part in fulfilling the
future energy needs for South Africa. The IRP lays out an intended 600 MW of solar power
to be produced by 2019, although the majority of this will come from concentrating solar
power (CSP) technology (Michaelson, 2011).
As a matter of interest, a 360MW PV system is set to be implemented in Cape Town, South
Africa, by a joint venture between Italy-based Moncada Group and South African based Solar
Capital. According to reports construction of this project will begin in 2012 and scheduled
completion is 2016. This project aims to take advantage of the renewable energy feed-in
tariff (REFIT) as laid out by the South African government.
2.5.4 RenewableEnergyFeed‐InTariff(REFIT)
The energy crisis of 2008 also gave birth to renewable energy feed-in tariff scheme (REFIT).
REFIT covers four renewable energy (RE) sources, which includes large-scale photovoltaic
grid-connected systems, which received a feed-in tariff of ZAR 3.94 per kilowatt-hour in
2009 and this was subsequently reduced to R2.31 per kilowatt-hour in 2011 (NERSA, 2009).

Copyright UCT
28
REFIT’s drawback for the residential renewable energy users is that it is only based on
installations by independent power producers (IPP) with a power supply feedback to grid
larger than 1MW capacity (Eskom, 2010). There is therefore no benefit to households to
consider feedback to grid options to help cover their initial costs. Having said this, in many
parts of the world the feedback to grid is implemented at small scale level. The possibility of
small residential applications feeding back to grid cannot be completely discounted in South
Africa. Nonetheless, for the purposes of this report, REFIT will not be considered an option.
2.6 Conclusion
The literature review reinforces the urgency and importance with which renewable energies
are being viewed in our current climatic and economic conditions. Renewable energy
sources are the way forward. Nonetheless, there remain a number of challenges for
renewable energies. A lot of progress has been made in this field, with a number of
commercially competitive and viable renewable energy solutions available to the individual
and small commercial industrial users.
The literature suggests that shallow geothermal heat pumps are better suited to residential
heating and cooling, as solar heating and cooling still has some disadvantages that will need
to be overcome.
Copyright UCT
29
3 ResearchMethodology
The purpose of this section is to lay the framework that guided the research report to ensure a
focused outcome. It does this by clearly stipulating the approach that has been followed. It
will highlight any assumptions made that could influence the outcome of this report.
Furthermore, it will look at the research design and the methods to be used to determine the
outcome of the report. Lastly it will describe any possible limitations that can impact the
outcome of the report and what implications they might have.
3.1 Researchapproachandstrategy
The research approach will take on the form of a deductive approach. “…deduction owes
much to what we would think of as scientific research” (Suanders, Lewis, & Thornhill, 2009).
This research is for the most part very close to the core of scientific research, and thus the
deductive approach would be the correct method to follow. Collis and Hussey (2003) states
that the deductive approach is where “laws present the basis of the explanation, allow the
anticipation of phenomena, predict their occurrence and therefore permit them to be
controlled”. By using this research approach, tangible data can be gathered that can explain
the differences in the geothermal energy, solar energy and current energies.
A hypothesis is made where one can test whether solar energy when compared to geothermal
energy in a particular application is the superior technology or not. These relationships are
tested in mostly quantitative ways but also has an element of qualitative comparisons
associated to it, such as the social impacts. These two technologies can be compared by
measuring the effectiveness through economic and financial analysis as well as through other
aspects such as commercial viability. A deductive approach requires that concepts be
operationalized that enables facts to be measured quantitatively (Suanders, Lewis, &
Thornhill, 2009). This proved to be possible as the research lends itself to being measured as
figures were obtained on a variety of fronts.
3.2 Researchassumptions
For the most part the underlying assumptions in the approach and strategy are the fact that
there are quantitative ways to measure the hypothesis. Furthermore, there should be similar
measurements to be able to compare the two technologies to each other by using the exact

Copyright UCT
30
same criteria for the measurement; otherwise the result will be meaningless. Lastly, it is
assumed that a financial figure can be coupled to the technologies, as there might be cases
where the technologies are not yet commercially viable or available. Should this be the case,
the focus would shift more to the required figures that would make these technologies
successful.
3.3 Researchdesign,datacollectionmethodsandresearchinstruments
The purpose of this research topic is to draw an accurate conclusion on the renewable energy
alternatives as proposed for residential households in the South African context. The
descripto-explanatory study will be the best approach to follow in this particular instance. It
gives the opportunity to accurately portray the situation surrounding renewable energies,
followed by an in depth analysis through explanatory studies to determine the relationship
between the different fields.
The most descriptive research design according to the literature that could describe this
particular undertaking would be archival research, possibly combined with either some action
research. A lot of answers can be gained from the literature relating to the research question,
hence the motivation for some archival research. Action research is defined by the literature
as research that has implications beyond the immediate project (Suanders, Lewis, &
Thornhill, 2009). This could very well be the case as the results here could inform or shed
light on other contexts in renewable energy as an alternative to fossil fuel based energies.
Action research is of an iterative nature, its diagnosing, planning, taking action and
evaluating (Suanders, Lewis, & Thornhill, 2009). This process is repeated taking into
account the previous findings and building on that.
The design will also take the form of a cross sectional study, a snapshot in the present as the
viabilities and technologies of the present will be compared to each other as opposed to the
development of these.
Data collection will be done through reviews of surveys and reports that have been done on
the specific renewable technologies involved. It is important to see this data from multiple
perspectives. Firstly, it will be necessary to understand the technologies involved and how

Copyright UCT
31
far they have developed. In terms of data collection, a number of factors were investigated,
analysed and then compared.
o Is the technology viable
o Is it commercially employable, or already to market
o Determine current energy costs in South Africa
o Calculate geothermal heat pump and direct solar implementation costs
o Calculate their operating costs
o Determine a realistic cost model in terms of feedback to grid possibilities (if it is at all
a possibility) and decreasing implementation costs
o Determine the break-even point, as compared to current energy as well as to each
other
o Determine the economic aspects or implications
All the necessary data to determine these factors were done through interviews with local
companies, both geothermal and solar orientated companies. Furthermore, a lot of data can
be gathered from reports and proceedings from conferences on renewable energy sources and
their future roles in our society. This is easily attainable through current literature.
3.4 Sampling
No sampling was done for this research report. However, a lot of quantitative data was
gathered for the purpose of determining the viability of these projects on both a financial and
economic front.
The population selected for this research comprises a variety of different stakeholders across
a range of countries. The population will consist of international as well as South African
entities in any regard related to the research. These will typically be the renewable energy
supplier, any institutions related to financing the operation, be it investors, banks or
development banks, they all form part of the data population. Furthermore institutions such
as Eskom (South Africa’s power utility) and NERSA, the energy regulator, formed part of the
population. Some of the data collected was secondary data collected from reports, analyses
and feasibility studies.
3.5 Researchcriteria
Data was gathered in such a way so as to ensure that it is not biased in any regard and that it
is representative from a broad range of perspectives. When data has been collected by any

Copyright UCT
32
means whatsoever, all efforts were made to verify this with the literature and if possible to
verify it with similar data. This similar data was data obtained from possible commercial
installations, where the data was actually generated, which is quite possible in the case of this
research topic. A lot of the technology is in commercial practice, in some cases not in South
Africa per se, but in other parts of the world. This would then assist in validating the data.
3.6 DataAnalysisMethods
The basic method for data analysis that will be used will be the approach of breaking down
and sorting a large body of information into smaller, workable themes. This is the approach
followed by Leedy & Ormrod (2005).
The information gathered here will come mostly from literature data or secondary data,
analyses of data reports and interviews with suppliers or producers.
The data will be analysed on both financial and economic fronts.
The financial feasibility will take into account the following factors:
o Acquisition or start-up costs for the individual in installing the technology
o Running costs (if applicable)
o Break-even costs and life of the technology as compared to conventional energy costs
o Usage due to different geographical areas, which will affect the costs due to more
dependence on conventional energy sources
The financial feasibility will be done on both technologies independently and then compared
to each other as well as to conventional energy costs.
The economic analysis will take the form of a cost benefit analysis. The cost benefit analysis
(CBA) is helpful in weighing up the costs to the total expected benefits derived from
undergoing the costs. It will take form in two stages, firstly by valuing the costs and benefits
and then by obtaining a present value for the project. It differs to that of a purely financial
analysis by the fact that in the CBA the costs and benefits are taken over a very broad
spectrum. It takes into account the costs and benefits to all members of society and the social
discount rate to obtain the present value can be different to that of the financial discount rate
(Layard & Glaister, 1994)

Copyright UCT
33
3.7 Limitations
To some degree, the research was limited due to the fact that data is not as readily available
for the South African context as the developed world. Geothermal technology is a rather new
technology to the South African context, and the companies involved with these technologies
are scarce. It proved useful to compare South African data to that of offshore data, to help in
lending credibility to the South African data. Another limitation encountered, specifically in
the case of the solar heating and cooling is the fact that the technology does not get readily
employed in the heating/cooling industry, but rather in the more general form of personal
electricity generation for the individual households. This led to a number of assumptions
being made to test the hypothesis and to be able to successfully compare it to geothermal
technology.
Fortunately the research report proved that both technologies proved to be a viable alternative
to that of conventional heating and cooling through conventionally generated electricity. The
literature did suggest that this will be very unlikely, but this was proven and substantiated in
the research document.

Copyright UCT
34
4 ResearchFindings,AnalysisandDiscussion
The research findings are based upon a number of calculations. The methodology followed
to arrive at the particular choice of calculations is described in section 3.3. The findings of
this report are based exclusively on these calculations.
For the purposes of this research report some assumptions need to be made in order to
compare the relevant technologies with each other fairly. There are three possible options
that were compared for this report. The three options all include space heating and cooling
for the entire hypothetical residence, as well as a means to heat water. The water heating was
included, as this is an added benefit of the geothermal system. The three systems are:
Conventional electric air conditioners and an electric geyser
Shallow geothermal system which incorporates heating, cooling and hot water
through a heat exchanger
Photovoltaic installation that supplies the air conditioners with adequate electricity
combined with a solar water geyser. The photovoltaic system incorporates the means
of using grid electricity, should solar power not be available, such as during non-
daylight hours.
The analysis of each of these options will be done separately, and once complete, the
analyses will be compared to one another.
A hypothetical residence was created for the basis of these comparisons. These assumptions
are summarised in Table 2.
Size of area in residence required for heating
and cooling
250 m2
Number of rooms 7
Air conditioning units
Comprising of:
7
3 x 12 000 Btu/h
1 x 18 000 Btu/h
3 x 24 000 Btu/h
Air conditioning combined coverage area 250m2
Shallow geothermal units 1
Geothermal coverage area 245m2
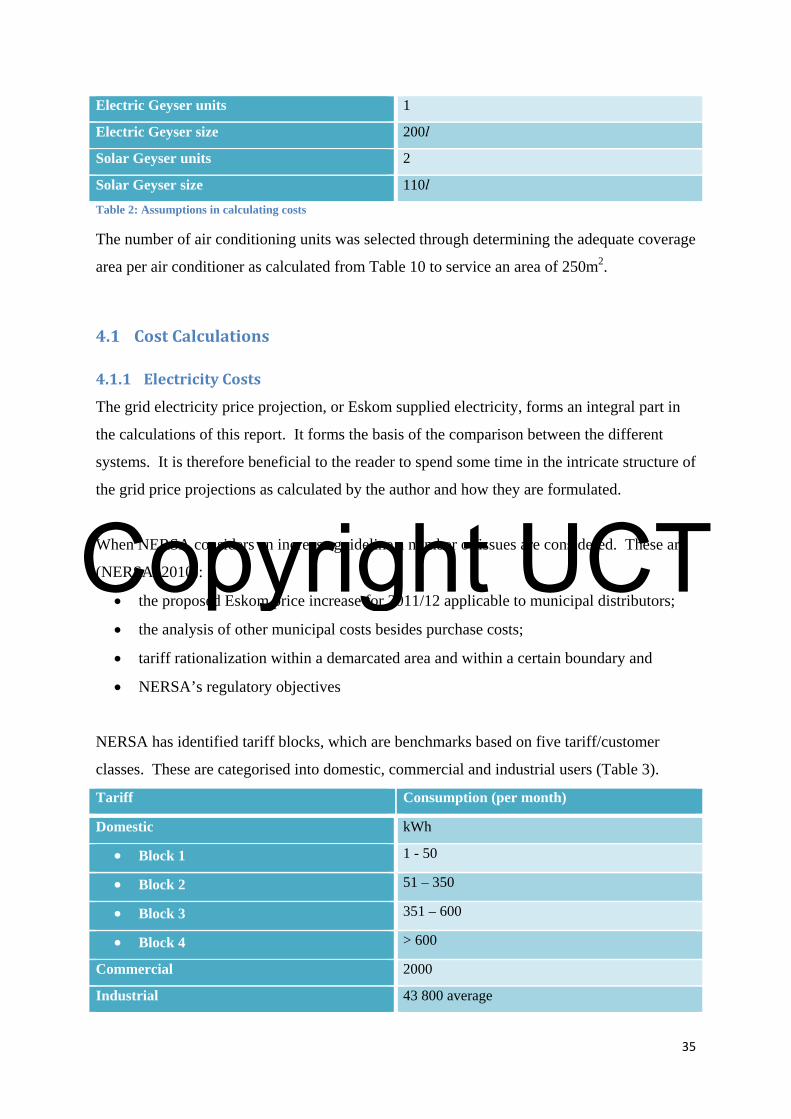
Copyright UCT
35
Electric Geyser units 1
Electric Geyser size 200l
Solar Geyser units 2
Solar Geyser size 110l
Table 2: Assumptions in calculating costs
The number of air conditioning units was selected through determining the adequate coverage
area per air conditioner as calculated from Table 10 to service an area of 250m2.
4.1 CostCalculations
4.1.1 ElectricityCosts
The grid electricity price projection, or Eskom supplied electricity, forms an integral part in
the calculations of this report. It forms the basis of the comparison between the different
systems. It is therefore beneficial to the reader to spend some time in the intricate structure of
the grid price projections as calculated by the author and how they are formulated.
When NERSA considers an increase guideline a number of issues are considered. These are
(NERSA, 2010):
the proposed Eskom price increase for 2011/12 applicable to municipal distributors;
the analysis of other municipal costs besides purchase costs;
tariff rationalization within a demarcated area and within a certain boundary and
NERSA’s regulatory objectives
NERSA has identified tariff blocks, which are benchmarks based on five tariff/customer
classes. These are categorised into domestic, commercial and industrial users (Table 3).
Tariff Consumption (per month)
Domestic kWh
Block 1 1 - 50
Block 2 51 – 350
Block 3 351 – 600
Block 4 > 600
Commercial 2000
Industrial 43 800 average

Copyright UCT
36
Table 3: NERSA tariff block benchmarks (NERSA, 2010)
The municipal electricity costs contain certain contributors to which different increases apply.
These contributors are salaries, repairs and maintenance, capital charges and other costs. The
revised weights are indicated in Table 4.
Benchmark Weighting (%)
Bulk purchases 70
Salaries 12
Repairs & Maintenance 5
Capital Charges 3
Other costs 10
Table 4: Revised benchmark weights (NERSA, 2010)
“There are a number of assumptions in the calculations and these are;
bulk purchases have been increased by 26.71%;
Consumer price index (CPI) equal to 4.8%;
salary increases assumed at CPI plus 2% (as per agreement between organised local
government and Unions);
repairs and maintenance, capital charges and other costs have been increased by CPI
and
the benchmark for bad debt is assumed at 0.5% of the total revenue of the municipality
In determining the latest CPI forecast for the 2011/12 financial year, NERSA used the
inflation figure as quoted in National Treasury’s economic policy and outlook and the
Medium Term Budget Policy statement (MTBPS) delivered by the Minister of Finance on 27
October 2010. This publication provides the latest official headline inflation forecasts; the
forecasted inflation for 2011/12 is 4.8%” (NERSA, 2010, p. 17). This is however NERSA’s
policy, and as will be seen, the author used a slightly different approach for the inflation
figures.
There are some challenges in the implementation of the tariffs approved by NERSA. One of
these is a time lag, as the increase goes from NERSA to Eskom to the municipalities. To

Copyright UCT
37
counter this time lag a ratio is introduced into the increase which is stipulated in the
Municipal Finance Management Act (MFMA) (NERSA, 2010). The increase approved for
the 2011/12 financial year by NERSA was 25.8%. Due to the MFMA time lag this was
implemented at 26.71% for municipalities. This equates to a ratio of 1.0352 for the time lag
correction factor.
Table 5 indicates the expected residential inclining block tariff increases for the 2011/12 and
2012/13 financial years.
Monthly level 2011/2012
c/kWh % increase
2012/2013
c/kWh % increase
Block 1 57.65 5.40 60.83 5.50
Block 2 66.16 13.23 75.09 13.50
Block 3 96.05 25.80 120.93 25.90
Block 4 105.35 25.80 132.63 25.90
Average tariff 68.83 78.62
Table 5: Residential inclining block tariffs for Eskom residential customers (NERSA, 2010b).
NERSA has provided a guideline for calculating and justifying an increase for a municipality.
This is given by Equation 1 and Table 6 as;
% % % % % % % % % %
Equation 1: Formula for calculating price increase guideline (NERSA, 2010)
Where
B Bulk purchases
BPI Bulk purchase increase
S Salaries
SI Salary increase
R Repairs
RI Repairs increase
C Capital charges
CCI Capital charges increase
OC Other charges
OCI Other charges increase
Table 6: Price calculation legend (NERSA, 2010)

Copyright UCT
38
The following table (Table 7) illustrates the electricity calculations as calculated by the
author. A few notes are worthy of mention
The different increases in Block 1 through Block 4 is illustrated in Appendix B.
CPI is estimated at 6%. This is taken due to the South African Reserve Bank
pursuing an active inflation targeting monetary policy. The inflation target is between
3 and 6 percent, and the worst scenario has been taken (South African Reserve Bank,
2009).
The lag factor will continue throughout the 15 years due to the proximity of financial
year end dates of the municipalities and the electricity increase implementation date
The blocks were increased at different rates, using the historical partial percentage
increase history of the increases of the previous years.
For the purposes of this report we will use block 4 costs. This will be the most
relevant electricity usage block, as these are the typical households that would look at
renewable energies. Furthermore, this is where the greatest advantage over
conventional heating and cooling with electricity will be realised due to the higher
costs of electricity.
Year Increase date
Bulk purchase Salaries and
Wages
Repairs and Maintenance
Capital Charges
Other costs
Increase
Bulk Lag factor
Effective
70% 12% 5% 3% 10%
0 Jul-11 25.80% 1.035 26.70% 8.00% 6% 6% 6% 20.73% 1 Jul-12 25.90% 1.035 26.81% 8.00% 6% 6% 6% 20.80% 2 Jul-13 12.00% 1.035 12.42% 8.00% 6% 6% 6% 10.73% 3 Jul-14 12.00% 1.035 12.42% 8.00% 6% 6% 6% 10.73% 4 Jul-15 12.00% 1.035 12.42% 8.00% 6% 6% 6% 10.73% 5 Jul-16 12.00% 1.035 12.42% 8.00% 6% 6% 6% 10.73%
6 Jul-17 12.00% 1.035 12.42% 8.00% 6% 6% 6% 10.73% 7 Jul-18 6.00% 1.035 6.21% 8.00% 6% 6% 6% 6.39% 8 Jul-19 6.00% 1.035 6.21% 8.00% 6% 6% 6% 6.39% 9 Jul-20 6.00% 1.035 6.21% 8.00% 6% 6% 6% 6.39%
10 Jul-21 6.00% 1.035 6.21% 8.00% 6% 6% 6% 6.39% 11 Jul-22 6.00% 1.035 6.21% 8.00% 6% 6% 6% 6.39%
12 Jul-23 6.00% 1.035 6.21% 8.00% 6% 6% 6% 6.39% 13 Jul-24 6.00% 1.035 6.21% 8.00% 6% 6% 6% 6.39% 14 Jul-25 6.00% 1.035 6.21% 8.00% 6% 6% 6% 6.39% 15 Jul-26 6.00% 1.035 6.21% 8.00% 6% 6% 6% 6.39%
Table 7: Electricity percentage increase calculation

Copyright UCT
39
Year Block
1 2 3 4 c/kWh % Increase c/kWh % Increase c/kWh % Increase c/kWh % Increase 0 57.65 66.16 96.05 105.35
1 60.83 5.52% 75.09 13.50% 120.93 25.90% 132.63 25.89% 2 64.48 6.00% 85.59 6.96% 133.91 10.73% 146.87 10.73% 3 68.35 6.00% 97.56 6.96% 148.28 10.73% 162.63 10.73% 4 72.45 6.00% 111.20 6.96% 164.20 10.73% 180.09 10.73% 5 76.80 6.00% 126.74 6.96% 181.83 10.73% 199.42 10.73% 6 81.40 6.00% 144.46 6.96% 201.34 10.73% 220.82 10.73%
7 86.29 6.00% 164.66 6.96% 214.20 6.39% 234.93 6.39% 8 91.47 6.00% 187.68 6.00% 227.89 6.39% 249.93 6.39% 9 96.95 6.00% 213.92 6.00% 242.44 6.39% 265.90 6.39%
10 102.77 6.00% 243.83 6.00% 257.92 6.39% 282.88 6.39% 11 108.94 6.00% 277.92 6.00% 274.40 6.39% 300.95 6.39% 12 115.47 6.00% 316.78 6.00% 291.92 6.39% 320.17 6.39%
13 122.40 6.00% 361.07 6.00% 310.57 6.39% 340.62 6.39% 14 129.75 6.00% 411.56 6.00% 330.41 6.39% 362.37 6.39% 15 137.53 6.00% 469.10 6.00% 351.51 6.39% 385.52 6.39%
Table 8: Electricity price increase by block
4.1.2 GeothermalCosts
4.1.2.1 Background
Geothermal installations are common in Europe and the United States of America and less so
in South Africa. There are however a number of suppliers installing shallow geothermal
technologies with the necessary knowledge and experience. Most of these companies utilise
foreign expertise as it is still a young technology in South Africa. From a number of
interviews conducted, in particular at Kyasol, it is evident that the South African market is
very small, mainly due to the high initial costs involved as compared to traditional electric
heating and cooling methods. Kyasol is a leading geothermal technology company based in
Johannesburg, South Africa.
A further advantage of installing renewable energies in residences is the fact that Eskom
offers rebates on a number of technologies. Heat pumps do fall under the category for an
eligible rebate, however, this is only applicable in the instance where an existing system is
retrofitted or replaced with a heat pump system. The rebate works on the principle that the
initial costs are partially subsidised by Eskom. For the purposes of this report we will assume

Copyright UCT
40
that we are only installing geothermal installations in new buildings, hence the rebate is not
applicable in this instance.
4.1.2.2 Energyrequirementsandcapacities
The following figures were gathered from interviews with shallow geothermal supply
companies in South Africa, the bulk of the information acquired from Kyasol. It is however
close estimates, as the final price is very much dependant on each individual household’s
requirements and layout of the particular residences.
In order to achieve successful heating/cooling in a space, certain energy input requirements
are needed. The typical energy requirements to achieve cooling/heating in the South African
climate are in the order of 80 – 90 W/m2. Insulation in residences reduces the amount of heat
loss through windows, doors and walls. In Europe this figure is halved, due to much better
standard insulation in residences installed, due to their cold winters. South African
residences do not get constructed with extreme cold in mind, hence there is hardly any
insulation installed in residences in South Africa.
Shallow geothermal installations have the ability to both heat and cool a residence, as well as
provide the residence with hot water, nullifying the need for an electrical hot water geyser.
This can then be considered an extra saving, and will be incorporated in the financial
calculations as such. Due to the fact that the shallow geothermal system is a closed loop
system, the hot water used in the residence is heated on demand through a heat exchanger,
and is not stored such as in a traditional hot water geyser. This has the added advantage that
there is no possibility of any bacteria growth, and the water needn’t be heated to such high
temperatures as electrical geysers, where the high temperature settings are needed to kill off
bacteria.
The typical cooling/heating capacity of shallow geothermal installations range from 5kW to
200kW. This gives a cooling/heating capacity to service an area of between 50 to 2500m2 in
South African conditions. All of these installations require some input of electrical energy,
so they are not completely renewable energies in the true sense. All of these installations
have a typical coefficient of performance (COP) in the range of 5. COP means that for each
1kW of electrical energy input, a cooling/heating capacity of 5kW is achieved.

Copyright UCT
41
4.1.2.3 Energycalculations
This section determines the individual energy requirements of the different systems. The
energy calculations were based on a usage of 8 hours per day. As the usage increases, the
research findings will show that the renewable energy installations become even more
competitive as compared to conventional energy usage. Due to the fact that this usage figure
is assumed, a further sensitivity analysis was done to lend credibility to the calculations.
Electric hotwatergeyser
A typical electrical hot water geyser of 200l capacity uses a 4000W element. Using the
energy calculator provided by Eskom your typical energy usage will be 306kWh per month
(Eskom, 2010). The installation costs are current prices as gathered from quotes from a
number of local plumbing companies.
Size (l) Load
(kW)
Typical monthly
usage (kWh)
Unit & Installation
Cost
Annual usage
(kWh)
50 2 355 R6 599 4 260
100 3 330 R6 999 3 960
150 4 320 R7 199 3 840
200 4 306 R8 399 3 672
250 4 297 R13 299 3 564
Table 9: Typical hot water geyser statistics (Kwikot, 2010)
It can be noted from Table 9 that the annual kWh declines as the geyser increases in size.
This is due to the fact that less energy is required to keep water heated than to heat it up from
cold. In smaller geysers, this is the case, as almost the entire capacity of the geyser gets
utilised, therefore the higher energy inputs.
AirConditioners
The most common air conditioner type in residential use is the wall mounted split type air
conditioner. These vary in size and cooling/heating capacity. The heating and cooling
capacities of these types of air conditioners are closely correlated on a per kW basis (Table

Copyright UCT
42
10). The heating and cooling capacities, costs and the required electrical energy input are
given in Table 10.
Cooling capacity (Btu/h) 9 000 12 000 18 000 22 000 24 000 30 000
Cooling capacity (kW) 2.5 3.5 5.1 6.1 6.7 8.8
Heating capacity (kW) 2.9 3.6 5.6 6.5 7.2 9.2
Power Input (kW) 1.7 1.8 2.7 2.9 2.3 3.0
Coverage area (m2) 18 25 36 43 47 60
Cooling COP 1.5 1.9 1.9 2.1 2.9 2.9
Heating COP 1.7 2.0 2.1 2.2 3.1 3.1
Usage monthly (kWh) 413 437 656 705 559 729
Unit & Installation cost R 4 674 R 5 130 R 6 658 R 7 524 R 8 550 R 11 058
Table 10: Typical heating and cooling capacities of a split type air conditioner (Chigo South Africa, 2011)
Notes on the above table:
The cooling/heating capacity is the cooling/heating work the unit is able to do. The
power input is the electrical power input required to run the unit.
The coverage area is the typical one storey floor area that the unit can effectively keep
cool at 21ºC (Chigo South Africa, 2011).
The cooling and heating coefficient of performance (COP) (see section 4.1.2.2) is the
cooling/heating capacity as a ratio of the required power input.
The cooling and heating usage is calculated on an average of 8 hours per day. The
usage is calculated through Eskom’s energy calculator (Eskom, 2010) or simply by
simple arithmetic (Equation 2).
Equation 2
To arrive at the required 250m2 a selection of units were taken. These are summarised in
Table 2.
ShallowGeothermal
The shallow geothermal statistics required to calculate the costs and to be able to compare
these costs to that of electrical geysers and electrical air conditioning are shown in Table 11.
All of the data was gathered through correspondence with a number of shallow geothermal
installation companies, both locally and internationally. The majority of the data gathered

Copyright UCT
43
were gained from Kyasol (2011), a local company, and Carrier (2011), an international
company.
Unit Size
Heating capacity
(Btu/h) 23 336 35 532 53 122 72756 132 646 197 612
Heating capacity (kW) 6.62 10.08 15.07 20.64 37.63 56.06
Cooling capacity
(Btu/h) 20 568 33 529 53 564 73 484 133 633 199 083
Cooling capacity (kW) 5.83 9.51 15.20 20.85 37.91 56.48
Power input (kW) 1.32 1.94 2.94 4.07 7.75 11.50
Heating COP 5.02 5.20 5.13 5.07 4.86 4.87
Cooling COP 4.42 4.90 5.17 5.12 4.89 4.91
Coverage area (m2) 80 120 175 245 450 660
Usage monthly (kWh) 321 472 715 990 1886 2798
Unit & Installation
cost R 160 000 R 240 000 R 350 000 R 490 000 R 900 000 R 1 320 000
Table 11: Shallow Geothermal Statistics, adapted from (Kyasol, 2011), (Carrier, 2011)
Notes on the above table:
The cooling/heating capacity is the cooling/heating work the unit is able to produce.
The power input is the electrical power input required to run the unit.
The cooling and heating coefficient of performance (COP) is the cooling/heating
capacity as a ratio of the required power input.
The cooling and heating usage is calculated on an average of 8 hours per day using
Equation 2.
4.1.3 PhotovoltaicCosts
4.1.3.1 Background
The annual 24-hour global solar radiation average is about 220 W/m2 for Southern Africa.
Most areas in South Africa average more than 2 500 hours of sunshine per year, and average
solar-radiation levels range between 4.5 and 6.5kWh/m2 in one day. This makes South
Africa's local resource one of the highest in the world (Department of Minerals and Energy,
2011).

Copyright UCT
44
Solar energy is the most readily accessible energy resource in South Africa. South Africa’s
solar orientated industry is developing with a number of installations already in use. Annual
photovoltaic (PV) panel-assembly capacity totals 5MW. Solar water-heating is also used to a
certain extent. Current domestic installed capacity installed totals 330 000 m2 and swimming
pools 327 000 m², commerce and industry 45 000 m² and agriculture 4 000 m2 (Department
of Minerals and Energy, 2011).
“At the moment, the majority of South African photovoltaics come from small scale off-grid
end-users, which utilise it in combination with wind turbines and generators. With the cost of
using photovoltaics here at parity with that of being on-grid, it is clear that many South
African households understand the potential benefits of choosing it as their energy supply and
are willing to opt in, provided the costs remain competitive” (Michaelson, 2011).
Kilowatt peak (kWp) refers to the value of power generated by a solar panel system under
standard laboratory conditions. In South Africa, one kilowatt peak of solar panelling will
generate roughly 1 710 kilowatt hours (kWh) per year (Solar Total, 2011).
4.1.3.2 CostCalculations
The basis of the cost calculations for the photovoltaic (PV) system is presented below. The
PV system energy requirements were based on the following assumptions:
Size of area in residence required for heating
and cooling
250 m2
Number of rooms 7
Air conditioning units
Comprising of:
7
3 x 12 000 Btu/h
1 x 18 000 Btu/h
3 x 24 000 Btu/h
PV installed cost (R/kWp) 30 000
kWp to kWh ratio in South Africa 1.71
PV installed cost (R/kWh) 10 000
Average daylight hours 8.7
Average sunset time 18:12

Copyright UCT
45
Daily PV usage (hours) 4
Daily grid usage (hours) 4
Table 12: PV cost calculation assumptions
The size of the building and number of cooling units are the same as that for the geothermal
comparison (see section 4). The PV installed cost was obtained from average estimates of
solar installation companies within South Africa, Solar Total and Sustainable (Solar Total,
2011) (Sustainable, 2011). The geyser assumptions are the same as for Table 2. The average
daylight hours and sunset times (Appendix C) was obtained for Johannesburg, South Africa
(South African Astronomical Observatory (SAAO), 2011).
The comparison between the geothermal system and the PV system was compared on the
basis of their respective electricity usage or saving costs. For the PV system an assumption is
made that the entire PV system should be able to supply the air conditioning and geyser units
with adequate energy. This assumption is made to enable the residence to utilise a fully
renewable energy source. It will also enable maximum savings through no grid electricity
usage, although the initial installation costs will be higher. Furthermore, down time can be
used to charge batteries or to feed back to grid (should this become a possibility in the
future), essentially reducing the cost of the entire system.
Due to the workings of the PV system, energy can only be converted into electric energy
during daylight hours. Banks of batteries need to be installed to make the system fully
sustainable during non-daylight hours or grid power is used during non-daylight hours. This
gives rise to some cost calculation difficulties when comparing to the geothermal and
conventional systems. The approach followed to circumnavigate this problem is as follows:
A cost calculation will be determined by assuming a 4 hour daylight usage time and a 4 hour
night usage time to arrive at the original 8 hour estimate.
In the one calculation the remainder of the daylight hours will be fed back to grid. Due to the
feedback to grid not being a current option in South Africa, it is only done for the purpose of
illustrating what the results will be should this option come into effect.
For the second instance, which is also the instance on which the comparison is based, the
system will be deemed to be non-utilised during these hours.
For both these instances the energy requirements for night usage will be acquired from grid
electricity, and the applicable projected electricity costs (section 4.1.1) will be used.

Copyright UCT
46
A further assumption is made that the geyser will also be a solar geyser. This is incorporated
into the calculations for completeness of comparison to the geothermal system. An efficient
system will service an entire residences hot water needs through just solar heating, and will
require no energy input from the grid (Sustainable, 2011).
The energy required to service an area of 250m2 through PV is calculated as follows (Table 13):
The total required energy (combined PV and grid usage) for air conditioner totals
43 000 kWh per annum
A 1 kWp system delivers 1710 kWh per annum (Solar Total, 2011)
This requires an installed PV capacity of 43000/1710 = 26 kWp
1 kWp requires 7.5m2 of panelling
The rooftop area required for the required PV capacity is 7.5m2 x 26 = 195m2. For
the purposes of this research report, the rooftop area available is a minimum of
250m2, so there is sufficient space available in this regard
An output of 0.54 was calculated through the fact that 1kWp delivers 1 710 kWh pa.
Therefore 1 710 / 365 = 4.68 kWh per day. Dividing this number by the average
number of daylight hours we get 4.68 / 8.7 = 0.54 kW. Therefore 1kWp delivers
roughly 0.54 kW
The installation cost is simply the average of 10 000 (R/kWh) multiplied by the
number of kW required, which is 15 in this instance. Therefore the installation cost is
10 000 x 15 = R150 000
System 1 kWp 26 kWp
Energy (kWh pa) 1 710 43 728
Rooftop area required (m2) 7.5 195
Installation Cost (R/kWh) 10 000
Output (kW/kWp) 0.54
Table 13: PV Energy system requirements
4.2 FinancialAnalyses
A financial model was created to draw a comparison and to evaluate the financial viability of
the respective systems. The basis of the model is a comparison between the implementation
of shallow geothermal technology as opposed to an electrical geyser for water heating and

Copyright UCT
47
equivalent space cooling/heating capacity using conventional electric air conditioners.
Furthermore, it is compared on the basis of a comparison to a PV installation supplying
adequate energy to the air conditioners combined with a solar geyser. These models take on
a number of assumptions:
All assumptions made in the calculation of the projected Eskom tariffs (Table 8).
The shallow geothermal installation and subsequent running costs are taken as costs.
The net present value and rate of return of a shallow geothermal system as opposed to
a geyser and air conditioners using grid electricity was calculated. This was achieved
by taking the running costs of the geyser and air conditioning units as the income, or
savings of the project.
The period is taken over 15 years as this is minimum typical useful life of shallow
geothermal technology.
The results of the financial analyses are illustrated in the following tables and will
subsequently be discussed.

Copyright UCT
48
Shallow Geothermal
Period (yr) 0 1 2 3 4 5 6 7 8 9 10 11 12 13 14 15 16
Initial Cost -500 000 - - - - - - - - - - - - - - - -
Electricity
Cost (c/kWh) - 105 133 147 163 180 199 221 235 250 266 283 301 320 341 362 386
Electricity
Usage (kWh) - 11 884 11 884 11 884 11 884 11 884 11 884 11 884 11 884 11 884 11 884 11 884 11 884 11 884 11 884 11 884 11 884
Electricity
Cost (R pa) - -12 520 -15 762 -17 454 -19 328 -21 402 -23 700 -26 244 -27 920 -29 703 -31 600 -33 619 -35 766 -38 050 -40 480 -43 066 -45 816
Total -500 000 -12 520 -15 762 -17 454 -19 328 -21 402 -23 700 -26 244 -27 920 -29 703 -31 600 -33 619 -35 766 -38 050 -40 480 -43 066 -45 816
Cumulative
Total -500 000 -512 520 -528 283 -545 737 -565 065 -586 467 -610 167 -636 410 -664 330 -694 033 -725 633 -759 252 -795 018 -833 068 -873 548 -916 614 -962 430
Table 14: Shallow Geothermal financial projections

Copyright UCT
49
Electric Geyser
Period (yr) 0 1 2 3 4 5 6 7 8 9 10 11 12 13 14 15 16
Initial cost -8 399
Electricity
Usage (kWh) - 3 672 3 672 3 672 3 672 3 672 3 672 3 672 3 672 3 672 3 672 3 672 3 672 3 672 3 672 3 672 3 672
Electricity
Cost (R pa) - -3 868 -4 870 -5 393 -5 972 -6 613 -7 323 -8 109 -8 627 -9 178 -9 764 -10 387 -11 051 -11 757 -12 507 -13 306 -14 156
Total -8 399 -3 868 -4 870 -5 393 -5 972 -6 613 -7 323 -8 109 -8 627 -9 178 -9 764 -10 387 -11 051 -11 757 -12 507 -13 306 -14 156
Cumulative
Total -8 399 -12 267 -17 138 -22 531 -28 502 -35 115 -42 438 -50 547 -59 173 -68 351 -78 114 -88 502 -99 552 -111 309 -123 816 -137 123 -151 279
Table 15: Electric Geyser financial projections

Copyright UCT
50
Electric Air Conditioning
Period (yr) 0 1 2 3 4 5 6 7 8 9 10 11 12 13 14 15 16
Initial Cost -47 698
Electricity
Usage (kWh) - 43 728 43 728 43 728 43 728 43 728 43 728 43 728 43 728 43 728 43 728 43 728 43 728 43 728 43 728 43 728 43 728
Electricity
Cost (R pa) - -46 067 -57 996 -64 222 -71 115 -78 749 -87 202 -96 562 -102 729 -109 291 -116 271 -123 697 -131 598 -140 003 -148 945 -158 458 -168 579
Total -47 698 -46 067 -57 996 -64 222 -71 115 -78 749 -87 202 -96 562 -102 729 -109 291 -116 271 -123 697 -131 598 -140 003 -148 945 -158 458 -168 579
Cumulative
Total -47 698 -93 765 -151 761 -215 983 -287 099 -365 848 -453 049 -549 611 -652 341 -761 631 -877 903 -1 001 600 -1 133 198 -1 273 201 -1 422 146 -1 580 604 -1 749 183
Table 16: Air Conditioning financial projections

Copyright UCT
51
Photovoltaic system
Period (years) 0 1 2 3 4 5 6 7 8 9 10 11 12 13 14 15 16
Initial cost (PV) -150 000 0 0 0 0 0 0 0 0 0 0 0 0 0 0 0 0
Initial cost (Air conditioners)
-47 698 0 0 0 0 0 0 0 0 0 0 0 0 0 0 0 0
Initial cost (Solar Geyser)
-9 920 0 0 0 0 0 0 0 0 0 0 0 0 0 0 0 0
Total -207 618 0 0 0 0 0 0 0 0 0 0 0 0 0 0 0 0
Air conditioner (kW) 0 0
Grid Electricity usage (kWh) - 21 864 21 864 21 864 21 864 21 864 21 864 21 864 21 864 21 864 21 864 21 864 21 864 21 864 21 864 21 864 21 864
PV Electricity generated
- 44 460 44 460 44 460 44 460 44 460 44 460 44 460 44 460 44 460 44 460 44 460 44 460 44 460 44 460 44 460 44 460
PV Electricity to grid - 22 596 22 596 22 596 22 596 22 596 22 596 22 596 22 596 22 596 22 596 22 596 22 596 22 596 22 596 22 596 22 596
Electricity cost (c/kWh) - 105 133 147 163 180 199 221 235 250 266 283 301 320 341 362 386
Electricity cost (R pa) - -23 034 -28 998 -32 111 -35 558 -39 374 -43 601 -48 281 -51 365 -54 645 -58 136 -61 849 -65 799 -70 002 -74 473 -79 229 -84 289
Feed in Tariff (R/kWh) - 2.31 2.31 2.31 2.31 2.31 2.31 2.31 2.31 2.31 2.31 2.31 2.31 2.31 2.31 2.31 2.31
Feed in Tariff (R pa) - 52 197 52 197 52 197 52 197 52 197 52 197 52 197 52 197 52 197 52 197 52 197 52 197 52 197 52 197 52 197 52 197
Total cost with REFIT -207 618 29 163 23 199 20 086 16 639 12 822 8 596 3 916 832 -2 449 -5 939 -9 652 -13 602 -17 805 -22 276 -27 032 -32 093
Total cost without REFIT
-207 618 -23 034 -28 998 -32 111 -35 558 -39 374 -43 601 -48 281 -51 365 -54 645 -58 136 -61 849 -65 799 -70 002 -74 473 -79 229 -84 289
Table 17: PV financial projections (REFIT and no REFIT)

Copyright UCT
52
Shallow Geothermal financial viability calculation
Period (yr) 0 1 2 3 4 5 6 7 8 9 10 11 12 13 14 15 16
Shallow
Geothermal -500 000 -12 520 -15 762 -17 454 -19 328 -21 402 -23 700 -26 244 -27 920 -29 703 -31 600 -33 619 -35 766 -38 050 -40 480 -43 066 -45 816
Geyser and
Air
conditioning
56 097 49 936 62 867 69 615 77 087 85 362 94 524 104 671 111 356 118 468 126 035 134 085 142 649 151 760 161 453 171 765 182 735
Total -443 903 37 416 47 104 52 161 57 759 63 959 70 825 78 427 83 436 88 765 94 435 100 466 106 883 113 710 120 972 128 699 136 919
NPV 938 032
IRR 207%
Table 18: Shallow Geothermal financial viability calculation

Copyright UCT
53
The results of the financial analyses for the corresponding systems can be seen individually in
Table 14 through Table 17. The financial viability of the shallow geothermal calculation is
illustrated in Table 18.
From the financial viability it can be concluded that shallow geothermal technology is a much
more cost efficient system over the long term. The expense in installing the system is quickly
offset by the saving in electricity costs. Should Table 18 be discounted (at 8%), the net
present value of a shallow geothermal installation is R230 000 and the rate of return of this
project is 81% over 15 years or 5.4% pa.
Figure 4-1: Cumulative financial projections (Shallow Geothermal vs. Geyser and Air conditioner)
Figure 4-1 illustrates the cumulative financial projections for the shallow geothermal system,
conventional heating and cooling with air conditioners and geysers for a 250m2 area with 8
hours per day utilisation. The PV system shown is with a 4 hour PV usage and a 4 hour grid
usage combined with a solar geyser and no REFIT. The cumulative projections include the
installation costs and the subsequent costs incurred in Eskom’s electricity usage. Detailed
calculations of these can be seen in Table 14 through Table 17.
‐2,000,000
‐1,800,000
‐1,600,000
‐1,400,000
‐1,200,000
‐1,000,000
‐800,000
‐600,000
‐400,000
‐200,000
‐
0 5 10 15 20
ZAR
Period (years)
Shallow Geothermal, Conventional and PV comparison
Shallow Geothermal
Geyser + Air conditioner
PV

Copyright UCT
54
The first comparison is between the geothermal and conventional system and all refer to
Figure 4-1. The break-even point is reached after 7 years and 5 months. The geothermal
system is cumulatively considerably cheaper than the conventional system. In nominal terms
the difference is roughly R1mil.
Secondly, consider the PV system compared to that of the conventional system. The PV
system breaks even at 5 years, shorter than that of the geothermal system. It is cumulatively
cheaper by roughly the same amount as that of the geothermal system.
Lastly, consider the PV system compared to the geothermal system. The PV system is
cheaper than the geothermal system almost for the entire life of 15 years. Should the
assumed usage hours differ, the angle of these graphs would alter, effectively resulting in
different systems being more cost effective.
These projections clearly illustrate that should the capital be available to install a shallow
geothermal system or PV system, the total cumulative cost over the life of 15 years is
basically the same. Both of these systems are a cheaper alternative to that of the conventional
energy usage from Eskom.
4.3 Sensitivityanalyses
Further analyses were done on a more general ground. This was done by comparing the costs
of the different systems on an area or per square meter basis, rather than the assumed usage
hours. A sensitivity analysis was done with regards to the hours per day usage and the area
covered by the installation. The financial calculations done are illustrated. (Table 19 to Table
22). The costs illustrated in Figure 4-2 and Figure 4-3 are calculated by taking the total
nominal cost over a life of 15 years, and then dividing this by the area covered, to obtain a
cost per square meter.
The following calculations were calculated for the purpose of a sensitivity analysis of cost per
area compared to the utilisation of a particular system.

Copyright UCT
55
Geothermal system
Period Electricity cost
(c/kWh)
Heating/Cooling capacity 6.23 7.92 9.80 11.79 15.13 20.74 26.88 37.77 56.27
Installation 160 000 200 000 240 000 280 000 350 000 490 000 629 866 900 000 1 320 000
Electricity Usage (kWh) 1.32 1.65 1.94 2.34 2.94 4.07 5.50 7.75 11.50
Coverage area (m2) 80 100 120 140 175 245 314.9328 450 660
Utilisation (hours/day) 0 -160 000 -200 000 -240 000 -280 000 -350 000 -490 000 -630 000 -900 000 -1 320 000
2 1 105 -1 015 -1 269 -1 492 -1 800 -2 261 -3 130 -4 230 -5 960 -8 844
2 133 -1 278 -1 598 -1 878 -2 266 -2 847 -3 941 -5 325 -7 504 -11 134
3 147 -1 415 -1 769 -2 080 -2 509 -3 152 -4 364 -5 897 -8 309 -12 329
4 163 -1 567 -1 959 -2 303 -2 778 -3 490 -4 832 -6 530 -9 201 -13 653
5 180 -1 735 -2 169 -2 550 -3 076 -3 865 -5 351 -7 231 -10 188 -15 118
6 199 -1 922 -2 402 -2 824 -3 406 -4 280 -5 925 -8 007 -11 282 -16 741
7 221 -2 128 -2 660 -3 127 -3 772 -4 739 -6 561 -8 866 -12 493 -18 538
8 235 -2 264 -2 830 -3 327 -4 013 -5 042 -6 980 -9 432 -13 291 -19 722
9 250 -2 408 -3 010 -3 540 -4 269 -5 364 -7 426 -10 035 -14 140 -20 982
10 266 -2 562 -3 203 -3 766 -4 542 -5 707 -7 900 -10 676 -15 043 -22 322
11 283 -2 726 -3 407 -4 006 -4 832 -6 071 -8 405 -11 358 -16 004 -23 748
12 301 -2 900 -3 625 -4 262 -5 141 -6 459 -8 941 -12 083 -17 026 -25 264
13 320 -3 085 -3 856 -4 534 -5 469 -6 871 -9 513 -12 855 -18 114 -26 878
14 341 -3 282 -4 103 -4 824 -5 818 -7 310 -10 120 -13 676 -19 270 -28 595
15 362 -3 492 -4 365 -5 132 -6 190 -7 777 -10 766 -14 549 -20 501 -30 421
16 386 -3 715 -4 644 -5 460 -6 585 -8 274 -11 454 -15 479 -21 811 -32 364
Total cost over life -197 494 -246 868 -295 105 -346 467 -433 510 -605 607 -786 226 -1 120 137 -1 646 655
R/m2 -2 469 -2 469 -2 459 -2 475 -2 477 -2 472 -2 496 -2 489 -2 495
Table 19: Shallow Geothermal sensitivity analysis for 2 hours per day utilisation

Copyright UCT
56
Air Conditioning & Geyser
Period Electricity cost (c/kWh)
Size (Btu) 22 000 24 000 22 000 24 000 30 000 30 000 30 000 30 000 30 000
Quantity required 2 2 3 3 3 4 5 8 11
Unit cost 7 524 8 550 7 524 8 550 11 058 11 058 11 058 11 058 11 058
Electricity Usage (per unit (kW)) 2.9 2.3 2.9 2.3 3.0 3.0 3 3 3
Electricity Usage (total (kW)) 5.8 8.7 8.7 6.9 9 12 15 24 33
Heating/Cooling capacity per unit (kW) 6.1 6.7 6.1 6.7 8.8 8.8 8.8 8.8 8.8
Heating/cooling capacity total (kW) 12.2 13.4 18.3 20.1 26.4 35.2 44 70.4 96.8
Geyser Installation cost 8399 8399 8399 8399 8399 8399 8399 8399 8399
Electricity usage (kWh/month) 306 306 306 306 306 306 306 306 306
Coverage area (m2) (per unit) 43 47 43 47 60 60 60 60 60
Coverage area (m2) (total) 85 94 129 141 180 240 300 480 660
Utilisation (hours/day) = 2 Total cost per annum
0 - -23 447 -25 499 -30 971 -34 049 -41 573 -52 631 -63 689 -96 863 -130 037
1 105 -8 329 -10 559 -10 559 -9 175 -10 790 -13 097 -15 404 -22 326 -29 247
2 133 -10 486 -13 294 -13 294 -11 551 -13 584 -16 489 -19 393 -28 107 -36 821
3 147 -11 611 -14 720 -14 720 -12 791 -15 042 -18 258 -21 475 -31 124 -40 773
4 163 -12 858 -16 301 -16 301 -14 164 -16 657 -20 218 -23 780 -34 465 -45 150
5 180 -14 238 -18 050 -18 050 -15 684 -18 445 -22 389 -26 332 -38 164 -49 996
6 199 -15 766 -19 988 -19 988 -17 367 -20 424 -24 792 -29 159 -42 261 -55 363
7 221 -17 458 -22 133 -22 133 -19 232 -22 617 -27 453 -32 289 -46 797 -61 305
8 235 -18 573 -23 547 -23 547 -20 460 -24 061 -29 206 -34 351 -49 786 -65 221
9 250 -19 760 -25 051 -25 051 -21 767 -25 598 -31 072 -36 545 -52 966 -69 386
10 266 -21 022 -26 651 -26 651 -23 157 -27 233 -33 056 -38 879 -56 349 -73 818
11 283 -22 364 -28 353 -28 353 -24 636 -28 972 -35 168 -41 363 -59 948 -78 533
12 301 -23 793 -30 164 -30 164 -26 209 -30 823 -37 414 -44 004 -63 777 -83 549
13 320 -25 312 -32 090 -32 090 -27 883 -32 792 -39 803 -46 815 -67 850 -88 885
14 341 -26 929 -34 140 -34 140 -29 664 -34 886 -42 346 -49 805 -72 184 -94 562
15 362 -28 649 -36 321 -36 321 -31 559 -37 114 -45 050 -52 986 -76 794 -100 602
16 386 -30 479 -38 640 -38 640 -33 575 -39 485 -47 927 -56 370 -81 699 -107 027

Copyright UCT
57
Total cost for life -331 075 -415 501 -420 973 -372 922 -440 096 -536 368 -632 641 -921 458 -1 210 275
R/m2 -3877 -4420 -3263 -2645 -2445 -2235 -2109 -1920 -1834
Table 20: Air conditioning and geyser system sensitivity analysis for 2 hours per day utilisation
Further calculations were done in a similar manner to Table 19 and Table 20 to obtain the financial values for utilisation periods of 4, 6, 8 and 10
hours per day. A summary of the calculations are illustrated below:
Total cost over life of system per m2 (R/m2)
Utilisation
(hours/day)
Coverage area (m2) 80 100 120 140 175 245 315 450 660
2 Geothermal -2469 -2469 -2459 -2475 -2477 -2472 -2496 -2489 -2495
AC & Geyser -3877 -4420 -3263 -2645 -2445 -2235 -2109 -1920 -1834
4 Geothermal -2937 -2937 -2918 -2950 -2954 -2944 -2993 -2978 -2990
AC & Geyser -5806 -7049 -5179 -4035 -3865 -3655 -3529 -3340 -3254
6 Geothermal -3406 -3406 -3378 -3424 -3432 -3416 -3489 -3468 -3485
AC & Geyser -7735 -9678 -7095 -5425 -5285 -5075 -4949 -4760 -4674
8 Geothermal -3875 -3875 -3837 -3899 -3909 -3887 -3985 -3957 -3980
AC & Geyser -9664 -12307 -9010 -6815 -6706 -6496 -6370 -6180 -6094
10 Geothermal -4343 -4343 -4296 -4374 -4386 -4359 -4481 -4446 -4475
AC & Geyser -11593 -14936 -10926 -8205 -8126 -7916 -7790 -7601 -7515
Table 21: Total cost per m2 over life of system
Due to the straight line cost per area of a geothermal system Table 21 was slightly adapted to give Table 22. The geothermal cost per area is
constant throughout and is compared to the air conditioning and geyser costs.

Copyright UCT
58
Geothermal Air conditioning and Geyser
Utilisation
(hours/day)
Coverage (m2) 80 100 120 140 175 245 315 450 660
2 -2 469 -3 877 -4 420 -3 263 -2 645 -2 445 -2 235 -2 109 -1 920 -1 834
4 -2 937 -5 806 -7 049 -5 179 -4 035 -3 865 -3 655 -3 529 -3 340 -3 254
6 -3 406 -7 735 -9 678 -7 095 -5 425 -5 285 -5 075 -4 949 -4 760 -4 674
8 -3 875 -9 664 -12 307 -9 010 -6 815 -6 706 -6 496 -6 370 -6 180 -6 094
10 -4 343 -11 593 -14 936 -10 926 -8 205 -8 126 -7 916 -7 790 -7 601 -7 515
Table 22: Total cost per m2 over life of system

Copyright UCT
59
Figure 4-2: Cost per area compared to utilisation time
Figure 4-2 illustrates the different costs per area of both the geothermal installation as well as
the air conditioning and geyser systems as a function of the hour usage per day. The graphs
are drawn for utilisation periods of 2 through 10 hours per day for 7 days a week. Each line
(2hrs, 4hrs etc.) shows the associated costs per area for both the geothermal system as well as
the conventional system. This graph further illustrates the point that for low utilisation (less
than 2hrs and an area bigger than 200m2), geothermal heating/cooling will be the more
expensive option over the 15 years.
Figure 4-3 illustrates the costs per area for the same systems as in Figure 4-2, just illustrated
differently. Once again it can be seen that for low utilisation geothermal technology is the
more expensive option. The geothermal plot only has one plot for all coverage areas, as the
cost per area are essentially the same. The running cost is only dependant on the number of
usage hours per day, irrespective of the initial coverage area installed.
‐14000
‐12000
‐10000
‐8000
‐6000
‐4000
‐2000
0
0 2 4 6 8 10
Cost (R/m
2)
Area covered (m2)
Cost vs. Utilisation
Geothermal 2hrs
Geotherml 4 hrs
AC & G 2hrs
AC & G 4hrs
Geothermal 6 hrs
Geothermal 8 hrs
Geothermal 10 hrs
AC & G 6 hrs
AC & G 8 hrs
AC & G 10 hrs

Copyright UCT
60
Figure 4-3: Cost per area of geothermal, air conditioning and geysers as a function of utilisation time
The complete financial analyses for the PV system is (Table 17) done for a life of 15 years
that will provide the same heating/cooling capacity as that of the geothermal and the
conventional system.
A sensitivity analysis was done for the PV system, based upon the number of hours the
system will be used at night. The PV system for our hypothesis has a baseline or once off
cost of R207 618 should the system only be used during the day. However, this isn’t
practically possible in a residential application, where the system will often be utilised during
night time. Therefore an analysis was done compared to that of the shallow geothermal
system on a night usage basis (Figure 4-4). From Figure 4-4 it can be derived that the PV
system will indeed be a cheaper alternative to that of the geothermal system in the instance
where the system will be mostly used during the day, i.e. office block applications. This is
still true up to a usage of around 2 night hours per night, where after the geothermal system
‐14,000
‐12,000
‐10,000
‐8,000
‐6,000
‐4,000
‐2,000
‐
0 2 4 6 8 10 12
R/m
2
Usage (Hrs/day)
Geothermal and Airconditioning and Geyser cost (R/m2)
Geothermal
Air conditioning and Geyser 80m2
Air conditioning and Geyser 100m2
Air conditioning and Geyser 120m2
Air conditioning and Geyser 140m2
Air conditioning and Geyser 175m2
Air conditioning and Geyser 245m2
Air conditioning and Geyser 315m2
Air conditioning and Geyser 450m2
Air conditioning and Geyser 660m2
Air conditioning and Geyser (AC & G)

Copyright UCT
61
becomes the cheaper option. This is due to the much larger initial installation costs of the
geothermal system compared to that of the PV air conditioning alternative.
Figure 4-4: Sensitivity of Geothermal cost vs. PV night usage hours
‐12000
‐10000
‐8000
‐6000
‐4000
‐2000
0
0 2 4 6 8 10 12
R/m
2
Night hours
Geothermal cost per area vs. PV night usage hours
Geothermal
PV 80
PV 100
PV 120
PV 140
PV 175
PV 245
PV 315
PV 450
PV 660

Copyright UCT
62
4.4 CostBenefitAnalysis
4.4.1 Background
The cost benefit analysis (CBA) method, “provides a logical framework by means of which
projects can be evaluated, serving as an aid in the decision making process” (Mullins, Gehrig,
Mokaila, Mosaka, Mulder, & van Dijk, 2006).
CBA analysis was originally conceptualised for the public sector. The main reason for this is
that public sector decision making often falls outside of the bounds and rigours of the market
system (Mullins, Gehrig, Mokaila, Mosaka, Mulder, & van Dijk, 2006, p. 2). The non-
financial costs and benefits are often hidden and include the economic and social benefits or
costs of a particular project (Mullins, Gehrig, Mokaila, Mosaka, Mulder, & van Dijk, 2006).
This is what CBA identifies and strives to determine. “CBA is a technique which can be used
to determine the relative merits of alternative projects in order to reach a high degree of
economic efficiency in the application of funds. It is ideally suited to the evaluation of
capital projects, i.e. projects that require immediate capital expenditure but which only realise
net benefits over time” (Mullins, Gehrig, Mokaila, Mosaka, Mulder, & van Dijk, 2006, p.
14).
4.4.2 StepsinCBA
The following table illustrates the steps to be taken in order to successfully conclude a CBA.
Step Activity
1 Specification of purpose of the CBA and specification of project boundaries within
which the analysis is to be conducted.
Acquaint with all relevant factors pertaining to the problem.
2 Identification of all impacts i.e. costs and benefits generated by a project within the
boundaries specified for analysis. Further, it is important that the analysis should not
be done in terms of only a single set of parameters, but that a whole number of
critical scenarios should be investigated with the aid of sensitivity analysis.
3 Quantification of cost and benefit streams via direct measurement of the impact itself
or, if necessary, measurement of an appropriate proxy for the impact. If direct
measurement of the impact or proxy is not possible, the impact or proxy should be
estimated using appropriate estimation tools and techniques.
4 Impacts, which are difficult to measure, should nevertheless be recorded in
qualitative terms and if possible ranked in order of importance.

Copyright UCT
63
The analyst should also, as far as possible, quantify the social consequences of a
project, and where such quantification is not possible they should be reported
qualitatively.
5 Discounting of project cost and benefit streams to present values
6 Calculation of NPV, ERR and BCR to define the value of the project in economic
terms.
7 Sensitivity analysis on the cost and benefit streams. The analysis should be based on
risk factors, which have been identified in the project setting.
8 Interpretation and reporting of the results of the analysis.
Table 23: Steps in CBA (Mullins, Gehrig, Mokaila, Mosaka, Mulder, & van Dijk, 2006, p. 61)
4.4.3 PricesinCBA
It will be beneficial to the reader to note a few prices and how the principles and criteria in
calculating these values are applied.
Resources are limited and a particular community can only benefit from these resources as
long as they are available. It is therefore imperative that the applications of these resources
are used in an optimal manner to maximise the benefits through which the net community can
benefit (Mullins, Gehrig, Mokaila, Mosaka, Mulder, & van Dijk, 2006, p. 23). Mullins et al
(2006) go on to say that the value of these inputs and outputs depend largely on the level of
development of the economy in which the prices are determined. “Market prices of products
and services often do not reflect the real value (scarcity value) of products and services, since
governments interfere in the operation of product and services markets through, for example,
tariff protection, taxes or subsidies” (Mullins, Gehrig, Mokaila, Mosaka, Mulder, & van Dijk,
2006, p. 23).
They further go on to explain the efficient market and the use of shadow prices. “Scarce
resources are traded at specific prices, namely market prices. Provided certain conditions are
met, prices are the best criteria upon which the allocation of resources for specific uses can be
based. The assumption is that markets are perfectly competitive and that supply and demand
determines the prices of inputs and outputs. When the free operation of the markets is
interfered with, by for example the restriction or stimulation of either supply or demand or by
price interference, market prices do not reflect economic scarcity values and the use of
shadow prices becomes necessary” (Mullins, Gehrig, Mokaila, Mosaka, Mulder, & van Dijk,

Copyright UCT
64
2006). A shadow price is therefore a price where the market price does not truly reflect the
cost of the product or service, irrespective of the reason.
4.4.4 Socialdiscountrate
There are a number of points of departure in the economic literature regarding social discount
rate. “The points of departure in the literature can be divided broadly into three schools of
thought, namely those who argue that the discount rate should be equal to the marginal return
on capital (opportunity costs of capital), those whose argument rests on long-term real
interest rates (cost of funding to the State), and those who advocate a social time preference
rate” (Mullins, Gehrig, Mokaila, Mosaka, Mulder, & van Dijk, 2006, p. 40).
There is no consensus which method should be used, but the following points should be taken
into account (Mullins, Gehrig, Mokaila, Mosaka, Mulder, & van Dijk, 2006, p. 40):
The discount rate should not be influenced by business cycles, since the rate is aimed
at the long term welfare structure.
A low discount rate generally favours projects with a high initial capital cost and low
future current costs, while the opposite applies to high discount rates. Since labour
costs are part of current expenditure, a high discount rate favours the employment of
labour in future.
If the real social discount rate is lower than the real implicit discount rate in the
private sector, then investment by the public sector will be encouraged at the expense
of investment by the private sector. The larger the gap between the two, the stronger
the effect.
Mullins et al. (2006) are of the opinion that the current 8% discount rate is still applicable in
South Africa, and they even consider it to be quite generous.
4.4.5 CostsrelatingtoCBA
There are a number of costs involved in the geothermal and PV installations as proposed in
this report. The costs relevant to the calculation of the CBA should include all relevant costs
throughout the life of the particular project.

Copyright UCT
65
Costs applicable to the CBA are capital investment costs as well as operational and
maintenance costs. For the purpose of this report, the capital investment costs will include all
the costs incurred to install the particular system. The operational costs only include the
electricity usage from grid as there are no other foreseeable operational costs. The
maintenance costs will be negligible, and therefore will not form part of this calculation.
4.4.6 Benefits
4.4.6.1 Emissions
The benefits of using the proposed systems are essentially the savings realised due to less
grid electricity usage. Associated to grid electricity are a number of negative environmental
impacts. Eskom has published the following figures. These figures are based on 1 kWh of
electricity generation (Eskom Holdings Limited, 2011):
Environmental use per kWh
Coal usage 0.53 kg
Water usage 1.4 l
Ash produced 155 g
Particulate emissions 0.33 g
CO2 Emissions 0.99 kg
SO2 Emissions 7.75 g
NOx Emissions 4.18 g
Table 24: Environmental considerations per 1 kWh electricity generation
4.4.6.2 Environmentalcosts
Environmental costs of coal fired electricity generation were estimated at 5.5c/kWh in 2005
by Mosterd’s study (as cited in (Menzies, 2011)). This includes all emissions associated with
the generation of coal fired electricity, but exclude CO2 emissions.
To obtain the current price, the 5.5c/kWh is inflated at the published CPI rates (Statistics
South Africa, 2011) to obtain a price of 7.94 c/kWh (Table 25).
Year Inflation
rate
Price
(c/kWh)

Copyright UCT
66
2006 3.4% 5.69
2007 4.6% 5.95
2008 7.2% 6.38
2009 11.5% 7.11
2010 7.1% 7.62
2011 4.3% 7.94
Table 25: Environmental costs of coal fired electricity generation
4.4.6.3 Carboncosts
From the literature it is not entirely clear what the correct price of carbon for electricity
generation should be. This is supported by Grubb & Newbery (2007) which state that they
are of a similar opinion. They further state that it spans a whole range of economically
plausible prices. The difficulty lies in the fact that different countries take different views
and subsequently penalise differently for carbon emissions (Vivid Economics, 2010). Vivid
Economics (2010) prepared a report for the Climate Institute. Their findings compare the
price of carbon for electricity generation across six different countries. The UK has taken by
some distance, the strongest action in their findings and has imposed an implicit carbon price
of US$28 per ton of CO2. South Korea has the lowest estimated price, US$0.50 per ton of
CO2. For the purposes of this report we will assume a carbon price equivalent to that of the
UK (US$28) price, as determining the exact electricity sector carbon price in South Africa is
beyond the scope of this report. As at November 2010 the average ZAR/USD exchange rate
was 7.3884 for the period since 6/3/2011 till 29/11/2011. The minimum was 6.6719 on the
7th of July 2011 and the exchange peaked at 8.5823 on November 26th 2011. Therefore the
average Rand cost of carbon in the electricity sector will be 28 x 7.3884 = R206.87
4.4.7 CBACalculations
For the purpose of the CBA calculations the difference between the costs and benefits, the net
benefit, is discounted by the social discount rate. The sum of all these net benefits then
presents us with the net present value (NPV). In equation form this would be:
1
1

Copyright UCT
67
Equation 3: Net present value
The values used in the calculations and the associated assumptions are summarised in Table
26.
Value
Inflation (%) 6%
Social discount rate, i (%) 8%
Environmental cost (R/kWh) R0.0794
CO2 cost (per kg) R0.20687
CO2 produced (kg/kWh) 0.99
CO2 cost (R/kWh) R0.2048
Annual conventional electricity usage (kWh) 47 400
Annual Geothermal grid usage (kWh) 11 884
Annual PV grid usage (kWh) 21 900
Annual Geothermal saving (kWh) 35 516
Annual PV saving (kWh) 25 500
Table 26: CBA values
The environmental cost and the CO2 costs are calculated through simple arithmetic. (See
section 4.4.6.2 and 4.4.6.3) The annual savings are obtained from section 4.2.
Geothermal
Costs Benefits
Period Installation Price
(R/kWh)
Saving
(kWh)
Electricity (ZAR) CO2 Environmental Total Present value
(ZAR)
0 -500 000 -500 000 -500 000
1 1.05 35 516 37 416 7 274 2 820 47 510 43 991
2 1.33 35 516 47 105 7 710 2 989 57 804 49 558
3 1.47 35 516 52 161 8 173 3 169 63 502 50 410
4 1.63 35 516 57 760 8 663 3 359 69 782 51 292
5 1.80 35 516 63 960 9 183 3 560 76 703 52 203
6 1.99 35 516 70 826 9 734 3 774 84 333 53 144
7 2.21 35 516 78 428 10 318 4 000 92 746 54 116
8 2.35 35 516 83 437 10 937 4 240 98 614 53 278
9 2.50 35 516 88 766 11 593 4 495 104 854 52 453
10 2.66 35 516 94 436 12 289 4 764 111 489 51 641
11 2.83 35 516 100 467 13 026 5 050 118 544 50 841
12 3.01 35 516 106 884 13 808 5 353 126 045 50 054
13 3.20 35 516 113 711 14 636 5 674 134 021 49 279
14 3.41 35 516 120 974 15 514 6 015 142 503 48 517

Copyright UCT
68
15 3.62 35 516 128 700 16 445 6 376 151 521 47 766
16 3.86 35 516 136 920 17 432 6 758 161 110 47 027
NPV 305 569
IRR 6.26%
Table 27: Shallow geothermal CBA results
PV
Costs Benefits
Period Installation Price
(R/kWh)
Saving
(kWh)
Electricity
(ZAR)
CO2 Environmental Total Present
value
(ZAR)
0 -207 618 -207 618 -207 618
1 1.05 25 500 26 864 5 222 2 025 34 111 31 585
2 1.33 25 500 33 821 5 536 2 146 41 503 35 582
3 1.47 25 500 37 451 5 868 2 275 45 594 36 194
4 1.63 25 500 41 471 6 220 2 411 50 102 36 827
5 1.80 25 500 45 922 6 593 2 556 55 072 37 481
6 1.99 25 500 50 852 6 989 2 710 60 550 38 157
7 2.21 25 500 56 310 7 408 2 872 66 590 38 855
8 2.35 25 500 59 907 7 853 3 044 70 804 38 253
9 2.50 25 500 63 733 8 324 3 227 75 284 37 661
10 2.66 25 500 67 804 8 823 3 421 80 047 37 077
11 2.83 25 500 72 134 9 353 3 626 85 113 36 503
12 3.01 25 500 76 741 9 914 3 843 90 499 35 938
13 3.20 25 500 81 643 10 508 4 074 96 225 35 382
14 3.41 25 500 86 857 11 139 4 319 102 315 34 834
15 3.62 25 500 92 405 11 807 4 578 108 790 34 295
16 3.86 25 500 98 307 12 516 4 852 115 675 33 764
NPV 370 770
IRR 15.64%
Table 28: PV CBA results
For the shallow geothermal system the NPV is R305 569 with a rate of return of 6.26%. For
the PV system the NPV is R370 770 with a rate of return of 15.64%.
For a comparison between projects the benefit cost ratio (BCR) analysis is the preferred
criterion (Mullins, Gehrig, Mokaila, Mosaka, Mulder, & van Dijk, 2006, p. 52).
BCR Shallow
geothermal
PV
Present costs 500 000 207 618

Copyright UCT
69
Present benefits 805 569 578 388
Net present benefit 305 569 370 770
BCR 1.61 2.79
Table 29: BCR Results
From the results in Table 29 it is evident that the PV system will be the preferred project.
Having said this, both the geothermal and PV system are viable projects as they both have
positive NPV figures. It is important to note that should the usage differ to the assumed
usages in this report, the figures can alter quite significantly, i.e. more night hour’s usage
time etc.
4.5 Researchlimitations
The research report did have some limitations. Firstly, the report was limited to a specified
number of hours of usage of the respective systems. The section addressing the sensitivity
analyses addressed this limitation (see section 4.3). The sensitivity analyses aimed to
compare costs on a more general ground, through cost per area. This proved successful and
the results in this section illustrated the optimal systems to use in a particular scenario more
clearly.
Secondly, this research report is aimed only at the South African environment. All data and
relevant cost calculations are based on this fact. The different policies, heating and cooling
requirements and climate in different countries can significantly alter the findings of this
report.
5 ResearchConclusions
Renewable energy plays an integral role in the future of our energy needs and requirements.
As the literature suggests, current energy requirements just aren’t sustainable in the long run
by non-sustainable energy sources such as fossil fuels. Renewable energies are the only
current answer (apart from fissile) that can address this growing concern.
It can be argued by some degree that the trend in increasing costs of current energy
worldwide, that energy is already becoming a scarce resource. The common economic
supply and demand graph reinforces this, as the demand increases as it currently is, the
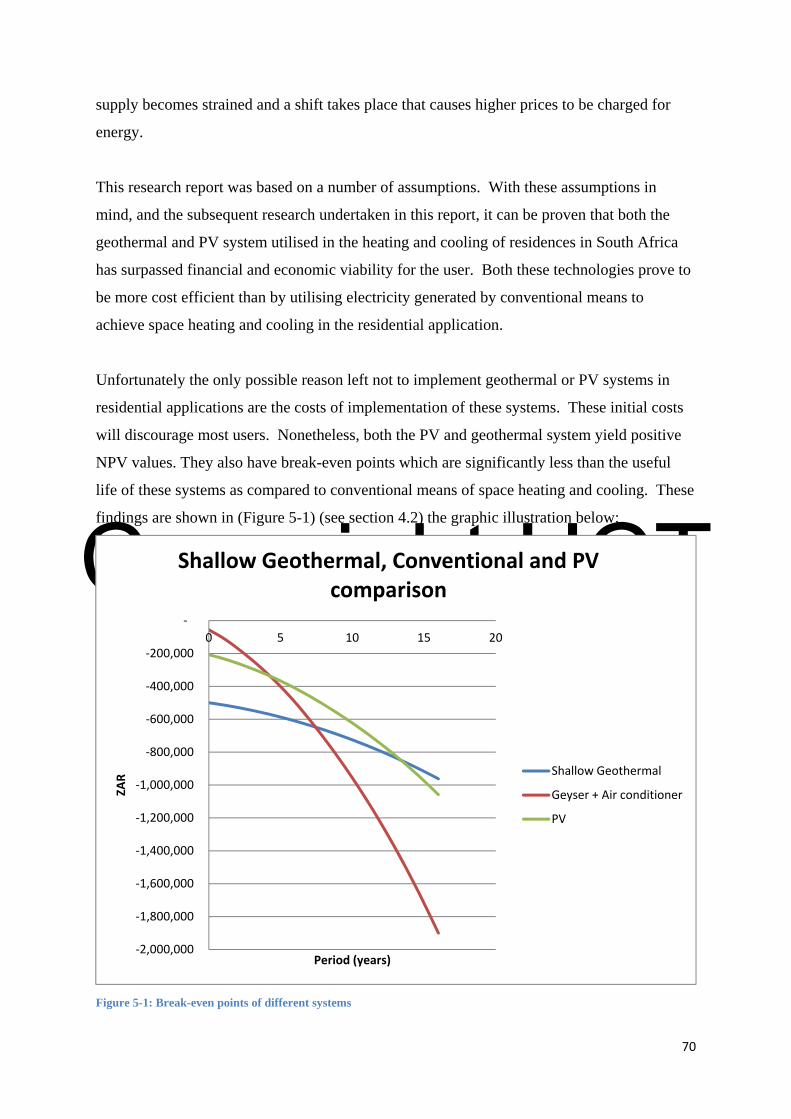
Copyright UCT
70
supply becomes strained and a shift takes place that causes higher prices to be charged for
energy.
This research report was based on a number of assumptions. With these assumptions in
mind, and the subsequent research undertaken in this report, it can be proven that both the
geothermal and PV system utilised in the heating and cooling of residences in South Africa
has surpassed financial and economic viability for the user. Both these technologies prove to
be more cost efficient than by utilising electricity generated by conventional means to
achieve space heating and cooling in the residential application.
Unfortunately the only possible reason left not to implement geothermal or PV systems in
residential applications are the costs of implementation of these systems. These initial costs
will discourage most users. Nonetheless, both the PV and geothermal system yield positive
NPV values. They also have break-even points which are significantly less than the useful
life of these systems as compared to conventional means of space heating and cooling. These
findings are shown in (Figure 5-1) (see section 4.2) the graphic illustration below:
Figure 5-1: Break-even points of different systems
‐2,000,000
‐1,800,000
‐1,600,000
‐1,400,000
‐1,200,000
‐1,000,000
‐800,000
‐600,000
‐400,000
‐200,000
‐
0 5 10 15 20
ZAR
Period (years)
Shallow Geothermal, Conventional and PV comparison
Shallow Geothermal
Geyser + Air conditioner
PV

Copyright UCT
71
When comparing PV and geothermal systems to each other, the advantages between the two
are less clear than when comparing them to conventional energy means. The system which
will truly be more efficient will depend upon each specific user, as the results are very
sensitive to usage time as well as what time of day or night these systems are being used. To
conclude this rather broadly, the shallow geothermal system will be better suited for
households with a lot of night usage hours, whereas the PV system will be the better option
for mainly day time users. This is a broad estimation, and only once the specific needs of the
households are determined will the correct system to be used known.
This report illustrates that both shallow geothermal and PV systems are viable technologies
that can be efficiently employed in residential applications of South Africa. To take it
further, these technologies are a much more efficient and better alternative to conventional
electricity usage as a means for space heating and cooling in South Africa.

Copyright UCT
I
6 FutureResearch
This report was based on a number of assumptions. The main assumptions that could alter
the findings of this report are
Size of cooling/heating area
Number of rooms in residence
Total usage time
Usage split between night and day
Should these assumptions change, favour will fall the way of either system, and could even
fall the way of conventional means, i.e. by using only grid electricity in extremely small
usage cases. It will be beneficial to research more in depth the sensitivities of these
respective systems to the assumptions mentioned above. This report briefly touches on these
points, but the basis is determined on the assumptions made and stated in this report.
Another assumption made in this report is the fact that feed back to grid possibilities are not
yet available for the small IPP. This could change in the future, as this is a policy decision
and not an operational limitation. This would make PV installations even more attractive.
The findings in this report and the methods used could be adjusted to take benefit of the
REFIT possibility, which would be of great advantage to the PV system as described in this
report.

Copyright UCT
II
Appendices
AppendixA
GeneralTariffPrinciples(GovernmentGazette,2008)
Section 16 of the Electricity Regulation Act of 2006 states that the setting of prices, charges,
tariffs and the regulation of revenues:
a. must enable an efficient licensee to recover the full cost of its licensed activities,
including a reasonable margin or return;
b. must provide for or prescribe incentives for continued improvement of the technical
and economic efficiency with which services are to be provided;
c. must give end users proper information regarding the costs that their consumption
imposes on the licensee's business;
d. must avoid undue discrimination between customer categories; and
e. may permit the cross-subsidy of tariffs to certain categories of customers.
The Act further states that a licensee may not charge a customer any other tariff and use
provisions in agreements other than those determined or approved by NERSA as part of its
licensing conditions.
Notwithstanding the above, NERSA may in prescribed circumstances approve a deviation
from set or approved tariffs. Other principles from the LGMSA are:
a. Users of municipal services should be treated equitably in the application of tariffs.
b. The amount individual users pay for services should generally be in proportion to
their use of that service.
c. Low income households must have access to at least basic services through: tariffs
that cover only operating and maintenance costs; special tariffs or life line tariffs for
low levels of use or consumption of services or for basic levels of service; or any
other direct or indirect method of subsidisation of tariffs for low income households.
d. Tariffs must reflect the costs reasonably associated with rendering the service,
including capital, operating, maintenance, administration and replacement costs, and
interest charges.
e. Tariffs must be set at levels that facilitate the financial sustainability of the service,
taking into account subsidisation from sources other than the service concerned.

Copyright UCT
III
f. Provision may be made in appropriate circumstances for a surcharge on the tariff for a
service.
g. Provision may be made for the promotion of local economic development through
special tariffs for categories of commercial and industrial users.
h. The economical, efficient and effective use of resources, the recycling of waste and
other appropriate environmental objectives must be encouraged.
i. The extent of subsidisation of tariffs for low income households and other categories
of users should be fully disclosed.
j. A tariff policy may differentiate between different categories of users, debtors, service
providers, services, service standards, geographical areas and other matters as long as
such differentiation does not amount to unfair discrimination.
This can be summarised in
Stakeholder Tariff objectives Description
Customer Affordable Price levels should assume an efficient and prudent utility,
in other words prices should be based on least cost options
and exclude inefficiencies
Non-discriminatory Tariffs should be equitable and fair
Tariffs should be
equitable and fair
Tariffs should be equitable and fair
Transparent and
unbundled
Full disclosure of cost (no hidden charges). Cost should be
unbundled. Tariffs should be easy to understand and apply
Utility Cost-reflective Prices should reflect the full cost (including a reasonable
risk adjusted margin or return) to supply electricity and
ensure that the industry is economically viable, stable and
fundable in the short, medium and long term
Efficient use Tariffs should promote overall demand and supply side
economic efficiency, and be structured to encourage
sustainable, efficient and effective usage of electricity
User-must pay A link between the price a user must pay to the cost of
serving that user
State Social support Tariff levels and structures should accommodate social
programmes
Environmentally The production and transport of electricity should be done

Copyright UCT
IV
responsible in a sustainable way and be mindful of the impact on the
environment
Sufficiency in
generation capacity
Expansion through development of least cost options
resources in line with national resource planning
State subsidies Industry needs to achieve and maintain financial
sustainability without on-going State subsidies. This does
not preclude provision for targeted subsidies such as FBE
Returns Fair and equitable
Table 30: Summary of Tariff objectives (Government Gazette, 2008)

Copyright UCT
V
AppendixB
Municipaltariffguideline
Table 31: Determination of the municipal tariff guideline and the revision of municipal tariff benchmarks (NERSA, 2010)
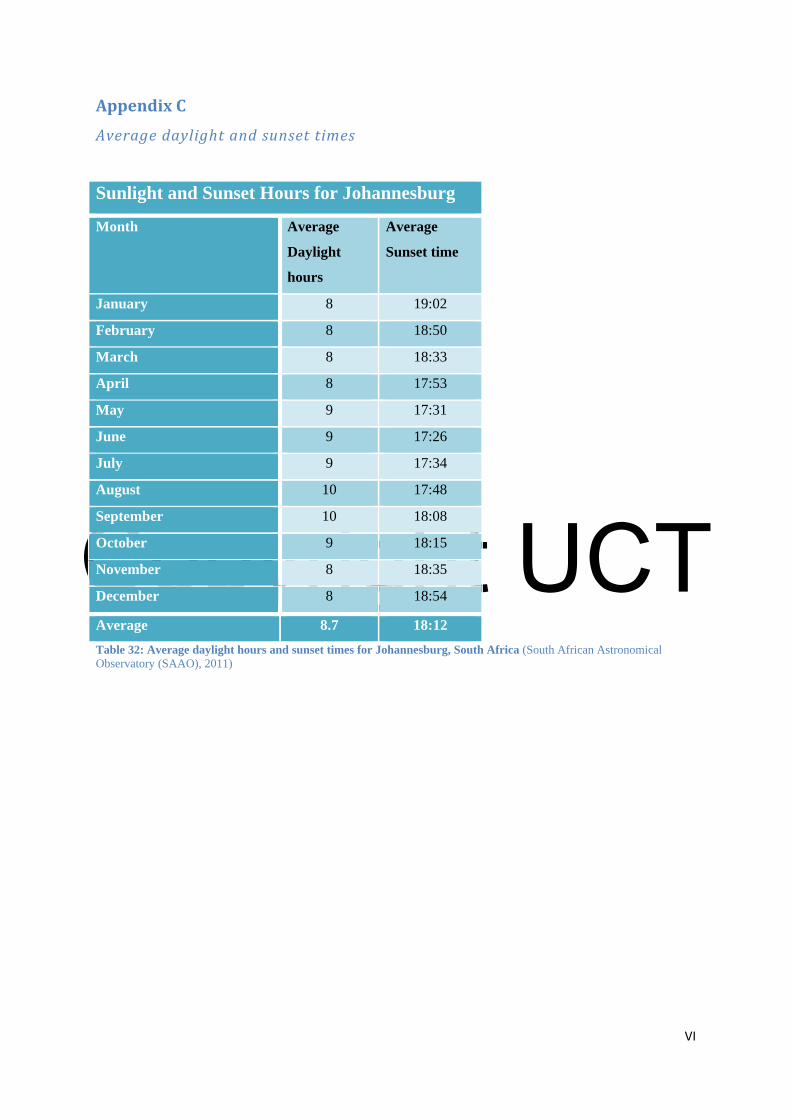
Copyright UCT
VI
AppendixC
Averagedaylightandsunsettimes
Table 32: Average daylight hours and sunset times for Johannesburg, South Africa (South African Astronomical Observatory (SAAO), 2011)
Sunlight and Sunset Hours for Johannesburg
Month Average
Daylight
hours
Average
Sunset time
January 8 19:02
February 8 18:50
March 8 18:33
April 8 17:53
May 9 17:31
June 9 17:26
July 9 17:34
August 10 17:48
September 10 18:08
October 9 18:15
November 8 18:35
December 8 18:54
Average 8.7 18:12

Copyright UCT
VII
7 Bibliography
4ecotips.com. (2006, May 9). Retrieved August 14, 2011, from http://www.4ecotips.com
UK Groundwater Forum. (2011). Retrieved August 14, 2011, from
http://www.groundwateruk.org
Allan, M., & Philippacopoulos, A. (1999). Groundwater protection issues with geothermal
heat pumps. Geothermal Resour Coun Trans, 23, 101-105.
Altener Project. (2002). Promoting solar air conditioning: technical overview of active
techniques.
Arvizu, D., Balay, P., Cabeza, L., Hollands, T., Jäger‐Waldau, A., Kondo, M., et al. (2011).
Direct solar energy. Cambridge, New York City: Cambridge University Press.
Bailey, S., Brinker, D., Curtis, H., Jenkins, P., & Scheiman, D. (1997). Solar Cell Calibration
and Measurement Techniques. Technical Memorandum 113155, NASA, Cleveland,
OH, USA.
Balaras, C. A. (2006). Solar Cooling - An Overview ef Eurepean Applications & Design
Guidelines. ASHRAE Journal, 14-22.
Balat, M. (2006). Solar Technological Progress and Use of Solar Energy in the World.
Energy sources, 28, 979-994.
Boden, T., & Marland, G. (2010). Global Carbon Dioxide Emissions from Fossil-Fuel
Burning, Cement Manufacture, and Gas Flaring: 1751-2007. Carbon Dioxide
Information Analysis Center, Oak Ridge National Laboratory, Oak Ridge, TN.
Carrier. (2011). GT-PX Geothermal Heat Pump. Retrieved November 18, 2011, from Carrier:
http://www.residential.carrier.com/products/geothermalheatpumps/gt-px.shtml
Chigo South Africa. (2011). Chigo Air Conditioning. Retrieved November 17, 2011, from
http://www.chigo.co.za/
Cleveland, C., Costanza, R., Hall, C., & Kaufmann, R. (1984). Energy and the US economy:
A biophysical perspective. Science, 890-897.
Collis, J., & Hussey, R. (2003). Business Research: A Practical Guide for Undergraduate
and Postgraduate Students. Basingstoke: Palgrave Macmillan.
Crabtree, G. W., & Lewis, N. S. (2007, March). Solar energy conversion. Physics Today, 37-
42.
Curtis, R., Lund, J., Sanner, B., Rybach, L., & Hellström, G. (2008). Ground Source Heat
Pumps - Geothermal Energy for Anyone, Anywhere: Current Worldwide Activity.
Proceedings World Geothermal Congress 2005, (pp. 1-8). Antalya, Turkey.

Copyright UCT
VIII
de Vries, B., van Vuuren, D., & Hoogwijk, M. (2007). Renewable energy sources: Their
global potential for the first half of the 21st century at a global level: An integrated
approach. Energy Policy, 35(4), 2590-2610.
Delorme, M., Six, R., Mugnier, D., Quinette, J., Richler, N., Heunemann, F., et al. (2004).
Climasol: solar air conditioning guide.
Demirbas, A. (2009). Global renewable energy projections. Energy Sources, Part B, 4, 212-
224.
Department of Minerals and Energy. (2011). Solar-power. Retrieved November 21, 2011,
from Renewable energy: http://www.energy.gov.za
Edkins, M., Marquard, A., & Winkler, H. (2010). South Africa's renewable energy policy
roadmaps. Cape Town: Energy Research Centre.
Eskom. (2007). Eskom. Retrieved November 3, 2011, from
http://www.eskom.co.za/c/56/eskom-solar-water-heating-programme/
Eskom. (2009). Annual Report 2009. Johanesburg: Eskom.
Eskom. (2009b). Proposed Revenue Applicaiton: Multi-year price determination 2010/11 to
1012/13 (MYPD2). Johannesburg: Eskom holdings.
Eskom. (2010). EskomIDM. Retrieved November 16, 2011, from
http://www.eskomidm.co.za/powerCalculator/?q=energy_calculator
Eskom. (2011). Eskom. Retrieved August 21, 2011, from
http://www.eskom.co.za/content/priceincrease2011.pdf
Eskom Holdings Limited. (2011). Eskom Holdings Limited Integrated Report 2011. Eskom.
Friedleifsson. (2001). Geothermal energy for the benefit of the people. Renew. Sustain.
Energy, 5, 299-312.
Goldstein, B., Hiriart, G., Bertani, R., Bromley, C., Gutiérrez‐Negrín, L., Huenges, E., et al.
(2011). Geothermal Energy. In IPCC Special Report on Renewable Energy Sources
and Climate Change Mitigation. Cambridge, New York: Cambridge University Press.
Government Gazette. (2008, June). Electricity pricing policy. Retrieved November 5, 2011,
from Polity: www.polity.org.za
Grubb, M., & Newbery, N. (2007). Pricing Carbon for Electricity Generation: National and
International Dimensions. Cambridge: University of Cambridge.
Guardiola, S., Gabay, G., & Moskowitz, H. (2009). Renewable energy; tapping and typing
the citizen's mind. Humanomics, 25(4), 254-267.
Halliday, S. P., Beggs, C., & Sleigh, P. (2002). The use of solar desiccant cooling in the UK:.
Applied Thermal Engineering, 22, 1327-1338.

Copyright UCT
IX
Henning, H. (2007). Solar assisted air conditioning of buildings - an overview. Applied
Thermal Engineering, 27, 1734-1749.
Hofman, Y., de Jager, D., Molenbroek, E., Schilig, F., & Voogt, M. (2002). The Potential of
Solar Electricity to reduce CO2 Emissions. Utrecth, Netherlands: Ecofys.
Hoogwijk, M. (2004). On the Global and Regional Potential of Renewable Energy Sources.
Utrecht University, Department of Science Technology and Society, Utrecht,
Netherlands.
IEA Heat pump centre. (n.d.). IEA Heat Pump Centre. Sittar, Netherlands.
International Energy Agency. (2006). 2006 Annual Report. Washington DC.
International Energy Agency. (2010). Key World Energy Statistics. Paris.
IPCC. (2011). Summary for Policymakers: IPCC Special Report on Renewable Energy
Sources and Climate. Cambridge, United Kingdom and New York, NY, USA:
Cambridge University Press.
Iqbal, M. (1984). An Introduction to Solar Radiation. New York: Academic Press.
Kalogirou, A. (2004). Solar thermal collectors and applications. Progress Energy Combust.
Sci., 30, 231-295.
Kankam, S., & Boon, E. (2009). Energy deliverd and utilization for rural development:
Lessons from Northern Ghana. Energy for Sustainable Development, 13(3), 212-218.
Kaygusuz, K. K. (2008). The Future of Nuclear Power and Renewable Energy Sources in the
European Union. Energy Sources Part B: Economics, Planning & Policy, 3(4), 348-
361.
Kumar, A., Schei, T., Ahenkorah, A., Rodrigues, R., Devarney, J., Freitas, M., et al. (2011).
Hydropower IPCC Special Report on Renewable Energy Sources and Climate
Change Mitigation. Cambridge, United Kingdom: Cambridge University Press.
Kwikot. (2010). Kwikot. Retrieved November 17, 2011, from http://www.kwikot.co.za
Kyasol. (2011). Kyasol. Retrieved November 18, 2011, from http://www.kyasol.co.za
Layard, R., & Glaister, S. (1994). Cost Benefit Analysis. Cambridge: Cambridge University
Press.
Leedy, P., & Ormrod, J. (2005). Practical Research: Planning and Design (8th ed.). New
Jersey: Pearson Prentice Hall.
Lund, J., Freeston, D., & Boyd, T. (2010). Direct utilization of geothermal energy 2010
worldwide review. Proceedings World Geothermal Congress 2010, (pp. 25-30). Bali.

Copyright UCT
X
Menzies, G. H. (2011, January). An economic evaluation of a wind power electricity
generating farm in South Africa. Port Elizabeth, Eastern Cape, South Africa: Nelson
Mandela Metropolitan University.
Michaelson, R. (2011, June 20). South Africa: PV could be a "goldmine" if supported by
government.
Mock, J., Tester, J., & Wright, P. (1997). Geothermal energy from the Earth: Its potential
impact as an environmentally sustainable resource. Annual review of Energy and the
Environment, 22, 305-356.
Moomaw, W., Yamba, F., Kamimoto, M., Maurice, L., Nyboer, J., Urama, K., et al. (2011).
Introduction: IPCC Special Report on Renewable Energy Sources and Climate
Change Mitigation. Cambridge; New York City: Cambridge University Press.
Mullins, D., Gehrig, G., Mokaila, G., Mosaka, D., Mulder, L., & van Dijk, E. (2006). A
manual for cost benefit analysis in South Africa with specific reference to water
resource development.
Muneer, T., Asif, M., & Munawwar, S. (2005). Sustainable production of solar electricity
with particular reference to the Indian economy. Renewable and Sustainable Energy
Reviews, 9, 444-473.
Nadaï, A., & van der Horst, D. (2010). Introduction: Landscapes of Energies. Landscape
Research, 35(2), 143-155.
Naukkarinen, P. (2009). Solar air conditioning and its role in alleviating the energy crisis of
the Mediterranean hotels. International Journal of Sustainable Energy, 29(1-3), 93-
100.
NERSA. (2009). Renewable Energy Feed-In Tariffs Phase II. Johannesburg: National Energy
Regulator of South Africa.
NERSA. (2010). Indicative municipal tariff guideline, benchmarks and proposed timelines
for municipal tariff approval process for the 2011/2012 financial year.
NERSA. (2010b). NERSA's Decision on Eskom's required Revenue application - Multi Year
Price Determination 2011/12 to 2012/13 (MYPD 2).
Nfah, E., Ngundam, J., & Tchinda, R. (2007). Modelling of solar/diesel/battery hybrid power
systems for far-north Cameroon. Renewable Energy, 32(5), 932-844.
O’Brien, G., & O'Keefe, P. (2006). The future of nuclear power in Europe: A response.
Internation Journal of Environmental Studies(63), 121-130.
Omer, A. (2008). Ground-source heat pumps systems and applications. Renewable and
Sustainable Energy Reviews, 12, 344-371.

Copyright UCT
XI
Pelc, R., & Fujita, R. (2002). Renewable energy from the ocean. Marine Policy, 26(6), 471-
479.
Rogner, H. H., Barthel, F., Cabrera, M., Faaij, A., Giroux, M., Hall, D., et al. (2000). Energy
Resources. United Nations Development Programme, World Energy Council, United
Nations Department of Economic and Social Affairs, New York, USA.
Rybach, L. (2005). The advance of geothermal heat pumps world-wide. International Energy
Agency (IEA) Heat Pump Centre Newsletter, 23, pp. 13-18.
Sheehan, J., Cambreco, V., Duffield, J., Garboski, M., & Shapouri, H. (1998). An overview
of biodiesel and petroleum diesel life cycles. US Department of Agriculture and
Energy.
Solar Total. (2011). Retrieved November 20, 2011, from Solar Total:
http://www.solartotal.co.za
Solomon, S., D. Qin, M., Manning, R., Alley, T., Berntsen, N., Bindoff, Z., et al. (2007).
Climate Change 2007: The Physical Science Basis. Cambridge, New York City:
Cambridge University Press.
South African Astronomical Observatory (SAAO). (2011). Johannesburg Sunrise and Sunset
in 2011 (SAST). Retrieved November 21, 2011, from South African Astronomical
Observatory (SAAO): http://www.saao.ac.za
South African Reserve Bank. (2009). South African Reserve Bank. Retrieved November 15,
2011, from
http://www.resbank.co.za/MonetaryPolicy/DecisionMaking/Pages/InflationMeasures.
aspx
Stefansson, V. (2000). The renewability of geothermal energy. World Geothermal Congress,
2, pp. 879-883.
Suanders, M., Lewis, P., & Thornhill, A. (2009). Research methods for business students.
Essex: Prentice Hall.
Sustainable. (2011). Solar-geysers. Retrieved November 21, 2011, from Sustainable:
http://www.sustainable.co.za
Taylor, G. (2007). Nuclear Energy and Global Sustainability. Social Alternatives, 26(2), 12-
17.
Tester, J., Drake, E., Golay, M., Driscoll, M., & Peters, W. (2005). Sustainable Energy -
Choosing Among Options. Cambridge, Massachusetts: MIT Press.
Topcu, Y., & Ulengin, F. (2004). Energy for the future: An integrated decision aid for the
case of Turkey. Energy, 29, 137-154.

Copyright UCT
XII
UNDP. (2000). Energy and the Challenge of Sustainability. United Nations Development
Programme. Paris, France.
Vivid Economics. (2010). The implicit price of carbon in the electricity sector of six major
economies. The Climate Institute.