residential research - content.knightfrank.com · apartments achieved 4.37%. the weighted average...
TRANSCRIPT
RESIDENTIAL RESEARCH
MARKET ACTIVITY REPORT FOR AUSTRALIAN CAPITAL CITIES & REGIONAL CENTRES
2
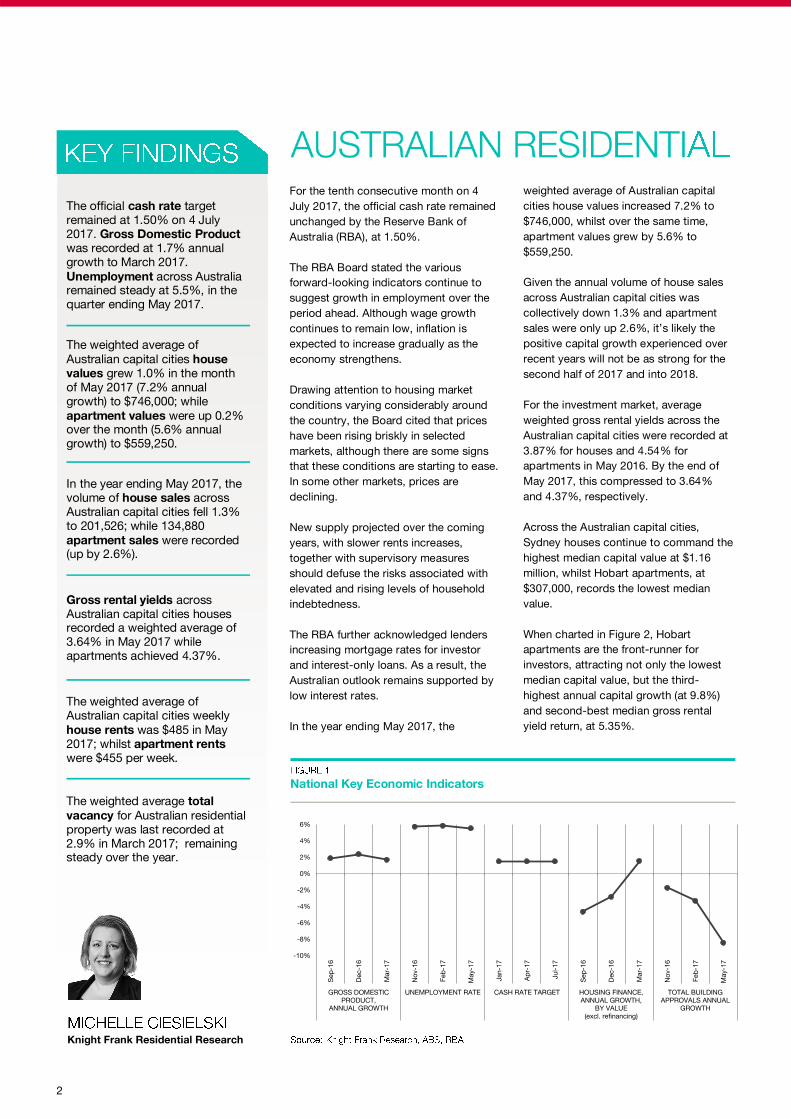
The official cash rate target
remained at 1.50% on 4 July
2017. Gross Domestic Product
was recorded at 1.7% annual
growth to March 2017.
Unemployment across Australia remained steady at 5.5%, in the
quarter ending May 2017.
The weighted average of
Australian capital cities house
values grew 1.0% in the month
of May 2017 (7.2% annual
growth) to $746,000; while
apartment values were up 0.2% over the month (5.6% annual
growth) to $559,250.
In the year ending May 2017, the
volume of house sales across
Australian capital cities fell 1.3%
to 201,526; while 134,880
apartment sales were recorded (up by 2.6%).
Gross rental yields across
Australian capital cities houses recorded a weighted average of
3.64% in May 2017 while
apartments achieved 4.37%.
The weighted average of
Australian capital cities weekly
house rents was $485 in May
2017; whilst apartment rents
were $455 per week.
The weighted average total
vacancy for Australian residential
property was last recorded at
2.9% in March 2017; remaining steady over the year.
Knight Frank Residential Research
National Key Economic Indicators
weighted average of Australian capital
cities house values increased 7.2% to
$746,000, whilst over the same time,
apartment values grew by 5.6% to
$559,250.
Given the annual volume of house sales
across Australian capital cities was
collectively down 1.3% and apartment
sales were only up 2.6%, it’s likely the
positive capital growth experienced over
recent years will not be as strong for the
second half of 2017 and into 2018.
For the investment market, average
weighted gross rental yields across the
Australian capital cities were recorded at
3.87% for houses and 4.54% for
apartments in May 2016. By the end of
May 2017, this compressed to 3.64%
and 4.37%, respectively.
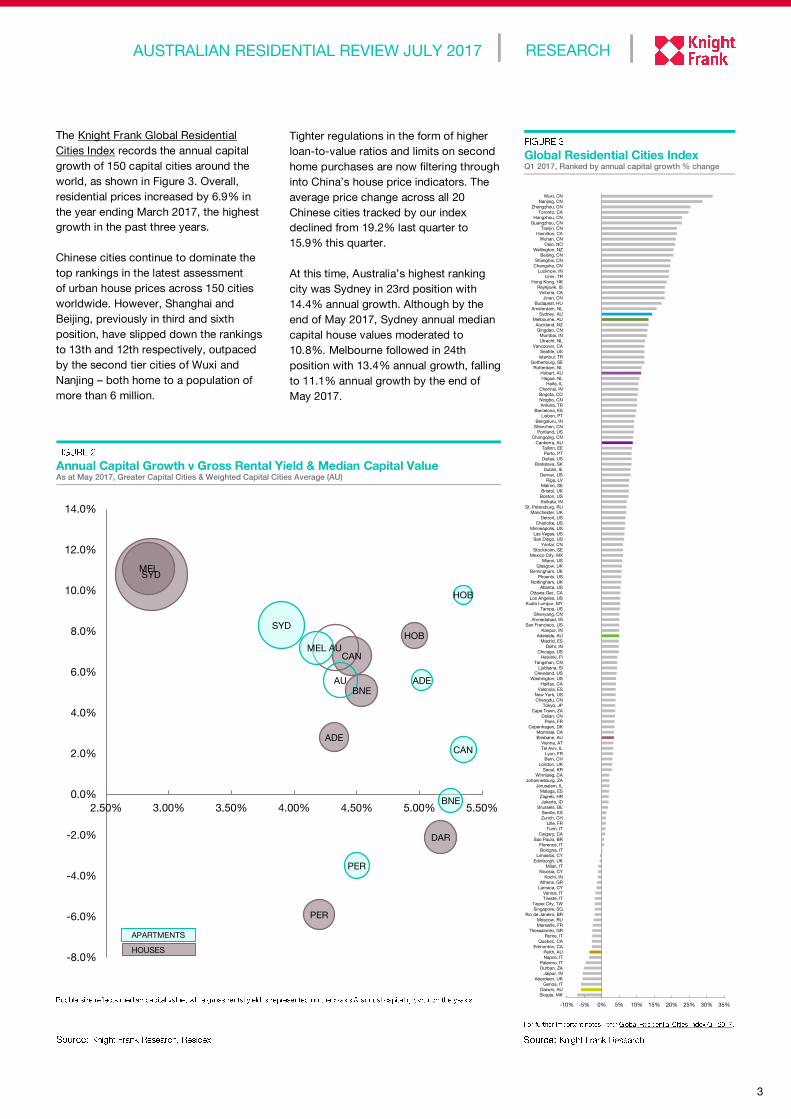
Across the Australian capital cities,
Sydney houses continue to command the
highest median capital value at $1.16
million, whilst Hobart apartments, at
$307,000, records the lowest median
value.
When charted in Figure 2, Hobart
apartments are the front-runner for
investors, attracting not only the lowest
median capital value, but the third-
highest annual capital growth (at 9.8%)
and second-best median gross rental
yield return, at 5.35%.
For the tenth consecutive month on 4
July 2017, the official cash rate remained
unchanged by the Reserve Bank of
Australia (RBA), at 1.50%.
The RBA Board stated the various
forward-looking indicators continue to
suggest growth in employment over the
period ahead. Although wage growth
continues to remain low, inflation is
expected to increase gradually as the
economy strengthens.
Drawing attention to housing market
conditions varying considerably around
the country, the Board cited that prices
have been rising briskly in selected
markets, although there are some signs
that these conditions are starting to ease.
In some other markets, prices are
declining.
New supply projected over the coming
years, with slower rents increases,
together with supervisory measures
should defuse the risks associated with
elevated and rising levels of household
indebtedness.
The RBA further acknowledged lenders
increasing mortgage rates for investor
and interest-only loans. As a result, the
Australian outlook remains supported by
low interest rates.
In the year ending May 2017, the
-10%
-8%
-6%
-4%
-2%
0%
2%
4%
6%
Sep
-16
Dec-1
6
Mar-
17
No
v-1
6
Feb
-17
May-1
7
Jan-1
7
Ap
r-1
7
Jul-
17
Sep
-16
Dec-1
6
Mar-
17
No
v-1
6
Feb
-17
May-1
7
GROSS DOMESTIC
PRODUCT,
ANNUAL GROWTH
UNEMPLOYMENT RATE CASH RATE TARGET HOUSING FINANCE,
ANNUAL GROWTH,
BY VALUE
(excl. refinancing)
TOTAL BUILDING
APPROVALS ANNUAL
GROWTH
3
RESEARCH AUSTRALIAN RESIDENTIAL REVIEW JULY 2017
The Knight Frank Global Residential
Cities Index records the annual capital
growth of 150 capital cities around the
world, as shown in Figure 3. Overall,
residential prices increased by 6.9% in
the year ending March 2017, the highest
growth in the past three years.
Chinese cities continue to dominate the
top rankings in the latest assessment
of urban house prices across 150 cities
worldwide. However, Shanghai and
Beijing, previously in third and sixth
position, have slipped down the rankings
to 13th and 12th respectively, outpaced
by the second tier cities of Wuxi and
Nanjing – both home to a population of
more than 6 million.
Global Residential Cities Index Q1 2017, Ranked by annual capital growth % change
Annual Capital Growth v Gross Rental Yield & Median Capital Value As at May 2017, Greater Capital Cities & Weighted Capital Cities Average (AU)
Tighter regulations in the form of higher
loan-to-value ratios and limits on second
home purchases are now filtering through
into China’s house price indicators. The
average price change across all 20
Chinese cities tracked by our index
declined from 19.2% last quarter to
15.9% this quarter.
At this time, Australia’s highest ranking
city was Sydney in 23rd position with
14.4% annual growth. Although by the
end of May 2017, Sydney annual median
capital house values moderated to
10.8%. Melbourne followed in 24th
position with 13.4% annual growth, falling
to 11.1% annual growth by the end of
May 2017.
-10% -5% 0% 5% 10% 15% 20% 25% 30% 35%
Skopje, MK
Darwin, AU
Genoa, IT
Aberdeen, UK
Jaipur, IN
Durban, ZA
Palermo, IT
Napoli, IT
Perth, AU
Edmonton, CA
Quebec, CA
Rome, IT
Thessaloniki, GR
Marseille, FR
Moscow, RU
Rio de Janeiro, BR
Singapore, SG
Taipei City, TW
Trieste, IT
Venice, IT
Larnaca, CY
Athens, GR
Kochi, IN
Nicosia, CY
Milan, IT
Edinburgh, UK
Limassol, CY
Bologna, IT
Florence, IT
Sao Paulo, BR
Calgary, CA
Turin, IT
Lille, FR
Zurich, CH
Seville, ES
Brussels, BE
Jakarta, ID
Zagreb, HR
Malaga, ES
Jerusalem, IL
Johannesburg, ZA
Winnipeg, CA
Seoul, KR
London, UK
Bern, CH
Lyon, FR
Tel Aviv, IL
Vienna, AT
Brisbane, AU
Montreal, CA
Copenhagen, DK
Paris, FR
Dalian, CN
Cape Town, ZA
Tokyo, JP
Chengdu, CN
New York, US
Valencia, ES
Halifax, CA
Washington, US
Cleveland, US
Ljubljana, SI
Tangshan, CN
Helsinki, FI
Chicago, US
Delhi, IN
Madrid, ES
Adelaide, AU
Kanpur, IN
San Francisco, US
Ahmedabad, IN
Shenyang, CN
Tampa, US
Kuala Lumpur, MY
Los Angeles, US
Ottawa Gat., CA
Atlanta, US
Nottingham, UK
Phoenix, US
Birmingham, UK
Glasgow, UK
Miami, US
Mexico City, MX
Stockholm, SE
Yantai, CN
San Diego, US
Las Vegas, US
Minneapolis, US
Charlotte, US
Detroit, US
Manchester, UK
St. Petersburg, RU
Kolkata, IN
Boston, US
Bristol, UK
Malmo, SE
Riga, LV
Denver, US
Dublin, IE
Bratislava, SK
Dallas, US
Porto, PT
Tallinn, EE
Canberra, AU
Chongqing, CN
Portland, US
Shenzhen, CN
Bengaluru, IN
Lisbon, PT
Barcelona, ES
Ankara, TR
Ningbo, CN
Bogota, CO
Chennai, IN
Haifa, IL
Hague, NL
Hobart, AU
Rotterdam, NL
Gothenburg, SE
Istanbul, TR
Seattle, US
Vancouver, CA
Utrecht, NL
Mumbai, IN
Qingdao, CN
Auckland, NZ
Melbourne, AU
Sydney, AU
Amsterdam, NL
Budapest, HU
Jinan, CN
Victoria, CA
Reykjavik, IS
Hong Kong, HK
Izmir, TR
Lucknow, IN
Changsha, CN
Shanghai, CN
Beijing, CN
Wellington, NZ
Oslo, NO
Wuhan, CN
Hamilton, CA
Tianjin, CN
Guangzhou, CN
Hangzhou, CN
Toronto, CA
Zhengzhou, CN
Nanjing, CN
Wuxi, CN
AU
SYDMEL
BNE
PER
ADE
CAN
HOB
DAR
AU
SYD
MEL
BNE
PER
ADE
CAN
HOB
-8.0%
-6.0%
-4.0%
-2.0%
0.0%
2.0%
4.0%
6.0%
8.0%
10.0%
12.0%
14.0%
2.50% 3.00% 3.50% 4.00% 4.50% 5.00% 5.50%
APARTMENTS
HOUSES
4
Market Trends The value of housing finance
commitments in New South Wales in
the three months ending April 2017 fell
by 1.1% on the previous year, to $21.9
billion.
Building approvals in the three months
ending May totalled 4,492 houses and
6,994 apartments in Greater Sydney.
This is trending 7.2% lower for houses
and 36% lower for apartment
approvals compared to the same
period in 2016.
The preliminary auction clearance rate
for the week ending 25 June was
68.2% out of 939 scheduled auctions
in Greater Sydney. This is slightly
higher than the week prior, at 68%
from 1927 scheduled auctions, and
lower than the comparable week a
year earlier, when 73.5% (out of 816
auctions) were sold.
Sales transacted in the year ending
May tallied 47,859 houses (down 2.2%
on previous year) and 48,939
apartments (up 2.9% on prior year).
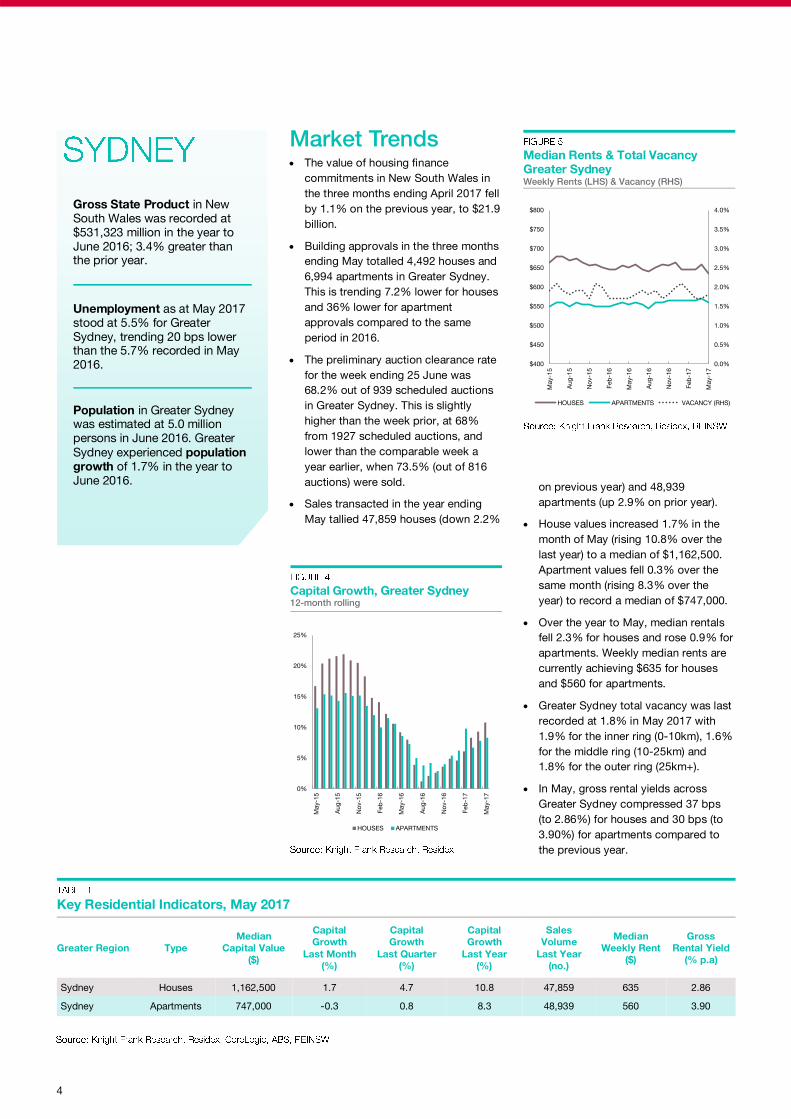
House values increased 1.7% in the
month of May (rising 10.8% over the
last year) to a median of $1,162,500.
Apartment values fell 0.3% over the
same month (rising 8.3% over the
year) to record a median of $747,000.
Over the year to May, median rentals
fell 2.3% for houses and rose 0.9% for
apartments. Weekly median rents are
currently achieving $635 for houses
and $560 for apartments.
Greater Sydney total vacancy was last
recorded at 1.8% in May 2017 with
1.9% for the inner ring (0-10km), 1.6%
for the middle ring (10-25km) and
1.8% for the outer ring (25km+).
In May, gross rental yields across
Greater Sydney compressed 37 bps
(to 2.86%) for houses and 30 bps (to
3.90%) for apartments compared to
the previous year.
Capital Growth, Greater Sydney 12-month rolling
Median Rents & Total Vacancy
Greater Sydney Weekly Rents (LHS) & Vacancy (RHS)
Gross State Product in New
South Wales was recorded at
$531,323 million in the year to
June 2016; 3.4% greater than the prior year.
Unemployment as at May 2017
stood at 5.5% for Greater
Sydney, trending 20 bps lower than the 5.7% recorded in May
2016.
Population in Greater Sydney was estimated at 5.0 million
persons in June 2016. Greater
Sydney experienced population
growth of 1.7% in the year to
June 2016.
Key Residential Indicators, May 2017
Greater Region
Median
Capital Value
($)
Capital
Growth
Last Quarter
(%)
Capital
Growth
Last Year
(%)
Sales
Volume
Last Year
(no.)
Median
Weekly Rent
($)
Gross
Rental Yield
(% p.a)
Type
Capital
Growth
Last Month
(%)
Sydney 1,162,500 4.7 10.8 47,859 635 2.86 Houses 1.7
Sydney 747,000 0.8 8.3 48,939 560 3.90 Apartments -0.3
0%
5%
10%
15%
20%
25%
May-1
5
Aug
-15
No
v-1
5
Feb
-16
May-1
6
Aug
-16
No
v-1
6
Feb
-17
May-1
7
HOUSES APARTMENTS
0.0%
0.5%
1.0%
1.5%
2.0%
2.5%
3.0%
3.5%
4.0%
$400
$450
$500
$550
$600
$650
$700
$750
$800
May-1
5
Aug
-15
No
v-1
5
Feb
-16
May-1
6
Aug
-16
No
v-1
6
Feb
-17
May-1
7
HOUSES APARTMENTS VACANCY (RHS)

5
RESEARCH
Market Trends The value of housing finance
commitments in Victoria in the three
months ending April 2017 grew by
0.8% on the previous year, to $17.1
billion.
Building approvals in the three months
ending May totalled 6,834 houses and
5,742 apartments in Greater
Melbourne. This is trending 1.2%
lower for houses and 25.6% lower for
apartment approvals compared to the
same period in 2016.
The preliminary auction clearance rate
for the week ending 25 June was
70.7% out of 1,047 scheduled
auctions in Greater Melbourne. This is
lower than the week prior, at 71%
from 1,129 scheduled auctions, and
higher than the comparable week the
year earlier, when 67.3% (out of 1,029
scheduled auctions) were sold.
Sales transacted in the year ending
May tallied 56,907 houses (down 1.6%
on previous year) and 43,293
apartments (up 3.5 on the prior year).
House values grew 1.1% in the month
of May (growth of 11.1% over the last
year) to a median of $836,000, and
apartment values were up 0.8% over
the month (growth of 7.2% over the
year) to record a median of $533,000.
Over the year to May, median rentals
remained steady for houses and rose
3.7% for apartments. Weekly median
rents are currently achieving $455 for
houses and $425 for apartments.
Greater Melbourne total vacancy was
last recorded at 2.2% in May 2017
with 2.0% in the inner ring (0-10km),
3.0% in the middle ring (10-20km) and
1.9% in the outer ring (20km+).
In May, gross rental yields across
Greater Melbourne compressed 30
bps (to 2.84%) for houses and 14 bps
(to 4.18%) for apartments compared
to prior year.
Median Rents & Total Vacancy
Greater Melbourne Weekly Rents (LHS) & Vacancy (RHS)
Gross State Product in Victoria was recorded at $373,624
million in the year to June 2016;
3.5% greater than the prior year.
Unemployment as at May 2017
stood at 5.9% for Greater Melbourne, trending 20 bps
higher than the 5.7% recorded
in May 2016.
Population in Greater Melbourne was estimated at 4.6
million persons in June 2016.
Greater Melbourne experienced
population growth of 2.5% in
the year to June 2016.
Key Residential Indicators, May 2017
Greater Region Type
Median
Capital Value
($)
Capital
Growth
Last Month
(%)
Capital
Growth
Last Quarter
(%)
Capital
Growth
Last Year
(%)
Sales
Volume
Last Year
(no.)
Median
Weekly Rent
($)
Gross
Rental Yield
(% p.a)
Melbourne Houses 836,000 1.1 3.5 11.1 56,907 455 2.84
Melbourne Apartments 533,000 0.8 3.5 7.2 43,293 425 4.18
AUSTRALIAN RESIDENTIAL REVIEW JULY 2017
Capital Growth, Greater Melbourne 12-month rolling
0%
2%
4%
6%
8%
10%
12%
14%
16%
May-1
5
Aug
-15
No
v-1
5
Feb
-16
May-1
6
Aug
-16
No
v-1
6
Feb
-17
May-1
7
HOUSES APARTMENTS
0.0%
0.5%
1.0%
1.5%
2.0%
2.5%
3.0%
3.5%
4.0%
$360
$380
$400
$420
$440
$460
$480
$500
May-1
5
Aug
-15
No
v-1
5
Feb
-16
May-1
6
Aug
-16
No
v-1
6
Feb
-17
May-1
7
HOUSES APARTMENTS VACANCY (RHS)
6
Capital Growth, Greater Brisbane 12-month rolling
on previous year) and 22,370
apartments (up 4.7% on prior year).
House values rose 0.6% in the month
of May (with growth of 5.1% over the
last year) to a median of $522,000.
Apartment values rose 0.5% over the
month, (down 0.3% over the year), to
record a median of $385,000.
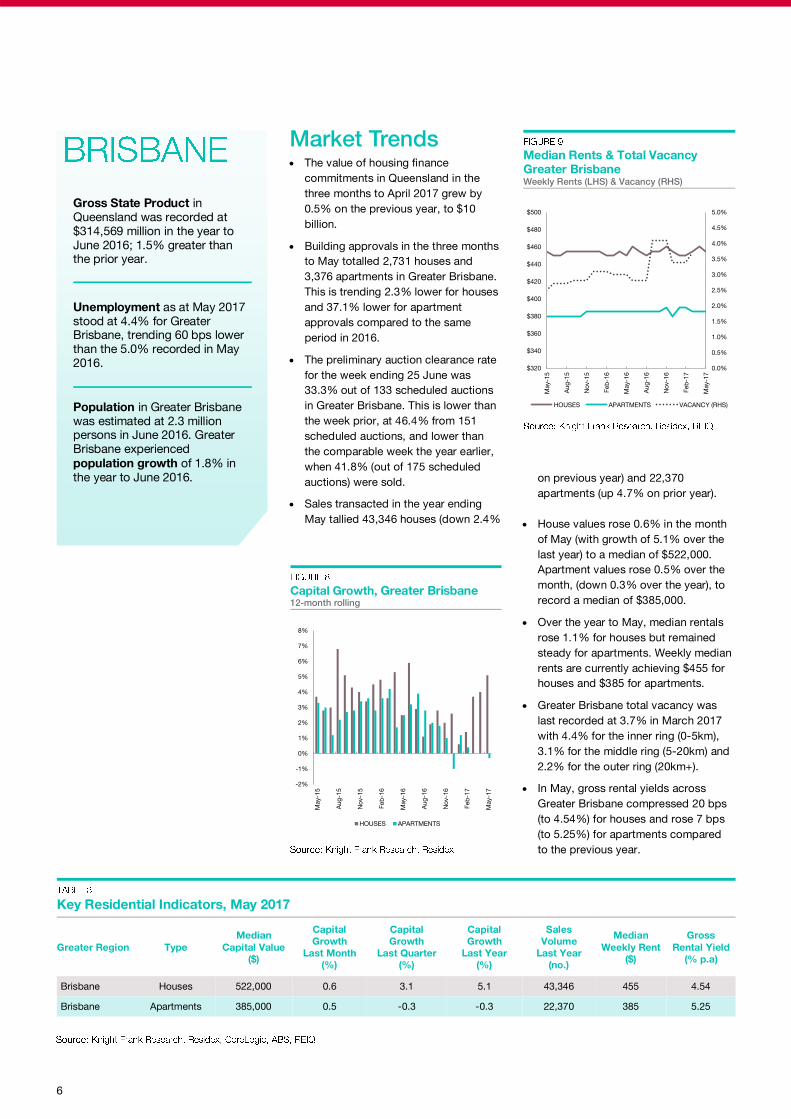
Over the year to May, median rentals
rose 1.1% for houses but remained
steady for apartments. Weekly median
rents are currently achieving $455 for
houses and $385 for apartments.
Greater Brisbane total vacancy was
last recorded at 3.7% in March 2017
with 4.4% for the inner ring (0-5km),
3.1% for the middle ring (5-20km) and
2.2% for the outer ring (20km+).
In May, gross rental yields across
Greater Brisbane compressed 20 bps
(to 4.54%) for houses and rose 7 bps
(to 5.25%) for apartments compared
to the previous year.
Median Rents & Total Vacancy
Greater Brisbane Weekly Rents (LHS) & Vacancy (RHS)
Gross State Product in
Queensland was recorded at
$314,569 million in the year to
June 2016; 1.5% greater than the prior year.
Unemployment as at May 2017
stood at 4.4% for Greater Brisbane, trending 60 bps lower
than the 5.0% recorded in May
2016.
Population in Greater Brisbane
was estimated at 2.3 million persons in June 2016. Greater
Brisbane experienced
population growth of 1.8% in
the year to June 2016.
Key Residential Indicators, May 2017
Greater Region
Median
Capital Value
($)
Capital
Growth
Last Quarter
(%)
Capital
Growth
Last Year
(%)
Sales
Volume
Last Year
(no.)
Median
Weekly Rent
($)
Gross
Rental Yield
(% p.a)
Type
Capital
Growth
Last Month
(%)
Brisbane 522,000 3.1 5.1 43,346 455 4.54 Houses 0.6
Brisbane 385,000 -0.3 -0.3 22,370 385 5.25 Apartments 0.5
Market Trends The value of housing finance
commitments in Queensland in the
three months to April 2017 grew by
0.5% on the previous year, to $10
billion.
Building approvals in the three months
to May totalled 2,731 houses and
3,376 apartments in Greater Brisbane.
This is trending 2.3% lower for houses
and 37.1% lower for apartment
approvals compared to the same
period in 2016.
The preliminary auction clearance rate
for the week ending 25 June was
33.3% out of 133 scheduled auctions
in Greater Brisbane. This is lower than
the week prior, at 46.4% from 151
scheduled auctions, and lower than
the comparable week the year earlier,
when 41.8% (out of 175 scheduled
auctions) were sold.
Sales transacted in the year ending
May tallied 43,346 houses (down 2.4%
-2%
-1%
0%
1%
2%
3%
4%
5%
6%
7%
8%
May-1
5
Aug
-15
No
v-1
5
Feb
-16
May-1
6
Aug
-16
No
v-1
6
Feb
-17
May-1
7
HOUSES APARTMENTS
0.0%
0.5%
1.0%
1.5%
2.0%
2.5%
3.0%
3.5%
4.0%
4.5%
5.0%
$320
$340
$360
$380
$400
$420
$440
$460
$480
$500
May-1
5
Aug
-15
No
v-1
5
Feb
-16
May-1
6
Aug
-16
No
v-1
6
Feb
-17
May-1
7
HOUSES APARTMENTS VACANCY (RHS)
7
RESEARCH
House values were recorded at a
median of $488,000, (down 0.5% in
the month of May) and down 5.9%
over the last year. Apartment values
rose 0.7% over the month, (down
3.5% over the year), to record a
median of $408,500.
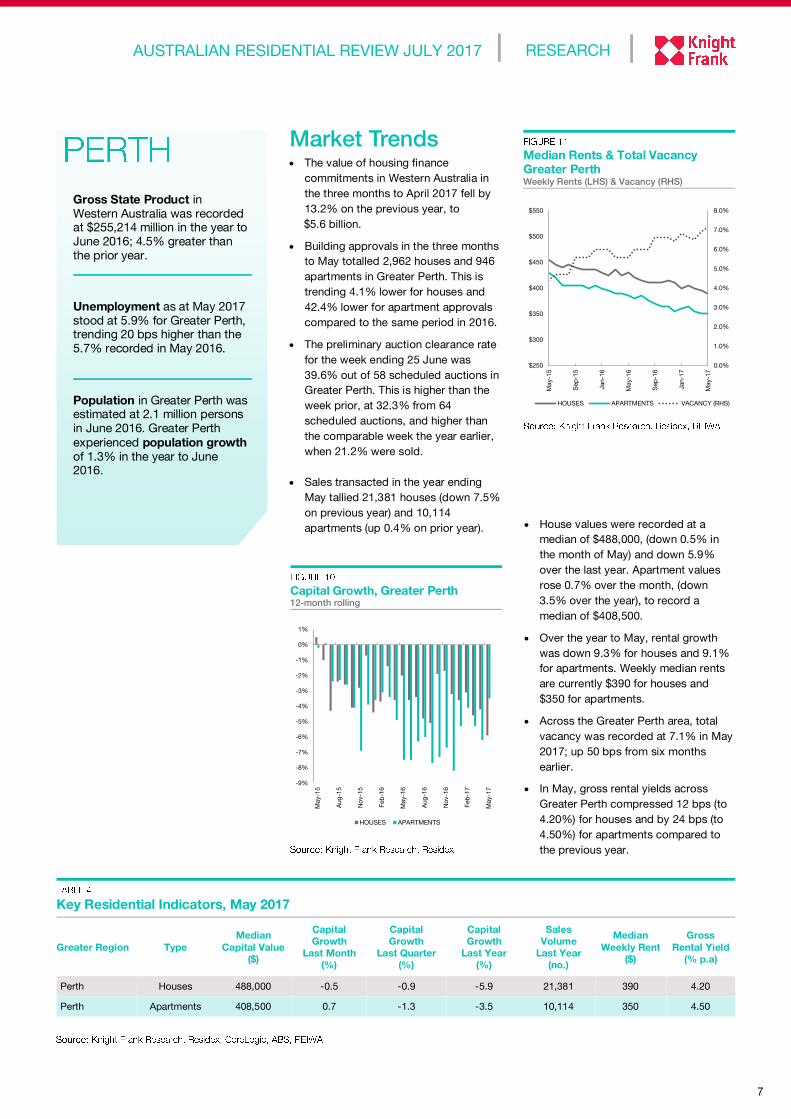
Over the year to May, rental growth
was down 9.3% for houses and 9.1%
for apartments. Weekly median rents
are currently $390 for houses and
$350 for apartments.
Across the Greater Perth area, total
vacancy was recorded at 7.1% in May
2017; up 50 bps from six months
earlier.
In May, gross rental yields across
Greater Perth compressed 12 bps (to
4.20%) for houses and by 24 bps (to
4.50%) for apartments compared to
the previous year.
Median Rents & Total Vacancy
Greater Perth Weekly Rents (LHS) & Vacancy (RHS)
Gross State Product in
Western Australia was recorded at $255,214 million in the year to
June 2016; 4.5% greater than
the prior year.
Unemployment as at May 2017
stood at 5.9% for Greater Perth, trending 20 bps higher than the
5.7% recorded in May 2016.
Population in Greater Perth was estimated at 2.1 million persons
in June 2016. Greater Perth
experienced population growth
of 1.3% in the year to June 2016.
Key Residential Indicators, May 2017
Greater Region
Median
Capital Value
($)
Capital
Growth
Last Quarter
(%)
Capital
Growth
Last Year
(%)
Sales
Volume
Last Year
(no.)
Median
Weekly Rent
($)
Gross
Rental Yield
(% p.a)
Type
Capital
Growth
Last Month
(%)
Perth 488,000 -0.9 -5.9 21,381 390 4.20 Houses -0.5
Perth 408,500 -1.3 -3.5 10,114 350 4.50 Apartments 0.7
AUSTRALIAN RESIDENTIAL REVIEW JULY 2017
Capital Growth, Greater Perth 12-month rolling
Market Trends The value of housing finance
commitments in Western Australia in
the three months to April 2017 fell by
13.2% on the previous year, to
$5.6 billion.
Building approvals in the three months
to May totalled 2,962 houses and 946
apartments in Greater Perth. This is
trending 4.1% lower for houses and
42.4% lower for apartment approvals
compared to the same period in 2016.
The preliminary auction clearance rate
for the week ending 25 June was
39.6% out of 58 scheduled auctions in
Greater Perth. This is higher than the
week prior, at 32.3% from 64
scheduled auctions, and higher than
the comparable week the year earlier,
when 21.2% were sold.
Sales transacted in the year ending
May tallied 21,381 houses (down 7.5%
on previous year) and 10,114
apartments (up 0.4% on prior year).
-9%
-8%
-7%
-6%
-5%
-4%
-3%
-2%
-1%
0%
1%
May-1
5
Aug
-15
No
v-1
5
Feb
-16
May-1
6
Aug
-16
No
v-1
6
Feb
-17
May-1
7
HOUSES APARTMENTS
0.0%
1.0%
2.0%
3.0%
4.0%
5.0%
6.0%
7.0%
8.0%
$250
$300
$350
$400
$450
$500
$550
May-1
5
Sep
-15
Jan-1
6
May-1
6
Sep
-16
Jan-1
7
May-1
7
HOUSES APARTMENTS VACANCY (RHS)
8
Market Trends The value of housing finance
commitments in South Australia in the
three months to April 2017 grew by
2.2% on the previous year, to $3.3
billion.
Building approvals in the three months
to May totalled 1,668 houses and
1,215 apartments approved in Greater
Adelaide. This is trending 9.4% lower
for houses and 6.9% higher for
apartment approvals compared to the
same period in 2016.
The preliminary auction clearance rate
for the week ending 25 June was
68.5% out of 102 scheduled auctions
in Greater Adelaide. This is lower than
the week prior, at 69.5% from 103
scheduled auctions, and higher than
the comparable week the year earlier,
when 59.8% (out of 90 scheduled
auctions) were sold.
Sales transacted in the year ending
May tallied 23,116 houses (up 9.4%
on previous year) and 5,803
apartments (up 5.5% on prior year).
House values were up 0.4% in the
month of May (2.8% over the last
year) to a median of $458,000.
Apartments rose 0.9% over the month
to record a median of $328,500 (rising
5.6% over the past year).
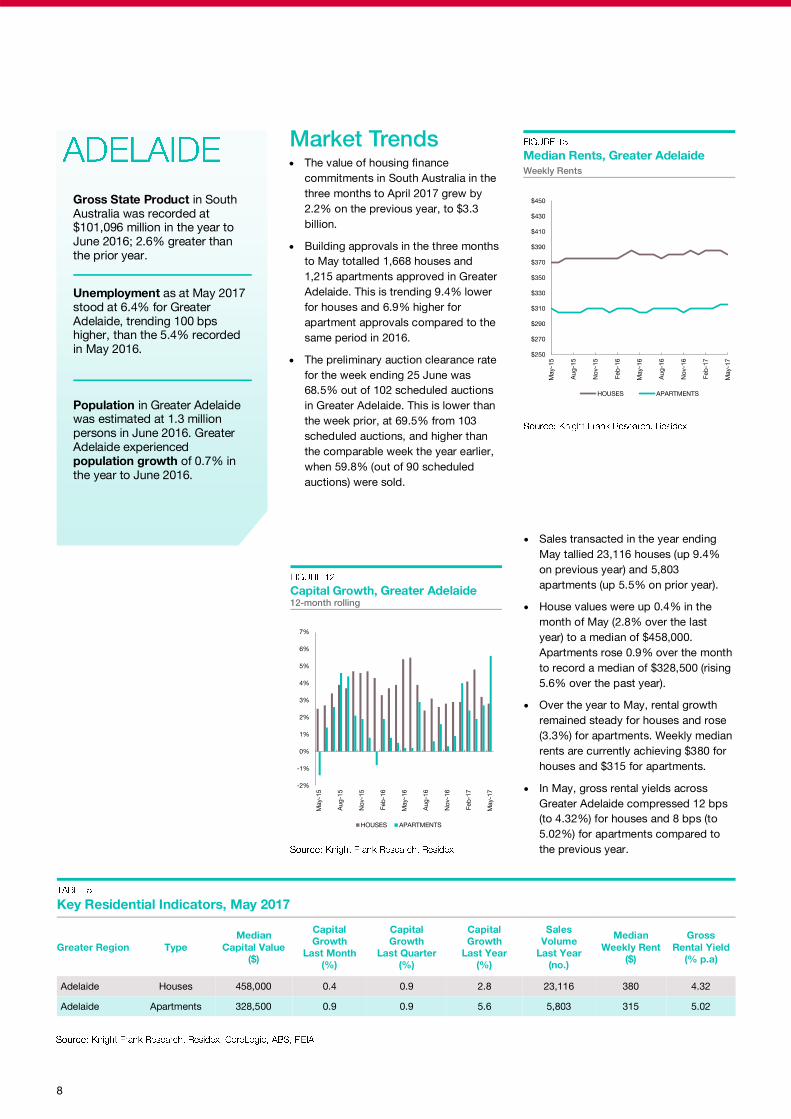
Over the year to May, rental growth
remained steady for houses and rose
(3.3%) for apartments. Weekly median
rents are currently achieving $380 for
houses and $315 for apartments.
In May, gross rental yields across
Greater Adelaide compressed 12 bps
(to 4.32%) for houses and 8 bps (to
5.02%) for apartments compared to
the previous year.
Median Rents, Greater Adelaide
Weekly Rents
Gross State Product in South
Australia was recorded at $101,096 million in the year to
June 2016; 2.6% greater than
the prior year.
Unemployment as at May 2017
stood at 6.4% for Greater
Adelaide, trending 100 bps higher, than the 5.4% recorded
in May 2016.
Population in Greater Adelaide was estimated at 1.3 million
persons in June 2016. Greater
Adelaide experienced
population growth of 0.7% in
the year to June 2016.
Key Residential Indicators, May 2017
Greater Region
Median
Capital Value
($)
Capital
Growth
Last Quarter
(%)
Capital
Growth
Last Year
(%)
Sales
Volume
Last Year
(no.)
Median
Weekly Rent
($)
Gross
Rental Yield
(% p.a)
Type
Capital
Growth
Last Month
(%)
Adelaide 458,000 0.9 2.8 23,116 380 4.32 Houses 0.4
Adelaide 328,500 0.9 5.6 5,803 315 5.02 Apartments 0.9
Capital Growth, Greater Adelaide 12-month rolling
-2%
-1%
0%
1%
2%
3%
4%
5%
6%
7%
May-1
5
Aug
-15
No
v-1
5
Feb
-16
May-1
6
Aug
-16
No
v-1
6
Feb
-17
May-1
7
HOUSES APARTMENTS
$250
$270
$290
$310
$330
$350
$370
$390
$410
$430
$450
May-1
5
Aug
-15
No
v-1
5
Feb
-16
May-1
6
Aug
-16
No
v-1
6
Feb
-17
May-1
7
HOUSES APARTMENTS
9
RESEARCH
House values rose 0.9% in the month
of May (with growth of 6.8% over the
last year) to a median of $621,000.
Apartment values rose 0.8% over the
month (and up 2.2% over the year) to
record a median of $420,000.
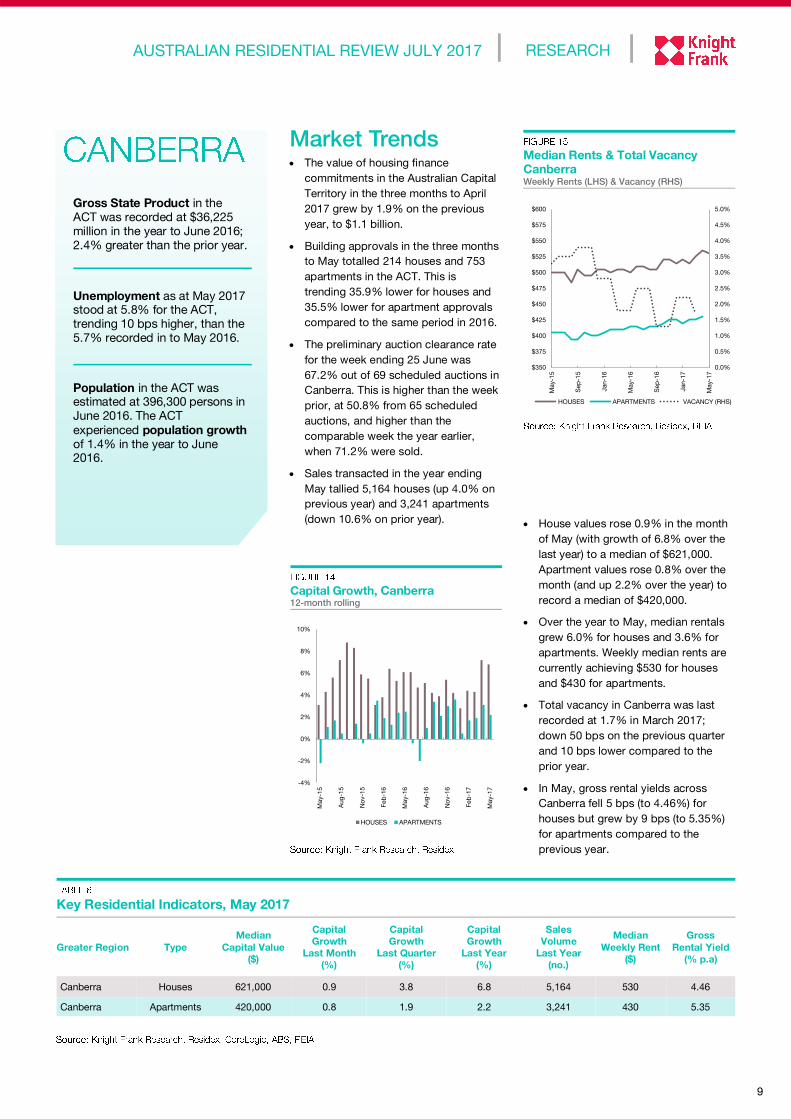
Over the year to May, median rentals
grew 6.0% for houses and 3.6% for
apartments. Weekly median rents are
currently achieving $530 for houses
and $430 for apartments.
Total vacancy in Canberra was last
recorded at 1.7% in March 2017;
down 50 bps on the previous quarter
and 10 bps lower compared to the
prior year.
In May, gross rental yields across
Canberra fell 5 bps (to 4.46%) for
houses but grew by 9 bps (to 5.35%)
for apartments compared to the
previous year.
Median Rents & Total Vacancy
Canberra Weekly Rents (LHS) & Vacancy (RHS)
Gross State Product in the
ACT was recorded at $36,225
million in the year to June 2016;
2.4% greater than the prior year.
Unemployment as at May 2017 stood at 5.8% for the ACT,
trending 10 bps higher, than the
5.7% recorded in to May 2016.
Population in the ACT was estimated at 396,300 persons in
June 2016. The ACT
experienced population growth
of 1.4% in the year to June 2016.
Key Residential Indicators, May 2017
Greater Region Type
Median
Capital Value
($)
Capital
Growth
Last Month
(%)
Capital
Growth
Last Quarter
(%)
Capital
Growth
Last Year
(%)
Sales
Volume
Last Year
(no.)
Median
Weekly Rent
($)
Gross
Rental Yield
(% p.a)
Canberra Houses 621,000 0.9 3.8 6.8 5,164 530 4.46
Canberra Apartments 420,000 0.8 1.9 2.2 3,241 430 5.35
AUSTRALIAN RESIDENTIAL REVIEW JULY 2017
Capital Growth, Canberra 12-month rolling
Market Trends The value of housing finance
commitments in the Australian Capital
Territory in the three months to April
2017 grew by 1.9% on the previous
year, to $1.1 billion.
Building approvals in the three months
to May totalled 214 houses and 753
apartments in the ACT. This is
trending 35.9% lower for houses and
35.5% lower for apartment approvals
compared to the same period in 2016.
The preliminary auction clearance rate
for the week ending 25 June was
67.2% out of 69 scheduled auctions in
Canberra. This is higher than the week
prior, at 50.8% from 65 scheduled
auctions, and higher than the
comparable week the year earlier,
when 71.2% were sold.
Sales transacted in the year ending
May tallied 5,164 houses (up 4.0% on
previous year) and 3,241 apartments
(down 10.6% on prior year).
-4%
-2%
0%
2%
4%
6%
8%
10%
May-1
5
Aug
-15
No
v-1
5
Feb
-16
May-1
6
Aug
-16
No
v-1
6
Feb
-17
May-1
7
HOUSES APARTMENTS
0.0%
0.5%
1.0%
1.5%
2.0%
2.5%
3.0%
3.5%
4.0%
4.5%
5.0%
$350
$375
$400
$425
$450
$475
$500
$525
$550
$575
$600
May-1
5
Sep
-15
Jan-1
6
May-1
6
Sep
-16
Jan-1
7
May-1
7
HOUSES APARTMENTS VACANCY (RHS)

10
Market Trends The value of housing finance
commitments in Tasmania in the three
months to April 2017 grew by 14.4%
on the previous year, to $703.9 million.
Building approvals in the three months
to May totalled 221 houses and 95
apartments in Greater Hobart. This is
trending 2.2% lower for houses but
163.9% higher for apartment
approvals compared to the same
period in 2016.
The preliminary auction clearance rate
for the week ending 25 June was
33.3% out of 7 scheduled auctions in
Greater Hobart. This was lower than
the previous week when 40% of 5
scheduled auctioned were sold.
Sales transacted in the year ending
May tallied 2,568 houses (down 8.6%
on previous year) and 628 apartments
(down 36.8% on prior year). House values rose 1.2% in the month
of May (rising 7.8% over the last year)
to a median of $420,000. Apartments
rose 1.2% over the month (up 9.8%
over the year) to record a median of
$307,000.
Over the year to May, rental growth
was 8.1% for houses and 6.8% for
apartments. Weekly median rents are
currently achieving $400 for houses
and $315 for apartments.
Greater Hobart total vacancy was last
recorded at 2.3% in March 2017;
down 10 bps on the previous quarter
and 40 bps lower compared to the
prior year.
In May, gross rental yields across
Greater Hobart remained stable for
houses (to 4.96%) but compressed 19
bps for apartments (to 5.35%)
compared to the previous year.
Median Rents & Total Vacancy
Greater Hobart Weekly Rents (LHS) & Vacancy (RHS)
Gross State Product in
Tasmania was recorded at $26,039 million in the year to
June 2016; 2.6% greater than
the prior year.
Unemployment as at May 2017
stood at 6.8% for Greater Hobart, trending 10 bps lower
than the 6.9% recorded in May
2016.
Population in Greater Hobart
was estimated at 222,800
persons in June 2016. Greater
Hobart experienced population
growth of 0.8% in the year to
June 2016.
Key Residential Indicators, May 2017
Greater Region
Median
Capital Value
($)
Capital
Growth
Last Quarter
(%)
Capital
Growth
Last Year
(%)
Sales
Volume
Last Year
(no.)
Median
Weekly Rent
($)
Gross
Rental Yield
(% p.a)
Type
Capital
Growth
Last Month
(%)
Hobart 420,000 5.0 7.8 2,568 400 4.96 Houses 1.2
Hobart 307,000 0.5 9.8 628 315 5.35 Apartments 1.2
Capital Growth, Greater Hobart 12-month rolling
-6%
-4%
-2%
0%
2%
4%
6%
8%
10%
12%
May-1
5
Aug
-15
No
v-1
5
Feb
-16
May-1
6
Aug
-16
No
v-1
6
Feb
-17
May-1
7
HOUSES APARTMENTS
0.0%
0.5%
1.0%
1.5%
2.0%
2.5%
3.0%
3.5%
4.0%
$200
$250
$300
$350
$400
$450
May-1
5
Sep
-15
Jan-1
6
May-1
6
Sep
-16
Jan-1
7
May-1
7
HOUSES APARTMENTS VACANCY (RHS)

11
RESEARCH
Market Trends The value of housing finance
commitments in the Northern Territory
in the three months to April 2017 fell
by 6.2% on the previous year, to
$291.2 million.
Building approvals in the three months
to May totalled 114 houses and 5
apartments in Greater Darwin. This is
trending 32.9% lower for houses and
97.5% lower for apartment approvals
compared to the same period in 2016.
The preliminary auction clearance rate
for the week ending 25 June was 17%
out of 12 scheduled auctions in
Greater Darwin. This was higher than
the previous week when 14% of 9
scheduled auctioned were sold.
Sales transacted in the year ending
May tallied 1,185 houses (up 9.3% on
previous year) and 492 apartments (up
1.7% on prior year).
House values fell 0.1% in the month
of May (down 2.1% over the last
year) to a median of $524,000.
Apartments fell 1.4% over the month
(down 9.4% over the year) to record
a median of $341,500.
Over the year to May, median rentals
were down 4.6% for houses and
10.6% for apartments. Weekly
median rents are currently achieving
$520 for houses and $380 for
apartments.
Greater Darwin total vacancy was last
recorded at 7.1% in March 2017;
down 70 bps on the previous quarter
and trending down 160 bps
compared to the prior year.
In May, gross rental yields across
Greater Darwin compressed 16 bps
(to 5.17%) for houses and 3 bps (to
5.83%) for apartments compare to
previous year.
Median Rents & Total Vacancy
Greater Darwin Weekly Rents (LHS) & Vacancy (RHS)
Gross State Product in the
Northern Territory was recorded at $23,648 million in the year to
June 2016; 11.5% greater than
the prior year.
Unemployment stood at 3.5%
in the Northern Territory as at
May 2017, trending 20 bps
lower than the 3.7% recorded in May 2016.
Population in Greater Darwin was estimated at 143,630
persons in June 2016. Greater
Darwin experienced population
growth of 1.0% in the year to
June 2016.
Key Residential Indicators, May 2017
Greater Region
Median
Capital Value
($)
Capital
Growth
Last Quarter
(%)
Capital
Growth
Last Year
(%)
Sales
Volume
Last Year
(no.)
Median
Weekly Rent
($)
Gross
Rental Yield
(% p.a)
Type
Capital
Growth
Last Month
(%)
Darwin 524,000 1.1 -2.1 1,185 520 5.17 Houses -0.1
Darwin 341,500 -5.4 -9.4 492 380 5.83 Apartments -1.4
AUSTRALIAN RESIDENTIAL REVIEW JULY 2017
Capital Growth, Greater Darwin 12-month rolling
-14%
-12%
-10%
-8%
-6%
-4%
-2%
0%
2%
May-1
5
Aug
-15
No
v-1
5
Feb
-16
May-1
6
Aug
-16
No
v-1
6
Feb
-17
May-1
7
HOUSES APARTMENTS
0.0%
1.0%
2.0%
3.0%
4.0%
5.0%
6.0%
7.0%
8.0%
9.0%
10.0%
$300
$350
$400
$450
$500
$550
$600
$650
$700
May-1
5
Sep
-15
Jan-1
6
May-1
6
Sep
-16
Jan-1
7
May-1
7
HOUSES APARTMENTS VACANCY (RHS)
Knight Frank Research provides strategic
advice, consultancy services and forecasting
to a wide range of clients worldwide
including developers, investors, funding
organisations, corporate institutions and the
public sector. All our clients recognise the
need for expert independent advice
customised to their specific needs.
Build-To-Rent Insight
April 2017
First Home Buyer
Incentive Guide
June 2017
The Wealth Report
2017
Knight Frank Research Reports are available at KnightFrank.com.au/Research
Foreign Investment in
Residential Property
June 2017
Important Notice
© Knight Frank Australia Pty Ltd 2017 – This report is published for general information only and not
to be relied upon in any way. Although high standards have been used in the preparation of the
information, analysis, views and projections presented in this report, no responsibility or liability
whatsoever can be accepted by Knight Frank Australia Pty Ltd for any loss or damage resultant from
any use of, reliance on or reference to the contents of this document. As a general report, this material
does not necessarily represent the view of Knight Frank Australia Pty Ltd in relation to particular
properties or projects. Reproduction of this report in whole or in part is not allowed without prior
written approval of Knight Frank Australia Pty Ltd to the form and content within which it appears.
RESIDENTIAL RESEARCH
Michelle Ciesielski
Director
+61 2 9036 6659
RESIDENTIAL AND
PROJECT MARKETING
Michael Robinson
Head of Project Marketing, Australia
+61 3 9604 4775
Neil Kay
Senior Director
Head of Residential, Perth (WA)
+61 8 6210 0112
Daniel Cashen
Director, Melbourne (Vic)
+61 3 9604 4749
Chris Litfin
Head of Project Marketing (Qld) &
Gold Coast
+61 7 5636 0814
INTERNATIONAL
PROJECT MARKETING
Rebecca Pugh
Associate Director, Australia
+61 3 9604 4716
PRESTIGE RESIDENTIAL SALES
Deborah Cullen
Head of Prestige Residential Sales
+61 2 9036 6805