residential new construction (nrnc) programs impact evaluation
TRANSCRIPT
Non‐Residential New
Construction (NRNC) Programs
Impact Evaluation California Investor‐Owned Utilities’ Non‐Residential
New Construction Program Evaluation for Program
Years 2006‐2008
Study ID: CPU0030.05 NRNC Appendices Part 2
Final Evaluation Report
Appendices to Volume II (Part 2)
Prepared by
KEMA, Inc.
The Cadmus Group, Inc.
Itron, Inc.
Nexus Market Research, Inc.
For the
California Public Utilities Commission
Energy Division
February 08, 2010

ii
Appendix H. On-Site Survey Instrument ................................................................................... iii Appendix I. Refrigerated Warehouse On-site Survey Instrument...........................................lvii Appendix J. Dust Collection System On-site Survey Instrument........................................ lxxxiii Appendix K. Compressed Air System On-Site Survey Instrument .......................................... xc Appendix L. Whole Building Savings Summary ................................................................ xcv Appendix M. Commercial Whole Building Site Characteristics .................................................. c Appendix N. Public Comments and Responses to Draft Evaluation Report .................. cccxvi

iii
Appendix H. On-Site Survey Instrument
This instrument was used during non‐residential new construction site visits. The data gathered included
occupancy history, schedules and controls for and heating and cooling, and HVAC operations, and was
used to produce computer models simulating building annual energy use.

iv
General Information
Site ID:
Primary
Contact:
Address 1: Phone 1:
Address 2: Phone 2:
City: State: CA Zip: Phone 3:
Account Number: Install Date:
/ / Email:
Application ID: Quantity:
Secondary Contact:
Annual Savings: Measure
Name:
SITE NOTES:
Building Type: Industry Type:
Site Visit Date: / / Site Visit
Time:
Inspector Initials:
Inspection Date: / /
Inspection Time: Start: End:
Scheduling Notes:

v
Interview Questions The following interview questions will be used to help us identify unobservable aspects of your building. These aspects include occupancy history, schedules, and heating and cooling controls. Answers to these questions will be coupled with data collected from our walk-through audit to produce a computer model which simulates the annual energy use of the building.
Building Overview Q1. What is the overall building floor area? ___________SF Q2. How many floors? ___________ Q3. What is the floor area of the new construction?
ο same as overall building floor area ο ____________SF
Q4. Characterize the site by circling the appropriate description: 1. New building (“green field”) 2. Alteration of existing building 3. Addition to existing building 4. Alteration of existing building and addition to existing building Q5. Circle the appropriate building type description:
1 Small office 11 Hotel 2 Large office 12 Small school 3 Small retail 13 Large school 4 Multi-story large retail 14 Community college 5 Single story large retail 15 Large university 6 Grocery 16 Assembly 7 Quick service restaurant 17 Hospital 8 Full-service restaurant 18 Lt. Manufacturing 9 Conditioned warehouse 19 Bio/Tech Manufacturing
10 Uncond. warehouse
vi
Building Start-up Q6. Draw a line that indicates the percentage of the new construction that was occupied (% of floor area) for 2006, 2007, & 2008.
0
20
40
60
80
100
Jan Feb Mar Apr May Jun Jul Aug Sep Oct Nov Dec 2006
0
20
40
60
80
100
Jan Feb Mar Apr May Jun Jul Aug Sep Oct Nov Dec 2007
0
20
40
60
80
100
Jan Feb Mar Apr May Jun Jul Aug Sep Oct Nov Dec 2008
Q7. Draw a line that indicates the percentage of the new construction that was conditioned (% of floor area) during 2006, 2007, & 2008.
0
20
40
60
80
100
Jan Feb Mar Apr May Jun Jul Aug Sep Oct Nov Dec 2006
0
20
40
60
80
100
Jan Feb Mar Apr May Jun Jul Aug Sep Oct Nov Dec 2007
vii
0
20
40
60
80
100
Jan Feb Mar Apr May Jun Jul Aug Sep Oct Nov Dec 2008
viii
Building Areas Q8. How many individual tenants (businesses) occupy this building? _________________ Q9. Do the majority of tenants have their own electric meter? Y N Q10. Which statement best describes the operation of the building? ( ) The entire building operates on basically the same schedule
( ) There are areas of the building (departments, tenants, etc.) that have substantially different operating schedules
Q11. If different areas of the building (departments, tenants, etc.) have substantially different operational schedules, divide the building into up to five areas with differing schedules, and provide a name for each area:
1. ______________________
2. ______________________
3. ______________________
4. ______________________
5. ______________________
Notes:
ix
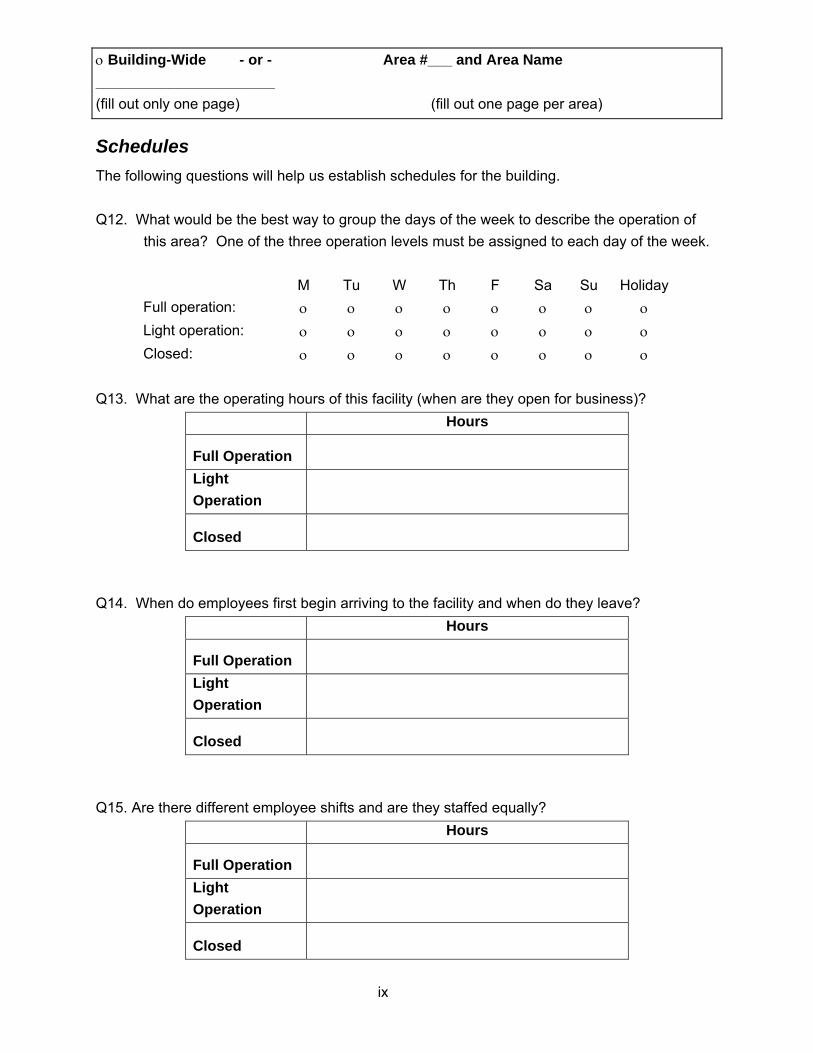
ο Building-Wide - or - Area #___ and Area Name ______________________ (fill out only one page) (fill out one page per area)
Schedules The following questions will help us establish schedules for the building. Q12. What would be the best way to group the days of the week to describe the operation of
this area? One of the three operation levels must be assigned to each day of the week.
M Tu W Th F Sa Su Holiday Full operation: ο ο ο ο ο ο ο ο Light operation: ο ο ο ο ο ο ο ο Closed: ο ο ο ο ο ο ο ο
Q13. What are the operating hours of this facility (when are they open for business)?
Hours
Full Operation Light Operation
Closed Q14. When do employees first begin arriving to the facility and when do they leave?
Hours
Full Operation Light Operation
Closed Q15. Are there different employee shifts and are they staffed equally?
Hours
Full Operation Light Operation
Closed
x
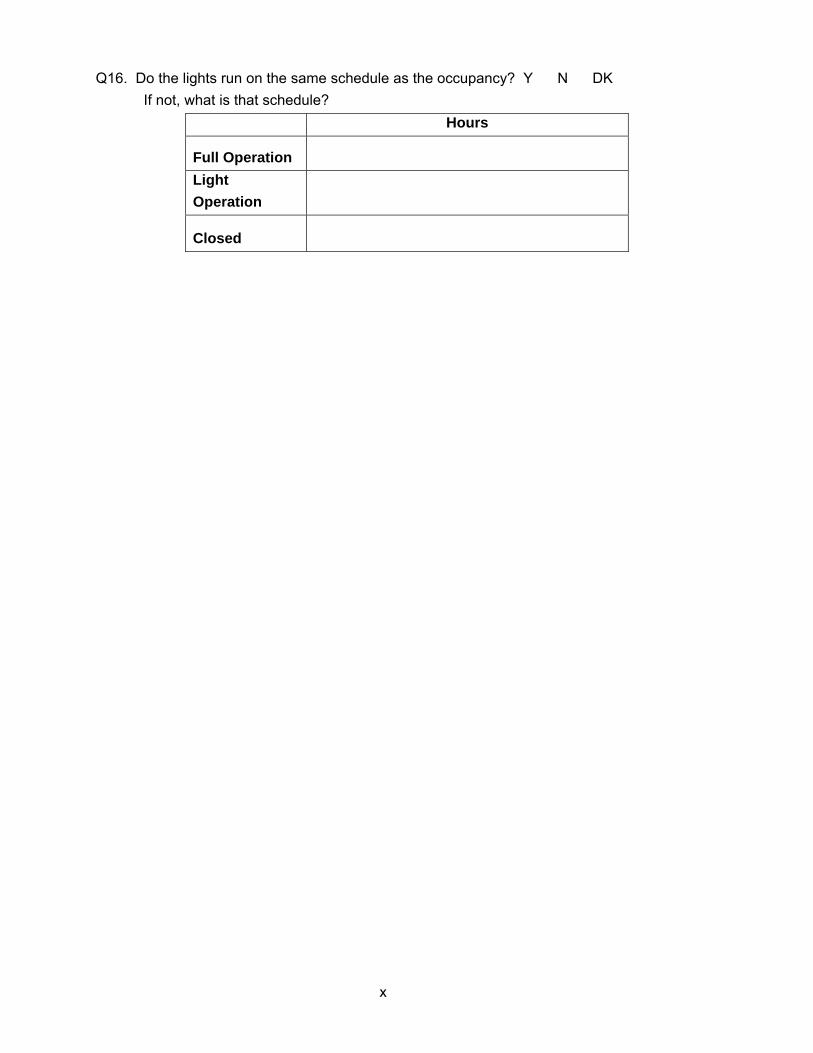
Q16. Do the lights run on the same schedule as the occupancy? Y N DK
If not, what is that schedule? Hours
Full Operation Light Operation
Closed
xi
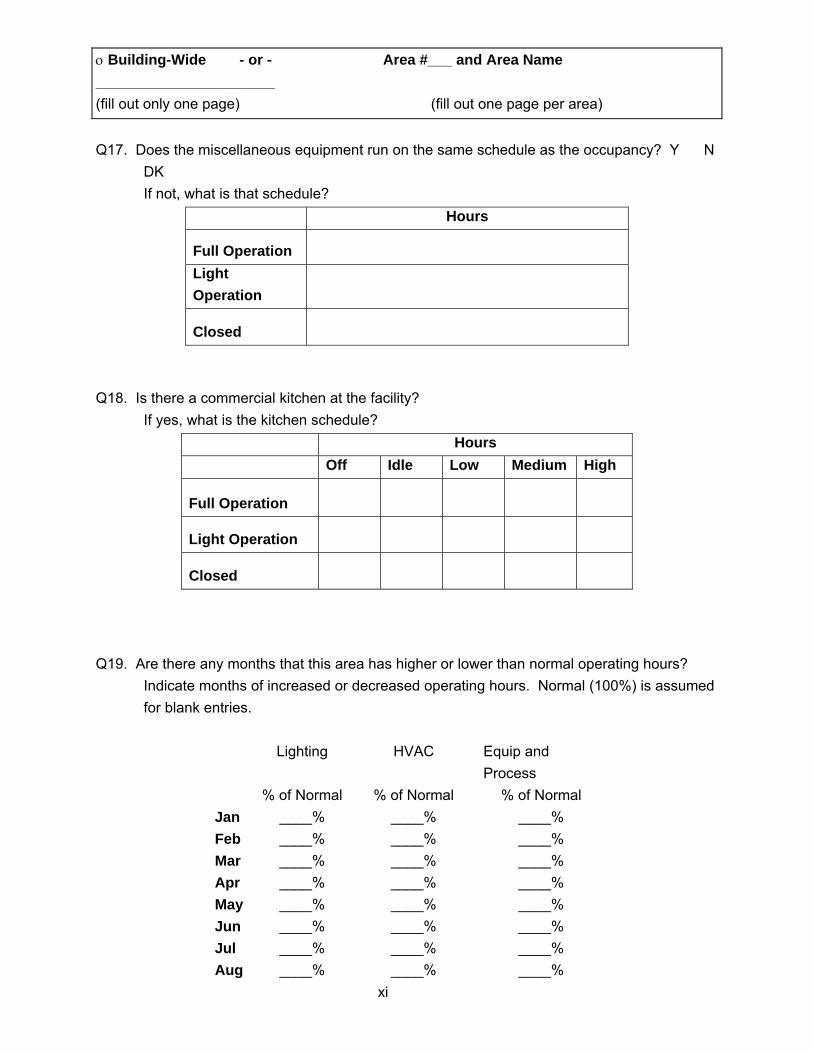
ο Building-Wide - or - Area #___ and Area Name ______________________ (fill out only one page) (fill out one page per area)
Q17. Does the miscellaneous equipment run on the same schedule as the occupancy? Y N
DK If not, what is that schedule?
Hours
Full Operation Light Operation
Closed
Q18. Is there a commercial kitchen at the facility? If yes, what is the kitchen schedule?
Hours Off Idle Low Medium High
Full Operation
Light Operation
Closed
Q19. Are there any months that this area has higher or lower than normal operating hours?
Indicate months of increased or decreased operating hours. Normal (100%) is assumed for blank entries.
Lighting HVAC Equip and
Process % of Normal % of Normal % of Normal Jan ____% ____% ____% Feb ____% ____% ____% Mar ____% ____% ____% Apr ____% ____% ____% May ____% ____% ____% Jun ____% ____% ____% Jul ____% ____% ____% Aug ____% ____% ____%
xii
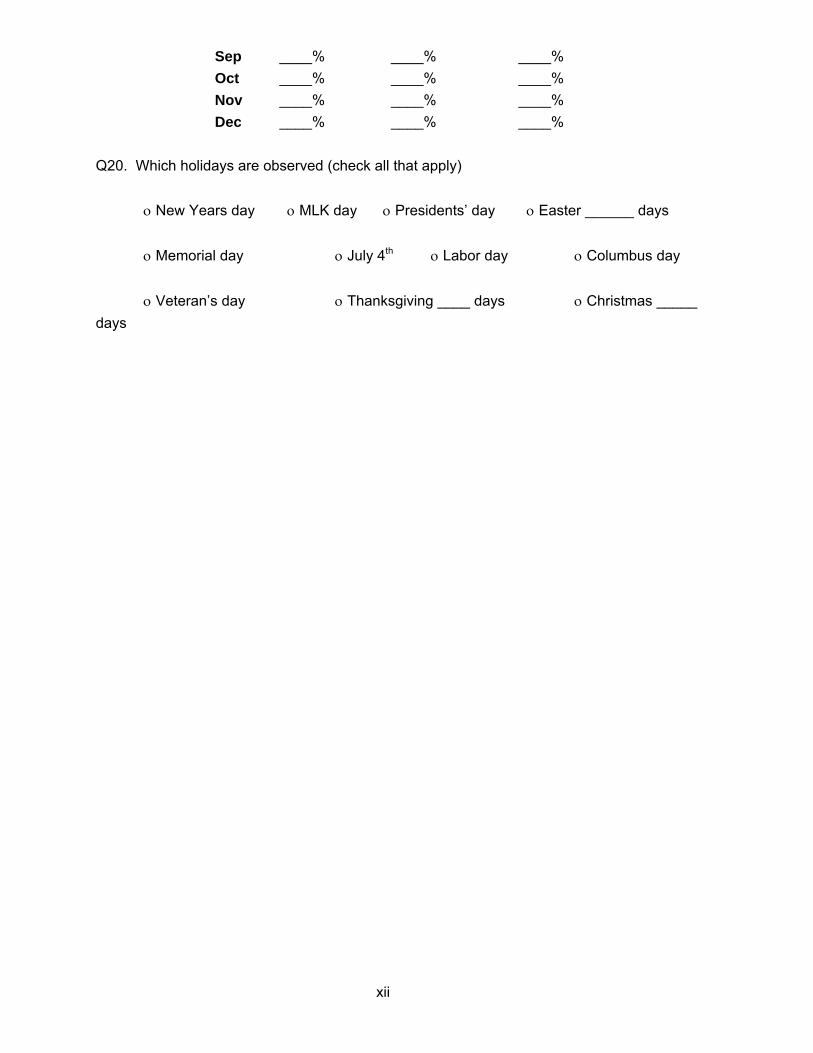
Sep ____% ____% ____% Oct ____% ____% ____% Nov ____% ____% ____% Dec ____% ____% ____%
Q20. Which holidays are observed (check all that apply) ο New Years day ο MLK day ο Presidents’ day ο Easter ______ days ο Memorial day ο July 4th ο Labor day ο Columbus day
ο Veteran’s day ο Thanksgiving ____ days ο Christmas _____ days
xiii
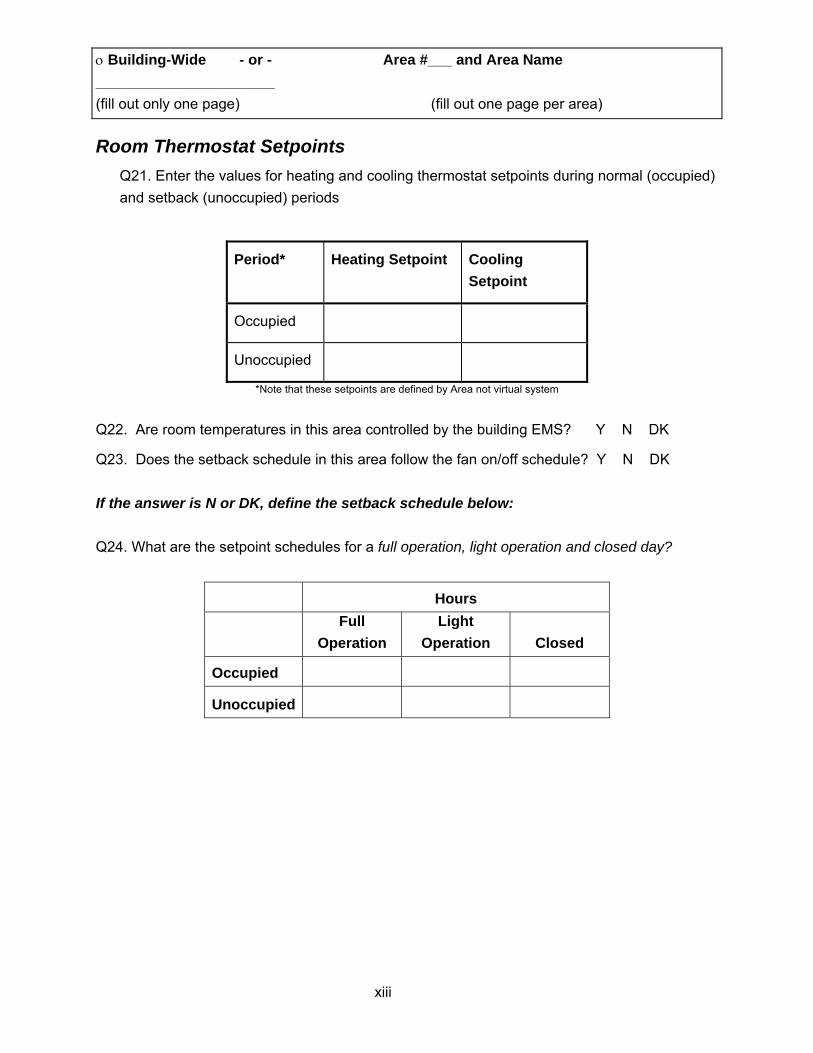
ο Building-Wide - or - Area #___ and Area Name ______________________ (fill out only one page) (fill out one page per area)
Room Thermostat Setpoints Q21. Enter the values for heating and cooling thermostat setpoints during normal (occupied) and setback (unoccupied) periods
Period* Heating Setpoint Cooling Setpoint
Occupied
Unoccupied
*Note that these setpoints are defined by Area not virtual system
Q22. Are room temperatures in this area controlled by the building EMS? Y N DK
Q23. Does the setback schedule in this area follow the fan on/off schedule? Y N DK If the answer is N or DK, define the setback schedule below: Q24. What are the setpoint schedules for a full operation, light operation and closed day?
Hours
Full
Operation Light
Operation Closed
Occupied
Unoccupied

xiv
� Building-Wide
Exterior Lighting Q25. How are the exterior lights controlled? ο Time clock ο Photocell ο DK Q26. If the exterior lights are controlled with a time clock, what is the schedule of operation.
Hours Full Operation Light Operation Closed On Off
Exterior Miscellaneous Equipment Q27. Provide a schedule for miscellaneous equipment not in the conditioned space for a full
operation, light operation, and closed day.
Hours Full Operation Light Operation Closed
xv
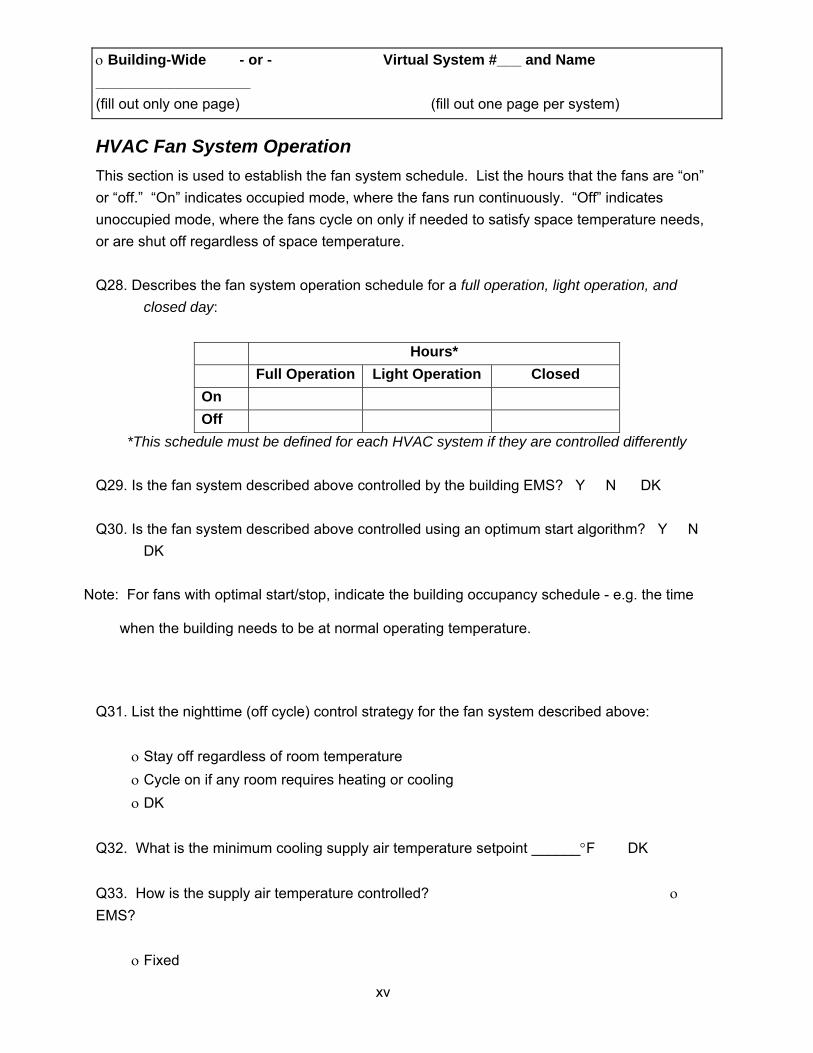
ο Building-Wide - or - Virtual System #___ and Name ___________________ (fill out only one page) (fill out one page per system)
HVAC Fan System Operation This section is used to establish the fan system schedule. List the hours that the fans are “on” or “off.” “On” indicates occupied mode, where the fans run continuously. “Off” indicates unoccupied mode, where the fans cycle on only if needed to satisfy space temperature needs, or are shut off regardless of space temperature. Q28. Describes the fan system operation schedule for a full operation, light operation, and
closed day:
Hours* Full Operation Light Operation Closed On Off
*This schedule must be defined for each HVAC system if they are controlled differently Q29. Is the fan system described above controlled by the building EMS? Y N DK Q30. Is the fan system described above controlled using an optimum start algorithm? Y N
DK
Note: For fans with optimal start/stop, indicate the building occupancy schedule - e.g. the time
when the building needs to be at normal operating temperature.
Q31. List the nighttime (off cycle) control strategy for the fan system described above:
ο Stay off regardless of room temperature ο Cycle on if any room requires heating or cooling ο DK
Q32. What is the minimum cooling supply air temperature setpoint ______°F DK
Q33. How is the supply air temperature controlled? ο EMS?
ο Fixed
xvi
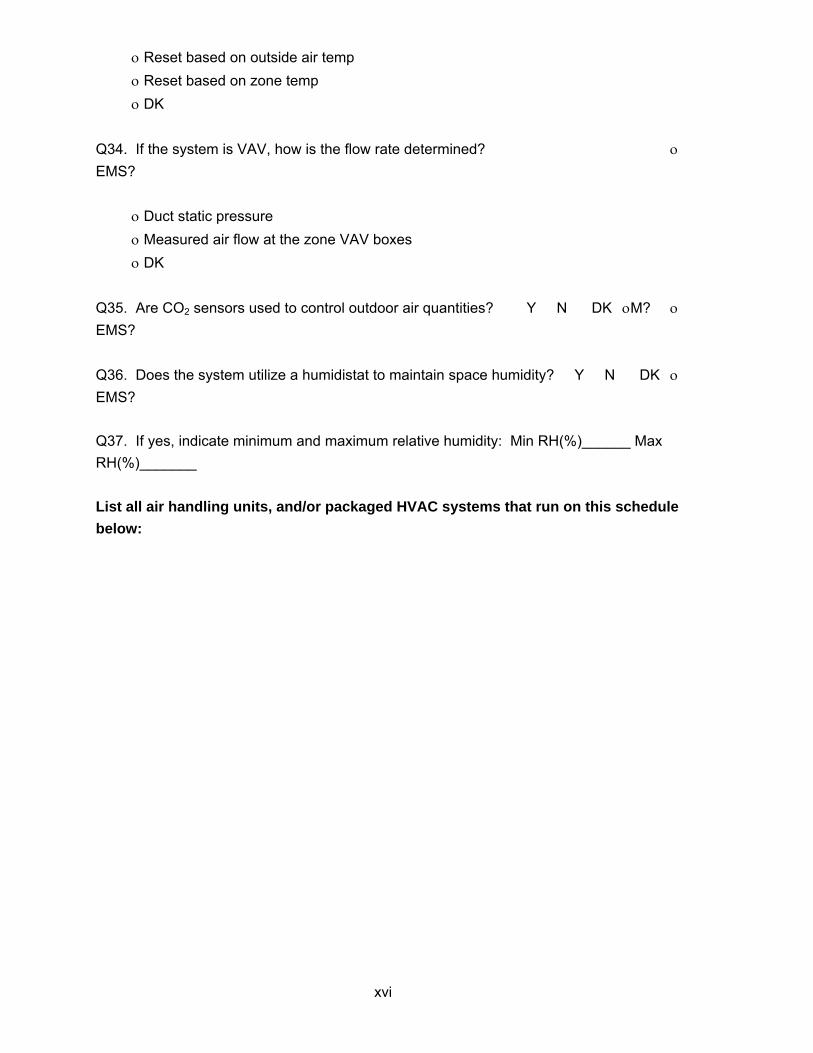
ο Reset based on outside air temp ο Reset based on zone temp ο DK
Q34. If the system is VAV, how is the flow rate determined? ο EMS?
ο Duct static pressure ο Measured air flow at the zone VAV boxes ο DK
Q35. Are CO2 sensors used to control outdoor air quantities? Y N DK οM? ο EMS? Q36. Does the system utilize a humidistat to maintain space humidity? Y N DK ο EMS? Q37. If yes, indicate minimum and maximum relative humidity: Min RH(%)______ Max RH(%)_______ List all air handling units, and/or packaged HVAC systems that run on this schedule below:

xvii
� Building-Wide
Central HVAC Design and Control The following questions will help us to understand how the HVAC systems operate in the building. (These questions are designed to be answered by someone familiar with the operation of the building mechanical and control systems.) Q38. Does the building have a central energy management system (EMS)? Y N DK Q39. What is the minimum condenser water setpoint temperature? ______°F DK Q40. What is the minimum cooling tower approach setpoint temperature? ______°F DK Q41. How is the condenser water setpoint temperature controlled? ο EMS?
ο Fixed ο Reset based on outside temp ο DK
Q42. If the building has chillers and cooling towers, is the system equipped with a water-side
economizer? Y N DK Q43. If yes, what type of water-side economizer is used? ο Strainer cycle ο Thermosyphon ο Plate-frame heat exchanger ο DK Q44. Circle the months of the year when the water-side economizer system is typically used: J F M A M J J A S O N D DK Q45. Is the heating system turned off (locked out) on a seasonal basis? Y N DK Q46. If yes, indicate the months when the heating system is typically available: J F M A M J J A S O N D DK
xviii
� Building-Wide
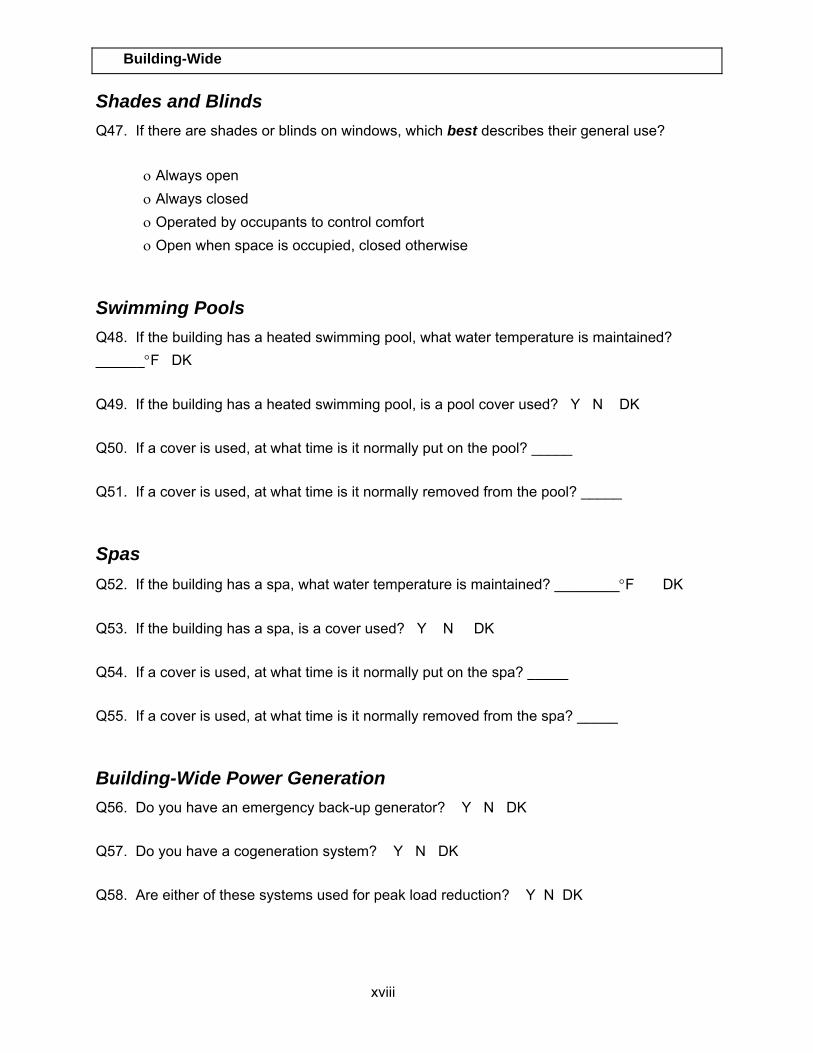
Shades and Blinds Q47. If there are shades or blinds on windows, which best describes their general use? ο Always open ο Always closed ο Operated by occupants to control comfort ο Open when space is occupied, closed otherwise
Swimming Pools Q48. If the building has a heated swimming pool, what water temperature is maintained? ______°F DK Q49. If the building has a heated swimming pool, is a pool cover used? Y N DK Q50. If a cover is used, at what time is it normally put on the pool? _____ Q51. If a cover is used, at what time is it normally removed from the pool? _____
Spas Q52. If the building has a spa, what water temperature is maintained? ________°F DK Q53. If the building has a spa, is a cover used? Y N DK Q54. If a cover is used, at what time is it normally put on the spa? _____ Q55. If a cover is used, at what time is it normally removed from the spa? _____
Building-Wide Power Generation Q56. Do you have an emergency back-up generator? Y N DK Q57. Do you have a cogeneration system? Y N DK Q58. Are either of these systems used for peak load reduction? Y N DK
xix
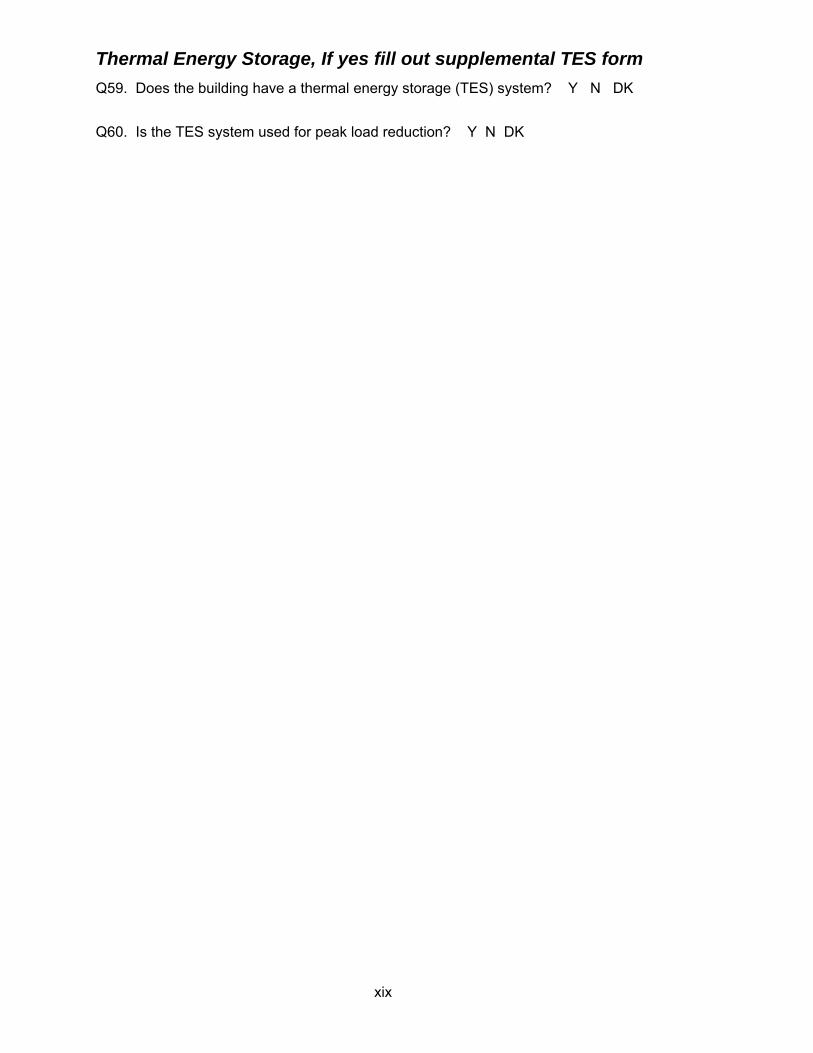
Thermal Energy Storage, If yes fill out supplemental TES form Q59. Does the building have a thermal energy storage (TES) system? Y N DK Q60. Is the TES system used for peak load reduction? Y N DK
xx
� Building-Wide
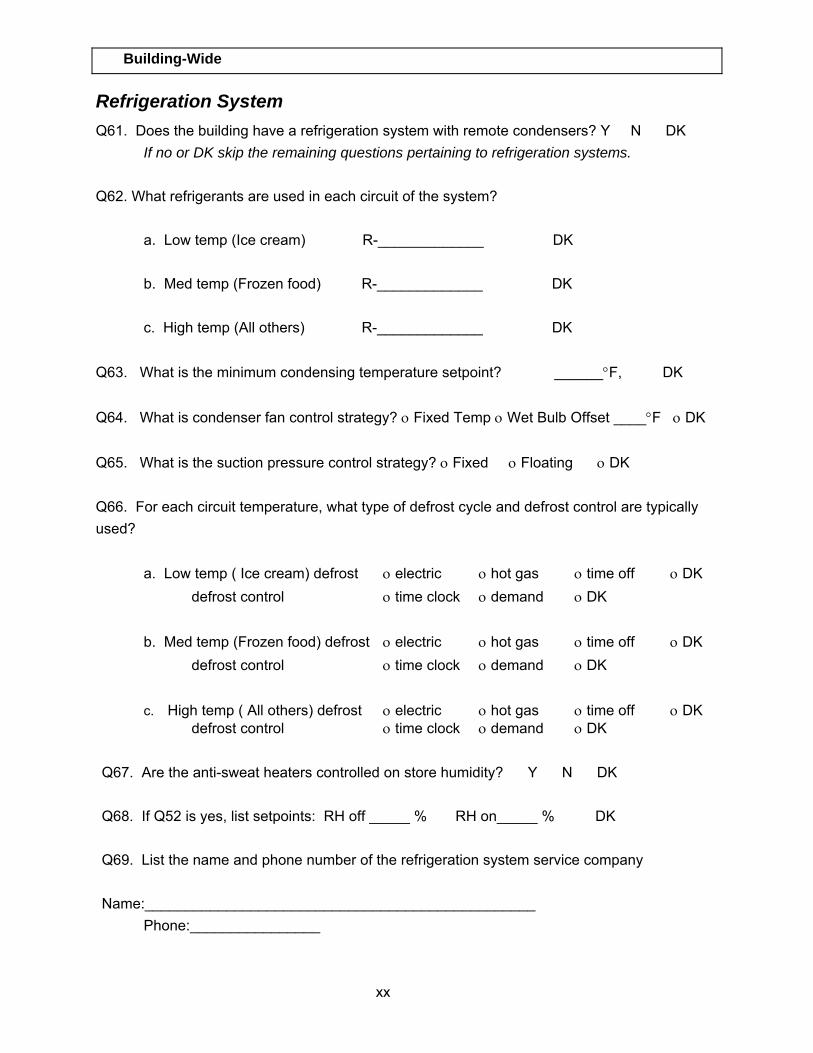
Refrigeration System Q61. Does the building have a refrigeration system with remote condensers? Y N DK
If no or DK skip the remaining questions pertaining to refrigeration systems.
Q62. What refrigerants are used in each circuit of the system? a. Low temp (Ice cream) R-_____________ DK b. Med temp (Frozen food) R-_____________ DK c. High temp (All others) R-_____________ DK Q63. What is the minimum condensing temperature setpoint? ______°F, DK Q64. What is condenser fan control strategy? ο Fixed Temp ο Wet Bulb Offset ____°F ο DK Q65. What is the suction pressure control strategy? ο Fixed ο Floating ο DK Q66. For each circuit temperature, what type of defrost cycle and defrost control are typically used?
a. Low temp ( Ice cream) defrost ο electric ο hot gas ο time off ο DK defrost control ο time clock ο demand ο DK
b. Med temp (Frozen food) defrost ο electric ο hot gas ο time off ο DK
defrost control ο time clock ο demand ο DK
c. High temp ( All others) defrost ο electric ο hot gas ο time off ο DK defrost control ο time clock ο demand ο DK
Q67. Are the anti-sweat heaters controlled on store humidity? Y N DK Q68. If Q52 is yes, list setpoints: RH off _____ % RH on_____ % DK Q69. List the name and phone number of the refrigeration system service company Name:________________________________________________
Phone:________________

xxi
xxii
� Building-Wide
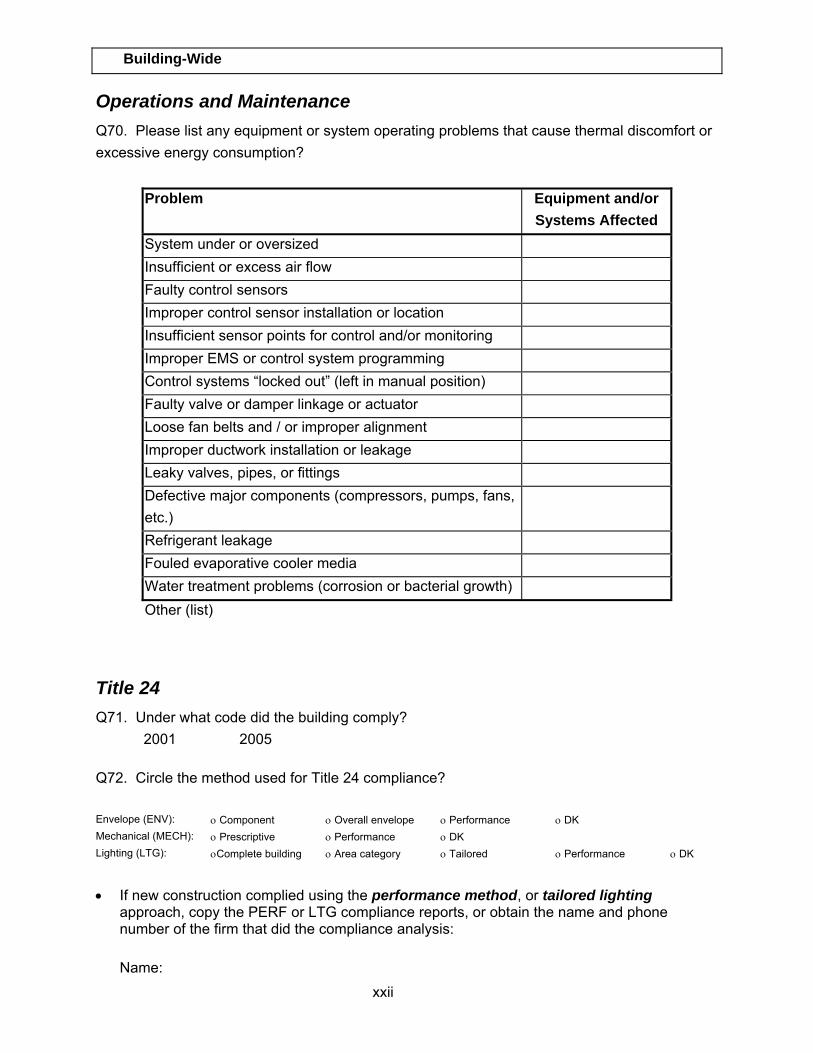
Operations and Maintenance Q70. Please list any equipment or system operating problems that cause thermal discomfort or excessive energy consumption?
Problem Equipment and/or Systems Affected
System under or oversized Insufficient or excess air flow Faulty control sensors Improper control sensor installation or location Insufficient sensor points for control and/or monitoring Improper EMS or control system programming Control systems “locked out” (left in manual position) Faulty valve or damper linkage or actuator Loose fan belts and / or improper alignment Improper ductwork installation or leakage Leaky valves, pipes, or fittings Defective major components (compressors, pumps, fans, etc.)
Refrigerant leakage Fouled evaporative cooler media Water treatment problems (corrosion or bacterial growth) Other (list)
Title 24 Q71. Under what code did the building comply?
2001 2005
Q72. Circle the method used for Title 24 compliance? Envelope (ENV): ο Component ο Overall envelope ο Performance ο DK Mechanical (MECH): ο Prescriptive ο Performance ο DK Lighting (LTG): οComplete building ο Area category ο Tailored ο Performance ο DK
• If new construction complied using the performance method, or tailored lighting
approach, copy the PERF or LTG compliance reports, or obtain the name and phone number of the firm that did the compliance analysis:
Name:

xxiii
Phone:
Notes:

xxiv
Built-Up HVAC Systems* *Indicate if backup or stand-by equipment
Chillers/ Large Split DX ο Serves more than the surveyed area
CH- CH- CH-
Equipment Name ο existing?
ο M? ο exisitng?
ο M? ο existing?
ο M?
Location
Quantity
Manufacturer
Model Number
Serial Number
Size (tons)
Chiller Type*
Full-load efficiency kW/ton
COP kW/ton
COP kW/ton
COP
Condenser Type Air / Water Air / Water Air / Water
Air-Cooled Cond. Fan hp** *Chiiller type: 1=recip; 2=screw/scroll; 3=cent; 4=sngl eff absorp; 5=dbl eff ind fired absorp; 6=dbl eff dir fired absorp; 7=gas eng **Enter condenser fan hp only if not included in equipment efficiency rating
xxv
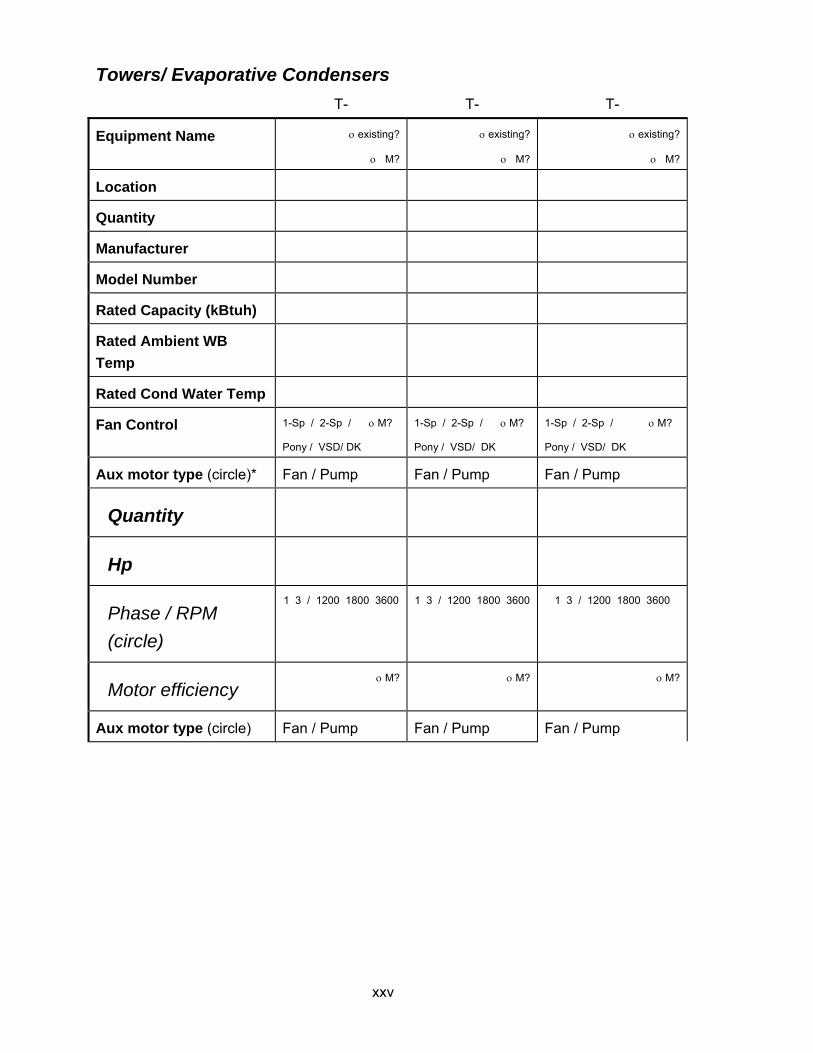
Towers/ Evaporative Condensers T- T- T-
Equipment Name ο existing?
ο M?
ο existing?
ο M?
ο existing?
ο M?
Location
Quantity
Manufacturer
Model Number
Rated Capacity (kBtuh)
Rated Ambient WB Temp
Rated Cond Water Temp
Fan Control 1-Sp / 2-Sp / ο M?
Pony / VSD/ DK
1-Sp / 2-Sp / ο M?
Pony / VSD/ DK
1-Sp / 2-Sp / ο M?
Pony / VSD/ DK
Aux motor type (circle)* Fan / Pump Fan / Pump Fan / Pump
Quantity
Hp
Phase / RPM (circle)
1 3 / 1200 1800 3600 1 3 / 1200 1800 3600 1 3 / 1200 1800 3600
Motor efficiency ο M? ο M? ο M?
Aux motor type (circle) Fan / Pump Fan / Pump Fan / Pump
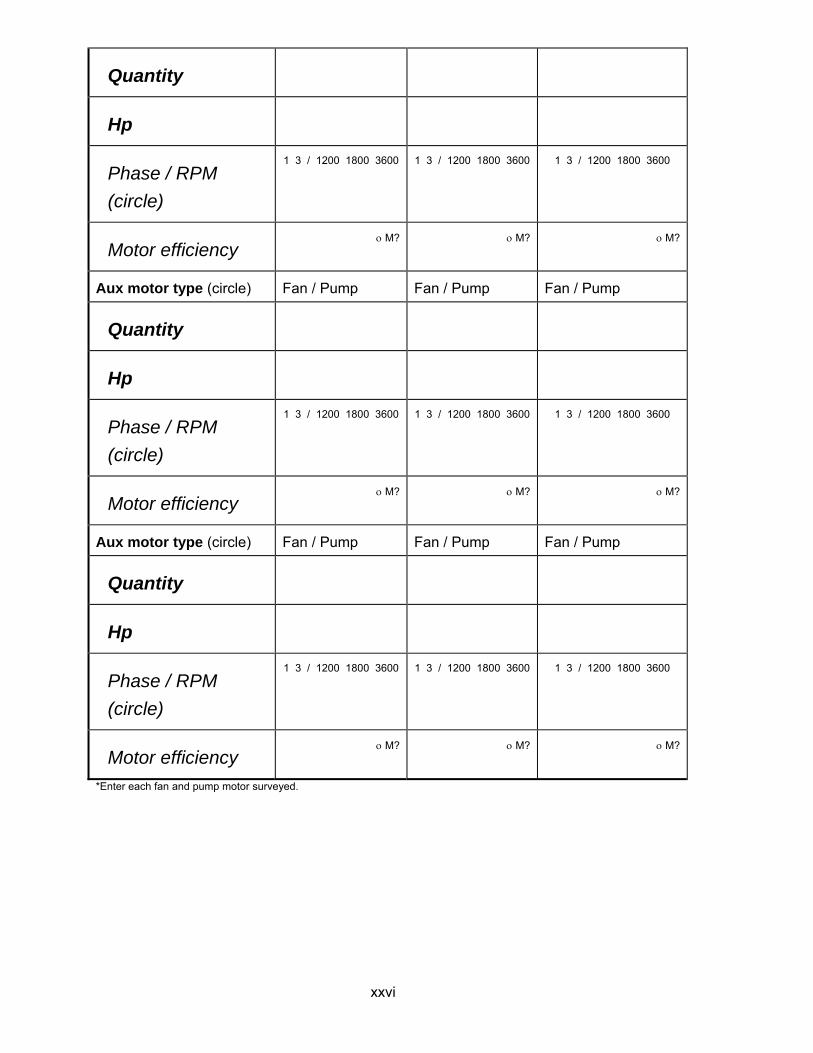
xxvi
Quantity
Hp
Phase / RPM (circle)
1 3 / 1200 1800 3600 1 3 / 1200 1800 3600 1 3 / 1200 1800 3600
Motor efficiency ο M? ο M? ο M?
Aux motor type (circle) Fan / Pump Fan / Pump Fan / Pump
Quantity
Hp
Phase / RPM (circle)
1 3 / 1200 1800 3600 1 3 / 1200 1800 3600 1 3 / 1200 1800 3600
Motor efficiency ο M? ο M? ο M?
Aux motor type (circle) Fan / Pump Fan / Pump Fan / Pump
Quantity
Hp
Phase / RPM (circle)
1 3 / 1200 1800 3600 1 3 / 1200 1800 3600 1 3 / 1200 1800 3600
Motor efficiency ο M? ο M? ο M?
*Enter each fan and pump motor surveyed.
xxvii
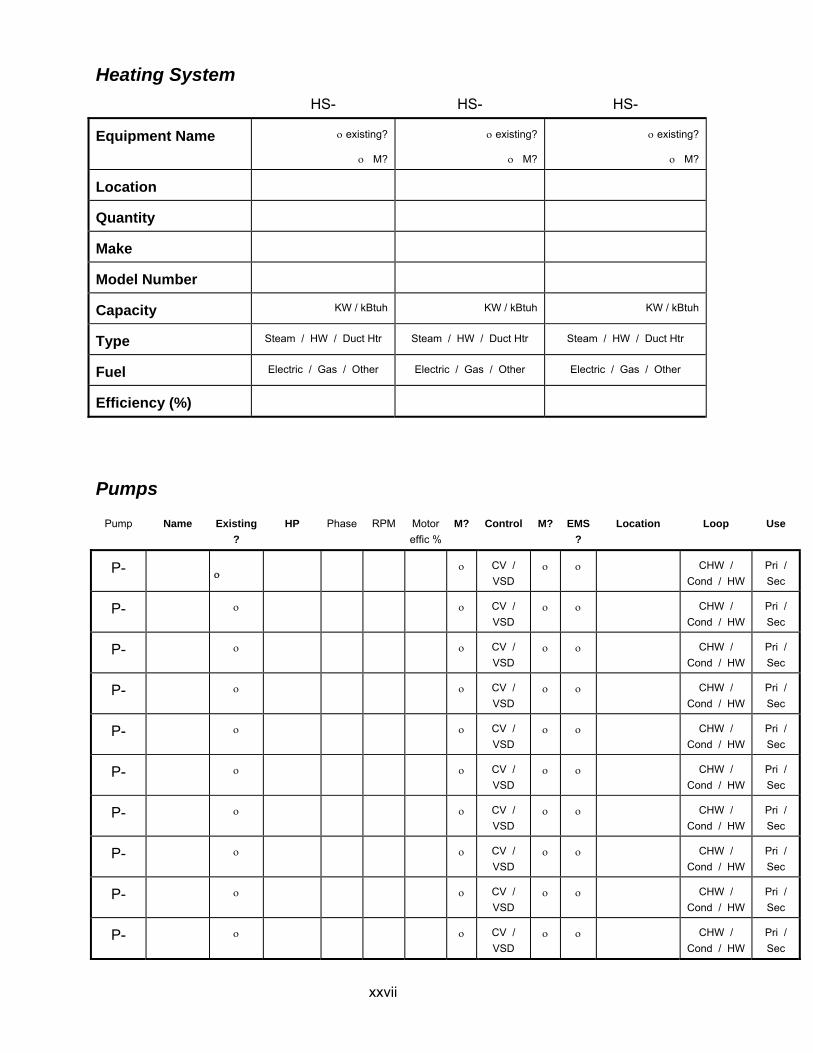
Heating System HS- HS- HS-
Equipment Name ο existing?
ο M?
ο existing?
ο M?
ο existing?
ο M?
Location
Quantity
Make
Model Number
Capacity KW / kBtuh KW / kBtuh KW / kBtuh
Type Steam / HW / Duct Htr Steam / HW / Duct Htr Steam / HW / Duct Htr
Fuel Electric / Gas / Other Electric / Gas / Other Electric / Gas / Other
Efficiency (%)
Pumps
Pump Name Existing?
HP Phase RPM Motor effic %
M? Control M? EMS?
Location Loop Use
P- ο ο CV /
VSD ο ο CHW /
Cond / HW Pri / Sec
P- ο ο CV / VSD
ο ο CHW / Cond / HW
Pri / Sec
P- ο ο CV / VSD
ο ο CHW / Cond / HW
Pri / Sec
P- ο ο CV / VSD
ο ο CHW / Cond / HW
Pri / Sec
P- ο ο CV / VSD
ο ο CHW / Cond / HW
Pri / Sec
P- ο ο CV / VSD
ο ο CHW / Cond / HW
Pri / Sec
P- ο ο CV / VSD
ο ο CHW / Cond / HW
Pri / Sec
P- ο ο CV / VSD
ο ο CHW / Cond / HW
Pri / Sec
P- ο ο CV / VSD
ο ο CHW / Cond / HW
Pri / Sec
P- ο ο CV / VSD
ο ο CHW / Cond / HW
Pri / Sec

xxviii
Central Air Handlers
Name AH- AH- AH-
Equipment Name ο existing?
ο M?
ο existing?
ο M?
ο existing?
ο M?
Location
Quantity
Type (circle one) Single Duct Dual Duct
Multi-Zone
Single Duct Dual Duct
Multi-Zone
Single Duct Dual Duct
Multi-Zone
Evaporative System Type (circle one)
None / Direct οM?
Ind / Ind-Dir
None / Direct οM?
Ind / Ind-Dir
None / Direct οM?
Ind / Ind-Dir
Supply Fan Type (circle one)
CV / VAV CV / VAV CV / VAV
Supply Fan Control (circle one)
CV: Constant / Cycles
VAV: VSD / Inlet/ Disch οM?
CV: Constant / Cycles
VAV: VSD / Inlet/ Disch οM?
CV: Constant / Cycles
VAV: VSD / Inlet/ Disch οM?
EMS control of supply fan? ο ο ο
Supply Fan Flow Rate (cfm)
Fan motor type (circle) Supply / Return Supply / Return Supply / Return
Motor HP
Phase / RPM (circle) 1 3 / 1200 1800 3600 1 3 / 1200 1800 3600 1 3 / 1200 1800 3600
Motor efficiency οM? οM? οM?
Fan motor type (circle) Supply / Return Supply / Return Supply / Return
Motor HP
Phase / RPM (circle) 1 3 / 1200 1800 3600 1 3 / 1200 1800 3600 1 3 / 1200 1800 3600
Motor efficiency οM? οM? οM?
Fan motor type (circle) Supply / Return Supply / Return Supply / Return
Motor HP
Phase / RPM (circle) 1 3 / 1200 1800 3600 1 3 / 1200 1800 3600 1 3 / 1200 1800 3600
Motor efficiency οM? οM? οM?
Fan motor type (circle) Supply / Return Supply / Return Supply / Return
xxix
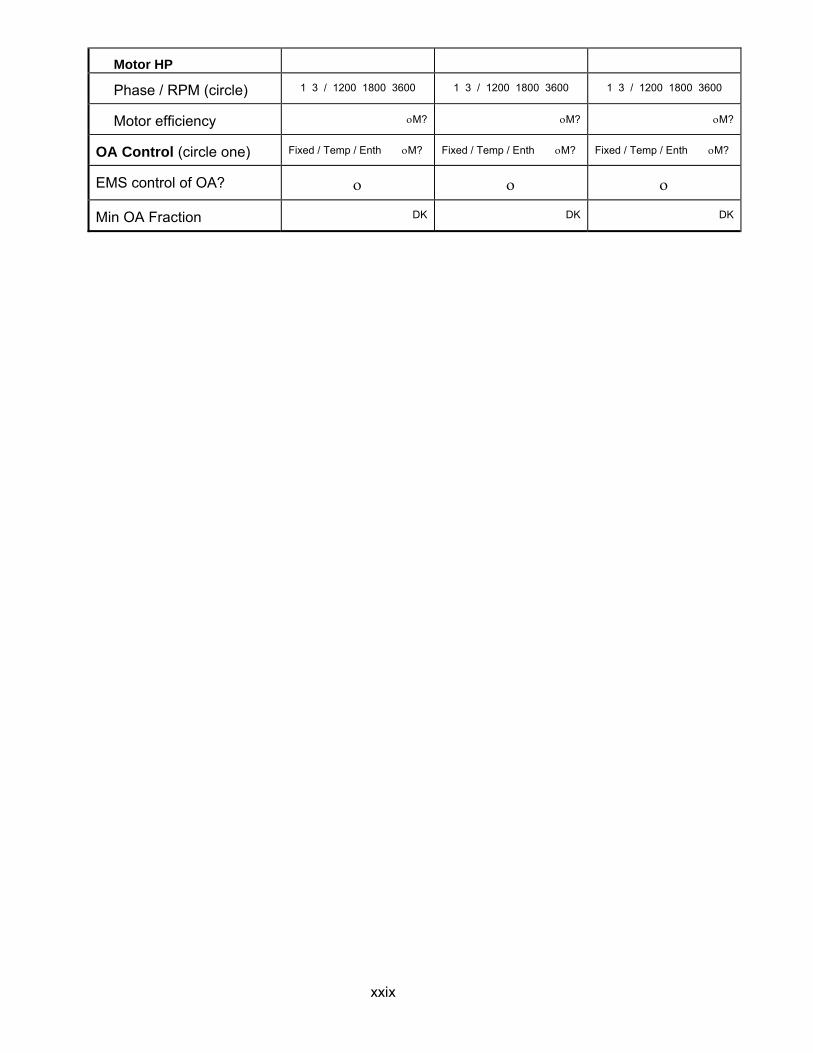
Motor HP
Phase / RPM (circle) 1 3 / 1200 1800 3600 1 3 / 1200 1800 3600 1 3 / 1200 1800 3600
Motor efficiency οM? οM? οM?
OA Control (circle one) Fixed / Temp / Enth οM? Fixed / Temp / Enth οM? Fixed / Temp / Enth οM?
EMS control of OA? ο ο ο
Min OA Fraction DK DK DK
xxx
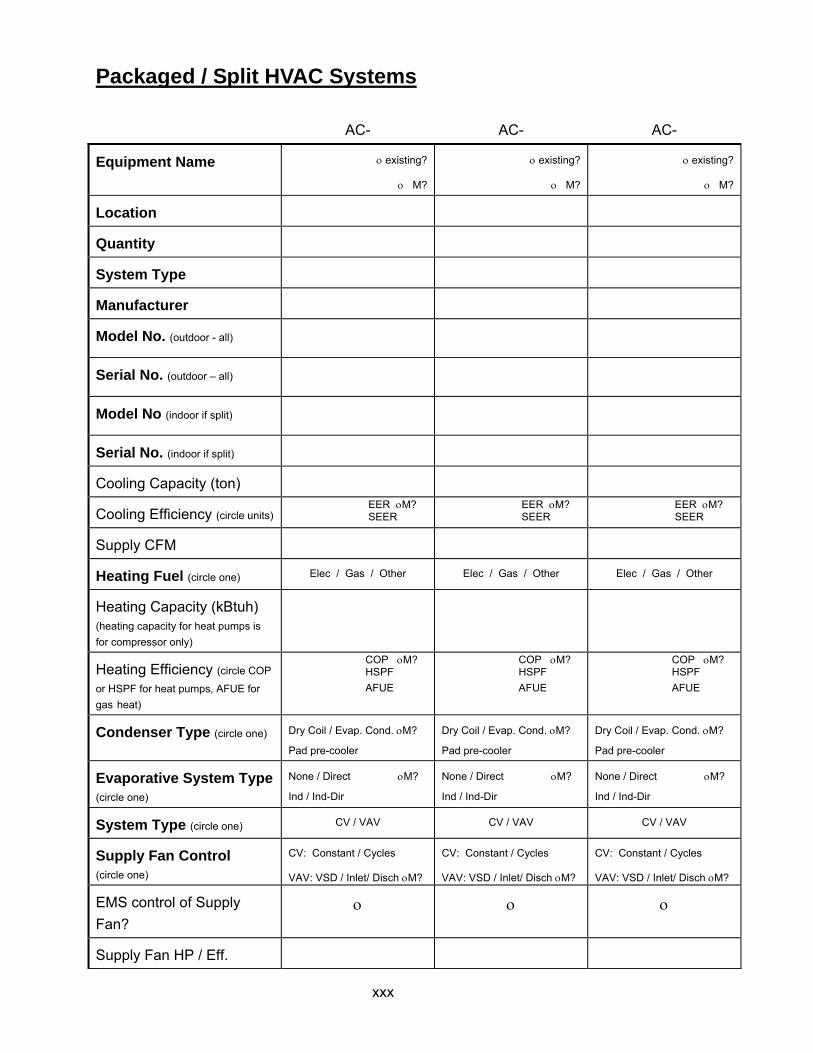
Packaged / Split HVAC Systems
AC- AC- AC-
Equipment Name ο existing?
ο M?
ο existing?
ο M?
ο existing?
ο M?
Location
Quantity
System Type
Manufacturer
Model No. (outdoor - all)
Serial No. (outdoor – all)
Model No (indoor if split)
Serial No. (indoor if split)
Cooling Capacity (ton)
Cooling Efficiency (circle units) EER οM? SEER
EER οM? SEER
EER οM? SEER
Supply CFM
Heating Fuel (circle one) Elec / Gas / Other Elec / Gas / Other Elec / Gas / Other
Heating Capacity (kBtuh)
(heating capacity for heat pumps is for compressor only)
Heating Efficiency (circle COP
or HSPF for heat pumps, AFUE for gas heat)
COP οM? HSPF AFUE
COP οM? HSPF AFUE
COP οM? HSPF AFUE
Condenser Type (circle one) Dry Coil / Evap. Cond. οM?
Pad pre-cooler
Dry Coil / Evap. Cond. οM?
Pad pre-cooler
Dry Coil / Evap. Cond. οM?
Pad pre-cooler
Evaporative System Type (circle one)
None / Direct οM?
Ind / Ind-Dir
None / Direct οM?
Ind / Ind-Dir
None / Direct οM?
Ind / Ind-Dir
System Type (circle one) CV / VAV CV / VAV CV / VAV
Supply Fan Control (circle one)
CV: Constant / Cycles
VAV: VSD / Inlet/ Disch οM?
CV: Constant / Cycles
VAV: VSD / Inlet/ Disch οM?
CV: Constant / Cycles
VAV: VSD / Inlet/ Disch οM?
EMS control of Supply Fan?
ο ο ο
Supply Fan HP / Eff.

xxxi
Return/Relief Fan HP / Eff.
OA Control Fixed / Temp / Enth οM?
Single Point / Differential
Fixed / Temp / Enth οM?
Single Point / Differential
Fixed / Temp / Enth οM?
Single Point / Differential
EMS control of OA? ο ο ο
Min OA Fraction DK DK DK
xxxii
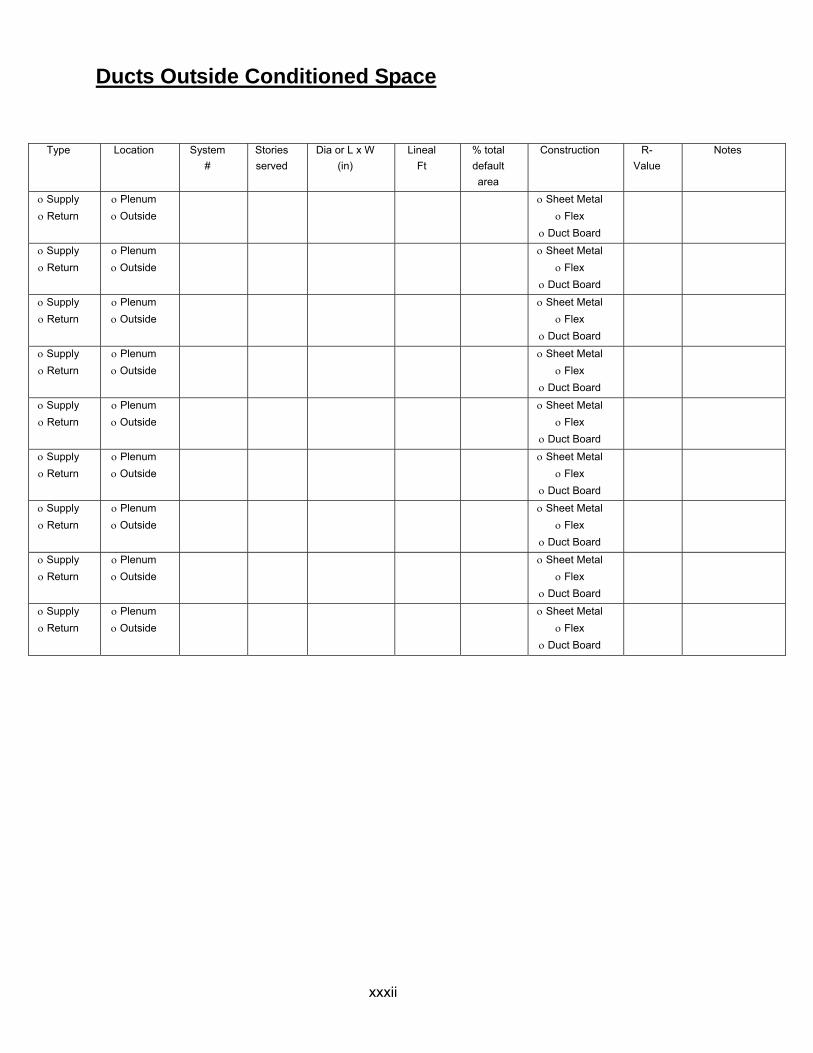
Ducts Outside Conditioned Space
Type Location System
# Stories served
Dia or L x W (in)
Lineal Ft
% total default area
Construction R-Value
Notes
ο Supply ο Return
ο Plenum ο Outside
ο Sheet Metal ο Flex
ο Duct Board
ο Supply ο Return
ο Plenum ο Outside
ο Sheet Metal ο Flex
ο Duct Board
ο Supply ο Return
ο Plenum ο Outside
ο Sheet Metal ο Flex
ο Duct Board
ο Supply ο Return
ο Plenum ο Outside
ο Sheet Metal ο Flex
ο Duct Board
ο Supply ο Return
ο Plenum ο Outside
ο Sheet Metal ο Flex
ο Duct Board
ο Supply ο Return
ο Plenum ο Outside
ο Sheet Metal ο Flex
ο Duct Board
ο Supply ο Return
ο Plenum ο Outside
ο Sheet Metal ο Flex
ο Duct Board
ο Supply ο Return
ο Plenum ο Outside
ο Sheet Metal ο Flex
ο Duct Board
ο Supply ο Return
ο Plenum ο Outside
ο Sheet Metal ο Flex
ο Duct Board
xxxiii
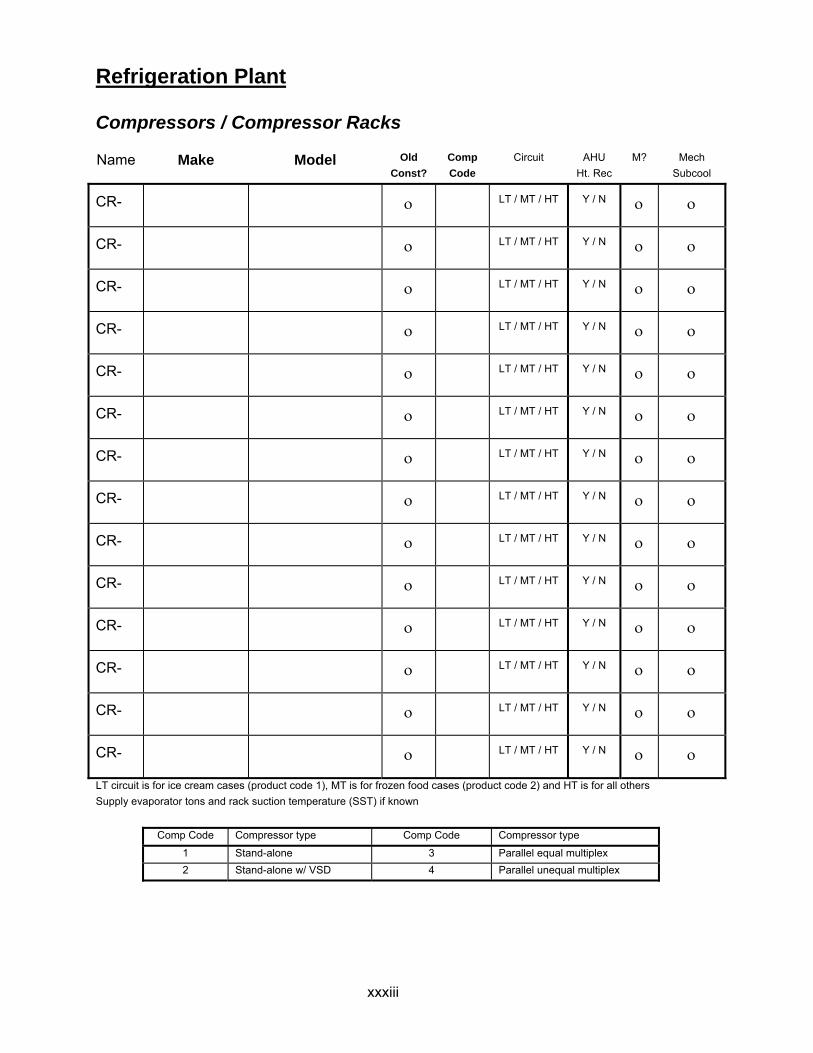
Refrigeration Plant
Compressors / Compressor Racks
Name Make Model Old Const?
Comp Code
Circuit AHU Ht. Rec
M? Mech Subcool
CR- ο LT / MT / HT Y / N ο ο
CR- ο LT / MT / HT Y / N ο ο
CR- ο LT / MT / HT Y / N ο ο
CR- ο LT / MT / HT Y / N ο ο
CR- ο LT / MT / HT Y / N ο ο
CR- ο LT / MT / HT Y / N ο ο
CR- ο LT / MT / HT Y / N ο ο
CR- ο LT / MT / HT Y / N ο ο
CR- ο LT / MT / HT Y / N ο ο
CR- ο LT / MT / HT Y / N ο ο
CR- ο LT / MT / HT Y / N ο ο
CR- ο LT / MT / HT Y / N ο ο
CR- ο LT / MT / HT Y / N ο ο
CR- ο LT / MT / HT Y / N ο ο
LT circuit is for ice cream cases (product code 1), MT is for frozen food cases (product code 2) and HT is for all others Supply evaporator tons and rack suction temperature (SST) if known
Comp Code Compressor type Comp Code Compressor type
1 Stand-alone 3 Parallel equal multiplex 2 Stand-alone w/ VSD 4 Parallel unequal multiplex
xxxiv
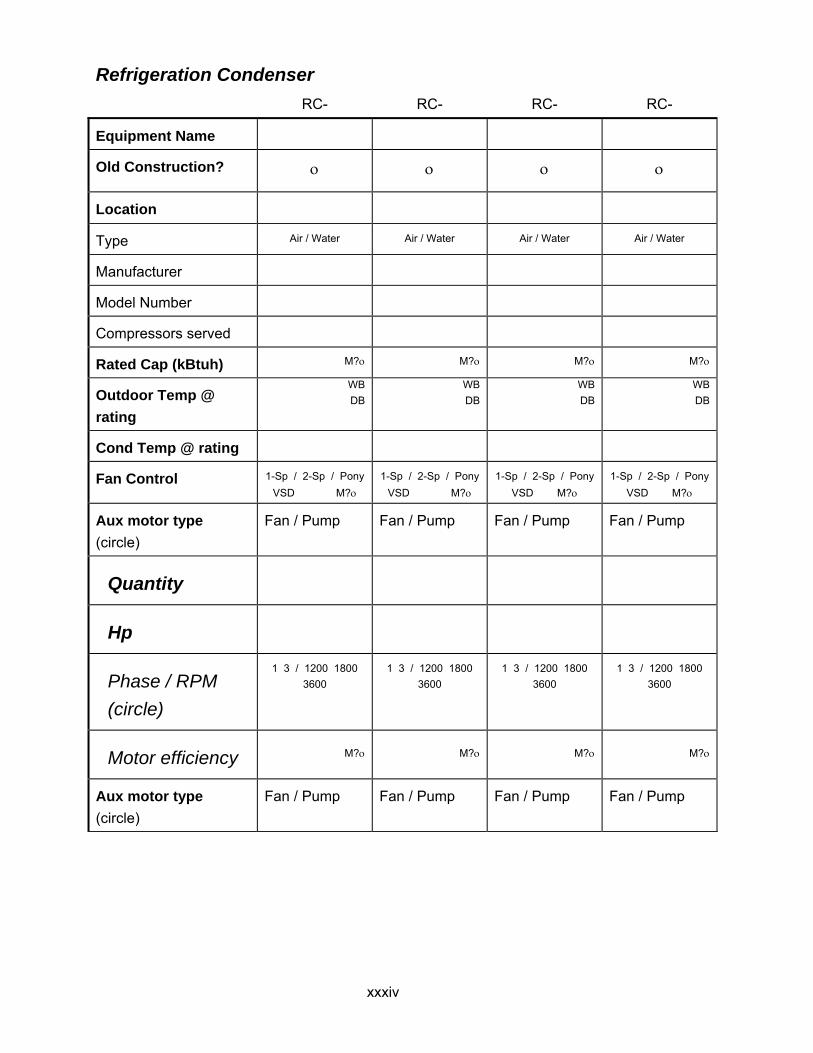
Refrigeration Condenser RC- RC- RC- RC-
Equipment Name
Old Construction? ο ο ο ο
Location
Type Air / Water Air / Water Air / Water Air / Water
Manufacturer
Model Number
Compressors served
Rated Cap (kBtuh) M?ο M?ο M?ο M?ο
Outdoor Temp @ rating
WB DB
WB DB
WB DB
WB DB
Cond Temp @ rating
Fan Control 1-Sp / 2-Sp / Pony VSD M?ο
1-Sp / 2-Sp / Pony VSD M?ο
1-Sp / 2-Sp / Pony VSD M?ο
1-Sp / 2-Sp / Pony VSD M?ο
Aux motor type (circle)
Fan / Pump Fan / Pump Fan / Pump Fan / Pump
Quantity
Hp
Phase / RPM (circle)
1 3 / 1200 1800 3600
1 3 / 1200 1800 3600
1 3 / 1200 1800 3600
1 3 / 1200 1800 3600
Motor efficiency M?ο M?ο M?ο M?ο
Aux motor type (circle)
Fan / Pump Fan / Pump Fan / Pump Fan / Pump
xxxv
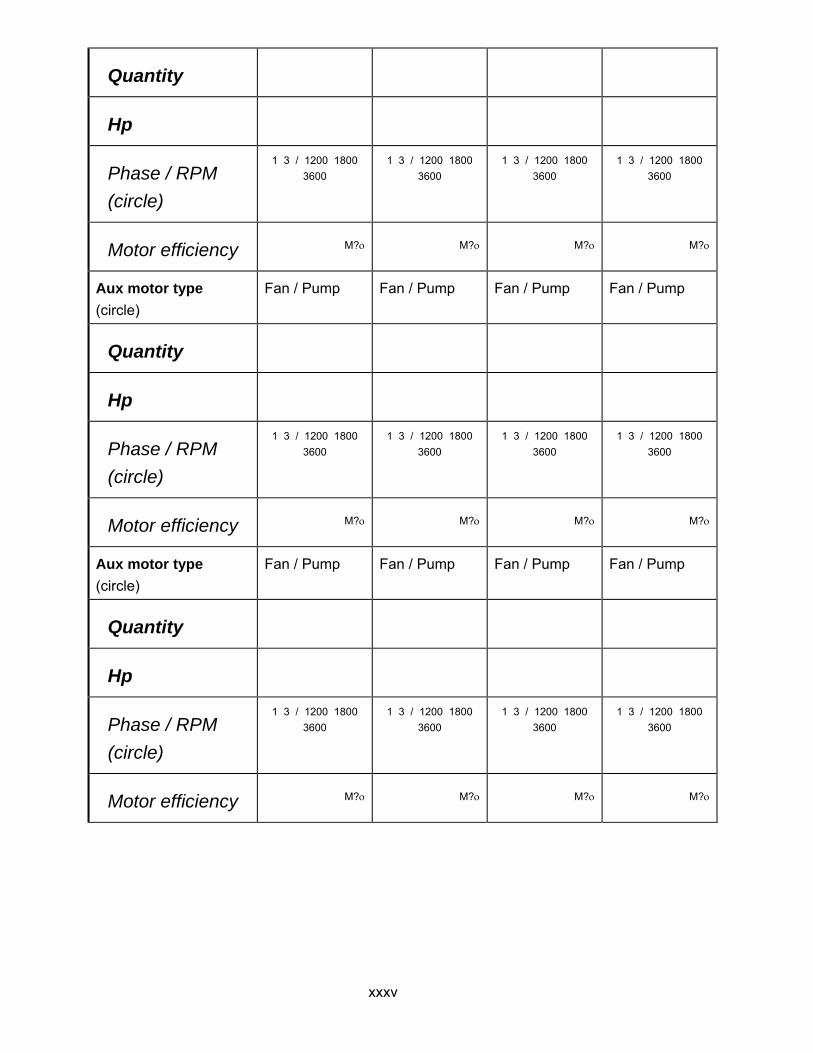
Quantity
Hp
Phase / RPM (circle)
1 3 / 1200 1800 3600
1 3 / 1200 1800 3600
1 3 / 1200 1800 3600
1 3 / 1200 1800 3600
Motor efficiency M?ο M?ο M?ο M?ο
Aux motor type (circle)
Fan / Pump Fan / Pump Fan / Pump Fan / Pump
Quantity
Hp
Phase / RPM (circle)
1 3 / 1200 1800 3600
1 3 / 1200 1800 3600
1 3 / 1200 1800 3600
1 3 / 1200 1800 3600
Motor efficiency M?ο M?ο M?ο M?ο
Aux motor type (circle)
Fan / Pump Fan / Pump Fan / Pump Fan / Pump
Quantity
Hp
Phase / RPM (circle)
1 3 / 1200 1800 3600
1 3 / 1200 1800 3600
1 3 / 1200 1800 3600
1 3 / 1200 1800 3600
Motor efficiency M?ο M?ο M?ο M?ο

xxxvi
Zone* *Note that each zone must be associated with a specific area and virtual HVAC system.
Name Zone Multiplier HVAC zoning by exposure?
Y N
Exterior Walls
Assembly Name Existing? Wall Type Insul R or U-value
HC M? Orientation (N, NE, E, etc.)
H (ft) W (ft)
ο RU
ο
ο RU
ο
ο RU
ο
ο RU
ο
ο RU
ο
Height and width are gross dimensions, including windows Enter “0” for R-value if uninsulated, leave blank if unknown
Wall Construction Type Wall Construction Type Wall Construction Type 1 Face Brick + Brick 4 Poured Concrete + Finish 7 Metal Frame Wall 2 Face Brick + Poured Concrete 5 Concrete Block + Finish 8 Curtain Wall 3 Face Brick + Concrete Block 6 Wood Frame Wall 9 Open
Interior Walls
Assembly Name Type Area H (ft) W (ft) Next to Zone
Notes
Solid Air
Solid Air
Survey only if non-adiabatic

xxxvii
Roof
Assembly Name
Existing?
Roof Type
Surf Type
Surf Color
Reflec Emitt M?
Ceil Insul
Roof M?
H (ft) W (ft) Plen H (ft)
Plen Wall R
Ret Air
ο ο R U
R U
ο ο
ο ο R U
R U
ο ο
ο ο R U
R U
ο ο
ο ο R U
R U
ο ο
Height and width are gross dimensions, including skylights Enter “0” for R-value if uninsulated, leave blank if unknown
Roof Construction Type Roof Surface Roof Surface 10 Concrete Deck Roof. 1 Paint 4 Metal roofing 11 Wood Frame Roof 2 Elastomeric coating 5 Asphalt shingles or roll 12 Metal Frame Roof 3 Single ply membrane 6 Gravel (ballast)
xxxviii
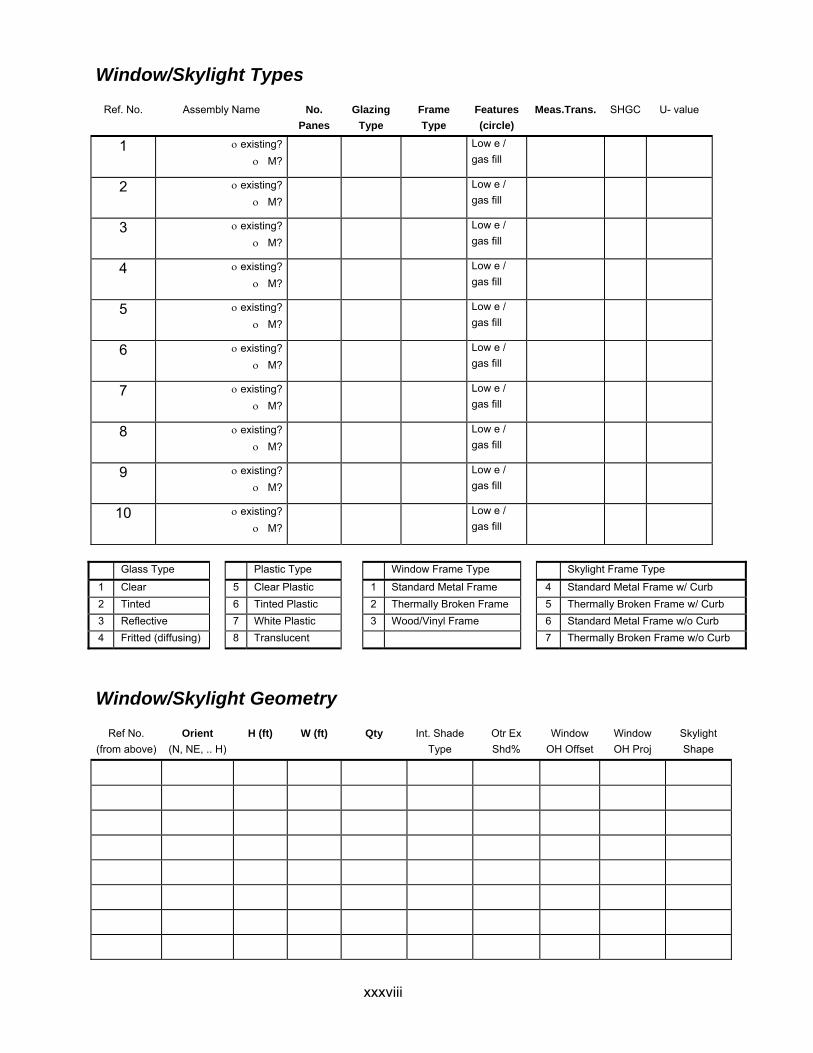
Window/Skylight Types
Ref. No. Assembly Name No. Panes
Glazing Type
Frame Type
Features (circle)
Meas.Trans. SHGC U- value
1 ο existing? ο M?
Low e / gas fill
2 ο existing? ο M?
Low e / gas fill
3 ο existing? ο M?
Low e / gas fill
4 ο existing? ο M?
Low e / gas fill
5 ο existing? ο M?
Low e / gas fill
6 ο existing? ο M?
Low e / gas fill
7 ο existing? ο M?
Low e / gas fill
8 ο existing? ο M?
Low e / gas fill
9 ο existing? ο M?
Low e / gas fill
10 ο existing? ο M?
Low e / gas fill
Glass Type Plastic Type Window Frame Type Skylight Frame Type
1 Clear 5 Clear Plastic 1 Standard Metal Frame 4 Standard Metal Frame w/ Curb 2 Tinted 6 Tinted Plastic 2 Thermally Broken Frame 5 Thermally Broken Frame w/ Curb 3 Reflective 7 White Plastic 3 Wood/Vinyl Frame 6 Standard Metal Frame w/o Curb 4 Fritted (diffusing) 8 Translucent 7 Thermally Broken Frame w/o Curb
Window/Skylight Geometry
Ref No. (from above)
Orient (N, NE, .. H)
H (ft) W (ft) Qty Int. Shade Type
Otr Ex Shd%
Window OH Offset
Window OH Proj
Skylight Shape

xxxix
Otr Ex Shd% refers to exterior shading from adjacent buildings, building self-shading, thick vegetation, hillsides etc. Interior Shade Type: 1 = Blinds; 2 = Light Shades or Drapes; 3 = Dark Shades or Drapes Skylight Shape: 1 = Domed; 2= Flat; 3= Pyramid; 4= Ridge; 5= Vault
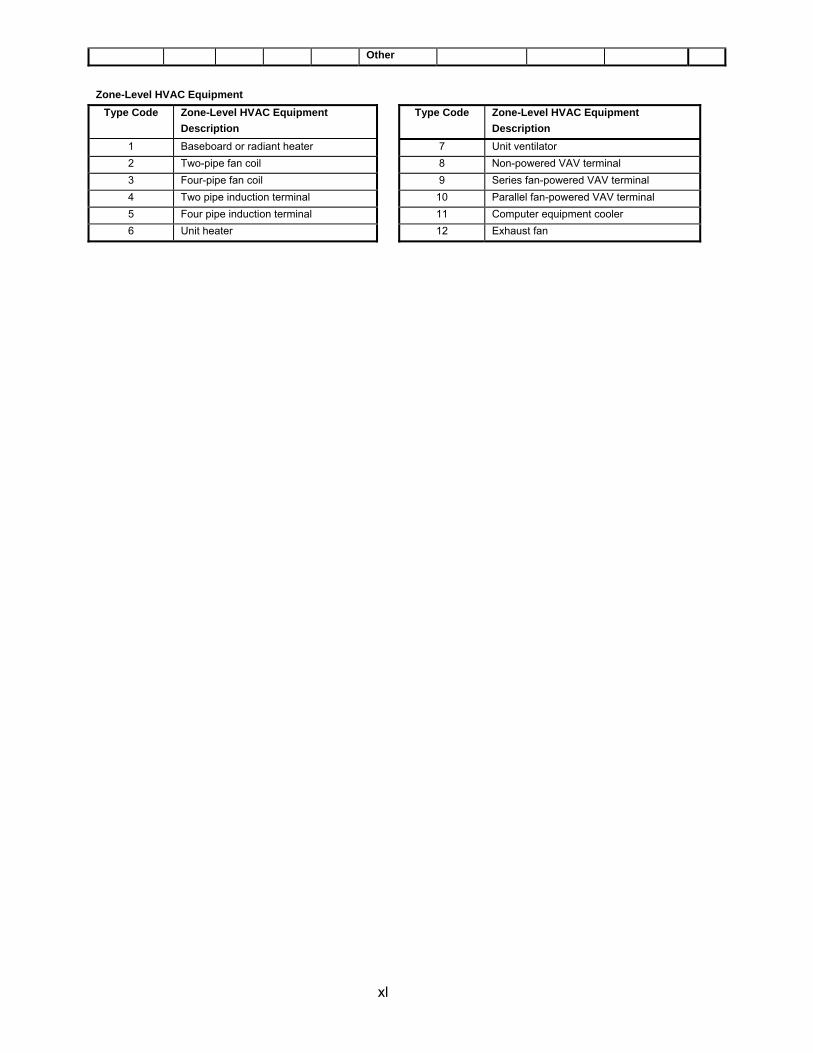
Zone-Level HVAC Equipment (Not Central, Not Packaged)
Name Type Code
Qty Fan Hp
CFM Heat Source
Make Model Capacity M?
None / Elec. / Other
None / Elec. / Other
None / Elec. / Other
None / Elec. / Other
None / Elec. / Other
None / Elec. / Other
None / Elec. / Other
None / Elec. / Other
None / Elec. / Other
None / Elec. / Other
None / Elec. /
xl
Other
Zone-Level HVAC Equipment
Type Code Zone-Level HVAC Equipment Description
Type Code Zone-Level HVAC Equipment Description
1 Baseboard or radiant heater 7 Unit ventilator 2 Two-pipe fan coil 8 Non-powered VAV terminal 3 Four-pipe fan coil 9 Series fan-powered VAV terminal 4 Two pipe induction terminal 10 Parallel fan-powered VAV terminal 5 Four pipe induction terminal 11 Computer equipment cooler 6 Unit heater 12 Exhaust fan
xli
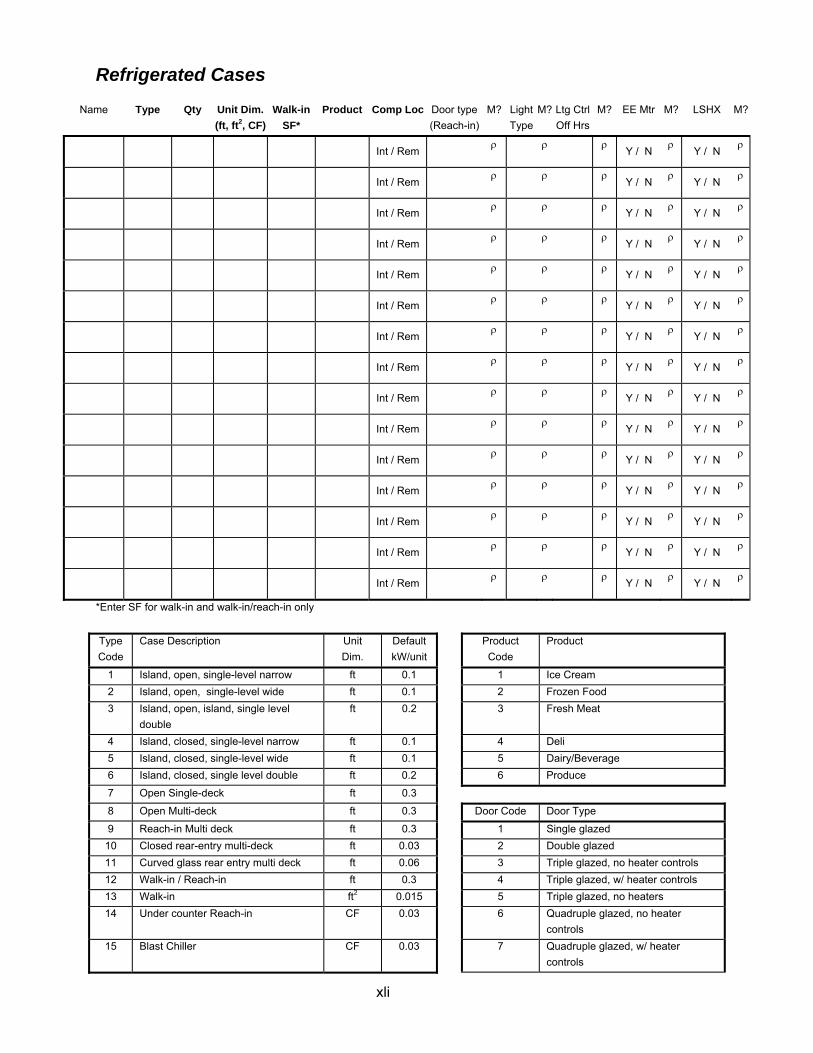
Refrigerated Cases
Name Type Qty Unit Dim. (ft, ft2, CF)
Walk-in SF*
Product Comp Loc Door type (Reach-in)
M? Light Type
M? Ltg Ctrl Off Hrs
M? EE Mtr M? LSHX M?
Int / Rem ρ
ρ
ρ
Y / N ρ
Y / N ρ
Int / Rem ρ
ρ
ρ
Y / N ρ
Y / N ρ
Int / Rem ρ
ρ
ρ
Y / N ρ
Y / N ρ
Int / Rem ρ
ρ
ρ
Y / N ρ
Y / N ρ
Int / Rem ρ
ρ
ρ
Y / N ρ
Y / N ρ
Int / Rem ρ
ρ
ρ
Y / N ρ
Y / N ρ
Int / Rem ρ
ρ
ρ
Y / N ρ
Y / N ρ
Int / Rem ρ
ρ
ρ
Y / N ρ
Y / N ρ
Int / Rem ρ
ρ
ρ
Y / N ρ
Y / N ρ
Int / Rem ρ
ρ
ρ
Y / N ρ
Y / N ρ
Int / Rem ρ
ρ
ρ
Y / N ρ
Y / N ρ
Int / Rem ρ
ρ
ρ
Y / N ρ
Y / N ρ
Int / Rem ρ
ρ
ρ
Y / N ρ
Y / N ρ
Int / Rem ρ
ρ
ρ
Y / N ρ
Y / N ρ
Int / Rem ρ
ρ
ρ
Y / N ρ
Y / N ρ
*Enter SF for walk-in and walk-in/reach-in only
Type Code
Case Description Unit Dim.
Default kW/unit
Product Code
Product
1 Island, open, single-level narrow ft 0.1 1 Ice Cream 2 Island, open, single-level wide ft 0.1 2 Frozen Food 3 Island, open, island, single level
double ft 0.2 3 Fresh Meat
4 Island, closed, single-level narrow ft 0.1 4 Deli 5 Island, closed, single-level wide ft 0.1 5 Dairy/Beverage 6 Island, closed, single level double ft 0.2 6 Produce
7 Open Single-deck ft 0.3
8 Open Multi-deck ft 0.3 Door Code Door Type
9 Reach-in Multi deck ft 0.3 1 Single glazed 10 Closed rear-entry multi-deck ft 0.03 2 Double glazed 11 Curved glass rear entry multi deck ft 0.06 3 Triple glazed, no heater controls 12 Walk-in / Reach-in ft 0.3 4 Triple glazed, w/ heater controls 13 Walk-in ft2 0.015 5 Triple glazed, no heaters 14 Under counter Reach-in CF 0.03 6 Quadruple glazed, no heater
controls 15 Blast Chiller CF 0.03 7 Quadruple glazed, w/ heater
controls
xlii
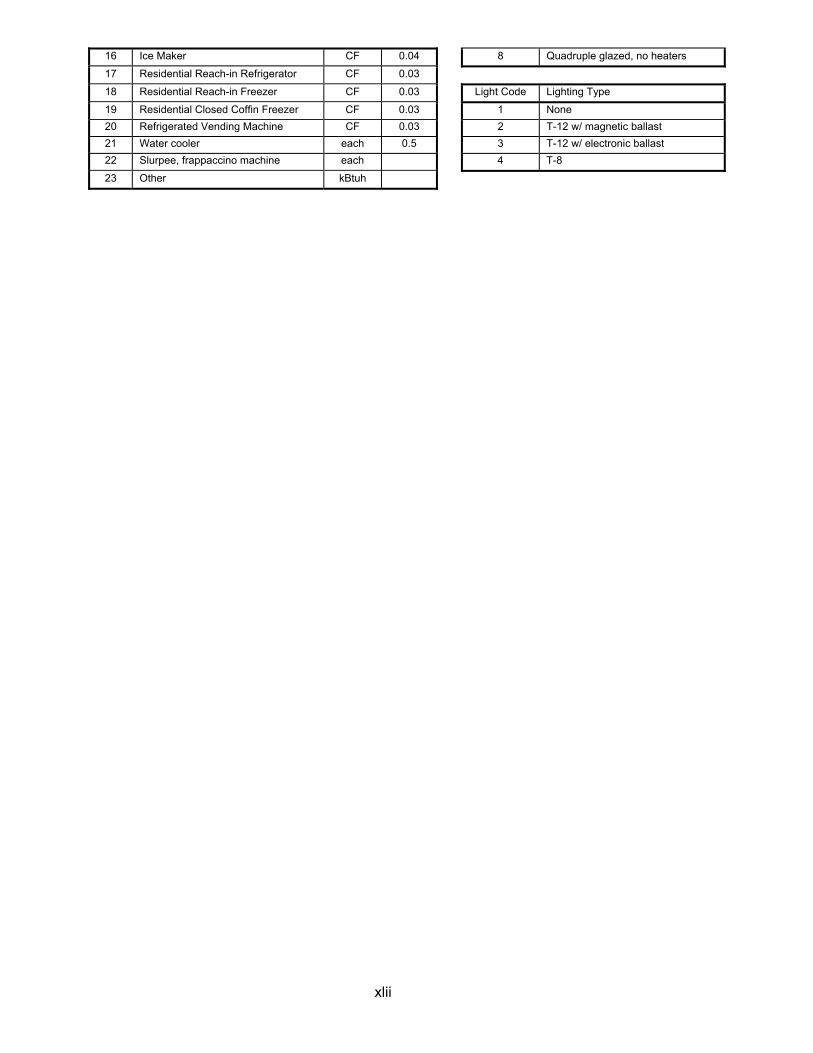
16 Ice Maker CF 0.04 8 Quadruple glazed, no heaters
17 Residential Reach-in Refrigerator CF 0.03
18 Residential Reach-in Freezer CF 0.03 Light Code Lighting Type
19 Residential Closed Coffin Freezer CF 0.03 1 None 20 Refrigerated Vending Machine CF 0.03 2 T-12 w/ magnetic ballast 21 Water cooler each 0.5 3 T-12 w/ electronic ballast 22 Slurpee, frappaccino machine each 4 T-8
23 Other kBtuh
xliii
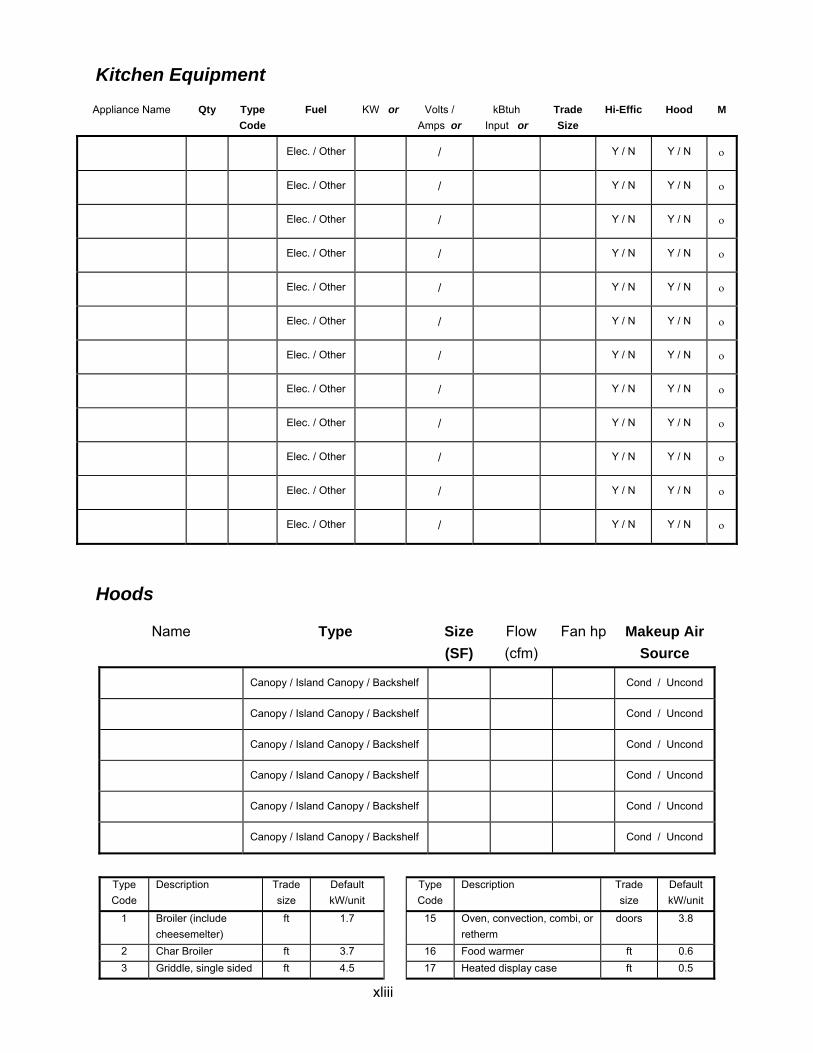
Kitchen Equipment
Appliance Name Qty Type Code
Fuel KW or Volts / Amps or
kBtuh Input or
Trade Size
Hi-Effic Hood M
Elec. / Other / Y / N Y / N ο
Elec. / Other / Y / N Y / N ο
Elec. / Other / Y / N Y / N ο
Elec. / Other / Y / N Y / N ο
Elec. / Other / Y / N Y / N ο
Elec. / Other / Y / N Y / N ο
Elec. / Other / Y / N Y / N ο
Elec. / Other / Y / N Y / N ο
Elec. / Other / Y / N Y / N ο
Elec. / Other / Y / N Y / N ο
Elec. / Other / Y / N Y / N ο
Elec. / Other / Y / N Y / N ο
Hoods
Name Type Size (SF)
Flow (cfm)
Fan hp Makeup Air Source
Canopy / Island Canopy / Backshelf Cond / Uncond
Canopy / Island Canopy / Backshelf Cond / Uncond
Canopy / Island Canopy / Backshelf Cond / Uncond
Canopy / Island Canopy / Backshelf Cond / Uncond
Canopy / Island Canopy / Backshelf Cond / Uncond
Canopy / Island Canopy / Backshelf Cond / Uncond
Type Code
Description Trade size
Default kW/unit
Type Code
Description Trade size
Default kW/unit
1 Broiler (include cheesemelter)
ft 1.7 15 Oven, convection, combi, or retherm
doors 3.8
2 Char Broiler ft 3.7 16 Food warmer ft 0.6 3 Griddle, single sided ft 4.5 17 Heated display case ft 0.5
xliv
4 Griddle, clam shell ft 7.5 18 Microwave oven 1.7 5 Fryer, countertop lb 0.3 19 Toaster, pop-up 1.8 6 Fryer, free-standing lb 0.3 20 Toaster, conveyor 4.6 7 Fryer, pressure lb 0.3 21 Coffee pot burners 1. 8 Fryer, donut lb 0.3 22 Steam table ft 0.6 9 Kettle, Pasta cooker qt 0.25 23 Dishwasher, single tank racks/hr 0.3
10 Heat lamps lamps 0.5 24 Dishwasher, conveyor racks/hr 0.1 11 Range top ft 5. 25 Steam jacketed kettle qt 0.4 12 Oven, pizza or bake decks 7. 26 Braising pan/skillet qt 0.1 13 Oven, conveyor decks 13. 27 Other kW 14 Oven, range ft 2.
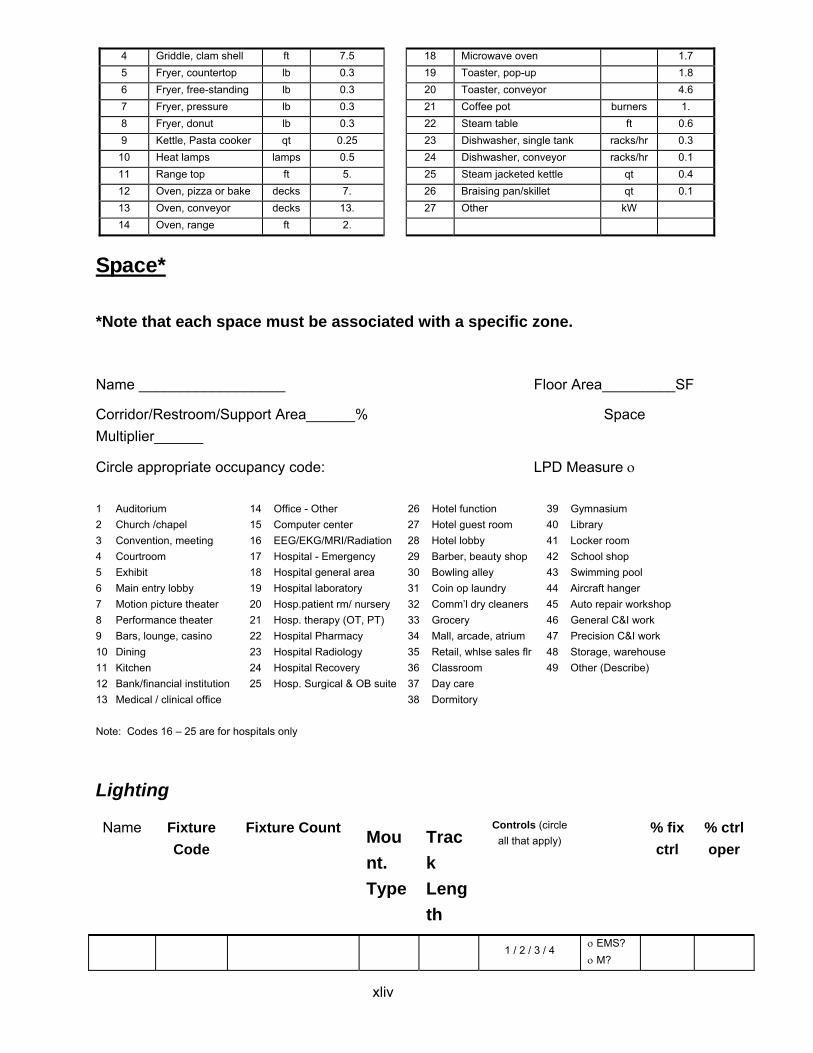
Space* *Note that each space must be associated with a specific zone.
Name __________________ Floor Area_________SF
Corridor/Restroom/Support Area______% Space Multiplier______
Circle appropriate occupancy code: LPD Measure ο 1 Auditorium 14 Office - Other 26 Hotel function 39 Gymnasium 2 Church /chapel 15 Computer center 27 Hotel guest room 40 Library 3 Convention, meeting 16 EEG/EKG/MRI/Radiation 28 Hotel lobby 41 Locker room 4 Courtroom 17 Hospital - Emergency 29 Barber, beauty shop 42 School shop 5 Exhibit 18 Hospital general area 30 Bowling alley 43 Swimming pool 6 Main entry lobby 19 Hospital laboratory 31 Coin op laundry 44 Aircraft hanger 7 Motion picture theater 20 Hosp.patient rm/ nursery 32 Comm’l dry cleaners 45 Auto repair workshop 8 Performance theater 21 Hosp. therapy (OT, PT) 33 Grocery 46 General C&I work 9 Bars, lounge, casino 22 Hospital Pharmacy 34 Mall, arcade, atrium 47 Precision C&I work 10 Dining 23 Hospital Radiology 35 Retail, whlse sales flr 48 Storage, warehouse 11 Kitchen 24 Hospital Recovery 36 Classroom 49 Other (Describe) 12 Bank/financial institution 25 Hosp. Surgical & OB suite 37 Day care 13 Medical / clinical office 38 Dormitory Note: Codes 16 – 25 are for hospitals only
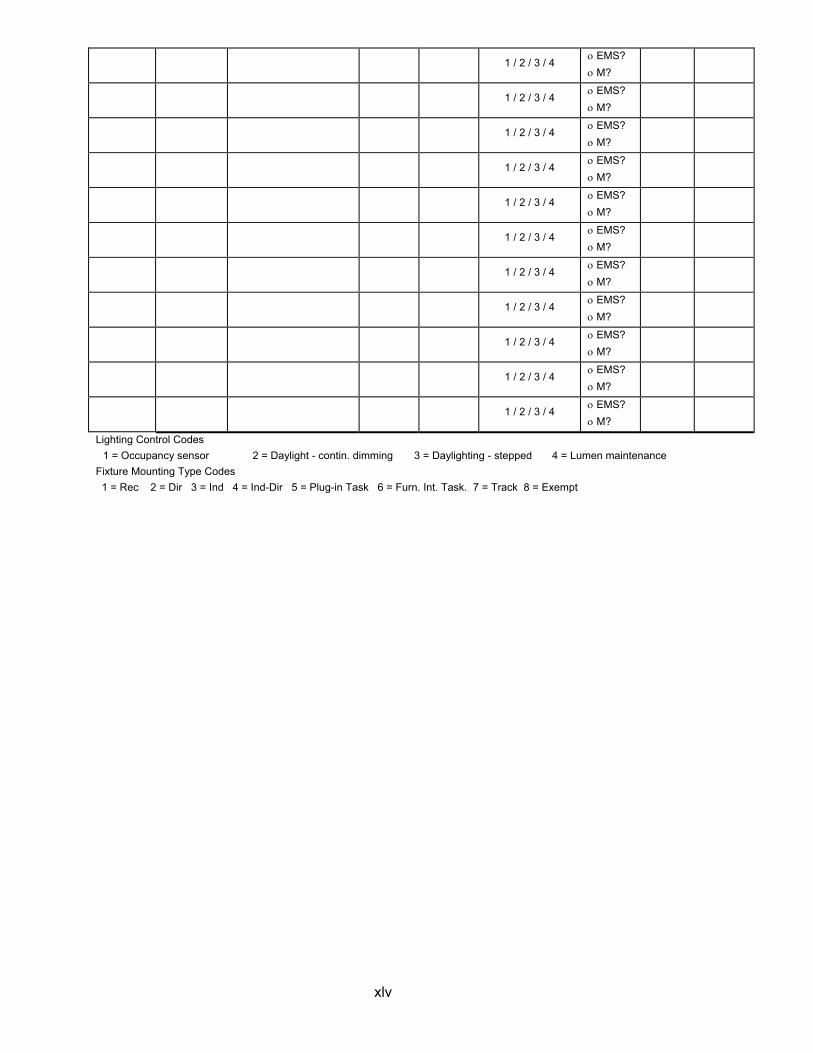
Lighting
Name Fixture Code
Fixture Count Mount. Type
Track Length
Controls (circle all that apply)
% fix ctrl
% ctrl oper
1 / 2 / 3 / 4 ο EMS? ο M?
xlv
1 / 2 / 3 / 4 ο EMS? ο M?
1 / 2 / 3 / 4 ο EMS? ο M?
1 / 2 / 3 / 4 ο EMS? ο M?
1 / 2 / 3 / 4 ο EMS? ο M?
1 / 2 / 3 / 4 ο EMS? ο M?
1 / 2 / 3 / 4 ο EMS? ο M?
1 / 2 / 3 / 4 ο EMS? ο M?
1 / 2 / 3 / 4 ο EMS? ο M?
1 / 2 / 3 / 4 ο EMS? ο M?
1 / 2 / 3 / 4 ο EMS? ο M?
1 / 2 / 3 / 4 ο EMS? ο M?
Lighting Control Codes 1 = Occupancy sensor 2 = Daylight - contin. dimming 3 = Daylighting - stepped 4 = Lumen maintenance
Fixture Mounting Type Codes 1 = Rec 2 = Dir 3 = Ind 4 = Ind-Dir 5 = Plug-in Task 6 = Furn. Int. Task. 7 = Track 8 = Exempt

xlvi
Light level measurements Test Area Description Floor Area
Percentage Represented
FC Under fixture
FC Between fixtures
Fixture Code
Average value____________ Min ________________ Max___________________- Notes:
xlvii
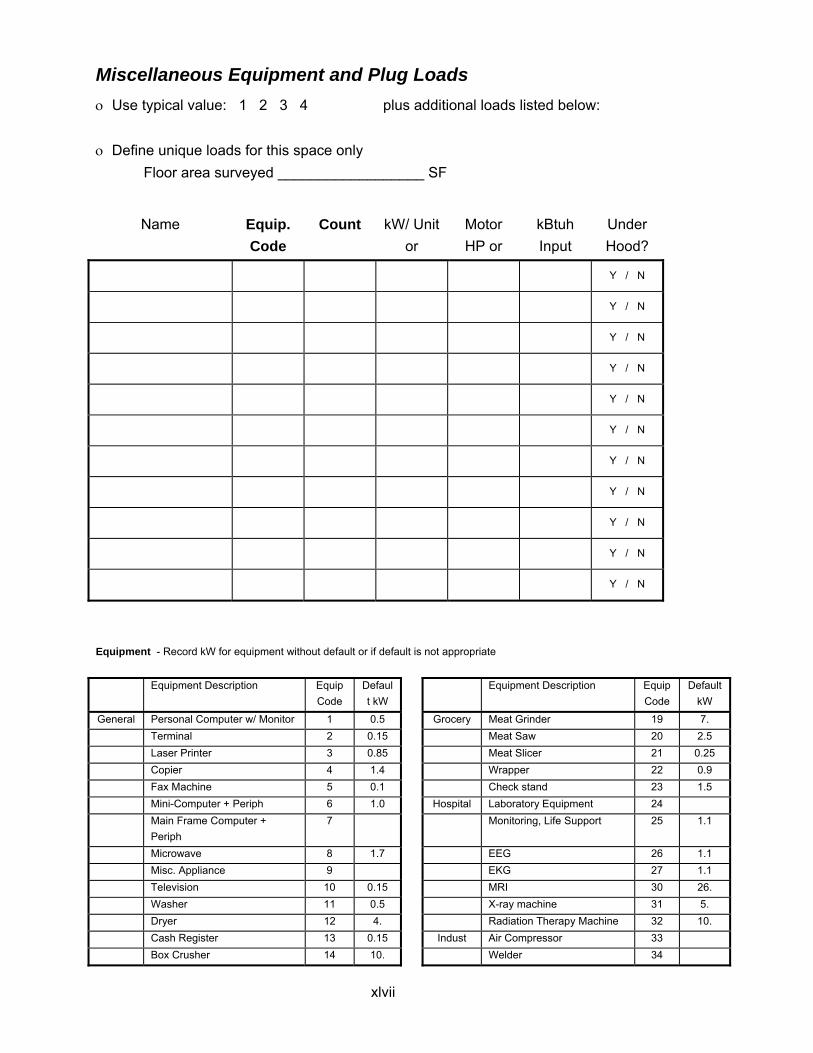
Miscellaneous Equipment and Plug Loads ο Use typical value: 1 2 3 4 plus additional loads listed below: ο Define unique loads for this space only
Floor area surveyed __________________ SF
Name Equip. Code
Count kW/ Unit or
Motor HP or
kBtuh Input
Under Hood?
Y / N
Y / N
Y / N
Y / N
Y / N
Y / N
Y / N
Y / N
Y / N
Y / N
Y / N
Equipment - Record kW for equipment without default or if default is not appropriate
Equipment Description Equip Code
Default kW
Equipment Description Equip Code
Default kW
General Personal Computer w/ Monitor 1 0.5 Grocery Meat Grinder 19 7. Terminal 2 0.15 Meat Saw 20 2.5 Laser Printer 3 0.85 Meat Slicer 21 0.25 Copier 4 1.4 Wrapper 22 0.9 Fax Machine 5 0.1 Check stand 23 1.5 Mini-Computer + Periph 6 1.0 Hospital Laboratory Equipment 24 Main Frame Computer +
Periph 7 Monitoring, Life Support 25 1.1
Microwave 8 1.7 EEG 26 1.1 Misc. Appliance 9 EKG 27 1.1 Television 10 0.15 MRI 30 26. Washer 11 0.5 X-ray machine 31 5. Dryer 12 4. Radiation Therapy Machine 32 10. Cash Register 13 0.15 Indust Air Compressor 33 Box Crusher 14 10. Welder 34
xlviii
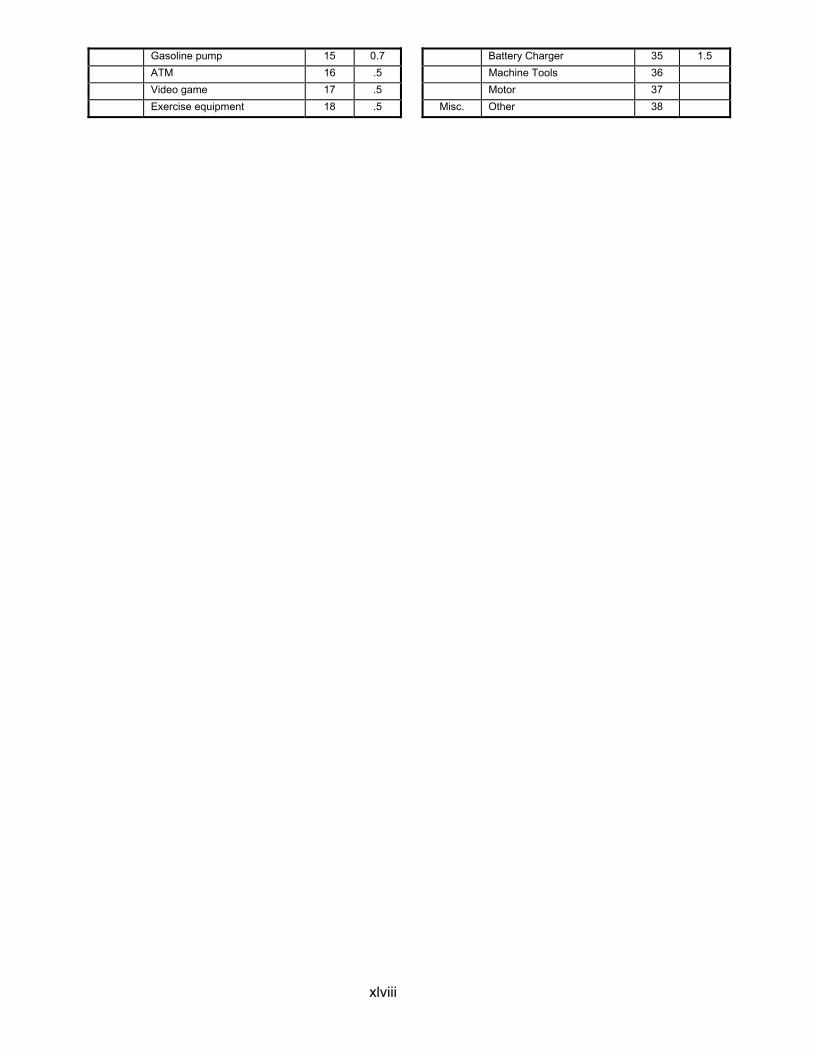
Gasoline pump 15 0.7 Battery Charger 35 1.5 ATM 16 .5 Machine Tools 36 Video game 17 .5 Motor 37 Exercise equipment 18 .5 Misc. Other 38
xlix
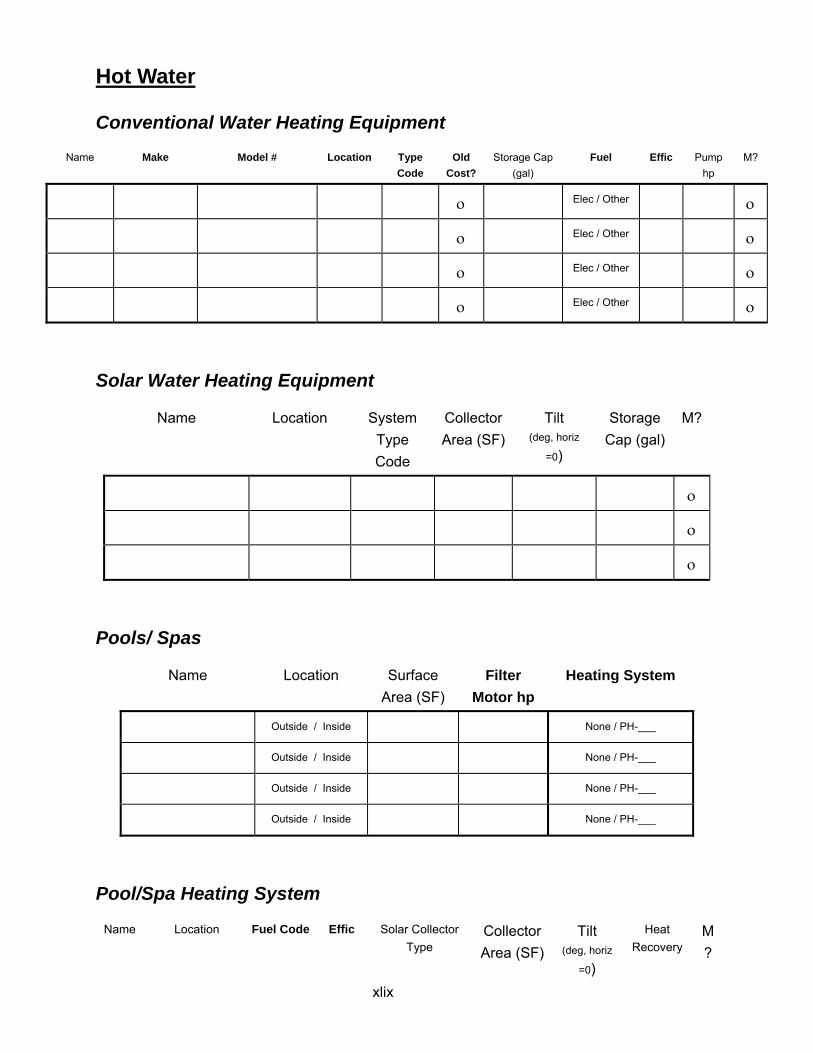
Hot Water
Conventional Water Heating Equipment
Name Make Model # Location Type Code
Old Cost?
Storage Cap (gal)
Fuel Effic Pump hp
M?
ο Elec / Other ο
ο Elec / Other ο
ο Elec / Other ο
ο Elec / Other ο
Solar Water Heating Equipment
Name Location System Type Code
Collector Area (SF)
Tilt (deg, horiz
=0)
Storage Cap (gal)
M?
ο
ο
ο
Pools/ Spas
Name Location Surface Area (SF)
Filter Motor hp
Heating System
Outside / Inside None / PH-___
Outside / Inside None / PH-___
Outside / Inside None / PH-___
Outside / Inside None / PH-___
Pool/Spa Heating System
Name Location Fuel Code Effic Solar Collector Type
Collector Area (SF)
Tilt (deg, horiz
=0)
Heat Recovery
M?
l
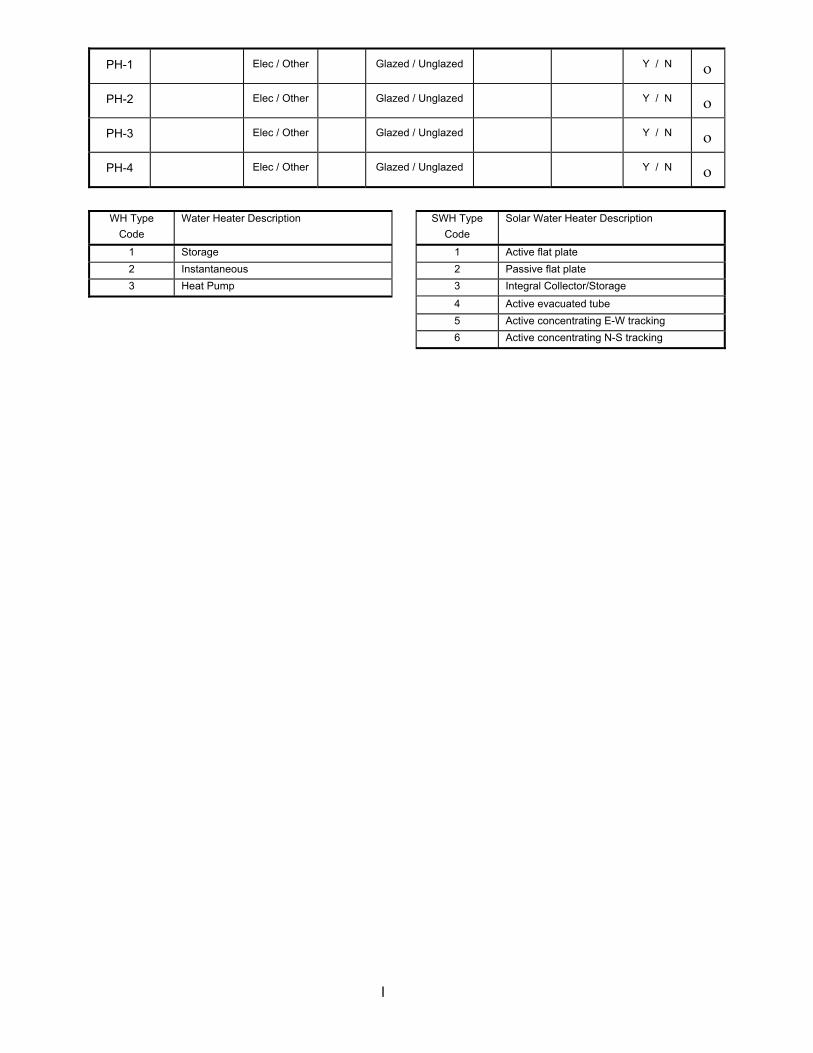
PH-1 Elec / Other Glazed / Unglazed Y / N ο
PH-2 Elec / Other Glazed / Unglazed Y / N ο
PH-3 Elec / Other Glazed / Unglazed Y / N ο
PH-4 Elec / Other Glazed / Unglazed Y / N ο
WH Type
Code Water Heater Description SWH Type
Code Solar Water Heater Description
1 Storage 1 Active flat plate 2 Instantaneous 2 Passive flat plate 3 Heat Pump 3 Integral Collector/Storage
4 Active evacuated tube 5 Active concentrating E-W tracking 6 Active concentrating N-S tracking
li
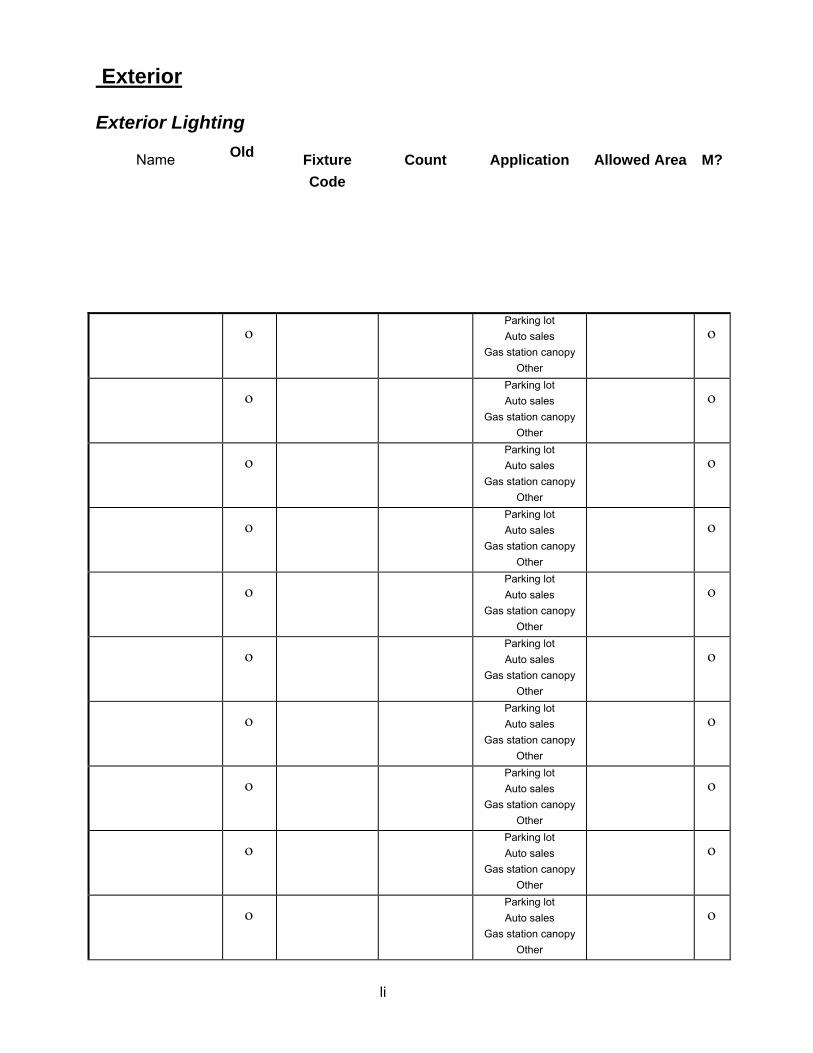
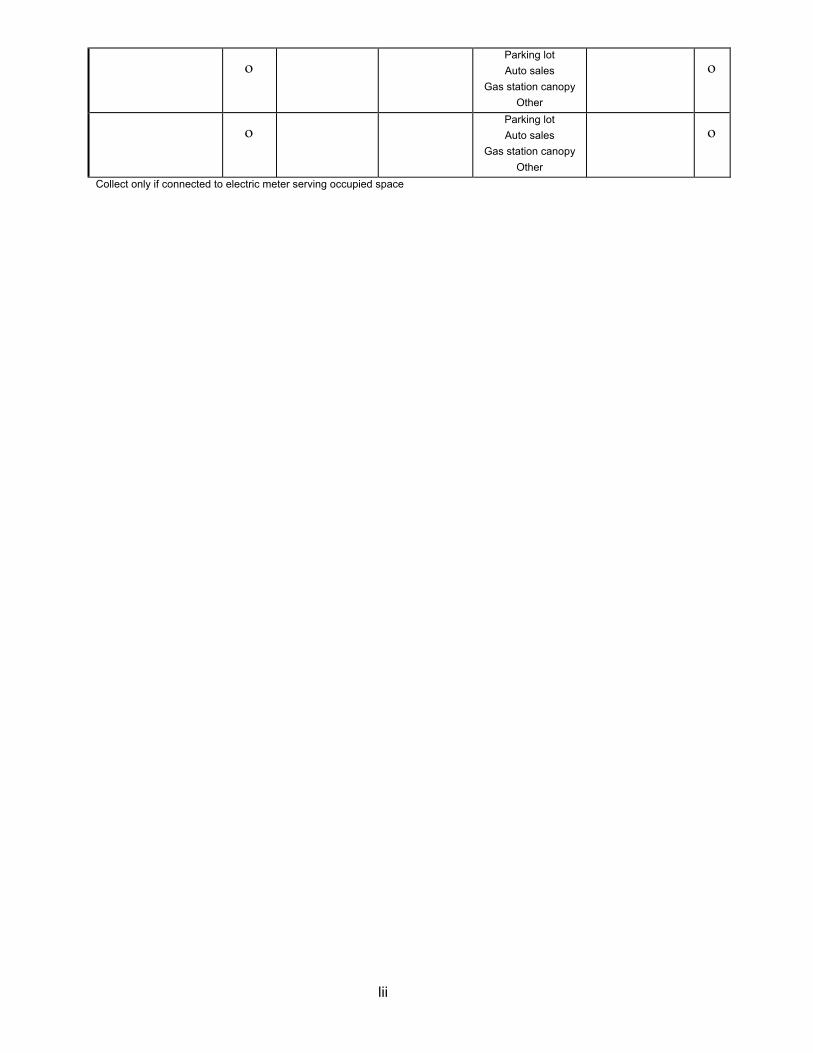
Exterior
Exterior Lighting
Name Old Fixture Code
Count Application Allowed Area M?
ο Parking lot Auto sales
Gas station canopy Other
ο
ο Parking lot Auto sales
Gas station canopy Other
ο
ο Parking lot Auto sales
Gas station canopy Other
ο
ο Parking lot Auto sales
Gas station canopy Other
ο
ο Parking lot Auto sales
Gas station canopy Other
ο
ο Parking lot Auto sales
Gas station canopy Other
ο
ο Parking lot Auto sales
Gas station canopy Other
ο
ο Parking lot Auto sales
Gas station canopy Other
ο
ο Parking lot Auto sales
Gas station canopy Other
ο
ο Parking lot Auto sales
Gas station canopy Other
ο
lii
ο Parking lot Auto sales
Gas station canopy Other
ο
ο Parking lot Auto sales
Gas station canopy Other
ο
Collect only if connected to electric meter serving occupied space
liii
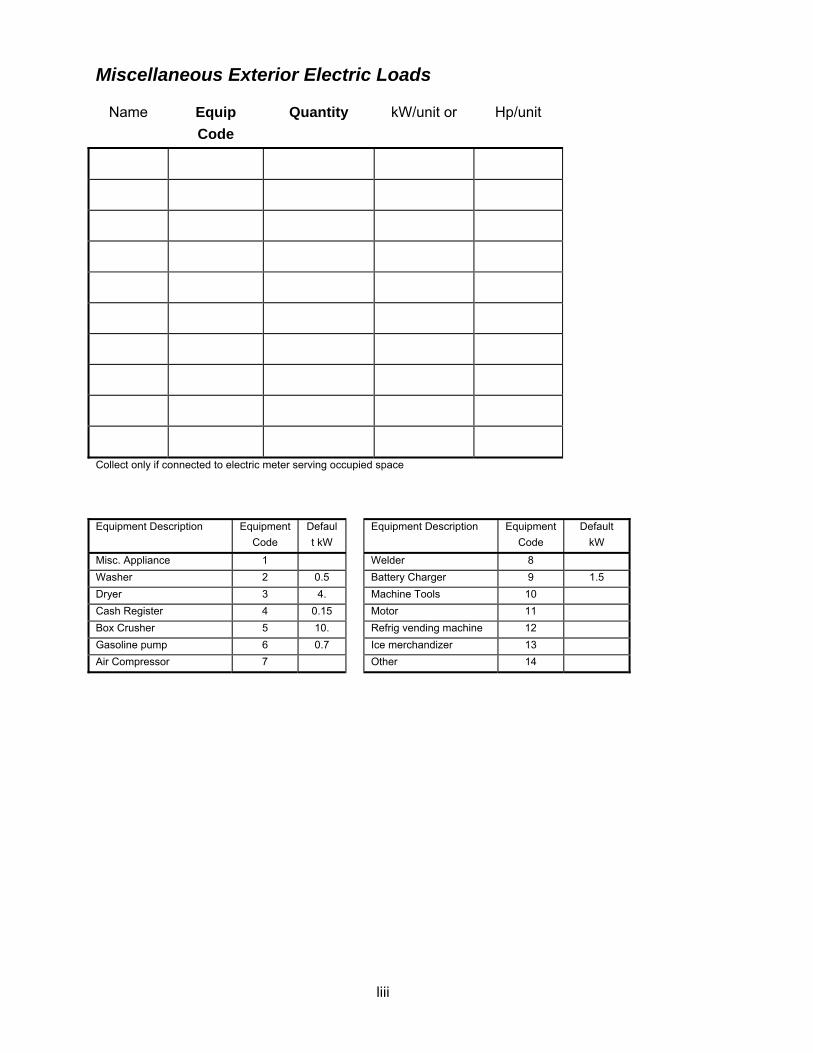
Miscellaneous Exterior Electric Loads
Name Equip Code
Quantity kW/unit or Hp/unit
Collect only if connected to electric meter serving occupied space
Equipment Description Equipment
Code Default kW
Equipment Description Equipment Code
Default kW
Misc. Appliance 1 Welder 8 Washer 2 0.5 Battery Charger 9 1.5 Dryer 3 4. Machine Tools 10 Cash Register 4 0.15 Motor 11 Box Crusher 5 10. Refrig vending machine 12 Gasoline pump 6 0.7 Ice merchandizer 13 Air Compressor 7 Other 14
liv
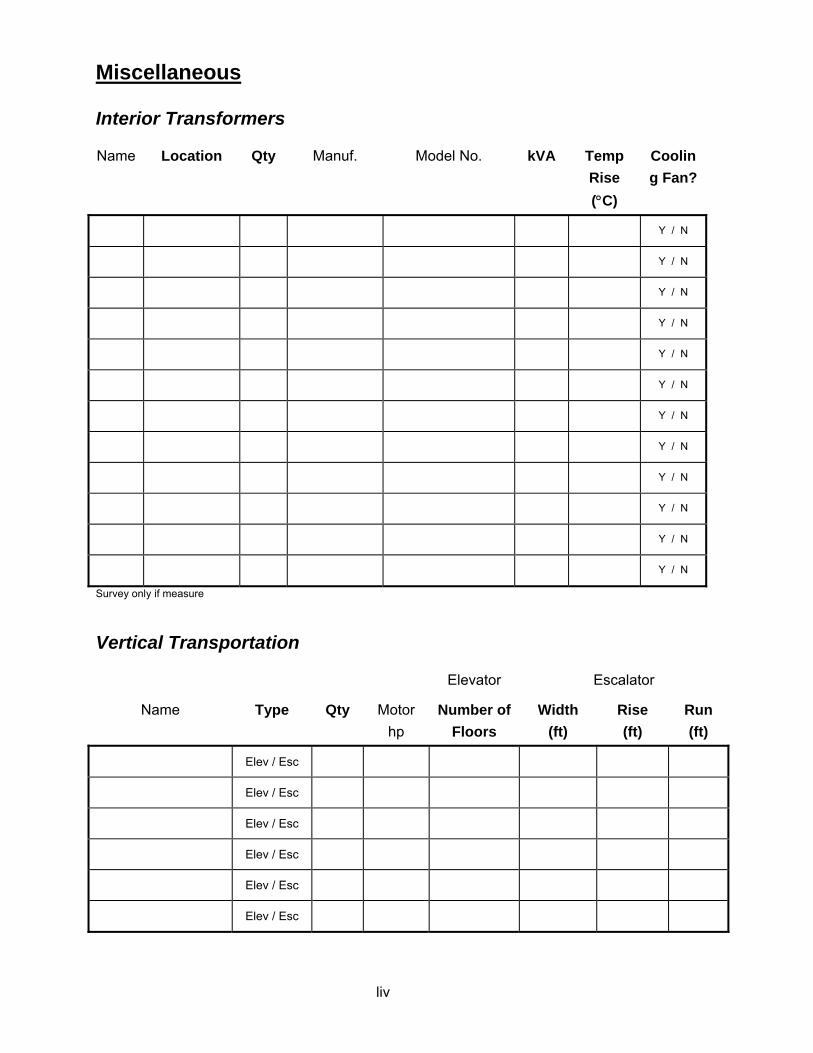
Miscellaneous
Interior Transformers
Name Location Qty Manuf. Model No. kVA Temp Rise (°C)
Cooling Fan?
Y / N
Y / N
Y / N
Y / N
Y / N
Y / N
Y / N
Y / N
Y / N
Y / N
Y / N
Y / N
Survey only if measure
Vertical Transportation
Elevator Escalator
Name Type Qty Motor hp
Number of Floors
Width (ft)
Rise (ft)
Run (ft)
Elev / Esc
Elev / Esc
Elev / Esc
Elev / Esc
Elev / Esc
Elev / Esc

lv
Incidents Circle any incidents as applicable: 1 None to report 7 Contact person unavailable or unaware of survey appointment 2 Complaint about rates 8 Customer expressed dissatisfaction with survey (list reason(s)) 3 Complaint about energy costs or lack of savings 9 Property damage occurred during on-site survey 4 Complaint about outages or power quality 10 Personal injury occurred during on-site survey 5 Complaint about technology reliability 11 Other (list) 6 Complaint about utility customer service
Meter Numbers
Utility Name Meter Number
Electric1 Electric2 Electric3 Electric4 Gas1 Gas2 Gas3 Gas4

lvi
Sketch of Building Floor Plan
Be sure to include dimensions, North arrow, and zone and HVAC equipment locations

lvii
Appendix I. Refrigerated Warehouse On‐site Survey Instrument
This instrument was used at site visits to refrigerated warehouse facilities. Data collection includes
building characteristics, door qualities, receiving volumes and schedules, cooling loads and schedules,
among other information.

lviii
General Information
Site ID #
Surveyor Name: Building Name:
Date: Primary Contact: Phone:
Building Address:
City Zip
Facility Overview What is the total square footage of this facility? __________ sq. ft. Which statement best describes the operation of the facility?
( ) long-term storage ( ) short-term storage ( ) distribution ( ) seasonal
Which statement best describes the operation of the facility?
( ) The entire facility operates on basically the same temperature and schedule. ( ) There are areas of the facility that have substantially different temperatures and
operational schedules. If different storage temperatures and operational schedules exist, divide the building into areas with differing schedules, and provide a name for each area: 1 1b 2 2b 3 3b 4 4b 5 5b
Experience you can trust. lix
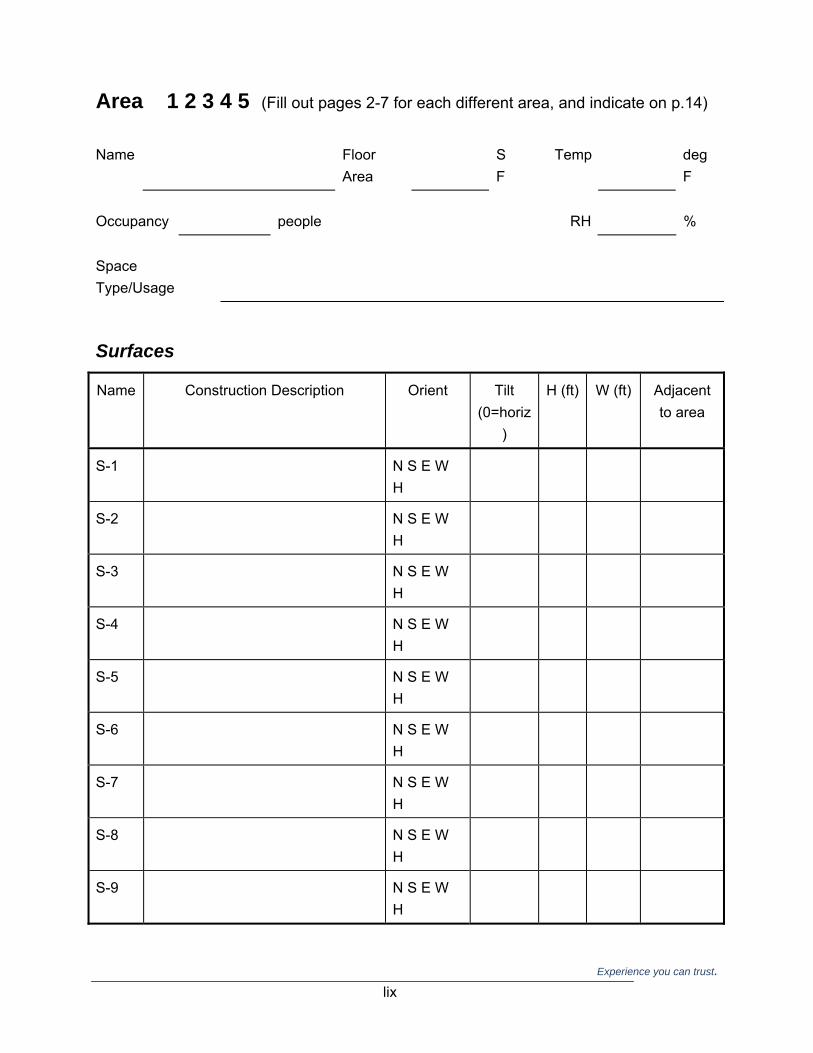
Area 1 2 3 4 5 (Fill out pages 2-7 for each different area, and indicate on p.14)
Name Floor
Area S
F Temp deg
F Occupancy people RH % Space Type/Usage
Surfaces
Name Construction Description Orient Tilt (0=horiz
)
H (ft) W (ft) Adjacent to area
S-1 N S E W H
S-2 N S E W H
S-3 N S E W H
S-4 N S E W H
S-5 N S E W H
S-6 N S E W H
S-7 N S E W H
S-8 N S E W H
S-9 N S E W H
Experience you can trust. lx
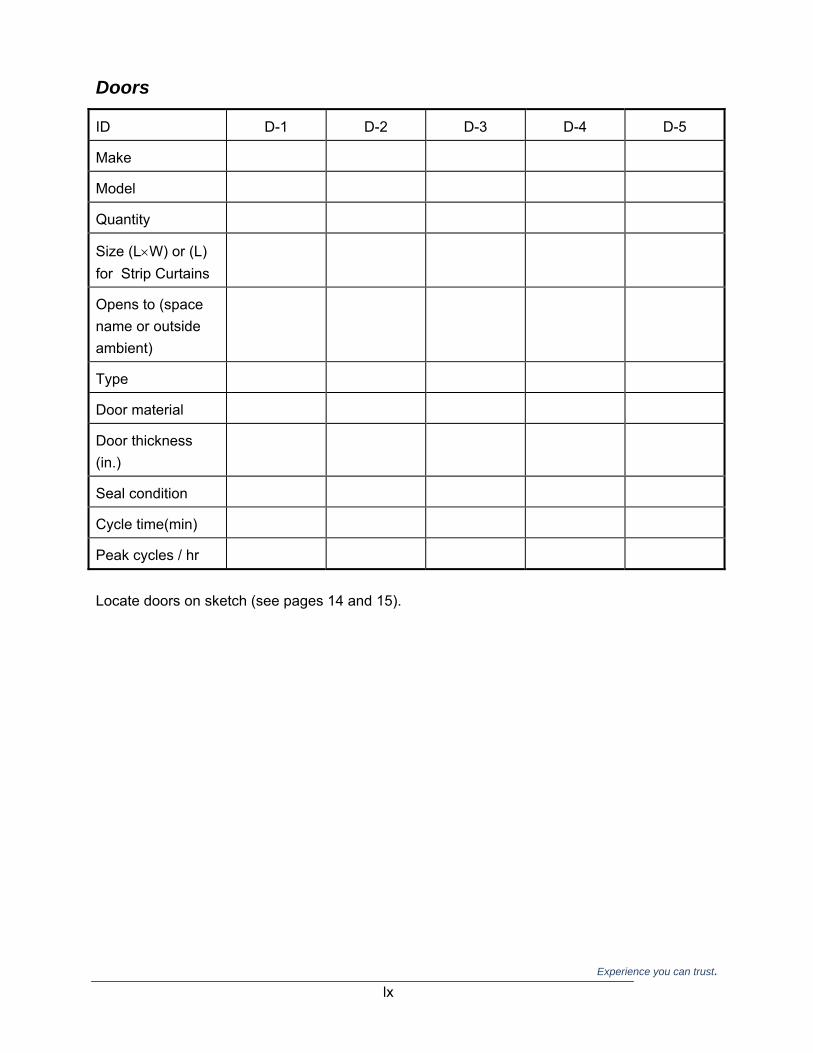
Doors
ID D-1 D-2 D-3 D-4 D-5
Make
Model
Quantity
Size (L×W) or (L) for Strip Curtains
Opens to (space name or outside ambient)
Type
Door material
Door thickness (in.)
Seal condition
Cycle time(min)
Peak cycles / hr Locate doors on sketch (see pages 14 and 15).
Experience you can trust. lxi
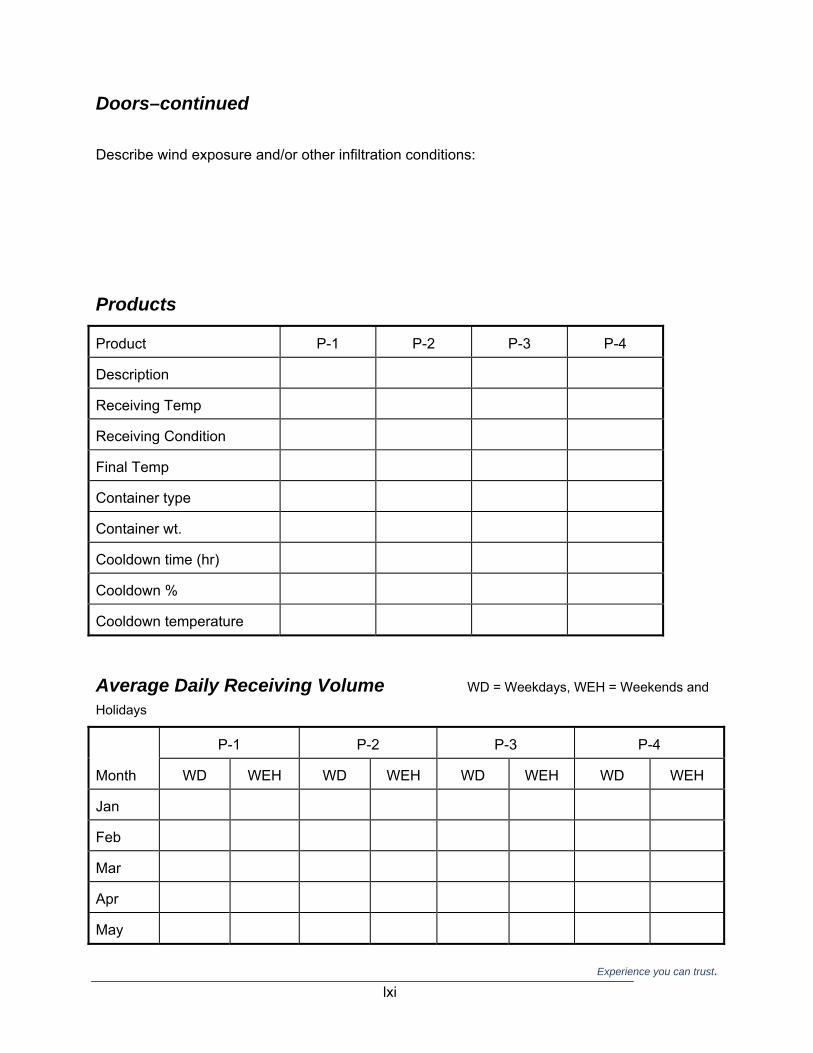
Doors–continued Describe wind exposure and/or other infiltration conditions:
Products
Product P-1 P-2 P-3 P-4
Description
Receiving Temp
Receiving Condition
Final Temp
Container type
Container wt.
Cooldown time (hr)
Cooldown %
Cooldown temperature
Average Daily Receiving Volume WD = Weekdays, WEH = Weekends and
Holidays
P-1 P-2 P-3 P-4
Month WD WEH WD WEH WD WEH WD WEH
Jan
Feb
Mar
Apr
May

Experience you can trust. lxii
Jun
Jul
Aug
Sep
Oct
Nov
Dec Be sure to indicate units
Experience you can trust. lxiii
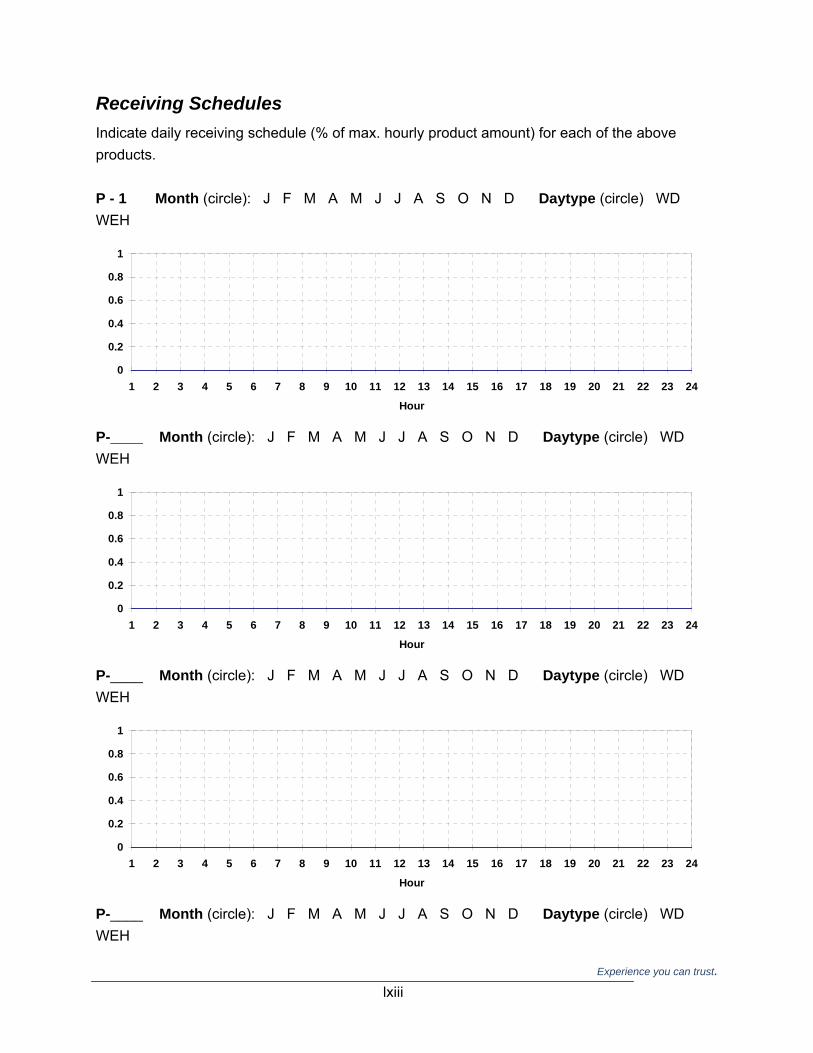
Receiving Schedules Indicate daily receiving schedule (% of max. hourly product amount) for each of the above products. P - 1 Month (circle): J F M A M J J A S O N D Daytype (circle) WD WEH
0
0.2
0.4
0.6
0.8
1
1 2 3 4 5 6 7 8 9 10 11 12 13 14 15 16 17 18 19 20 21 22 23 24
Hour
P-____ Month (circle): J F M A M J J A S O N D Daytype (circle) WD WEH
0
0.2
0.4
0.6
0.8
1
1 2 3 4 5 6 7 8 9 10 11 12 13 14 15 16 17 18 19 20 21 22 23 24
Hour
P-____ Month (circle): J F M A M J J A S O N D Daytype (circle) WD WEH
0
0.2
0.4
0.6
0.8
1
1 2 3 4 5 6 7 8 9 10 11 12 13 14 15 16 17 18 19 20 21 22 23 24
Hour
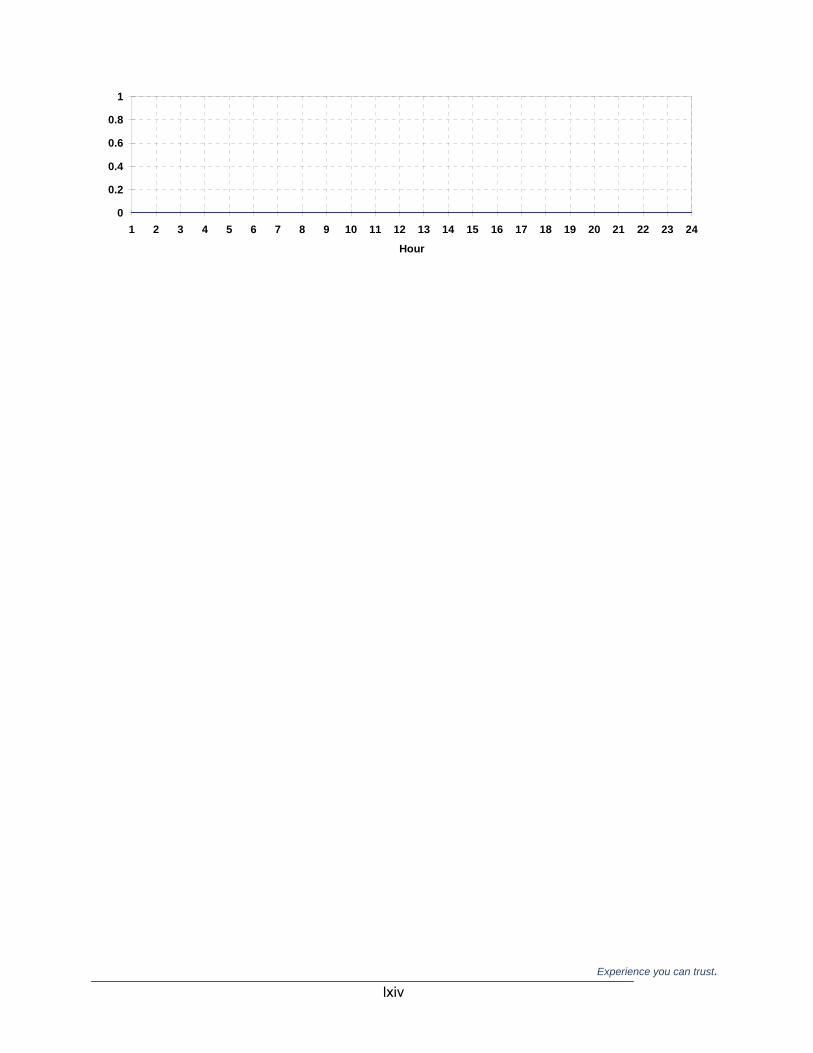
P-____ Month (circle): J F M A M J J A S O N D Daytype (circle) WD WEH
Experience you can trust. lxiv
0
0.2
0.4
0.6
0.8
1
1 2 3 4 5 6 7 8 9 10 11 12 13 14 15 16 17 18 19 20 21 22 23 24
Hour

Experience you can trust. lxv
Total Product Stored
Month P-1 P-2 P-3 P-4
Jan
Feb
Mar
Apr
May
Jun
Jul
Aug
Sep
Oct
Nov
Dec Be sure to indicate units Notes (record additional comments on p.13):
Evaporators
ID EV-1 EV-2 EV-3 EV-4 EV-5
Make
Model
Quantity
Capacity (ton)
Liquid feed
Fan hp
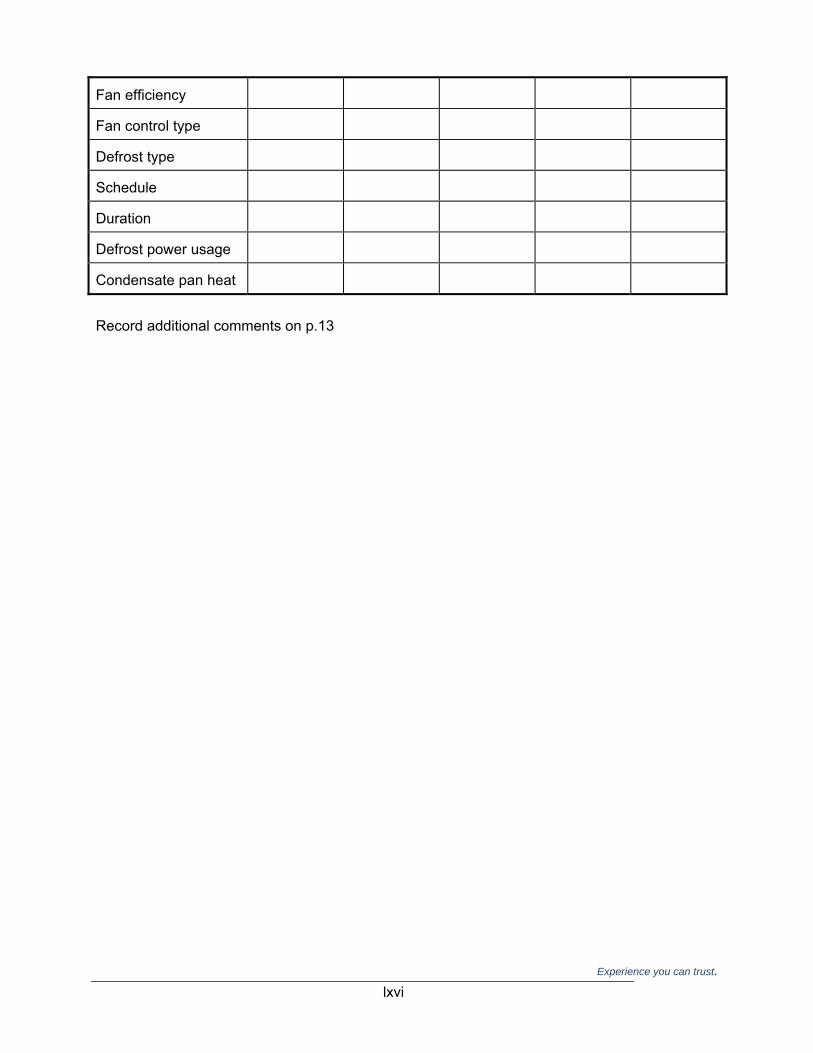
Experience you can trust. lxvi
Fan efficiency
Fan control type
Defrost type
Schedule
Duration
Defrost power usage
Condensate pan heat Record additional comments on p.13
Experience you can trust. lxvii
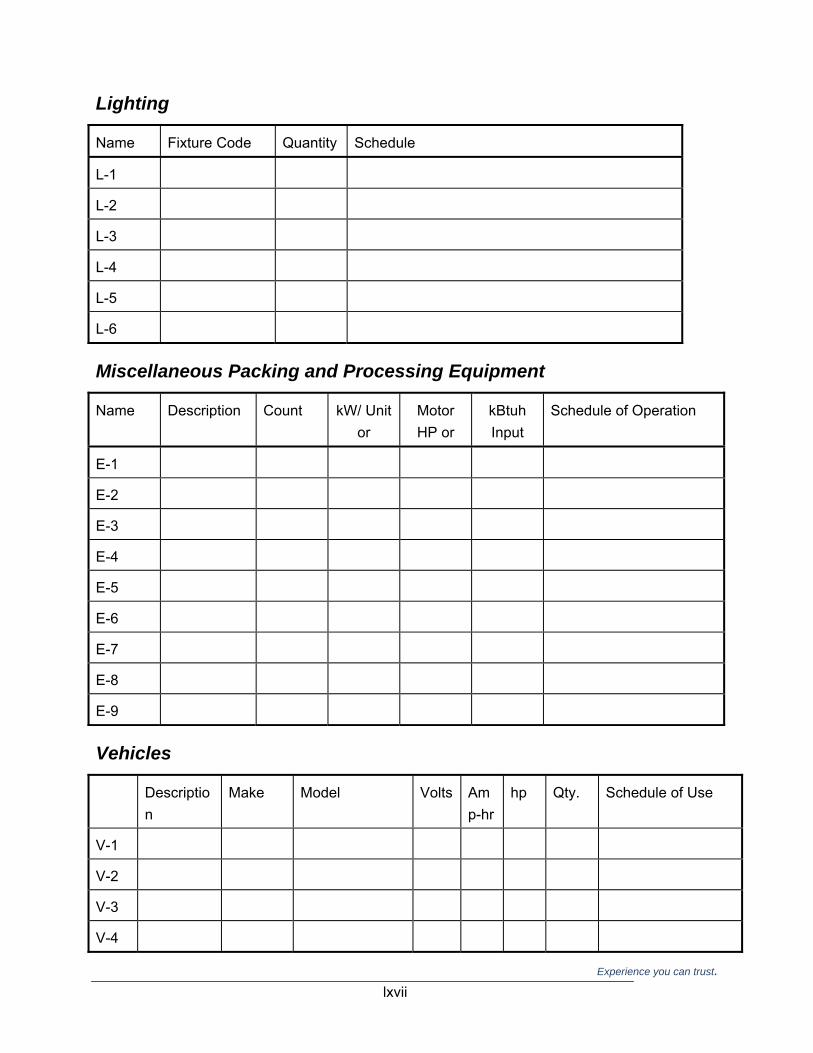
Lighting
Name Fixture Code Quantity Schedule
L-1
L-2
L-3
L-4
L-5
L-6
Miscellaneous Packing and Processing Equipment
Name Description Count kW/ Unit or
Motor HP or
kBtuh Input
Schedule of Operation
E-1
E-2
E-3
E-4
E-5
E-6
E-7
E-8
E-9
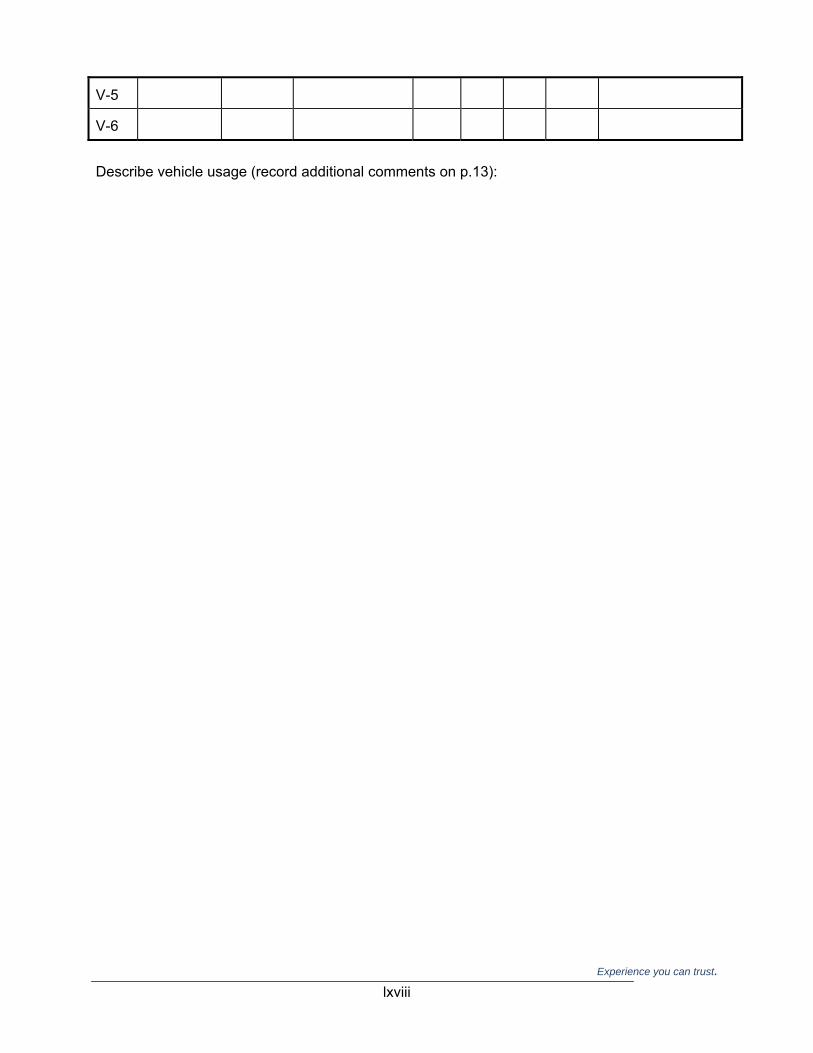
Vehicles
Description
Make Model Volts Amp-hr
hp Qty. Schedule of Use
V-1
V-2
V-3
V-4
Experience you can trust. lxviii
V-5
V-6 Describe vehicle usage (record additional comments on p.13):

Experience you can trust. lxix
Process Cooling Loads
ID PCL-1 PCL-2 PCL-3 PCL-4
Type
Make
Model Number
Auxiliary hp
Product
Entering Temp
Leaving Temp
Cycle length (min)
Average Daily Process Volume WD = Weekdays, WEH = Weekends and
Holidays
PCL-1 PCL-2 PCL-3 PCL-4
Month WD WEH WD WEH WD WEH WD WEH
Jan
Feb
Mar
Apr
May
Jun
Jul
Aug
Sep
Oct
Nov
Dec
Experience you can trust. lxx
Be sure to indicate units Any process load scheduling or sequencing information that cannot be recorded on the following page should be noted here (record additional comments on p.13):
Experience you can trust. lxxi
Process Cooling Schedules Indicate average daily process schedule (% of max. hourly total amount) for each process load. PCL - 1 : Month (circle): J F M A M J J A S O N D Daytype (circle) WD WEH
0
0.2
0.4
0.6
0.8
1
1 2 3 4 5 6 7 8 9 10 11 12 13 14 15 16 17 18 19 20 21 22 23 24
Hour
PCL-____: Month (circle): J F M A M J J A S O N D Daytype (circle) WD WEH
0
0.2
0.4
0.6
0.8
1
1 2 3 4 5 6 7 8 9 10 11 12 13 14 15 16 17 18 19 20 21 22 23 24
Hour
PCL-____: Month (circle): J F M A M J J A S O N D Daytype (circle) WD WEH
0
0.2
0.4
0.6
0.8
1
1 2 3 4 5 6 7 8 9 10 11 12 13 14 15 16 17 18 19 20 21 22 23 24
Hour
PCL-____: Month (circle): J F M A M J J A S O N D Daytype (circle) WD WEH

Experience you can trust. lxxii
0
0.2
0.4
0.6
0.8
1
1 2 3 4 5 6 7 8 9 10 11 12 13 14 15 16 17 18 19 20 21 22 23 24
Hour
Refrigeration Plant
Compressors
ID C-1 C-2 C-3 C-4 C-5
Make
Model Number
Serial Number
Refrigerant type
Application
Suction setpoint
Discharge setpoint
Min capacity %
Max capacity %
Motor Make
Model No.
hp
Efficiency
RPM
Type
Experience you can trust. lxxiii
Condensers
Name RC-1 RC-2 RC-3 RC-4
Make
Model
Type Air / Evap Air / Evap Air / Evap Air / Evap
Fan hp
type ODP / TEFC ODP / TEFC ODP / TEFC ODP / TEFC
RPM
η
control 1Sp / 2Sp / VSD 1Sp / 2Sp / VSD 1Sp / 2Sp / VSD 1Sp / 2Sp / VSD
control type
Pump hp
type ODP / TEFC ODP / TEFC ODP / TEFC ODP / TEFC
RPM
η
Experience you can trust. lxxiv
Condensers–continued Describe compressor and condenser fan sequencing for each system:
Refrigerant Vessels ID Description Length (in.) Diameter (in.) Insulatio
n RV-1 RV-2 RV-3 RV-4 RV-5 RV-6 RV-7 RV-8
Notes (record additional comments on p.13):

Experience you can trust. lxxv
Heat Exchangers for Subcooling, Desuperheat ID Application HX Type Flow Type HX-1 HX-2 HX-3 HX-4 HX-5 HX-6 Notes (record additional comments on p.13):
Experience you can trust. lxxvi
Equipment / Load Association Circuit 1 2 3 4 5 Area 1 2 3 4 5 1b 2b 3b 4b 5b Process PCL-1 PCL-2 PCL-3 PCL-4 Compressor C-1 C-2 C-3 C-4 C-5 C-1b C-2b C-3b C-4b C-5b Condenser RC-1 RC-2 RC-3 RC-4 Refrigerant Vessel
RV-1
RV-2 RV-3 RV-4 RV-5
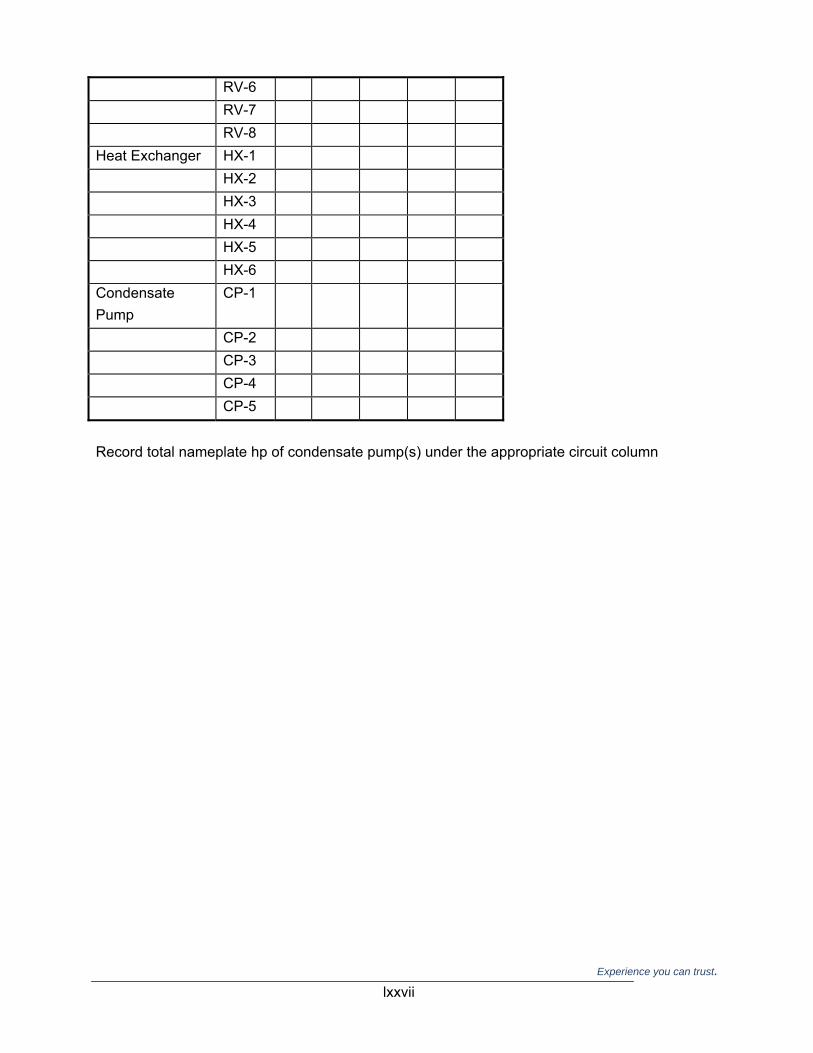
Experience you can trust. lxxvii
RV-6 RV-7 RV-8 Heat Exchanger HX-1 HX-2 HX-3 HX-4 HX-5 HX-6 Condensate Pump
CP-1
CP-2 CP-3 CP-4 CP-5 Record total nameplate hp of condensate pump(s) under the appropriate circuit column

Experience you can trust. lxxviii
Exterior Lighting
Name Fixture Code Count Control Schedule
XLT-1
XLT-2
XLT-3
XLT-4
XLT-5
Battery Chargers
Name Make Model Qty. Volts In
Amps In
Volts Out
Amps Out
Charging schedule
BC-1
BC-2
BC-3
BC-4
BC-5
BC-6
Miscellaneous Exterior Electric Loads
Name Description Qty. kW/unit
Hp/unit
Schedule
MC-1
MC-2
MC-3
MC-4
MC-5
MC-6

Experience you can trust. lxxix
Notes:

Experience you can trust. lxxx
Experience you can trust. lxxxi
Sketch of Building Floor Plan
Be sure to include dimensions, North arrow, and zone and HVAC equipment locations
Experience you can trust. lxxxii
Envelope Sketch Sketch elevations, exterior wall, interior wall, roof, and floor sections
Experience you can trust. lxxxiii
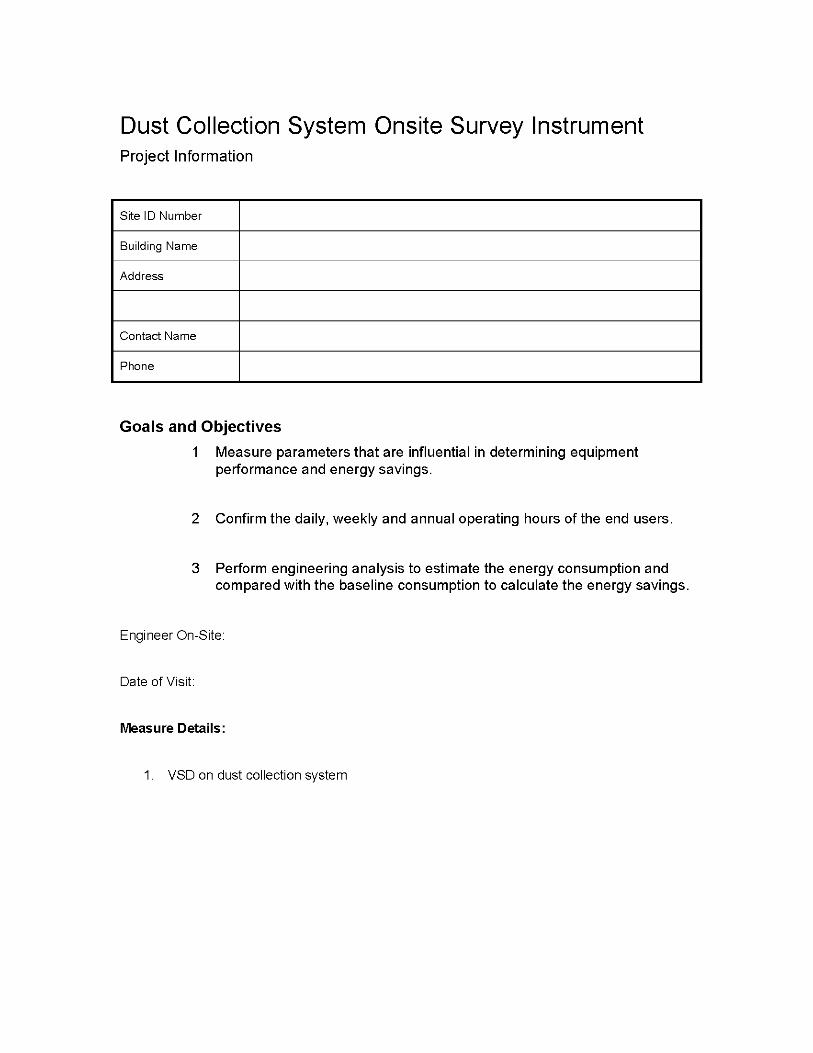
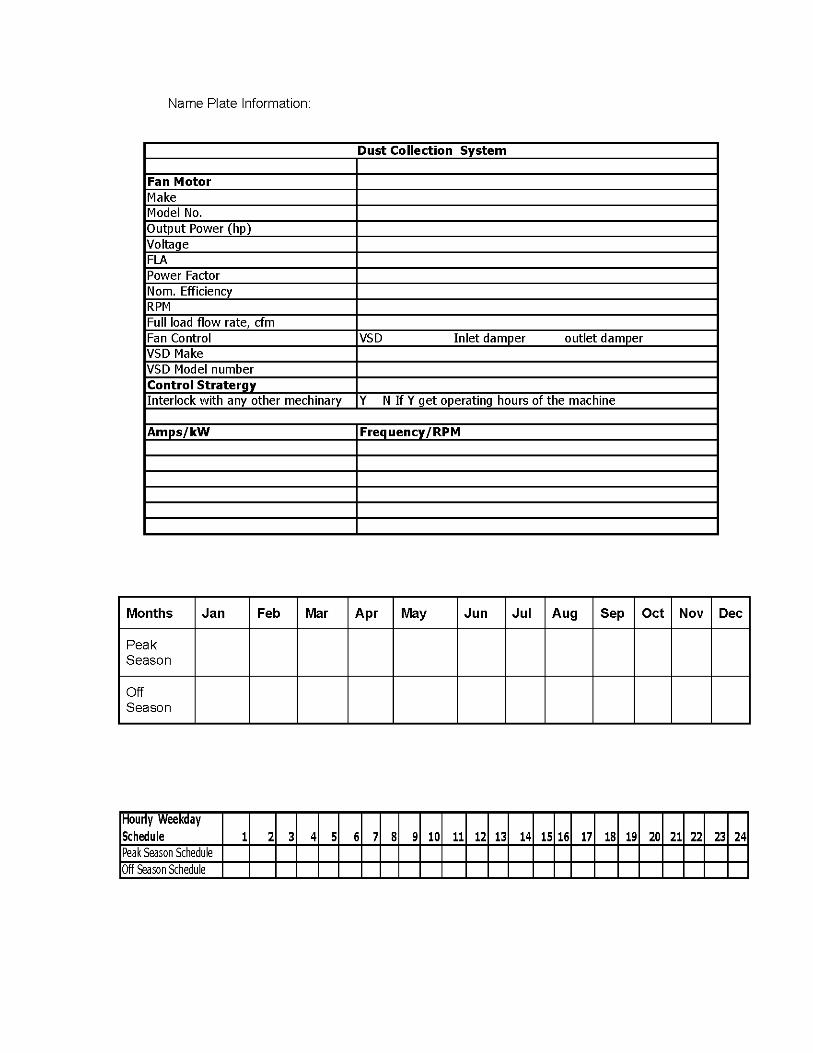
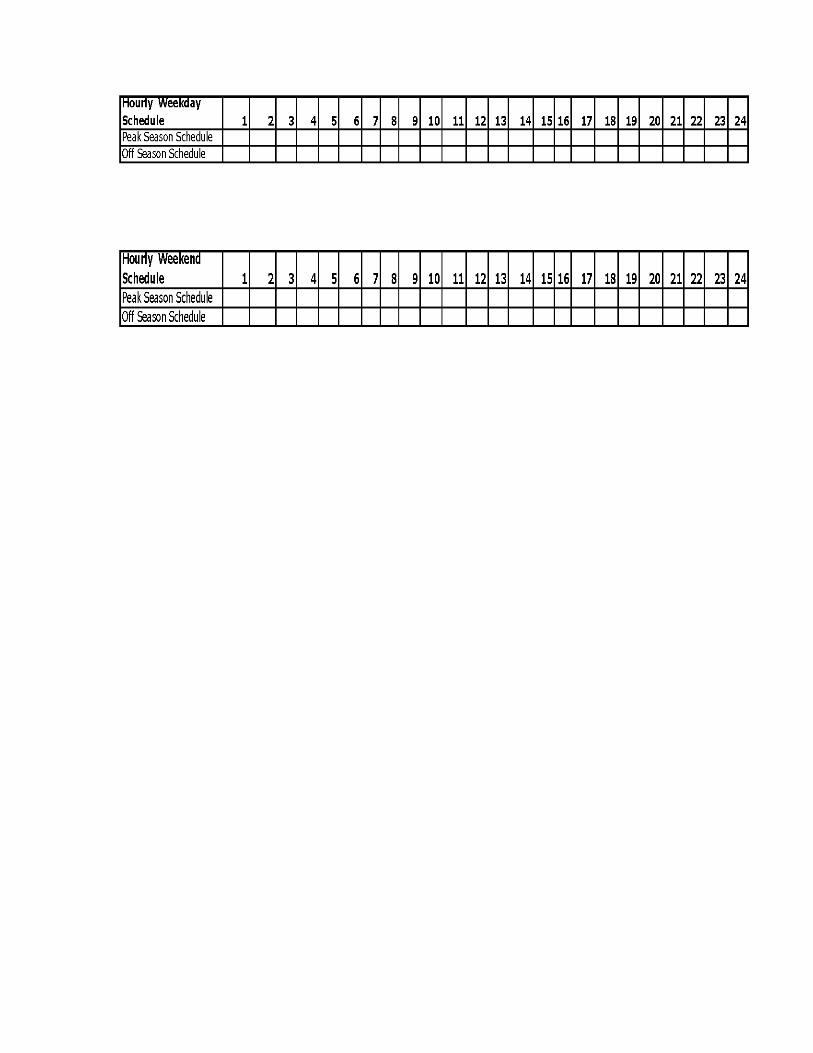
Appendix J. Dust Collection System On-site Survey Instrument
This survey instrument collects information on VSDs on dust collection systems at NRNC site facilities.
Data collected includes VSD nameplate information and operating schedule and is used to inform the
following:
1. Measure parameters that are influential in determining equipment performance and energy savings.
2. Confirm the daily, weekly and annual operating hours of the end users. 3. Perform engineering analysis to estimate the energy consumption and compared with the baseline consumption to calculate the energy savings.
C:\Documents and Settings\syang\Deskt
Experience you can trust. lxxxiv
Experience you can trust. lxxxv
Appendix A.

Experience you can trust. lxxxvi
Experience you can trust. lxxxvii

Experience you can trust. lxxxviii

Experience you can trust. lxxxix

Experience you can trust. xc
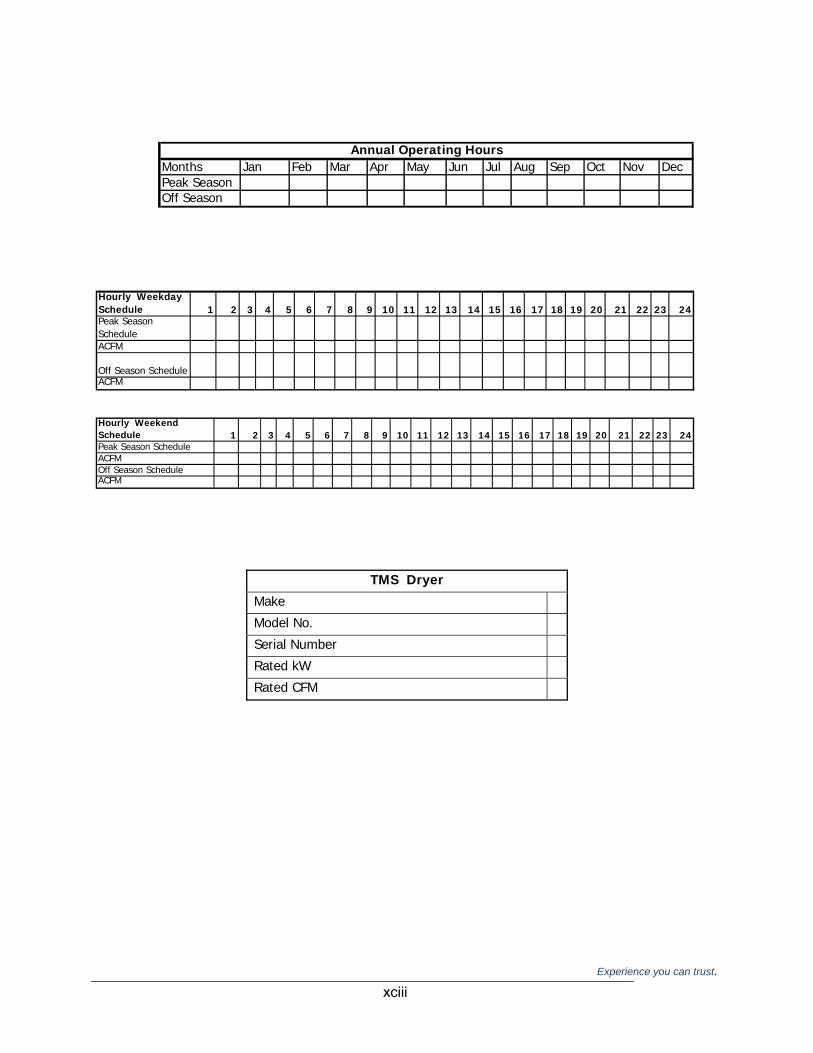
Appendix K. Compressed Air System On‐Site Survey Instrument
This survey instrument is at site visits for compressed air system measures in which a VSD air
compressor, TMS dryer, and no air loss valve was installed, and air compressor discharge was reduced.
The instrument collects air compressor system data, schedules, and operating times. The data seeks to
inform the following objectives:
1. Measure parameters that are influential in determining equipment performance and energy savings. 2. Confirm the daily, weekly and annual operating hours of the end users. 3. Perform Air Master simulation on all compressed air end users to estimate the energy consumption and compared with the baseline consumption to calculate the energy savings.

Experience you can trust. xci
Compressed Air System Onsite Survey Instrument
Project Information
Site ID Number
Building Name
Address
Contact Name
Phone
Goals and Objectives
1 Measure parameters that are influential in determining equipment performance and energy savings.
2 Confirm the daily, weekly and annual operating hours of the end users.
3 Perform Air Master simulation on all compressed air end users to estimate the energy consumption and compared with the baseline consumption to calculate the energy savings.
Engineer On-Site:
Date of Visit:
Measures Descriptions:
• Install a ____hp VSD air compressor
• Install a TMS Dryer
• Install no air loss valve
• Reduce the air compressor discharge pressure

Experience you can trust. xcii
Compressor TypeSingle Stage lubricant injected rotary screw
Two Stage lubricant injected rotary screw
Two Stage lubricant free injected rotary screw
Single Stage receprocating
Two Stage receprocating
Multi-staged Centrifugal
MakeModel No.Serial NumberCompressor ControlOutput Power (hp)VoltageFLAPower FactorNom. EfficiencyRPMFull Load Operating Pressure (psig)Rated Capacity at Full Load Operating Pressure AcfmCompressor LocationControl TypeAfter CoolingFan motor hp
Unload Point % CapacityNumber of Unload StepsUnloaded Sump Pressure (psig)Automatic Shutdown TimerAverage Temperature at inlet air compressor inletAtmospheric pressure (psia)
Discharge Pressure at rated peformance conditionPower used by air compressor at rated performance condition
Unloading Control
Compressor Performance Points
Load/Unload, Inlet Modulation without unloading, Inlet Modulation with unloading, Multistep unloading, Start/StopWater Cooled or Air Cooled
Air Compressor System
System Data
System Elevation, ft
Air Storage Capacity, cu ft
Sequenced (If they have Multiple
System)
Cascade Pressure or Target
pressure
LocationRequired air flow, acfm Regulated
Required Pressure, psig
Measured Pressure, psig(from the facility Gauge)
End User's Data
Experience you can trust. xciii
Months Jan Feb Mar Apr May Jun Jul Aug Sep Oct Nov DecPeak SeasonOff Season
Annual Operating Hours
Hourly Weekday Schedule 1 2 3 4 5 6 7 8 9 10 11 12 13 14 15 16 17 18 19 20 21 22 23 24Peak Season ScheduleACFM
Off Season ScheduleACFM Hourly Weekend Schedule 1 2 3 4 5 6 7 8 9 10 11 12 13 14 15 16 17 18 19 20 21 22 23 24Peak Season ScheduleACFMOff Season ScheduleACFM
TMS Dryer
Make Model No. Serial Number Rated kW Rated CFM

Experience you can trust. xciv
Project: Date:
Building:
Panel/Circuit: Equipment:
Location: Time:
Phase A Phase B Phase C Notes
V (ph to grnd)
Amps
kW
PF
Datalogger amps
Panel/Circuit: Equipment:
Location: Time:
Phase A Phase B Phase C Notes
V (ph to grnd))
Amps
kW
PF
Datalogger amps
Panel/Circuit: Equipment:
Location: Time:
Phase A Phase B Phase C Notes
V (ph to grnd)
Amps
kW
PF
Datalogger amps
Panel/Circuit: Equipment:
Location: Time:
Experience you can trust. xcv
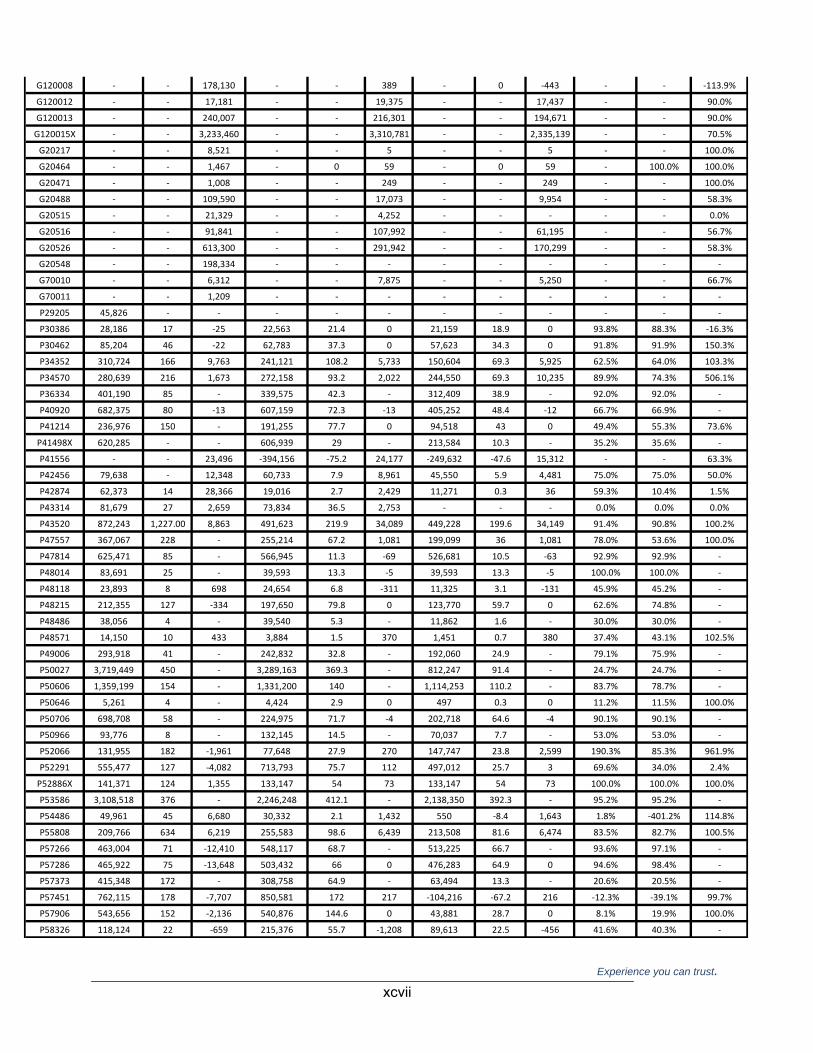
Appendix K. Whole Building Savings Summary
The following tables include the ex‐ante, ex‐post gross, and ex‐post net savings values for kWh, kW, and
therms aggregated to the site level for each measure in the sample.
In this appendix the reader will note that there are a few projects where the net‐to‐gross ratio for therm
savings is greater than one. A net‐to‐gross ratio greater than one means that the net savings is greater
than the gross savings, which at first glance, does not seem possible. These counter intuitive results are
attributable to the interactive effects with electrical savings measures. For example, within the building
energy simulation model, when we de‐rate lighting LPD when the NTG analysis determines that a
portion (or all) of the lighting measure installation was not due to the program, this reduces the need for
additional gas heating below that which would have resulted if the program caused all of the LPD gains.
Likewise, de‐rating glazing SHGC for NTG increases passive solar heating, thereby, reducing the gas
heating load. If there are no gas measures being de‐rated by the NTG analysis, these interactive effects
will drive the NTGR above one. So, there are several cases where the NTG for gas was high, but the
lower NTG for electric savings interacted to create net savings better than the apparent gross savings.
Site D62797 was dropped from the gas analysis because the model was a producing an unreasonable
estimate of savings for which we were unable to diagnose the cause of.
The site names were created with a prefix to represent each utility, P for PG&E, D for SDG&E, S for SCE,
and G for SoCalGas. The site numbers are identifiers from each utilities tracking database. For PG&E
the field is project_code, for SCE the field is coupon_num, and for SDG&E and SoCalGas the field is
site_nbr. Sites with an X postfix denote sites that were collapsed either because they had multiple
buildings at a location or multiple locations within a single campus. Site P52886X is composed of site
P52886 and P74687. Site 19029X is composed of site S19029 and S18132.

Experience you can trust. xcvi
Site ID kWh kW Therms kWh kW Therms kWh kW Therms kWh kW Therms
D61295 831,145 427 3,454 412,561 166.9 6,069 178,512 71.2 6,273 43.3% 42.6% 103.4%
D61588 1,047,190 926 ‐866 1,445,662 243.9 177 287,308 45.1 205 19.9% 18.5% 116.0%
D61590 244,457 37 ‐ 255,662 38.9 ‐ 132,092 20.1 ‐ 51.7% 51.7% ‐
D61703 245,403 160 628 127,417 23.4 4 79,498 6.6 5 62.4% 28.3% 111.1%
D62109X 282,125 45 505 165,901 69.7 ‐146 95,639 10 ‐26 57.6% 14.3% ‐
D62147 221,265 24 ‐482 124,859 15.1 20 108,592 12.1 20 87.0% 80.0% 97.0%
D62232 20,909 7 ‐60 5,198 1.3 ‐ 1,502 0.7 ‐ 28.9% 51.0% ‐
D62388X 235,664 35 ‐ 179,668 27.3 ‐ 62,884 9.6 ‐ 35.0% 35.0% ‐
D62401 351,002 73 ‐13,261 237,941 42.8 0 158,474 26.8 0 66.6% 62.8% 11.9%
D62544 13,840 8 ‐ 18,858 13.7 ‐ 11,936 8.7 ‐ 63.3% 63.3% ‐
D62549 34,231 16 ‐ 28,078 5.8 ‐ 23,268 4.6 ‐ 82.9% 79.4% ‐
D62567 514,262 282 ‐41 390,826 80.6 139 ‐249,404 ‐49.9 139 ‐63.8% ‐61.9% 100.0%
D62594 511,475 58 ‐ 597,905 85.4 ‐ 448,429 64.1 ‐ 75.0% 75.0% ‐
D62627 211,150 33 1,084 205,623 38 3,824 141,114 23.4 3,568 68.6% 61.5% 93.3%
D62669 52,991 45 1,064 58,102 22.9 ‐23 52,227 20.4 ‐22 89.9% 89.1% ‐
D62692 596,739 125 52,159 ‐188,228 ‐29.6 1,384 ‐50,857 ‐15.2 695 ‐ ‐ 50.2%
D62736 386,529 174 1,512 303,780 117 1,631 274,498 107.6 1,923 90.4% 92.0% 117.9%
D62744 21,408 5 ‐139 13,394 3.1 ‐12 7,193 1.7 ‐8 53.7% 53.1% ‐
D62760 578,116 144 ‐ 570,977 142.6 ‐ 553,847 137.8 ‐ 97.0% 96.7% ‐
D62762 676,295 210 ‐535 241,028 64.7 ‐25 164,179 38.1 ‐20 68.1% 58.9% ‐
D62774 63,341 21 30 48,879 18.8 ‐3 10,864 3 0 22.2% 16.0% ‐
D62797 762,569 147 58,319 801,091 101 13,171 779,887 96.4 16,558 97.4% 95.4% 125.7%
D62807 391,524 61 1 8,776 ‐1.6 ‐ 549 ‐0.1 ‐ 6.3% ‐ ‐
D62826 1,032,510 118 ‐ 778,702 114.5 ‐ 441,264 64.9 ‐ 56.7% 56.7% ‐
D62878 114,468 37 ‐113 58,842 16.6 ‐10 33,774 9.5 ‐7 57.4% 57.3% ‐
D62879 39,361 13 ‐45 24,013 7.1 ‐11 13,652 4 ‐6 56.9% 56.5% ‐
D62885 120,033 14 ‐ 57,873 6.6 ‐ 50,156 5.7 ‐ 86.7% 86.7% ‐
D62938 16,010 12 ‐ 16,641 7.7 ‐1 9,255 4.3 ‐1 55.6% 55.1% ‐
D62956 390,132 59 51,180 123,219 14.1 3,826 ‐ ‐ ‐ 0.0% 0.0% 0.0%
D62974 277,687 33 ‐1,455 328,005 67.1 ‐ 268,453 54.4 ‐ 81.8% 81.2% ‐
D62979 941,329 108 ‐ 1,189,459 136.1 ‐ 515,432 59 ‐ 43.3% 43.3% ‐
D62980 284,264 37 ‐7,269 196,023 23 150 179,320 18.8 154 91.5% 81.8% 102.9%
D62989 539,872 74 ‐ 742,368 105 ‐ 173,219 24.5 ‐ 23.3% 23.3% ‐
D62993 312,571 33 24,654 170,496 21.5 20,592 169,893 21.3 20,609 99.6% 99.1% 100.1%
D62995 60,443 18 ‐178 51,316 14.4 ‐2 30,163 8.5 ‐1 58.8% 59.3% ‐
D63017 133,060 14 667 177,672 24.9 13,547 154,092 21.7 13,547 86.7% 87.0% 100.0%
D63025 252,519 42 ‐ 242,040 51 ‐ 145,224 30.6 ‐ 60.0% 60.0% ‐
D63028 136,404 ‐5 ‐34 122,836 1.6 ‐12 106,220 0.5 ‐12 86.5% 32.5% ‐
D63031 44,479 20 21 33,389 0.1 1,038 25,622 0.1 1,040 76.7% 100.8% 100.2%
D63035 60,942 7 ‐ 47,059 5.4 ‐ 35,295 4 ‐ 75.0% 75.0% ‐
D63038 67,684 27 ‐263 13,083 2.2 ‐ 12,892 2.1 ‐ 98.5% 95.4% ‐
D63043 201,477 231 138 362,847 153.6 ‐160 361,317 95.6 9,126 99.6% 62.2% ‐
D63073 10,563 4 ‐ 10,255 3.3 0 6,297 1.3 0 61.4% 38.1% ‐
D63075 338,031 39 ‐ 129,885 38.6 ‐ 56,283 16.7 ‐ 43.3% 43.3% ‐
D63187 58,155 18 224 60,601 14.9 ‐72 49,653 13.1 42 81.9% 88.1% ‐
D63199 416,605 70 ‐ 415,602 47.4 ‐ 360,189 41.1 ‐ 86.7% 86.7% ‐
D63233 45,467 19 ‐ 53,498 2.4 ‐ 51,042 1.6 ‐ 95.4% 68.1% ‐
D63257 505,112 50 40,326 482,197 84 25,374 482,197 84 25,374 100.0% 100.0% 100.0%
G120001 ‐ ‐ 95,337 ‐ ‐ 48,516 ‐ ‐ 31,535 ‐ ‐ 65.0%
G120006 ‐ ‐ 41,685 ‐ ‐ 15,480 ‐ ‐ 6,708 ‐ ‐ 43.3%
All Sites
Ex‐Ante Savings Ex‐Post Gross Savings Ex‐Post Net Savings Site Net to Gross Ratio
Experience you can trust. xcvii
G120008 ‐ ‐ 178,130 ‐ ‐ 389 ‐ 0 ‐443 ‐ ‐ ‐113.9%
G120012 ‐ ‐ 17,181 ‐ ‐ 19,375 ‐ ‐ 17,437 ‐ ‐ 90.0%
G120013 ‐ ‐ 240,007 ‐ ‐ 216,301 ‐ ‐ 194,671 ‐ ‐ 90.0%
G120015X ‐ ‐ 3,233,460 ‐ ‐ 3,310,781 ‐ ‐ 2,335,139 ‐ ‐ 70.5%
G20217 ‐ ‐ 8,521 ‐ ‐ 5 ‐ ‐ 5 ‐ ‐ 100.0%
G20464 ‐ ‐ 1,467 ‐ 0 59 ‐ 0 59 ‐ 100.0% 100.0%
G20471 ‐ ‐ 1,008 ‐ ‐ 249 ‐ ‐ 249 ‐ ‐ 100.0%
G20488 ‐ ‐ 109,590 ‐ ‐ 17,073 ‐ ‐ 9,954 ‐ ‐ 58.3%
G20515 ‐ ‐ 21,329 ‐ ‐ 4,252 ‐ ‐ ‐ ‐ ‐ 0.0%
G20516 ‐ ‐ 91,841 ‐ ‐ 107,992 ‐ ‐ 61,195 ‐ ‐ 56.7%
G20526 ‐ ‐ 613,300 ‐ ‐ 291,942 ‐ ‐ 170,299 ‐ ‐ 58.3%
G20548 ‐ ‐ 198,334 ‐ ‐ ‐ ‐ ‐ ‐ ‐ ‐ ‐
G70010 ‐ ‐ 6,312 ‐ ‐ 7,875 ‐ ‐ 5,250 ‐ ‐ 66.7%
G70011 ‐ ‐ 1,209 ‐ ‐ ‐ ‐ ‐ ‐ ‐ ‐ ‐
P29205 45,826 ‐ ‐ ‐ ‐ ‐ ‐ ‐ ‐ ‐ ‐ ‐
P30386 28,186 17 ‐25 22,563 21.4 0 21,159 18.9 0 93.8% 88.3% ‐16.3%
P30462 85,204 46 ‐22 62,783 37.3 0 57,623 34.3 0 91.8% 91.9% 150.3%
P34352 310,724 166 9,763 241,121 108.2 5,733 150,604 69.3 5,925 62.5% 64.0% 103.3%
P34570 280,639 216 1,673 272,158 93.2 2,022 244,550 69.3 10,235 89.9% 74.3% 506.1%
P36334 401,190 85 ‐ 339,575 42.3 ‐ 312,409 38.9 ‐ 92.0% 92.0% ‐
P40920 682,375 80 ‐13 607,159 72.3 ‐13 405,252 48.4 ‐12 66.7% 66.9% ‐
P41214 236,976 150 ‐ 191,255 77.7 0 94,518 43 0 49.4% 55.3% 73.6%
P41498X 620,285 ‐ ‐ 606,939 29 ‐ 213,584 10.3 ‐ 35.2% 35.6% ‐
P41556 ‐ ‐ 23,496 ‐394,156 ‐75.2 24,177 ‐249,632 ‐47.6 15,312 ‐ ‐ 63.3%
P42456 79,638 ‐ 12,348 60,733 7.9 8,961 45,550 5.9 4,481 75.0% 75.0% 50.0%
P42874 62,373 14 28,366 19,016 2.7 2,429 11,271 0.3 36 59.3% 10.4% 1.5%
P43314 81,679 27 2,659 73,834 36.5 2,753 ‐ ‐ ‐ 0.0% 0.0% 0.0%
P43520 872,243 1,227.00 8,863 491,623 219.9 34,089 449,228 199.6 34,149 91.4% 90.8% 100.2%
P47557 367,067 228 ‐ 255,214 67.2 1,081 199,099 36 1,081 78.0% 53.6% 100.0%
P47814 625,471 85 ‐ 566,945 11.3 ‐69 526,681 10.5 ‐63 92.9% 92.9% ‐
P48014 83,691 25 ‐ 39,593 13.3 ‐5 39,593 13.3 ‐5 100.0% 100.0% ‐
P48118 23,893 8 698 24,654 6.8 ‐311 11,325 3.1 ‐131 45.9% 45.2% ‐
P48215 212,355 127 ‐334 197,650 79.8 0 123,770 59.7 0 62.6% 74.8% ‐
P48486 38,056 4 ‐ 39,540 5.3 ‐ 11,862 1.6 ‐ 30.0% 30.0% ‐
P48571 14,150 10 433 3,884 1.5 370 1,451 0.7 380 37.4% 43.1% 102.5%
P49006 293,918 41 ‐ 242,832 32.8 ‐ 192,060 24.9 ‐ 79.1% 75.9% ‐
P50027 3,719,449 450 ‐ 3,289,163 369.3 ‐ 812,247 91.4 ‐ 24.7% 24.7% ‐
P50606 1,359,199 154 ‐ 1,331,200 140 ‐ 1,114,253 110.2 ‐ 83.7% 78.7% ‐
P50646 5,261 4 ‐ 4,424 2.9 0 497 0.3 0 11.2% 11.5% 100.0%
P50706 698,708 58 ‐ 224,975 71.7 ‐4 202,718 64.6 ‐4 90.1% 90.1% ‐
P50966 93,776 8 ‐ 132,145 14.5 ‐ 70,037 7.7 ‐ 53.0% 53.0% ‐
P52066 131,955 182 ‐1,961 77,648 27.9 270 147,747 23.8 2,599 190.3% 85.3% 961.9%
P52291 555,477 127 ‐4,082 713,793 75.7 112 497,012 25.7 3 69.6% 34.0% 2.4%
P52886X 141,371 124 1,355 133,147 54 73 133,147 54 73 100.0% 100.0% 100.0%
P53586 3,108,518 376 ‐ 2,246,248 412.1 ‐ 2,138,350 392.3 ‐ 95.2% 95.2% ‐
P54486 49,961 45 6,680 30,332 2.1 1,432 550 ‐8.4 1,643 1.8% ‐401.2% 114.8%
P55808 209,766 634 6,219 255,583 98.6 6,439 213,508 81.6 6,474 83.5% 82.7% 100.5%
P57266 463,004 71 ‐12,410 548,117 68.7 ‐ 513,225 66.7 ‐ 93.6% 97.1% ‐
P57286 465,922 75 ‐13,648 503,432 66 0 476,283 64.9 0 94.6% 98.4% ‐
P57373 415,348 172 ‐ 308,758 64.9 ‐ 63,494 13.3 ‐ 20.6% 20.5% ‐
P57451 762,115 178 ‐7,707 850,581 172 217 ‐104,216 ‐67.2 216 ‐12.3% ‐39.1% 99.7%
P57906 543,656 152 ‐2,136 540,876 144.6 0 43,881 28.7 0 8.1% 19.9% 100.0%
P58326 118,124 22 ‐659 215,376 55.7 ‐1,208 89,613 22.5 ‐456 41.6% 40.3% ‐

Experience you can trust. xcviii
P59926 1,690,617 122 ‐ 1,422,139 82.8 ‐ 1,183,957 67.5 ‐ 83.3% 81.5% ‐
P60806 1,052,365 ‐ ‐ 23,022 2.6 1,738 ‐ ‐ ‐ 0.0% 0.0% 0.0%
P61766 22,115 19 27 10,864 7.8 1,520 8,828 6.4 1,558 81.3% 81.7% 102.5%
P61867 552,660 ‐ 101,796 433,816 49.5 145,072 ‐ ‐ ‐ 0.0% 0.0% 0.0%
P62326 176,830 66 1,966 116,836 53.7 2,813 50,611 37.3 2,865 43.3% 69.4% 101.9%
P62766 821,004 221 ‐8,337 707,729 232.5 38 90,096 42.8 47 12.7% 18.4% 122.8%
P63626 15,757 ‐ ‐ 63,139 4 ‐ 33,464 2.1 ‐ 53.0% 53.0% ‐
P64746 405,697 188 626 322,349 69 ‐781 292,461 60 ‐818 90.7% 87.0% ‐
P65106 89,601 15 ‐ 64,452 9.7 ‐ 45,116 6.8 ‐ 70.0% 70.0% ‐
P65966 919,908 769 14,424 298,996 269.2 2,219 ‐50,871 172.8 700 ‐17.0% 64.2% 31.6%
P69506 1,639,902 297 ‐73 1,428,181 287.4 ‐1,664 1,187,008 187.7 ‐1,963 83.1% 65.3% ‐
P69566 348,189 74 ‐6,533 316,973 58.1 ‐15 315,866 55.4 ‐17 99.7% 95.3% ‐
P70226 726,074 198 1,529 807,534 216.9 2,136 226,991 55.9 2,143 28.1% 25.8% 100.3%
P70686 1,232,601 447 ‐7,608 987,011 244.3 ‐17 986,896 244.1 ‐17 100.0% 99.9% ‐
P71966 158,183 14 ‐ 92,869 28.2 ‐ 75,843 23.1 ‐ 81.7% 81.7% ‐
P72707 728,362 224 1,547 1,080,753 326.2 2,265 121,984 57.6 2,273 11.3% 17.7% 100.4%
P75627 396,685 123 ‐ 366,898 89.3 ‐ 220,708 53.8 ‐ 60.2% 60.3% ‐
P81166 47,554 25 ‐ 70,011 8.8 ‐27 44,056 2.4 ‐13 62.9% 27.1% ‐
S18005 168,504 20 ‐14 148,121 29.3 2 127,599 25.2 3 86.1% 86.0% 203.6%
S18009 601,401 190 ‐72 504,150 136.5 ‐76 441,066 110.6 ‐76 87.5% 81.0% ‐
S18010 637,709 205 ‐ 668,166 105.4 135 536,196 66.1 135 80.2% 62.7% 100.1%
S18011 34,552 9 ‐ 32,362 9.1 ‐475 27,997 7.9 ‐419 86.5% 86.5% ‐
S18012 745,741 264 ‐1,059 566,215 140.4 16 465,120 102.8 16 82.1% 73.2% 100.0%
S18014 981,214 75 37,926 1,044,398 428.9 40,364 653,167 270.1 25,564 62.5% 63.0% 63.3%
S18016 676,296 210 ‐535 983,378 289.2 0 928,954 270.2 0 94.5% 93.4% ‐
S18018 562,273 56 ‐ 1,280,663 280.9 133 928,361 204.4 0 72.5% 72.7% 0.0%
S18021 17,831 5 ‐ 32,582 6.3 ‐9 5,788 1.2 ‐7 17.8% 19.5% ‐
S18022 355,557 58 ‐ 253,343 57.5 ‐ 238,675 54.3 ‐ 94.2% 94.5% ‐
S18044 18,158 5 ‐ 14,792 4.8 0 1,671 0.5 0 11.3% 11.3% ‐
S18077 405,062 46 ‐ 404,694 46.2 ‐ ‐ ‐ ‐ 0.0% 0.0% ‐
S18079 387,017 44 ‐ 326,676 37.3 ‐ ‐ ‐ ‐ 0.0% 0.0% ‐
S18080 346,370 40 ‐ 759,276 86.7 ‐ ‐ ‐ ‐ 0.0% 0.0% ‐
S18081 399,806 46 ‐ 361,684 41.3 ‐ ‐ ‐ ‐ 0.0% 0.0% ‐
S18082 400,332 46 ‐ 635,697 72.6 ‐ ‐ ‐ ‐ 0.0% 0.0% ‐
S18084 380,885 44 ‐ 597,238 68.2 ‐ ‐ ‐ ‐ 0.0% 0.0% ‐
S18086 401,734 46 ‐ 682,958 78 ‐ ‐ ‐ ‐ 0.0% 0.0% ‐
S18088 388,506 44 ‐ 486,963 55.6 ‐ ‐ ‐ ‐ 0.0% 0.0% ‐
S18089 390,871 45 ‐ 808,587 92.3 ‐ ‐ ‐ ‐ 0.0% 0.0% ‐
S18093 381,936 44 ‐ 896,958 102.4 ‐ ‐ ‐ ‐ 0.0% 0.0% ‐
S18101 315,185 36 ‐ 186,393 21.3 ‐ ‐ ‐ ‐ 0.0% 0.0% ‐
S18103 405,062 46 ‐ 590,737 67.4 ‐ ‐ ‐ ‐ 0.0% 0.0% ‐
S18109 312,995 36 ‐ 352,132 40.2 ‐ ‐ ‐ ‐ 0.0% 0.0% ‐
S18112 1,978,538 ‐ ‐ 1,815,577 203.5 ‐ 1,724,798 193.3 ‐ 95.0% 95.0% ‐
S18114 293,269 89 204 368,470 82.5 ‐32 223,047 45.2 ‐32 60.5% 54.9% ‐
S18117 1,207 1 ‐ 574 0.1 ‐ ‐555 ‐0.2 ‐ ‐96.6% ‐155.6% ‐
S18118 10,938 6 ‐ 13,838 5.7 ‐1 8,257 3.4 ‐1 59.7% 59.4% ‐
S18119 599,762 129 ‐ 400,678 131.8 ‐ 348,782 117.1 ‐ 87.0% 88.8% ‐
S18120 789,995 187 ‐ 546,400 96.3 ‐ 522,302 92.8 ‐ 95.6% 96.3% ‐
S18125 567,434 127 ‐ 406,963 152.4 ‐ 42,467 13.8 ‐ 10.4% 9.0% ‐
S18129 37,727 12 ‐163 ‐25,212 ‐2.9 2 ‐26,906 ‐3.7 2 ‐ ‐ 100.0%
S18152 4,833 4 ‐ 3,580 1.6 0 3,036 1.4 0 84.8% 85.6% ‐
S18162 610,961 131 ‐2,477 700,601 126.7 49 547,634 80 49 78.2% 63.2% 100.0%
S19003 347,959 167 1,302 251,583 87.9 820 269,243 89.4 186 107.0% 101.7% 22.6%
S19010 31,863 10 ‐123 10,527 5.8 ‐19 5,209 4.7 38 49.5% 81.1% ‐
S19015 290,296 53 ‐129 303,964 63.9 ‐33 79,239 24.6 ‐33 26.1% 38.5% ‐
S19018 571,926 160 ‐ 1,467,459 308 239 597,295 123.8 173 40.7% 40.2% 72.1%

Experience you can trust. xcix
S19019 37,130 7 2,634 66,463 11.6 ‐ 58,309 10.2 ‐ 87.7% 87.7% ‐
S19021 1,887,914 337 ‐ 1,875,382 368.4 ‐ 1,226,667 239.5 ‐ 65.4% 65.0% ‐
S19023 401,744 91 7,914 448,998 96 1,317 241,039 80.2 1,454 53.7% 83.6% 110.4%
S19029X 411,422 37 ‐ 122,942 10.6 53 103,138 8.2 53 83.9% 77.3% 100.0%
S19045 450,661 79 ‐6,435 529,056 57.7 ‐3 492,121 53.4 ‐3 93.0% 92.5% ‐
S19065 26,529 12 ‐ 978 4.2 ‐46 ‐5,061 1.2 ‐29 ‐517.7% 29.4% ‐
S19066 3,713 3 ‐ ‐7,815 ‐2 ‐1 ‐12,435 ‐3.8 ‐1 ‐ ‐ ‐
S19083 300,590 64 ‐ 173,136 45.6 ‐ 17,729 3.7 ‐ 10.2% 8.0% ‐
S19088 523,507 136 ‐ 580,553 28.8 ‐5 115,400 ‐46.6 ‐2 19.9% ‐161.5% ‐
S19094 1,774,739 229 ‐ 1,759,916 228.1 ‐ 1,009,186 123.3 ‐ 57.3% 54.1% ‐
S19097 799,472 95 ‐ 846,924 131.1 ‐ 624,070 96.2 ‐ 73.7% 73.4% ‐
S19098 1,566,373 287 282 1,654,301 353.3 282 1,284,910 266 161 77.7% 75.3% 57.3%
S19104 4,351,133 1 ‐ ‐ ‐ ‐ ‐ ‐ ‐ ‐ ‐ ‐
S19105 26,260 9 ‐ 16,337 9.2 ‐ 3,446 1.2 ‐ 21.1% 12.9% ‐
S19108 3,586,696 11 ‐ 2,247,168 399.6 ‐ 1,161,037 206.4 ‐ 51.7% 51.7% ‐
S19109 227,698 55 ‐ 204,441 73.8 ‐ 204,214 73.8 ‐ 99.9% 100.0% ‐
S19111 1,006,965 175 ‐ 1,356,009 273.8 ‐ 1,144,496 244.4 ‐ 84.4% 89.2% ‐
S19112 291,110 32 ‐7,107 157,800 17 0 ‐5,747 ‐7.3 0 ‐3.6% ‐43.1% ‐
S19114 745,471 264 ‐ 480,537 110.1 902 450,855 97.9 901 93.8% 88.9% 99.9%
S19121 686,835 223 ‐2,969 625,004 130.7 92 558,502 113 92 89.4% 86.5% 100.0%
S19125 321,721 216 ‐ 358,697 215.5 0 265,814 160.8 0 74.1% 74.6% ‐
S19134 199,256 33 ‐3,957 466,647 54.5 2,135 426,043 46.7 2,135 91.3% 85.7% 100.0%
S19151 481,001 130 ‐ 317,827 2.7 ‐ 121,601 0.6 ‐ 38.3% 20.7% ‐
S19152 780,261 202 ‐7,899 851,847 218.2 ‐18 227,831 37.5 ‐19 26.7% 17.2% ‐
S19176 172,936 27 108 124,127 17.3 ‐ 129,982 17.8 ‐ 104.7% 102.9% ‐
S19186 2,784,748 383 ‐ 4,114,741 673.3 ‐ 1,963,989 316 ‐ 47.7% 46.9% ‐
S19187 499,068 198 ‐ 475,453 163.7 ‐ 311,811 113.9 ‐ 65.6% 69.6% ‐
S19189 683,476 87 ‐ 612,695 112.2 ‐ 612,695 112.2 ‐ 100.0% 100.0% ‐
S19192 47,605 26 ‐ 17,637 9.4 ‐ ‐1,380 ‐0.5 ‐ ‐7.8% ‐5.3% ‐
S20021 172,457 27 ‐713 224,469 28.4 0 214,306 27.5 0 95.5% 96.7% 104.4%
S20046 158,580 24 65 253,602 27.5 ‐27 246,588 26.5 ‐27 97.2% 96.5% ‐
S20066 25,131 8 ‐ ‐ ‐ ‐ ‐ ‐ ‐ ‐ ‐ ‐
Experience you can trust. c
Appendix M. Commercial Whole Building Site Characteristics
The following document is a complete list of the parametric results generated by the Survey‐IT software
used for building analysis. The results show the existing parameters and Title 24 baseline, ex‐post gross
and net savings, and the net‐to‐gross (NTG) realization rates for each of the 120 commercial sites. Also
included are field notes taken at site visits. Each site is given an ID by IOU; sites IDs that begin with D
belong to SDG&E, G is SCG, P is PG&E, and S is SCE.

ci
D61295............................................................................................................................ cv D61703...........................................................................................................................cvii D62109X .........................................................................................................................cix D62147............................................................................................................................cxi D62232.......................................................................................................................... cxiii D62401...........................................................................................................................cxv D62544.........................................................................................................................cxvii D62549..........................................................................................................................cxix D62567..........................................................................................................................cxxi D62627........................................................................................................................ cxxiii D62669.........................................................................................................................cxxv D62692.........................................................................................................................cxxv D62692........................................................................................................................ cxxvi D62736...................................................................................................................... cxxviii D62744........................................................................................................................ cxxix D62762........................................................................................................................ cxxxi D62774...................................................................................................................... cxxxiii D62797....................................................................................................................... cxxxv D62878..................................................................................................................... cxxxvii D62879.....................................................................................................................cxxxviii D62938...................................................................................................................... cxxxix D62974...........................................................................................................................cxli D62980......................................................................................................................... cxliii D62993..........................................................................................................................cxlv D62995........................................................................................................................ cxlvii D63017....................................................................................................................... cxlviii D63028............................................................................................................................. cl D63031.............................................................................................................................cli D63038...........................................................................................................................cliii D63043............................................................................................................................clv D63073...........................................................................................................................clvi D63187......................................................................................................................... clviii D63233............................................................................................................................clx D63257...........................................................................................................................clxi G02471 ........................................................................................................................ clxiii G12008 ........................................................................................................................ clxvi G20217 ...................................................................................................................... clxviii G20464 .........................................................................................................................clxx

cii
G20471 ....................................................................................................................... clxxii G120008 .................................................................................................................... clxxiv P30386....................................................................................................................... clxxvi P30462......................................................................................................................clxxviii P34352........................................................................................................................ clxxx P34570...................................................................................................................... clxxxii P41214......................................................................................................................clxxxiii P42874..................................................................................................................... clxxxiv P43314..................................................................................................................... clxxxvi P43520....................................................................................................................clxxxviii P47557...........................................................................................................................cxc P47814.........................................................................................................................cxcii P48014........................................................................................................................ cxciv P48118........................................................................................................................ cxcvi P48215...................................................................................................................... cxcviii P48571........................................................................................................................ cxcix P50646............................................................................................................................cci P50706..........................................................................................................................cciii P52066...........................................................................................................................ccv P52291.........................................................................................................................ccvii P52886X ..................................................................................................................... ccviii P53586..........................................................................................................................ccix P54486...........................................................................................................................ccx P55808.........................................................................................................................ccxii P57266........................................................................................................................ ccxiv P57286.........................................................................................................................ccxv P57451........................................................................................................................ ccxvi P57906....................................................................................................................... ccxvii P57986........................................................................................................................ ccxix P58326........................................................................................................................ ccxxi P61766....................................................................................................................... ccxxii P62326...................................................................................................................... ccxxiii P64746...................................................................................................................... ccxxiv P65966...................................................................................................................... ccxxvi P69566..................................................................................................................... ccxxvii P70226.....................................................................................................................ccxxviii P70686...................................................................................................................... ccxxix P72707....................................................................................................................... ccxxx

ciii
P81166..................................................................................................................... ccxxxii S18005.................................................................................................................... ccxxxiv S18010.................................................................................................................... ccxxxvi S18011...................................................................................................................ccxxxviii S18012.................................................................................................................... ccxxxix S18016.........................................................................................................................ccxli S18018........................................................................................................................ ccxlii S18021....................................................................................................................... ccxliv S18044....................................................................................................................... ccxlvi S18114......................................................................................................................ccxlviii S18117............................................................................................................................ccl S18118..........................................................................................................................cclii S18119.........................................................................................................................ccliv S18120.........................................................................................................................cclvi S18125....................................................................................................................... cclviii S18129..........................................................................................................................cclx S18152........................................................................................................................ cclxii S18162....................................................................................................................... cclxiv S19003....................................................................................................................... cclxvi S19010......................................................................................................................cclxviii S19015........................................................................................................................ cclxx S19018....................................................................................................................... cclxxi S19019...................................................................................................................... cclxxii S19023......................................................................................................................cclxxiii S19029X .................................................................................................................. cclxxvi S19045....................................................................................................................cclxxviii S19065...................................................................................................................... cclxxx S19066.....................................................................................................................cclxxxii S19083....................................................................................................................cclxxxiv S19088....................................................................................................................cclxxxvi S19105.................................................................................................................. cclxxxviii S19109....................................................................................................................cclxxxix S19111........................................................................................................................ ccxci S19112...................................................................................................................... ccxciii S19114....................................................................................................................... ccxcv S19121..................................................................................................................... ccxcvii S19125.....................................................................................................................ccxcviii S19134...........................................................................................................................ccc
civ
S19152.........................................................................................................................cccii S19176........................................................................................................................ ccciv S19186........................................................................................................................ cccvi S19187...................................................................................................................... cccviii S19189.........................................................................................................................cccx S19192....................................................................................................................... cccxii S20021...................................................................................................................... cccxiii S20046...................................................................................................................... cccxiv
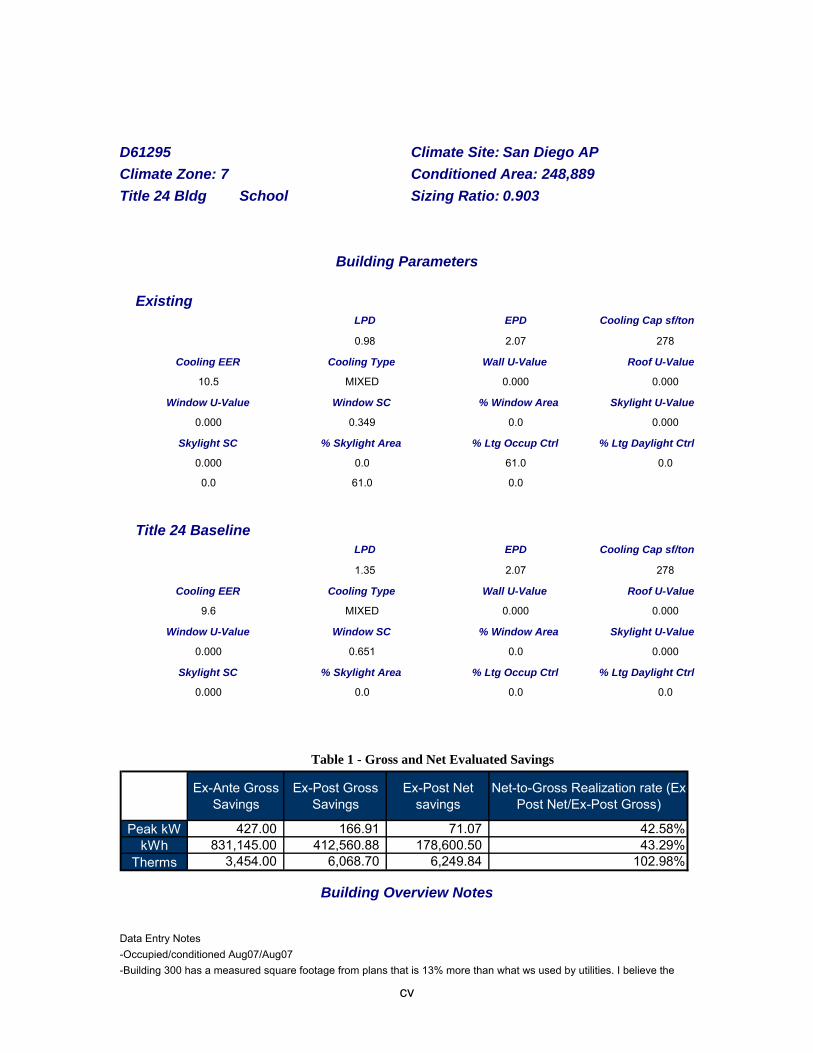
cv
D61295 Climate Site: San Diego AP Climate Zone: 7 Conditioned Area: 248,889 Title 24 Bldg School Sizing Ratio: 0.903
Building Parameters
Existing LPD EPD Cooling Cap sf/ton 0.98 2.07 278 Cooling EER Cooling Type Wall U-Value Roof U-Value 10.5 MIXED 0.000 0.000 Window U-Value Window SC % Window Area Skylight U-Value 0.000 0.349 0.0 0.000 Skylight SC % Skylight Area % Ltg Occup Ctrl % Ltg Daylight Ctrl 0.000 0.0 61.0 0.0 0.0 61.0 0.0
Title 24 Baseline LPD EPD Cooling Cap sf/ton 1.35 2.07 278 Cooling EER Cooling Type Wall U-Value Roof U-Value 9.6 MIXED 0.000 0.000 Window U-Value Window SC % Window Area Skylight U-Value 0.000 0.651 0.0 0.000 Skylight SC % Skylight Area % Ltg Occup Ctrl % Ltg Daylight Ctrl 0.000 0.0 0.0 0.0
Table 1 - Gross and Net Evaluated Savings
Ex-Ante Gross Savings
Ex-Post Gross Savings
Ex-Post Net savings
Net-to-Gross Realization rate (Ex-Post Net/Ex-Post Gross)
Peak kW 427.00 166.91 71.07 42.58%kWh 831,145.00 412,560.88 178,600.50 43.29%
Therms 3,454.00 6,068.70 6,249.84 102.98%
Building Overview Notes
Data Entry Notes -Occupied/conditioned Aug07/Aug07 -Building 300 has a measured square footage from plans that is 13% more than what ws used by utilities. I believe the
cvi
value they used is incorrect based on similar buildings at the facility. I am using the values measured on the architectural plans. -No cool roof found on any of the buildings despite claims -Unsure of economizer type on packaged units, but using utilities assumptions. EER found on spec sheets & mechanical schedule don't match manufacturer's specs (very off), using values found on manufacturer's specs. All else matches for packaged systems -There is a multiplier for zones in building 400 by 3x, but there is an issue with the orientation of the windows. The buildings are identical but they are built like mirror reflections along the x-axis I am splitting up the north face windows in a 1:2 ratio to reflect the actual distrubtion of windows when the program multiplies out the zones. Same thing with the south facing windows since these are the only ones affected. -Overall, our model for the shell is more reliable than the utilities. Noticed the orientation of the glazings were done incorrectly and incorrect values for glazing (at least for the gym) in their calc sheets. -Exterior lights not entered but are in plans.
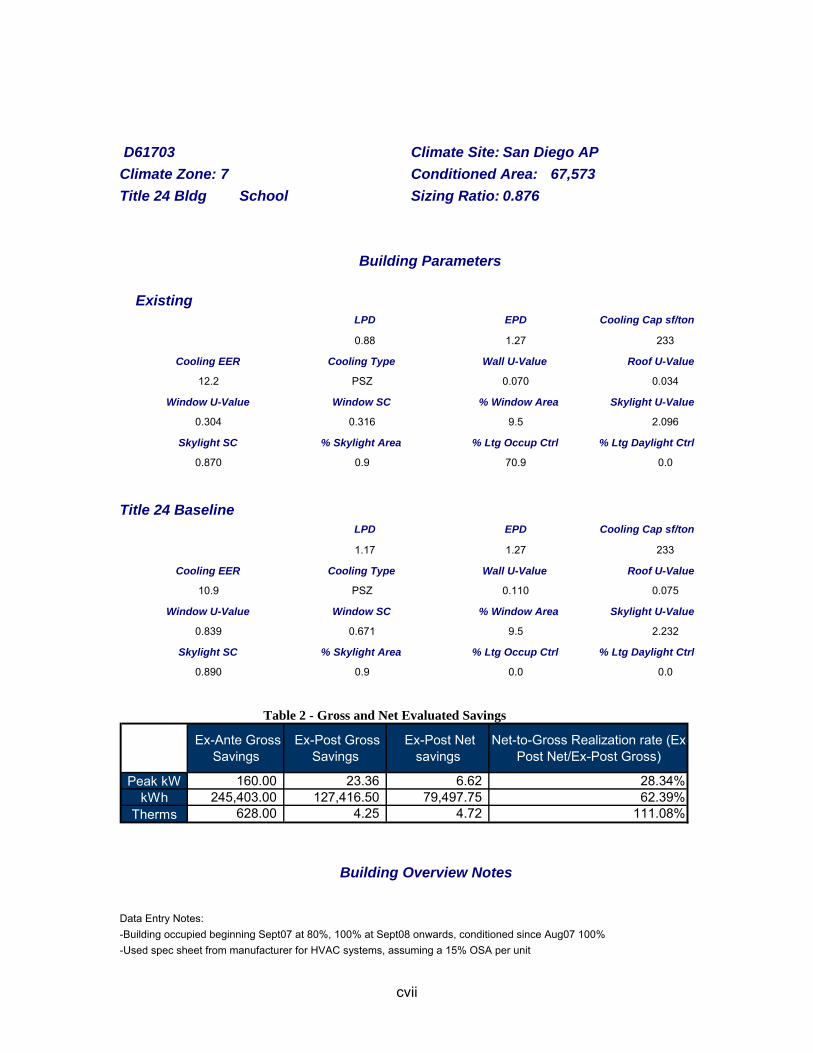
cvii
D61703 Climate Site: San Diego AP Climate Zone: 7 Conditioned Area: 67,573 Title 24 Bldg School Sizing Ratio: 0.876
Building Parameters
Existing LPD EPD Cooling Cap sf/ton 0.88 1.27 233 Cooling EER Cooling Type Wall U-Value Roof U-Value 12.2 PSZ 0.070 0.034 Window U-Value Window SC % Window Area Skylight U-Value 0.304 0.316 9.5 2.096 Skylight SC % Skylight Area % Ltg Occup Ctrl % Ltg Daylight Ctrl 0.870 0.9 70.9 0.0
Title 24 Baseline LPD EPD Cooling Cap sf/ton 1.17 1.27 233 Cooling EER Cooling Type Wall U-Value Roof U-Value 10.9 PSZ 0.110 0.075 Window U-Value Window SC % Window Area Skylight U-Value 0.839 0.671 9.5 2.232 Skylight SC % Skylight Area % Ltg Occup Ctrl % Ltg Daylight Ctrl 0.890 0.9 0.0 0.0
Table 2 - Gross and Net Evaluated Savings
Ex-Ante Gross Savings
Ex-Post Gross Savings
Ex-Post Net savings
Net-to-Gross Realization rate (Ex-Post Net/Ex-Post Gross)
Peak kW 160.00 23.36 6.62 28.34%kWh 245,403.00 127,416.50 79,497.75 62.39%
Therms 628.00 4.25 4.72 111.08% Building Overview Notes
Data Entry Notes: -Building occupied beginning Sept07 at 80%, 100% at Sept08 onwards, conditioned since Aug07 100% -Used spec sheet from manufacturer for HVAC systems, assuming a 15% OSA per unit

cviii
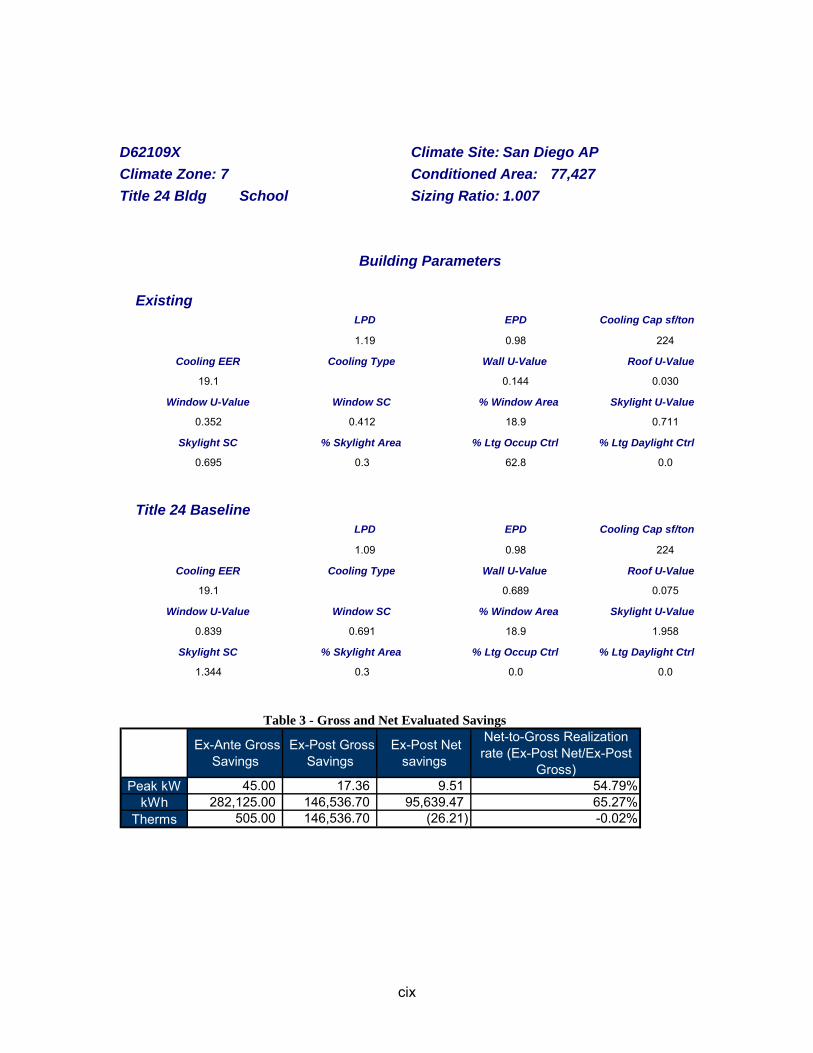
cix
D62109X Climate Site: San Diego AP Climate Zone: 7 Conditioned Area: 77,427 Title 24 Bldg School Sizing Ratio: 1.007
Building Parameters
Existing LPD EPD Cooling Cap sf/ton 1.19 0.98 224 Cooling EER Cooling Type Wall U-Value Roof U-Value 19.1 0.144 0.030 Window U-Value Window SC % Window Area Skylight U-Value 0.352 0.412 18.9 0.711 Skylight SC % Skylight Area % Ltg Occup Ctrl % Ltg Daylight Ctrl 0.695 0.3 62.8 0.0
Title 24 Baseline LPD EPD Cooling Cap sf/ton 1.09 0.98 224 Cooling EER Cooling Type Wall U-Value Roof U-Value 19.1 0.689 0.075 Window U-Value Window SC % Window Area Skylight U-Value 0.839 0.691 18.9 1.958 Skylight SC % Skylight Area % Ltg Occup Ctrl % Ltg Daylight Ctrl 1.344 0.3 0.0 0.0
Table 3 - Gross and Net Evaluated Savings
Ex-Ante Gross Savings
Ex-Post Gross Savings
Ex-Post Net savings
Net-to-Gross Realization rate (Ex-Post Net/Ex-Post
Gross)Peak kW 45.00 17.36 9.51 54.79%
kWh 282,125.00 146,536.70 95,639.47 65.27%Therms 505.00 146,536.70 (26.21) -0.02%

cx
Building Overview Notes
Data Entry Notes: -Building occupied/conditioned in August '06 (not '05 as entered) -Onsite host claims that buiding operates on same schedule, but since this is mixed-use building, schedule will vary. -Fancoils and condenser units claimed in the project file were not found onsite, although mechanical plans show it. -The buiding's cooling needs are supplied by the central plant which serves entire campus -Incented HHW pump efficiency (91%) does not match found on site (87.5%) -Assumed SHGC=0.4, U=.6 for skylights (not incented) -Exhaust fan CFM had to be reduced to match OA% from mechanical plans -**Confident in LPD as entered, triple checked areas and interior lightings *Due to the data being a combined site (parking garage plus SOLES building), I separated the savings by project to get a clear picture of where the discrepancies are. The utilities treated the entire building as one area whereas we divided ours based on occupancy type. They also used lighting fixture wattages that do not reflect the ones found on the lighting plans. Ours is a much better reflection of what was actually installed. The savings for the HVAC equipment are within QC parameters, but those for lighting due to the reasons above came out as negative. Also, utilities inspector failed to due a complete count of all lights in garage giving us these results.

cxi
D62147 Climate Site: Chula Vista Climate Zone: 7 Conditioned Area: 68,491 Title 24 Bldg School Sizing Ratio: 0.882
Building Parameters
Existing LPD EPD Cooling Cap sf/ton 0.85 0.63 284 Cooling EER Cooling Type Wall U-Value Roof U-Value 11.1 PSZ 0.146 0.054 Window U-Value Window SC % Window Area Skylight U-Value 0.927 0.547 9.0 2.228 Skylight SC % Skylight Area % Ltg Occup Ctrl % Ltg Daylight Ctrl 0.570 0.1 89.9 0.0
Title 24 Baseline LPD EPD Cooling Cap sf/ton 1.19 0.63 282 Cooling EER Cooling Type Wall U-Value Roof U-Value 11.7 PSZ 0.430 0.075 Window U-Value Window SC % Window Area Skylight U-Value 0.839 0.682 9.0 1.971 Skylight SC % Skylight Area % Ltg Occup Ctrl % Ltg Daylight Ctrl 0.890 0.1 0.0 0.0
Table 4 - Gross and Net Evaluated Savings
Ex-Ante Gross Savings
Ex-Post Gross Savings
Ex-Post Net savings
Net-to-Gross Realization rate (Ex-Post Net/Ex-Post
Gross)Peak kW 24.00 15.09 12.07 80.01%
kWh 221,265.00 124,858.56 108,591.56 86.97%Therms (482.00) 124,858.56 19.58 0.02%
cxii
Building Overview Notes
Data Entry Notes: -Building occupied Sept07, conditioned Jun07 -Overall LPD in line with utility estimates (0.85 versus 0.83)
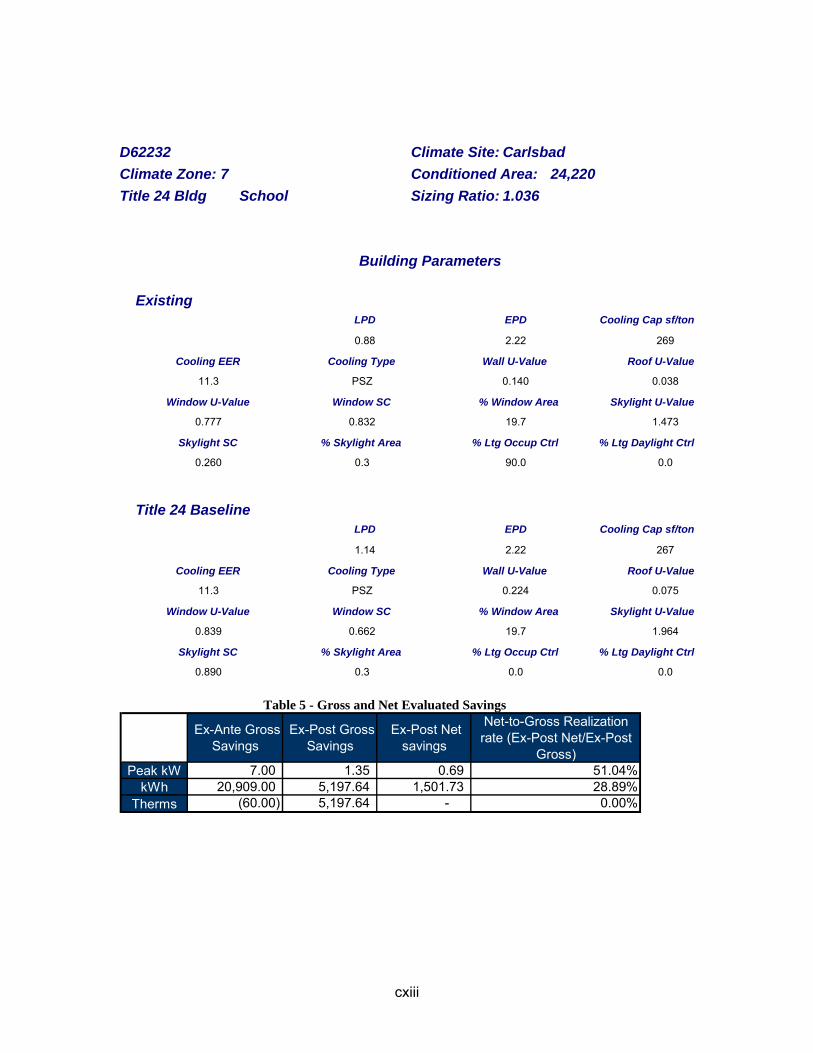
cxiii
D62232 Climate Site: Carlsbad Climate Zone: 7 Conditioned Area: 24,220 Title 24 Bldg School Sizing Ratio: 1.036
Building Parameters
Existing LPD EPD Cooling Cap sf/ton 0.88 2.22 269 Cooling EER Cooling Type Wall U-Value Roof U-Value 11.3 PSZ 0.140 0.038 Window U-Value Window SC % Window Area Skylight U-Value 0.777 0.832 19.7 1.473 Skylight SC % Skylight Area % Ltg Occup Ctrl % Ltg Daylight Ctrl 0.260 0.3 90.0 0.0
Title 24 Baseline LPD EPD Cooling Cap sf/ton 1.14 2.22 267 Cooling EER Cooling Type Wall U-Value Roof U-Value 11.3 PSZ 0.224 0.075 Window U-Value Window SC % Window Area Skylight U-Value 0.839 0.662 19.7 1.964 Skylight SC % Skylight Area % Ltg Occup Ctrl % Ltg Daylight Ctrl 0.890 0.3 0.0 0.0
Table 5 - Gross and Net Evaluated Savings
Ex-Ante Gross Savings
Ex-Post Gross Savings
Ex-Post Net savings
Net-to-Gross Realization rate (Ex-Post Net/Ex-Post
Gross)Peak kW 7.00 1.35 0.69 51.04%
kWh 20,909.00 5,197.64 1,501.73 28.89%Therms (60.00) 5,197.64 - 0.00%
cxiv
Building Overview Notes
Lighting measures only. Utility claimed savings of 20,909 kWh based on 52-week year. Measure-only realization on 52-week calendar is 70%, but on actual academic calendar is only 53% (9,439 kWh).
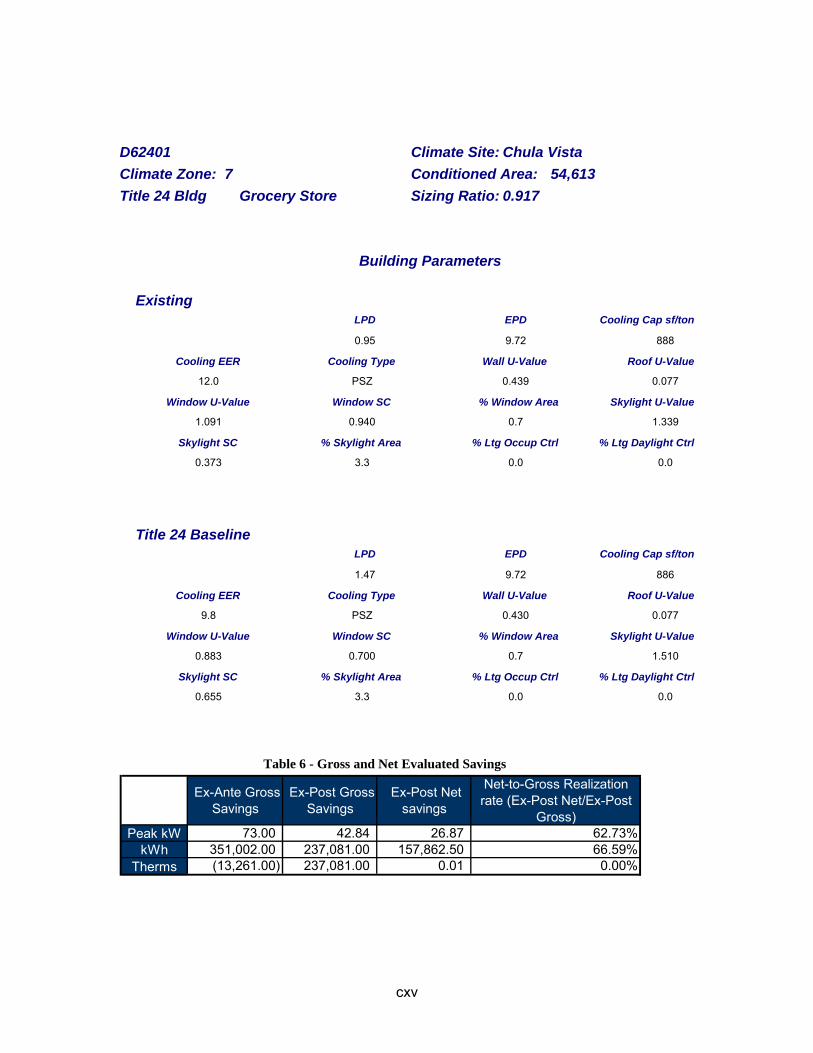
cxv
D62401 Climate Site: Chula Vista Climate Zone: 7 Conditioned Area: 54,613 Title 24 Bldg Grocery Store Sizing Ratio: 0.917
Building Parameters
Existing LPD EPD Cooling Cap sf/ton 0.95 9.72 888 Cooling EER Cooling Type Wall U-Value Roof U-Value 12.0 PSZ 0.439 0.077 Window U-Value Window SC % Window Area Skylight U-Value 1.091 0.940 0.7 1.339 Skylight SC % Skylight Area % Ltg Occup Ctrl % Ltg Daylight Ctrl 0.373 3.3 0.0 0.0
Title 24 Baseline LPD EPD Cooling Cap sf/ton 1.47 9.72 886 Cooling EER Cooling Type Wall U-Value Roof U-Value 9.8 PSZ 0.430 0.077 Window U-Value Window SC % Window Area Skylight U-Value 0.883 0.700 0.7 1.510 Skylight SC % Skylight Area % Ltg Occup Ctrl % Ltg Daylight Ctrl 0.655 3.3 0.0 0.0
Table 6 - Gross and Net Evaluated Savings
Ex-Ante Gross Savings
Ex-Post Gross Savings
Ex-Post Net savings
Net-to-Gross Realization rate (Ex-Post Net/Ex-Post
Gross)Peak kW 73.00 42.84 26.87 62.73%
kWh 351,002.00 237,081.00 157,862.50 66.59%Therms (13,261.00) 237,081.00 0.01 0.00%
cxvi
Building Overview Notes All RTU's EER 12.0

cxvii
D62544 Climate Site: Mission Viejo Climate Zone: 8 Conditioned Area: 38,692 Title 24 Bldg Office Sizing Ratio: 1.094
Building Parameters
Existing LPD EPD Cooling Cap sf/ton 0.81 5.51 260 Cooling EER Cooling Type Wall U-Value Roof U-Value 12.0 PSZ 0.104 0.038 Window U-Value Window SC % Window Area Skylight U-Value 0.370 0.290 33.5 0.000 Skylight SC % Skylight Area % Ltg Occup Ctrl % Ltg Daylight Ctrl 0.000 0.0 80.0 0.0
Title 24 Baseline LPD EPD Cooling Cap sf/ton 1.22 5.51 256 Cooling EER Cooling Type Wall U-Value Roof U-Value 8.8 PSZ 0.189 0.077 Window U-Value Window SC % Window Area Skylight U-Value 0.883 0.476 33.5 0.000 Skylight SC % Skylight Area % Ltg Occup Ctrl % Ltg Daylight Ctrl 0.000 0.0 0.0 0.0
Table 7 - Gross and Net Evaluated Savings
Ex-Ante Gross Savings
Ex-Post Gross Savings
Ex-Post Net savings
Net-to-Gross Realization rate (Ex-Post Net/Ex-Post
Gross)Peak kW 8.00 13.71 9.54 69.56%
kWh 13,840.00 18,857.81 12,043.88 63.87%Therms - 18,857.81 - 0.00%
cxviii
Building Overview Notes
HVAC measures only. Model 2TWR4048A1 (6 units) and model 2TWR4060A1 (3 units) not eligible. Building has been at 67% occupancy since opening. This building is certified LEED Gold.
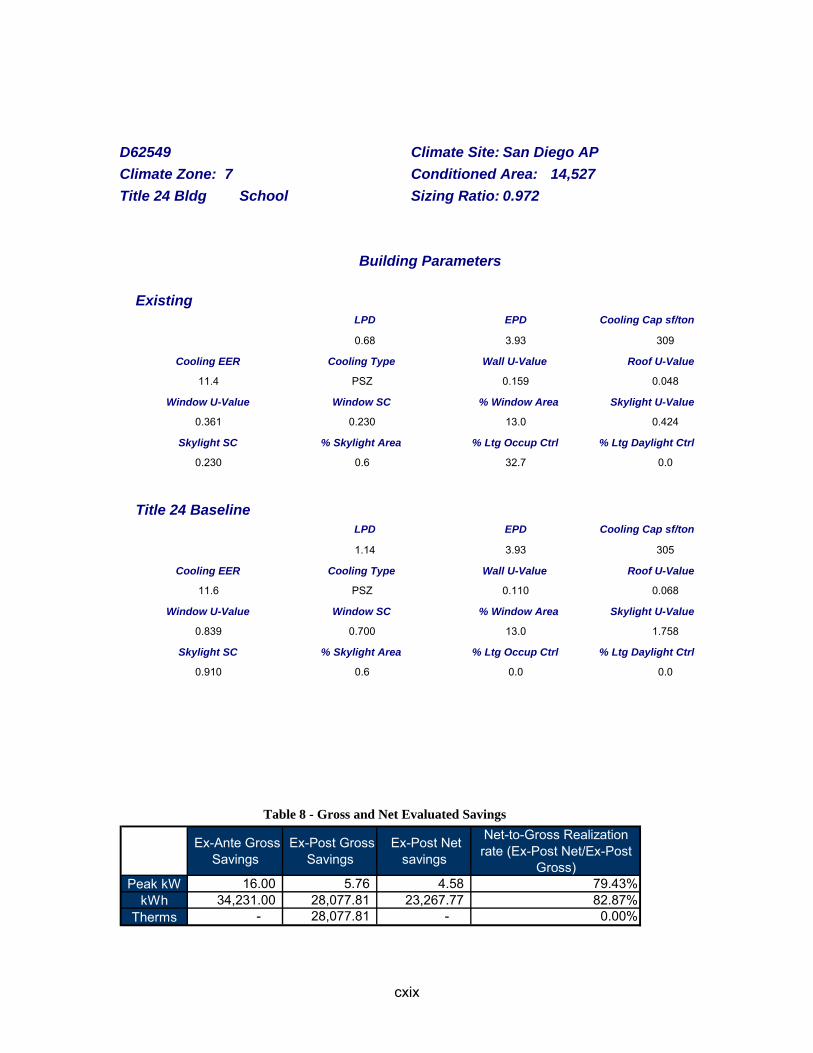
cxix
D62549 Climate Site: San Diego AP Climate Zone: 7 Conditioned Area: 14,527 Title 24 Bldg School Sizing Ratio: 0.972
Building Parameters
Existing LPD EPD Cooling Cap sf/ton 0.68 3.93 309 Cooling EER Cooling Type Wall U-Value Roof U-Value 11.4 PSZ 0.159 0.048 Window U-Value Window SC % Window Area Skylight U-Value 0.361 0.230 13.0 0.424 Skylight SC % Skylight Area % Ltg Occup Ctrl % Ltg Daylight Ctrl 0.230 0.6 32.7 0.0
Title 24 Baseline LPD EPD Cooling Cap sf/ton 1.14 3.93 305 Cooling EER Cooling Type Wall U-Value Roof U-Value 11.6 PSZ 0.110 0.068 Window U-Value Window SC % Window Area Skylight U-Value 0.839 0.700 13.0 1.758 Skylight SC % Skylight Area % Ltg Occup Ctrl % Ltg Daylight Ctrl 0.910 0.6 0.0 0.0
Table 8 - Gross and Net Evaluated Savings
Ex-Ante Gross Savings
Ex-Post Gross Savings
Ex-Post Net savings
Net-to-Gross Realization rate (Ex-Post Net/Ex-Post
Gross)Peak kW 16.00 5.76 4.58 79.43%
kWh 34,231.00 28,077.81 23,267.77 82.87%Therms - 28,077.81 - 0.00%
cxx
Building Overview Notes Both the savings for the cooling and the lighting was lower than expected. Also the heating is worse than baseline. I assume this is because they are using heatpumps and the setpoint is all the way up to 72F.
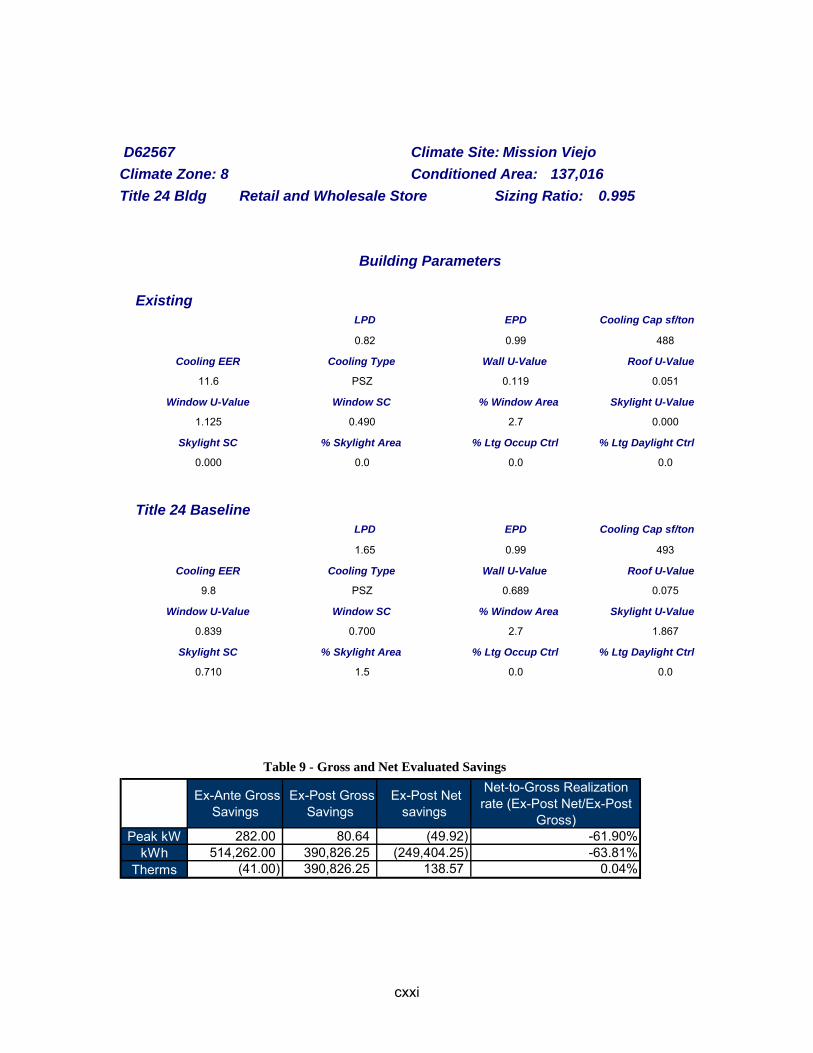
cxxi
D62567 Climate Site: Mission Viejo Climate Zone: 8 Conditioned Area: 137,016 Title 24 Bldg Retail and Wholesale Store Sizing Ratio: 0.995
Building Parameters
Existing LPD EPD Cooling Cap sf/ton 0.82 0.99 488 Cooling EER Cooling Type Wall U-Value Roof U-Value 11.6 PSZ 0.119 0.051 Window U-Value Window SC % Window Area Skylight U-Value 1.125 0.490 2.7 0.000 Skylight SC % Skylight Area % Ltg Occup Ctrl % Ltg Daylight Ctrl 0.000 0.0 0.0 0.0
Title 24 Baseline LPD EPD Cooling Cap sf/ton 1.65 0.99 493 Cooling EER Cooling Type Wall U-Value Roof U-Value 9.8 PSZ 0.689 0.075 Window U-Value Window SC % Window Area Skylight U-Value 0.839 0.700 2.7 1.867 Skylight SC % Skylight Area % Ltg Occup Ctrl % Ltg Daylight Ctrl 0.710 1.5 0.0 0.0
Table 9 - Gross and Net Evaluated Savings
Ex-Ante Gross Savings
Ex-Post Gross Savings
Ex-Post Net savings
Net-to-Gross Realization rate (Ex-Post Net/Ex-Post
Gross)Peak kW 282.00 80.64 (49.92) -61.90%
kWh 514,262.00 390,826.25 (249,404.25) -63.81%Therms (41.00) 390,826.25 138.57 0.04%

cxxii
Building Overview Notes
-Actual Building Start-up in 2007 not 2005 as entered -For envelope, using U-values based on T-24 documents unless noted below. -Roof area for all dropped ceiling areas included in main sales floor roof area Results: values are in part due to a large amount of display lighting not accounted for in the initial estimates but were observed on site. The HVAC comprises a much smaller part of the kW savings in our model, but is accurate as entered. I suspect the baselines differ because we used an area definition of the spaces whereas the original estimates considers the entire store as one space type.
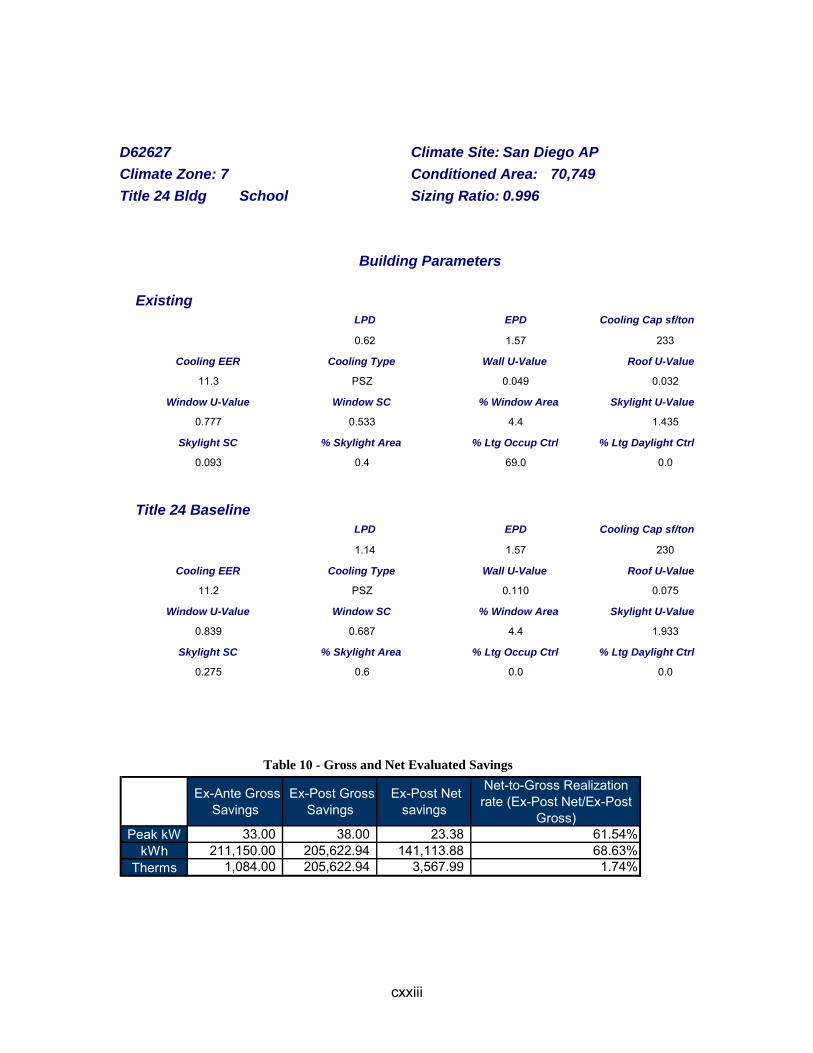
cxxiii
D62627 Climate Site: San Diego AP Climate Zone: 7 Conditioned Area: 70,749 Title 24 Bldg School Sizing Ratio: 0.996
Building Parameters
Existing LPD EPD Cooling Cap sf/ton 0.62 1.57 233 Cooling EER Cooling Type Wall U-Value Roof U-Value 11.3 PSZ 0.049 0.032 Window U-Value Window SC % Window Area Skylight U-Value 0.777 0.533 4.4 1.435 Skylight SC % Skylight Area % Ltg Occup Ctrl % Ltg Daylight Ctrl 0.093 0.4 69.0 0.0
Title 24 Baseline LPD EPD Cooling Cap sf/ton 1.14 1.57 230 Cooling EER Cooling Type Wall U-Value Roof U-Value 11.2 PSZ 0.110 0.075 Window U-Value Window SC % Window Area Skylight U-Value 0.839 0.687 4.4 1.933 Skylight SC % Skylight Area % Ltg Occup Ctrl % Ltg Daylight Ctrl 0.275 0.6 0.0 0.0
Table 10 - Gross and Net Evaluated Savings
Ex-Ante Gross Savings
Ex-Post Gross Savings
Ex-Post Net savings
Net-to-Gross Realization rate (Ex-Post Net/Ex-Post
Gross)Peak kW 33.00 38.00 23.38 61.54%
kWh 211,150.00 205,622.94 141,113.88 68.63%Therms 1,084.00 205,622.94 3,567.99 1.74%

cxxiv
Building Overview Notes
-Model # for HVAC system onsite do not match those given in file. Refer to pictures. -Dimensions for windows in all buildings are taken from plans Limited ability to take plug loads. Personnel did not have access to all areas. Estimates are based on a few rooms that were accessible, and from values based on similar buildings. Actual packaged systems found onsite differ slightly in their cooling efficiencies. In addition, the actual number of units and configurations on each building differ vastly from what was proposed. There is a substantial increase in the tonnage of cooling supplied to each building. Furthermore, the overall cooling efficiency found on site is a marginal improvement (11.3EER versus 11.2EER) to T24.
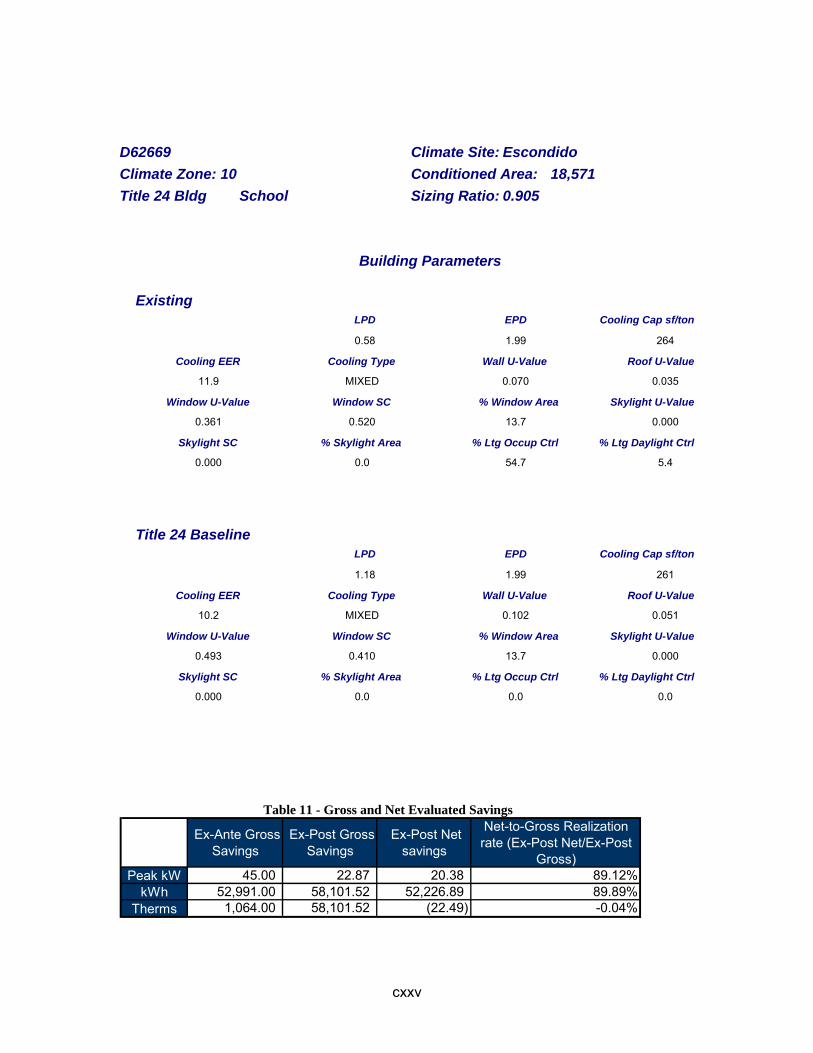
cxxv
D62669 Climate Site: Escondido Climate Zone: 10 Conditioned Area: 18,571 Title 24 Bldg School Sizing Ratio: 0.905
Building Parameters
Existing LPD EPD Cooling Cap sf/ton 0.58 1.99 264 Cooling EER Cooling Type Wall U-Value Roof U-Value 11.9 MIXED 0.070 0.035 Window U-Value Window SC % Window Area Skylight U-Value 0.361 0.520 13.7 0.000 Skylight SC % Skylight Area % Ltg Occup Ctrl % Ltg Daylight Ctrl 0.000 0.0 54.7 5.4
Title 24 Baseline LPD EPD Cooling Cap sf/ton 1.18 1.99 261 Cooling EER Cooling Type Wall U-Value Roof U-Value 10.2 MIXED 0.102 0.051 Window U-Value Window SC % Window Area Skylight U-Value 0.493 0.410 13.7 0.000 Skylight SC % Skylight Area % Ltg Occup Ctrl % Ltg Daylight Ctrl 0.000 0.0 0.0 0.0
Table 11 - Gross and Net Evaluated Savings
Ex-Ante Gross Savings
Ex-Post Gross Savings
Ex-Post Net savings
Net-to-Gross Realization rate (Ex-Post Net/Ex-Post
Gross)Peak kW 45.00 22.87 20.38 89.12%
kWh 52,991.00 58,101.52 52,226.89 89.89%Therms 1,064.00 58,101.52 (22.49) -0.04%

cxxvi
D62692 Climate Site: San Diego AP Climate Zone: 7 Conditioned Area: 69,225 Title 24 Bldg Medical/Clinical Sizing Ratio: 1.108
Building Parameters
Existing LPD EPD Cooling Cap sf/ton 0.84 9.16 269 Cooling EER Cooling Type Wall U-Value Roof U-Value 12.3 0.124 0.037 Window U-Value Window SC % Window Area Skylight U-Value 0.466 0.321 37.1 0.000 Skylight SC % Skylight Area % Ltg Occup Ctrl % Ltg Daylight Ctrl 0.000 0.0 31.7 0.0
Title 24 Baseline LPD EPD Cooling Cap sf/ton 1.13 9.16 141 Cooling EER Cooling Type Wall U-Value Roof U-Value 17.3 0.430 0.075 Window U-Value Window SC % Window Area Skylight U-Value 0.839 0.487 37.1 1.885 Skylight SC % Skylight Area % Ltg Occup Ctrl % Ltg Daylight Ctrl 0.890 1.3 0.0 0.0
Table 12 - Gross and Net Evaluated Savings
Ex-Ante Gross Savings
Ex-Post Gross Savings
Ex-Post Net savings
Net-to-Gross Realization rate (Ex-Post Net/Ex-Post
Gross)Peak kW 125.00 (35.12) (15.21) 43.31%
kWh 596,739.00 (98,733.00) (50,857.25) 51.51%Therms 52,159.00 (98,733.00) 694.82 -0.70%

cxxvii
Building Overview Notes -Completely surveyed first floor and used plug in and lighting loads for second floor. Per facilities manager, composition of first and second floor are the same. -R-value assumed from T-24 documents (walls=15.5, roof=24), window u-factor based on # of panes and presence of lowE coating, SHGC=.29, otherwise from T-24 documents.

cxxviii
D62736 Climate Site: San Diego AP Climate Zone: 7 Conditioned Area: 128,611 Title 24 Bldg General C&I Work Sizing Ratio: 1.103
Building Parameters
Existing LPD EPD Cooling Cap sf/ton 0.78 5.11 222 Cooling EER Cooling Type Wall U-Value Roof U-Value 21.1 0.101 0.038 Window U-Value Window SC % Window Area Skylight U-Value 1.227 0.340 19.7 2.462 Skylight SC % Skylight Area % Ltg Occup Ctrl % Ltg Daylight Ctrl 0.570 2.1 31.6 0.0
Title 24 Baseline LPD EPD Cooling Cap sf/ton 1.34 5.11 228 Cooling EER Cooling Type Wall U-Value Roof U-Value 17.3 0.689 0.077 Window U-Value Window SC % Window Area Skylight U-Value 0.883 0.450 19.7 1.578 Skylight SC % Skylight Area % Ltg Occup Ctrl % Ltg Daylight Ctrl 0.710 2.1 0.0 0.0
Table 13 - Gross and Net Evaluated Savings
Ex-Ante Gross Savings
Ex-Post Gross Savings
Ex-Post Net savings
Net-to-Gross Realization rate (Ex-Post Net/Ex-Post
Gross)Peak kW 174.00 117.00 107.13 91.57%
kWh 386,529.00 303,779.50 271,761.00 89.46%Therms 1,512.00 303,779.50 1,845.32 0.61%

cxxix
D62744 Climate Site: Escondido Climate Zone: 10 Conditioned Area: 11,659 Title 24 Bldg Retail and Wholesale Store Sizing Ratio: 0.967
Building Parameters
Existing LPD EPD Cooling Cap sf/ton 0.83 2.12 284 Cooling EER Cooling Type Wall U-Value Roof U-Value 11.3 PSZ 0.094 0.064 Window U-Value Window SC % Window Area Skylight U-Value 0.370 0.841 21.3 0.000 Skylight SC % Skylight Area % Ltg Occup Ctrl % Ltg Daylight Ctrl 0.000 0.0 21.9 0.0
Title 24 Baseline LPD EPD Cooling Cap sf/ton 1.13 2.12 282 Cooling EER Cooling Type Wall U-Value Roof U-Value 11.0 PSZ 0.102 0.051 Window U-Value Window SC % Window Area Skylight U-Value 0.493 0.392 21.3 0.000 Skylight SC % Skylight Area % Ltg Occup Ctrl % Ltg Daylight Ctrl 0.000 0.0 0.0 0.0
Table 14 - Gross and Net Evaluated Savings
Ex-Ante Gross Savings
Ex-Post Gross Savings
Ex-Post Net savings
Net-to-Gross Realization rate (Ex-Post Net/Ex-Post
Gross)Peak kW 5.00 3.14 1.67 53.12%
kWh 21,408.00 13,393.89 7,193.30 53.71%Therms (139.00) 13,393.89 (8.32) -0.06%
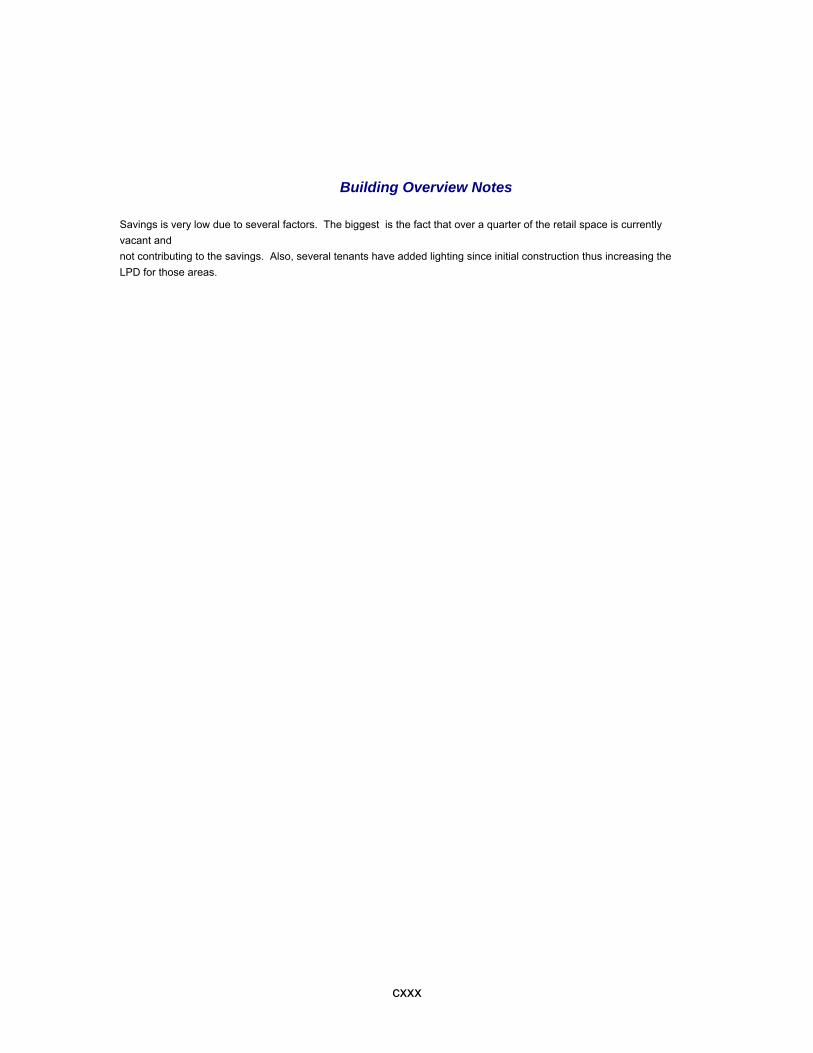
cxxx
Building Overview Notes Savings is very low due to several factors. The biggest is the fact that over a quarter of the retail space is currently vacant and not contributing to the savings. Also, several tenants have added lighting since initial construction thus increasing the LPD for those areas.
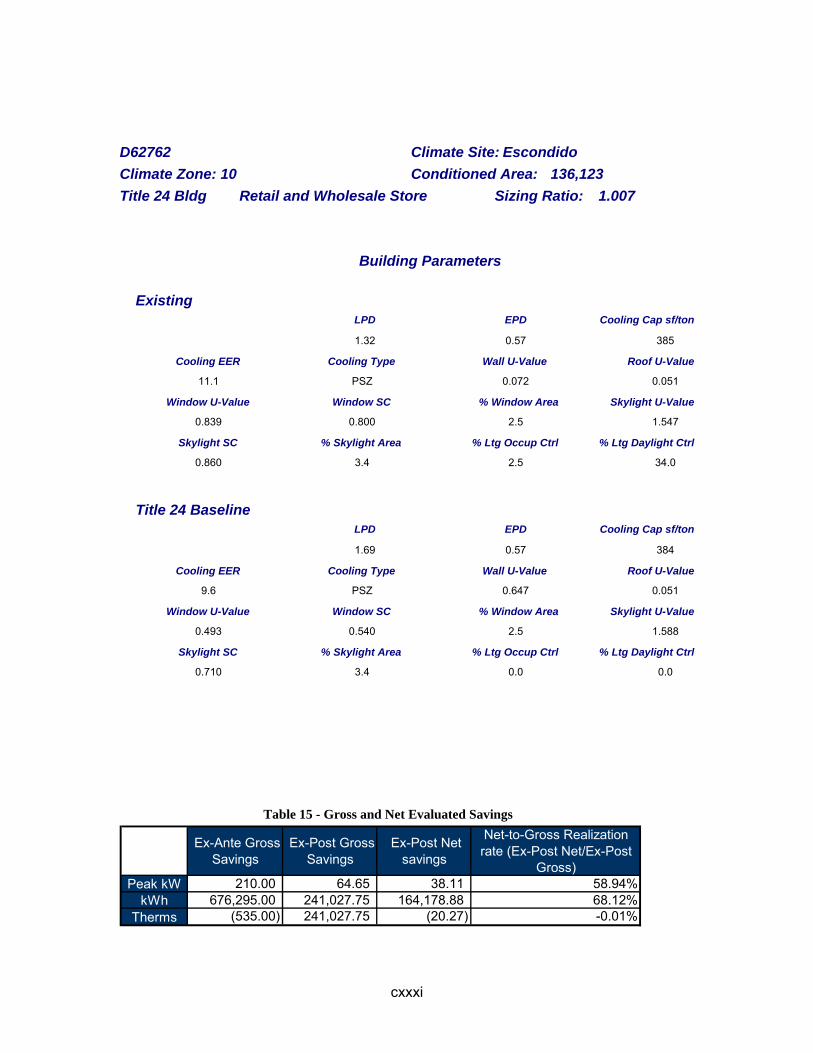
cxxxi
D62762 Climate Site: Escondido Climate Zone: 10 Conditioned Area: 136,123 Title 24 Bldg Retail and Wholesale Store Sizing Ratio: 1.007
Building Parameters
Existing LPD EPD Cooling Cap sf/ton 1.32 0.57 385 Cooling EER Cooling Type Wall U-Value Roof U-Value 11.1 PSZ 0.072 0.051 Window U-Value Window SC % Window Area Skylight U-Value 0.839 0.800 2.5 1.547 Skylight SC % Skylight Area % Ltg Occup Ctrl % Ltg Daylight Ctrl 0.860 3.4 2.5 34.0
Title 24 Baseline LPD EPD Cooling Cap sf/ton 1.69 0.57 384 Cooling EER Cooling Type Wall U-Value Roof U-Value 9.6 PSZ 0.647 0.051 Window U-Value Window SC % Window Area Skylight U-Value 0.493 0.540 2.5 1.588 Skylight SC % Skylight Area % Ltg Occup Ctrl % Ltg Daylight Ctrl 0.710 3.4 0.0 0.0
Table 15 - Gross and Net Evaluated Savings
Ex-Ante Gross Savings
Ex-Post Gross Savings
Ex-Post Net savings
Net-to-Gross Realization rate (Ex-Post Net/Ex-Post
Gross)Peak kW 210.00 64.65 38.11 58.94%
kWh 676,295.00 241,027.75 164,178.88 68.12%Therms (535.00) 241,027.75 (20.27) -0.01%
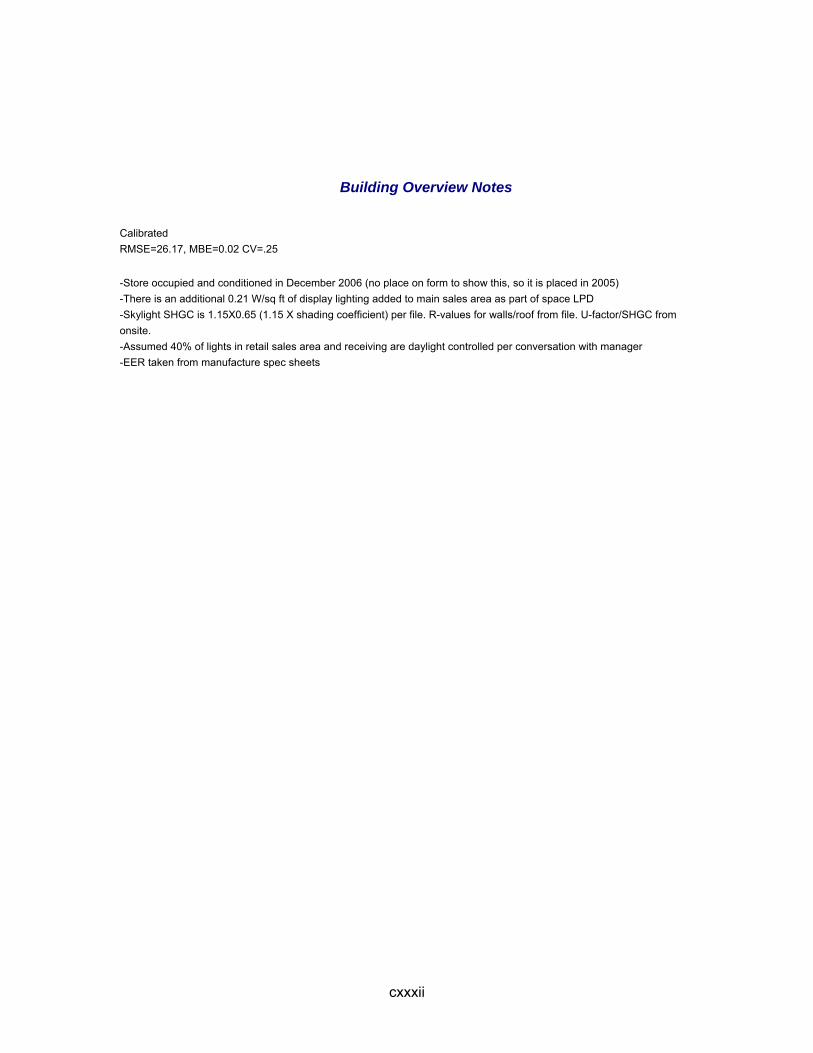
cxxxii
Building Overview Notes
Calibrated RMSE=26.17, MBE=0.02 CV=.25 -Store occupied and conditioned in December 2006 (no place on form to show this, so it is placed in 2005) -There is an additional 0.21 W/sq ft of display lighting added to main sales area as part of space LPD -Skylight SHGC is 1.15X0.65 (1.15 X shading coefficient) per file. R-values for walls/roof from file. U-factor/SHGC from onsite. -Assumed 40% of lights in retail sales area and receiving are daylight controlled per conversation with manager -EER taken from manufacture spec sheets
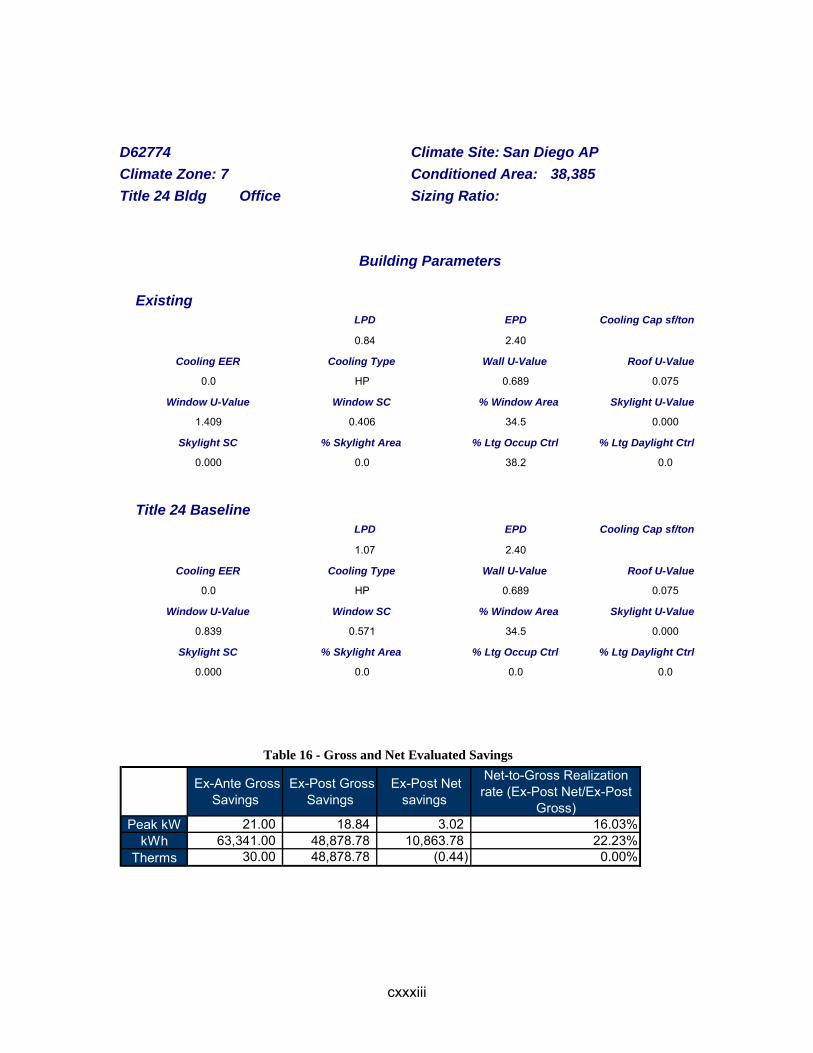
cxxxiii
D62774 Climate Site: San Diego AP Climate Zone: 7 Conditioned Area: 38,385 Title 24 Bldg Office Sizing Ratio:
Building Parameters
Existing LPD EPD Cooling Cap sf/ton 0.84 2.40 Cooling EER Cooling Type Wall U-Value Roof U-Value 0.0 HP 0.689 0.075 Window U-Value Window SC % Window Area Skylight U-Value 1.409 0.406 34.5 0.000 Skylight SC % Skylight Area % Ltg Occup Ctrl % Ltg Daylight Ctrl 0.000 0.0 38.2 0.0
Title 24 Baseline LPD EPD Cooling Cap sf/ton 1.07 2.40 Cooling EER Cooling Type Wall U-Value Roof U-Value 0.0 HP 0.689 0.075 Window U-Value Window SC % Window Area Skylight U-Value 0.839 0.571 34.5 0.000 Skylight SC % Skylight Area % Ltg Occup Ctrl % Ltg Daylight Ctrl 0.000 0.0 0.0 0.0
Table 16 - Gross and Net Evaluated Savings
Ex-Ante Gross Savings
Ex-Post Gross Savings
Ex-Post Net savings
Net-to-Gross Realization rate (Ex-Post Net/Ex-Post
Gross)Peak kW 21.00 18.84 3.02 16.03%
kWh 63,341.00 48,878.78 10,863.78 22.23%Therms 30.00 48,878.78 (0.44) 0.00%
cxxxiv
Building Overview Notes
Data Entry Notes: -Occupancy/air conditioning began June 06 -Specifications for heat pumps are from manufacturer. Note that EER, COP, tonnage used by utilities differ substantially. -Cooling tower fan incented for a 93% efficiency motor but found only a 91% efficiency motor. -Model entered as surveyed.

cxxxv
D62797 Climate Site: San Diego AP Climate Zone: 7 Conditioned Area: 65,314 Title 24 Bldg General C&I Work Sizing Ratio: 0.600
Building Parameters
Existing LPD EPD Cooling Cap sf/ton 0.93 15.15 114 Cooling EER Cooling Type Wall U-Value Roof U-Value 20.1 0.148 0.075 Window U-Value Window SC % Window Area Skylight U-Value 0.777 0.215 41.2 0.000 Skylight SC % Skylight Area % Ltg Occup Ctrl % Ltg Daylight Ctrl 0.000 0.0 0.0 0.0
Title 24 Baseline LPD EPD Cooling Cap sf/ton 1.26 15.15 114 Cooling EER Cooling Type Wall U-Value Roof U-Value 17.6 0.689 0.075 Window U-Value Window SC % Window Area Skylight U-Value 0.839 0.411 41.2 0.000 Skylight SC % Skylight Area % Ltg Occup Ctrl % Ltg Daylight Ctrl 0.000 0.0 0.0 0.0
Table 17 - Gross and Net Evaluated Savings
Ex-Ante Gross Savings
Ex-Post Gross Savings
Ex-Post Net savings
Net-to-Gross Realization rate (Ex-Post Net/Ex-Post
Gross)Peak kW 147.00 69.25 96.36 139.16%
kWh 762,569.00 565,015.00 779,887.13 138.03%Therms 58,319.00 565,015.00 16,557.50 2.93%
cxxxvi
Building Overview Notes Data entry complete, model runs. Lighting, cooling and ventilation looks OK The site includes fume hoods Program file says 3 HWP, but only 1 installed
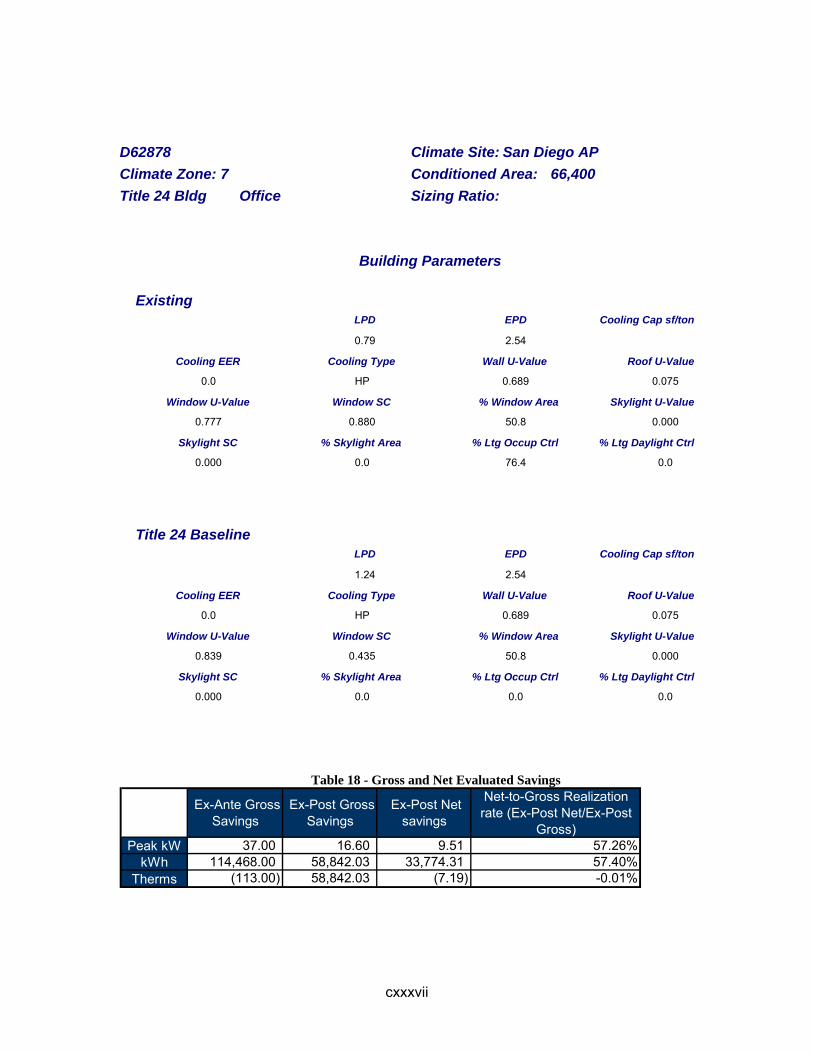
cxxxvii
D62878 Climate Site: San Diego AP Climate Zone: 7 Conditioned Area: 66,400 Title 24 Bldg Office Sizing Ratio:
Building Parameters
Existing LPD EPD Cooling Cap sf/ton 0.79 2.54 Cooling EER Cooling Type Wall U-Value Roof U-Value 0.0 HP 0.689 0.075 Window U-Value Window SC % Window Area Skylight U-Value 0.777 0.880 50.8 0.000 Skylight SC % Skylight Area % Ltg Occup Ctrl % Ltg Daylight Ctrl 0.000 0.0 76.4 0.0
Title 24 Baseline LPD EPD Cooling Cap sf/ton 1.24 2.54 Cooling EER Cooling Type Wall U-Value Roof U-Value 0.0 HP 0.689 0.075 Window U-Value Window SC % Window Area Skylight U-Value 0.839 0.435 50.8 0.000 Skylight SC % Skylight Area % Ltg Occup Ctrl % Ltg Daylight Ctrl 0.000 0.0 0.0 0.0
Table 18 - Gross and Net Evaluated Savings
Ex-Ante Gross Savings
Ex-Post Gross Savings
Ex-Post Net savings
Net-to-Gross Realization rate (Ex-Post Net/Ex-Post
Gross)Peak kW 37.00 16.60 9.51 57.26%
kWh 114,468.00 58,842.03 33,774.31 57.40%Therms (113.00) 58,842.03 (7.19) -0.01%
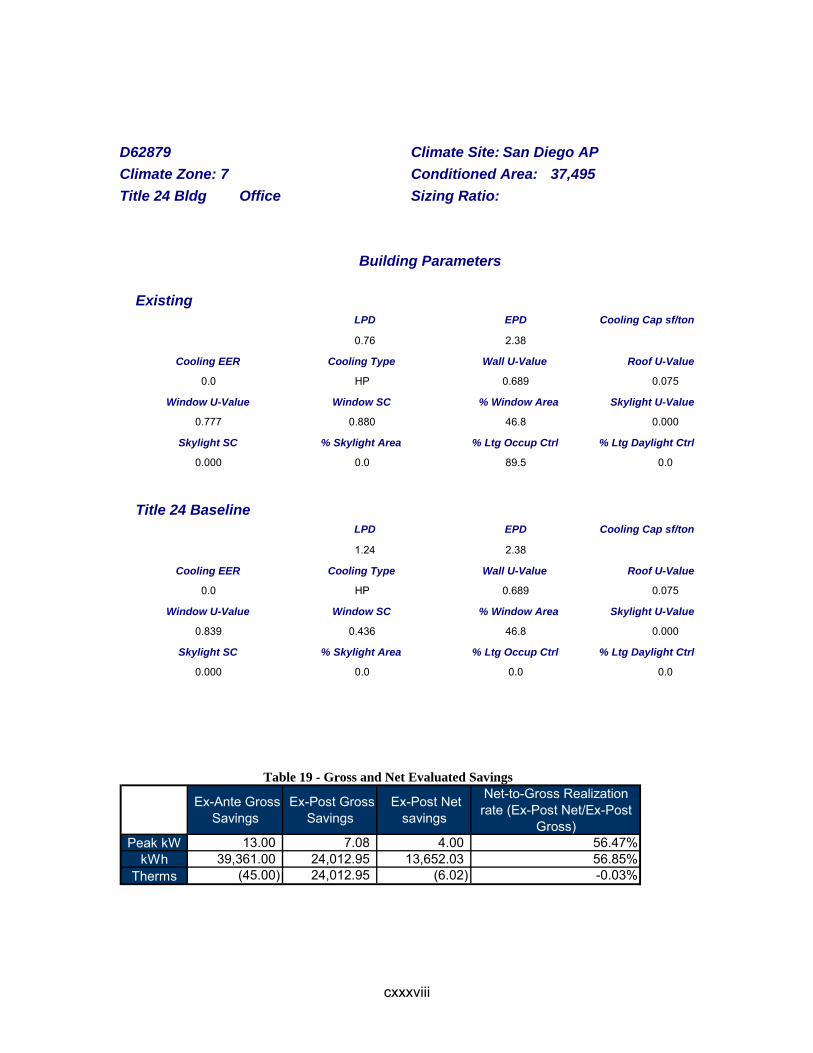
cxxxviii
D62879 Climate Site: San Diego AP Climate Zone: 7 Conditioned Area: 37,495 Title 24 Bldg Office Sizing Ratio:
Building Parameters
Existing LPD EPD Cooling Cap sf/ton 0.76 2.38 Cooling EER Cooling Type Wall U-Value Roof U-Value 0.0 HP 0.689 0.075 Window U-Value Window SC % Window Area Skylight U-Value 0.777 0.880 46.8 0.000 Skylight SC % Skylight Area % Ltg Occup Ctrl % Ltg Daylight Ctrl 0.000 0.0 89.5 0.0
Title 24 Baseline LPD EPD Cooling Cap sf/ton 1.24 2.38 Cooling EER Cooling Type Wall U-Value Roof U-Value 0.0 HP 0.689 0.075 Window U-Value Window SC % Window Area Skylight U-Value 0.839 0.436 46.8 0.000 Skylight SC % Skylight Area % Ltg Occup Ctrl % Ltg Daylight Ctrl 0.000 0.0 0.0 0.0
Table 19 - Gross and Net Evaluated Savings
Ex-Ante Gross Savings
Ex-Post Gross Savings
Ex-Post Net savings
Net-to-Gross Realization rate (Ex-Post Net/Ex-Post
Gross)Peak kW 13.00 7.08 4.00 56.47%
kWh 39,361.00 24,012.95 13,652.03 56.85%Therms (45.00) 24,012.95 (6.02) -0.03%
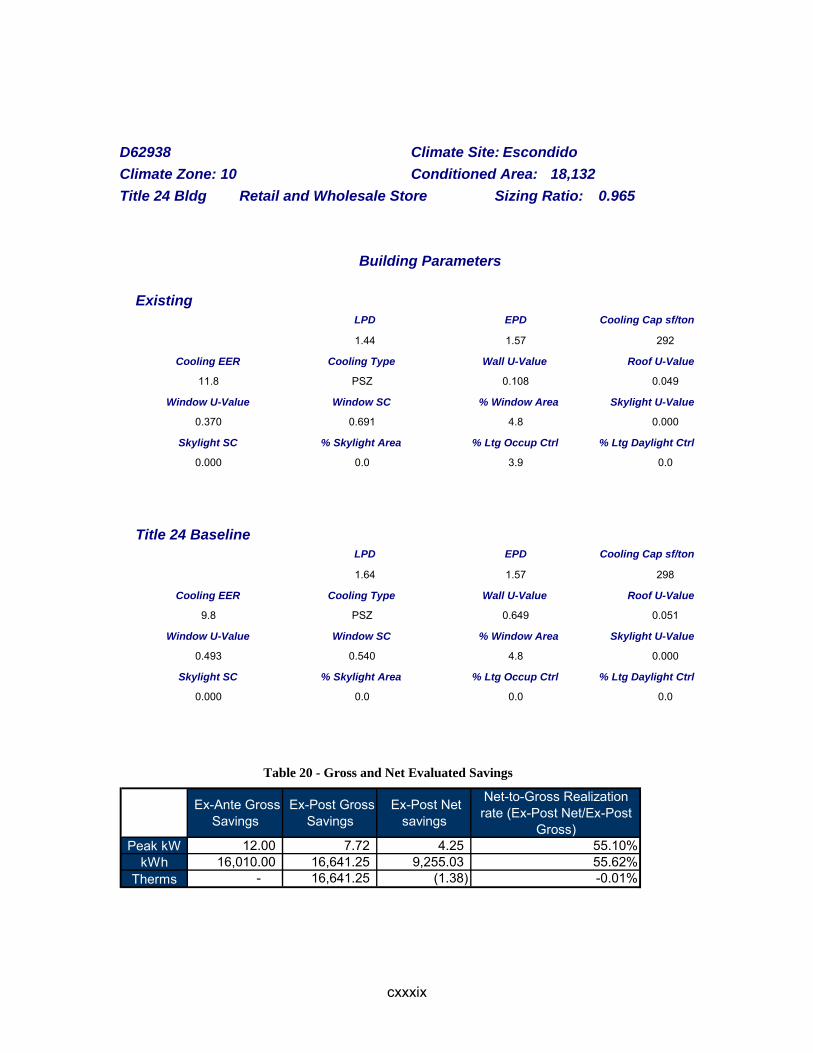
cxxxix
D62938 Climate Site: Escondido Climate Zone: 10 Conditioned Area: 18,132 Title 24 Bldg Retail and Wholesale Store Sizing Ratio: 0.965
Building Parameters
Existing LPD EPD Cooling Cap sf/ton 1.44 1.57 292 Cooling EER Cooling Type Wall U-Value Roof U-Value 11.8 PSZ 0.108 0.049 Window U-Value Window SC % Window Area Skylight U-Value 0.370 0.691 4.8 0.000 Skylight SC % Skylight Area % Ltg Occup Ctrl % Ltg Daylight Ctrl 0.000 0.0 3.9 0.0
Title 24 Baseline LPD EPD Cooling Cap sf/ton 1.64 1.57 298 Cooling EER Cooling Type Wall U-Value Roof U-Value 9.8 PSZ 0.649 0.051 Window U-Value Window SC % Window Area Skylight U-Value 0.493 0.540 4.8 0.000 Skylight SC % Skylight Area % Ltg Occup Ctrl % Ltg Daylight Ctrl 0.000 0.0 0.0 0.0
Table 20 - Gross and Net Evaluated Savings
Ex-Ante Gross Savings
Ex-Post Gross Savings
Ex-Post Net savings
Net-to-Gross Realization rate (Ex-Post Net/Ex-Post
Gross)Peak kW 12.00 7.72 4.25 55.10%
kWh 16,010.00 16,641.25 9,255.03 55.62%Therms - 16,641.25 (1.38) -0.01%
cxl
Building Overview Notes
The site contact only had one set of as builts and they were less than thorough. Project file was pretty slim as well. The measure savings is right on but the realization rate is extremely high. This is most likely because the proposed LPD was higher than the allowable lpd. Accordiing to the lighting as-builts and our thorough lighting inventory the LPD was 1.46 compared to the 1.55 allowed. This most likely caused a significant increase compared to the minimal savings gained from the HVAC savings.
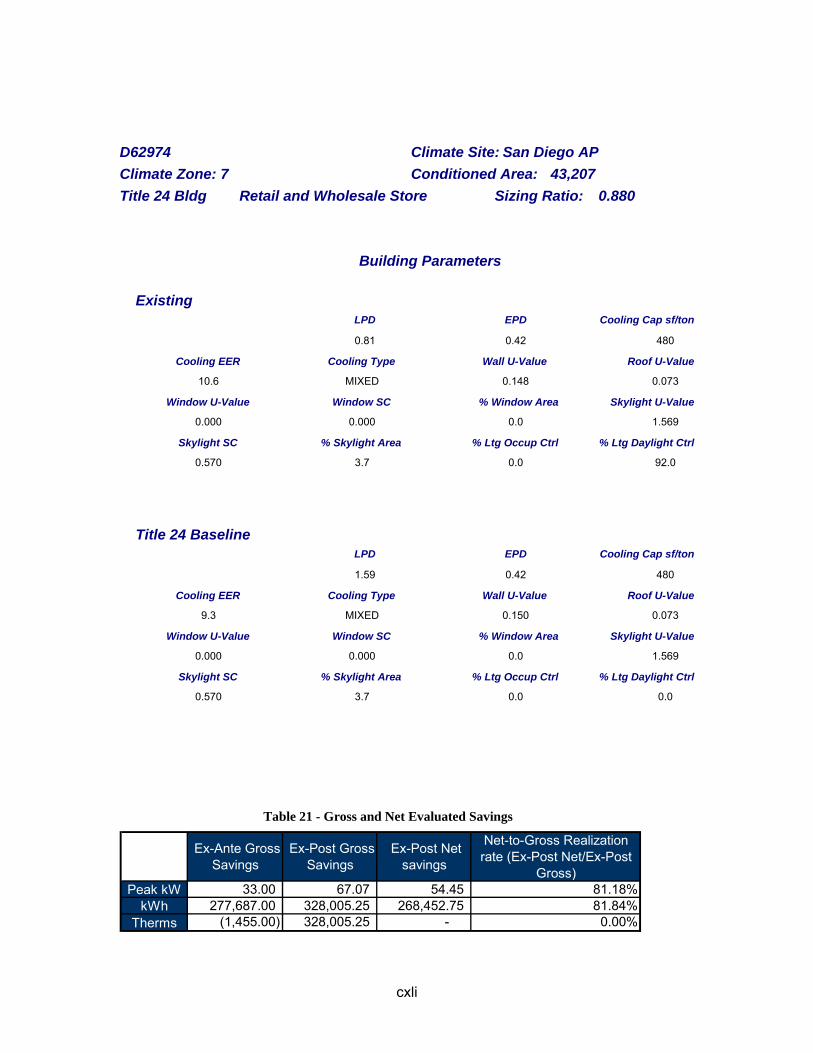
cxli
D62974 Climate Site: San Diego AP Climate Zone: 7 Conditioned Area: 43,207 Title 24 Bldg Retail and Wholesale Store Sizing Ratio: 0.880
Building Parameters
Existing LPD EPD Cooling Cap sf/ton 0.81 0.42 480 Cooling EER Cooling Type Wall U-Value Roof U-Value 10.6 MIXED 0.148 0.073 Window U-Value Window SC % Window Area Skylight U-Value 0.000 0.000 0.0 1.569 Skylight SC % Skylight Area % Ltg Occup Ctrl % Ltg Daylight Ctrl 0.570 3.7 0.0 92.0
Title 24 Baseline LPD EPD Cooling Cap sf/ton 1.59 0.42 480 Cooling EER Cooling Type Wall U-Value Roof U-Value 9.3 MIXED 0.150 0.073 Window U-Value Window SC % Window Area Skylight U-Value 0.000 0.000 0.0 1.569 Skylight SC % Skylight Area % Ltg Occup Ctrl % Ltg Daylight Ctrl 0.570 3.7 0.0 0.0
Table 21 - Gross and Net Evaluated Savings
Ex-Ante Gross Savings
Ex-Post Gross Savings
Ex-Post Net savings
Net-to-Gross Realization rate (Ex-Post Net/Ex-Post
Gross)Peak kW 33.00 67.07 54.45 81.18%
kWh 277,687.00 328,005.25 268,452.75 81.84%Therms (1,455.00) 328,005.25 - 0.00%
cxlii
Building Overview Notes
This was a retrofit of an old warehouse. The entire building is 92,000 sf but Restaurant Depot only occupies just over 60k of the building. They are leasing their location. They have separate meters but I couldn't find the meter and the site contact there had no idea where it was either. They began operation at the facitlity in September of 2006 not June.

cxliii
D62980 Climate Site: Oceanside Climate Zone: 7 Conditioned Area: 28,977 Title 24 Bldg Grocery Store Sizing Ratio:
Building Parameters
Existing LPD EPD Cooling Cap sf/ton 1.31 2.07 307 Cooling EER Cooling Type Wall U-Value Roof U-Value 10.8 PVAV 0.148 0.048 Window U-Value Window SC % Window Area Skylight U-Value 0.370 0.880 6.0 1.302 Skylight SC % Skylight Area % Ltg Occup Ctrl % Ltg Daylight Ctrl 0.490 3.5 0.0 0.0
Title 24 Baseline LPD EPD Cooling Cap sf/ton 1.47 2.07 507 Cooling EER Cooling Type Wall U-Value Roof U-Value 9.5 PVAV 0.689 0.075 Window U-Value Window SC % Window Area Skylight U-Value 0.839 0.700 6.0 1.933 Skylight SC % Skylight Area % Ltg Occup Ctrl % Ltg Daylight Ctrl 0.710 3.5 0.0 0.0
Table 22 - Gross and Net Evaluated Savings
Ex-Ante Gross Savings
Ex-Post Gross Savings
Ex-Post Net savings
Net-to-Gross Realization rate (Ex-Post Net/Ex-Post
Gross)Peak kW 37.00 22.97 18.78 81.77%
kWh 284,264.00 196,022.88 179,320.13 91.48%Therms (7,269.00) 196,022.88 153.93 0.08%
cxliv
Building Overview Notes The lighting measures savings is low for two reasons. The main is that the daylighting controls measure is not being implemented. I ran the model with 100% of the controls working and the lighting only T24 savings was 10,604. The Lighting measures only savings was 14,790. Without both numbers are -8k or around there. The second reason for the poor lighting savings is that the baseline LPD for a grocery store is less than the 1.60 w/sf that's perscribed in the baseline. The refrigerant and cooling savings appear to be ok.
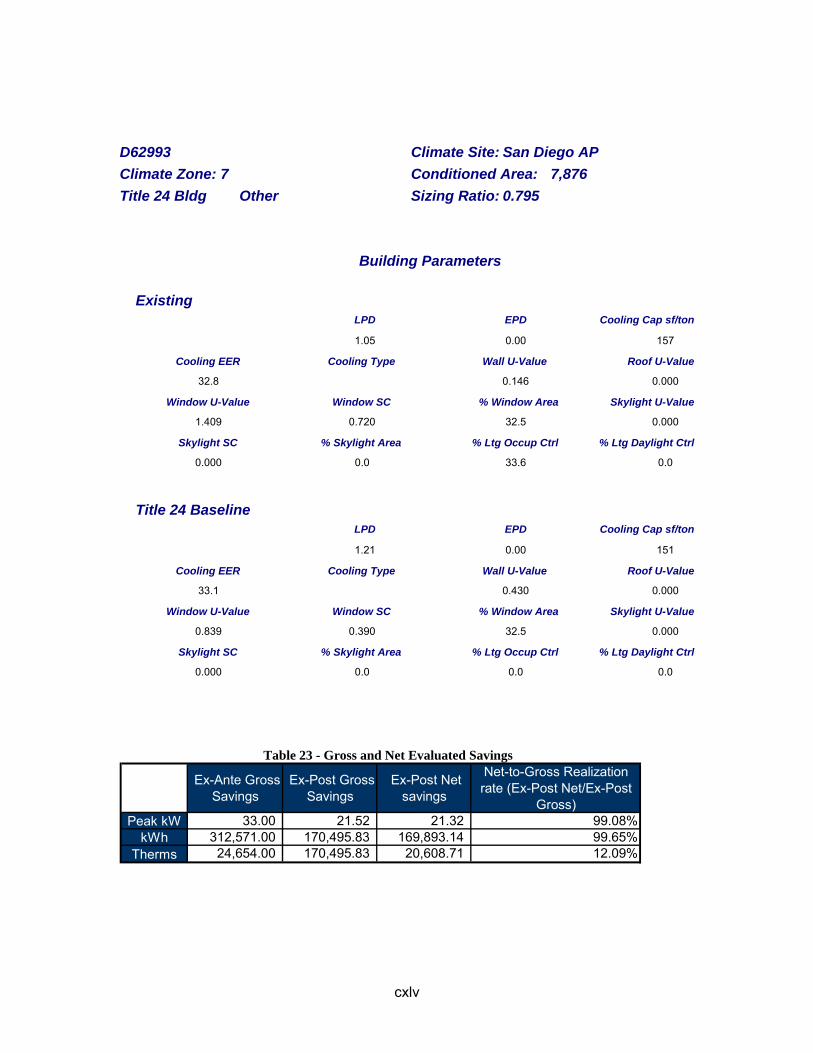
cxlv
D62993 Climate Site: San Diego AP Climate Zone: 7 Conditioned Area: 7,876 Title 24 Bldg Other Sizing Ratio: 0.795
Building Parameters
Existing LPD EPD Cooling Cap sf/ton 1.05 0.00 157 Cooling EER Cooling Type Wall U-Value Roof U-Value 32.8 0.146 0.000 Window U-Value Window SC % Window Area Skylight U-Value 1.409 0.720 32.5 0.000 Skylight SC % Skylight Area % Ltg Occup Ctrl % Ltg Daylight Ctrl 0.000 0.0 33.6 0.0
Title 24 Baseline LPD EPD Cooling Cap sf/ton 1.21 0.00 151 Cooling EER Cooling Type Wall U-Value Roof U-Value 33.1 0.430 0.000 Window U-Value Window SC % Window Area Skylight U-Value 0.839 0.390 32.5 0.000 Skylight SC % Skylight Area % Ltg Occup Ctrl % Ltg Daylight Ctrl 0.000 0.0 0.0 0.0
Table 23 - Gross and Net Evaluated Savings
Ex-Ante Gross Savings
Ex-Post Gross Savings
Ex-Post Net savings
Net-to-Gross Realization rate (Ex-Post Net/Ex-Post
Gross)Peak kW 33.00 21.52 21.32 99.08%
kWh 312,571.00 170,495.83 169,893.14 99.65%Therms 24,654.00 170,495.83 20,608.71 12.09%
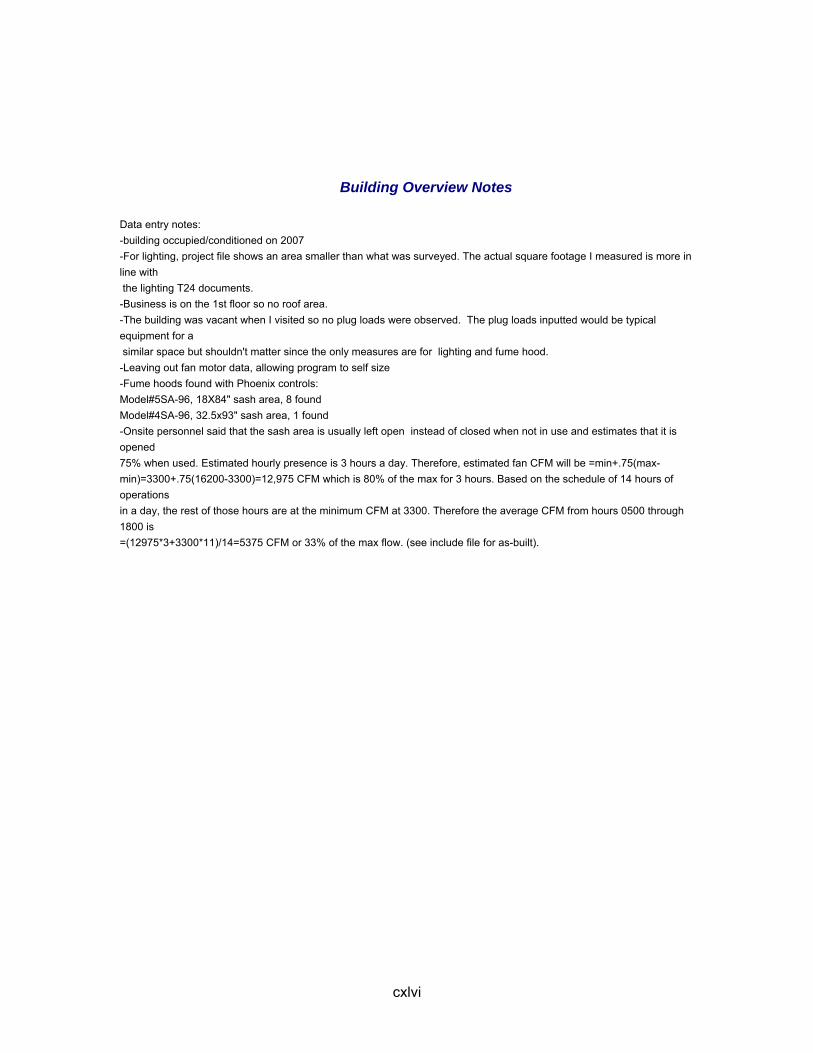
cxlvi
Building Overview Notes Data entry notes: -building occupied/conditioned on 2007 -For lighting, project file shows an area smaller than what was surveyed. The actual square footage I measured is more in line with the lighting T24 documents. -Business is on the 1st floor so no roof area. -The building was vacant when I visited so no plug loads were observed. The plug loads inputted would be typical equipment for a similar space but shouldn't matter since the only measures are for lighting and fume hood. -Leaving out fan motor data, allowing program to self size -Fume hoods found with Phoenix controls: Model#5SA-96, 18X84" sash area, 8 found Model#4SA-96, 32.5x93" sash area, 1 found -Onsite personnel said that the sash area is usually left open instead of closed when not in use and estimates that it is opened 75% when used. Estimated hourly presence is 3 hours a day. Therefore, estimated fan CFM will be =min+.75(max- min)=3300+.75(16200-3300)=12,975 CFM which is 80% of the max for 3 hours. Based on the schedule of 14 hours of operations in a day, the rest of those hours are at the minimum CFM at 3300. Therefore the average CFM from hours 0500 through 1800 is =(12975*3+3300*11)/14=5375 CFM or 33% of the max flow. (see include file for as-built).

cxlvii
D62995 Climate Site: San Diego AP Climate Zone: 7 Conditioned Area: 11,746 Title 24 Bldg Retail and Wholesale Store Sizing Ratio: 0.855
Building Parameters
Existing LPD EPD Cooling Cap sf/ton 0.71 1.64 276 Cooling EER Cooling Type Wall U-Value Roof U-Value 12.0 PSZ 0.689 0.077 Window U-Value Window SC % Window Area Skylight U-Value 0.777 0.440 19.1 2.428 Skylight SC % Skylight Area % Ltg Occup Ctrl % Ltg Daylight Ctrl 1.000 1.4 0.0 0.0
Title 24 Baseline LPD EPD Cooling Cap sf/ton 1.77 1.64 270 Cooling EER Cooling Type Wall U-Value Roof U-Value 10.3 PSZ 0.689 0.077 Window U-Value Window SC % Window Area Skylight U-Value 0.883 0.473 19.1 1.554 Skylight SC % Skylight Area % Ltg Occup Ctrl % Ltg Daylight Ctrl 0.890 1.4 0.0 0.0
Table 24 - Gross and Net Evaluated Savings
Ex-Ante Gross Savings
Ex-Post Gross Savings
Ex-Post Net savings
Net-to-Gross Realization rate (Ex-Post Net/Ex-Post
Gross)Peak kW 18.00 14.37 8.53 59.32%
kWh 60,443.00 49,796.98 30,163.20 60.57%Therms (178.00) 49,796.98 (0.68) 0.00%
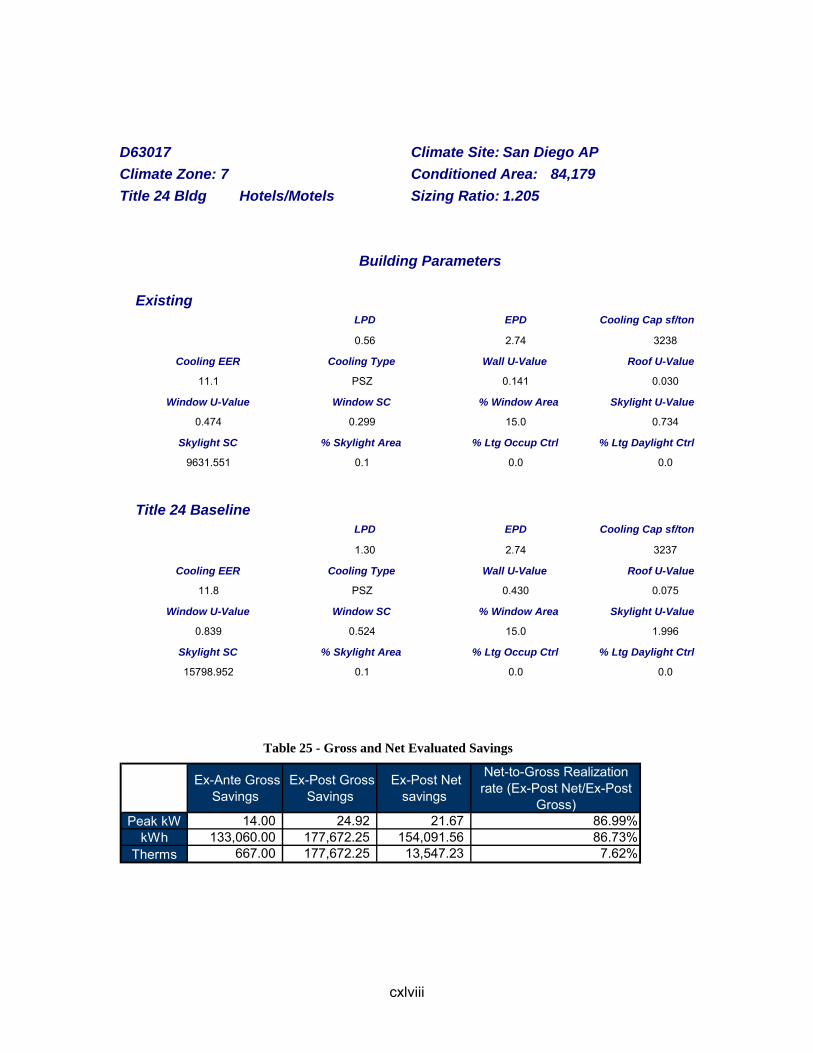
cxlviii
D63017 Climate Site: San Diego AP Climate Zone: 7 Conditioned Area: 84,179 Title 24 Bldg Hotels/Motels Sizing Ratio: 1.205
Building Parameters
Existing LPD EPD Cooling Cap sf/ton 0.56 2.74 3238 Cooling EER Cooling Type Wall U-Value Roof U-Value 11.1 PSZ 0.141 0.030 Window U-Value Window SC % Window Area Skylight U-Value 0.474 0.299 15.0 0.734 Skylight SC % Skylight Area % Ltg Occup Ctrl % Ltg Daylight Ctrl 9631.551 0.1 0.0 0.0
Title 24 Baseline LPD EPD Cooling Cap sf/ton 1.30 2.74 3237 Cooling EER Cooling Type Wall U-Value Roof U-Value 11.8 PSZ 0.430 0.075 Window U-Value Window SC % Window Area Skylight U-Value 0.839 0.524 15.0 1.996 Skylight SC % Skylight Area % Ltg Occup Ctrl % Ltg Daylight Ctrl 15798.952 0.1 0.0 0.0
Table 25 - Gross and Net Evaluated Savings
Ex-Ante Gross Savings
Ex-Post Gross Savings
Ex-Post Net savings
Net-to-Gross Realization rate (Ex-Post Net/Ex-Post
Gross)Peak kW 14.00 24.92 21.67 86.99%
kWh 133,060.00 177,672.25 154,091.56 86.73%Therms 667.00 177,672.25 13,547.23 7.62%
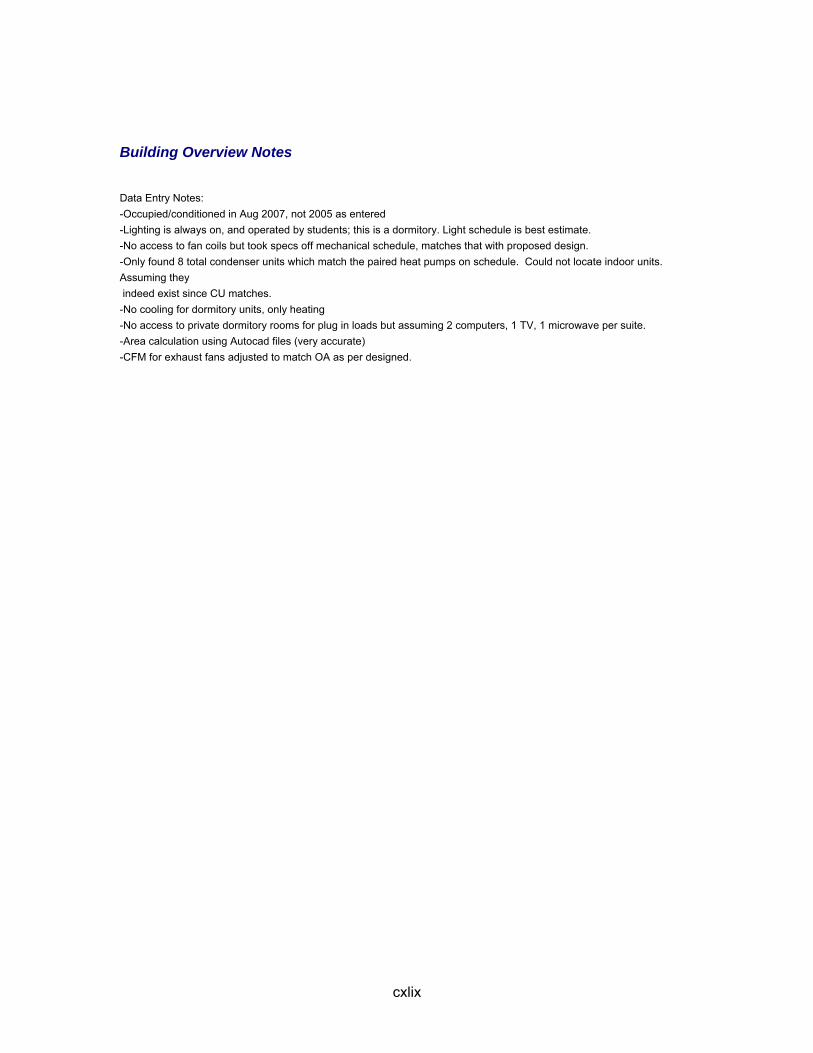
cxlix
Building Overview Notes
Data Entry Notes: -Occupied/conditioned in Aug 2007, not 2005 as entered -Lighting is always on, and operated by students; this is a dormitory. Light schedule is best estimate. -No access to fan coils but took specs off mechanical schedule, matches that with proposed design. -Only found 8 total condenser units which match the paired heat pumps on schedule. Could not locate indoor units. Assuming they indeed exist since CU matches. -No cooling for dormitory units, only heating -No access to private dormitory rooms for plug in loads but assuming 2 computers, 1 TV, 1 microwave per suite. -Area calculation using Autocad files (very accurate) -CFM for exhaust fans adjusted to match OA as per designed.

cl
D63028 Climate Site: San Diego AP Climate Zone: 7 Conditioned Area: 41,383 Title 24 Bldg Office Sizing Ratio: 3.694
Building Parameters
Existing LPD EPD Cooling Cap sf/ton 0.86 2.98 63 Cooling EER Cooling Type Wall U-Value Roof U-Value 26.4 PSZ 0.108 0.075 Window U-Value Window SC % Window Area Skylight U-Value 0.777 0.570 4.0 2.440 Skylight SC % Skylight Area % Ltg Occup Ctrl % Ltg Daylight Ctrl 1.000 9.8 89.7 0.0
Title 24 Baseline LPD EPD Cooling Cap sf/ton 1.06 2.98 63 Cooling EER Cooling Type Wall U-Value Roof U-Value 18.6 PSZ 0.108 0.075 Window U-Value Window SC % Window Area Skylight U-Value 0.777 0.570 4.0 1.922 Skylight SC % Skylight Area % Ltg Occup Ctrl % Ltg Daylight Ctrl 0.710 9.8 0.0 0.0
Table 26 - Gross and Net Evaluated Savings
Ex-Ante Gross Savings
Ex-Post Gross Savings
Ex-Post Net Savings
Net-to-Gross Realization Rate (Ex-Post Net/Ex-Post
Gross)Peak kW (5.00) 1.65 0.54 32.52%
kWh 136,404.00 122,835.91 106,219.75 86.47%Therms (34.00) 122,835.91 (12.39) -0.01%
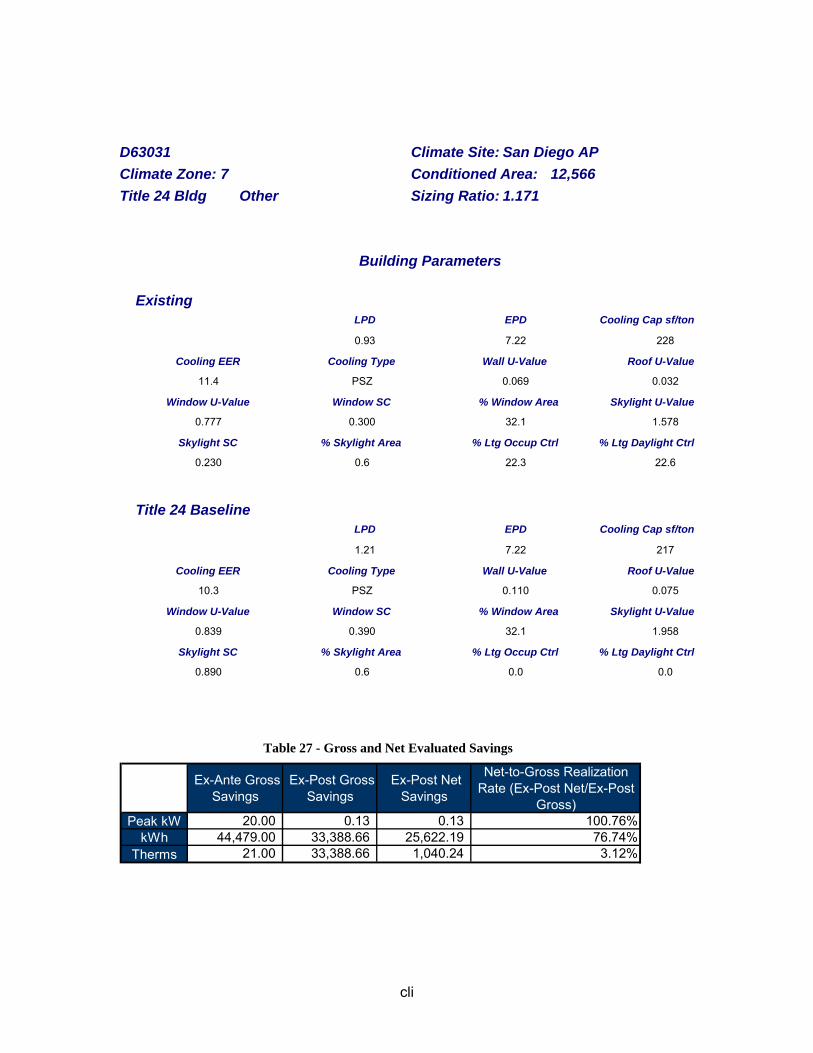
cli
D63031 Climate Site: San Diego AP Climate Zone: 7 Conditioned Area: 12,566 Title 24 Bldg Other Sizing Ratio: 1.171
Building Parameters
Existing LPD EPD Cooling Cap sf/ton 0.93 7.22 228 Cooling EER Cooling Type Wall U-Value Roof U-Value 11.4 PSZ 0.069 0.032 Window U-Value Window SC % Window Area Skylight U-Value 0.777 0.300 32.1 1.578 Skylight SC % Skylight Area % Ltg Occup Ctrl % Ltg Daylight Ctrl 0.230 0.6 22.3 22.6
Title 24 Baseline LPD EPD Cooling Cap sf/ton 1.21 7.22 217 Cooling EER Cooling Type Wall U-Value Roof U-Value 10.3 PSZ 0.110 0.075 Window U-Value Window SC % Window Area Skylight U-Value 0.839 0.390 32.1 1.958 Skylight SC % Skylight Area % Ltg Occup Ctrl % Ltg Daylight Ctrl 0.890 0.6 0.0 0.0
Table 27 - Gross and Net Evaluated Savings
Ex-Ante Gross Savings
Ex-Post Gross Savings
Ex-Post Net Savings
Net-to-Gross Realization Rate (Ex-Post Net/Ex-Post
Gross)Peak kW 20.00 0.13 0.13 100.76%
kWh 44,479.00 33,388.66 25,622.19 76.74%Therms 21.00 33,388.66 1,040.24 3.12%
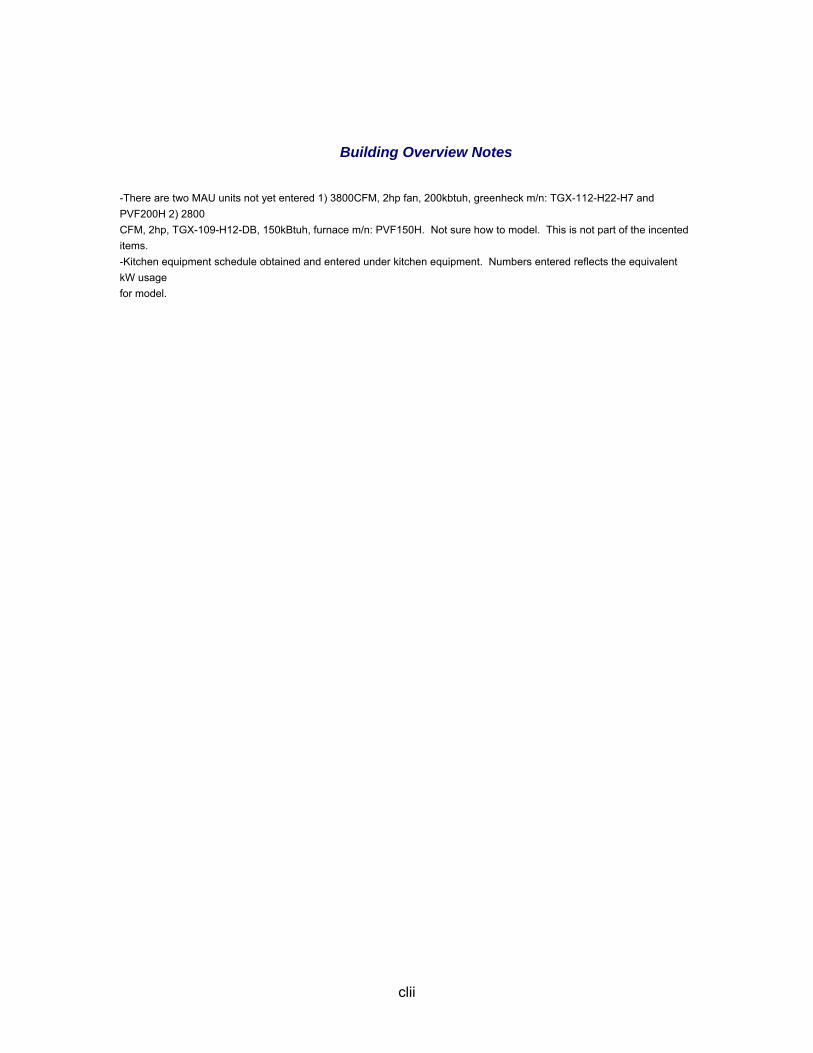
clii
Building Overview Notes
-There are two MAU units not yet entered 1) 3800CFM, 2hp fan, 200kbtuh, greenheck m/n: TGX-112-H22-H7 and PVF200H 2) 2800 CFM, 2hp, TGX-109-H12-DB, 150kBtuh, furnace m/n: PVF150H. Not sure how to model. This is not part of the incented items. -Kitchen equipment schedule obtained and entered under kitchen equipment. Numbers entered reflects the equivalent kW usage for model.

cliii
D63038 Climate Site: Poway Valley Climate Zone: 10 Conditioned Area: 14,329 Title 24 Bldg Retail and Wholesale Store Sizing Ratio: 0.955
Building Parameters
Existing LPD EPD Cooling Cap sf/ton 1.22 0.76 337 Cooling EER Cooling Type Wall U-Value Roof U-Value 10.9 PSZ 0.410 0.034 Window U-Value Window SC % Window Area Skylight U-Value 0.304 0.440 30.0 0.000 Skylight SC % Skylight Area % Ltg Occup Ctrl % Ltg Daylight Ctrl 0.000 0.0 55.9 0.0
Title 24 Baseline LPD EPD Cooling Cap sf/ton 1.39 0.76 337 Cooling EER Cooling Type Wall U-Value Roof U-Value 10.9 PSZ 0.649 0.051 Window U-Value Window SC % Window Area Skylight U-Value 0.493 0.360 30.0 0.000 Skylight SC % Skylight Area % Ltg Occup Ctrl % Ltg Daylight Ctrl 0.000 0.0 0.0 0.0
Table 28 - Gross and Net Evaluated Savings
Ex-Ante Gross Savings
Ex-Post Gross Savings
Ex-Post Net Savings
Net-to-Gross Realization Rate (Ex-Post Net/Ex-Post
Gross)Peak kW 27.00 2.24 2.14 95.41%
kWh 67,684.00 13,082.86 12,891.69 98.54%Therms (263.00) 13,082.86 - 0.00%

cliv
Building Overview Notes
Cooling is way under performing compared to the energy pro run. The as surveyed units are standard efficiency. All Packaged HVAC units found on roof were different than in the as built plans. Plans indicate use of Carrier units, Rheem units found on roof. > 80% of savings anticipated from space cooling. Model-IT results indicate a greater cooling kwh consumption than the title 24 baseline.... -All systems in Zone 3 given enthalpy economizers even though 2 of units were fixed OA control (AC1, HP-4) -Service center exhaust fans rolled into exterior equipment (Service center is unconditioned space, which causes the exhaust fans to be placed in another zone where exhaust air exceeds OA air) -All plug loads in unconditioned space rolled into "Exterior Equipment"
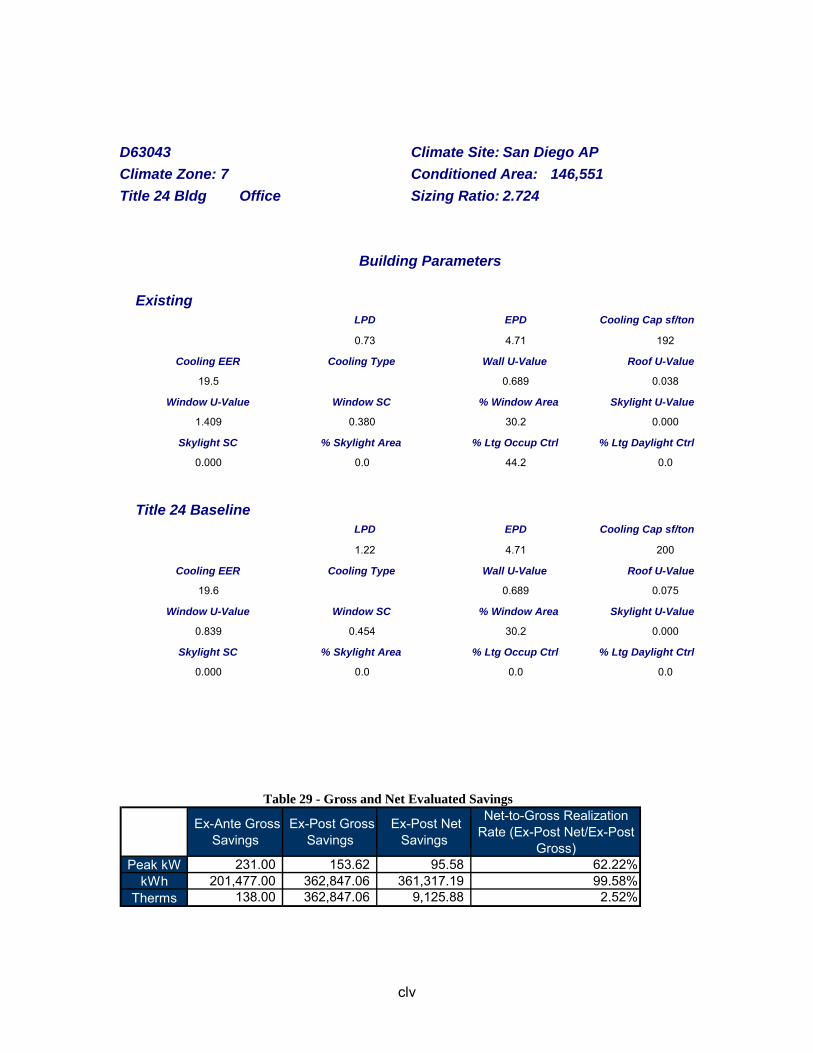
clv
D63043 Climate Site: San Diego AP Climate Zone: 7 Conditioned Area: 146,551 Title 24 Bldg Office Sizing Ratio: 2.724
Building Parameters
Existing LPD EPD Cooling Cap sf/ton 0.73 4.71 192 Cooling EER Cooling Type Wall U-Value Roof U-Value 19.5 0.689 0.038 Window U-Value Window SC % Window Area Skylight U-Value 1.409 0.380 30.2 0.000 Skylight SC % Skylight Area % Ltg Occup Ctrl % Ltg Daylight Ctrl 0.000 0.0 44.2 0.0
Title 24 Baseline LPD EPD Cooling Cap sf/ton 1.22 4.71 200 Cooling EER Cooling Type Wall U-Value Roof U-Value 19.6 0.689 0.075 Window U-Value Window SC % Window Area Skylight U-Value 0.839 0.454 30.2 0.000 Skylight SC % Skylight Area % Ltg Occup Ctrl % Ltg Daylight Ctrl 0.000 0.0 0.0 0.0
Table 29 - Gross and Net Evaluated Savings
Ex-Ante Gross Savings
Ex-Post Gross Savings
Ex-Post Net Savings
Net-to-Gross Realization Rate (Ex-Post Net/Ex-Post
Gross)Peak kW 231.00 153.62 95.58 62.22%
kWh 201,477.00 362,847.06 361,317.19 99.58%Therms 138.00 362,847.06 9,125.88 2.52%

clvi
D63073 Climate Site: San Diego AP Climate Zone: 7 Conditioned Area: 8,083 Title 24 Bldg Office Sizing Ratio: 1.143
Building Parameters
Existing LPD EPD Cooling Cap sf/ton 0.77 4.75 323 Cooling EER Cooling Type Wall U-Value Roof U-Value 11.6 MIXED 0.689 0.000 Window U-Value Window SC % Window Area Skylight U-Value 1.409 0.720 39.4 0.000 Skylight SC % Skylight Area % Ltg Occup Ctrl % Ltg Daylight Ctrl 0.000 0.0 31.3 0.0
Title 24 Baseline LPD EPD Cooling Cap sf/ton 1.20 4.75 323 Cooling EER Cooling Type Wall U-Value Roof U-Value 11.6 MIXED 0.689 0.000 Window U-Value Window SC % Window Area Skylight U-Value 1.409 0.720 39.4 0.000 Skylight SC % Skylight Area % Ltg Occup Ctrl % Ltg Daylight Ctrl 0.000 0.0 0.0 0.0
Table 30 - Gross and Net Evaluated Savings
Ex-Ante Gross Savings
Ex-Post Gross Savings
Ex-Post Net Savings
Net-to-Gross Realization Rate (Ex-Post Net/Ex-Post
Gross)Peak kW 4.00 3.30 1.26 38.08%
kWh 10,563.00 10,255.30 6,296.67 61.40%Therms - 10,255.30 (0.14) 0.00%

clvii
Building Overview Notes -2 (4'x2) T8 fixtures changed to 4 (4'x1) T8 fixtures to match exact wattage

clviii
D63187 Climate Site: San Diego AP Climate Zone: 7 Conditioned Area: 17,812 Title 24 Bldg Office Sizing Ratio: 2.425
Building Parameters
Existing LPD EPD Cooling Cap sf/ton 0.72 2.77 124 Cooling EER Cooling Type Wall U-Value Roof U-Value 17.3 0.689 0.049 Window U-Value Window SC % Window Area Skylight U-Value 0.493 0.310 19.7 1.625 Skylight SC % Skylight Area % Ltg Occup Ctrl % Ltg Daylight Ctrl 0.889 0.8 27.3 0.0
Title 24 Baseline LPD EPD Cooling Cap sf/ton 1.06 2.77 124 Cooling EER Cooling Type Wall U-Value Roof U-Value 17.6 0.689 0.075 Window U-Value Window SC % Window Area Skylight U-Value 0.839 0.490 19.7 1.983 Skylight SC % Skylight Area % Ltg Occup Ctrl % Ltg Daylight Ctrl 0.891 0.8 0.0 0.0
Table 31 - Gross and Net Evaluated Savings
Ex-Ante Gross Savings
Ex-Post Gross Savings
Ex-Post Net Savings
Net-to-Gross Realization Rate (Ex-Post Net/Ex-Post
Gross)Peak kW 18.00 14.87 13.10 88.10%
kWh 58,155.00 60,601.25 49,653.25 81.93%Therms 224.00 60,601.25 41.79 0.07%

clix
Building Overview Notes
-The HVAC for this building actually consists of 22 small Fan Coils and Air Handlers operating independently in their own zones. For modeling purposes, the air handlers and fan coils were grouped into two "Air handlers", one representing the AHUs (w/ economizers), and the other representing the FCs (w/out economizers)
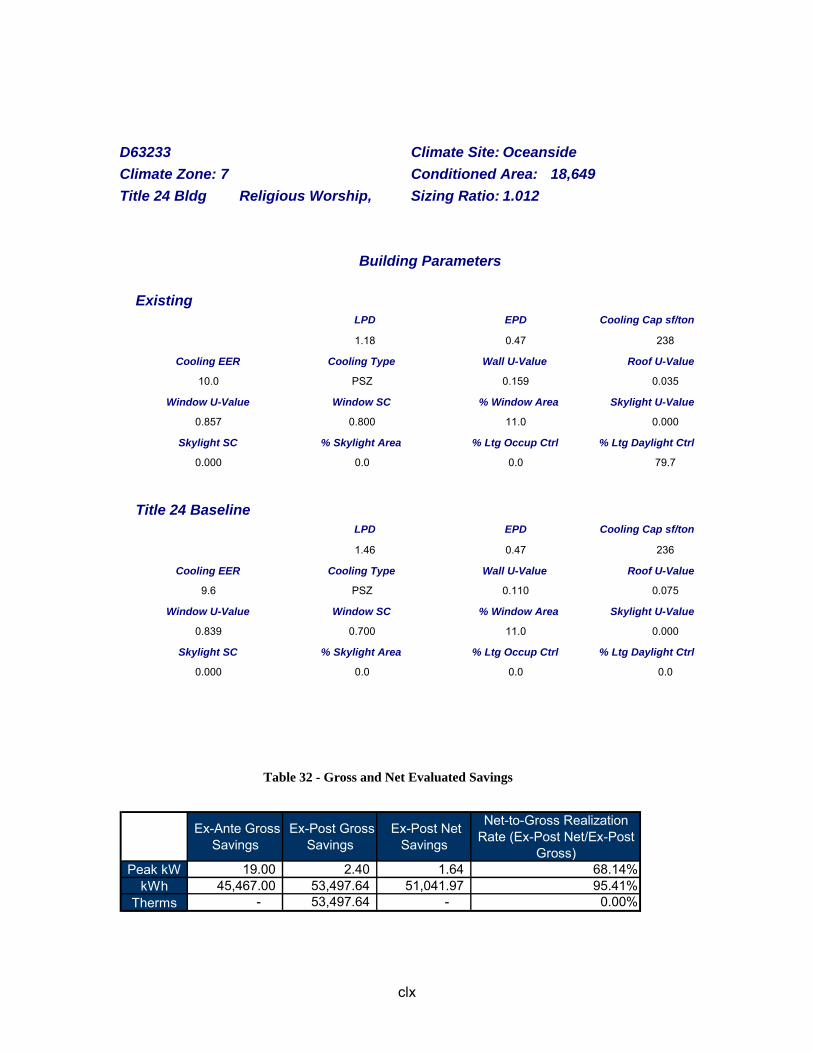
clx
D63233 Climate Site: Oceanside Climate Zone: 7 Conditioned Area: 18,649 Title 24 Bldg Religious Worship, Sizing Ratio: 1.012
Building Parameters
Existing LPD EPD Cooling Cap sf/ton 1.18 0.47 238 Cooling EER Cooling Type Wall U-Value Roof U-Value 10.0 PSZ 0.159 0.035 Window U-Value Window SC % Window Area Skylight U-Value 0.857 0.800 11.0 0.000 Skylight SC % Skylight Area % Ltg Occup Ctrl % Ltg Daylight Ctrl 0.000 0.0 0.0 79.7
Title 24 Baseline LPD EPD Cooling Cap sf/ton 1.46 0.47 236 Cooling EER Cooling Type Wall U-Value Roof U-Value 9.6 PSZ 0.110 0.075 Window U-Value Window SC % Window Area Skylight U-Value 0.839 0.700 11.0 0.000 Skylight SC % Skylight Area % Ltg Occup Ctrl % Ltg Daylight Ctrl 0.000 0.0 0.0 0.0
Table 32 - Gross and Net Evaluated Savings
Ex-Ante Gross Savings
Ex-Post Gross Savings
Ex-Post Net Savings
Net-to-Gross Realization Rate (Ex-Post Net/Ex-Post
Gross)Peak kW 19.00 2.40 1.64 68.14%
kWh 45,467.00 53,497.64 51,041.97 95.41%Therms - 53,497.64 - 0.00%

clxi
D63257 Climate Site: Oceanside Climate Zone: 7 Conditioned Area: 5,547 Title 24 Bldg Medical/Clinical Sizing Ratio: 1.284
Building Parameters
Existing LPD EPD Cooling Cap sf/ton 1.09 12.77 34 Cooling EER Cooling Type Wall U-Value Roof U-Value 13.9 0.140 0.054 Window U-Value Window SC % Window Area Skylight U-Value 0.777 0.570 5.8 0.000 Skylight SC % Skylight Area % Ltg Occup Ctrl % Ltg Daylight Ctrl 0.000 0.0 0.0 0.0
Title 24 Baseline LPD EPD Cooling Cap sf/ton 1.20 12.77 34 Cooling EER Cooling Type Wall U-Value Roof U-Value 7.9 0.224 0.054 Window U-Value Window SC % Window Area Skylight U-Value 0.839 0.700 5.8 0.000 Skylight SC % Skylight Area % Ltg Occup Ctrl % Ltg Daylight Ctrl 0.000 0.0 0.0 0.0
Table 33 - Gross and Net Evaluated Savings
Ex-Ante Gross Savings
Ex-Post Gross Savings
Ex-Post Net Savings
Net-to-Gross Realization Rate (Ex-Post Net/Ex-Post
Gross)Peak kW 50.00 84.00 - 0.00%
kWh 505,112.00 482,197.00 482,197.00 100.00%Therms 40,326.00 482,197.00 25,374.20 5.26%
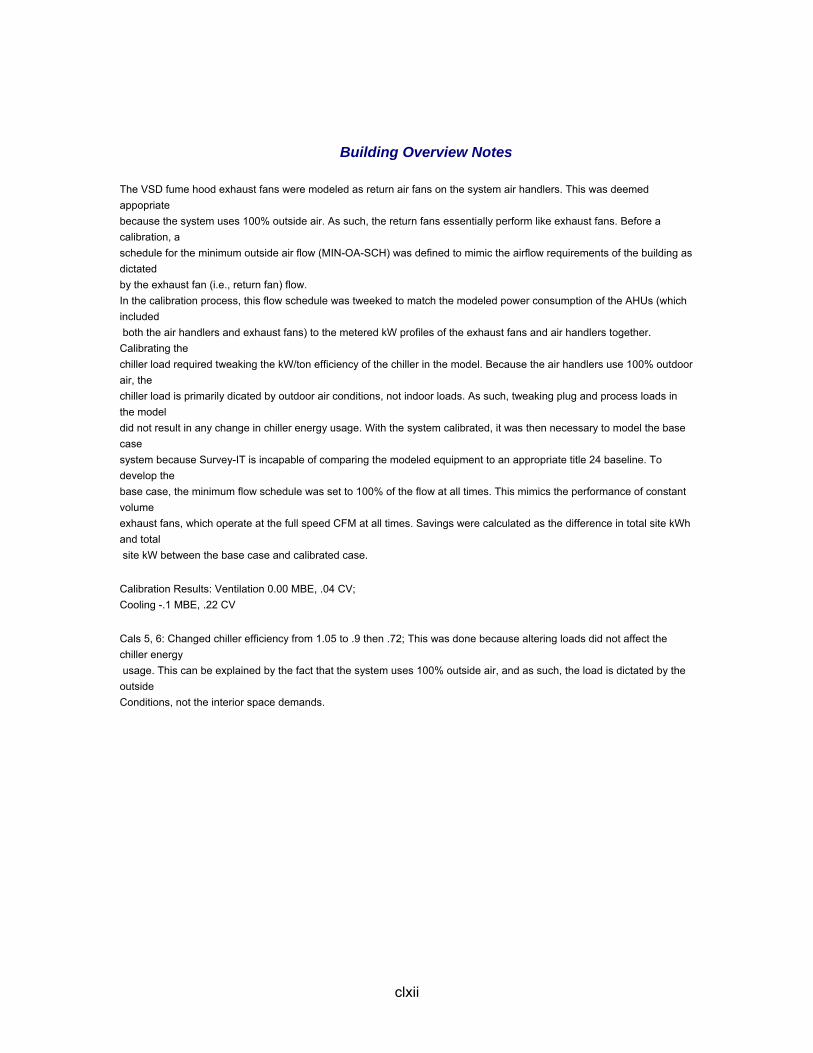
clxii
Building Overview Notes The VSD fume hood exhaust fans were modeled as return air fans on the system air handlers. This was deemed appopriate because the system uses 100% outside air. As such, the return fans essentially perform like exhaust fans. Before a calibration, a schedule for the minimum outside air flow (MIN-OA-SCH) was defined to mimic the airflow requirements of the building as dictated by the exhaust fan (i.e., return fan) flow. In the calibration process, this flow schedule was tweeked to match the modeled power consumption of the AHUs (which included both the air handlers and exhaust fans) to the metered kW profiles of the exhaust fans and air handlers together. Calibrating the chiller load required tweaking the kW/ton efficiency of the chiller in the model. Because the air handlers use 100% outdoor air, the chiller load is primarily dicated by outdoor air conditions, not indoor loads. As such, tweaking plug and process loads in the model did not result in any change in chiller energy usage. With the system calibrated, it was then necessary to model the base case system because Survey-IT is incapable of comparing the modeled equipment to an appropriate title 24 baseline. To develop the base case, the minimum flow schedule was set to 100% of the flow at all times. This mimics the performance of constant volume exhaust fans, which operate at the full speed CFM at all times. Savings were calculated as the difference in total site kWh and total site kW between the base case and calibrated case. Calibration Results: Ventilation 0.00 MBE, .04 CV; Cooling -.1 MBE, .22 CV Cals 5, 6: Changed chiller efficiency from 1.05 to .9 then .72; This was done because altering loads did not affect the chiller energy usage. This can be explained by the fact that the system uses 100% outside air, and as such, the load is dictated by the outside Conditions, not the interior space demands.
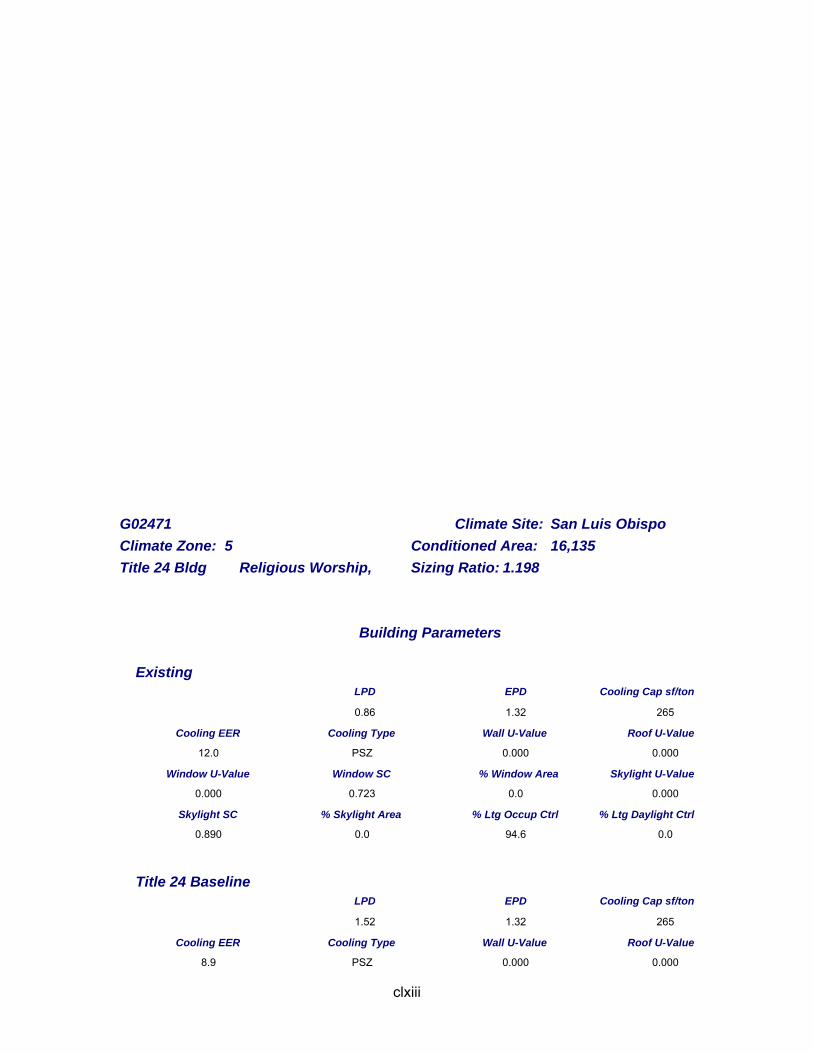
clxiii
G02471 Climate Site: San Luis Obispo Climate Zone: 5 Conditioned Area: 16,135 Title 24 Bldg Religious Worship, Sizing Ratio: 1.198
Building Parameters
Existing LPD EPD Cooling Cap sf/ton 0.86 1.32 265 Cooling EER Cooling Type Wall U-Value Roof U-Value 12.0 PSZ 0.000 0.000 Window U-Value Window SC % Window Area Skylight U-Value 0.000 0.723 0.0 0.000 Skylight SC % Skylight Area % Ltg Occup Ctrl % Ltg Daylight Ctrl 0.890 0.0 94.6 0.0
Title 24 Baseline LPD EPD Cooling Cap sf/ton 1.52 1.32 265 Cooling EER Cooling Type Wall U-Value Roof U-Value 8.9 PSZ 0.000 0.000

clxiv
Window U-Value Window SC % Window Area Skylight U-Value 0.000 0.493 0.0 0.000 Skylight SC % Skylight Area % Ltg Occup Ctrl % Ltg Daylight Ctrl 1.285 0.0 0.0 0.0
Table 34 - Gross and Net Evaluated Savings
Ex-Ante Gross Savings
Ex-Post Gross Savings
Ex-Post Net savings
Net-to-Gross Realization rate (Ex-Post Net/Ex-Post Gross)
Peak kW - - - 0.00%kWh - 130.23 162.02 124.41%
Therms 1,008.00 248.51 246.21 99.07%
clxv
Building Overview Notes
Baseline (using split systems w/ actual found heating elements left into HVAC systems instead of zonal, using ~12 eer) This site is unique since there are no HVAC systems installed. The dummy HVAC are from YORK HRE models. Only thing changed from the G02471Z model is that T-stat set to very high to prevent cooling from coming on. -Note that implementers used two separate files to calculate savings

clxvi
G12008 Climate Site: Redondo Beach Climate Zone: 6 Conditioned Area: 130,213 Title 24 Bldg Medical/Clinical Sizing Ratio: 1.210
Building Parameters
Existing LPD EPD Cooling Cap sf/ton 1.14 0.70 368 Cooling EER Cooling Type Wall U-Value Roof U-Value 19.6 0.689 0.075 Window U-Value Window SC % Window Area Skylight U-Value 1.409 0.740 23.7 0.000 Skylight SC % Skylight Area % Ltg Occup Ctrl % Ltg Daylight Ctrl 0.000 0.0 0.0 0.0
Title 24 Baseline LPD EPD Cooling Cap sf/ton 1.14 0.70 368 Cooling EER Cooling Type Wall U-Value Roof U-Value 19.6 0.689 0.075 Window U-Value Window SC % Window Area Skylight U-Value 1.409 0.778 23.7 1.881 Skylight SC % Skylight Area % Ltg Occup Ctrl % Ltg Daylight Ctrl 0.092 1.1 0.0 0.0
clxvii
Building Overview Notes
-Run is completed, this is a gas savings measure only and is not in database but modeling is used to estimate savings. The low realization rate below is because the implementers used the existing equipment and operating conditions as the baseline. However, we used T24 so a low rate is expected. Data entry notes -This site had no plans available for review. Much of the dimensions were estimated using a walking wheel and general layouts from the building's EMS. -Majority of areas are private, so no entry permitted, had to estimate plug loads, overall difficult site to accurately survey. -Gym is on different schedule but size small so lumped as one "Area" instead. -Building square footage claimed to be 168k, but those that are served by the incented equipment is less ~123K. -The supply and exhaust fans replaced with higher efficiency motors and VFD controls are the following: SF-1,2,3,5,8,8a,11 RF1, EF3,4,8 per plans. -SF7 rented out to Silverado retirement facility, does not use heating so this is not included either. -EF5, 7, 9 not on plans for VFD, instead VFDs are placed on EF3,4,8.
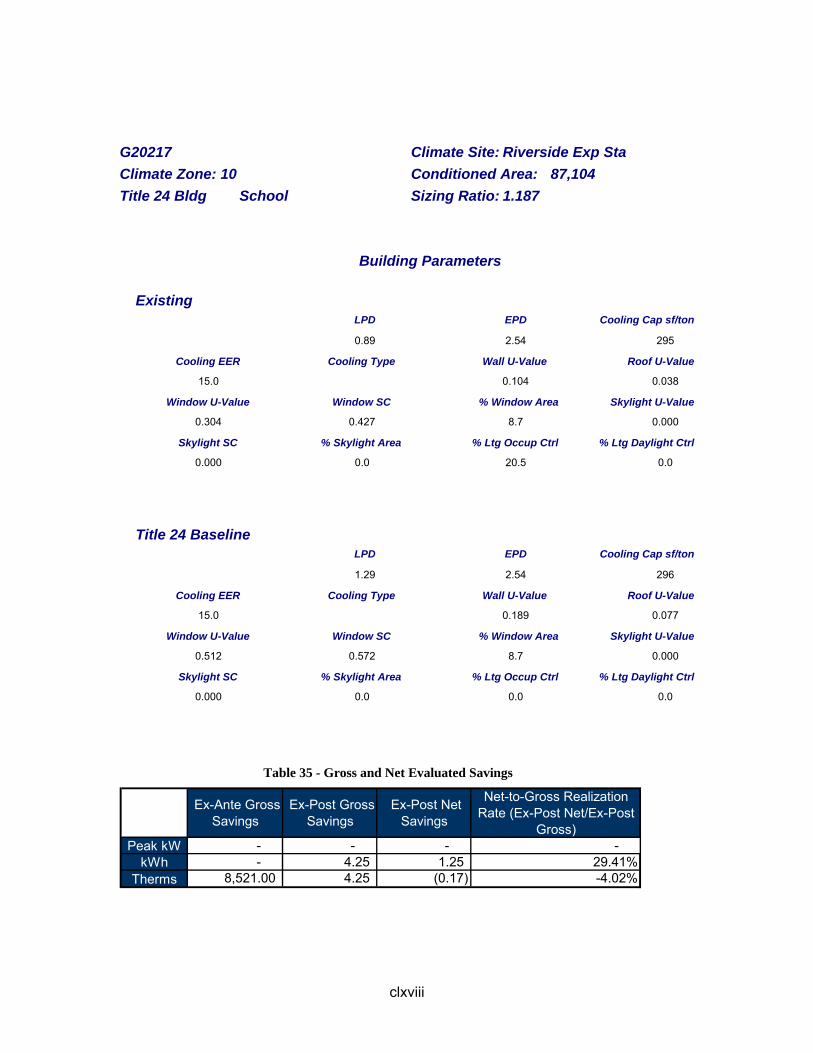
clxviii
G20217 Climate Site: Riverside Exp Sta Climate Zone: 10 Conditioned Area: 87,104 Title 24 Bldg School Sizing Ratio: 1.187
Building Parameters
Existing LPD EPD Cooling Cap sf/ton 0.89 2.54 295 Cooling EER Cooling Type Wall U-Value Roof U-Value 15.0 0.104 0.038 Window U-Value Window SC % Window Area Skylight U-Value 0.304 0.427 8.7 0.000 Skylight SC % Skylight Area % Ltg Occup Ctrl % Ltg Daylight Ctrl 0.000 0.0 20.5 0.0
Title 24 Baseline LPD EPD Cooling Cap sf/ton 1.29 2.54 296 Cooling EER Cooling Type Wall U-Value Roof U-Value 15.0 0.189 0.077 Window U-Value Window SC % Window Area Skylight U-Value 0.512 0.572 8.7 0.000 Skylight SC % Skylight Area % Ltg Occup Ctrl % Ltg Daylight Ctrl 0.000 0.0 0.0 0.0
Table 35 - Gross and Net Evaluated Savings
Ex-Ante Gross Savings
Ex-Post Gross Savings
Ex-Post Net Savings
Net-to-Gross Realization Rate (Ex-Post Net/Ex-Post
Gross)Peak kW - - - -
kWh - 4.25 1.25 29.41%Therms 8,521.00 4.25 (0.17) -4.02%
clxix
Building Overview Notes
-Occupied/conditioned in 2007, but using 2001 building standards since analysis done in 2003.
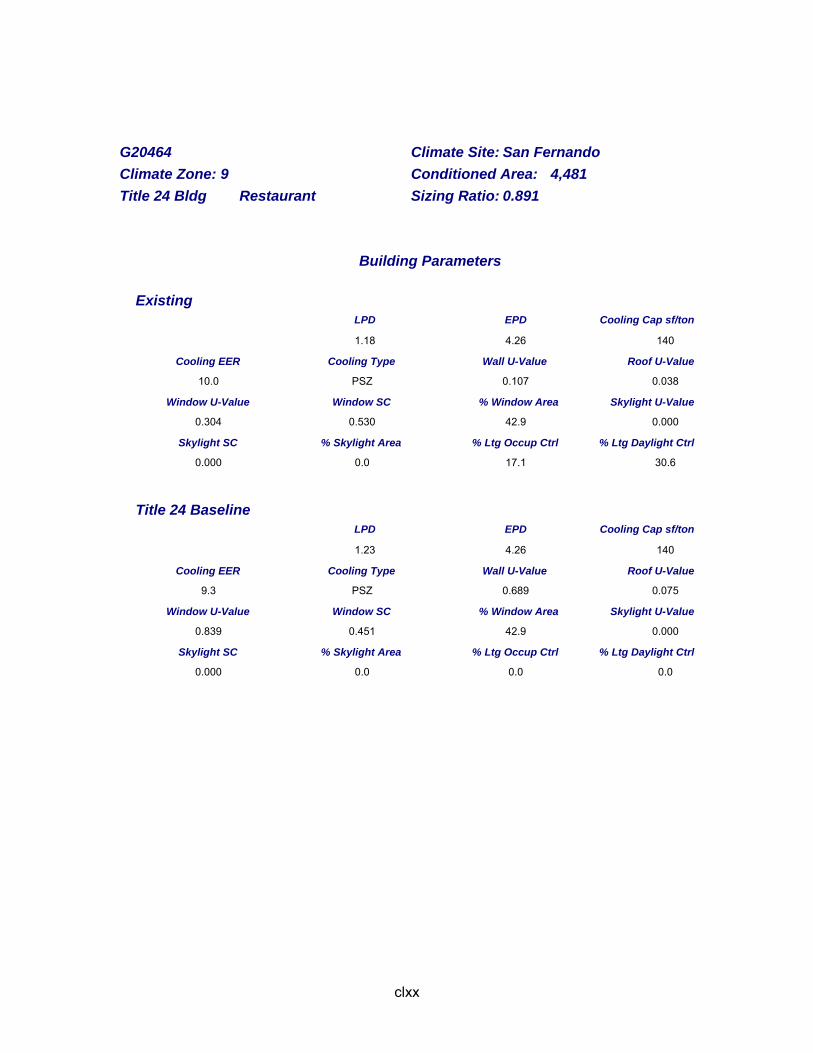
clxx
G20464 Climate Site: San Fernando Climate Zone: 9 Conditioned Area: 4,481 Title 24 Bldg Restaurant Sizing Ratio: 0.891
Building Parameters
Existing LPD EPD Cooling Cap sf/ton 1.18 4.26 140 Cooling EER Cooling Type Wall U-Value Roof U-Value 10.0 PSZ 0.107 0.038 Window U-Value Window SC % Window Area Skylight U-Value 0.304 0.530 42.9 0.000 Skylight SC % Skylight Area % Ltg Occup Ctrl % Ltg Daylight Ctrl 0.000 0.0 17.1 30.6
Title 24 Baseline LPD EPD Cooling Cap sf/ton 1.23 4.26 140 Cooling EER Cooling Type Wall U-Value Roof U-Value 9.3 PSZ 0.689 0.075 Window U-Value Window SC % Window Area Skylight U-Value 0.839 0.451 42.9 0.000 Skylight SC % Skylight Area % Ltg Occup Ctrl % Ltg Daylight Ctrl 0.000 0.0 0.0 0.0
clxxi
Building Overview Notes
Began occupying 7/15/07 with half staff. Full operations by 8/1/07. Window to Wall Ratio (Non-North) is greater than 40 percent = 0.45 (As observed)

clxxii
G20471 Climate Site: San Luis Obispo Climate Zone: 5 Conditioned Area: 16,135 Title 24 Bldg Religious Worship, Sizing Ratio: 1.198
Building Parameters
Existing LPD EPD Cooling Cap sf/ton 0.86 1.32 265 Cooling EER Cooling Type Wall U-Value Roof U-Value 11.3 PSZ 0.000 0.000 Window U-Value Window SC % Window Area Skylight U-Value 0.000 0.707 0.0 0.000 Skylight SC % Skylight Area % Ltg Occup Ctrl % Ltg Daylight Ctrl 1.092 0.0 94.6 0.0
Title 24 Baseline LPD EPD Cooling Cap sf/ton 1.52 1.32 265 Cooling EER Cooling Type Wall U-Value Roof U-Value 8.7 PSZ 0.000 0.000 Window U-Value Window SC % Window Area Skylight U-Value 0.000 0.484 0.0 0.000 Skylight SC % Skylight Area % Ltg Occup Ctrl % Ltg Daylight Ctrl 1.577 0.0 0.0 0.0
Table 36 - Gross and Net Evaluated Savings
Ex-Ante Gross Savings
Ex-Post Gross Savings
Ex-Post Net Savings
Net-to-Gross Realization Rate (Ex-Post Net/Ex-Post
Gross)Peak kW - - - -
kWh - 130.23 162.02 124.41%Therms 1,008.00 130.23 246.21 189.05%
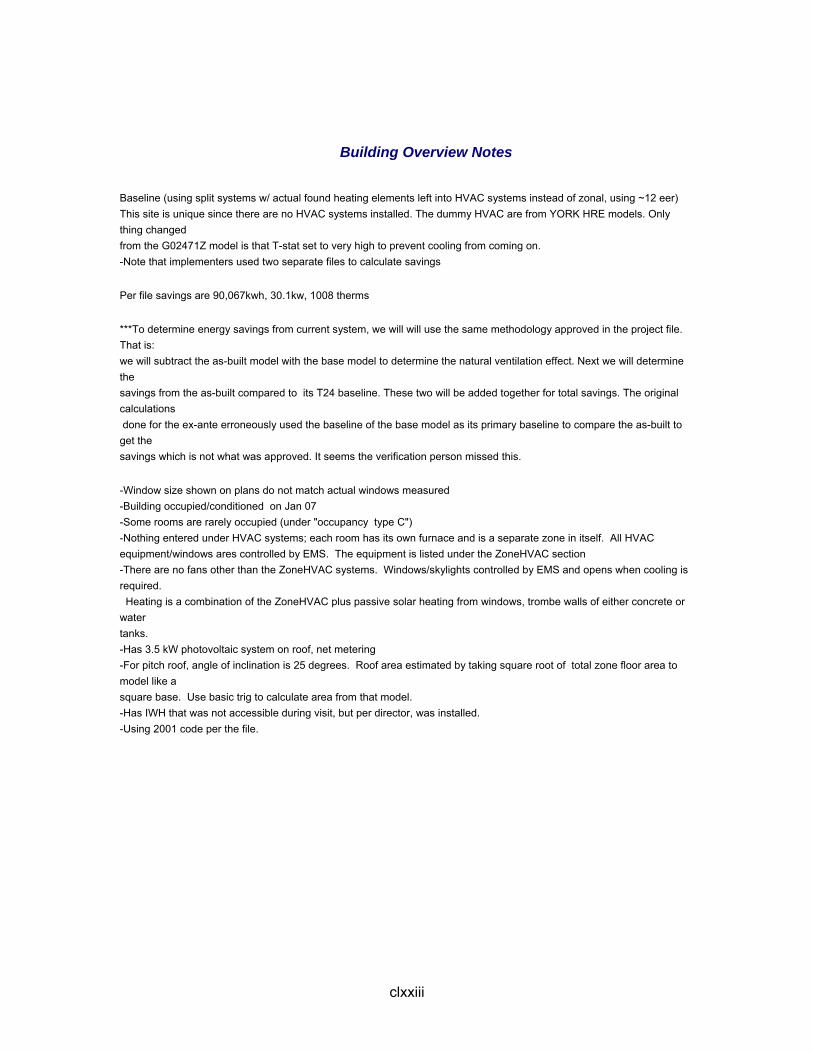
clxxiii
Building Overview Notes
Baseline (using split systems w/ actual found heating elements left into HVAC systems instead of zonal, using ~12 eer) This site is unique since there are no HVAC systems installed. The dummy HVAC are from YORK HRE models. Only thing changed from the G02471Z model is that T-stat set to very high to prevent cooling from coming on. -Note that implementers used two separate files to calculate savings Per file savings are 90,067kwh, 30.1kw, 1008 therms ***To determine energy savings from current system, we will will use the same methodology approved in the project file. That is: we will subtract the as-built model with the base model to determine the natural ventilation effect. Next we will determine the savings from the as-built compared to its T24 baseline. These two will be added together for total savings. The original calculations done for the ex-ante erroneously used the baseline of the base model as its primary baseline to compare the as-built to get the savings which is not what was approved. It seems the verification person missed this. -Window size shown on plans do not match actual windows measured -Building occupied/conditioned on Jan 07 -Some rooms are rarely occupied (under "occupancy type C") -Nothing entered under HVAC systems; each room has its own furnace and is a separate zone in itself. All HVAC equipment/windows ares controlled by EMS. The equipment is listed under the ZoneHVAC section -There are no fans other than the ZoneHVAC systems. Windows/skylights controlled by EMS and opens when cooling is required. Heating is a combination of the ZoneHVAC plus passive solar heating from windows, trombe walls of either concrete or water tanks. -Has 3.5 kW photovoltaic system on roof, net metering -For pitch roof, angle of inclination is 25 degrees. Roof area estimated by taking square root of total zone floor area to model like a square base. Use basic trig to calculate area from that model. -Has IWH that was not accessible during visit, but per director, was installed. -Using 2001 code per the file.
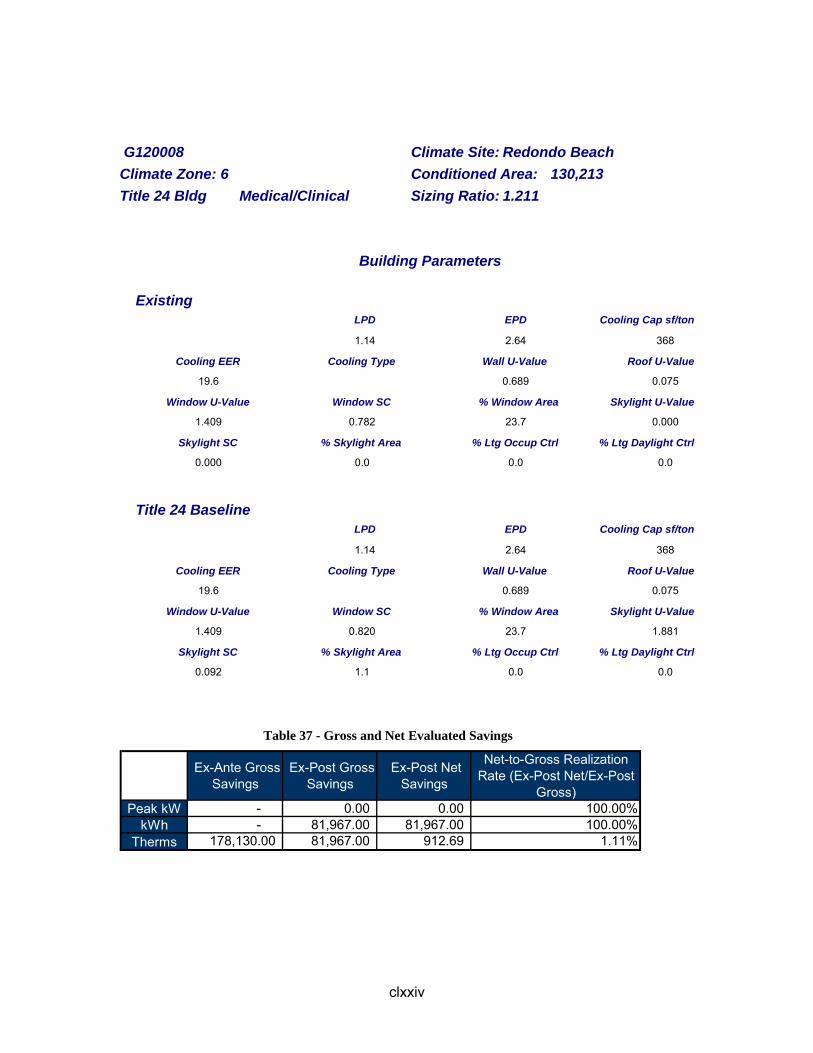
clxxiv
G120008 Climate Site: Redondo Beach Climate Zone: 6 Conditioned Area: 130,213 Title 24 Bldg Medical/Clinical Sizing Ratio: 1.211
Building Parameters
Existing LPD EPD Cooling Cap sf/ton 1.14 2.64 368 Cooling EER Cooling Type Wall U-Value Roof U-Value 19.6 0.689 0.075 Window U-Value Window SC % Window Area Skylight U-Value 1.409 0.782 23.7 0.000 Skylight SC % Skylight Area % Ltg Occup Ctrl % Ltg Daylight Ctrl 0.000 0.0 0.0 0.0
Title 24 Baseline LPD EPD Cooling Cap sf/ton 1.14 2.64 368 Cooling EER Cooling Type Wall U-Value Roof U-Value 19.6 0.689 0.075 Window U-Value Window SC % Window Area Skylight U-Value 1.409 0.820 23.7 1.881 Skylight SC % Skylight Area % Ltg Occup Ctrl % Ltg Daylight Ctrl 0.092 1.1 0.0 0.0
Table 37 - Gross and Net Evaluated Savings
Ex-Ante Gross Savings
Ex-Post Gross Savings
Ex-Post Net Savings
Net-to-Gross Realization Rate (Ex-Post Net/Ex-Post
Gross)Peak kW - 0.00 0.00 100.00%
kWh - 81,967.00 81,967.00 100.00%Therms 178,130.00 81,967.00 912.69 1.11%
clxxv
Building Overview Notes - Data entry notes -This site had no plans available for review. Much of the dimensions were estimated using a walking wheel and general layouts from the building's EMS. - Gym is on different schedule but size small so lumped as one "Area" instead. -Building square footage claimed to be 168k, but those that are served by the incented equipment is less ~123K. -The supply and exhaust fans replaced with higher efficiency motors and VFD controls are the following: SF-1,2,3,5,8,8a,11 RF1, EF3,4,8 per plans. -SF7 rented out to Silverado retirement facility, does not use heating so this is not included either. -EF5, 7, 9 not on plans for VFD, instead VFDs are placed on EF3,4,8. -
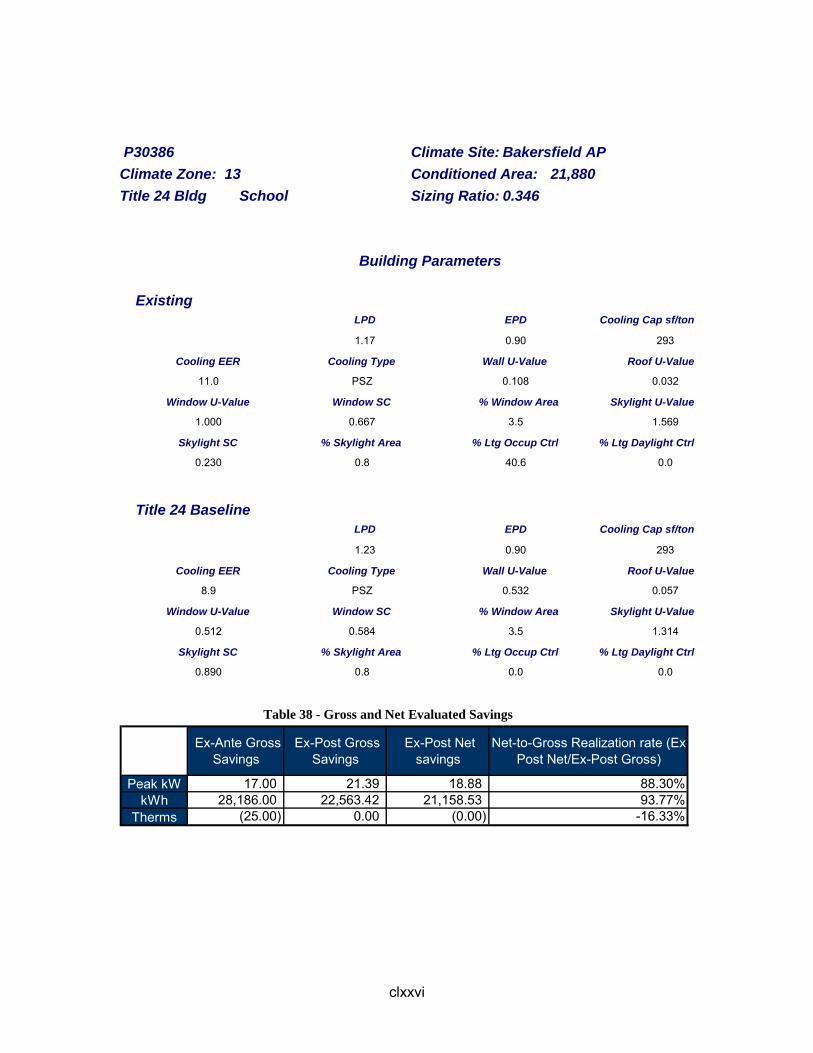
clxxvi
P30386 Climate Site: Bakersfield AP Climate Zone: 13 Conditioned Area: 21,880 Title 24 Bldg School Sizing Ratio: 0.346
Building Parameters
Existing LPD EPD Cooling Cap sf/ton 1.17 0.90 293 Cooling EER Cooling Type Wall U-Value Roof U-Value 11.0 PSZ 0.108 0.032 Window U-Value Window SC % Window Area Skylight U-Value 1.000 0.667 3.5 1.569 Skylight SC % Skylight Area % Ltg Occup Ctrl % Ltg Daylight Ctrl 0.230 0.8 40.6 0.0
Title 24 Baseline LPD EPD Cooling Cap sf/ton 1.23 0.90 293 Cooling EER Cooling Type Wall U-Value Roof U-Value 8.9 PSZ 0.532 0.057 Window U-Value Window SC % Window Area Skylight U-Value 0.512 0.584 3.5 1.314 Skylight SC % Skylight Area % Ltg Occup Ctrl % Ltg Daylight Ctrl 0.890 0.8 0.0 0.0
Table 38 - Gross and Net Evaluated Savings
Ex-Ante Gross Savings
Ex-Post Gross Savings
Ex-Post Net savings
Net-to-Gross Realization rate (Ex-Post Net/Ex-Post Gross)
Peak kW 17.00 21.39 18.88 88.30%kWh 28,186.00 22,563.42 21,158.53 93.77%
Therms (25.00) 0.00 (0.00) -16.33%
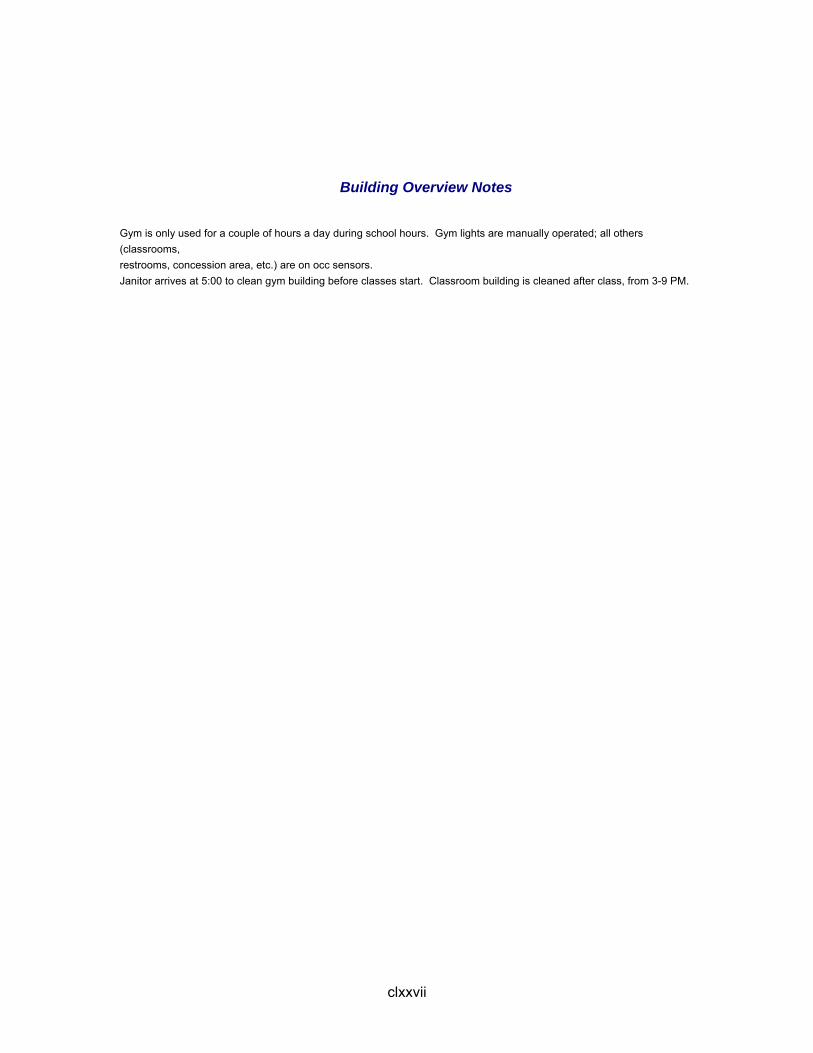
clxxvii
Building Overview Notes
Gym is only used for a couple of hours a day during school hours. Gym lights are manually operated; all others (classrooms, restrooms, concession area, etc.) are on occ sensors. Janitor arrives at 5:00 to clean gym building before classes start. Classroom building is cleaned after class, from 3-9 PM.
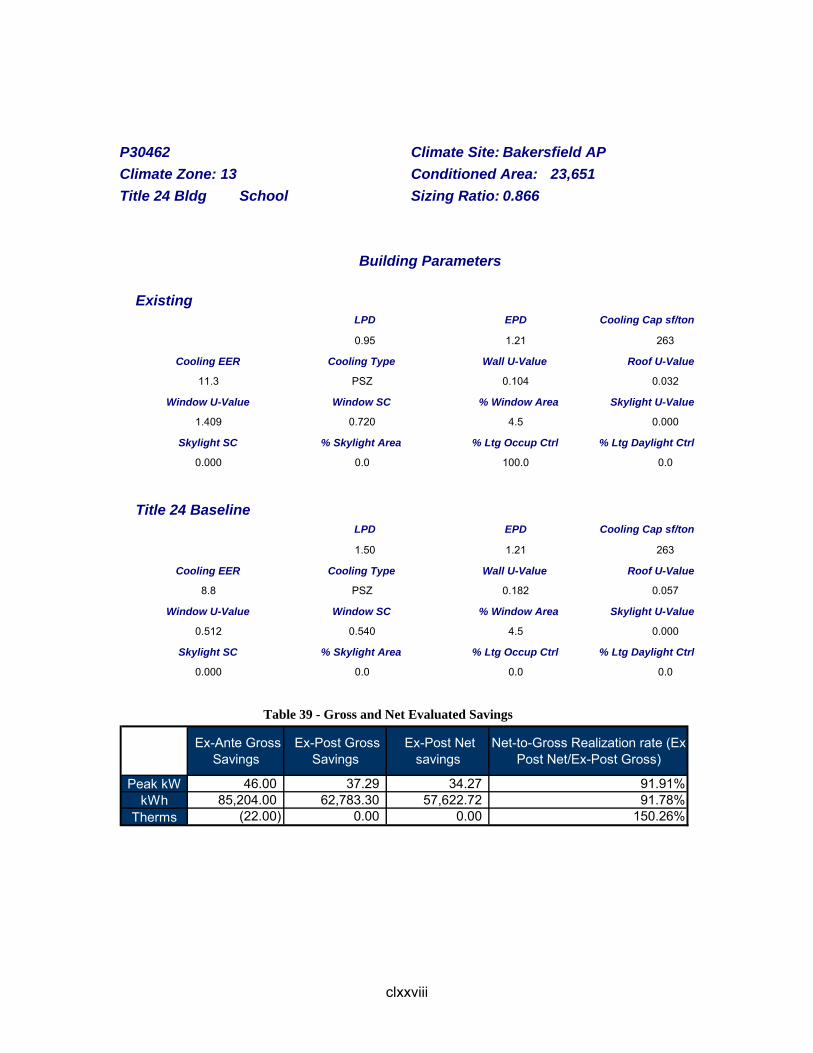
clxxviii
P30462 Climate Site: Bakersfield AP Climate Zone: 13 Conditioned Area: 23,651 Title 24 Bldg School Sizing Ratio: 0.866
Building Parameters
Existing LPD EPD Cooling Cap sf/ton 0.95 1.21 263 Cooling EER Cooling Type Wall U-Value Roof U-Value 11.3 PSZ 0.104 0.032 Window U-Value Window SC % Window Area Skylight U-Value 1.409 0.720 4.5 0.000 Skylight SC % Skylight Area % Ltg Occup Ctrl % Ltg Daylight Ctrl 0.000 0.0 100.0 0.0
Title 24 Baseline LPD EPD Cooling Cap sf/ton 1.50 1.21 263 Cooling EER Cooling Type Wall U-Value Roof U-Value 8.8 PSZ 0.182 0.057 Window U-Value Window SC % Window Area Skylight U-Value 0.512 0.540 4.5 0.000 Skylight SC % Skylight Area % Ltg Occup Ctrl % Ltg Daylight Ctrl 0.000 0.0 0.0 0.0
Table 39 - Gross and Net Evaluated Savings
Ex-Ante Gross Savings
Ex-Post Gross Savings
Ex-Post Net savings
Net-to-Gross Realization rate (Ex-Post Net/Ex-Post Gross)
Peak kW 46.00 37.29 34.27 91.91%kWh 85,204.00 62,783.30 57,622.72 91.78%
Therms (22.00) 0.00 0.00 150.26%
clxxix
Building Overview Notes
Buildings occupied 100% from the last week in August, 2006. Start-up took place over a weekend.
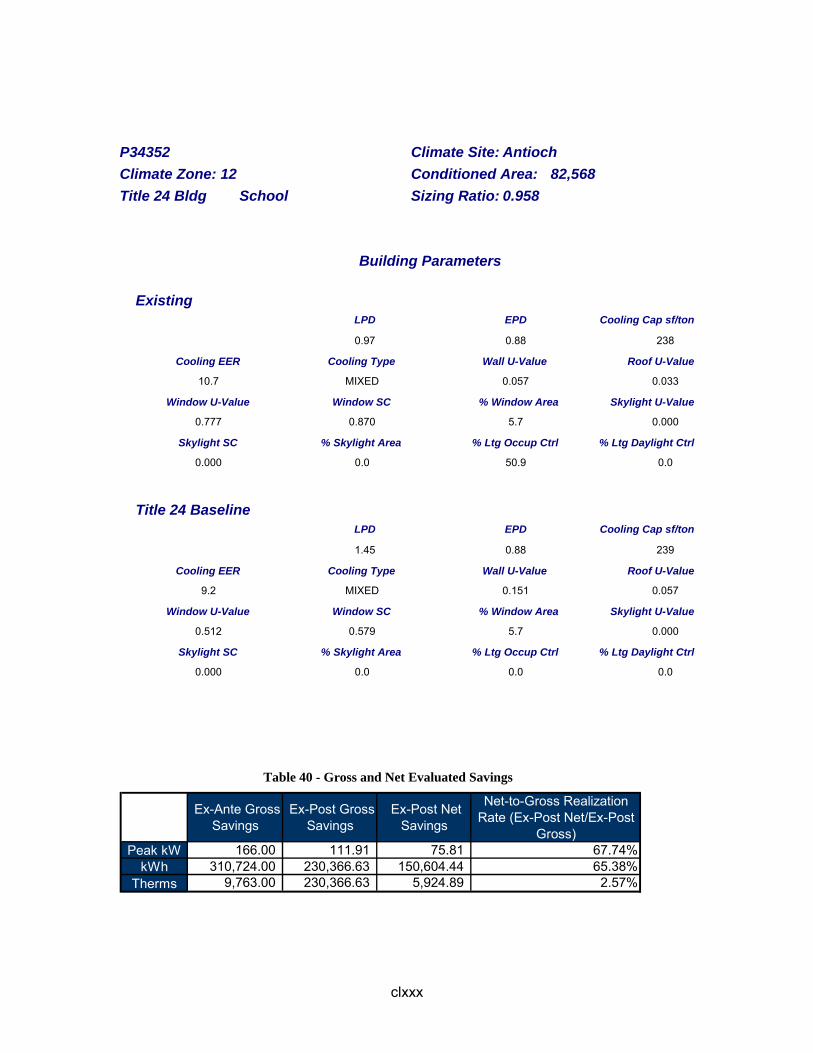
clxxx
P34352 Climate Site: Antioch Climate Zone: 12 Conditioned Area: 82,568 Title 24 Bldg School Sizing Ratio: 0.958
Building Parameters
Existing LPD EPD Cooling Cap sf/ton 0.97 0.88 238 Cooling EER Cooling Type Wall U-Value Roof U-Value 10.7 MIXED 0.057 0.033 Window U-Value Window SC % Window Area Skylight U-Value 0.777 0.870 5.7 0.000 Skylight SC % Skylight Area % Ltg Occup Ctrl % Ltg Daylight Ctrl 0.000 0.0 50.9 0.0
Title 24 Baseline LPD EPD Cooling Cap sf/ton 1.45 0.88 239 Cooling EER Cooling Type Wall U-Value Roof U-Value 9.2 MIXED 0.151 0.057 Window U-Value Window SC % Window Area Skylight U-Value 0.512 0.579 5.7 0.000 Skylight SC % Skylight Area % Ltg Occup Ctrl % Ltg Daylight Ctrl 0.000 0.0 0.0 0.0
Table 40 - Gross and Net Evaluated Savings
Ex-Ante Gross Savings
Ex-Post Gross Savings
Ex-Post Net Savings
Net-to-Gross Realization Rate (Ex-Post Net/Ex-Post
Gross)Peak kW 166.00 111.91 75.81 67.74%
kWh 310,724.00 230,366.63 150,604.44 65.38%Therms 9,763.00 230,366.63 5,924.89 2.57%

clxxxi
Building Overview Notes
Year-round school.
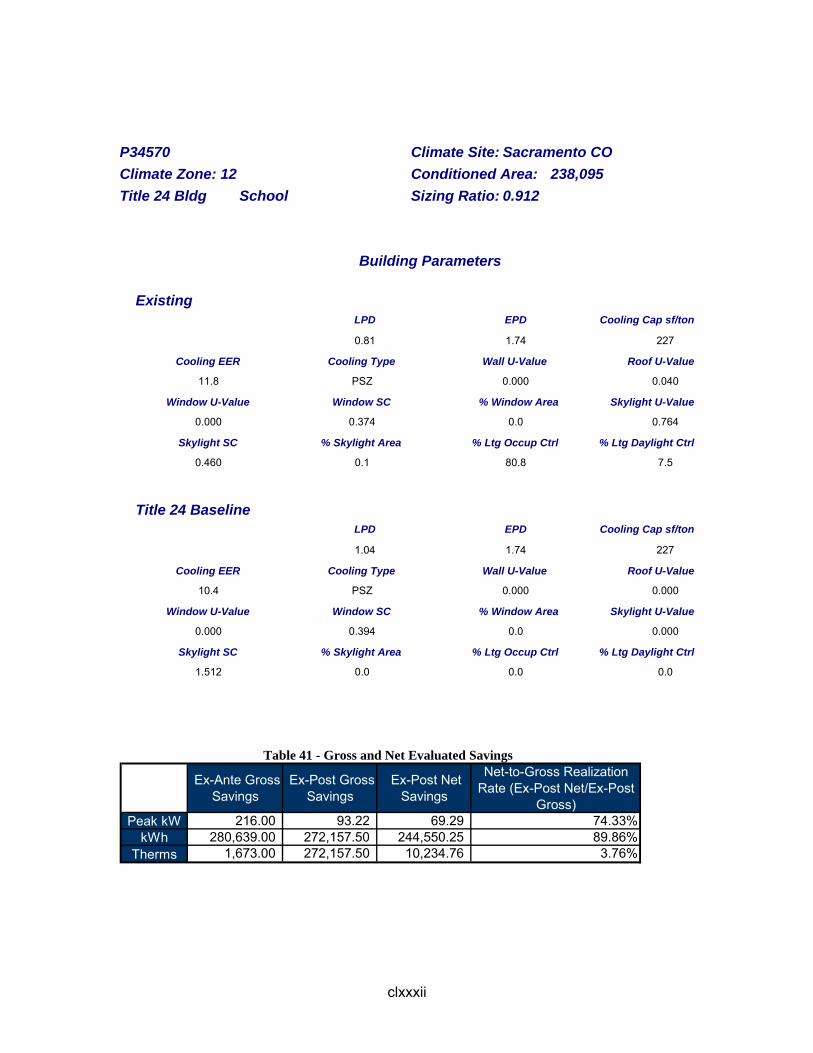
clxxxii
P34570 Climate Site: Sacramento CO Climate Zone: 12 Conditioned Area: 238,095 Title 24 Bldg School Sizing Ratio: 0.912
Building Parameters
Existing LPD EPD Cooling Cap sf/ton 0.81 1.74 227 Cooling EER Cooling Type Wall U-Value Roof U-Value 11.8 PSZ 0.000 0.040 Window U-Value Window SC % Window Area Skylight U-Value 0.000 0.374 0.0 0.764 Skylight SC % Skylight Area % Ltg Occup Ctrl % Ltg Daylight Ctrl 0.460 0.1 80.8 7.5
Title 24 Baseline LPD EPD Cooling Cap sf/ton 1.04 1.74 227 Cooling EER Cooling Type Wall U-Value Roof U-Value 10.4 PSZ 0.000 0.000 Window U-Value Window SC % Window Area Skylight U-Value 0.000 0.394 0.0 0.000 Skylight SC % Skylight Area % Ltg Occup Ctrl % Ltg Daylight Ctrl 1.512 0.0 0.0 0.0
Table 41 - Gross and Net Evaluated Savings
Ex-Ante Gross Savings
Ex-Post Gross Savings
Ex-Post Net Savings
Net-to-Gross Realization Rate (Ex-Post Net/Ex-Post
Gross)Peak kW 216.00 93.22 69.29 74.33%
kWh 280,639.00 272,157.50 244,550.25 89.86%Therms 1,673.00 272,157.50 10,234.76 3.76%

clxxxiii
P41214 Climate Site: Bakersfield AP Climate Zone: 13 Conditioned Area: 45,006 Title 24 Bldg School Sizing Ratio: 0.751
Building Parameters
Existing LPD EPD Cooling Cap sf/ton 0.74 1.77 225 Cooling EER Cooling Type Wall U-Value Roof U-Value 11.2 PSZ 0.129 0.030 Window U-Value Window SC % Window Area Skylight U-Value 3.769 0.354 14.5 0.956 Skylight SC % Skylight Area % Ltg Occup Ctrl % Ltg Daylight Ctrl 0.920 0.3 90.0 0.0
Title 24 Baseline LPD EPD Cooling Cap sf/ton 1.59 1.77 225 Cooling EER Cooling Type Wall U-Value Roof U-Value 9.2 PSZ 0.182 0.057 Window U-Value Window SC % Window Area Skylight U-Value 0.512 0.431 14.5 0.673 Skylight SC % Skylight Area % Ltg Occup Ctrl % Ltg Daylight Ctrl 0.530 0.3 0.0 0.0
Table 42 - Gross and Net Evaluated Savings
Ex-Ante Gross Savings
Ex-Post Gross Savings
Ex-Post Net Savings
Net-to-Gross Realization Rate (Ex-Post Net/Ex-Post
Gross)Peak kW 150.00 77.72 42.97 55.30%
kWh 236,976.00 191,255.25 94,518.22 49.42%Therms - 191,255.25 0.01 0.00%
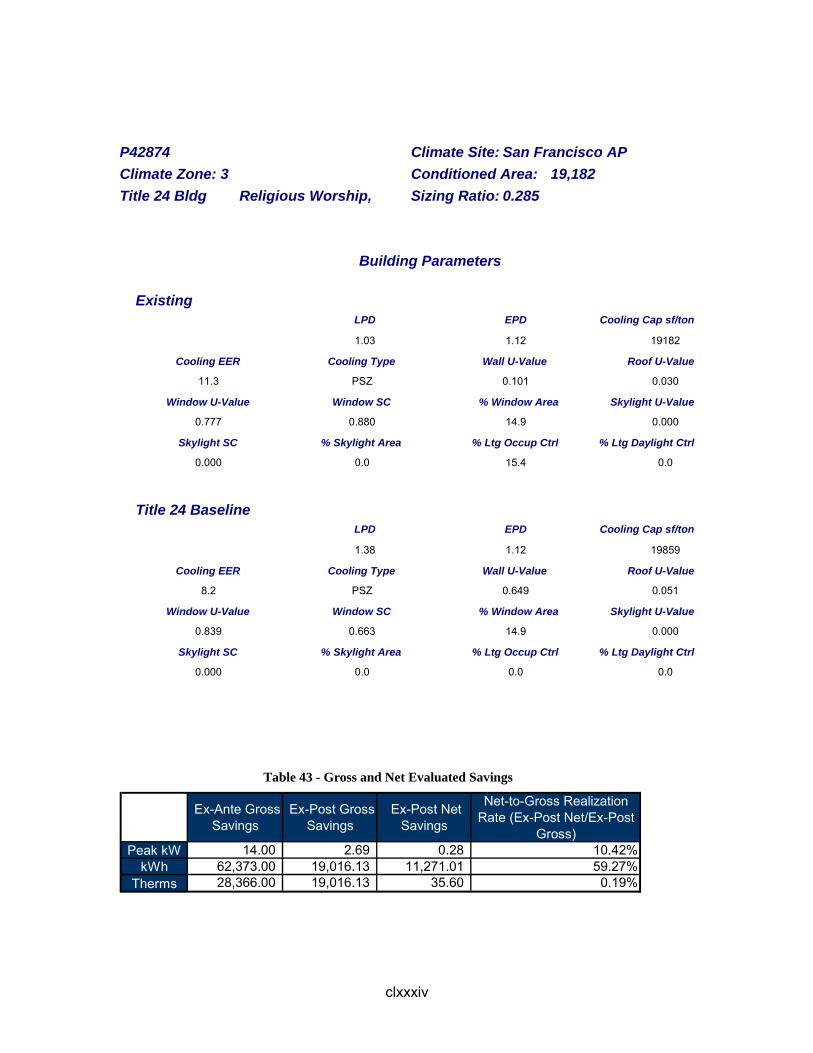
clxxxiv
P42874 Climate Site: San Francisco AP Climate Zone: 3 Conditioned Area: 19,182 Title 24 Bldg Religious Worship, Sizing Ratio: 0.285
Building Parameters
Existing LPD EPD Cooling Cap sf/ton 1.03 1.12 19182 Cooling EER Cooling Type Wall U-Value Roof U-Value 11.3 PSZ 0.101 0.030 Window U-Value Window SC % Window Area Skylight U-Value 0.777 0.880 14.9 0.000 Skylight SC % Skylight Area % Ltg Occup Ctrl % Ltg Daylight Ctrl 0.000 0.0 15.4 0.0
Title 24 Baseline LPD EPD Cooling Cap sf/ton 1.38 1.12 19859 Cooling EER Cooling Type Wall U-Value Roof U-Value 8.2 PSZ 0.649 0.051 Window U-Value Window SC % Window Area Skylight U-Value 0.839 0.663 14.9 0.000 Skylight SC % Skylight Area % Ltg Occup Ctrl % Ltg Daylight Ctrl 0.000 0.0 0.0 0.0
Table 43 - Gross and Net Evaluated Savings
Ex-Ante Gross Savings
Ex-Post Gross Savings
Ex-Post Net Savings
Net-to-Gross Realization Rate (Ex-Post Net/Ex-Post
Gross)Peak kW 14.00 2.69 0.28 10.42%
kWh 62,373.00 19,016.13 11,271.01 59.27%Therms 28,366.00 19,016.13 35.60 0.19%

clxxxv
Building Overview Notes
No A/C. Cooling by ventilation only (San Francisco)
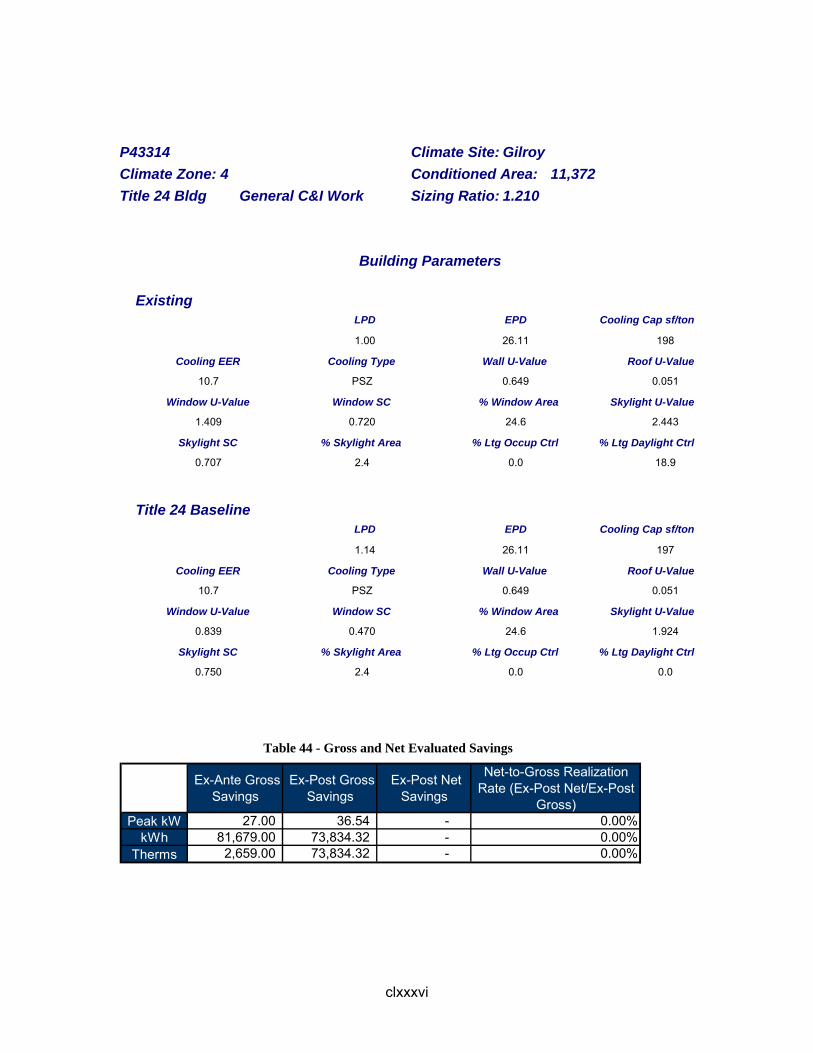
clxxxvi
P43314 Climate Site: Gilroy Climate Zone: 4 Conditioned Area: 11,372 Title 24 Bldg General C&I Work Sizing Ratio: 1.210
Building Parameters
Existing LPD EPD Cooling Cap sf/ton 1.00 26.11 198 Cooling EER Cooling Type Wall U-Value Roof U-Value 10.7 PSZ 0.649 0.051 Window U-Value Window SC % Window Area Skylight U-Value 1.409 0.720 24.6 2.443 Skylight SC % Skylight Area % Ltg Occup Ctrl % Ltg Daylight Ctrl 0.707 2.4 0.0 18.9
Title 24 Baseline LPD EPD Cooling Cap sf/ton 1.14 26.11 197 Cooling EER Cooling Type Wall U-Value Roof U-Value 10.7 PSZ 0.649 0.051 Window U-Value Window SC % Window Area Skylight U-Value 0.839 0.470 24.6 1.924 Skylight SC % Skylight Area % Ltg Occup Ctrl % Ltg Daylight Ctrl 0.750 2.4 0.0 0.0
Table 44 - Gross and Net Evaluated Savings
Ex-Ante Gross Savings
Ex-Post Gross Savings
Ex-Post Net Savings
Net-to-Gross Realization Rate (Ex-Post Net/Ex-Post
Gross)Peak kW 27.00 36.54 - 0.00%
kWh 81,679.00 73,834.32 - 0.00%Therms 2,659.00 73,834.32 - 0.00%

clxxxvii
Building Overview Notes
This site had a vsd on a dust collector. The dust collector vsd and hvac interactive effects were evaluated using a spreadsheet tool. This model is only representative of the lighting savings -In office, 1 fixture removed and 1 added to match LPD -In Warehouse, 1 fixture added to match LPD -In Ancillary Lab, 1 fixture added to match LPD -Lighting type of main lab (4FTT5)x4 fixtures not in plans; picked assumed match from fixture code list

clxxxviii
P43520 Climate Site: Bakersfield AP Climate Zone: 13 Conditioned Area: 190,998 Title 24 Bldg School Sizing Ratio: 0.695
Building Parameters
Existing LPD EPD Cooling Cap sf/ton 1.00 0.40 294 Cooling EER Cooling Type Wall U-Value Roof U-Value 18.2 PSZ 0.049 0.026 Window U-Value Window SC % Window Area Skylight U-Value 0.777 0.560 10.8 0.000 Skylight SC % Skylight Area % Ltg Occup Ctrl % Ltg Daylight Ctrl 0.000 0.0 47.3 0.0
Title 24 Baseline LPD EPD Cooling Cap sf/ton 1.15 0.40 294 Cooling EER Cooling Type Wall U-Value Roof U-Value 15.3 PSZ 0.102 0.051 Window U-Value Window SC % Window Area Skylight U-Value 0.493 0.457 10.8 1.547 Skylight SC % Skylight Area % Ltg Occup Ctrl % Ltg Daylight Ctrl 0.890 0.6 0.0 0.0
Table 45 - Gross and Net Evaluated Savings
Ex-Ante Gross Savings
Ex-Post Gross Savings
Ex-Post Net Savings
Net-to-Gross Realization Rate (Ex-Post Net/Ex-Post
Gross)Peak kW 1,227.00 219.88 199.61 90.78%
kWh 872,243.00 491,623.00 449,228.38 91.38%Therms 8,863.00 491,623.00 34,148.68 6.95%
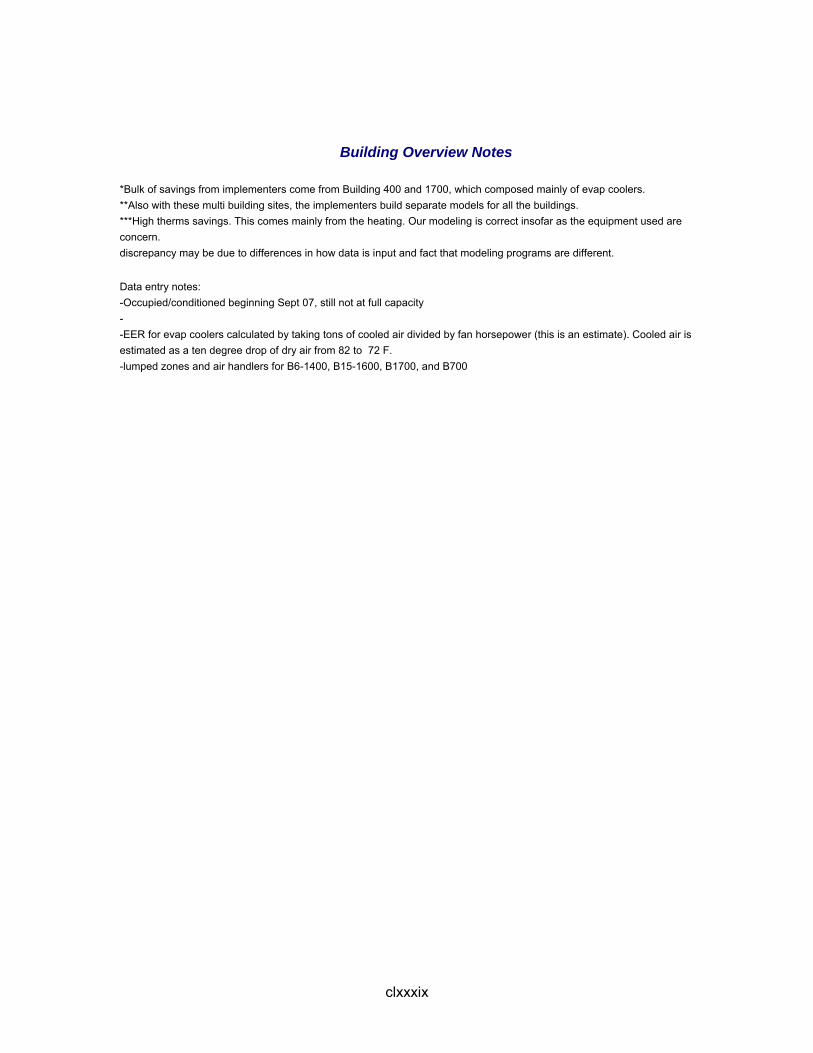
clxxxix
Building Overview Notes *Bulk of savings from implementers come from Building 400 and 1700, which composed mainly of evap coolers. **Also with these multi building sites, the implementers build separate models for all the buildings. ***High therms savings. This comes mainly from the heating. Our modeling is correct insofar as the equipment used are concern. discrepancy may be due to differences in how data is input and fact that modeling programs are different. Data entry notes: -Occupied/conditioned beginning Sept 07, still not at full capacity - -EER for evap coolers calculated by taking tons of cooled air divided by fan horsepower (this is an estimate). Cooled air is estimated as a ten degree drop of dry air from 82 to 72 F. -lumped zones and air handlers for B6-1400, B15-1600, B1700, and B700
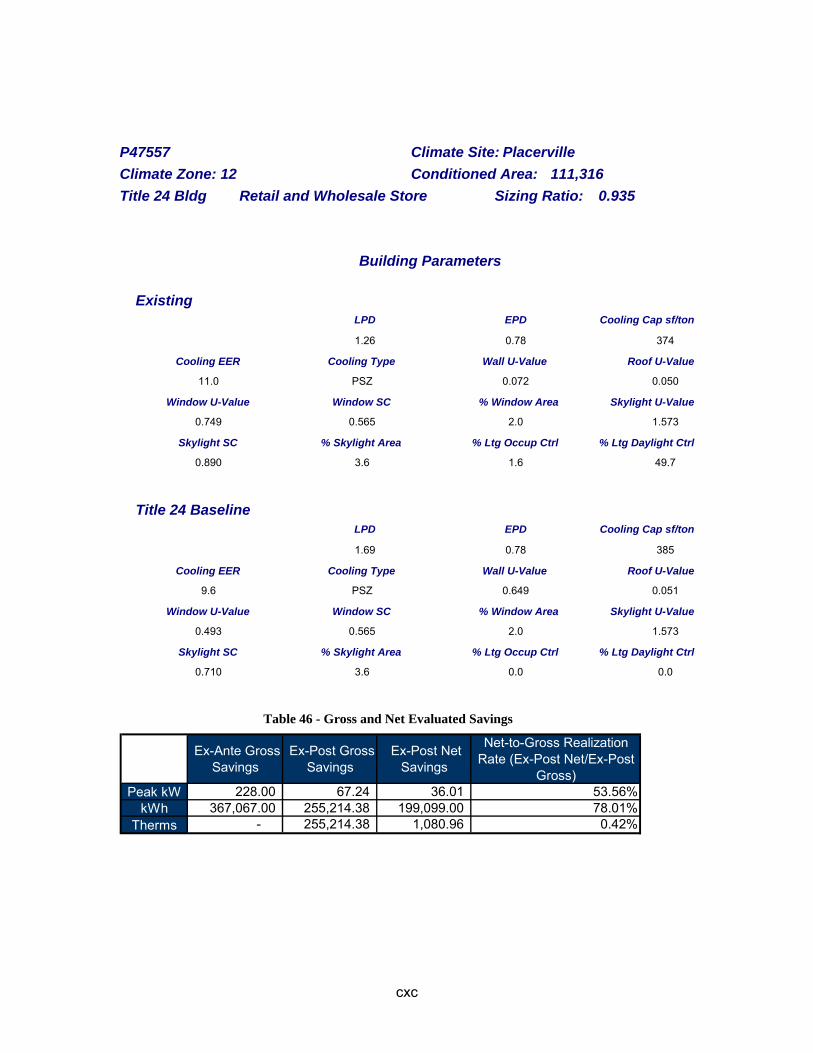
cxc
P47557 Climate Site: Placerville Climate Zone: 12 Conditioned Area: 111,316 Title 24 Bldg Retail and Wholesale Store Sizing Ratio: 0.935
Building Parameters
Existing LPD EPD Cooling Cap sf/ton 1.26 0.78 374 Cooling EER Cooling Type Wall U-Value Roof U-Value 11.0 PSZ 0.072 0.050 Window U-Value Window SC % Window Area Skylight U-Value 0.749 0.565 2.0 1.573 Skylight SC % Skylight Area % Ltg Occup Ctrl % Ltg Daylight Ctrl 0.890 3.6 1.6 49.7
Title 24 Baseline LPD EPD Cooling Cap sf/ton 1.69 0.78 385 Cooling EER Cooling Type Wall U-Value Roof U-Value 9.6 PSZ 0.649 0.051 Window U-Value Window SC % Window Area Skylight U-Value 0.493 0.565 2.0 1.573 Skylight SC % Skylight Area % Ltg Occup Ctrl % Ltg Daylight Ctrl 0.710 3.6 0.0 0.0
Table 46 - Gross and Net Evaluated Savings
Ex-Ante Gross Savings
Ex-Post Gross Savings
Ex-Post Net Savings
Net-to-Gross Realization Rate (Ex-Post Net/Ex-Post
Gross)Peak kW 228.00 67.24 36.01 53.56%
kWh 367,067.00 255,214.38 199,099.00 78.01%Therms - 255,214.38 1,080.96 0.42%
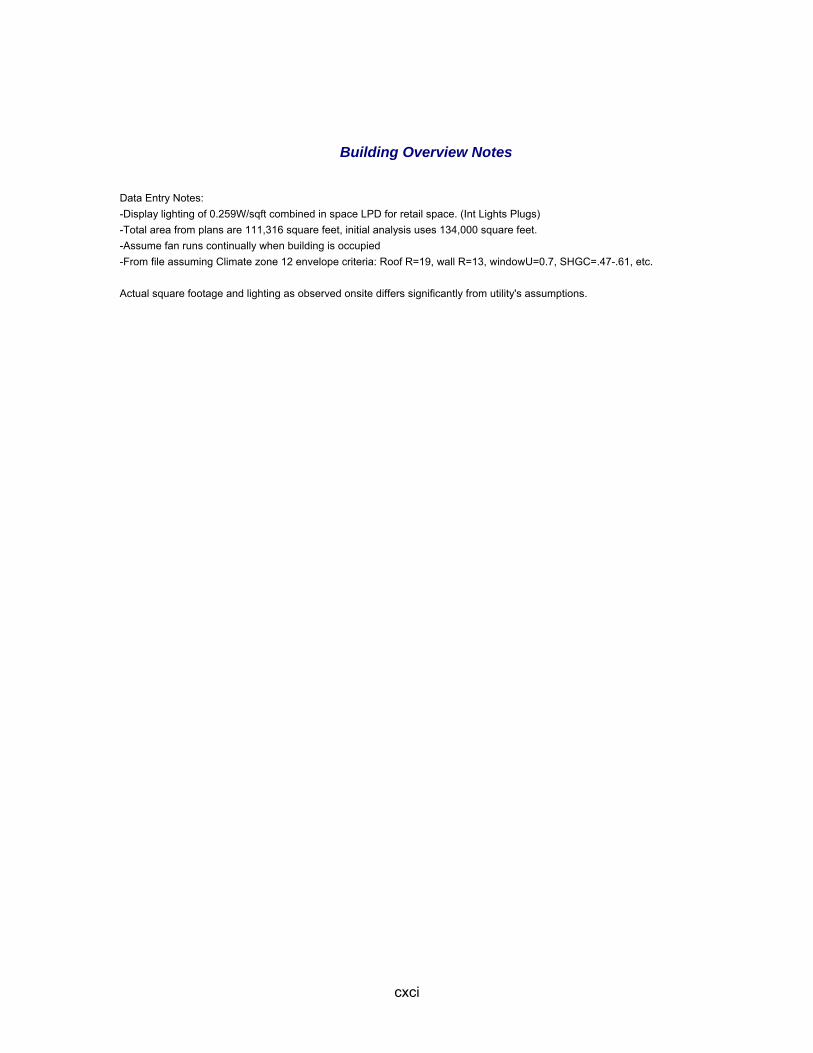
cxci
Building Overview Notes
Data Entry Notes: -Display lighting of 0.259W/sqft combined in space LPD for retail space. (Int Lights Plugs) -Total area from plans are 111,316 square feet, initial analysis uses 134,000 square feet. -Assume fan runs continually when building is occupied -From file assuming Climate zone 12 envelope criteria: Roof R=19, wall R=13, windowU=0.7, SHGC=.47-.61, etc. Actual square footage and lighting as observed onsite differs significantly from utility's assumptions.
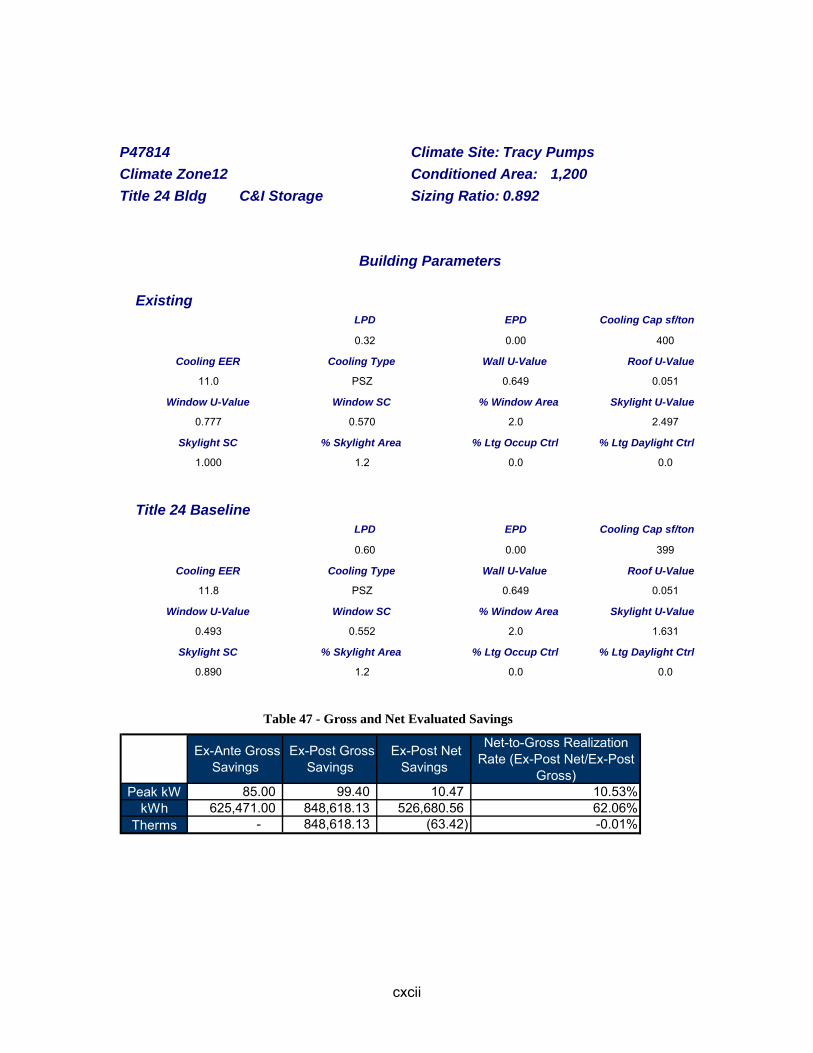
cxcii
P47814 Climate Site: Tracy Pumps Climate Zone12 Conditioned Area: 1,200 Title 24 Bldg C&I Storage Sizing Ratio: 0.892
Building Parameters
Existing LPD EPD Cooling Cap sf/ton 0.32 0.00 400 Cooling EER Cooling Type Wall U-Value Roof U-Value 11.0 PSZ 0.649 0.051 Window U-Value Window SC % Window Area Skylight U-Value 0.777 0.570 2.0 2.497 Skylight SC % Skylight Area % Ltg Occup Ctrl % Ltg Daylight Ctrl 1.000 1.2 0.0 0.0
Title 24 Baseline LPD EPD Cooling Cap sf/ton 0.60 0.00 399 Cooling EER Cooling Type Wall U-Value Roof U-Value 11.8 PSZ 0.649 0.051 Window U-Value Window SC % Window Area Skylight U-Value 0.493 0.552 2.0 1.631 Skylight SC % Skylight Area % Ltg Occup Ctrl % Ltg Daylight Ctrl 0.890 1.2 0.0 0.0
Table 47 - Gross and Net Evaluated Savings
Ex-Ante Gross Savings
Ex-Post Gross Savings
Ex-Post Net Savings
Net-to-Gross Realization Rate (Ex-Post Net/Ex-Post
Gross)Peak kW 85.00 99.40 10.47 10.53%
kWh 625,471.00 848,618.13 526,680.56 62.06%Therms - 848,618.13 (63.42) -0.01%
cxciii
Building Overview Notes Lower LPD than Ex-Ante projection, hence higher realization rate

cxciv
P48014 Climate Site: Paso Robles AP Climate Zone: 4 Conditioned Area: 6,720 Title 24 Bldg Retail and Wholesale Store Sizing Ratio: 0.953
Building Parameters
Existing LPD EPD Cooling Cap sf/ton 0.48 4.59 354 Cooling EER Cooling Type Wall U-Value Roof U-Value 11.0 PSZ 0.049 0.054 Window U-Value Window SC % Window Area Skylight U-Value 1.433 0.920 16.7 0.823 Skylight SC % Skylight Area % Ltg Occup Ctrl % Ltg Daylight Ctrl 0.540 1.1 13.0 0.0
Title 24 Baseline LPD EPD Cooling Cap sf/ton 1.27 4.59 354 Cooling EER Cooling Type Wall U-Value Roof U-Value 9.0 PSZ 0.092 0.077 Window U-Value Window SC % Window Area Skylight U-Value 0.883 0.643 16.7 1.595 Skylight SC % Skylight Area % Ltg Occup Ctrl % Ltg Daylight Ctrl 0.910 1.1 0.0 0.0
Table 48 - Gross and Net Evaluated Savings
Ex-Ante Gross Savings
Ex-Post Gross Savings
Ex-Post Net Savings
Net-to-Gross Realization Rate (Ex-Post Net/Ex-Post
Gross)Peak kW 25.00 13.29 13.28 99.95%
kWh 83,691.00 39,592.74 39,544.17 99.88%Therms - 39,592.74 (5.50) -0.01%
cxcv
Building Overview Notes This site was partially 2001 baseline and 2005 baseline . The site was broken up into 2 models. 1 using the 2001 baseline and 1 using 2005 baseline. The savings for both models are then combined to calculate savings -Unit C/D was not occupied during site visit. Scheduled for Occupancy on January 2009. Not completely built out yet. -Observed in field that most of AC units installed have lower SEER efficiency than what was used in original calculations. -Did not see DHW heater on premise; may be in inaccessible room. Inputted model shown in T-24 docs instead. -Mitsubishi AC installed later by tenant. Results: **Baseline is 2001 title 24 code, per file for units A and B. Low realized savings due to incomplete buildout of units C/D which accounts for about 40% of the HVAC needs. However, a second simulation run with a "mock tenant" in place yielded savings of kWh=46% and kW=76% based on 2001 title 24 code. However, I believe the utuilities overestimated the savings based on the equipment and conditions found onsite. Particularly, the HVAC units are not mch more efficient than 2005 title 24 code which is what units C/D are using as their baselines (per file).
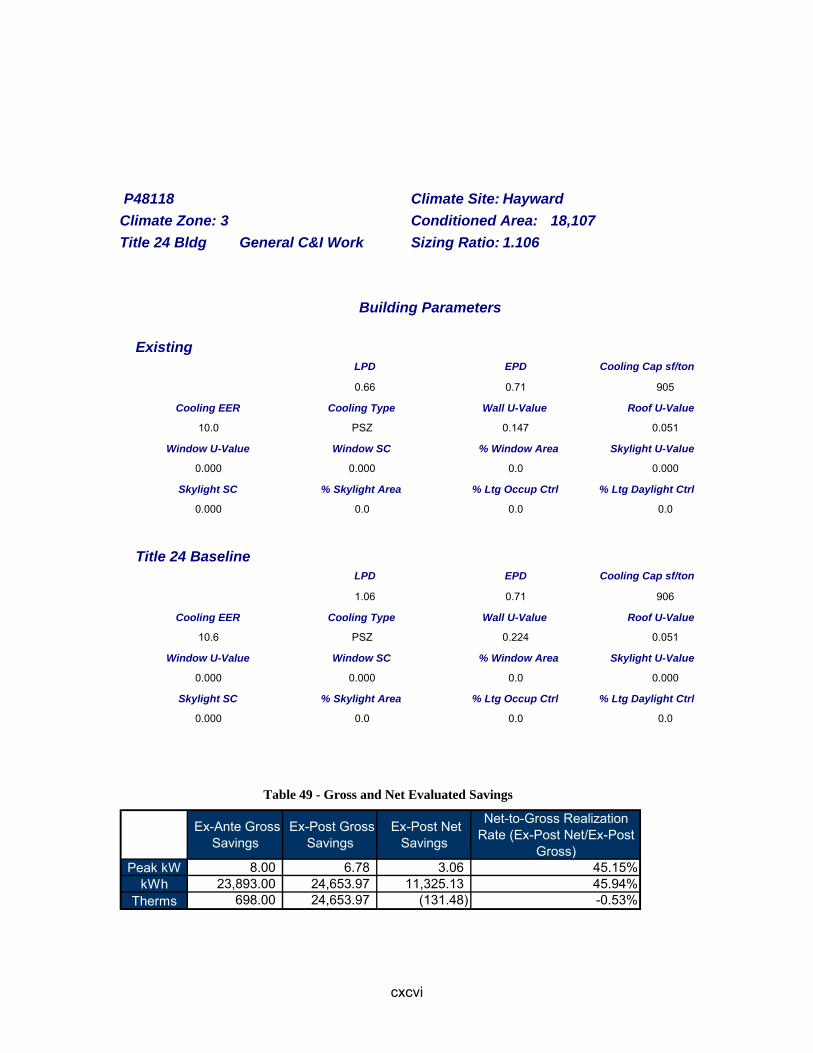
cxcvi
P48118 Climate Site: Hayward Climate Zone: 3 Conditioned Area: 18,107 Title 24 Bldg General C&I Work Sizing Ratio: 1.106
Building Parameters
Existing LPD EPD Cooling Cap sf/ton 0.66 0.71 905 Cooling EER Cooling Type Wall U-Value Roof U-Value 10.0 PSZ 0.147 0.051 Window U-Value Window SC % Window Area Skylight U-Value 0.000 0.000 0.0 0.000 Skylight SC % Skylight Area % Ltg Occup Ctrl % Ltg Daylight Ctrl 0.000 0.0 0.0 0.0
Title 24 Baseline LPD EPD Cooling Cap sf/ton 1.06 0.71 906 Cooling EER Cooling Type Wall U-Value Roof U-Value 10.6 PSZ 0.224 0.051 Window U-Value Window SC % Window Area Skylight U-Value 0.000 0.000 0.0 0.000 Skylight SC % Skylight Area % Ltg Occup Ctrl % Ltg Daylight Ctrl 0.000 0.0 0.0 0.0
Table 49 - Gross and Net Evaluated Savings
Ex-Ante Gross Savings
Ex-Post Gross Savings
Ex-Post Net Savings
Net-to-Gross Realization Rate (Ex-Post Net/Ex-Post
Gross)Peak kW 8.00 6.78 3.06 45.15%
kWh 23,893.00 24,653.97 11,325.13 45.94%Therms 698.00 24,653.97 (131.48) -0.53%
cxcvii
Building Overview Notes s. Original estimates uses eQuest to estimate savings from improved insulation and combines that with a general equation for the furnaces. Details are not given, but the low therms realization is probably a reflection of how our modeling engine treats the insulation measure in combination with the furnace measure. (note that the insulation improvement is very minor from R-11 to R-12 in most walls and R-19 in one wall, consistent with our model, so I suspect there is some over estimation of savings in the original estimates. I built a similar eQuest model and it only shows a therms savings of 26-147 therms based o R-12 through R-19 walls for the insulation measure whereas the original estimates 439 therms). The original approach mixes evaluation methods and may not be accurate. Likely used no insulation as the baseline.
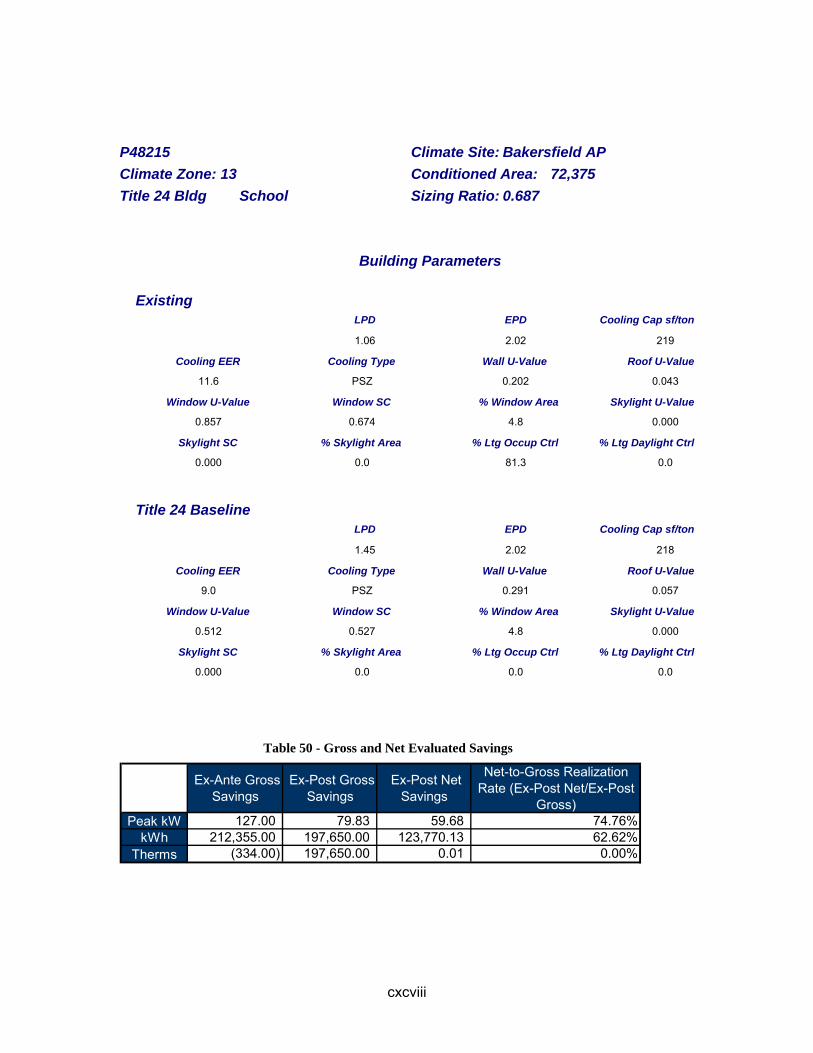
cxcviii
P48215 Climate Site: Bakersfield AP Climate Zone: 13 Conditioned Area: 72,375 Title 24 Bldg School Sizing Ratio: 0.687
Building Parameters
Existing LPD EPD Cooling Cap sf/ton 1.06 2.02 219 Cooling EER Cooling Type Wall U-Value Roof U-Value 11.6 PSZ 0.202 0.043 Window U-Value Window SC % Window Area Skylight U-Value 0.857 0.674 4.8 0.000 Skylight SC % Skylight Area % Ltg Occup Ctrl % Ltg Daylight Ctrl 0.000 0.0 81.3 0.0
Title 24 Baseline LPD EPD Cooling Cap sf/ton 1.45 2.02 218 Cooling EER Cooling Type Wall U-Value Roof U-Value 9.0 PSZ 0.291 0.057 Window U-Value Window SC % Window Area Skylight U-Value 0.512 0.527 4.8 0.000 Skylight SC % Skylight Area % Ltg Occup Ctrl % Ltg Daylight Ctrl 0.000 0.0 0.0 0.0
Table 50 - Gross and Net Evaluated Savings
Ex-Ante Gross Savings
Ex-Post Gross Savings
Ex-Post Net Savings
Net-to-Gross Realization Rate (Ex-Post Net/Ex-Post
Gross)Peak kW 127.00 79.83 59.68 74.76%
kWh 212,355.00 197,650.00 123,770.13 62.62%Therms (334.00) 197,650.00 0.01 0.00%

cxcix
P48571 Climate Site: South San Francisco Climate Zone: 3 Conditioned Area: 6,288 Title 24 Bldg Community Center Sizing Ratio: 1.125
Building Parameters
Existing LPD EPD Cooling Cap sf/ton 0.98 1.57 159 Cooling EER Cooling Type Wall U-Value Roof U-Value 10.8 PSZ 0.108 0.038 Window U-Value Window SC % Window Area Skylight U-Value 0.262 0.445 25.9 0.480 Skylight SC % Skylight Area % Ltg Occup Ctrl % Ltg Daylight Ctrl 0.390 1.5 64.7 0.0
Title 24 Baseline LPD EPD Cooling Cap sf/ton 1.34 1.57 159 Cooling EER Cooling Type Wall U-Value Roof U-Value 10.2 PSZ 0.649 0.051 Window U-Value Window SC % Window Area Skylight U-Value 0.839 0.475 25.9 0.967 Skylight SC % Skylight Area % Ltg Occup Ctrl % Ltg Daylight Ctrl 0.910 1.5 0.0 0.0
Table 51 - Gross and Net Evaluated Savings
Ex-Ante Gross Savings
Ex-Post Gross Savings
Ex-Post Net Savings
Net-to-Gross Realization Rate (Ex-Post Net/Ex-Post
Gross)Peak kW 10.00 1.55 0.67 43.12%
kWh 14,150.00 3,883.75 1,450.87 37.36%Therms 433.00 3,883.75 379.53 9.77%

cc
Building Overview Notes
Site is a community center with a large meeting room, a small kitchen, a couple of offices, a large storage area, and restrooms. The offices are staffed during the workday but the meeting room is typically in use only an hour or two a day.

cci
P50646 Climate Site: Clovis Climate Zone: 13 Conditioned Area: 23,700 Title 24 Bldg Retail and Wholesale Store Sizing Ratio: 0.760
Building Parameters
Existing LPD EPD Cooling Cap sf/ton 1.30 2.59 499 Cooling EER Cooling Type Wall U-Value Roof U-Value 11.0 PSZ 0.649 0.051 Window U-Value Window SC % Window Area Skylight U-Value 1.409 0.940 0.8 0.000 Skylight SC % Skylight Area % Ltg Occup Ctrl % Ltg Daylight Ctrl 0.000 0.0 0.0 0.0
Title 24 Baseline LPD EPD Cooling Cap sf/ton 1.38 2.59 499 Cooling EER Cooling Type Wall U-Value Roof U-Value 10.3 PSZ 0.649 0.051 Window U-Value Window SC % Window Area Skylight U-Value 0.493 0.700 0.8 0.000 Skylight SC % Skylight Area % Ltg Occup Ctrl % Ltg Daylight Ctrl 0.000 0.0 0.0 0.0
Table 52 - Gross and Net Evaluated Savings
Ex-Ante Gross Savings
Ex-Post Gross Savings
Ex-Post Net Savings
Net-to-Gross Realization Rate (Ex-Post Net/Ex-Post
Gross)Peak kW 4.00 2.95 0.34 11.50%
kWh 5,261.00 4,424.00 497.13 11.24%Therms - 4,424.00 0.47 0.01%

ccii
Building Overview Notes . all RTU's 11.0 and 11.3 EER

cciii
P50706 Climate Site: Vallejo Climate Zone: 3 Conditioned Area: 3,442 Title 24 Bldg C&I Storage Sizing Ratio: 1.149
Building Parameters
Existing LPD EPD Cooling Cap sf/ton 0.21 0.09 430 Cooling EER Cooling Type Wall U-Value Roof U-Value 2.0 PSZ 0.147 0.079 Window U-Value Window SC % Window Area Skylight U-Value 0.777 0.570 0.6 2.462 Skylight SC % Skylight Area % Ltg Occup Ctrl % Ltg Daylight Ctrl 0.260 1.1 81.3 0.0
Title 24 Baseline LPD EPD Cooling Cap sf/ton 0.61 0.09 430 Cooling EER Cooling Type Wall U-Value Roof U-Value 11.5 PSZ 0.649 0.051 Window U-Value Window SC % Window Area Skylight U-Value 0.839 0.700 0.6 1.941 Skylight SC % Skylight Area % Ltg Occup Ctrl % Ltg Daylight Ctrl 0.910 1.1 0.0 0.0
Table 53 - Gross and Net Evaluated Savings
Ex-Ante Gross Savings
Ex-Post Gross Savings
Ex-Post Net Savings
Net-to-Gross Realization Rate (Ex-Post Net/Ex-Post
Gross)Peak kW 58.00 80.71 64.64 80.09%
kWh 698,708.00 295,405.47 202,717.77 68.62%Therms - 295,405.47 (3.66) 0.00%
cciv
Building Overview Notes Program savings are based on 24/7, but warehouse actually runs on a 60-hour workweek. Office A/C units are 10 SEER and occupants run fans 24/7 which accounts for some of the negative HVAC savings.
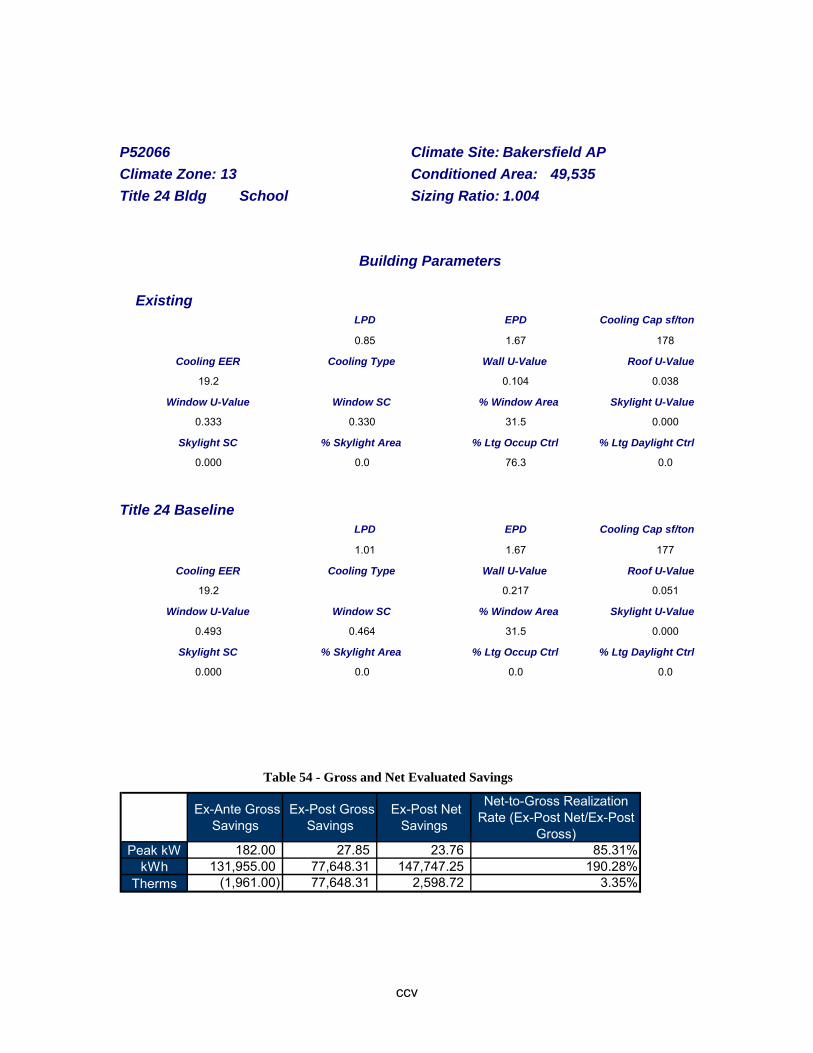
ccv
P52066 Climate Site: Bakersfield AP Climate Zone: 13 Conditioned Area: 49,535 Title 24 Bldg School Sizing Ratio: 1.004
Building Parameters
Existing LPD EPD Cooling Cap sf/ton 0.85 1.67 178 Cooling EER Cooling Type Wall U-Value Roof U-Value 19.2 0.104 0.038 Window U-Value Window SC % Window Area Skylight U-Value 0.333 0.330 31.5 0.000 Skylight SC % Skylight Area % Ltg Occup Ctrl % Ltg Daylight Ctrl 0.000 0.0 76.3 0.0
Title 24 Baseline LPD EPD Cooling Cap sf/ton 1.01 1.67 177 Cooling EER Cooling Type Wall U-Value Roof U-Value 19.2 0.217 0.051 Window U-Value Window SC % Window Area Skylight U-Value 0.493 0.464 31.5 0.000 Skylight SC % Skylight Area % Ltg Occup Ctrl % Ltg Daylight Ctrl 0.000 0.0 0.0 0.0
Table 54 - Gross and Net Evaluated Savings
Ex-Ante Gross Savings
Ex-Post Gross Savings
Ex-Post Net Savings
Net-to-Gross Realization Rate (Ex-Post Net/Ex-Post
Gross)Peak kW 182.00 27.85 23.76 85.31%
kWh 131,955.00 77,648.31 147,747.25 190.28%Therms (1,961.00) 77,648.31 2,598.72 3.35%

ccvi
Building Overview Notes -plug loads are estimated based on typical occupancy and partial survey -space areas are derived from measurements on site using plans and with LTG-4-c document

ccvii
P52291 Climate Site: Monterey AP Climate Zone: 3 Conditioned Area: 135,260 Title 24 Bldg Grocery Store Sizing Ratio: 1.181
Building Parameters
Existing LPD EPD Cooling Cap sf/ton 0.92 1.10 604 Cooling EER Cooling Type Wall U-Value Roof U-Value 10.3 PSZ 0.151 0.051 Window U-Value Window SC % Window Area Skylight U-Value 0.000 0.000 0.0 1.547 Skylight SC % Skylight Area % Ltg Occup Ctrl % Ltg Daylight Ctrl 0.490 3.6 0.0 29.5
Title 24 Baseline LPD EPD Cooling Cap sf/ton 1.64 1.10 605 Cooling EER Cooling Type Wall U-Value Roof U-Value 9.6 PSZ 0.649 0.051 Window U-Value Window SC % Window Area Skylight U-Value 0.000 0.000 0.0 1.922 Skylight SC % Skylight Area % Ltg Occup Ctrl % Ltg Daylight Ctrl 0.750 3.6 0.0 0.0
Table 55 - Gross and Net Evaluated Savings
Ex-Ante Gross Savings
Ex-Post Gross Savings
Ex-Post Net Savings
Net-to-Gross Realization Rate (Ex-Post Net/Ex-Post
Gross)Peak kW 127.00 75.68 25.70 33.96%
kWh 555,477.00 713,793.00 497,011.50 69.63%Therms (4,082.00) 713,793.00 2.71 0.00%

ccviii
P52886X Climate Site: Stockton AP Climate Zone: 12 Conditioned Area: 65,400 Title 24 Bldg Office Sizing Ratio: 1.125
Building Parameters
Existing LPD EPD Cooling Cap sf/ton 0.72 0.00 282 Cooling EER Cooling Type Wall U-Value Roof U-Value 12.5 PSZ 0.220 0.051 Window U-Value Window SC % Window Area Skylight U-Value 0.659 0.874 16.5 0.000 Skylight SC % Skylight Area % Ltg Occup Ctrl % Ltg Daylight Ctrl 0.000 0.0 50.0 0.0
Title 24 Baseline LPD EPD Cooling Cap sf/ton 1.11 0.00 285 Cooling EER Cooling Type Wall U-Value Roof U-Value 9.9 PSZ 0.649 0.051 Window U-Value Window SC % Window Area Skylight U-Value 0.493 0.449 16.5 0.000 Skylight SC % Skylight Area % Ltg Occup Ctrl % Ltg Daylight Ctrl 0.000 0.0 0.0 0.0
Table 56 - Gross and Net Evaluated Savings
Ex-Ante Gross Savings
Ex-Post Gross Savings
Ex-Post Net Savings
Net-to-Gross Realization Rate (Ex-Post Net/Ex-Post
Gross)Peak kW 124.00 54.02 54.02 100.00%
kWh 141,371.00 133,147.19 133,147.19 100.00%Therms 1,355.00 133,147.19 72.56 0.05%
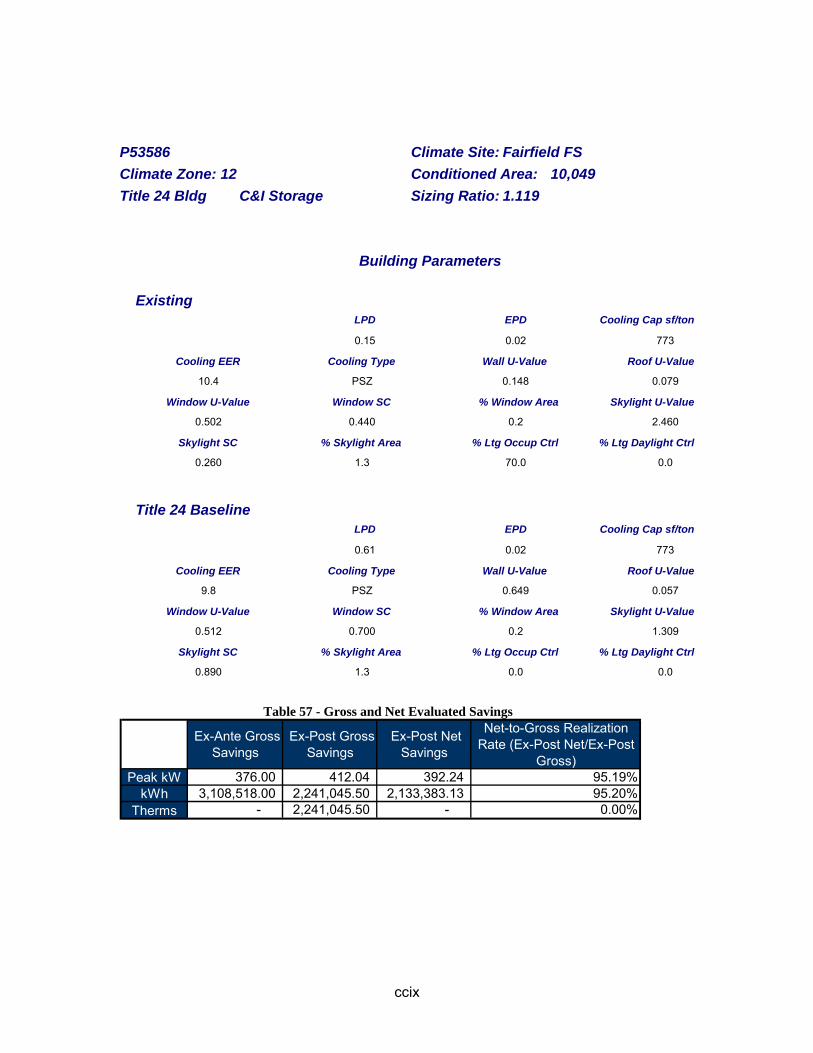
ccix
P53586 Climate Site: Fairfield FS Climate Zone: 12 Conditioned Area: 10,049 Title 24 Bldg C&I Storage Sizing Ratio: 1.119
Building Parameters
Existing LPD EPD Cooling Cap sf/ton 0.15 0.02 773 Cooling EER Cooling Type Wall U-Value Roof U-Value 10.4 PSZ 0.148 0.079 Window U-Value Window SC % Window Area Skylight U-Value 0.502 0.440 0.2 2.460 Skylight SC % Skylight Area % Ltg Occup Ctrl % Ltg Daylight Ctrl 0.260 1.3 70.0 0.0
Title 24 Baseline LPD EPD Cooling Cap sf/ton 0.61 0.02 773 Cooling EER Cooling Type Wall U-Value Roof U-Value 9.8 PSZ 0.649 0.057 Window U-Value Window SC % Window Area Skylight U-Value 0.512 0.700 0.2 1.309 Skylight SC % Skylight Area % Ltg Occup Ctrl % Ltg Daylight Ctrl 0.890 1.3 0.0 0.0
Table 57 - Gross and Net Evaluated Savings
Ex-Ante Gross Savings
Ex-Post Gross Savings
Ex-Post Net Savings
Net-to-Gross Realization Rate (Ex-Post Net/Ex-Post
Gross)Peak kW 376.00 412.04 392.24 95.19%
kWh 3,108,518.00 2,241,045.50 2,133,383.13 95.20%Therms - 2,241,045.50 - 0.00%

ccx
P54486 Climate Site: San Francisco CO Climate Zone: 3 Conditioned Area: 19,232 Title 24 Bldg School Sizing Ratio: 0.133
Building Parameters
Existing LPD EPD Cooling Cap sf/ton 0.97 1.03 2404 Cooling EER Cooling Type Wall U-Value Roof U-Value 11.3 PVAV 0.093 0.045 Window U-Value Window SC % Window Area Skylight U-Value 0.216 0.710 10.0 0.000 Skylight SC % Skylight Area % Ltg Occup Ctrl % Ltg Daylight Ctrl 0.000 0.0 1.8 46.9
Title 24 Baseline LPD EPD Cooling Cap sf/ton 1.18 1.03 2461 Cooling EER Cooling Type Wall U-Value Roof U-Value 11.8 PVAV 0.093 0.045 Window U-Value Window SC % Window Area Skylight U-Value 0.839 0.700 10.0 0.000 Skylight SC % Skylight Area % Ltg Occup Ctrl % Ltg Daylight Ctrl 0.000 0.0 0.0 0.0
Table 58 - Gross and Net Evaluated Savings
Ex-Ante Gross Savings
Ex-Post Gross Savings
Ex-Post Net Savings
Net-to-Gross Realization Rate (Ex-Post Net/Ex-Post
Gross)Peak kW 45.00 2.08 (8.35) -401.15%
kWh 49,961.00 30,331.52 549.68 1.81%Therms 6,680.00 30,331.52 1,643.46 5.42%
ccxi
Building Overview Notes
Small high school. Designed for ~200 students, currently has ~160 enrolled. Building occupied in September 2007 at 25% capacity (freshman class only), increased to 50% in September 2008 (freshman, sophomore classes) and hit 75% in September 2009 (freshman, sophomore, and junior classes). No A/C. Ventilation system remains from old building. Boiler and pump are new, VSD motors on fans are new.

ccxii
P55808 Climate Site: Bakersfield AP Climate Zone: 13 Conditioned Area: 136,980 Title 24 Bldg School Sizing Ratio: 1.190
Building Parameters
Existing LPD EPD Cooling Cap sf/ton 1.12 0.67 151 Cooling EER Cooling Type Wall U-Value Roof U-Value 25.3 0.066 0.032 Window U-Value Window SC % Window Area Skylight U-Value 0.493 0.505 12.9 0.000 Skylight SC % Skylight Area % Ltg Occup Ctrl % Ltg Daylight Ctrl 0.000 0.0 61.0 0.0
Title 24 Baseline LPD EPD Cooling Cap sf/ton 1.20 0.67 152 Cooling EER Cooling Type Wall U-Value Roof U-Value 19.6 0.195 0.051 Window U-Value Window SC % Window Area Skylight U-Value 0.493 0.448 12.9 0.000 Skylight SC % Skylight Area % Ltg Occup Ctrl % Ltg Daylight Ctrl 0.000 0.0 0.0 0.0
Table 59 - Gross and Net Evaluated Savings
Ex-Ante Gross Savings
Ex-Post Gross Savings
Ex-Post Net Savings
Net-to-Gross Realization Rate (Ex-Post Net/Ex-Post
Gross)Peak kW 634.00 98.59 81.55 82.72%
kWh 209,766.00 255,583.00 213,507.63 83.54%Therms 6,219.00 255,583.00 6,474.44 2.53%
ccxiii
Building Overview Notes *kW is below parameter chiefly due to a difference in LPD in the majority of the buildings. I do not believe their LPD results as they seem artificially low. LPD in our model are derived from square footage found in the plans on an area classification basis and matched with the lighting plans. Data Entry Notes: -Surveyed buildings 100,200,300,600,700,800,900,1000,1100 since these are the ones that qualified for incentives -Year first occupied/conditioned is 2007 -class300 space (music/choir classrooms) and auditorium do indeed have high LPD -plug loads are estimated

ccxiv
P57266 Climate Site: Modesto Climate Zone: 12 Conditioned Area: 52,869 Title 24 Bldg Grocery Store Sizing Ratio: 1.318
Building Parameters
Existing LPD EPD Cooling Cap sf/ton 1.42 0.47 307 Cooling EER Cooling Type Wall U-Value Roof U-Value 10.6 MIXED 0.105 0.041 Window U-Value Window SC % Window Area Skylight U-Value 0.857 0.680 6.2 2.180 Skylight SC % Skylight Area % Ltg Occup Ctrl % Ltg Daylight Ctrl 0.780 3.1 0.0 0.0
Title 24 Baseline LPD EPD Cooling Cap sf/ton 1.52 0.47 311 Cooling EER Cooling Type Wall U-Value Roof U-Value 9.1 MIXED 0.328 0.057 Window U-Value Window SC % Window Area Skylight U-Value 0.512 0.540 6.2 1.309 Skylight SC % Skylight Area % Ltg Occup Ctrl % Ltg Daylight Ctrl 0.710 3.1 0.0 0.0
Table 60 - Gross and Net Evaluated Savings
Ex-Ante Gross Savings
Ex-Post Gross Savings
Ex-Post Net Savings
Net-to-Gross Realization Rate (Ex-Post Net/Ex-Post
Gross)Peak kW 71.00 68.68 66.67 97.07%
kWh 463,004.00 548,317.25 513,271.75 93.61%Therms (12,410.00) 548,317.25 - 0.00%

ccxv
P57286 Climate Site: Modesto Climate Zone: 12 Conditioned Area: 53,114 Title 24 Bldg Grocery Store Sizing Ratio: 1.309
Building Parameters
Existing LPD EPD Cooling Cap sf/ton 1.38 0.54 309 Cooling EER Cooling Type Wall U-Value Roof U-Value 10.6 MIXED 0.105 0.041 Window U-Value Window SC % Window Area Skylight U-Value 0.857 0.680 5.9 2.180 Skylight SC % Skylight Area % Ltg Occup Ctrl % Ltg Daylight Ctrl 0.780 3.2 0.0 0.0
Title 24 Baseline LPD EPD Cooling Cap sf/ton 1.52 0.54 311 Cooling EER Cooling Type Wall U-Value Roof U-Value 9.1 MIXED 0.347 0.057 Window U-Value Window SC % Window Area Skylight U-Value 0.512 0.540 5.9 1.309 Skylight SC % Skylight Area % Ltg Occup Ctrl % Ltg Daylight Ctrl 0.710 3.2 0.0 0.0
Table 61 - Gross and Net Evaluated Savings
Ex-Ante Gross Savings
Ex-Post Gross Savings
Ex-Post Net Savings
Net-to-Gross Realization Rate (Ex-Post Net/Ex-Post
Gross)Peak kW 75.00 65.96 64.87 98.34%
kWh 465,922.00 503,822.63 476,233.00 94.52%Therms (13,648.00) 503,822.63 0.00 0.00%
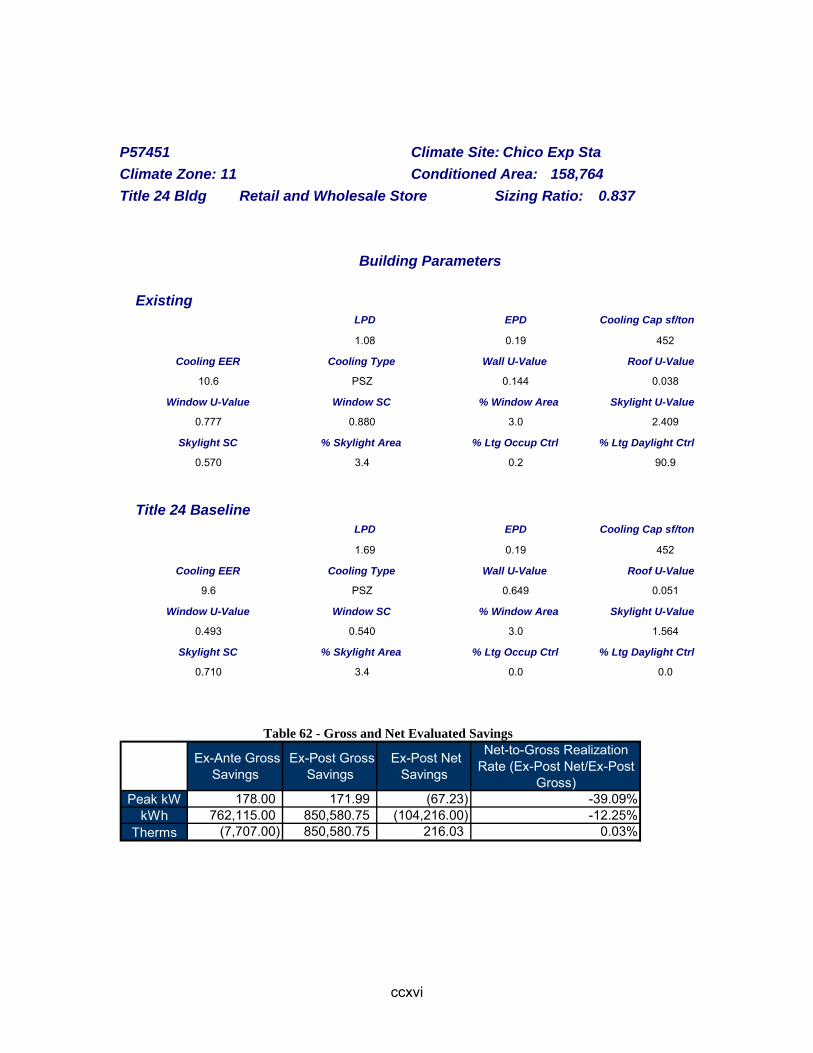
ccxvi
P57451 Climate Site: Chico Exp Sta Climate Zone: 11 Conditioned Area: 158,764 Title 24 Bldg Retail and Wholesale Store Sizing Ratio: 0.837
Building Parameters
Existing LPD EPD Cooling Cap sf/ton 1.08 0.19 452 Cooling EER Cooling Type Wall U-Value Roof U-Value 10.6 PSZ 0.144 0.038 Window U-Value Window SC % Window Area Skylight U-Value 0.777 0.880 3.0 2.409 Skylight SC % Skylight Area % Ltg Occup Ctrl % Ltg Daylight Ctrl 0.570 3.4 0.2 90.9
Title 24 Baseline LPD EPD Cooling Cap sf/ton 1.69 0.19 452 Cooling EER Cooling Type Wall U-Value Roof U-Value 9.6 PSZ 0.649 0.051 Window U-Value Window SC % Window Area Skylight U-Value 0.493 0.540 3.0 1.564 Skylight SC % Skylight Area % Ltg Occup Ctrl % Ltg Daylight Ctrl 0.710 3.4 0.0 0.0
Table 62 - Gross and Net Evaluated Savings
Ex-Ante Gross Savings
Ex-Post Gross Savings
Ex-Post Net Savings
Net-to-Gross Realization Rate (Ex-Post Net/Ex-Post
Gross)Peak kW 178.00 171.99 (67.23) -39.09%
kWh 762,115.00 850,580.75 (104,216.00) -12.25%Therms (7,707.00) 850,580.75 216.03 0.03%
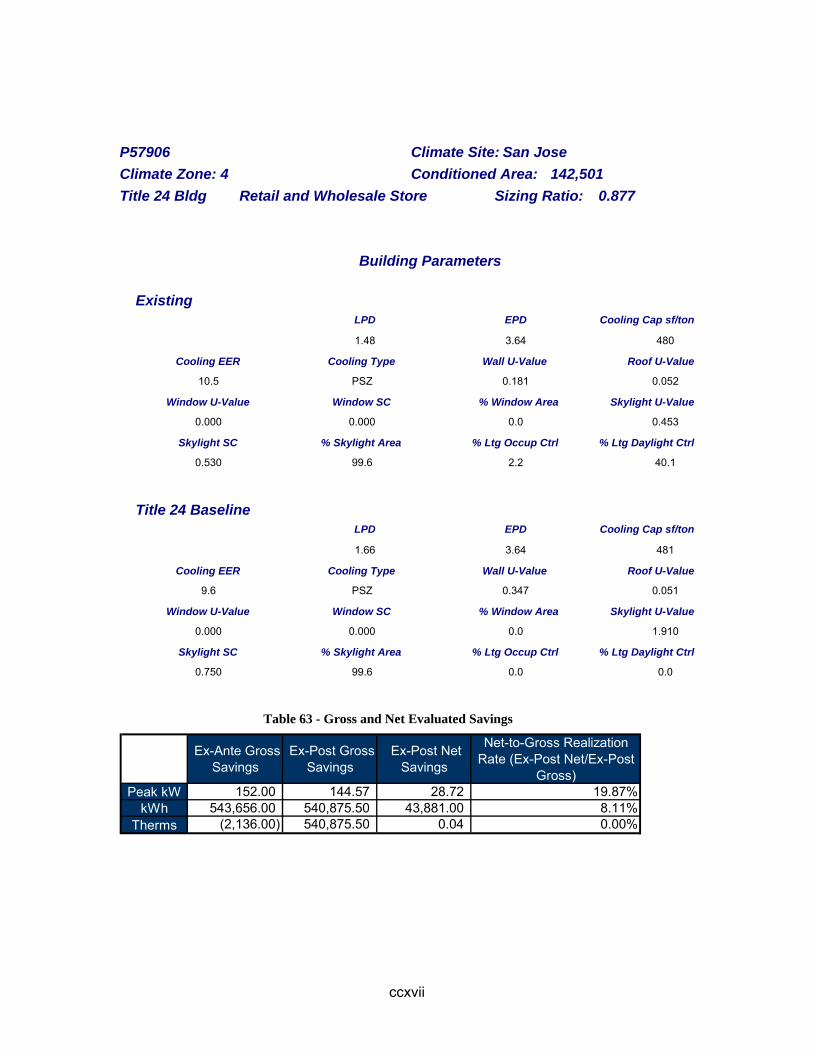
ccxvii
P57906 Climate Site: San Jose Climate Zone: 4 Conditioned Area: 142,501 Title 24 Bldg Retail and Wholesale Store Sizing Ratio: 0.877
Building Parameters
Existing LPD EPD Cooling Cap sf/ton 1.48 3.64 480 Cooling EER Cooling Type Wall U-Value Roof U-Value 10.5 PSZ 0.181 0.052 Window U-Value Window SC % Window Area Skylight U-Value 0.000 0.000 0.0 0.453 Skylight SC % Skylight Area % Ltg Occup Ctrl % Ltg Daylight Ctrl 0.530 99.6 2.2 40.1
Title 24 Baseline LPD EPD Cooling Cap sf/ton 1.66 3.64 481 Cooling EER Cooling Type Wall U-Value Roof U-Value 9.6 PSZ 0.347 0.051 Window U-Value Window SC % Window Area Skylight U-Value 0.000 0.000 0.0 1.910 Skylight SC % Skylight Area % Ltg Occup Ctrl % Ltg Daylight Ctrl 0.750 99.6 0.0 0.0
Table 63 - Gross and Net Evaluated Savings
Ex-Ante Gross Savings
Ex-Post Gross Savings
Ex-Post Net Savings
Net-to-Gross Realization Rate (Ex-Post Net/Ex-Post
Gross)Peak kW 152.00 144.57 28.72 19.87%
kWh 543,656.00 540,875.50 43,881.00 8.11%Therms (2,136.00) 540,875.50 0.04 0.00%
ccxviii
Building Overview Notes
Pre-fabricated buildings were surveyed on site. Peremeter info was obtained from the as builts but lighting and appliance info was collected during the site visit.
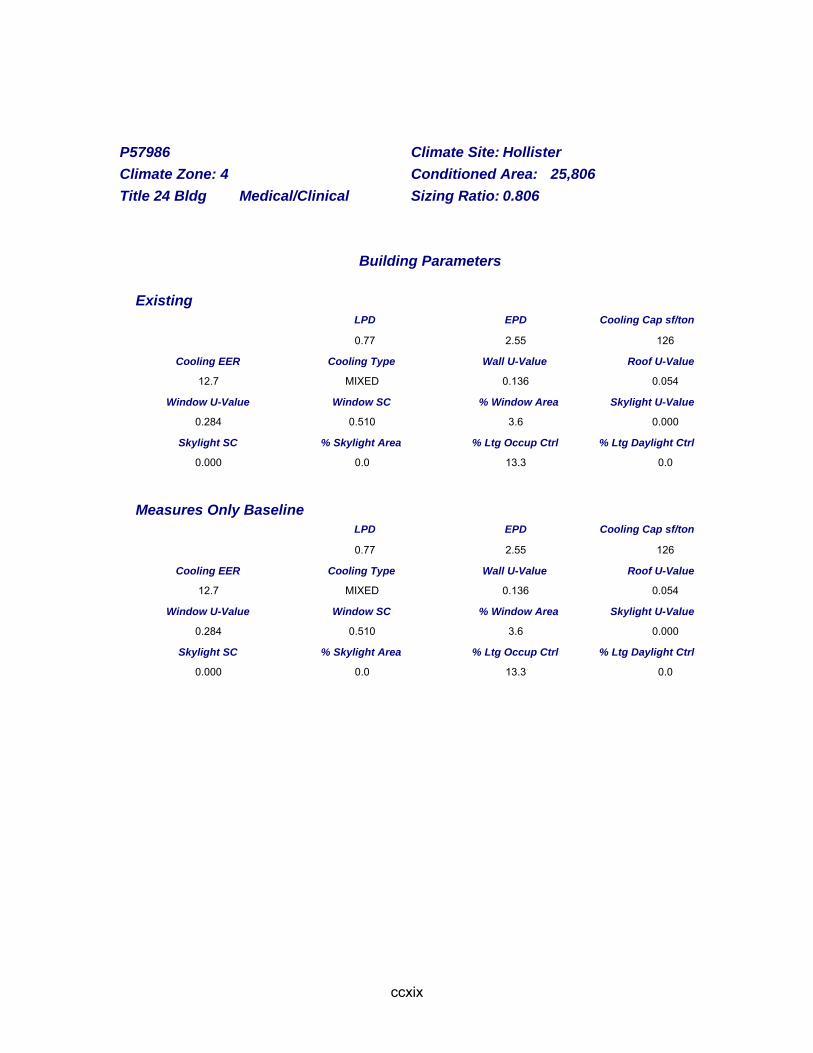
ccxix
P57986 Climate Site: Hollister Climate Zone: 4 Conditioned Area: 25,806 Title 24 Bldg Medical/Clinical Sizing Ratio: 0.806
Building Parameters
Existing LPD EPD Cooling Cap sf/ton 0.77 2.55 126 Cooling EER Cooling Type Wall U-Value Roof U-Value 12.7 MIXED 0.136 0.054 Window U-Value Window SC % Window Area Skylight U-Value 0.284 0.510 3.6 0.000 Skylight SC % Skylight Area % Ltg Occup Ctrl % Ltg Daylight Ctrl 0.000 0.0 13.3 0.0
Measures Only Baseline LPD EPD Cooling Cap sf/ton 0.77 2.55 126 Cooling EER Cooling Type Wall U-Value Roof U-Value 12.7 MIXED 0.136 0.054 Window U-Value Window SC % Window Area Skylight U-Value 0.284 0.510 3.6 0.000 Skylight SC % Skylight Area % Ltg Occup Ctrl % Ltg Daylight Ctrl 0.000 0.0 13.3 0.0
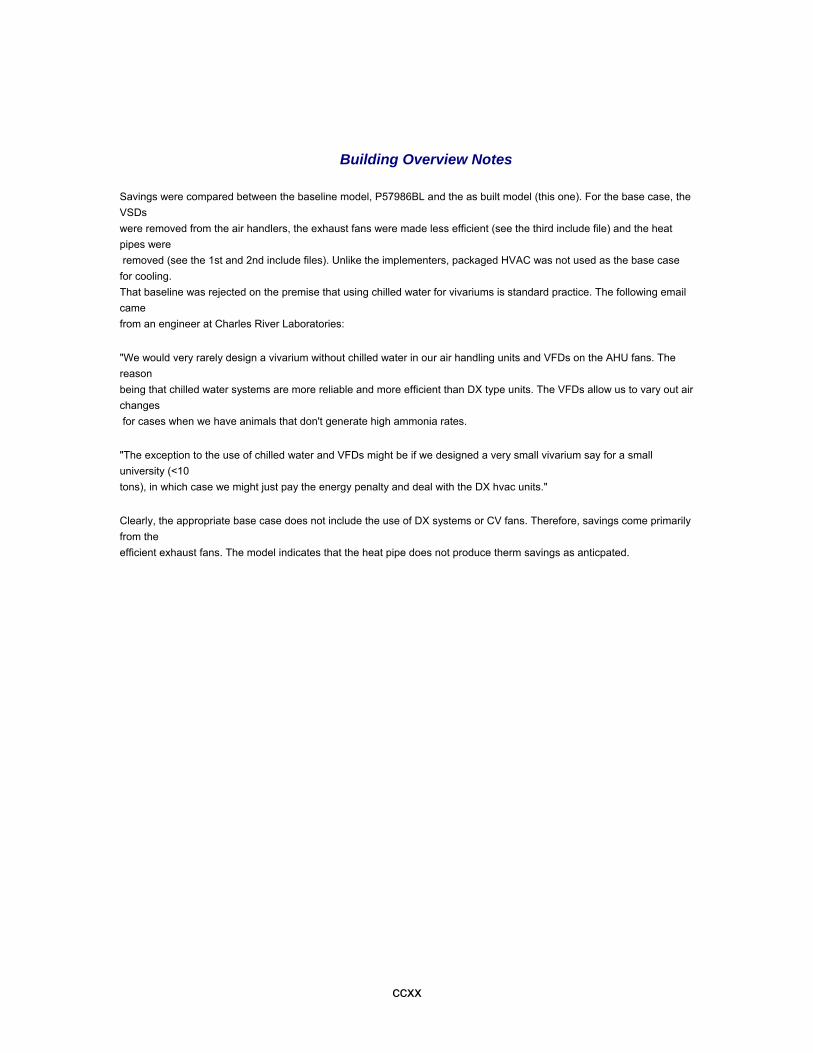
ccxx
Building Overview Notes Savings were compared between the baseline model, P57986BL and the as built model (this one). For the base case, the VSDs were removed from the air handlers, the exhaust fans were made less efficient (see the third include file) and the heat pipes were removed (see the 1st and 2nd include files). Unlike the implementers, packaged HVAC was not used as the base case for cooling. That baseline was rejected on the premise that using chilled water for vivariums is standard practice. The following email came from an engineer at Charles River Laboratories: "We would very rarely design a vivarium without chilled water in our air handling units and VFDs on the AHU fans. The reason being that chilled water systems are more reliable and more efficient than DX type units. The VFDs allow us to vary out air changes for cases when we have animals that don't generate high ammonia rates. "The exception to the use of chilled water and VFDs might be if we designed a very small vivarium say for a small university (<10 tons), in which case we might just pay the energy penalty and deal with the DX hvac units." Clearly, the appropriate base case does not include the use of DX systems or CV fans. Therefore, savings come primarily from the efficient exhaust fans. The model indicates that the heat pipe does not produce therm savings as anticpated.

ccxxi
P58326 Climate Site: Antioch Climate Zone: 12 Conditioned Area: 100,543 Title 24 Bldg Retail and Wholesale Store Sizing Ratio: 0.737
Building Parameters
Existing LPD EPD Cooling Cap sf/ton 1.07 1.34 513 Cooling EER Cooling Type Wall U-Value Roof U-Value 10.7 PSZ 0.649 0.051 Window U-Value Window SC % Window Area Skylight U-Value 0.000 0.000 0.0 0.000 Skylight SC % Skylight Area % Ltg Occup Ctrl % Ltg Daylight Ctrl 0.000 0.0 3.4 0.0
Title 24 Baseline LPD EPD Cooling Cap sf/ton 1.59 1.34 513 Cooling EER Cooling Type Wall U-Value Roof U-Value 9.6 PSZ 0.649 0.051 Window U-Value Window SC % Window Area Skylight U-Value 0.000 0.000 0.0 1.547 Skylight SC % Skylight Area % Ltg Occup Ctrl % Ltg Daylight Ctrl 0.890 0.7 0.0 0.0
Table 64 - Gross and Net Evaluated Savings
Ex-Ante Gross Savings
Ex-Post Gross Savings
Ex-Post Net Savings
Net-to-Gross Realization Rate (Ex-Post Net/Ex-Post
Gross)Peak kW 22.00 55.68 22.46 40.34%
kWh 118,124.00 215,376.44 89,613.25 41.61%Therms (659.00) 215,376.44 (455.84) -0.21%

ccxxii
P61766 Climate Site: Woodland Climate Zone: 12 Conditioned Area: 7,138 Title 24 Bldg Gymnasium Sizing Ratio: 1.069
Building Parameters
Existing LPD EPD Cooling Cap sf/ton 0.36 0.00 238 Cooling EER Cooling Type Wall U-Value Roof U-Value 11.5 PSZ 0.145 0.051 Window U-Value Window SC % Window Area Skylight U-Value 0.631 0.570 1.1 0.000 Skylight SC % Skylight Area % Ltg Occup Ctrl % Ltg Daylight Ctrl 0.000 0.0 0.0 0.0
Title 24 Baseline LPD EPD Cooling Cap sf/ton 0.60 0.00 254 Cooling EER Cooling Type Wall U-Value Roof U-Value 9.7 PSZ 0.649 0.051 Window U-Value Window SC % Window Area Skylight U-Value 0.493 0.580 1.1 0.000 Skylight SC % Skylight Area % Ltg Occup Ctrl % Ltg Daylight Ctrl 0.000 0.0 0.0 0.0
Table 65 - Gross and Net Evaluated Savings
Ex-Ante Gross Savings
Ex-Post Gross Savings
Ex-Post Net Savings
Net-to-Gross Realization Rate (Ex-Post Net/Ex-Post
Gross)Peak kW 19.00 7.81 6.38 81.72%
kWh 22,115.00 10,863.79 8,828.16 81.26%Therms 27.00 10,863.79 1,557.72 14.34%

ccxxiii
P62326 Climate Site: San Jose Climate Zone: 4 Conditioned Area: 42,732 Title 24 Bldg School Sizing Ratio: 0.812
Building Parameters
Existing LPD EPD Cooling Cap sf/ton 0.75 0.58 337 Cooling EER Cooling Type Wall U-Value Roof U-Value 22.0 PVAV 0.092 0.051 Window U-Value Window SC % Window Area Skylight U-Value 0.649 0.230 13.5 0.901 Skylight SC % Skylight Area % Ltg Occup Ctrl % Ltg Daylight Ctrl 0.570 15.0 37.7 0.0
Title 24 Baseline LPD EPD Cooling Cap sf/ton 1.33 0.58 344 Cooling EER Cooling Type Wall U-Value Roof U-Value 11.0 PVAV 0.649 0.051 Window U-Value Window SC % Window Area Skylight U-Value 0.839 0.700 13.5 0.909 Skylight SC % Skylight Area % Ltg Occup Ctrl % Ltg Daylight Ctrl 0.460 15.0 0.0 0.0
Table 66 - Gross and Net Evaluated Savings
Ex-Ante Gross Savings
Ex-Post Gross Savings
Ex-Post Net Savings
Net-to-Gross Realization Rate (Ex-Post Net/Ex-Post
Gross)Peak kW 66.00 53.66 37.26 69.44%
kWh 176,830.00 116,836.44 50,610.88 43.32%Therms 1,966.00 116,836.44 2,865.48 2.45%

ccxxiv
P64746 Climate Site: Manteca Climate Zone: 12 Conditioned Area: 129,064 Title 24 Bldg School Sizing Ratio: 1.181
Building Parameters
Existing LPD EPD Cooling Cap sf/ton 0.71 0.57 286 Cooling EER Cooling Type Wall U-Value Roof U-Value 11.2 PSZ 0.049 0.040 Window U-Value Window SC % Window Area Skylight U-Value 0.777 0.570 6.5 0.000 Skylight SC % Skylight Area % Ltg Occup Ctrl % Ltg Daylight Ctrl 0.000 0.0 99.5 0.0
Title 24 Baseline LPD EPD Cooling Cap sf/ton 1.19 0.57 286 Cooling EER Cooling Type Wall U-Value Roof U-Value 10.9 PSZ 0.102 0.051 Window U-Value Window SC % Window Area Skylight U-Value 0.493 0.578 6.5 0.000 Skylight SC % Skylight Area % Ltg Occup Ctrl % Ltg Daylight Ctrl 0.000 0.0 0.0 0.0
Table 67 -Gross and Net Evaluated Savings
Ex-Ante Gross Savings
Ex-Post Gross Savings
Ex-Post Net Savings
Net-to-Gross Realization Rate (Ex-Post Net/Ex-Post
Gross)Peak kW 188.00 68.97 60.02 87.02%
kWh 405,697.00 322,348.94 292,460.69 90.73%Therms 626.00 322,348.94 (818.44) -0.25%
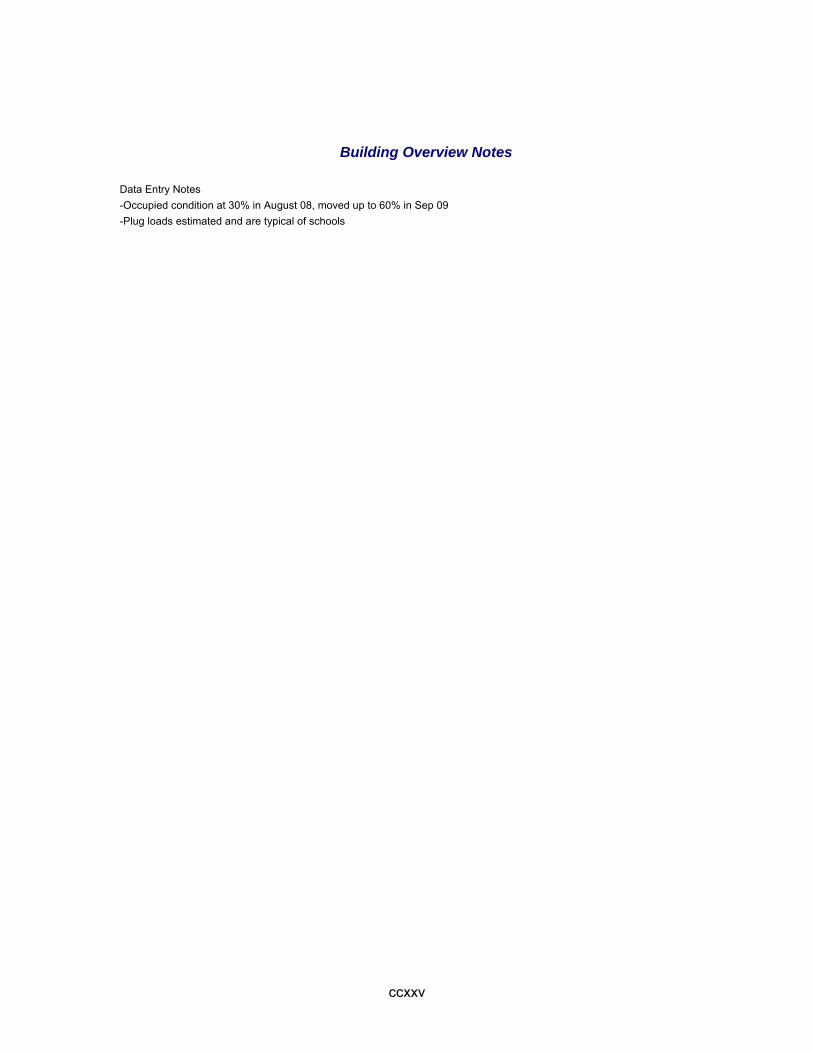
ccxxv
Building Overview Notes Data Entry Notes -Occupied condition at 30% in August 08, moved up to 60% in Sep 09 -Plug loads estimated and are typical of schools

ccxxvi
P65966 Climate Site: Vacaville Climate Zone: 12 Conditioned Area: 260,115 Title 24 Bldg Office Sizing Ratio: 2.698
Building Parameters
Existing LPD EPD Cooling Cap sf/ton 0.79 6.23 169 Cooling EER Cooling Type Wall U-Value Roof U-Value 19.5 PVAV 0.144 0.038 Window U-Value Window SC % Window Area Skylight U-Value 0.304 0.360 34.5 0.000 Skylight SC % Skylight Area % Ltg Occup Ctrl % Ltg Daylight Ctrl 0.000 0.0 0.0 0.0
Title 24 Baseline LPD EPD Cooling Cap sf/ton 1.18 6.23 170 Cooling EER Cooling Type Wall U-Value Roof U-Value 17.0 PVAV 0.649 0.051 Window U-Value Window SC % Window Area Skylight U-Value 0.493 0.407 34.5 1.618 Skylight SC % Skylight Area % Ltg Occup Ctrl % Ltg Daylight Ctrl 0.890 0.0 0.0 0.0
Table 68 - Gross and Net Evaluated Savings
Ex-Ante Gross Savings
Ex-Post Gross Savings
Ex-Post Net Savings
Net-to-Gross Realization Rate (Ex-Post Net/Ex-Post
Gross)Peak kW 769.00 269.20 172.78 64.18%
kWh 919,908.00 298,996.00 (50,871.00) -17.01%Therms 14,424.00 298,996.00 700.15 0.23%

ccxxvii
P69566 Climate Site: Novato Climate Zone: 2 Conditioned Area: 49,312 Title 24 Bldg Grocery Store Sizing Ratio: 0.039
Building Parameters
Existing LPD EPD Cooling Cap sf/ton 1.44 0.96 834 Cooling EER Cooling Type Wall U-Value Roof U-Value 13.2 MIXED 0.453 0.049 Window U-Value Window SC % Window Area Skylight U-Value 0.361 0.460 0.4 0.000 Skylight SC % Skylight Area % Ltg Occup Ctrl % Ltg Daylight Ctrl 0.000 0.0 0.0 0.0
Title 24 Baseline LPD EPD Cooling Cap sf/ton 1.60 0.96 836 Cooling EER Cooling Type Wall U-Value Roof U-Value 10.3 MIXED 0.649 0.051 Window U-Value Window SC % Window Area Skylight U-Value 0.493 0.700 0.4 1.591 Skylight SC % Skylight Area % Ltg Occup Ctrl % Ltg Daylight Ctrl 0.890 0.7 0.0 0.0
Table 69 - Gross and Net Evaluated Savings
Ex-Ante Gross Savings
Ex-Post Gross Savings
Ex-Post Net Savings
Net-to-Gross Realization Rate (Ex-Post Net/Ex-Post
Gross)Peak kW 74.00 58.14 55.43 95.34%
kWh 348,189.00 316,973.13 315,866.38 99.65%Therms (6,533.00) 316,973.13 (16.76) -0.01%

ccxxviii
P70226 Climate Site: Antioch Climate Zone: 12 Conditioned Area: 148,947 Title 24 Bldg Grocery Store Sizing Ratio: 0.899
Building Parameters
Existing LPD EPD Cooling Cap sf/ton 1.50 1.55 403 Cooling EER Cooling Type Wall U-Value Roof U-Value 10.5 PSZ 0.180 0.046 Window U-Value Window SC % Window Area Skylight U-Value 0.000 0.000 0.0 0.705 Skylight SC % Skylight Area % Ltg Occup Ctrl % Ltg Daylight Ctrl 0.540 4.3 3.3 51.7
Title 24 Baseline LPD EPD Cooling Cap sf/ton 1.67 1.55 403 Cooling EER Cooling Type Wall U-Value Roof U-Value 9.6 PSZ 0.365 0.051 Window U-Value Window SC % Window Area Skylight U-Value 0.000 0.000 0.0 1.588 Skylight SC % Skylight Area % Ltg Occup Ctrl % Ltg Daylight Ctrl 0.710 4.3 0.0 0.0
Table 70 - Gross and Net Evaluated Savings
Ex-Ante Gross Savings
Ex-Post Gross Savings
Ex-Post Net Savings
Net-to-Gross Realization Rate (Ex-Post Net/Ex-Post
Gross)Peak kW 198.00 216.87 55.94 25.80%
kWh 726,074.00 807,534.00 226,990.50 28.11%Therms 1,529.00 807,534.00 2,142.77 0.27%

ccxxix
P70686 Climate Site: Stockton AP Climate Zone: 12 Conditioned Area: 14,300 Title 24 Bldg C&I Storage Sizing Ratio: 0.598
Building Parameters
Existing LPD EPD Cooling Cap sf/ton 0.27 0.03 722 Cooling EER Cooling Type Wall U-Value Roof U-Value 12.0 PSZ 0.093 0.051 Window U-Value Window SC % Window Area Skylight U-Value 0.000 0.000 0.0 0.000 Skylight SC % Skylight Area % Ltg Occup Ctrl % Ltg Daylight Ctrl 0.000 0.0 4.0 85.6
Title 24 Baseline LPD EPD Cooling Cap sf/ton 0.61 0.03 708 Cooling EER Cooling Type Wall U-Value Roof U-Value 10.9 PSZ 0.649 0.051 Window U-Value Window SC % Window Area Skylight U-Value 0.000 0.000 0.0 0.000 Skylight SC % Skylight Area % Ltg Occup Ctrl % Ltg Daylight Ctrl 0.000 0.0 0.0 0.0
Table 71 - Gross and Net Evaluated Savings
Ex-Ante Gross Savings
Ex-Post Gross Savings
Ex-Post Net Savings
Net-to-Gross Realization Rate (Ex-Post Net/Ex-Post
Gross)Peak kW 447.00 244.25 244.11 99.94%
kWh 1,232,601.00 987,011.44 986,896.00 99.99%Therms (7,608.00) 987,011.44 (16.78) 0.00%
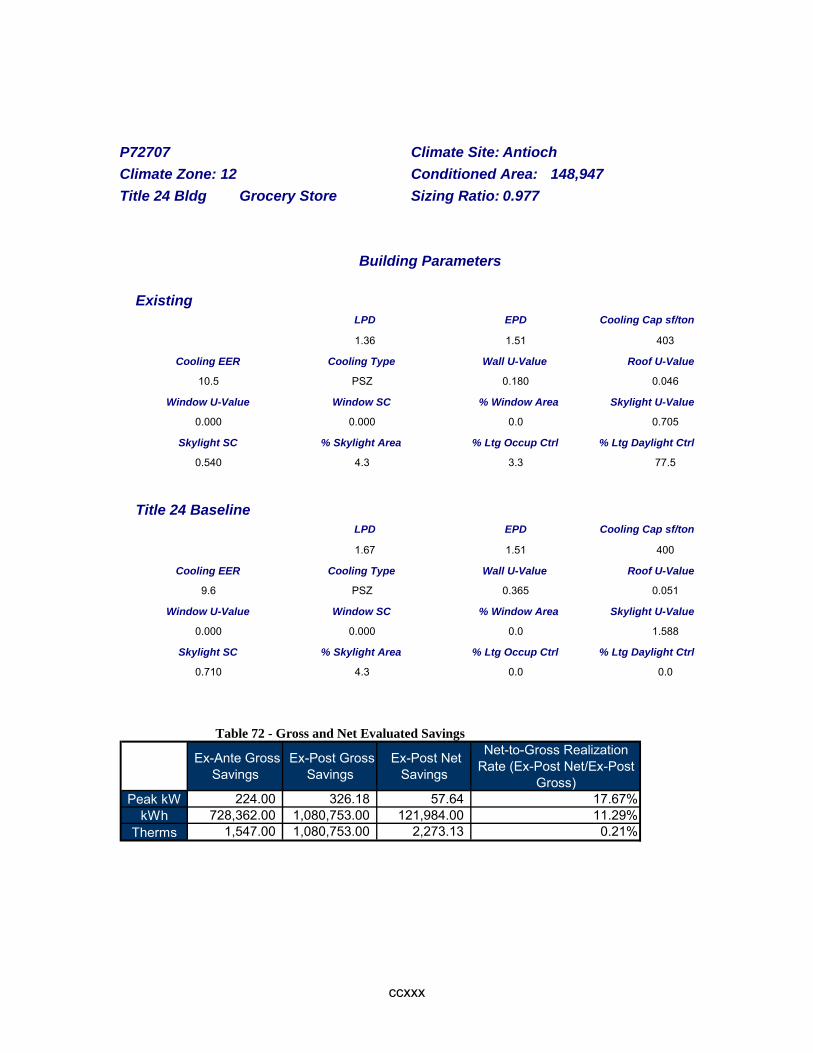
ccxxx
P72707 Climate Site: Antioch Climate Zone: 12 Conditioned Area: 148,947 Title 24 Bldg Grocery Store Sizing Ratio: 0.977
Building Parameters
Existing LPD EPD Cooling Cap sf/ton 1.36 1.51 403 Cooling EER Cooling Type Wall U-Value Roof U-Value 10.5 PSZ 0.180 0.046 Window U-Value Window SC % Window Area Skylight U-Value 0.000 0.000 0.0 0.705 Skylight SC % Skylight Area % Ltg Occup Ctrl % Ltg Daylight Ctrl 0.540 4.3 3.3 77.5
Title 24 Baseline LPD EPD Cooling Cap sf/ton 1.67 1.51 400 Cooling EER Cooling Type Wall U-Value Roof U-Value 9.6 PSZ 0.365 0.051 Window U-Value Window SC % Window Area Skylight U-Value 0.000 0.000 0.0 1.588 Skylight SC % Skylight Area % Ltg Occup Ctrl % Ltg Daylight Ctrl 0.710 4.3 0.0 0.0
Table 72 - Gross and Net Evaluated Savings
Ex-Ante Gross Savings
Ex-Post Gross Savings
Ex-Post Net Savings
Net-to-Gross Realization Rate (Ex-Post Net/Ex-Post
Gross)Peak kW 224.00 326.18 57.64 17.67%
kWh 728,362.00 1,080,753.00 121,984.00 11.29%Therms 1,547.00 1,080,753.00 2,273.13 0.21%
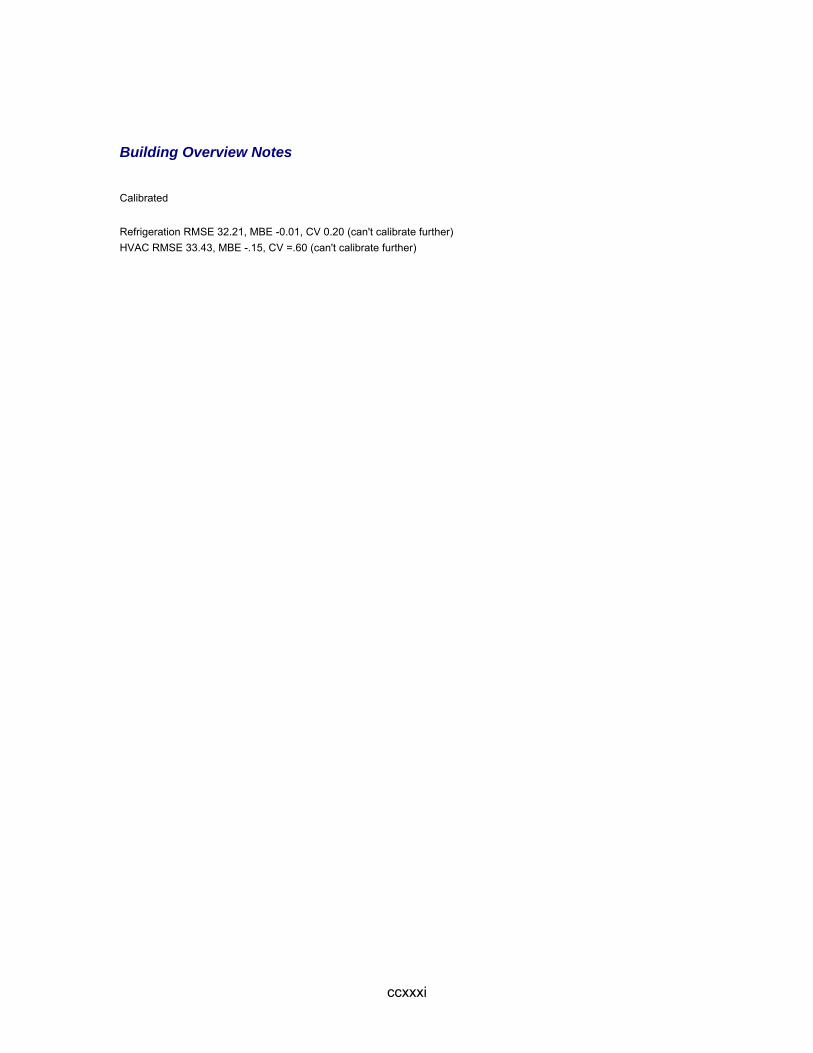
ccxxxi
Building Overview Notes
Calibrated Refrigeration RMSE 32.21, MBE -0.01, CV 0.20 (can't calibrate further) HVAC RMSE 33.43, MBE -.15, CV =.60 (can't calibrate further)

ccxxxii
P81166 Climate Site: Bakersfield AP Climate Zone: 13 Conditioned Area: 14,415 Title 24 Bldg Religious Worship, Sizing Ratio: 0.866
Building Parameters
Existing LPD EPD Cooling Cap sf/ton 0.78 0.72 186 Cooling EER Cooling Type Wall U-Value Roof U-Value 10.9 PSZ 0.104 0.038 Window U-Value Window SC % Window Area Skylight U-Value 0.741 0.450 7.8 0.000 Skylight SC % Skylight Area % Ltg Occup Ctrl % Ltg Daylight Ctrl 0.000 0.0 27.9 0.0
Title 24 Baseline LPD EPD Cooling Cap sf/ton 1.47 0.72 183 Cooling EER Cooling Type Wall U-Value Roof U-Value 10.4 PSZ 0.217 0.051 Window U-Value Window SC % Window Area Skylight U-Value 0.493 0.553 7.8 0.000 Skylight SC % Skylight Area % Ltg Occup Ctrl % Ltg Daylight Ctrl 0.000 0.0 0.0 0.0
Table 73 - Gross and Net Evaluated Savings
Ex-Ante Gross Savings
Ex-Post Gross Savings
Ex-Post Net Savings
Net-to-Gross Realization Rate (Ex-Post Net/Ex-Post
Gross)Peak kW 25.00 8.80 2.39 27.12%
kWh 47,554.00 70,010.58 44,056.45 62.93%Therms - 70,010.58 (13.34) -0.02%
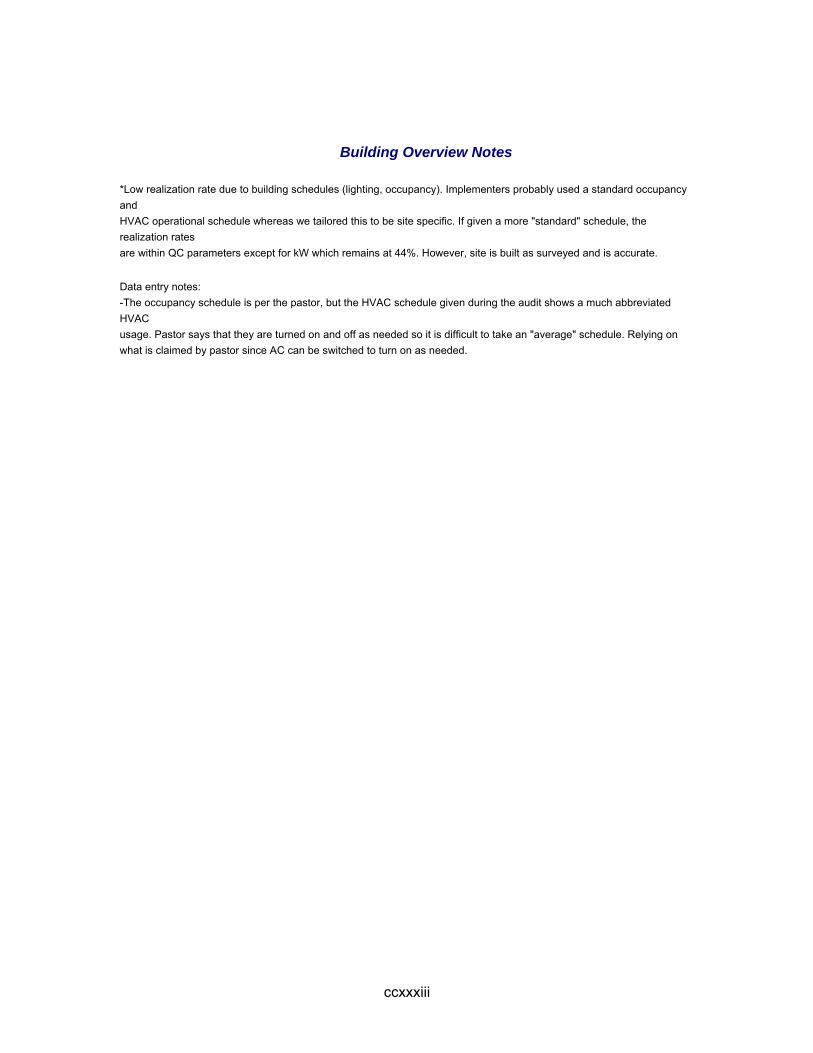
ccxxxiii
Building Overview Notes *Low realization rate due to building schedules (lighting, occupancy). Implementers probably used a standard occupancy and HVAC operational schedule whereas we tailored this to be site specific. If given a more "standard" schedule, the realization rates are within QC parameters except for kW which remains at 44%. However, site is built as surveyed and is accurate. Data entry notes: -The occupancy schedule is per the pastor, but the HVAC schedule given during the audit shows a much abbreviated HVAC usage. Pastor says that they are turned on and off as needed so it is difficult to take an "average" schedule. Relying on what is claimed by pastor since AC can be switched to turn on as needed.
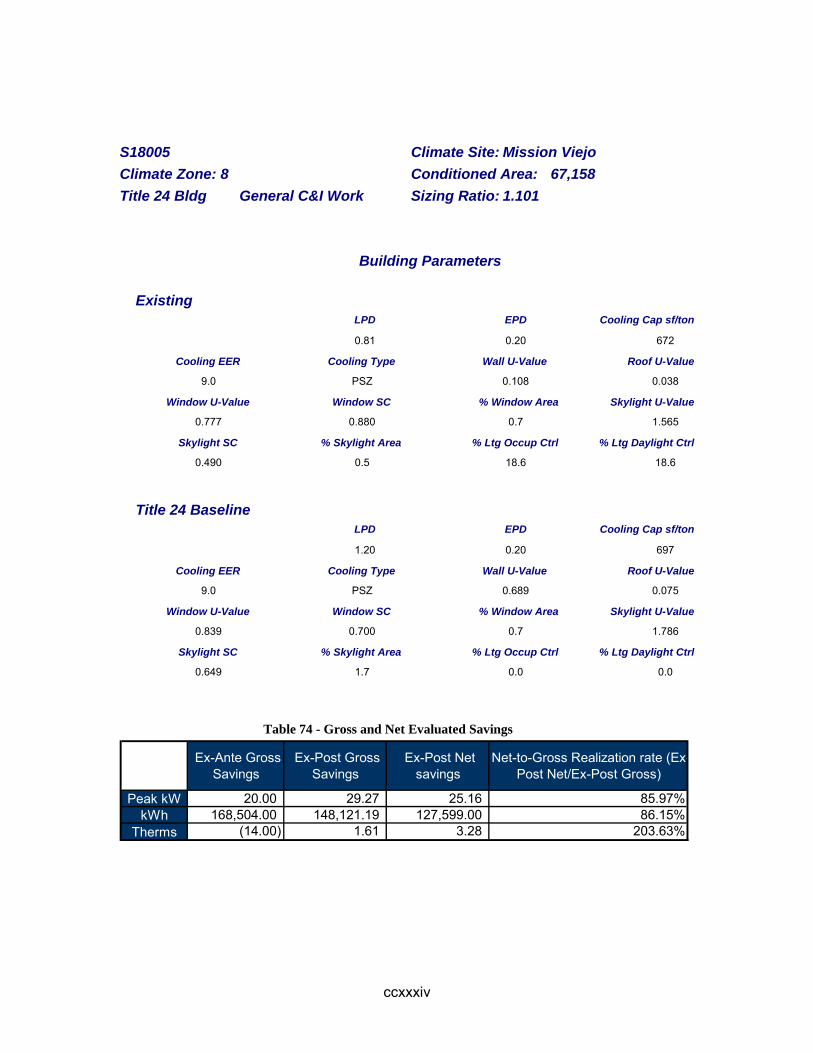
ccxxxiv
S18005 Climate Site: Mission Viejo Climate Zone: 8 Conditioned Area: 67,158 Title 24 Bldg General C&I Work Sizing Ratio: 1.101
Building Parameters
Existing LPD EPD Cooling Cap sf/ton 0.81 0.20 672 Cooling EER Cooling Type Wall U-Value Roof U-Value 9.0 PSZ 0.108 0.038 Window U-Value Window SC % Window Area Skylight U-Value 0.777 0.880 0.7 1.565 Skylight SC % Skylight Area % Ltg Occup Ctrl % Ltg Daylight Ctrl 0.490 0.5 18.6 18.6
Title 24 Baseline LPD EPD Cooling Cap sf/ton 1.20 0.20 697 Cooling EER Cooling Type Wall U-Value Roof U-Value 9.0 PSZ 0.689 0.075 Window U-Value Window SC % Window Area Skylight U-Value 0.839 0.700 0.7 1.786 Skylight SC % Skylight Area % Ltg Occup Ctrl % Ltg Daylight Ctrl 0.649 1.7 0.0 0.0
Table 74 - Gross and Net Evaluated Savings
Ex-Ante Gross Savings
Ex-Post Gross Savings
Ex-Post Net savings
Net-to-Gross Realization rate (Ex-Post Net/Ex-Post Gross)
Peak kW 20.00 29.27 25.16 85.97%kWh 168,504.00 148,121.19 127,599.00 86.15%
Therms (14.00) 1.61 3.28 203.63%

ccxxxv
Building Overview Notes
Interior lighting measure only. Mainframe/Mini assy/shipping/test/QC room only, not the entire campus. No heating; cooling only.
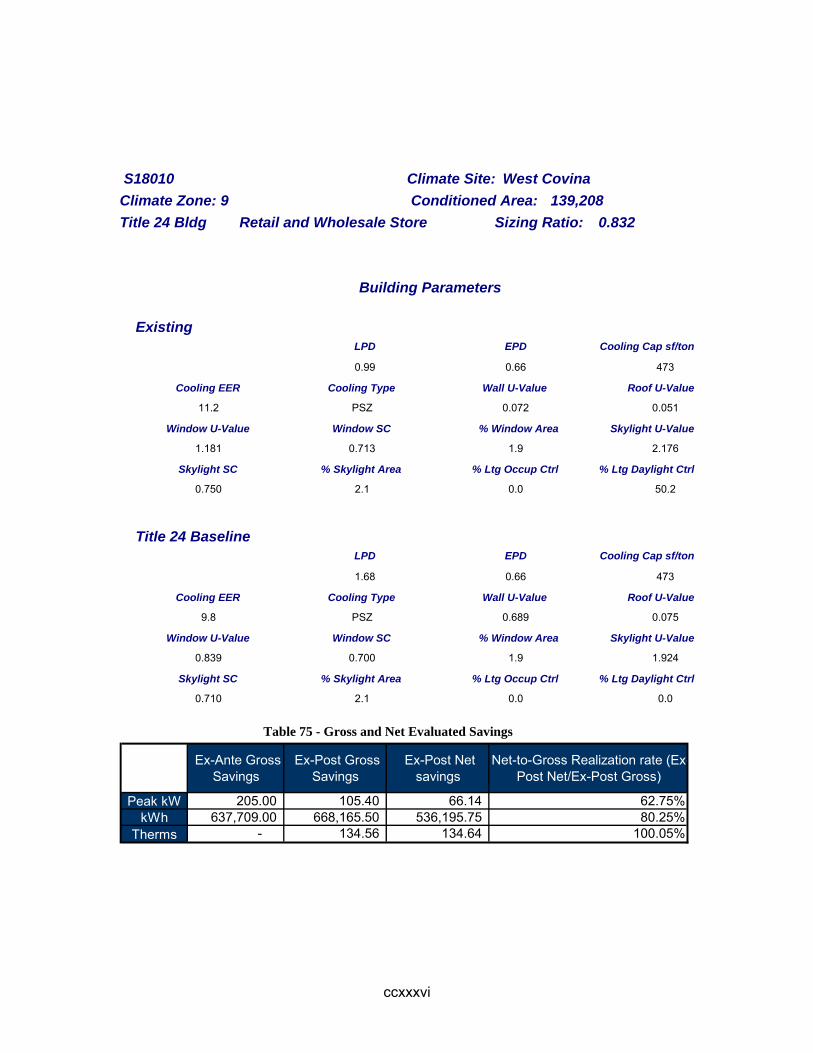
ccxxxvi
S18010 Climate Site: West Covina Climate Zone: 9 Conditioned Area: 139,208 Title 24 Bldg Retail and Wholesale Store Sizing Ratio: 0.832
Building Parameters
Existing LPD EPD Cooling Cap sf/ton 0.99 0.66 473 Cooling EER Cooling Type Wall U-Value Roof U-Value 11.2 PSZ 0.072 0.051 Window U-Value Window SC % Window Area Skylight U-Value 1.181 0.713 1.9 2.176 Skylight SC % Skylight Area % Ltg Occup Ctrl % Ltg Daylight Ctrl 0.750 2.1 0.0 50.2
Title 24 Baseline LPD EPD Cooling Cap sf/ton 1.68 0.66 473 Cooling EER Cooling Type Wall U-Value Roof U-Value 9.8 PSZ 0.689 0.075 Window U-Value Window SC % Window Area Skylight U-Value 0.839 0.700 1.9 1.924 Skylight SC % Skylight Area % Ltg Occup Ctrl % Ltg Daylight Ctrl 0.710 2.1 0.0 0.0
Table 75 - Gross and Net Evaluated Savings
Ex-Ante Gross Savings
Ex-Post Gross Savings
Ex-Post Net savings
Net-to-Gross Realization rate (Ex-Post Net/Ex-Post Gross)
Peak kW 205.00 105.40 66.14 62.75%kWh 637,709.00 668,165.50 536,195.75 80.25%
Therms - 134.56 134.64 100.05%
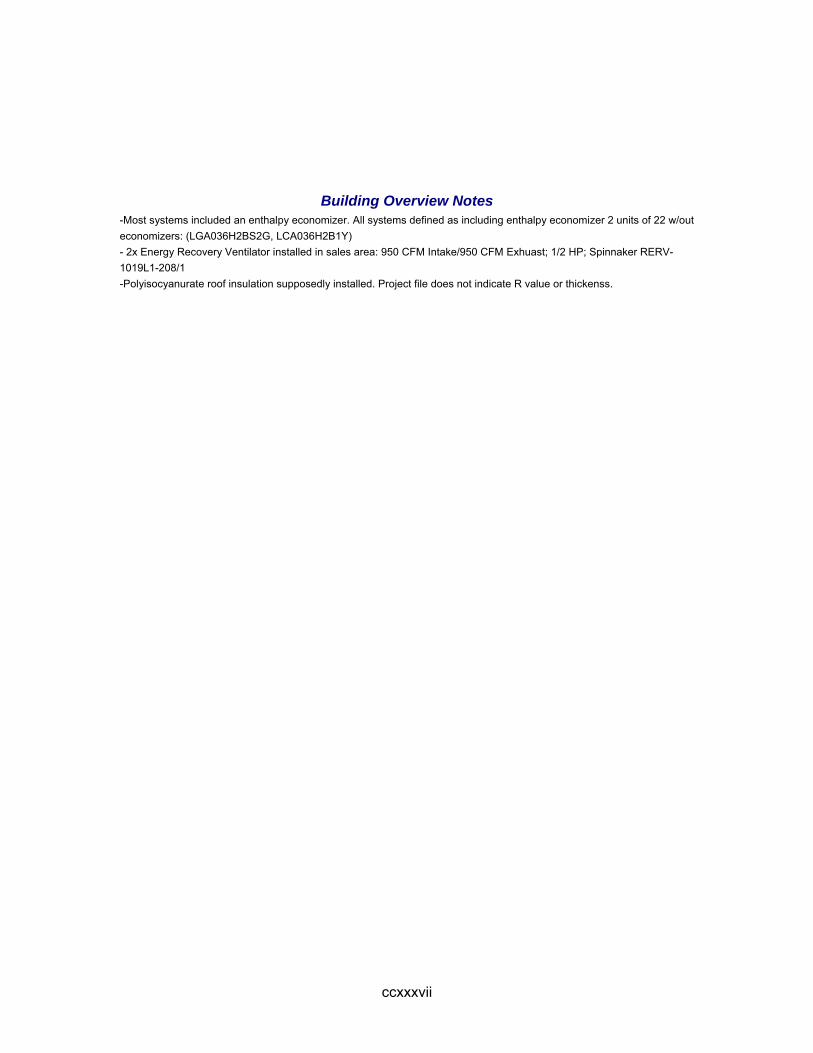
ccxxxvii
Building Overview Notes
-Most systems included an enthalpy economizer. All systems defined as including enthalpy economizer 2 units of 22 w/out economizers: (LGA036H2BS2G, LCA036H2B1Y) - 2x Energy Recovery Ventilator installed in sales area: 950 CFM Intake/950 CFM Exhuast; 1/2 HP; Spinnaker RERV-1019L1-208/1 -Polyisocyanurate roof insulation supposedly installed. Project file does not indicate R value or thickenss.
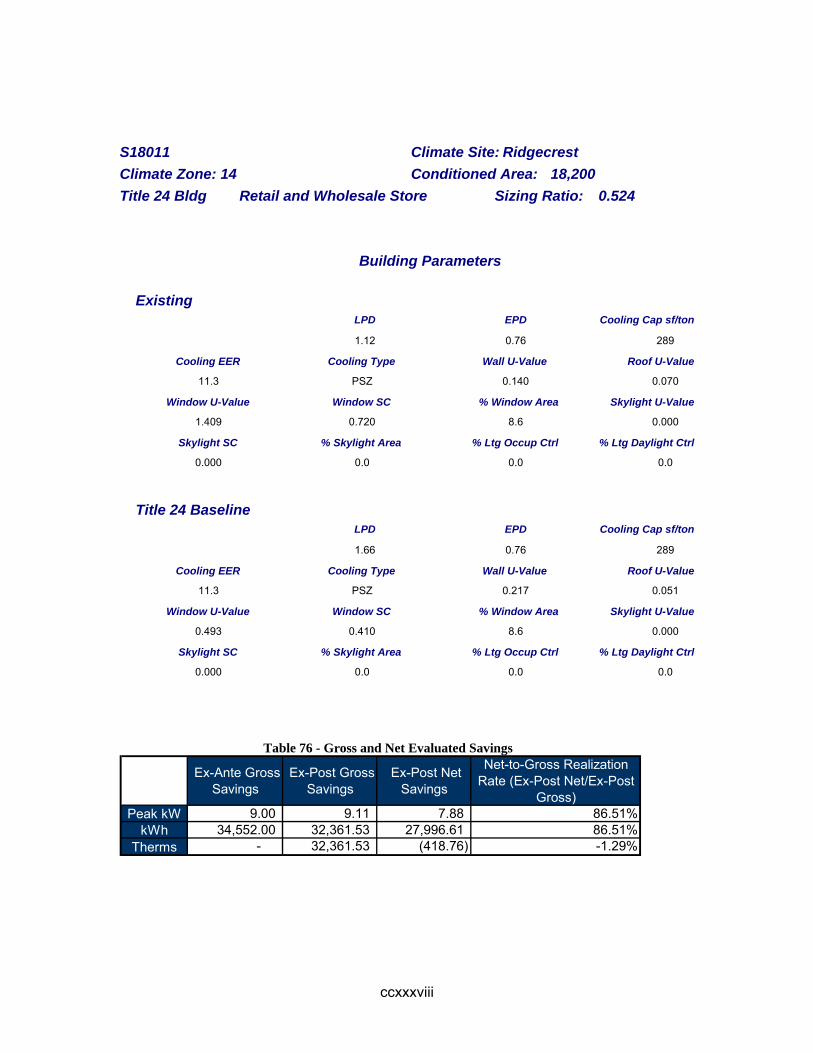
ccxxxviii
S18011 Climate Site: Ridgecrest Climate Zone: 14 Conditioned Area: 18,200 Title 24 Bldg Retail and Wholesale Store Sizing Ratio: 0.524
Building Parameters
Existing LPD EPD Cooling Cap sf/ton 1.12 0.76 289 Cooling EER Cooling Type Wall U-Value Roof U-Value 11.3 PSZ 0.140 0.070 Window U-Value Window SC % Window Area Skylight U-Value 1.409 0.720 8.6 0.000 Skylight SC % Skylight Area % Ltg Occup Ctrl % Ltg Daylight Ctrl 0.000 0.0 0.0 0.0
Title 24 Baseline LPD EPD Cooling Cap sf/ton 1.66 0.76 289 Cooling EER Cooling Type Wall U-Value Roof U-Value 11.3 PSZ 0.217 0.051 Window U-Value Window SC % Window Area Skylight U-Value 0.493 0.410 8.6 0.000 Skylight SC % Skylight Area % Ltg Occup Ctrl % Ltg Daylight Ctrl 0.000 0.0 0.0 0.0
Table 76 - Gross and Net Evaluated Savings
Ex-Ante Gross Savings
Ex-Post Gross Savings
Ex-Post Net Savings
Net-to-Gross Realization Rate (Ex-Post Net/Ex-Post
Gross)Peak kW 9.00 9.11 7.88 86.51%
kWh 34,552.00 32,361.53 27,996.61 86.51%Therms - 32,361.53 (418.76) -1.29%

ccxxxix
S18012 Climate Site: Tulare Climate Zone: 13 Conditioned Area: 118,651 Title 24 Bldg Retail and Wholesale Store Sizing Ratio: 0.852
Building Parameters
Existing LPD EPD Cooling Cap sf/ton 1.05 1.17 398 Cooling EER Cooling Type Wall U-Value Roof U-Value 11.0 PSZ 0.085 0.055 Window U-Value Window SC % Window Area Skylight U-Value 0.839 0.800 1.3 0.908 Skylight SC % Skylight Area % Ltg Occup Ctrl % Ltg Daylight Ctrl 0.590 3.5 2.1 58.7
Title 24 Baseline LPD EPD Cooling Cap sf/ton 1.68 1.17 404 Cooling EER Cooling Type Wall U-Value Roof U-Value 9.6 PSZ 0.649 0.051 Window U-Value Window SC % Window Area Skylight U-Value 0.493 0.577 1.3 1.588 Skylight SC % Skylight Area % Ltg Occup Ctrl % Ltg Daylight Ctrl 0.710 3.5 0.0 0.0
Table 77 - Gross and Net Evaluated Savings
Ex-Ante Gross Savings
Ex-Post Gross Savings
Ex-Post Net Savings
Net-to-Gross Realization Rate (Ex-Post Net/Ex-Post
Gross)Peak kW 264.00 140.43 102.76 73.18%
kWh 745,741.00 566,214.63 465,119.75 82.15%Therms (1,059.00) 566,214.63 16.05 0.00%

ccxl
Building Overview Notes Lower savings due to higher LPD for display lighting as surveyed (1.6) than was initially calculated by the utilities (1.38). The actual square footage from plans (113,260 sqft) is significantly lower than what was assumed (134,000 sqft).

ccxli
S18016 Climate Site: Ontario AP Climate Zone: 10 Conditioned Area: 129,690 Title 24 Bldg Retail and Wholesale Store Sizing Ratio: 0.914
Building Parameters
Existing LPD EPD Cooling Cap sf/ton 1.15 0.22 367 Cooling EER Cooling Type Wall U-Value Roof U-Value 11.1 PSZ 0.108 0.039 Window U-Value Window SC % Window Area Skylight U-Value 0.000 0.000 0.0 0.934 Skylight SC % Skylight Area % Ltg Occup Ctrl % Ltg Daylight Ctrl 0.230 2.8 5.6 55.4
Title 24 Baseline LPD EPD Cooling Cap sf/ton 1.98 0.22 366 Cooling EER Cooling Type Wall U-Value Roof U-Value 9.6 PSZ 0.689 0.077 Window U-Value Window SC % Window Area Skylight U-Value 0.000 0.000 0.0 1.294 Skylight SC % Skylight Area % Ltg Occup Ctrl % Ltg Daylight Ctrl 0.710 2.8 0.0 0.0
Table 78 - Gross and Net Evaluated Savings
Ex-Ante Gross Savings
Ex-Post Gross Savings
Ex-Post Net Savings
Net-to-Gross Realization Rate (Ex-Post Net/Ex-Post
Gross)Peak kW 210.00 289.32 270.28 93.42%
kWh 676,296.00 983,819.50 929,321.13 94.46%Therms (535.00) 983,819.50 (0.09) 0.00%
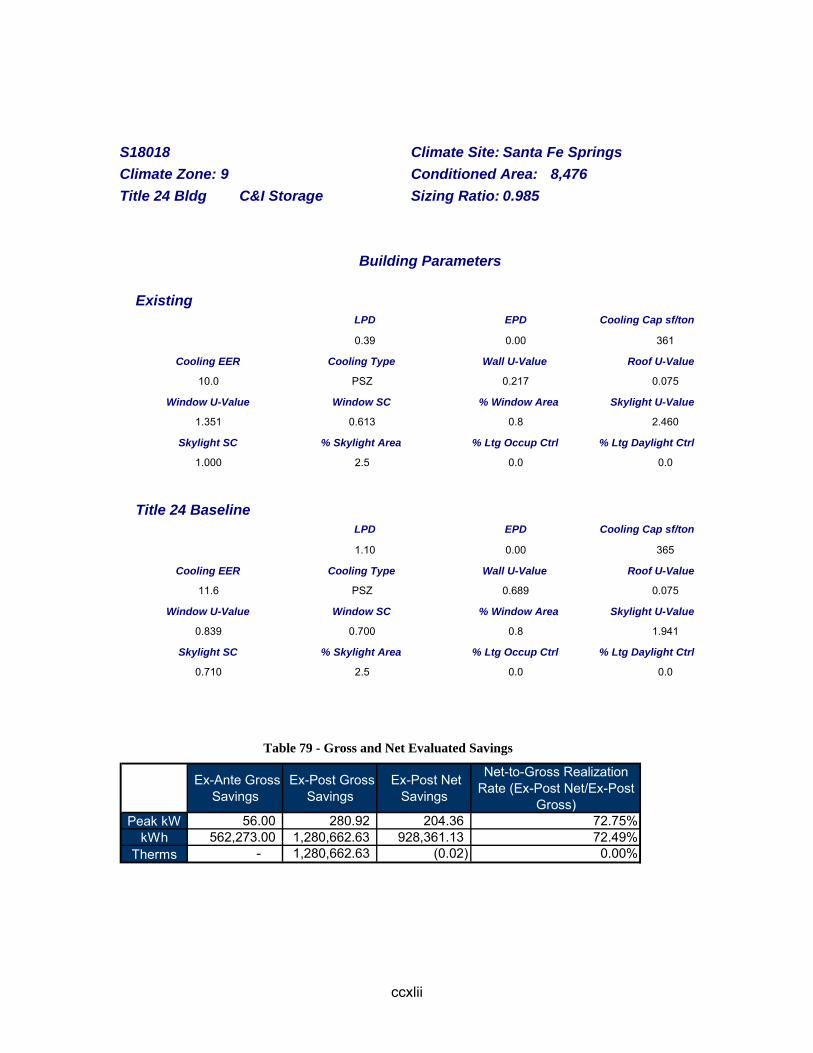
ccxlii
S18018 Climate Site: Santa Fe Springs Climate Zone: 9 Conditioned Area: 8,476 Title 24 Bldg C&I Storage Sizing Ratio: 0.985
Building Parameters
Existing LPD EPD Cooling Cap sf/ton 0.39 0.00 361 Cooling EER Cooling Type Wall U-Value Roof U-Value 10.0 PSZ 0.217 0.075 Window U-Value Window SC % Window Area Skylight U-Value 1.351 0.613 0.8 2.460 Skylight SC % Skylight Area % Ltg Occup Ctrl % Ltg Daylight Ctrl 1.000 2.5 0.0 0.0
Title 24 Baseline LPD EPD Cooling Cap sf/ton 1.10 0.00 365 Cooling EER Cooling Type Wall U-Value Roof U-Value 11.6 PSZ 0.689 0.075 Window U-Value Window SC % Window Area Skylight U-Value 0.839 0.700 0.8 1.941 Skylight SC % Skylight Area % Ltg Occup Ctrl % Ltg Daylight Ctrl 0.710 2.5 0.0 0.0
Table 79 - Gross and Net Evaluated Savings
Ex-Ante Gross Savings
Ex-Post Gross Savings
Ex-Post Net Savings
Net-to-Gross Realization Rate (Ex-Post Net/Ex-Post
Gross)Peak kW 56.00 280.92 204.36 72.75%
kWh 562,273.00 1,280,662.63 928,361.13 72.49%Therms - 1,280,662.63 (0.02) 0.00%
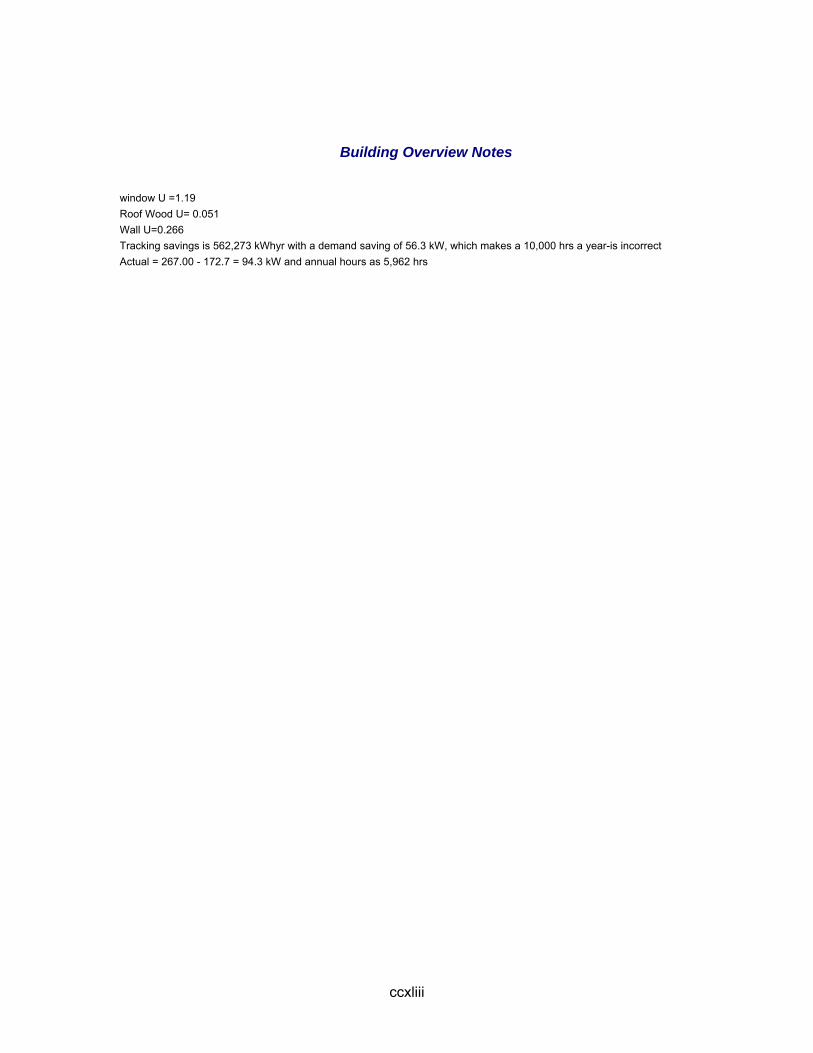
ccxliii
Building Overview Notes
window U =1.19 Roof Wood U= 0.051 Wall U=0.266 Tracking savings is 562,273 kWhyr with a demand saving of 56.3 kW, which makes a 10,000 hrs a year-is incorrect Actual = 267.00 - 172.7 = 94.3 kW and annual hours as 5,962 hrs

ccxliv
S18021 Climate Site: El Monte Climate Zone: 9 Conditioned Area: 14,829 Title 24 Bldg Retail and Wholesale Store Sizing Ratio: 0.934
Building Parameters
Existing LPD EPD Cooling Cap sf/ton 1.22 0.94 330 Cooling EER Cooling Type Wall U-Value Roof U-Value 10.7 PSZ 0.108 0.038 Window U-Value Window SC % Window Area Skylight U-Value 0.777 0.880 6.6 0.000 Skylight SC % Skylight Area % Ltg Occup Ctrl % Ltg Daylight Ctrl 0.000 0.0 1.0 0.0
Title 24 Baseline LPD EPD Cooling Cap sf/ton 1.55 0.94 330 Cooling EER Cooling Type Wall U-Value Roof U-Value 10.2 PSZ 0.689 0.075 Window U-Value Window SC % Window Area Skylight U-Value 0.839 0.700 6.6 0.000 Skylight SC % Skylight Area % Ltg Occup Ctrl % Ltg Daylight Ctrl 0.000 0.0 0.0 0.0
Table 80 - Gross and Net Evaluated Savings
Ex-Ante Gross Savings
Ex-Post Gross Savings
Ex-Post Net Savings
Net-to-Gross Realization Rate (Ex-Post Net/Ex-Post
Gross)Peak kW 5.00 6.32 1.23 19.45%
kWh 17,831.00 32,582.47 5,787.56 17.76%Therms - 32,582.47 (7.12) -0.02%
ccxlv
Building Overview Notes Lighting measures only. The program savings were almost certainly calculated with the pre-24/7 schedule as the store had just recently switched to 24/7. Store manager was "running errands" during site visit and authorized staff to allow me full access. Staff answered questions as well as they could in his absence.
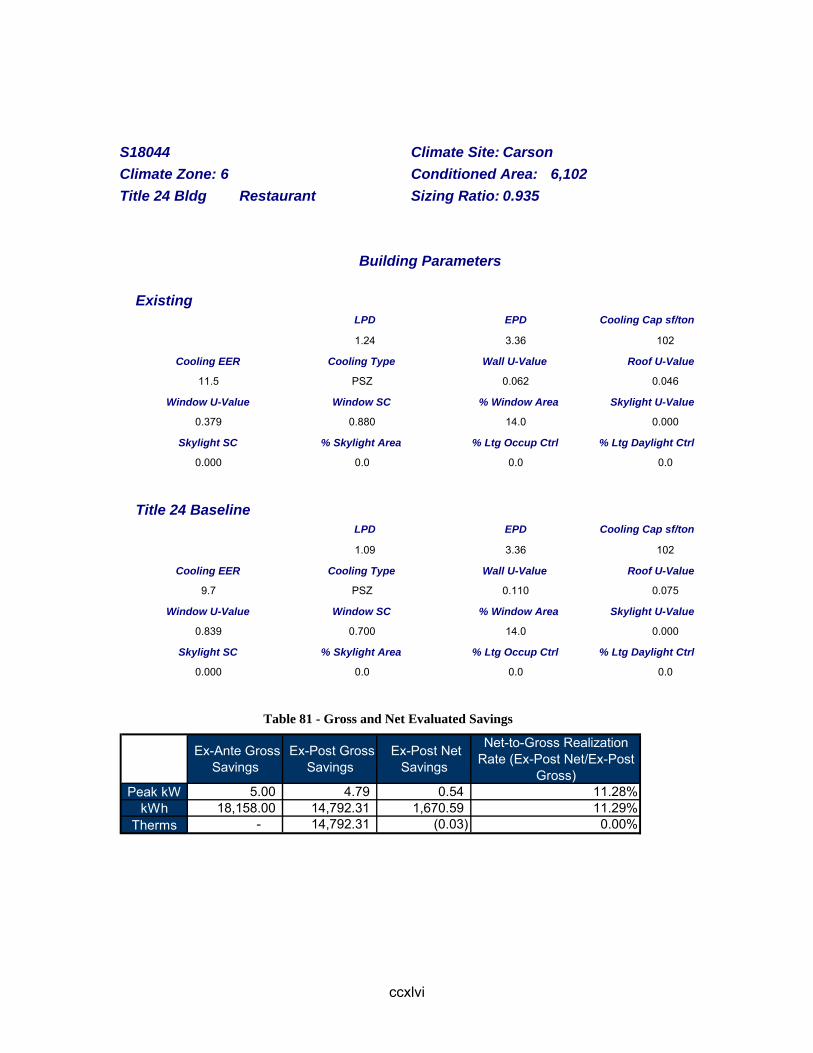
ccxlvi
S18044 Climate Site: Carson Climate Zone: 6 Conditioned Area: 6,102 Title 24 Bldg Restaurant Sizing Ratio: 0.935
Building Parameters
Existing LPD EPD Cooling Cap sf/ton 1.24 3.36 102 Cooling EER Cooling Type Wall U-Value Roof U-Value 11.5 PSZ 0.062 0.046 Window U-Value Window SC % Window Area Skylight U-Value 0.379 0.880 14.0 0.000 Skylight SC % Skylight Area % Ltg Occup Ctrl % Ltg Daylight Ctrl 0.000 0.0 0.0 0.0
Title 24 Baseline LPD EPD Cooling Cap sf/ton 1.09 3.36 102 Cooling EER Cooling Type Wall U-Value Roof U-Value 9.7 PSZ 0.110 0.075 Window U-Value Window SC % Window Area Skylight U-Value 0.839 0.700 14.0 0.000 Skylight SC % Skylight Area % Ltg Occup Ctrl % Ltg Daylight Ctrl 0.000 0.0 0.0 0.0
Table 81 - Gross and Net Evaluated Savings
Ex-Ante Gross Savings
Ex-Post Gross Savings
Ex-Post Net Savings
Net-to-Gross Realization Rate (Ex-Post Net/Ex-Post
Gross)Peak kW 5.00 4.79 0.54 11.28%
kWh 18,158.00 14,792.31 1,670.59 11.29%Therms - 14,792.31 (0.03) 0.00%

ccxlvii
Building Overview Notes -U values taken from T24 documents

ccxlviii
S18114 Climate Site: Riverside Exp Sta Climate Zone: 10 Conditioned Area: 101,211 Title 24 Bldg Retail and Wholesale Store Sizing Ratio: 0.808
Building Parameters
Existing LPD EPD Cooling Cap sf/ton 1.03 0.33 613 Cooling EER Cooling Type Wall U-Value Roof U-Value 11.3 PSZ 0.337 0.054 Window U-Value Window SC % Window Area Skylight U-Value 0.777 0.840 1.5 0.000 Skylight SC % Skylight Area % Ltg Occup Ctrl % Ltg Daylight Ctrl 0.000 0.0 4.8 0.0
Title 24 Baseline LPD EPD Cooling Cap sf/ton 1.54 0.33 594 Cooling EER Cooling Type Wall U-Value Roof U-Value 9.5 PSZ 0.649 0.051 Window U-Value Window SC % Window Area Skylight U-Value 0.493 0.700 1.5 0.000 Skylight SC % Skylight Area % Ltg Occup Ctrl % Ltg Daylight Ctrl 0.000 0.0 0.0 0.0
Table 82 - Gross and Net Evaluated Savings
Ex-Ante Gross Savings
Ex-Post Gross Savings
Ex-Post Net Savings
Net-to-Gross Realization Rate (Ex-Post Net/Ex-Post
Gross)Peak kW 89.00 82.47 45.25 54.86%
kWh 293,269.00 368,469.75 223,046.88 60.53%Therms 204.00 368,469.75 (32.33) -0.01%
ccxlix
Building Overview Notes
Roof R value 19 , Wall U- value 0.337. Cooling EER 11.3. PV cells were installed last year July 2008 Hvac Savings looks OK. Lighting savings seems lot more than expected.

ccl
S18117 Climate Site: Covina Climate Zone: 9 Conditioned Area: 14,678 Title 24 Bldg Retail and Wholesale Store Sizing Ratio: 0.842
Building Parameters
Existing LPD EPD Cooling Cap sf/ton 1.51 1.47 408 Cooling EER Cooling Type Wall U-Value Roof U-Value 10.8 PSZ 0.141 0.052 Window U-Value Window SC % Window Area Skylight U-Value 0.697 0.790 8.2 0.000 Skylight SC % Skylight Area % Ltg Occup Ctrl % Ltg Daylight Ctrl 0.000 0.0 7.0 0.0
Title 24 Baseline LPD EPD Cooling Cap sf/ton 1.55 1.47 423 Cooling EER Cooling Type Wall U-Value Roof U-Value 10.6 PSZ 0.478 0.075 Window U-Value Window SC % Window Area Skylight U-Value 0.839 0.700 8.2 0.000 Skylight SC % Skylight Area % Ltg Occup Ctrl % Ltg Daylight Ctrl 0.000 0.0 0.0 0.0
Table 83 - Gross and Net Evaluated Savings
Ex-Ante Gross Savings
Ex-Post Gross Savings
Ex-Post Net Savings
Net-to-Gross Realization Rate (Ex-Post Net/Ex-Post
Gross)Peak kW 1.00 0.14 (0.21) -155.56%
kWh 1,207.00 574.25 (554.75) -96.60%Therms - 574.25 - 0.00%
ccli
Building Overview Notes --The efficiency measures implemented for this store is for the HVAC units only. This includes RTU4,5,6. No other measures implemented. -U-value per T24 for walls not realistic (.126) will assume overall wall R-value of 13 The only measures here are 3 rooftop heat pumps. A comparison of these units on a measures basis shows that it has an EER less than the baseline, resulting in these negative numbers. The building overall does not meet T24 standards due to the low efficiency heat pumps installed.
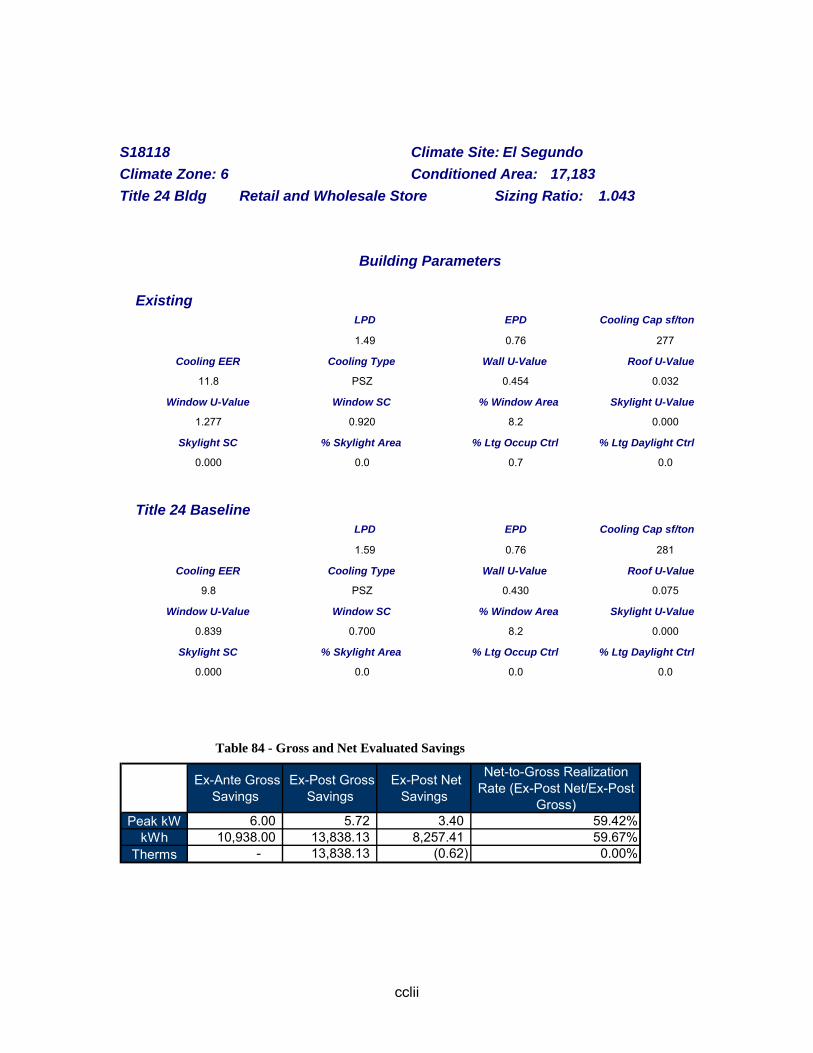
cclii
S18118 Climate Site: El Segundo Climate Zone: 6 Conditioned Area: 17,183 Title 24 Bldg Retail and Wholesale Store Sizing Ratio: 1.043
Building Parameters
Existing LPD EPD Cooling Cap sf/ton 1.49 0.76 277 Cooling EER Cooling Type Wall U-Value Roof U-Value 11.8 PSZ 0.454 0.032 Window U-Value Window SC % Window Area Skylight U-Value 1.277 0.920 8.2 0.000 Skylight SC % Skylight Area % Ltg Occup Ctrl % Ltg Daylight Ctrl 0.000 0.0 0.7 0.0
Title 24 Baseline LPD EPD Cooling Cap sf/ton 1.59 0.76 281 Cooling EER Cooling Type Wall U-Value Roof U-Value 9.8 PSZ 0.430 0.075 Window U-Value Window SC % Window Area Skylight U-Value 0.839 0.700 8.2 0.000 Skylight SC % Skylight Area % Ltg Occup Ctrl % Ltg Daylight Ctrl 0.000 0.0 0.0 0.0
Table 84 - Gross and Net Evaluated Savings
Ex-Ante Gross Savings
Ex-Post Gross Savings
Ex-Post Net Savings
Net-to-Gross Realization Rate (Ex-Post Net/Ex-Post
Gross)Peak kW 6.00 5.72 3.40 59.42%
kWh 10,938.00 13,838.13 8,257.41 59.67%Therms - 13,838.13 (0.62) 0.00%

ccliii
Building Overview Notes
-Only incented measures are packaged rooftop units 1-4 (RTU1-4)
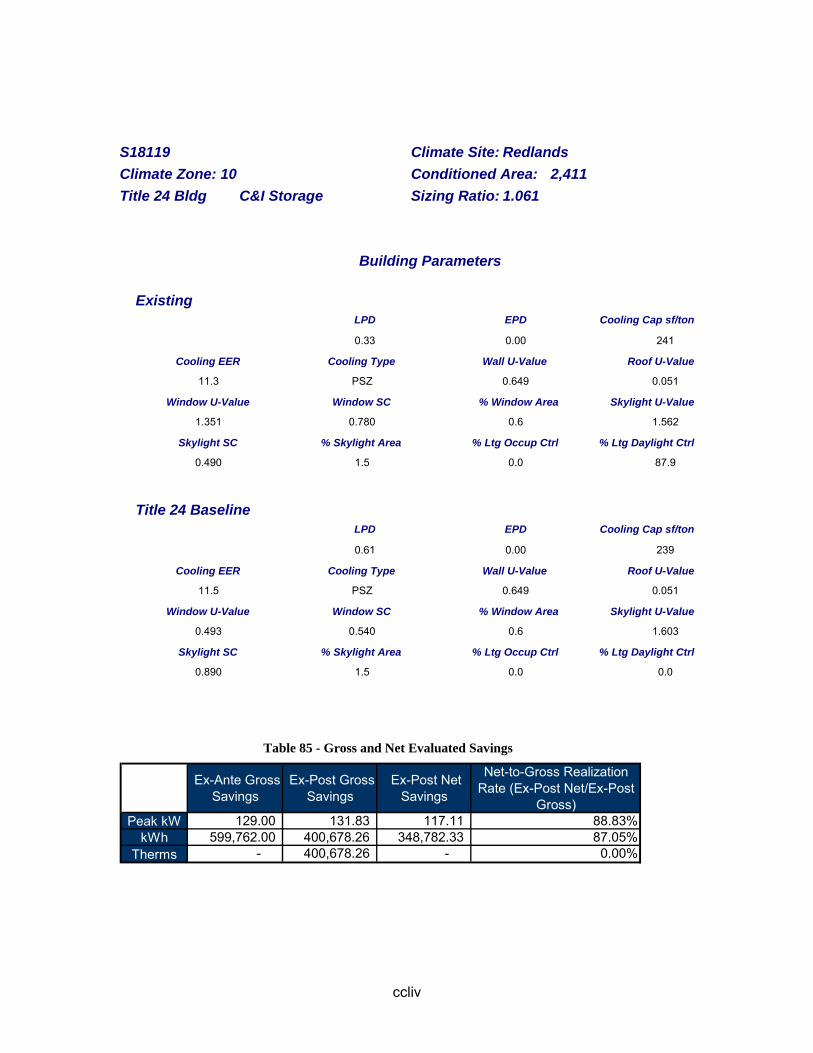
ccliv
S18119 Climate Site: Redlands Climate Zone: 10 Conditioned Area: 2,411 Title 24 Bldg C&I Storage Sizing Ratio: 1.061
Building Parameters
Existing LPD EPD Cooling Cap sf/ton 0.33 0.00 241 Cooling EER Cooling Type Wall U-Value Roof U-Value 11.3 PSZ 0.649 0.051 Window U-Value Window SC % Window Area Skylight U-Value 1.351 0.780 0.6 1.562 Skylight SC % Skylight Area % Ltg Occup Ctrl % Ltg Daylight Ctrl 0.490 1.5 0.0 87.9
Title 24 Baseline LPD EPD Cooling Cap sf/ton 0.61 0.00 239 Cooling EER Cooling Type Wall U-Value Roof U-Value 11.5 PSZ 0.649 0.051 Window U-Value Window SC % Window Area Skylight U-Value 0.493 0.540 0.6 1.603 Skylight SC % Skylight Area % Ltg Occup Ctrl % Ltg Daylight Ctrl 0.890 1.5 0.0 0.0
Table 85 - Gross and Net Evaluated Savings
Ex-Ante Gross Savings
Ex-Post Gross Savings
Ex-Post Net Savings
Net-to-Gross Realization Rate (Ex-Post Net/Ex-Post
Gross)Peak kW 129.00 131.83 117.11 88.83%
kWh 599,762.00 400,678.26 348,782.33 87.05%Therms - 400,678.26 - 0.00%
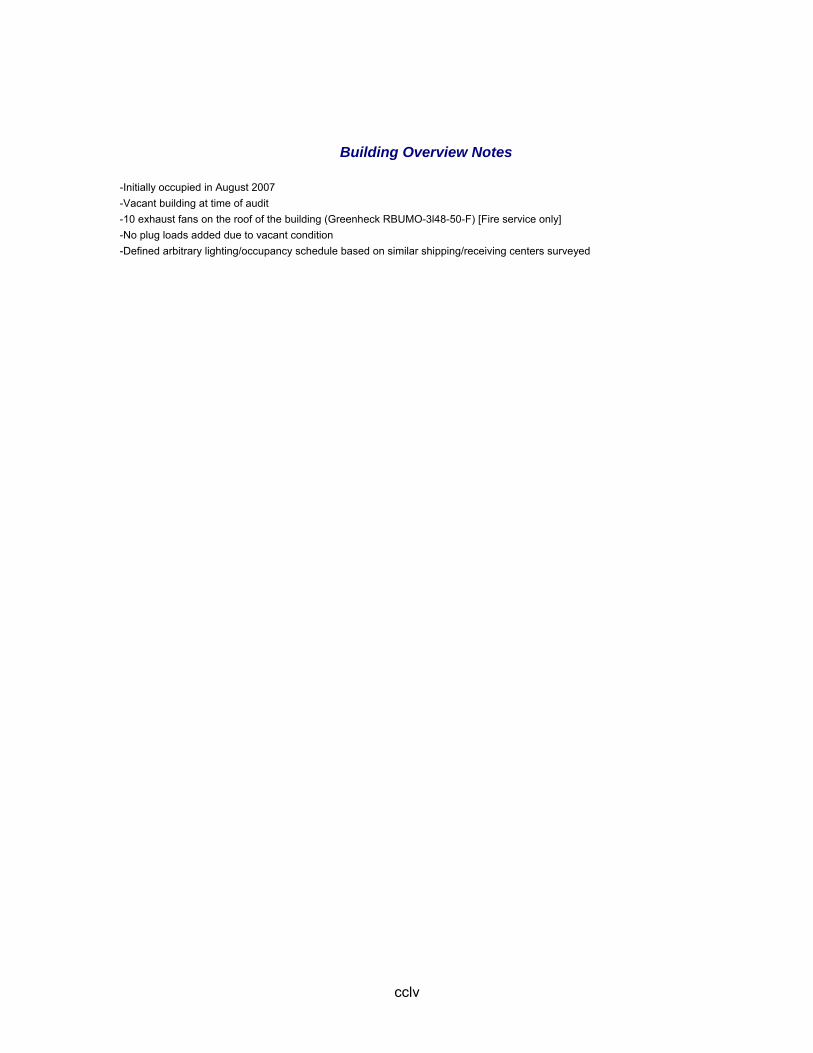
cclv
Building Overview Notes -Initially occupied in August 2007 -Vacant building at time of audit -10 exhaust fans on the roof of the building (Greenheck RBUMO-3l48-50-F) [Fire service only] -No plug loads added due to vacant condition -Defined arbitrary lighting/occupancy schedule based on similar shipping/receiving centers surveyed
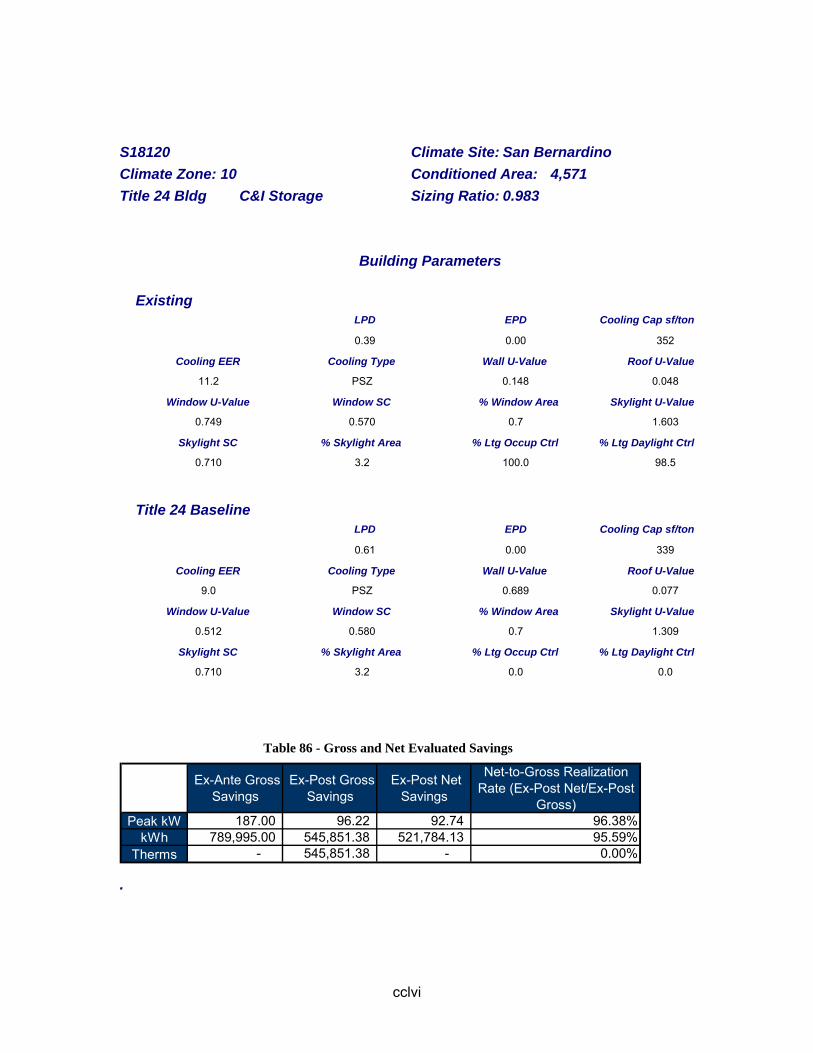
cclvi
S18120 Climate Site: San Bernardino Climate Zone: 10 Conditioned Area: 4,571 Title 24 Bldg C&I Storage Sizing Ratio: 0.983
Building Parameters
Existing LPD EPD Cooling Cap sf/ton 0.39 0.00 352 Cooling EER Cooling Type Wall U-Value Roof U-Value 11.2 PSZ 0.148 0.048 Window U-Value Window SC % Window Area Skylight U-Value 0.749 0.570 0.7 1.603 Skylight SC % Skylight Area % Ltg Occup Ctrl % Ltg Daylight Ctrl 0.710 3.2 100.0 98.5
Title 24 Baseline LPD EPD Cooling Cap sf/ton 0.61 0.00 339 Cooling EER Cooling Type Wall U-Value Roof U-Value 9.0 PSZ 0.689 0.077 Window U-Value Window SC % Window Area Skylight U-Value 0.512 0.580 0.7 1.309 Skylight SC % Skylight Area % Ltg Occup Ctrl % Ltg Daylight Ctrl 0.710 3.2 0.0 0.0
Table 86 - Gross and Net Evaluated Savings
Ex-Ante Gross Savings
Ex-Post Gross Savings
Ex-Post Net Savings
Net-to-Gross Realization Rate (Ex-Post Net/Ex-Post
Gross)Peak kW 187.00 96.22 92.74 96.38%
kWh 789,995.00 545,851.38 521,784.13 95.59%Therms - 545,851.38 - 0.00%
.
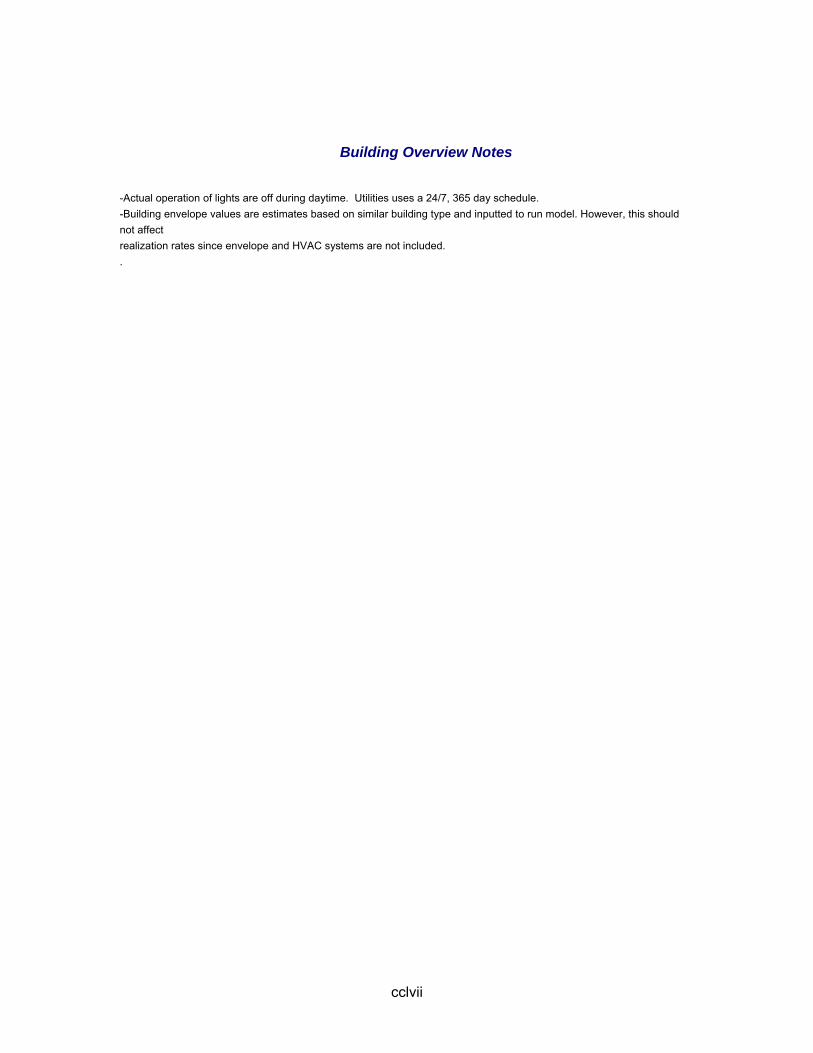
cclvii
Building Overview Notes
-Actual operation of lights are off during daytime. Utilities uses a 24/7, 365 day schedule. -Building envelope values are estimates based on similar building type and inputted to run model. However, this should not affect realization rates since envelope and HVAC systems are not included. .

cclviii
S18125 Climate Site: Fontana Climate Zone: 10 Conditioned Area: 18,650 Title 24 Bldg C&I Storage Sizing Ratio: 0.966
Building Parameters
Existing LPD EPD Cooling Cap sf/ton 0.39 0.24 278 Cooling EER Cooling Type Wall U-Value Roof U-Value 11.1 PSZ 0.108 0.038 Window U-Value Window SC % Window Area Skylight U-Value 0.604 0.700 1.6 2.460 Skylight SC % Skylight Area % Ltg Occup Ctrl % Ltg Daylight Ctrl 0.710 2.3 0.0 78.6
Title 24 Baseline LPD EPD Cooling Cap sf/ton 0.63 0.24 281 Cooling EER Cooling Type Wall U-Value Roof U-Value 11.1 PSZ 0.649 0.051 Window U-Value Window SC % Window Area Skylight U-Value 0.493 0.601 1.6 1.603 Skylight SC % Skylight Area % Ltg Occup Ctrl % Ltg Daylight Ctrl 0.710 2.3 0.0 0.0
Table 87 - Gross and Net Evaluated Savings
Ex-Ante Gross Savings
Ex-Post Gross Savings
Ex-Post Net Savings
Net-to-Gross Realization Rate (Ex-Post Net/Ex-Post
Gross)Peak kW 127.00 152.42 13.75 9.02%
kWh 567,434.00 406,962.88 42,466.75 10.44%Therms - 406,962.88 - 0.00%
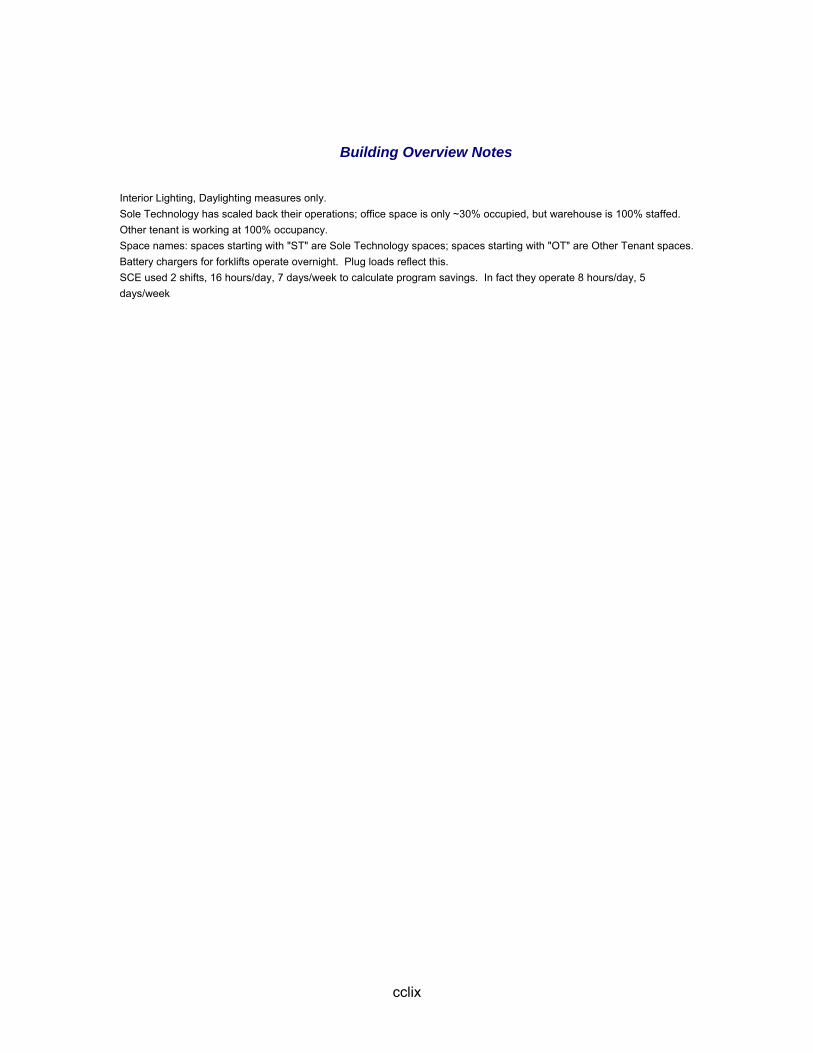
cclix
Building Overview Notes
Interior Lighting, Daylighting measures only. Sole Technology has scaled back their operations; office space is only ~30% occupied, but warehouse is 100% staffed. Other tenant is working at 100% occupancy. Space names: spaces starting with "ST" are Sole Technology spaces; spaces starting with "OT" are Other Tenant spaces. Battery chargers for forklifts operate overnight. Plug loads reflect this. SCE used 2 shifts, 16 hours/day, 7 days/week to calculate program savings. In fact they operate 8 hours/day, 5 days/week

cclx
S18129 Climate Site: Monterey Park Climate Zone: 9 Conditioned Area: 16,197 Title 24 Bldg Retail and Wholesale Store Sizing Ratio: 0.948
Building Parameters
Existing LPD EPD Cooling Cap sf/ton 1.92 5.67 415 Cooling EER Cooling Type Wall U-Value Roof U-Value 11.3 PSZ 0.454 0.035 Window U-Value Window SC % Window Area Skylight U-Value 1.277 0.920 2.9 0.000 Skylight SC % Skylight Area % Ltg Occup Ctrl % Ltg Daylight Ctrl 0.000 0.0 5.9 7.7
Title 24 Baseline LPD EPD Cooling Cap sf/ton 1.64 5.67 416 Cooling EER Cooling Type Wall U-Value Roof U-Value 10.7 PSZ 0.451 0.075 Window U-Value Window SC % Window Area Skylight U-Value 1.277 0.920 2.9 0.000 Skylight SC % Skylight Area % Ltg Occup Ctrl % Ltg Daylight Ctrl 0.000 0.0 0.0 0.0
88 - Gross and Net Evaluated Savings
Ex-Ante Gross Savings
Ex-Post Gross Savings
Ex-Post Net Savings
Net-to-Gross Realization Rate (Ex-Post Net/Ex-Post
Gross)Peak kW 12.00 (2.89) (3.68) 127.52%
kWh 37,727.00 (25,212.47) (26,906.28) 106.72%Therms (163.00) (25,212.47) 2.24 -0.01%
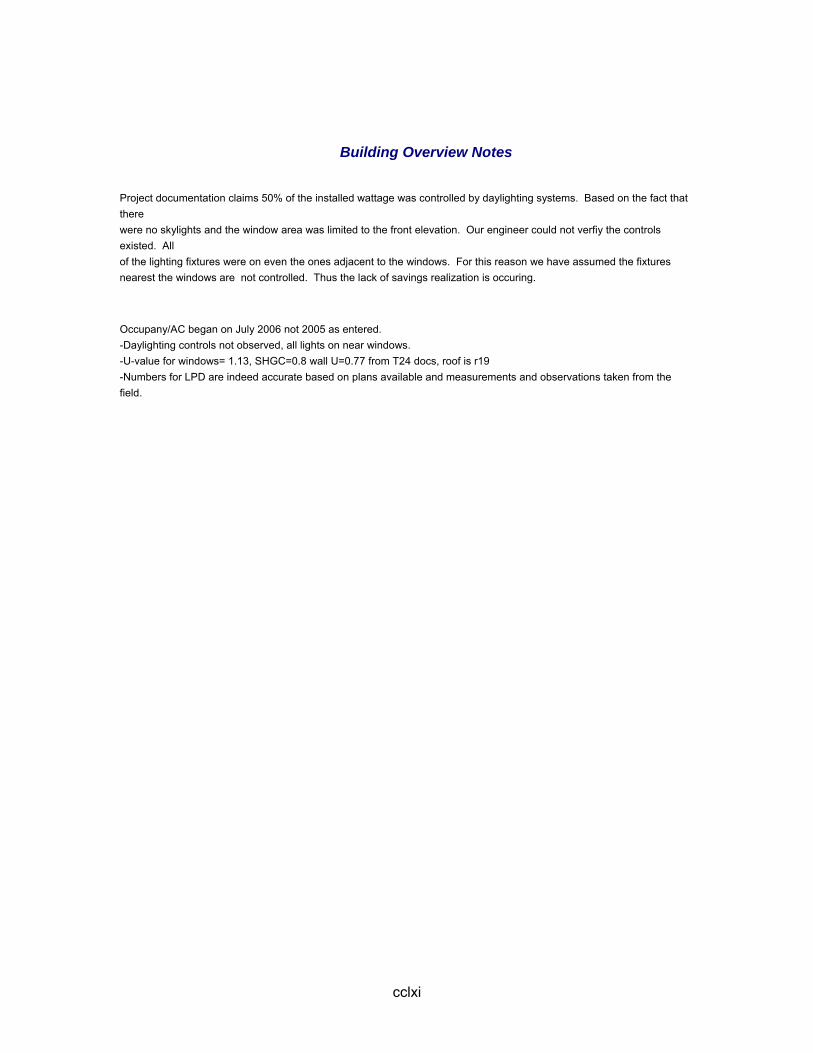
cclxi
Building Overview Notes
Project documentation claims 50% of the installed wattage was controlled by daylighting systems. Based on the fact that there were no skylights and the window area was limited to the front elevation. Our engineer could not verfiy the controls existed. All of the lighting fixtures were on even the ones adjacent to the windows. For this reason we have assumed the fixtures nearest the windows are not controlled. Thus the lack of savings realization is occuring. Occupany/AC began on July 2006 not 2005 as entered. -Daylighting controls not observed, all lights on near windows. -U-value for windows= 1.13, SHGC=0.8 wall U=0.77 from T24 docs, roof is r19 -Numbers for LPD are indeed accurate based on plans available and measurements and observations taken from the field.

cclxii
S18152 Climate Site: Elsinore Climate Zone: 10 Conditioned Area: 19,136 Title 24 Bldg Retail and Wholesale Store Sizing Ratio: 0.720
Building Parameters
Existing LPD EPD Cooling Cap sf/ton 1.81 1.80 638 Cooling EER Cooling Type Wall U-Value Roof U-Value 11.0 PSZ 0.689 0.077 Window U-Value Window SC % Window Area Skylight U-Value 0.777 0.880 3.1 2.587 Skylight SC % Skylight Area % Ltg Occup Ctrl % Ltg Daylight Ctrl 0.804 1.1 0.0 0.0
Title 24 Baseline LPD EPD Cooling Cap sf/ton 1.81 1.80 639 Cooling EER Cooling Type Wall U-Value Roof U-Value 9.7 PSZ 0.689 0.077 Window U-Value Window SC % Window Area Skylight U-Value 0.512 0.590 3.1 1.216 Skylight SC % Skylight Area % Ltg Occup Ctrl % Ltg Daylight Ctrl 0.602 1.1 0.0 0.0
Table 89 -Gross and Net Evaluated Savings
Ex-Ante Gross Savings
Ex-Post Gross Savings
Ex-Post Net Savings
Net-to-Gross Realization Rate (Ex-Post Net/Ex-Post
Gross)Peak kW 4.00 1.59 1.37 86.08%
kWh 4,833.00 3,579.97 3,044.34 85.04%Therms - 3,579.97 (0.04) 0.00%
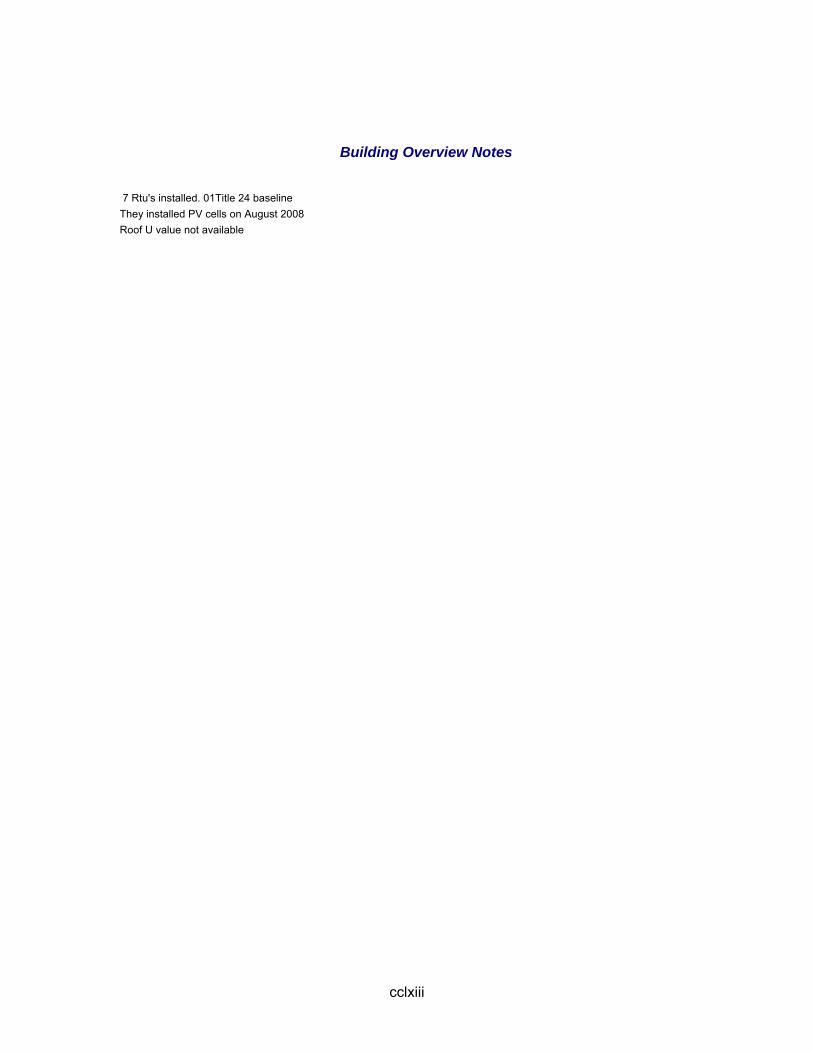
cclxiii
Building Overview Notes
7 Rtu's installed. 01Title 24 baseline They installed PV cells on August 2008 Roof U value not available
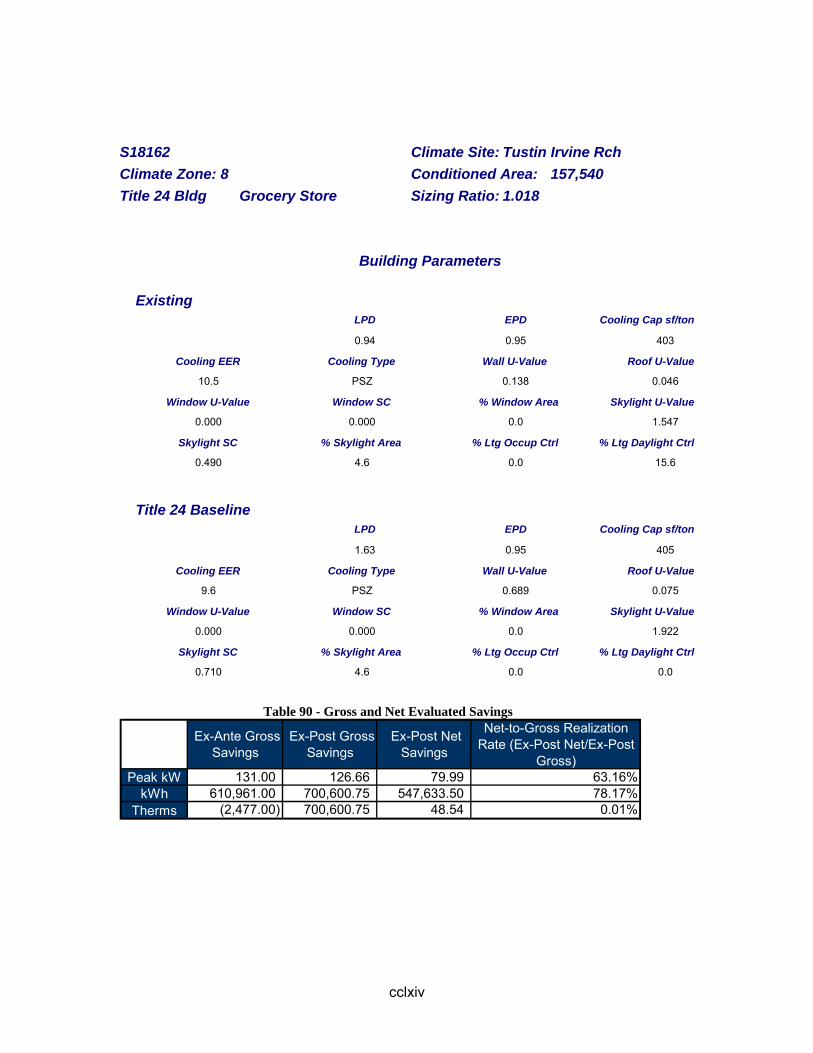
cclxiv
S18162 Climate Site: Tustin Irvine Rch Climate Zone: 8 Conditioned Area: 157,540 Title 24 Bldg Grocery Store Sizing Ratio: 1.018
Building Parameters
Existing LPD EPD Cooling Cap sf/ton 0.94 0.95 403 Cooling EER Cooling Type Wall U-Value Roof U-Value 10.5 PSZ 0.138 0.046 Window U-Value Window SC % Window Area Skylight U-Value 0.000 0.000 0.0 1.547 Skylight SC % Skylight Area % Ltg Occup Ctrl % Ltg Daylight Ctrl 0.490 4.6 0.0 15.6
Title 24 Baseline LPD EPD Cooling Cap sf/ton 1.63 0.95 405 Cooling EER Cooling Type Wall U-Value Roof U-Value 9.6 PSZ 0.689 0.075 Window U-Value Window SC % Window Area Skylight U-Value 0.000 0.000 0.0 1.922 Skylight SC % Skylight Area % Ltg Occup Ctrl % Ltg Daylight Ctrl 0.710 4.6 0.0 0.0
Table 90 - Gross and Net Evaluated Savings
Ex-Ante Gross Savings
Ex-Post Gross Savings
Ex-Post Net Savings
Net-to-Gross Realization Rate (Ex-Post Net/Ex-Post
Gross)Peak kW 131.00 126.66 79.99 63.16%
kWh 610,961.00 700,600.75 547,633.50 78.17%Therms (2,477.00) 700,600.75 48.54 0.01%
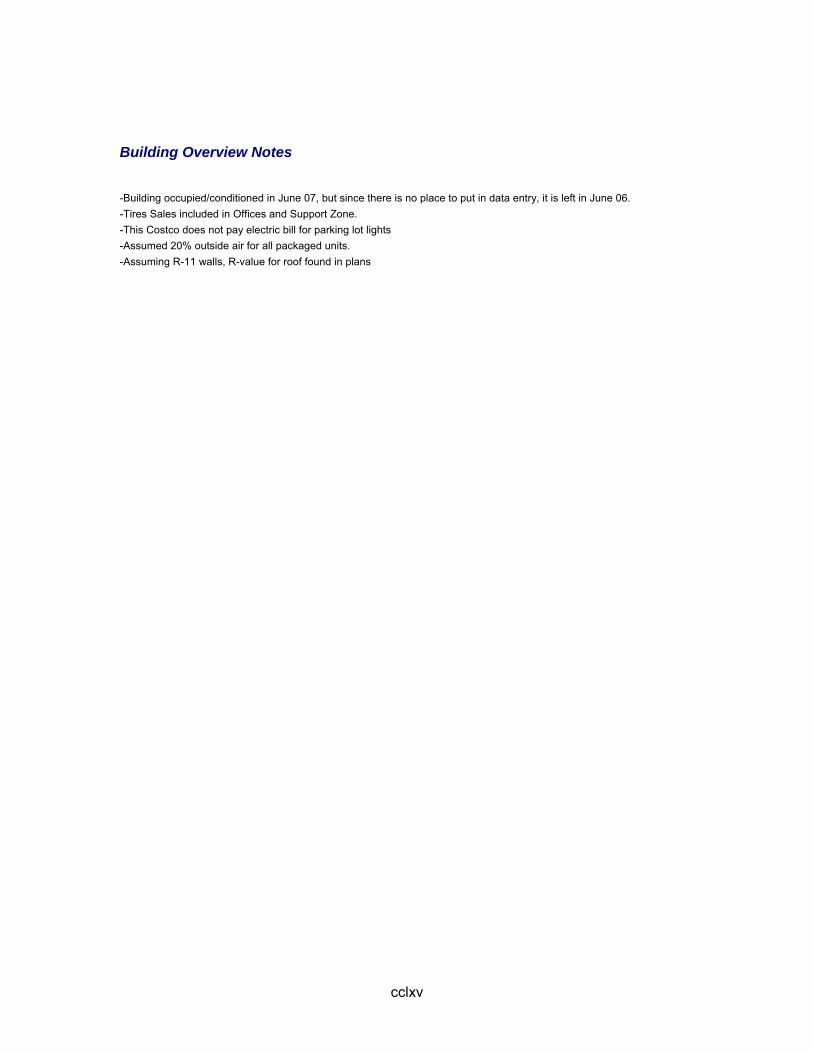
cclxv
Building Overview Notes
-Building occupied/conditioned in June 07, but since there is no place to put in data entry, it is left in June 06. -Tires Sales included in Offices and Support Zone. -This Costco does not pay electric bill for parking lot lights -Assumed 20% outside air for all packaged units. -Assuming R-11 walls, R-value for roof found in plans

cclxvi
S19003 Climate Site: San Bernardino Climate Zone: 10 Conditioned Area: 293,814 Title 24 Bldg Office Sizing Ratio:
Building Parameters
Existing LPD EPD Cooling Cap sf/ton 0.97 5.16 397 Cooling EER Cooling Type Wall U-Value Roof U-Value 14.2 PVAV 0.000 0.000 Window U-Value Window SC % Window Area Skylight U-Value 0.000 0.158 0.0 0.000 Skylight SC % Skylight Area % Ltg Occup Ctrl % Ltg Daylight Ctrl 0.000 0.0 0.0 0.0
Title 24 Baseline LPD EPD Cooling Cap sf/ton 1.20 5.16 510 Cooling EER Cooling Type Wall U-Value Roof U-Value 11.0 PVAV 0.000 0.000 Window U-Value Window SC % Window Area Skylight U-Value 0.000 0.329 0.0 0.000 Skylight SC % Skylight Area % Ltg Occup Ctrl % Ltg Daylight Ctrl 0.000 0.0 0.0 0.0
Table 91 - Gross and Net Evaluated Savings
Ex-Ante Gross Savings
Ex-Post Gross Savings
Ex-Post Net Savings
Net-to-Gross Realization Rate (Ex-Post Net/Ex-Post
Gross)Peak kW 167.00 87.90 89.37 101.67%
kWh 347,959.00 251,582.50 269,243.00 107.02%Therms 1,302.00 251,582.50 185.62 0.07%

cclxvii
Building Overview Notes
-Incented for HVAC measures which includes low SHGC glass, VFDs, and packaged systems. -Floor areas are best estimates based on floor plan and sketches. Total conditioned floor area is within ~3.8% error to what is claimed. -Glazing will exceed 40% of wall area and as observed. -Exhaust fans are not exact but modeled as separate fans per zone. Actual CFM adjusted to match OSA and may not reflect values taken from mechanical schedule. -Separate supply fan for OSA, modeled as part of main package system per floor. Actual OSA for package system is zero, but adjusted to both reflect the minimum OSA requirements and actual (separate) minimum supply fan capacity.

cclxviii
S19010 Climate Site: Tulare Climate Zone: 13 Conditioned Area: 6,295 Title 24 Bldg Restaurant Sizing Ratio: 0.773
Building Parameters
Existing LPD EPD Cooling Cap sf/ton 0.96 11.22 138 Cooling EER Cooling Type Wall U-Value Roof U-Value 11.8 PSZ 0.100 0.049 Window U-Value Window SC % Window Area Skylight U-Value 0.749 0.380 9.4 0.000 Skylight SC % Skylight Area % Ltg Occup Ctrl % Ltg Daylight Ctrl 0.000 0.0 0.0 50.4
Title 24 Baseline LPD EPD Cooling Cap sf/ton 1.16 11.22 140 Cooling EER Cooling Type Wall U-Value Roof U-Value 9.7 PSZ 0.649 0.051 Window U-Value Window SC % Window Area Skylight U-Value 0.493 0.410 9.4 0.000 Skylight SC % Skylight Area % Ltg Occup Ctrl % Ltg Daylight Ctrl 0.000 0.0 0.0 0.0
Table 92 - Gross and Net Evaluated Savings
Ex-Ante Gross Savings
Ex-Post Gross Savings
Ex-Post Net Savings
Net-to-Gross Realization Rate (Ex-Post Net/Ex-Post
Gross)Peak kW 10.00 5.75 4.67 81.09%
kWh 31,863.00 10,527.41 5,209.28 49.48%Therms (123.00) 10,527.41 37.89 0.36%

cclxix
Building Overview Notes
-U/SHGC values for roof/walls/ windows taken from T24 sheets. U-value=0.7 for double pane metal windows assumed. -Information for compressor/condenser units not available. Condenser capacity and design values are estimates. -Lighting verified and as per plans. -Kitchen equipment energy values are estimates. -Plans shows a control credit of 1285W for "dimming" feature as modeled. -Systems incentives for LPD and rooftop HVAC units.
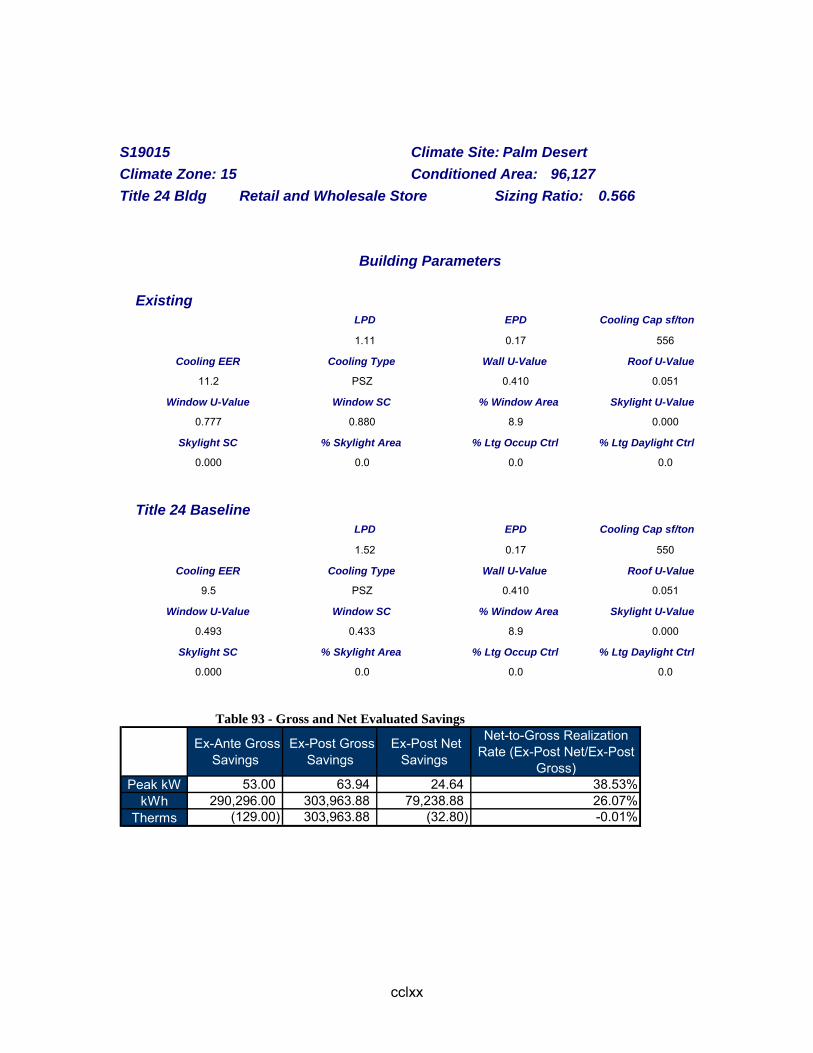
cclxx
S19015 Climate Site: Palm Desert Climate Zone: 15 Conditioned Area: 96,127 Title 24 Bldg Retail and Wholesale Store Sizing Ratio: 0.566
Building Parameters
Existing LPD EPD Cooling Cap sf/ton 1.11 0.17 556 Cooling EER Cooling Type Wall U-Value Roof U-Value 11.2 PSZ 0.410 0.051 Window U-Value Window SC % Window Area Skylight U-Value 0.777 0.880 8.9 0.000 Skylight SC % Skylight Area % Ltg Occup Ctrl % Ltg Daylight Ctrl 0.000 0.0 0.0 0.0
Title 24 Baseline LPD EPD Cooling Cap sf/ton 1.52 0.17 550 Cooling EER Cooling Type Wall U-Value Roof U-Value 9.5 PSZ 0.410 0.051 Window U-Value Window SC % Window Area Skylight U-Value 0.493 0.433 8.9 0.000 Skylight SC % Skylight Area % Ltg Occup Ctrl % Ltg Daylight Ctrl 0.000 0.0 0.0 0.0
Table 93 - Gross and Net Evaluated Savings
Ex-Ante Gross Savings
Ex-Post Gross Savings
Ex-Post Net Savings
Net-to-Gross Realization Rate (Ex-Post Net/Ex-Post
Gross)Peak kW 53.00 63.94 24.64 38.53%
kWh 290,296.00 303,963.88 79,238.88 26.07%Therms (129.00) 303,963.88 (32.80) -0.01%
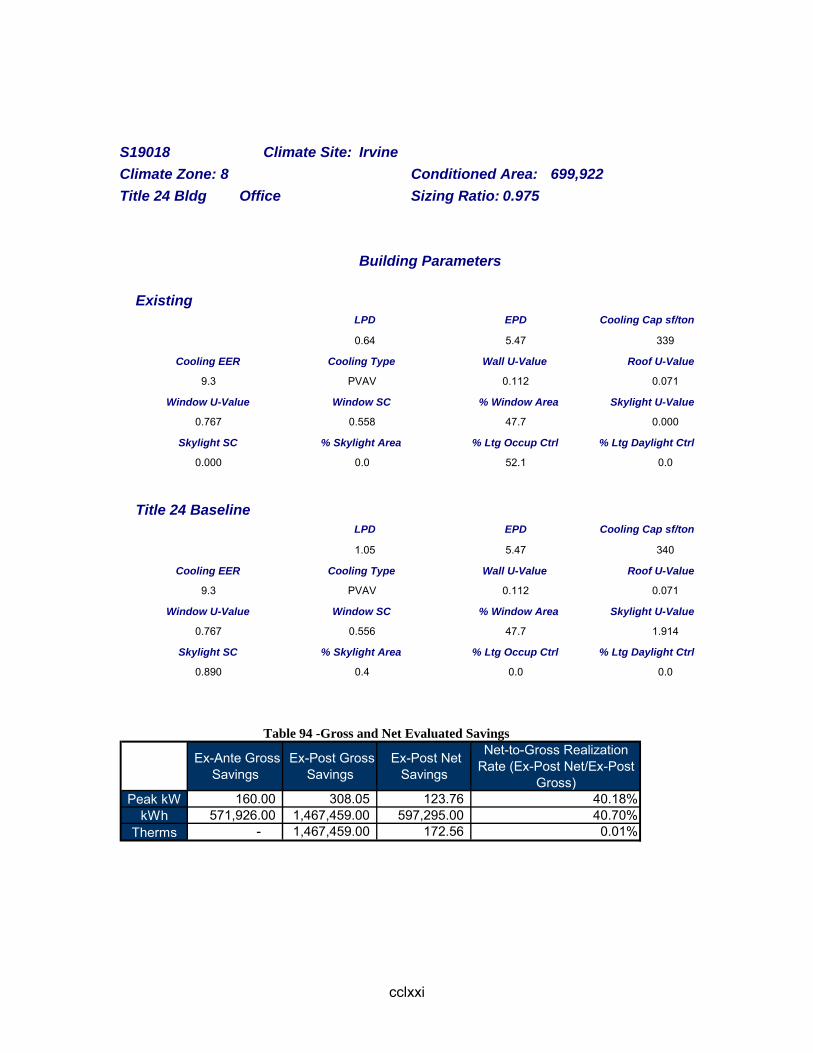
cclxxi
S19018 Climate Site: Irvine Climate Zone: 8 Conditioned Area: 699,922 Title 24 Bldg Office Sizing Ratio: 0.975
Building Parameters
Existing LPD EPD Cooling Cap sf/ton 0.64 5.47 339 Cooling EER Cooling Type Wall U-Value Roof U-Value 9.3 PVAV 0.112 0.071 Window U-Value Window SC % Window Area Skylight U-Value 0.767 0.558 47.7 0.000 Skylight SC % Skylight Area % Ltg Occup Ctrl % Ltg Daylight Ctrl 0.000 0.0 52.1 0.0
Title 24 Baseline LPD EPD Cooling Cap sf/ton 1.05 5.47 340 Cooling EER Cooling Type Wall U-Value Roof U-Value 9.3 PVAV 0.112 0.071 Window U-Value Window SC % Window Area Skylight U-Value 0.767 0.556 47.7 1.914 Skylight SC % Skylight Area % Ltg Occup Ctrl % Ltg Daylight Ctrl 0.890 0.4 0.0 0.0
Table 94 -Gross and Net Evaluated Savings
Ex-Ante Gross Savings
Ex-Post Gross Savings
Ex-Post Net Savings
Net-to-Gross Realization Rate (Ex-Post Net/Ex-Post
Gross)Peak kW 160.00 308.05 123.76 40.18%
kWh 571,926.00 1,467,459.00 597,295.00 40.70%Therms - 1,467,459.00 172.56 0.01%
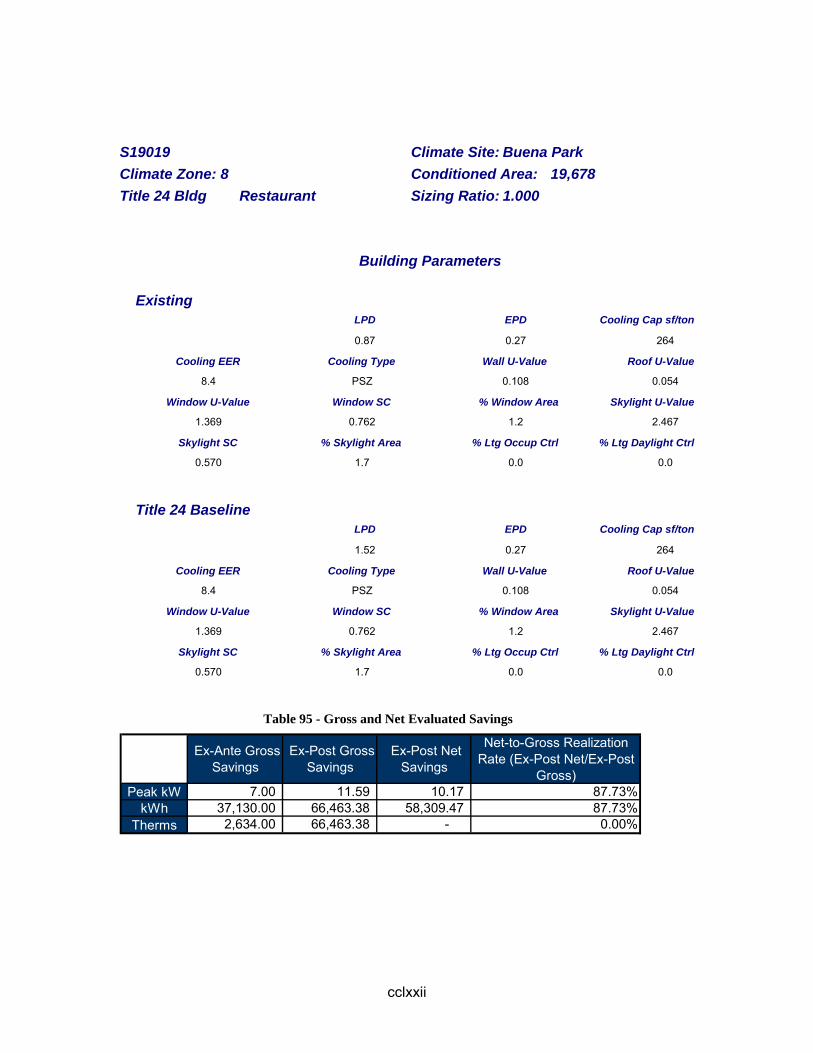
cclxxii
S19019 Climate Site: Buena Park Climate Zone: 8 Conditioned Area: 19,678 Title 24 Bldg Restaurant Sizing Ratio: 1.000
Building Parameters
Existing LPD EPD Cooling Cap sf/ton 0.87 0.27 264 Cooling EER Cooling Type Wall U-Value Roof U-Value 8.4 PSZ 0.108 0.054 Window U-Value Window SC % Window Area Skylight U-Value 1.369 0.762 1.2 2.467 Skylight SC % Skylight Area % Ltg Occup Ctrl % Ltg Daylight Ctrl 0.570 1.7 0.0 0.0
Title 24 Baseline LPD EPD Cooling Cap sf/ton 1.52 0.27 264 Cooling EER Cooling Type Wall U-Value Roof U-Value 8.4 PSZ 0.108 0.054 Window U-Value Window SC % Window Area Skylight U-Value 1.369 0.762 1.2 2.467 Skylight SC % Skylight Area % Ltg Occup Ctrl % Ltg Daylight Ctrl 0.570 1.7 0.0 0.0
Table 95 - Gross and Net Evaluated Savings
Ex-Ante Gross Savings
Ex-Post Gross Savings
Ex-Post Net Savings
Net-to-Gross Realization Rate (Ex-Post Net/Ex-Post
Gross)Peak kW 7.00 11.59 10.17 87.73%
kWh 37,130.00 66,463.38 58,309.47 87.73%Therms 2,634.00 66,463.38 - 0.00%
cclxxiii
Building Overview Notes
Complete remodel of existing warehouse. "Office" space includes two restrooms and two changing/locker rooms. Bakery lighting, bakery high-efficiency gas oven and office high-efficiency HVAC measures only. Actual schedule is 14 hours a day, 365 days a year (with 16-hour operations four days a year)
S19023 Climate Site: Carson Climate Zone: 6 Conditioned Area: 181,167
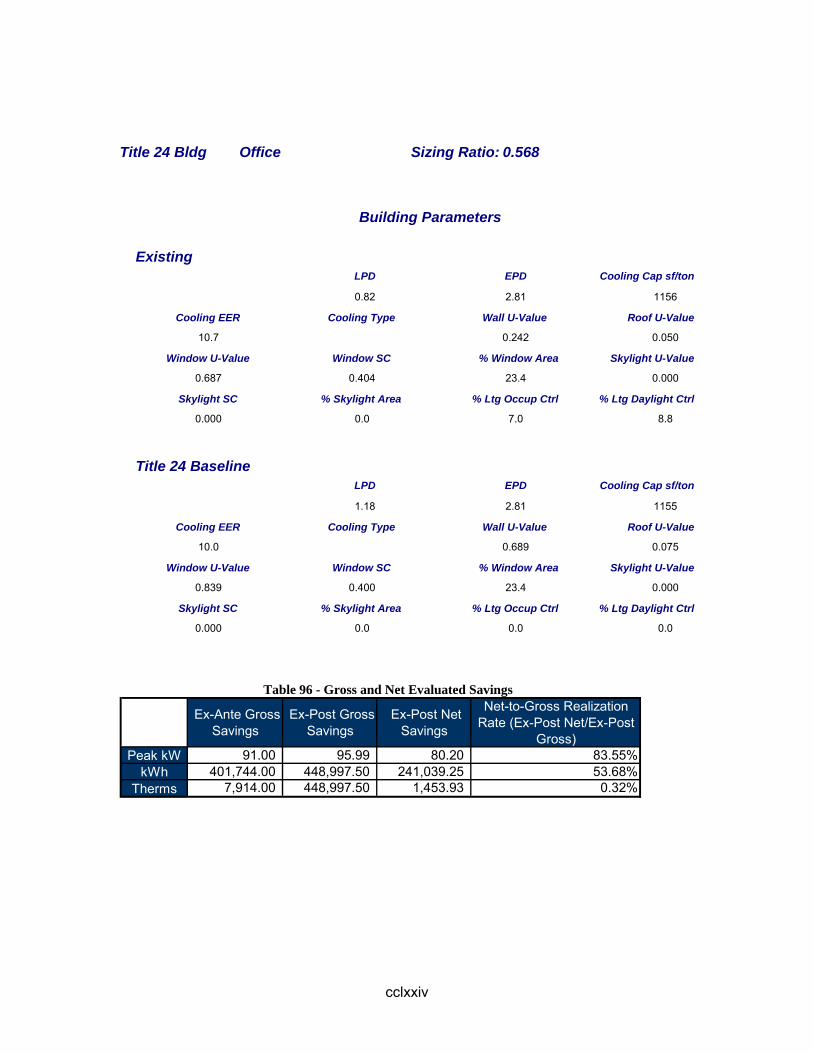
cclxxiv
Title 24 Bldg Office Sizing Ratio: 0.568
Building Parameters
Existing LPD EPD Cooling Cap sf/ton 0.82 2.81 1156 Cooling EER Cooling Type Wall U-Value Roof U-Value 10.7 0.242 0.050 Window U-Value Window SC % Window Area Skylight U-Value 0.687 0.404 23.4 0.000 Skylight SC % Skylight Area % Ltg Occup Ctrl % Ltg Daylight Ctrl 0.000 0.0 7.0 8.8
Title 24 Baseline LPD EPD Cooling Cap sf/ton 1.18 2.81 1155 Cooling EER Cooling Type Wall U-Value Roof U-Value 10.0 0.689 0.075 Window U-Value Window SC % Window Area Skylight U-Value 0.839 0.400 23.4 0.000 Skylight SC % Skylight Area % Ltg Occup Ctrl % Ltg Daylight Ctrl 0.000 0.0 0.0 0.0
Table 96 - Gross and Net Evaluated Savings
Ex-Ante Gross Savings
Ex-Post Gross Savings
Ex-Post Net Savings
Net-to-Gross Realization Rate (Ex-Post Net/Ex-Post
Gross)Peak kW 91.00 95.99 80.20 83.55%
kWh 401,744.00 448,997.50 241,039.25 53.68%Therms 7,914.00 448,997.50 1,453.93 0.32%
cclxxv
Building Overview Notes -Wattage on exterior lights is an estimate. -Number inputted for % OA is the % economizer is opened not necessarily the OA%.
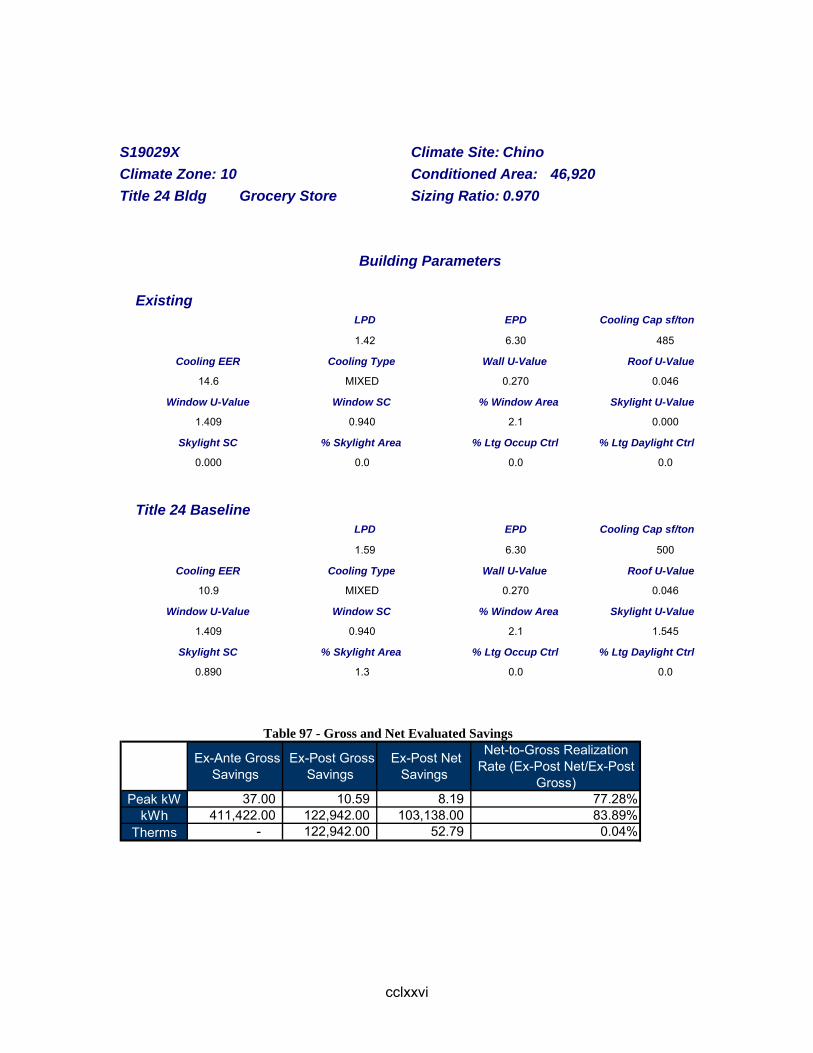
cclxxvi
S19029X Climate Site: Chino Climate Zone: 10 Conditioned Area: 46,920 Title 24 Bldg Grocery Store Sizing Ratio: 0.970
Building Parameters
Existing LPD EPD Cooling Cap sf/ton 1.42 6.30 485 Cooling EER Cooling Type Wall U-Value Roof U-Value 14.6 MIXED 0.270 0.046 Window U-Value Window SC % Window Area Skylight U-Value 1.409 0.940 2.1 0.000 Skylight SC % Skylight Area % Ltg Occup Ctrl % Ltg Daylight Ctrl 0.000 0.0 0.0 0.0
Title 24 Baseline LPD EPD Cooling Cap sf/ton 1.59 6.30 500 Cooling EER Cooling Type Wall U-Value Roof U-Value 10.9 MIXED 0.270 0.046 Window U-Value Window SC % Window Area Skylight U-Value 1.409 0.940 2.1 1.545 Skylight SC % Skylight Area % Ltg Occup Ctrl % Ltg Daylight Ctrl 0.890 1.3 0.0 0.0
Table 97 - Gross and Net Evaluated Savings
Ex-Ante Gross Savings
Ex-Post Gross Savings
Ex-Post Net Savings
Net-to-Gross Realization Rate (Ex-Post Net/Ex-Post
Gross)Peak kW 37.00 10.59 8.19 77.28%
kWh 411,422.00 122,942.00 103,138.00 83.89%Therms - 122,942.00 52.79 0.04%
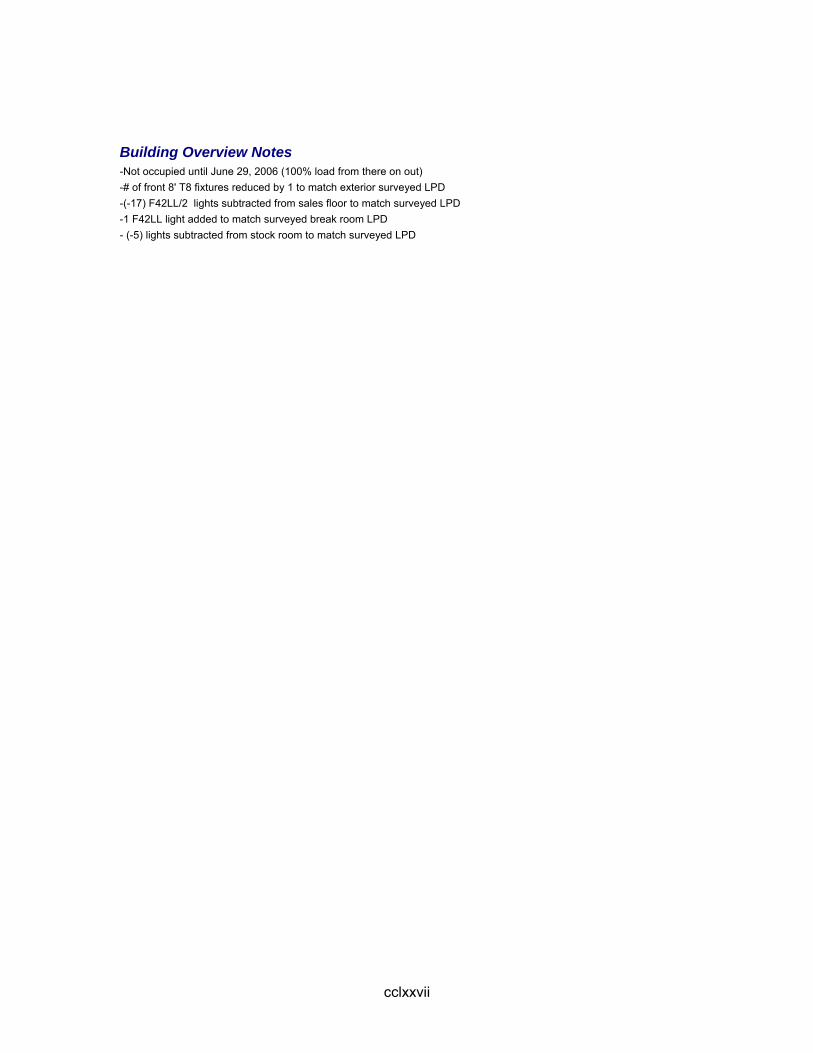
cclxxvii
Building Overview Notes -Not occupied until June 29, 2006 (100% load from there on out) -# of front 8' T8 fixtures reduced by 1 to match exterior surveyed LPD -(-17) F42LL/2 lights subtracted from sales floor to match surveyed LPD -1 F42LL light added to match surveyed break room LPD - (-5) lights subtracted from stock room to match surveyed LPD

cclxxviii
S19045 Climate Site: El Toro MCAS Climate Zone: 8 Conditioned Area: 48,420 Title 24 Bldg Grocery Store Sizing Ratio: 0.575
Building Parameters
Existing LPD EPD Cooling Cap sf/ton 1.28 1.91 494 Cooling EER Cooling Type Wall U-Value Roof U-Value 12.7 MIXED 0.689 0.075 Window U-Value Window SC % Window Area Skylight U-Value 1.235 0.720 2.3 2.426 Skylight SC % Skylight Area % Ltg Occup Ctrl % Ltg Daylight Ctrl 0.570 4.7 5.4 39.9
Title 24 Baseline LPD EPD Cooling Cap sf/ton 1.49 1.91 491 Cooling EER Cooling Type Wall U-Value Roof U-Value 11.0 MIXED 0.689 0.075 Window U-Value Window SC % Window Area Skylight U-Value 0.839 0.700 2.3 1.912 Skylight SC % Skylight Area % Ltg Occup Ctrl % Ltg Daylight Ctrl 0.710 4.7 0.0 0.0
Table 98 - Gross and Net Evaluated Savings
Ex-Ante Gross Savings
Ex-Post Gross Savings
Ex-Post Net Savings
Net-to-Gross Realization Rate (Ex-Post Net/Ex-Post
Gross)Peak kW 79.00 57.75 53.40 92.48%
kWh 450,661.00 529,055.50 492,121.00 93.02%Therms (6,435.00) 529,055.50 (3.04) 0.00%

cclxxix
Building Overview Notes Modeling notes: Actual lighting fixture types were not used in creating the LPD because the correct fixture wattages could not be found in the database for the actual fixture types.
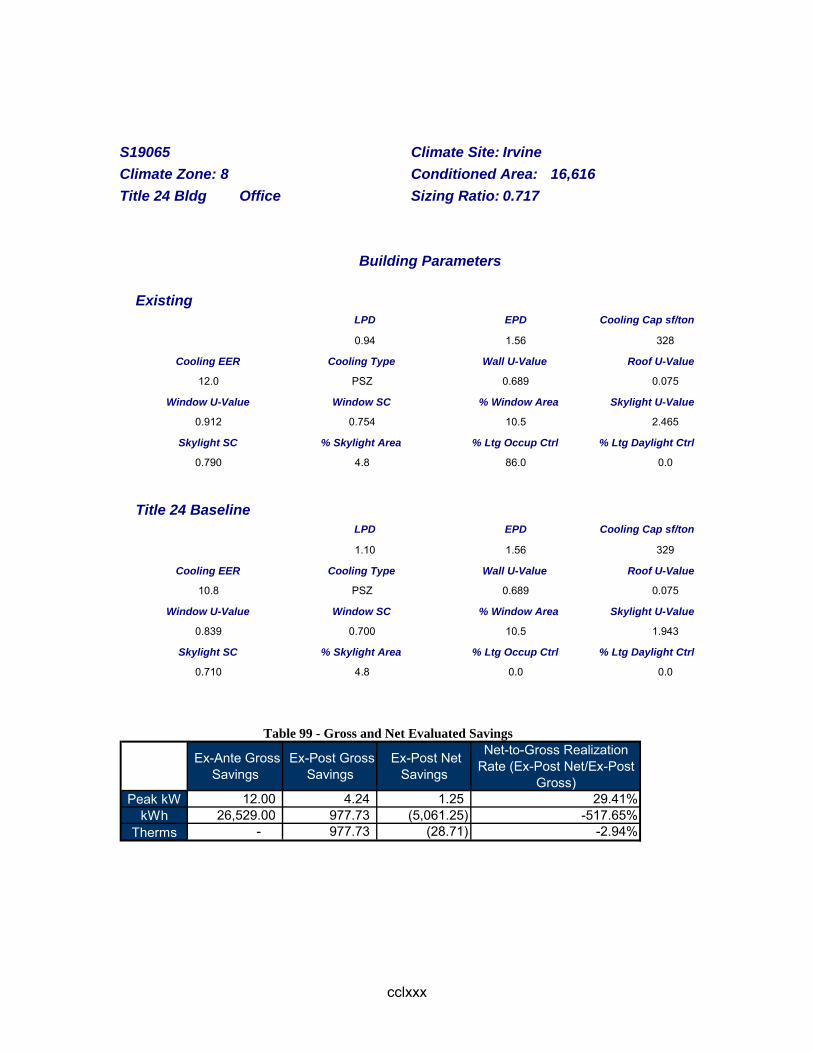
cclxxx
S19065 Climate Site: Irvine Climate Zone: 8 Conditioned Area: 16,616 Title 24 Bldg Office Sizing Ratio: 0.717
Building Parameters
Existing LPD EPD Cooling Cap sf/ton 0.94 1.56 328 Cooling EER Cooling Type Wall U-Value Roof U-Value 12.0 PSZ 0.689 0.075 Window U-Value Window SC % Window Area Skylight U-Value 0.912 0.754 10.5 2.465 Skylight SC % Skylight Area % Ltg Occup Ctrl % Ltg Daylight Ctrl 0.790 4.8 86.0 0.0
Title 24 Baseline LPD EPD Cooling Cap sf/ton 1.10 1.56 329 Cooling EER Cooling Type Wall U-Value Roof U-Value 10.8 PSZ 0.689 0.075 Window U-Value Window SC % Window Area Skylight U-Value 0.839 0.700 10.5 1.943 Skylight SC % Skylight Area % Ltg Occup Ctrl % Ltg Daylight Ctrl 0.710 4.8 0.0 0.0
Table 99 - Gross and Net Evaluated Savings
Ex-Ante Gross Savings
Ex-Post Gross Savings
Ex-Post Net Savings
Net-to-Gross Realization Rate (Ex-Post Net/Ex-Post
Gross)Peak kW 12.00 4.24 1.25 29.41%
kWh 26,529.00 977.73 (5,061.25) -517.65%Therms - 977.73 (28.71) -2.94%
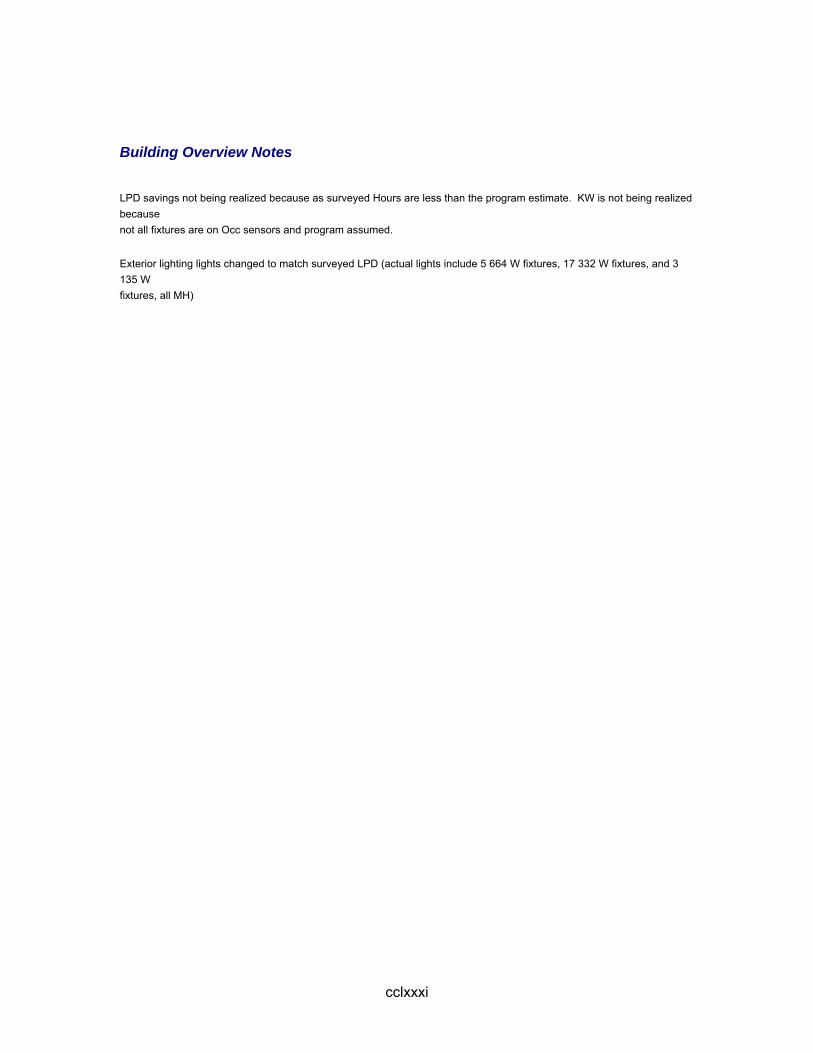
cclxxxi
Building Overview Notes
LPD savings not being realized because as surveyed Hours are less than the program estimate. KW is not being realized because not all fixtures are on Occ sensors and program assumed. Exterior lighting lights changed to match surveyed LPD (actual lights include 5 664 W fixtures, 17 332 W fixtures, and 3 135 W fixtures, all MH)
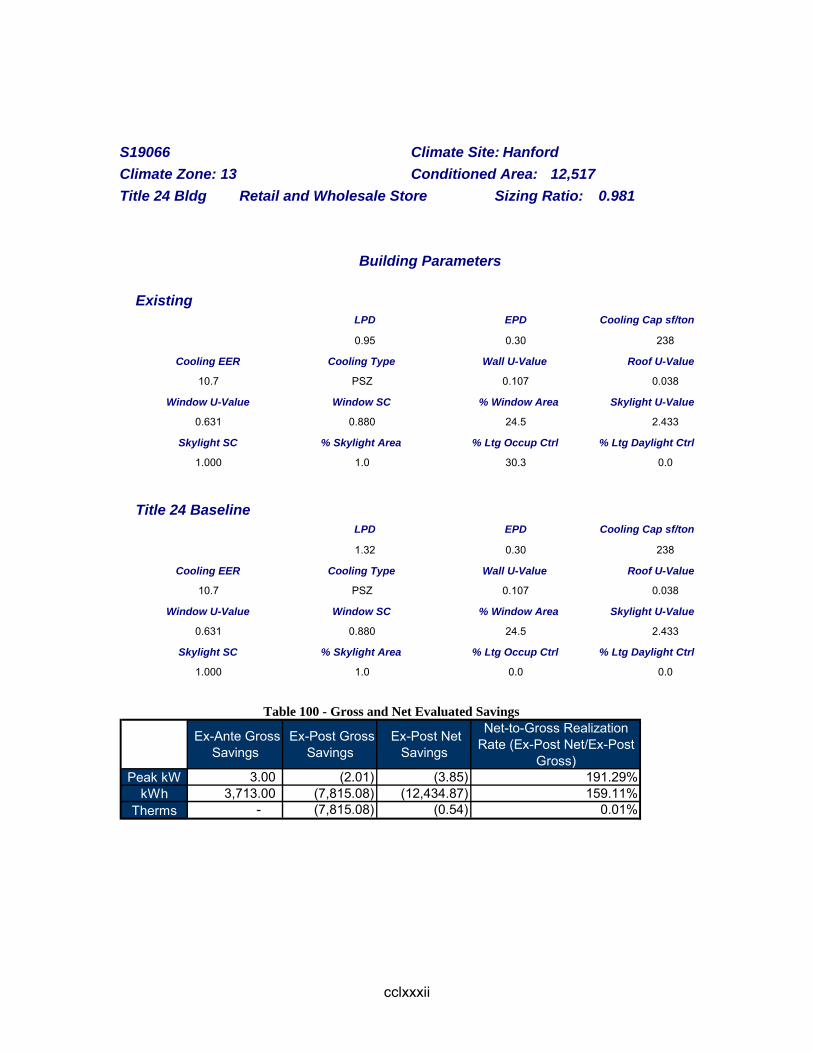
cclxxxii
S19066 Climate Site: Hanford Climate Zone: 13 Conditioned Area: 12,517 Title 24 Bldg Retail and Wholesale Store Sizing Ratio: 0.981
Building Parameters
Existing LPD EPD Cooling Cap sf/ton 0.95 0.30 238 Cooling EER Cooling Type Wall U-Value Roof U-Value 10.7 PSZ 0.107 0.038 Window U-Value Window SC % Window Area Skylight U-Value 0.631 0.880 24.5 2.433 Skylight SC % Skylight Area % Ltg Occup Ctrl % Ltg Daylight Ctrl 1.000 1.0 30.3 0.0
Title 24 Baseline LPD EPD Cooling Cap sf/ton 1.32 0.30 238 Cooling EER Cooling Type Wall U-Value Roof U-Value 10.7 PSZ 0.107 0.038 Window U-Value Window SC % Window Area Skylight U-Value 0.631 0.880 24.5 2.433 Skylight SC % Skylight Area % Ltg Occup Ctrl % Ltg Daylight Ctrl 1.000 1.0 0.0 0.0
Table 100 - Gross and Net Evaluated Savings
Ex-Ante Gross Savings
Ex-Post Gross Savings
Ex-Post Net Savings
Net-to-Gross Realization Rate (Ex-Post Net/Ex-Post
Gross)Peak kW 3.00 (2.01) (3.85) 191.29%
kWh 3,713.00 (7,815.08) (12,434.87) 159.11%Therms - (7,815.08) (0.54) 0.01%

cclxxxiii
Building Overview Notes HVAC Measures only. 12.5-ton system not eligible, not included in measure calcs.

cclxxxiv
S19083 Climate Site: Ontario AP Climate Zone: 10 Conditioned Area: 5,013 Title 24 Bldg C&I Storage Sizing Ratio: 1.156
Building Parameters
Existing LPD EPD Cooling Cap sf/ton 0.46 0.14 264 Cooling EER Cooling Type Wall U-Value Roof U-Value 11.1 PSZ 0.639 0.050 Window U-Value Window SC % Window Area Skylight U-Value 1.474 0.770 1.0 1.603 Skylight SC % Skylight Area % Ltg Occup Ctrl % Ltg Daylight Ctrl 0.570 3.0 39.1 60.9
Title 24 Baseline LPD EPD Cooling Cap sf/ton 0.61 0.14 264 Cooling EER Cooling Type Wall U-Value Roof U-Value 11.1 PSZ 0.640 0.051 Window U-Value Window SC % Window Area Skylight U-Value 0.493 0.540 1.0 1.603 Skylight SC % Skylight Area % Ltg Occup Ctrl % Ltg Daylight Ctrl 0.710 3.0 0.0 0.0
Table 101 - Gross and Net Evaluated Savings
Ex-Ante Gross Savings
Ex-Post Gross Savings
Ex-Post Net Savings
Net-to-Gross Realization Rate (Ex-Post Net/Ex-Post
Gross)Peak kW 64.00 45.57 3.66 8.04%
kWh 300,590.00 173,136.44 17,729.06 10.24%Therms - 173,136.44 - 0.00%
cclxxxv
Building Overview Notes
. Data entry notes: -Year of occupancy/condition is 2007 -warehouse lights averaged out to get similar W/fixture. Higher kWh savings is likely due to difference in operating hours from our interview versus the assumed operating hours used by implementer in calculations.

cclxxxvi
S19088 Climate Site: Long Beach AP Climate Zone: 6 Conditioned Area: 132,557 Title 24 Bldg Retail and Wholesale Store Sizing Ratio: 0.699
Building Parameters
Existing LPD EPD Cooling Cap sf/ton 0.95 0.17 1418 Cooling EER Cooling Type Wall U-Value Roof U-Value 10.8 PSZ 0.051 0.038 Window U-Value Window SC % Window Area Skylight U-Value 0.777 0.880 1.1 0.000 Skylight SC % Skylight Area % Ltg Occup Ctrl % Ltg Daylight Ctrl 0.000 0.0 12.3 0.0
Title 24 Baseline LPD EPD Cooling Cap sf/ton 1.67 0.17 1353 Cooling EER Cooling Type Wall U-Value Roof U-Value 9.9 PSZ 0.689 0.075 Window U-Value Window SC % Window Area Skylight U-Value 0.839 0.700 1.1 1.867 Skylight SC % Skylight Area % Ltg Occup Ctrl % Ltg Daylight Ctrl 0.890 1.4 0.0 0.0
Table 102 - Gross and Net Evaluated Savings
Ex-Ante Gross Savings
Ex-Post Gross Savings
Ex-Post Net Savings
Net-to-Gross Realization Rate (Ex-Post Net/Ex-Post
Gross)Peak kW 136.00 28.84 (46.57) -161.48%
kWh 523,507.00 580,553.25 115,399.75 19.88%Therms - 580,553.25 (1.64) 0.00%

cclxxxvii
Building Overview Notes
Began to reoccupy in mid-June, 2006. Reopened June 29, 2006.

cclxxxviii
S19105 Climate Site: Lancaster Climate Zone: 14 Conditioned Area: 6,726 Title 24 Bldg Restaurant Sizing Ratio: 0.635
Building Parameters
Existing LPD EPD Cooling Cap sf/ton 1.00 10.20 143 Cooling EER Cooling Type Wall U-Value Roof U-Value 11.8 PVAV 0.101 0.038 Window U-Value Window SC % Window Area Skylight U-Value 0.749 0.380 9.5 0.000 Skylight SC % Skylight Area % Ltg Occup Ctrl % Ltg Daylight Ctrl 0.000 0.0 0.0 0.0
Title 24 Baseline LPD EPD Cooling Cap sf/ton 1.39 10.20 143 Cooling EER Cooling Type Wall U-Value Roof U-Value 9.7 PVAV 0.410 0.051 Window U-Value Window SC % Window Area Skylight U-Value 0.493 0.548 9.5 0.000 Skylight SC % Skylight Area % Ltg Occup Ctrl % Ltg Daylight Ctrl 0.000 0.0 0.0 0.0
Table 103 - Gross and Net Evaluated Savings
Ex-Ante Gross Savings
Ex-Post Gross Savings
Ex-Post Net Savings
Net-to-Gross Realization Rate (Ex-Post Net/Ex-Post
Gross)Peak kW 9.00 9.24 1.19 12.89%
kWh 26,260.00 16,336.91 3,446.00 21.09%Therms - 16,336.91 - 0.00%

cclxxxix
S19109 Climate Site: Redlands Climate Zone: 10 Conditioned Area: 3,980 Title 24 Bldg C&I Storage Sizing Ratio: 1.035
Building Parameters
Existing LPD EPD Cooling Cap sf/ton 0.44 0.59 265 Cooling EER Cooling Type Wall U-Value Roof U-Value 10.1 PSZ 0.649 0.051 Window U-Value Window SC % Window Area Skylight U-Value 1.409 0.720 2.2 1.204 Skylight SC % Skylight Area % Ltg Occup Ctrl % Ltg Daylight Ctrl 0.570 2.6 0.3 85.2
Title 24 Baseline LPD EPD Cooling Cap sf/ton 0.62 0.59 263 Cooling EER Cooling Type Wall U-Value Roof U-Value 10.1 PSZ 0.649 0.051 Window U-Value Window SC % Window Area Skylight U-Value 0.493 0.540 2.2 1.603 Skylight SC % Skylight Area % Ltg Occup Ctrl % Ltg Daylight Ctrl 0.710 2.6 0.0 0.0
Table 104 - Gross and Net Evaluated Savings
Ex-Ante Gross Savings
Ex-Post Gross Savings
Ex-Post Net Savings
Net-to-Gross Realization Rate (Ex-Post Net/Ex-Post
Gross)Peak kW 55.00 73.81 73.78 99.96%
kWh 227,698.00 204,440.88 204,214.23 99.89%Therms - 204,440.88 - 0.00%
ccxc
Building Overview Notes -3 extra 4x6 T8 fixtures added; 1 extra 4x3 T8 fixture added to match surveyed LPD -Plans indicate 4x3 T8 fixtures in offices; Surveyed lights were T5; chose T5 fixture code most closely matching planned T8 wattage of 93 (97 W fixture selected)

ccxci
S19111 Climate Site: Redlands Climate Zone: 10 Conditioned Area: 8,033 Title 24 Bldg C&I Storage Sizing Ratio: 1.067
Building Parameters
Existing LPD EPD Cooling Cap sf/ton 0.41 0.19 263 Cooling EER Cooling Type Wall U-Value Roof U-Value 11.0 PSZ 0.644 0.051 Window U-Value Window SC % Window Area Skylight U-Value 1.474 0.570 0.8 2.460 Skylight SC % Skylight Area % Ltg Occup Ctrl % Ltg Daylight Ctrl 0.570 2.4 0.0 58.6
Title 24 Baseline LPD EPD Cooling Cap sf/ton 0.61 0.19 255 Cooling EER Cooling Type Wall U-Value Roof U-Value 11.1 PSZ 0.649 0.051 Window U-Value Window SC % Window Area Skylight U-Value 0.493 0.605 0.8 1.603 Skylight SC % Skylight Area % Ltg Occup Ctrl % Ltg Daylight Ctrl 0.710 2.4 0.0 0.0
Table 105 - Gross and Net Evaluated Savings
Ex-Ante Gross Savings
Ex-Post Gross Savings
Ex-Post Net Savings
Net-to-Gross Realization Rate (Ex-Post Net/Ex-Post
Gross)Peak kW 175.00 273.82 244.39 89.25%
kWh 1,006,965.00 1,356,009.25 1,144,496.25 84.40%Therms - 1,356,009.25 - 0.00%
ccxcii
Building Overview Notes
-Realization Rate significantly reduced surveyed LPD -Lighting count done completely manually; plans were not made available until after the site visit at the building owner's (Prologis) headquaters

ccxciii
S19112 Climate Site: Norwalk Climate Zone: 8 Conditioned Area: 57,766 Title 24 Bldg Grocery Store Sizing Ratio: 1.684
Building Parameters
Existing LPD EPD Cooling Cap sf/ton 0.99 1.26 555 Cooling EER Cooling Type Wall U-Value Roof U-Value 14.5 MIXED 0.108 0.037 Window U-Value Window SC % Window Area Skylight U-Value 0.777 0.880 1.1 0.000 Skylight SC % Skylight Area % Ltg Occup Ctrl % Ltg Daylight Ctrl 0.000 0.0 0.0 0.0
Title 24 Baseline LPD EPD Cooling Cap sf/ton 1.57 1.26 558 Cooling EER Cooling Type Wall U-Value Roof U-Value 9.7 MIXED 0.108 0.037 Window U-Value Window SC % Window Area Skylight U-Value 0.777 0.880 1.1 1.875 Skylight SC % Skylight Area % Ltg Occup Ctrl % Ltg Daylight Ctrl 0.710 1.6 0.0 0.0
Table 106 - Gross and Net Evaluated Savings
Ex-Ante Gross Savings
Ex-Post Gross Savings
Ex-Post Net Savings
Net-to-Gross Realization Rate (Ex-Post Net/Ex-Post
Gross)Peak kW 32.00 16.96 (7.32) -43.15%
kWh 291,110.00 157,799.81 (5,747.13) -3.64%Therms (7,107.00) 157,799.81 (0.09) 0.00%

ccxciv
Building Overview Notes
Moved in during last two weeks of September, 2006.
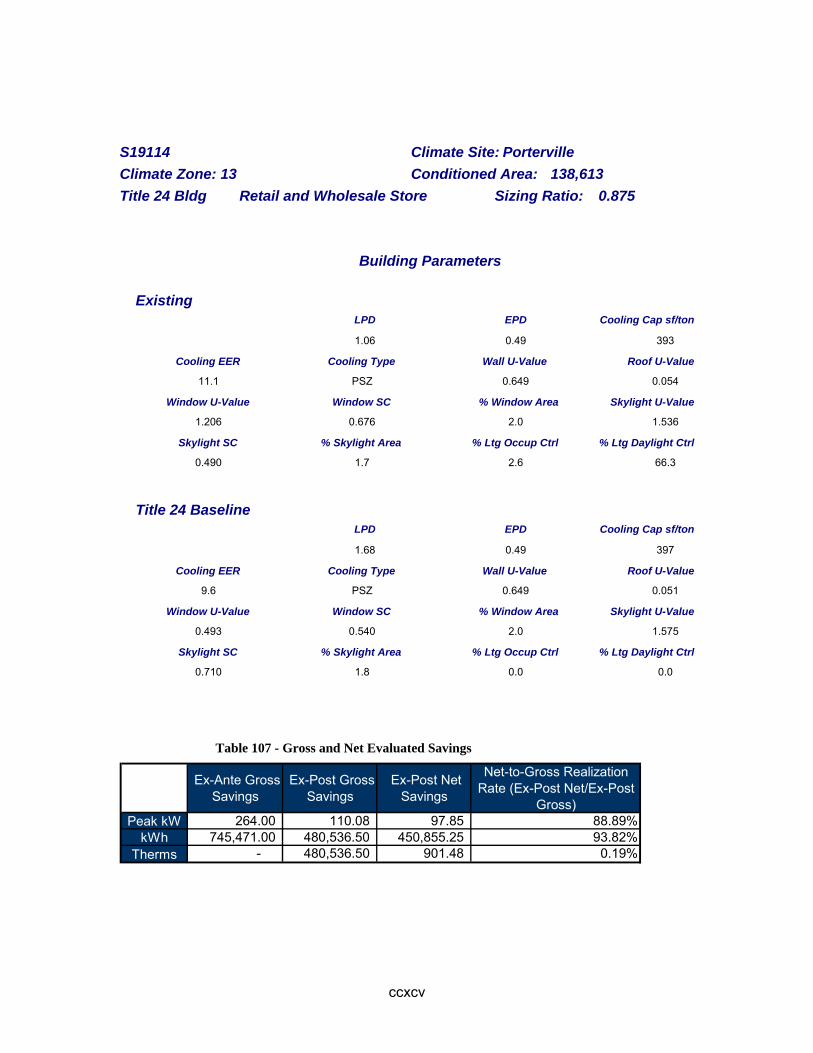
ccxcv
S19114 Climate Site: Porterville Climate Zone: 13 Conditioned Area: 138,613 Title 24 Bldg Retail and Wholesale Store Sizing Ratio: 0.875
Building Parameters
Existing LPD EPD Cooling Cap sf/ton 1.06 0.49 393 Cooling EER Cooling Type Wall U-Value Roof U-Value 11.1 PSZ 0.649 0.054 Window U-Value Window SC % Window Area Skylight U-Value 1.206 0.676 2.0 1.536 Skylight SC % Skylight Area % Ltg Occup Ctrl % Ltg Daylight Ctrl 0.490 1.7 2.6 66.3
Title 24 Baseline LPD EPD Cooling Cap sf/ton 1.68 0.49 397 Cooling EER Cooling Type Wall U-Value Roof U-Value 9.6 PSZ 0.649 0.051 Window U-Value Window SC % Window Area Skylight U-Value 0.493 0.540 2.0 1.575 Skylight SC % Skylight Area % Ltg Occup Ctrl % Ltg Daylight Ctrl 0.710 1.8 0.0 0.0
Table 107 - Gross and Net Evaluated Savings
Ex-Ante Gross Savings
Ex-Post Gross Savings
Ex-Post Net Savings
Net-to-Gross Realization Rate (Ex-Post Net/Ex-Post
Gross)Peak kW 264.00 110.08 97.85 88.89%
kWh 745,471.00 480,536.50 450,855.25 93.82%Therms - 480,536.50 901.48 0.19%

ccxcvi
Building Overview Notes Added .1108 W/sqft for display lighting (removed for savings change test) Lighting schedule unavailable (no plans) Lighting fixture wattages pulled from other survyed Lowe's in same region (Lowe's of Tulare)

ccxcvii
S19121 Climate Site: Apple Valley Climate Zone: 14 Conditioned Area: 135,854 Title 24 Bldg Retail and Wholesale Store Sizing Ratio: 0.893
Building Parameters
Existing LPD EPD Cooling Cap sf/ton 1.10 0.54 384 Cooling EER Cooling Type Wall U-Value Roof U-Value 11.1 PSZ 0.150 0.072 Window U-Value Window SC % Window Area Skylight U-Value 0.839 0.700 2.4 1.922 Skylight SC % Skylight Area % Ltg Occup Ctrl % Ltg Daylight Ctrl 0.890 2.5 2.7 63.3
Title 24 Baseline LPD EPD Cooling Cap sf/ton 1.68 0.54 394 Cooling EER Cooling Type Wall U-Value Roof U-Value 9.6 PSZ 0.408 0.051 Window U-Value Window SC % Window Area Skylight U-Value 0.493 0.530 2.4 1.588 Skylight SC % Skylight Area % Ltg Occup Ctrl % Ltg Daylight Ctrl 0.670 2.5 0.0 0.0
Table 108 - Gross and Net Evaluated Savings
Ex-Ante Gross Savings
Ex-Post Gross Savings
Ex-Post Net Savings
Net-to-Gross Realization Rate (Ex-Post Net/Ex-Post
Gross)Peak kW 223.00 130.65 113.03 86.51%
kWh 686,835.00 625,003.50 558,502.25 89.36%Therms (2,969.00) 625,003.50 91.84 0.01%

ccxcviii
S19125 Climate Site: West Covina Climate Zone: 9 Conditioned Area: 12,164 Title 24 Bldg Restaurant Sizing Ratio: 0.991
Building Parameters
Existing LPD EPD Cooling Cap sf/ton 1.18 3.10 184 Cooling EER Cooling Type Wall U-Value Roof U-Value 11.0 PSZ 0.110 0.121 Window U-Value Window SC % Window Area Skylight U-Value 0.777 0.570 15.0 0.000 Skylight SC % Skylight Area % Ltg Occup Ctrl % Ltg Daylight Ctrl 0.000 0.0 0.0 0.0
Title 24 Baseline LPD EPD Cooling Cap sf/ton 0.85 3.10 185 Cooling EER Cooling Type Wall U-Value Roof U-Value 10.4 PSZ 0.110 0.121 Window U-Value Window SC % Window Area Skylight U-Value 0.839 0.700 15.0 0.000 Skylight SC % Skylight Area % Ltg Occup Ctrl % Ltg Daylight Ctrl 0.000 0.0 0.0 0.0
Table 109 - Gross and Net Evaluated Savings
Ex-Ante Gross Savings
Ex-Post Gross Savings
Ex-Post Net Savings
Net-to-Gross Realization Rate (Ex-Post Net/Ex-Post
Gross)Peak kW 216.00 215.50 160.83 74.63%
kWh 321,721.00 358,696.56 265,814.35 74.11%Therms - 358,696.56 (0.00) 0.00%
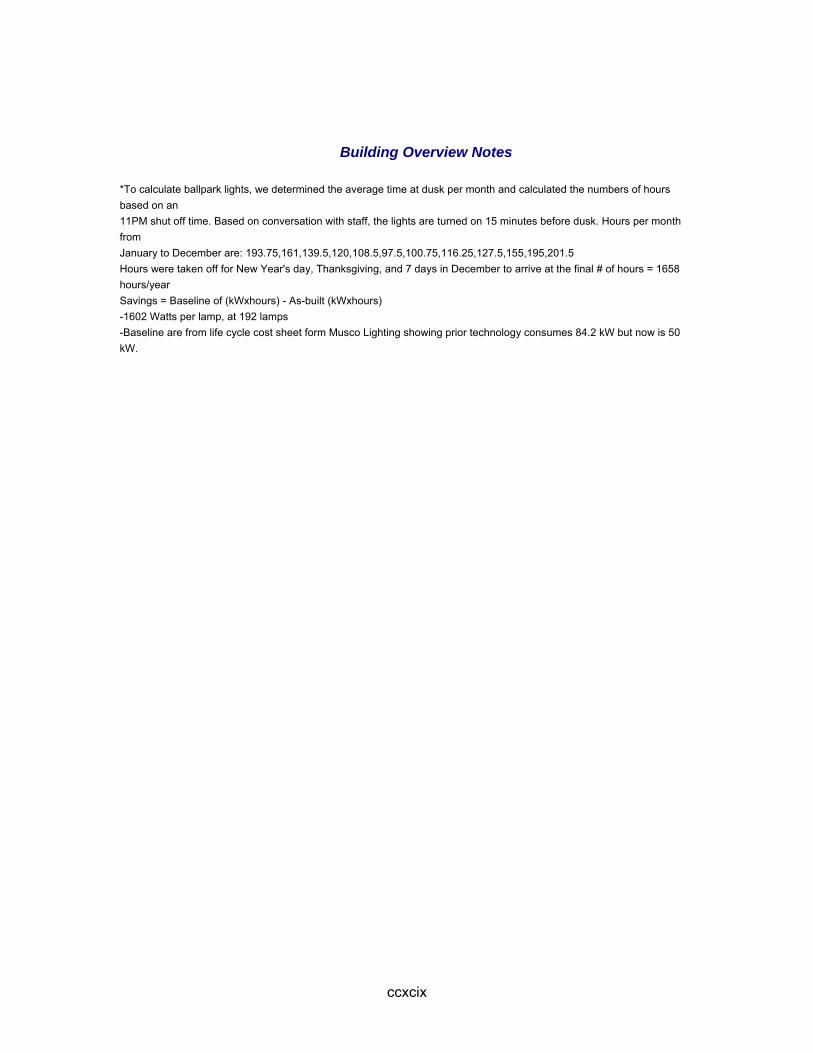
ccxcix
Building Overview Notes *To calculate ballpark lights, we determined the average time at dusk per month and calculated the numbers of hours based on an 11PM shut off time. Based on conversation with staff, the lights are turned on 15 minutes before dusk. Hours per month from January to December are: 193.75,161,139.5,120,108.5,97.5,100.75,116.25,127.5,155,195,201.5 Hours were taken off for New Year's day, Thanksgiving, and 7 days in December to arrive at the final # of hours = 1658 hours/year Savings = Baseline of (kWxhours) - As-built (kWxhours) -1602 Watts per lamp, at 192 lamps -Baseline are from life cycle cost sheet form Musco Lighting showing prior technology consumes 84.2 kW but now is 50 kW.

ccc
S19134 Climate Site: Upland Climate Zone: 10 Conditioned Area: 48,530 Title 24 Bldg Grocery Store Sizing Ratio: 1.053
Building Parameters
Existing LPD EPD Cooling Cap sf/ton 1.06 1.74 354 Cooling EER Cooling Type Wall U-Value Roof U-Value 10.7 PSZ 0.060 0.049 Window U-Value Window SC % Window Area Skylight U-Value 0.767 0.940 8.5 1.159 Skylight SC % Skylight Area % Ltg Occup Ctrl % Ltg Daylight Ctrl 0.490 2.3 0.5 9.4
Title 24 Baseline LPD EPD Cooling Cap sf/ton 1.48 1.74 355 Cooling EER Cooling Type Wall U-Value Roof U-Value 9.8 PSZ 0.430 0.051 Window U-Value Window SC % Window Area Skylight U-Value 0.493 0.540 8.5 1.590 Skylight SC % Skylight Area % Ltg Occup Ctrl % Ltg Daylight Ctrl 0.710 2.3 0.0 0.0
Table 110 - Gross and Net Evaluated Savings
Ex-Ante Gross Savings
Ex-Post Gross Savings
Ex-Post Net Savings
Net-to-Gross Realization Rate (Ex-Post Net/Ex-Post
Gross)Peak kW 33.00 54.47 46.69 85.73%
kWh 199,256.00 466,646.50 426,042.50 91.30%Therms (3,957.00) 466,646.50 2,135.20 0.46%

ccci
Building Overview Notes
Excessive refrigeration savings is because of the increased evaporative condensor efficiency over the base case air cooled condensor. Project did not capture this added efficiency in its EEM implementation. -Relative humidity setpoints are estimates. -Supply fan motor efficiency assumed at 86.5%. -Hood CFM reduced to 390 due to OA limit. Actual is 1800 CFM. Exhaust fan CFM reduced accordingly in other zones to make up for OA limits.

cccii
S19152 Climate Site: Visalia Climate Zone: 13 Conditioned Area: 148,947 Title 24 Bldg Grocery Store Sizing Ratio: 0.855
Building Parameters
Existing LPD EPD Cooling Cap sf/ton 1.50 1.55 403 Cooling EER Cooling Type Wall U-Value Roof U-Value 10.5 PSZ 0.180 0.046 Window U-Value Window SC % Window Area Skylight U-Value 0.000 0.000 0.0 0.705 Skylight SC % Skylight Area % Ltg Occup Ctrl % Ltg Daylight Ctrl 0.540 4.3 3.3 51.7
Title 24 Baseline LPD EPD Cooling Cap sf/ton 1.67 1.55 403 Cooling EER Cooling Type Wall U-Value Roof U-Value 9.6 PSZ 0.365 0.051 Window U-Value Window SC % Window Area Skylight U-Value 0.000 0.000 0.0 1.588 Skylight SC % Skylight Area % Ltg Occup Ctrl % Ltg Daylight Ctrl 0.710 4.3 0.0 0.0
Table 111 - Gross and Net Evaluated Savings
Ex-Ante Gross Savings
Ex-Post Gross Savings
Ex-Post Net Savings
Net-to-Gross Realization Rate (Ex-Post Net/Ex-Post
Gross)Peak kW 202.00 218.22 37.47 17.17%
kWh 780,261.00 851,847.00 227,831.00 26.75%Therms (7,899.00) 851,847.00 (19.27) 0.00%
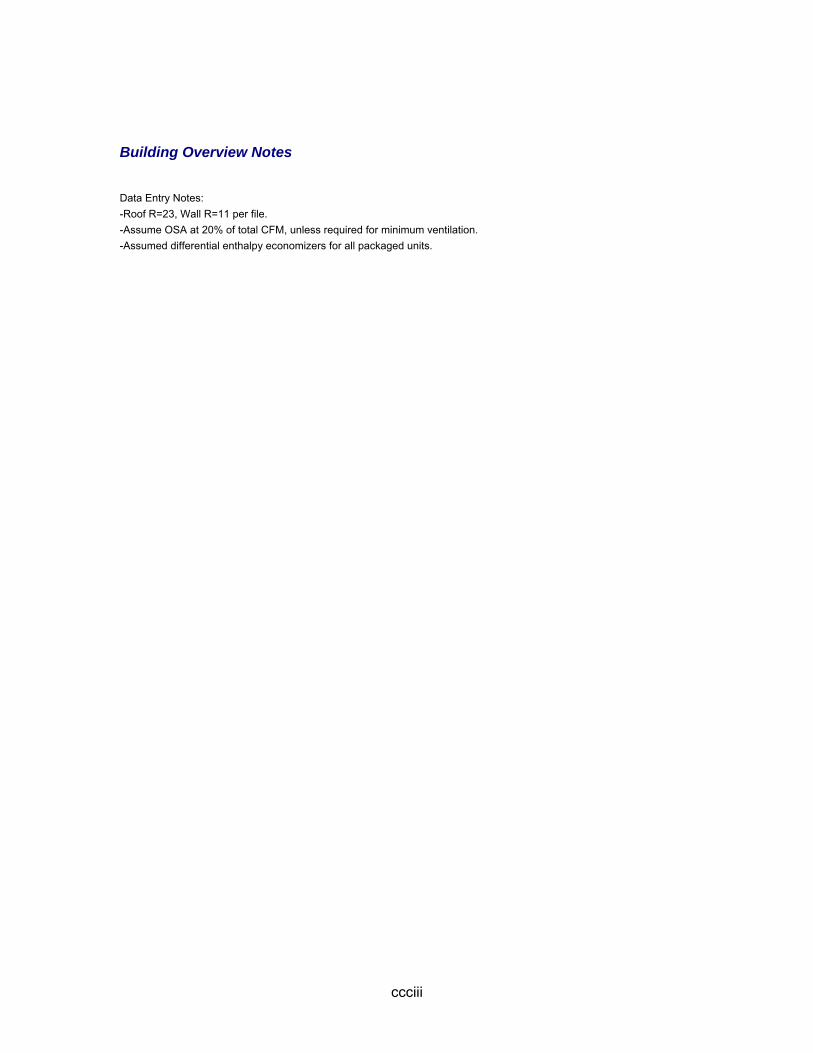
ccciii
Building Overview Notes
Data Entry Notes: -Roof R=23, Wall R=11 per file. -Assume OSA at 20% of total CFM, unless required for minimum ventilation. -Assumed differential enthalpy economizers for all packaged units.

ccciv
S19176 Climate Site: La Mirada Climate Zone: 9 Conditioned Area: 14,380 Title 24 Bldg Grocery Store Sizing Ratio: 1.063
Building Parameters
Existing LPD EPD Cooling Cap sf/ton 1.01 1.61 495 Cooling EER Cooling Type Wall U-Value Roof U-Value 12.0 MIXED 0.689 0.032 Window U-Value Window SC % Window Area Skylight U-Value 1.006 0.464 6.6 2.416 Skylight SC % Skylight Area % Ltg Occup Ctrl % Ltg Daylight Ctrl 0.790 2.6 0.0 0.0
Title 24 Baseline LPD EPD Cooling Cap sf/ton 1.44 1.61 498 Cooling EER Cooling Type Wall U-Value Roof U-Value 9.6 MIXED 0.689 0.075 Window U-Value Window SC % Window Area Skylight U-Value 0.839 0.700 6.6 1.902 Skylight SC % Skylight Area % Ltg Occup Ctrl % Ltg Daylight Ctrl 0.710 2.6 0.0 0.0
Table 112 - Gross and Net Evaluated Savings
Ex-Ante Gross Savings
Ex-Post Gross Savings
Ex-Post Net Savings
Net-to-Gross Realization Rate (Ex-Post Net/Ex-Post
Gross)Peak kW 27.00 17.25 17.75 102.89%
kWh 172,936.00 124,127.31 129,981.94 104.72%Therms 108.00 124,127.31 - 0.00%

cccv
Building Overview Notes Office and warehouse lights actually 4' T5 2-bulb fixtures (modelled differently to match wattage) -HVAC modeled as packaged units (actually tied in with the refrigeration system)

cccvi
S19186 Climate Site: Hemet Climate Zone: 10 Conditioned Area: 13,239 Title 24 Bldg C&I Storage Sizing Ratio: 0.564
Building Parameters
Existing LPD EPD Cooling Cap sf/ton 0.39 0.09 224 Cooling EER Cooling Type Wall U-Value Roof U-Value 10.7 PSZ 0.148 0.048 Window U-Value Window SC % Window Area Skylight U-Value 1.133 0.450 0.5 0.792 Skylight SC % Skylight Area % Ltg Occup Ctrl % Ltg Daylight Ctrl 0.620 2.4 34.3 65.7
Title 24 Baseline LPD EPD Cooling Cap sf/ton 0.60 0.09 208 Cooling EER Cooling Type Wall U-Value Roof U-Value 10.5 PSZ 0.649 0.051 Window U-Value Window SC % Window Area Skylight U-Value 0.493 0.605 0.5 1.603 Skylight SC % Skylight Area % Ltg Occup Ctrl % Ltg Daylight Ctrl 0.710 2.4 0.0 0.0
Table 113 - Gross and Net Evaluated Savings
Ex-Ante Gross Savings
Ex-Post Gross Savings
Ex-Post Net Savings
Net-to-Gross Realization Rate (Ex-Post Net/Ex-Post
Gross)Peak kW 383.00 192.96 315.95 163.74%
kWh 2,784,748.00 1,262,176.00 1,963,988.50 155.60%Therms - 1,262,176.00 - 0.00%
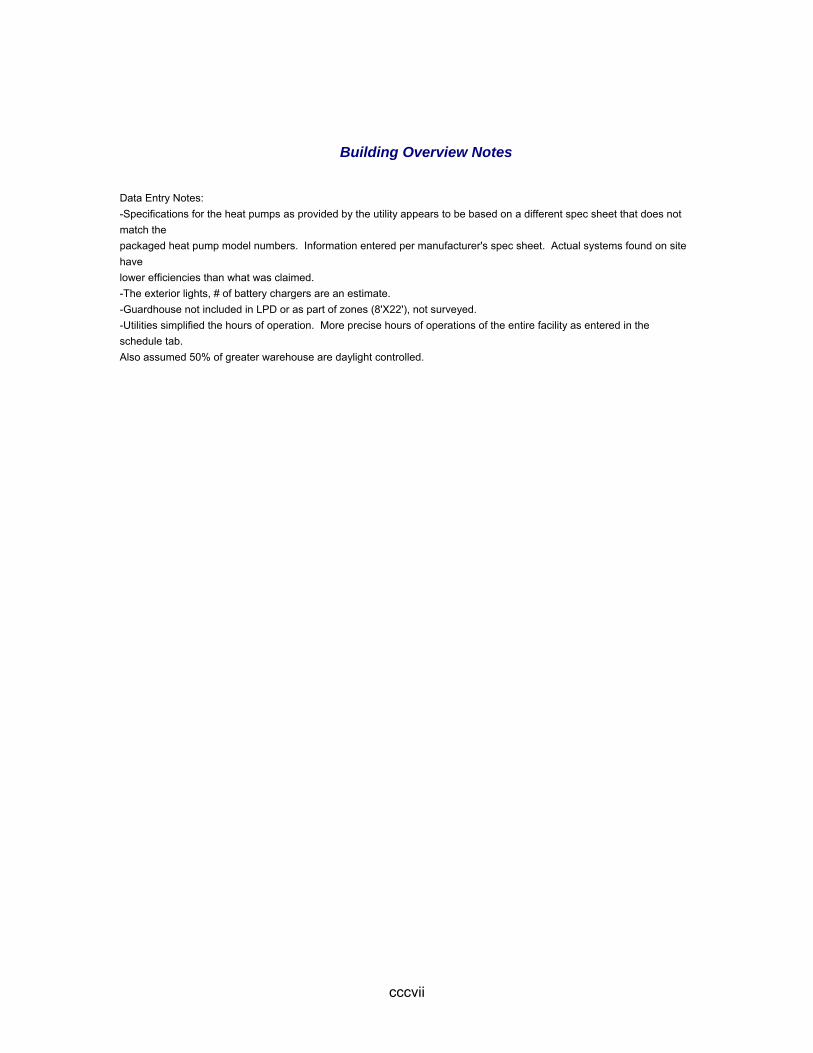
cccvii
Building Overview Notes
Data Entry Notes: -Specifications for the heat pumps as provided by the utility appears to be based on a different spec sheet that does not match the packaged heat pump model numbers. Information entered per manufacturer's spec sheet. Actual systems found on site have lower efficiencies than what was claimed. -The exterior lights, # of battery chargers are an estimate. -Guardhouse not included in LPD or as part of zones (8'X22'), not surveyed. -Utilities simplified the hours of operation. More precise hours of operations of the entire facility as entered in the schedule tab. Also assumed 50% of greater warehouse are daylight controlled.

cccviii
S19187 Climate Site: Riverside Exp Sta Climate Zone: 10 Conditioned Area: 15,473 Title 24 Bldg C&I Storage Sizing Ratio: 1.054
Building Parameters
Existing LPD EPD Cooling Cap sf/ton 0.45 0.49 348 Cooling EER Cooling Type Wall U-Value Roof U-Value 11.5 PSZ 0.649 0.051 Window U-Value Window SC % Window Area Skylight U-Value 1.409 0.720 2.3 1.204 Skylight SC % Skylight Area % Ltg Occup Ctrl % Ltg Daylight Ctrl 0.570 2.4 2.3 33.4
Title 24 Baseline LPD EPD Cooling Cap sf/ton 0.61 0.49 341 Cooling EER Cooling Type Wall U-Value Roof U-Value 11.4 PSZ 0.649 0.051 Window U-Value Window SC % Window Area Skylight U-Value 0.493 0.540 2.3 1.603 Skylight SC % Skylight Area % Ltg Occup Ctrl % Ltg Daylight Ctrl 0.710 2.4 0.0 0.0
Table 114 - Gross and Net Evaluated Savings
Ex-Ante Gross Savings
Ex-Post Gross Savings
Ex-Post Net Savings
Net-to-Gross Realization Rate (Ex-Post Net/Ex-Post
Gross)Peak kW 198.00 163.68 113.87 69.57%
kWh 499,068.00 475,453.38 311,811.00 65.58%Therms - 475,453.38 - 0.00%

cccix
Building Overview Notes -All lighting counts done manually -6 extra warehouse metal halide lights added to match surveyed LPD -Aside from main warehouse Metal Halide lighting, all lighting fixture types are estimates based on visual inspection on site. No plans were available for fixture verification. (Only warehouse lighting incented)

cccx
S19189 Climate Site: Redlands Climate Zone: 10 Conditioned Area: 4,400 Title 24 Bldg C&I Storage Sizing Ratio: 1.143
Building Parameters
Existing LPD EPD Cooling Cap sf/ton 0.39 0.00 880 Cooling EER Cooling Type Wall U-Value Roof U-Value 11.3 PSZ 0.649 0.054 Window U-Value Window SC % Window Area Skylight U-Value 1.409 0.940 0.0 0.000 Skylight SC % Skylight Area % Ltg Occup Ctrl % Ltg Daylight Ctrl 0.000 0.0 0.0 0.0
Title 24 Baseline LPD EPD Cooling Cap sf/ton 0.60 0.00 880 Cooling EER Cooling Type Wall U-Value Roof U-Value 11.3 PSZ 0.649 0.054 Window U-Value Window SC % Window Area Skylight U-Value 1.409 0.940 0.0 0.000 Skylight SC % Skylight Area % Ltg Occup Ctrl % Ltg Daylight Ctrl 0.000 0.0 0.0 0.0
Table 115 - Gross and Net Evaluated Savings
Ex-Ante Gross Savings
Ex-Post Gross Savings
Ex-Post Net Savings
Net-to-Gross Realization Rate (Ex-Post Net/Ex-Post
Gross)Peak kW 87.00 112.19 112.19 100.00%
kWh 683,476.00 612,694.75 612,694.75 100.00%Therms - 612,694.75 - 0.00%

cccxi
Building Overview Notes The lower than expected kWh realization rate is due to the operation of the lights. Per conversation with multiple personnel and as observed on site, the facility manually shuts off lights from around 8:30AM to 6 PM to take advantage of the existing sky lighting. Since there are no sensors installed in conjunction with this, no credit was given and only savings from the improved LPD are shown here.
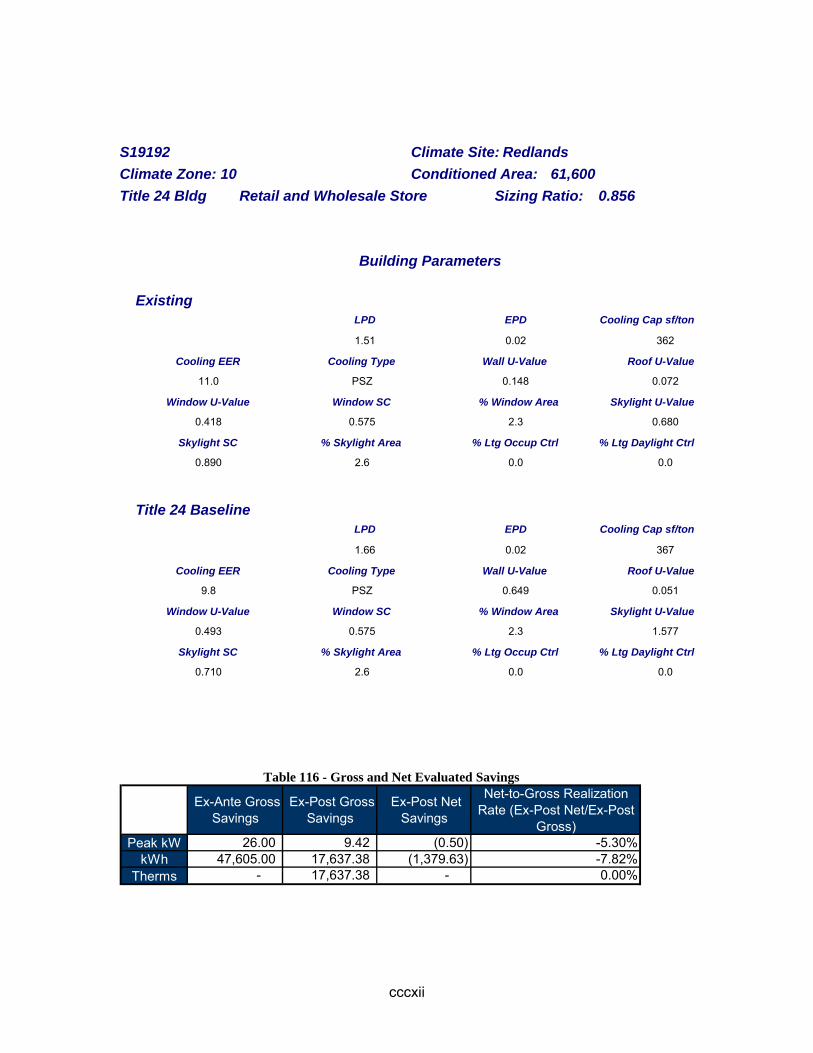
cccxii
S19192 Climate Site: Redlands Climate Zone: 10 Conditioned Area: 61,600 Title 24 Bldg Retail and Wholesale Store Sizing Ratio: 0.856
Building Parameters
Existing LPD EPD Cooling Cap sf/ton 1.51 0.02 362 Cooling EER Cooling Type Wall U-Value Roof U-Value 11.0 PSZ 0.148 0.072 Window U-Value Window SC % Window Area Skylight U-Value 0.418 0.575 2.3 0.680 Skylight SC % Skylight Area % Ltg Occup Ctrl % Ltg Daylight Ctrl 0.890 2.6 0.0 0.0
Title 24 Baseline LPD EPD Cooling Cap sf/ton 1.66 0.02 367 Cooling EER Cooling Type Wall U-Value Roof U-Value 9.8 PSZ 0.649 0.051 Window U-Value Window SC % Window Area Skylight U-Value 0.493 0.575 2.3 1.577 Skylight SC % Skylight Area % Ltg Occup Ctrl % Ltg Daylight Ctrl 0.710 2.6 0.0 0.0
Table 116 - Gross and Net Evaluated Savings
Ex-Ante Gross Savings
Ex-Post Gross Savings
Ex-Post Net Savings
Net-to-Gross Realization Rate (Ex-Post Net/Ex-Post
Gross)Peak kW 26.00 9.42 (0.50) -5.30%
kWh 47,605.00 17,637.38 (1,379.63) -7.82%Therms - 17,637.38 - 0.00%

cccxiii
S20021 Climate Site: Upland Climate Zone: 10 Conditioned Area: 9,502 Title 24 Bldg Grocery Store Sizing Ratio: 1.545
Building Parameters
Existing LPD EPD Cooling Cap sf/ton 1.70 3.50 339 Cooling EER Cooling Type Wall U-Value Roof U-Value 16.0 PVAV 0.649 0.032 Window U-Value Window SC % Window Area Skylight U-Value 0.777 0.570 25.2 0.000 Skylight SC % Skylight Area % Ltg Occup Ctrl % Ltg Daylight Ctrl 0.000 0.0 15.9 0.0
Title 24 Baseline LPD EPD Cooling Cap sf/ton 1.59 3.50 339 Cooling EER Cooling Type Wall U-Value Roof U-Value 11.0 PVAV 0.649 0.051 Window U-Value Window SC % Window Area Skylight U-Value 0.493 0.360 25.2 0.000 Skylight SC % Skylight Area % Ltg Occup Ctrl % Ltg Daylight Ctrl 0.000 0.0 0.0 0.0
Table 117 - Gross and Net Evaluated Savings
Ex-Ante Gross Savings
Ex-Post Gross Savings
Ex-Post Net Savings
Net-to-Gross Realization Rate (Ex-Post Net/Ex-Post
Gross)Peak kW 27.00 28.41 27.48 96.70%
kWh 172,457.00 224,469.06 214,306.44 95.47%Therms (713.00) 224,469.06 0.00 0.00%
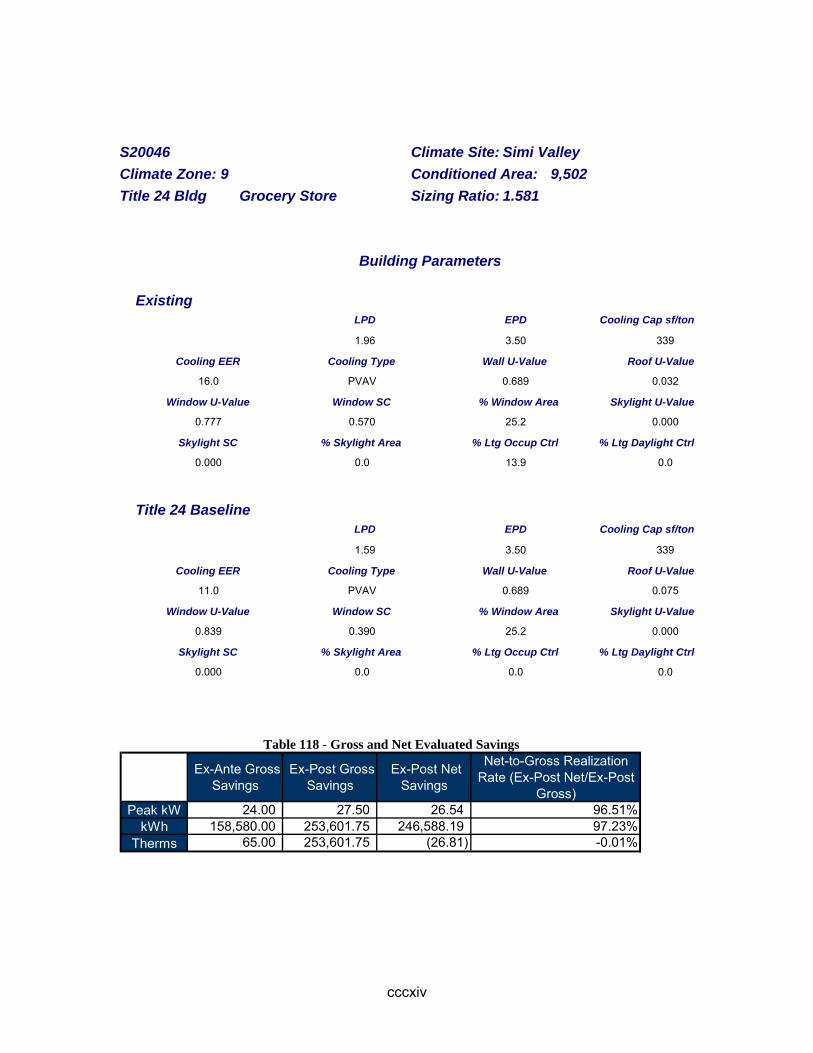
cccxiv
S20046 Climate Site: Simi Valley Climate Zone: 9 Conditioned Area: 9,502 Title 24 Bldg Grocery Store Sizing Ratio: 1.581
Building Parameters
Existing LPD EPD Cooling Cap sf/ton 1.96 3.50 339 Cooling EER Cooling Type Wall U-Value Roof U-Value 16.0 PVAV 0.689 0.032 Window U-Value Window SC % Window Area Skylight U-Value 0.777 0.570 25.2 0.000 Skylight SC % Skylight Area % Ltg Occup Ctrl % Ltg Daylight Ctrl 0.000 0.0 13.9 0.0
Title 24 Baseline LPD EPD Cooling Cap sf/ton 1.59 3.50 339 Cooling EER Cooling Type Wall U-Value Roof U-Value 11.0 PVAV 0.689 0.075 Window U-Value Window SC % Window Area Skylight U-Value 0.839 0.390 25.2 0.000 Skylight SC % Skylight Area % Ltg Occup Ctrl % Ltg Daylight Ctrl 0.000 0.0 0.0 0.0
Table 118 - Gross and Net Evaluated Savings
Ex-Ante Gross Savings
Ex-Post Gross Savings
Ex-Post Net Savings
Net-to-Gross Realization Rate (Ex-Post Net/Ex-Post
Gross)Peak kW 24.00 27.50 26.54 96.51%
kWh 158,580.00 253,601.75 246,588.19 97.23%Therms 65.00 253,601.75 (26.81) -0.01%
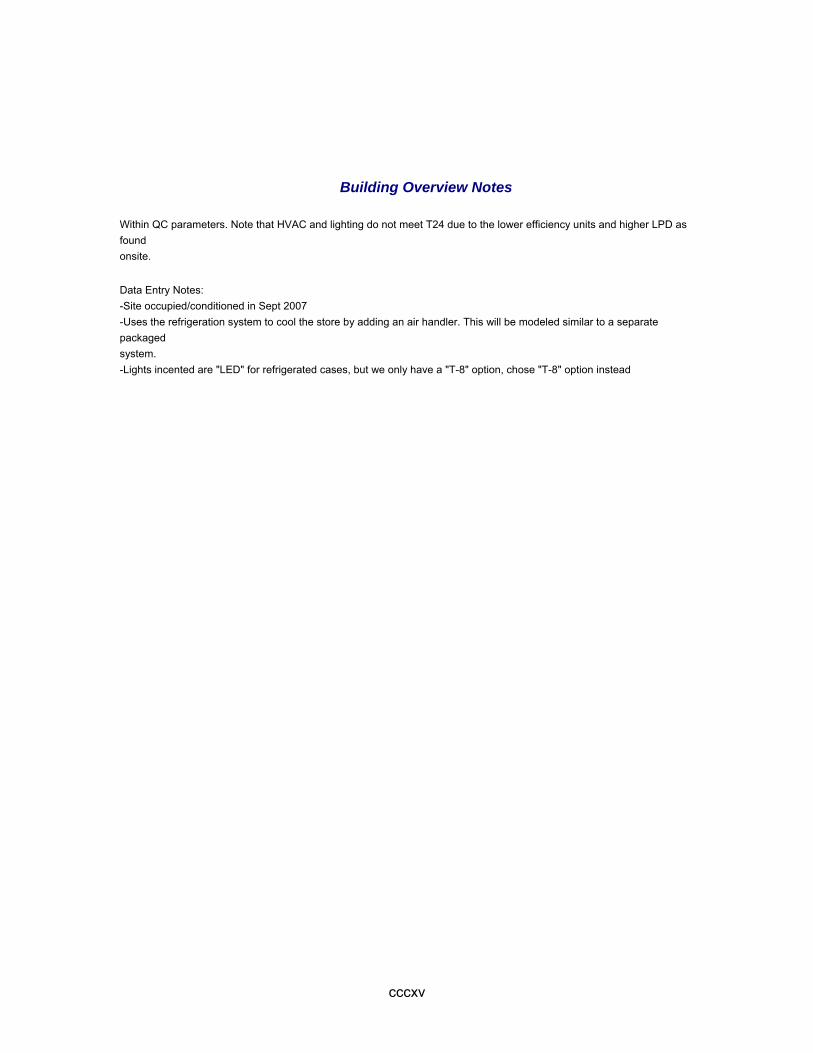
cccxv
Building Overview Notes Within QC parameters. Note that HVAC and lighting do not meet T24 due to the lower efficiency units and higher LPD as found onsite. Data Entry Notes: -Site occupied/conditioned in Sept 2007 -Uses the refrigeration system to cool the store by adding an air handler. This will be modeled similar to a separate packaged system. -Lights incented are "LED" for refrigerated cases, but we only have a "T-8" option, chose "T-8" option instead

cccxvi
Appendix N. Public Comments and Responses to Draft
Evaluation Report
The following document is a compilation of the comments and questions raised by the four
investor‐owned utilities in response to the draft report posted December 2, 2009. At the close of
the public comment period, KEMA addressed each of the comments; the responses are
provided here.

cccxvii
Reference Source Subject: Section/ Page
Type (Question or Comment)
Comment or Question and Response
1 PGE Annual Gross Savings
3.4.1 / p.48
Question 1
Tables show dramatically larger error bounds for PG&E results than for those of other utilities. Please explain the basis for this. It is related to the small sample sizes and late schedule for review of PG&E programs?
Response 1
The error bounds are a measure of the variability between the evaluated savings of each site from the realization rate for the utility. The high error bound means that there was a large amount of variability by site from the realization rate. For net savings this would be caused by responses to the free�ridership survey. The more variable the responses, the larger the error bound. For example, if every site had an 80% free�ridership the error bound would be lower than if the average free�ridership was 80% but sites varied from 0% to 100%.
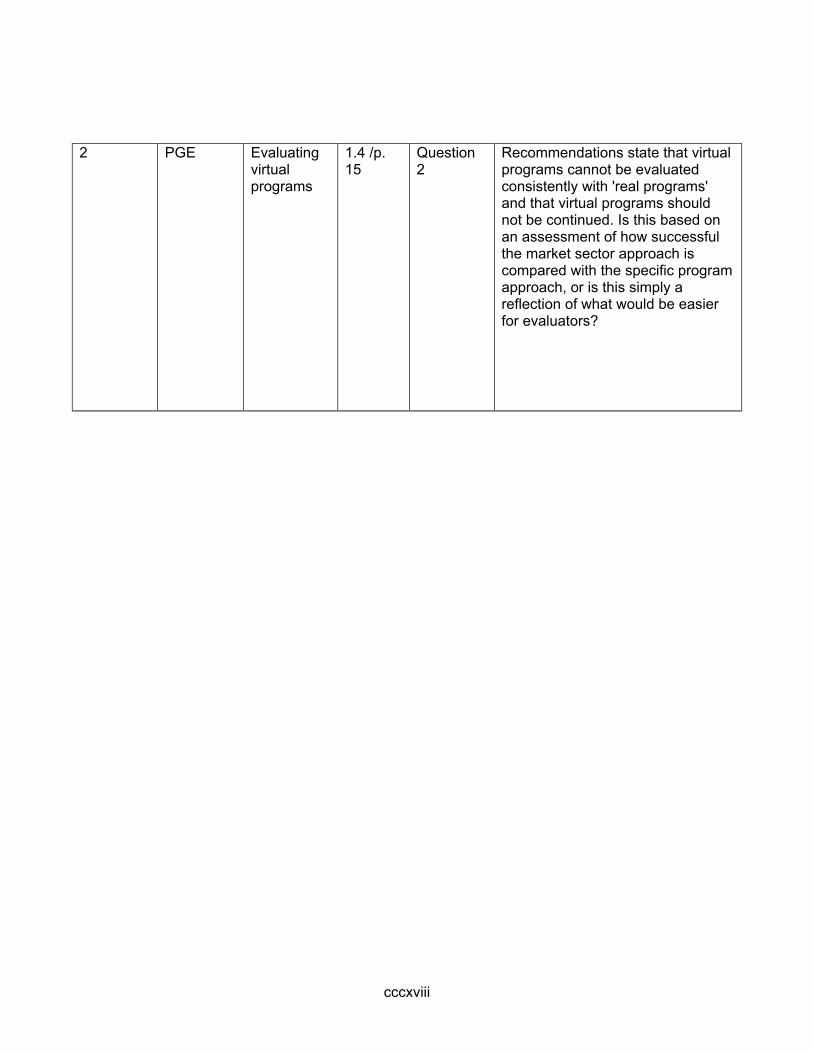
cccxviii
2 PGE Evaluating virtual programs
1.4 /p. 15
Question 2
Recommendations state that virtual programs cannot be evaluated consistently with 'real programs' and that virtual programs should not be continued. Is this based on an assessment of how successful the market sector approach is compared with the specific program approach, or is this simply a reflection of what would be easier for evaluators?

cccxix
Response 2 We evaluated the state�wide SBD program; we did not evaluate PG&E's market sector approach and cannot comment on that approach as compared to the SBD program as implemented by the other Utilities. The statement refers to the anyone’s ability to actually evaluate the program and to the tracking of “program” data, not simply the ease of evaluation, of the program.
3 PGE Evaluation objectives
2.1 / p.17
Question 3 In the third bullet, concerning development of impact estimates for each utility, are you referring to gross, net, or both?
Response 3 The report has been updated to specify that we are referring to both gross and net savings.
4 PGE Gas sample design
3.4.3, p 53
Question 4 In order to get reasonable sampling for estimating gas savings, one would need a separate stratification and sample for sites having large gas savings. Current sampling is driven by electricity savings. Do you agree that a separate gas sample should be done? Should this be a recommendation for future studies?
Response 4 We updated the report to say: The gas IOUs’ tracking savings estimates have little correlation to the evaluated gas savings, especially in the case of the building simulation models. This result is similar to the gas savings finding in the previous SBD evaluation. As a result of this lack of correlation, a weighted
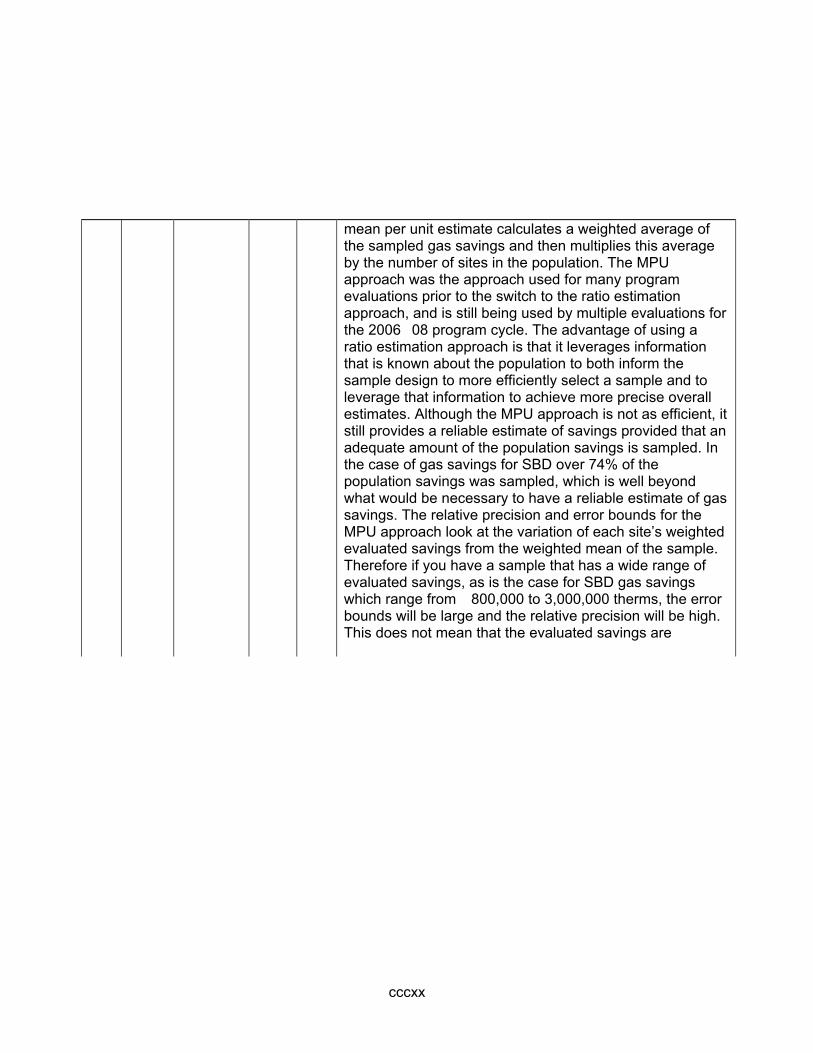
cccxx
mean per unit estimate calculates a weighted average of the sampled gas savings and then multiplies this average by the number of sites in the population. The MPU approach was the approach used for many program evaluations prior to the switch to the ratio estimation approach, and is still being used by multiple evaluations for the 2006�08 program cycle. The advantage of using a ratio estimation approach is that it leverages information that is known about the population to both inform the sample design to more efficiently select a sample and to leverage that information to achieve more precise overall estimates. Although the MPU approach is not as efficient, it still provides a reliable estimate of savings provided that an adequate amount of the population savings is sampled. In the case of gas savings for SBD over 74% of the population savings was sampled, which is well beyond what would be necessary to have a reliable estimate of gas savings. The relative precision and error bounds for the MPU approach look at the variation of each site’s weighted evaluated savings from the weighted mean of the sample. Therefore if you have a sample that has a wide range of evaluated savings, as is the case for SBD gas savings which range from �800,000 to 3,000,000 therms, the error bounds will be large and the relative precision will be high. This does not mean that the evaluated savings are
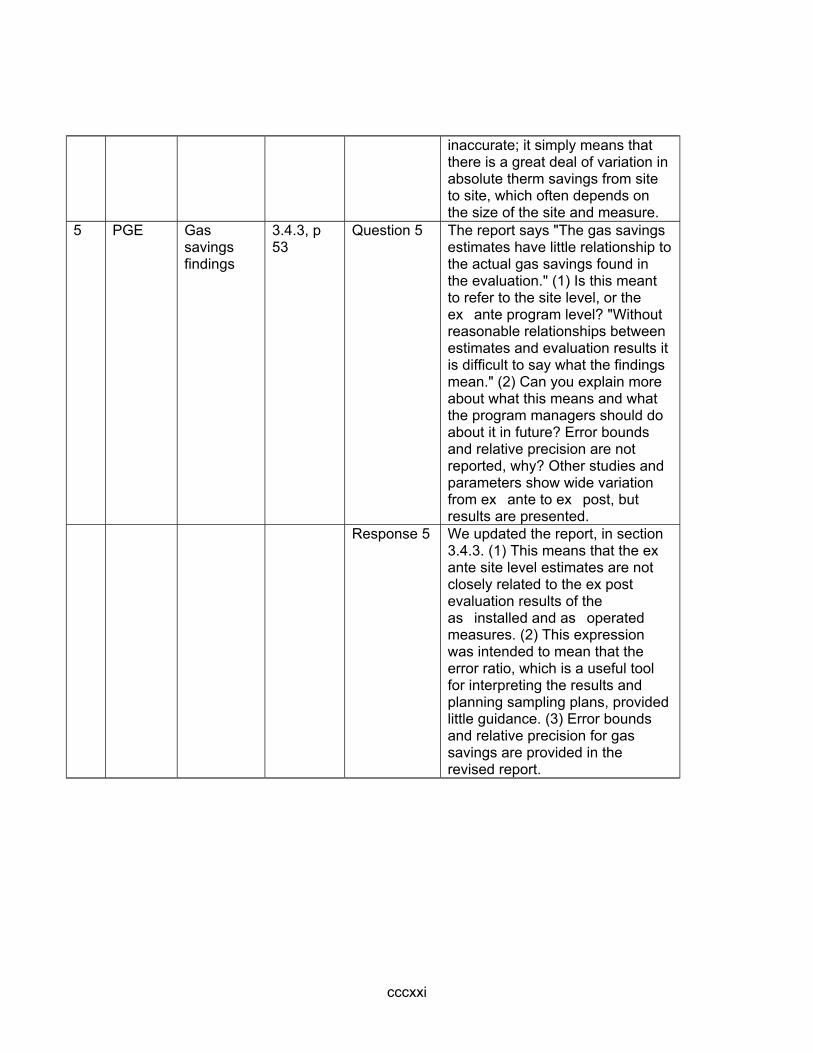
cccxxi
inaccurate; it simply means that there is a great deal of variation in absolute therm savings from site to site, which often depends on the size of the site and measure.
5 PGE Gas savings findings
3.4.3, p 53
Question 5 The report says "The gas savings estimates have little relationship to the actual gas savings found in the evaluation." (1) Is this meant to refer to the site level, or the ex�ante program level? "Without reasonable relationships between estimates and evaluation results it is difficult to say what the findings mean." (2) Can you explain more about what this means and what the program managers should do about it in future? Error bounds and relative precision are not reported, why? Other studies and parameters show wide variation from ex�ante to ex�post, but results are presented.
Response 5 We updated the report, in section 3.4.3. (1) This means that the ex ante site level estimates are not closely related to the ex post evaluation results of the as�installed and as�operated measures. (2) This expression was intended to mean that the error ratio, which is a useful tool for interpreting the results and planning sampling plans, provided little guidance. (3) Error bounds and relative precision for gas savings are provided in the revised report.
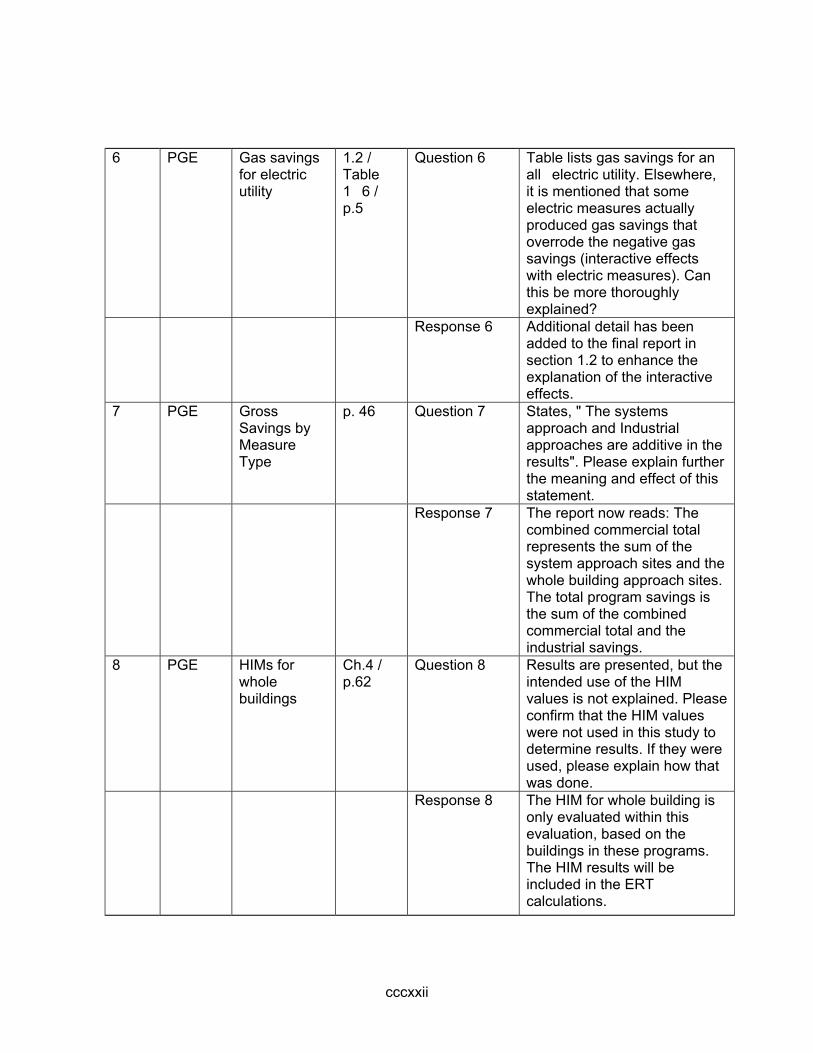
cccxxii
6 PGE Gas savings for electric utility
1.2 / Table 1�6 / p.5
Question 6 Table lists gas savings for an all�electric utility. Elsewhere, it is mentioned that some electric measures actually produced gas savings that overrode the negative gas savings (interactive effects with electric measures). Can this be more thoroughly explained?
Response 6 Additional detail has been added to the final report in section 1.2 to enhance the explanation of the interactive effects.
7 PGE Gross Savings by Measure Type
p. 46 Question 7 States, " The systems approach and Industrial approaches are additive in the results". Please explain further the meaning and effect of this statement.
Response 7 The report now reads: The combined commercial total represents the sum of the system approach sites and the whole building approach sites. The total program savings is the sum of the combined commercial total and the industrial savings.
8 PGE HIMs for whole buildings
Ch.4 / p.62
Question 8 Results are presented, but the intended use of the HIM values is not explained. Please confirm that the HIM values were not used in this study to determine results. If they were used, please explain how that was done.
Response 8 The HIM for whole building is only evaluated within this evaluation, based on the buildings in these programs. The HIM results will be included in the ERT calculations.
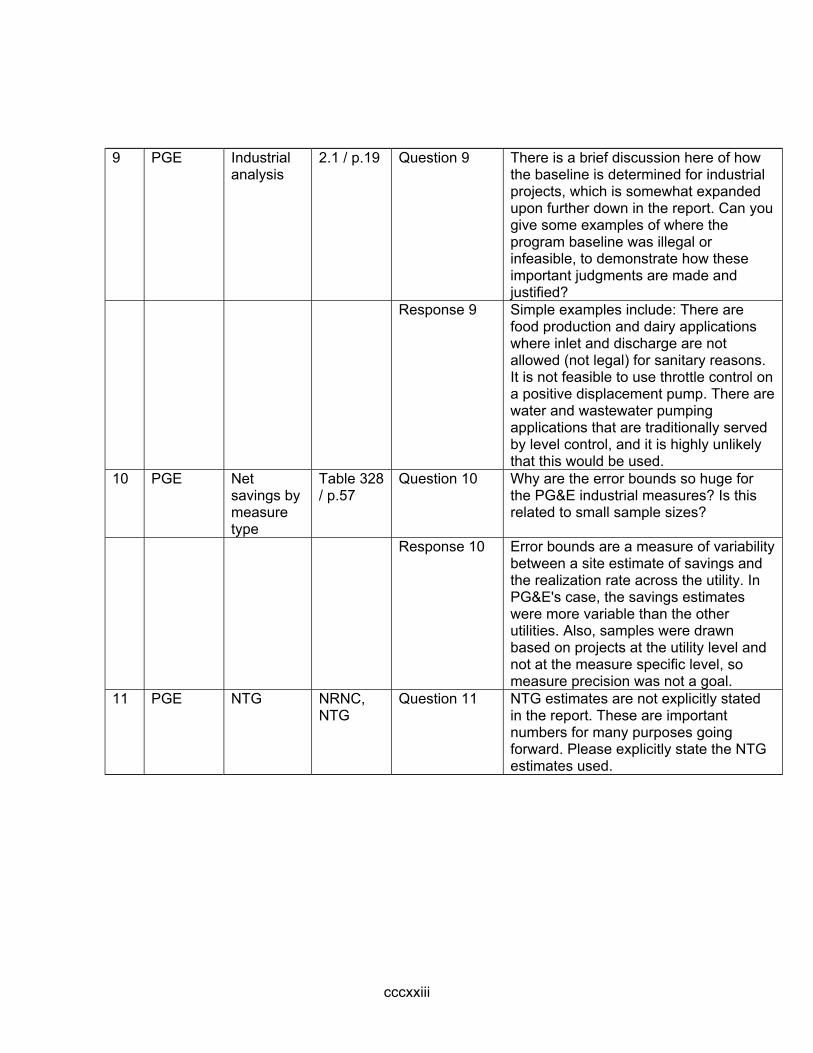
cccxxiii
9 PGE Industrial analysis
2.1 / p.19 Question 9 There is a brief discussion here of how the baseline is determined for industrial projects, which is somewhat expanded upon further down in the report. Can you give some examples of where the program baseline was illegal or infeasible, to demonstrate how these important judgments are made and justified?
Response 9 Simple examples include: There are food production and dairy applications where inlet and discharge are not allowed (not legal) for sanitary reasons. It is not feasible to use throttle control on a positive displacement pump. There are water and wastewater pumping applications that are traditionally served by level control, and it is highly unlikely that this would be used.
10 PGE Net savings by measure type
Table 328 / p.57
Question 10 Why are the error bounds so huge for the PG&E industrial measures? Is this related to small sample sizes?
Response 10 Error bounds are a measure of variability between a site estimate of savings and the realization rate across the utility. In PG&E's case, the savings estimates were more variable than the other utilities. Also, samples were drawn based on projects at the utility level and not at the measure specific level, so measure precision was not a goal.
11 PGE NTG NRNC, NTG
Question 11 NTG estimates are not explicitly stated in the report. These are important numbers for many purposes going forward. Please explicitly state the NTG estimates used.
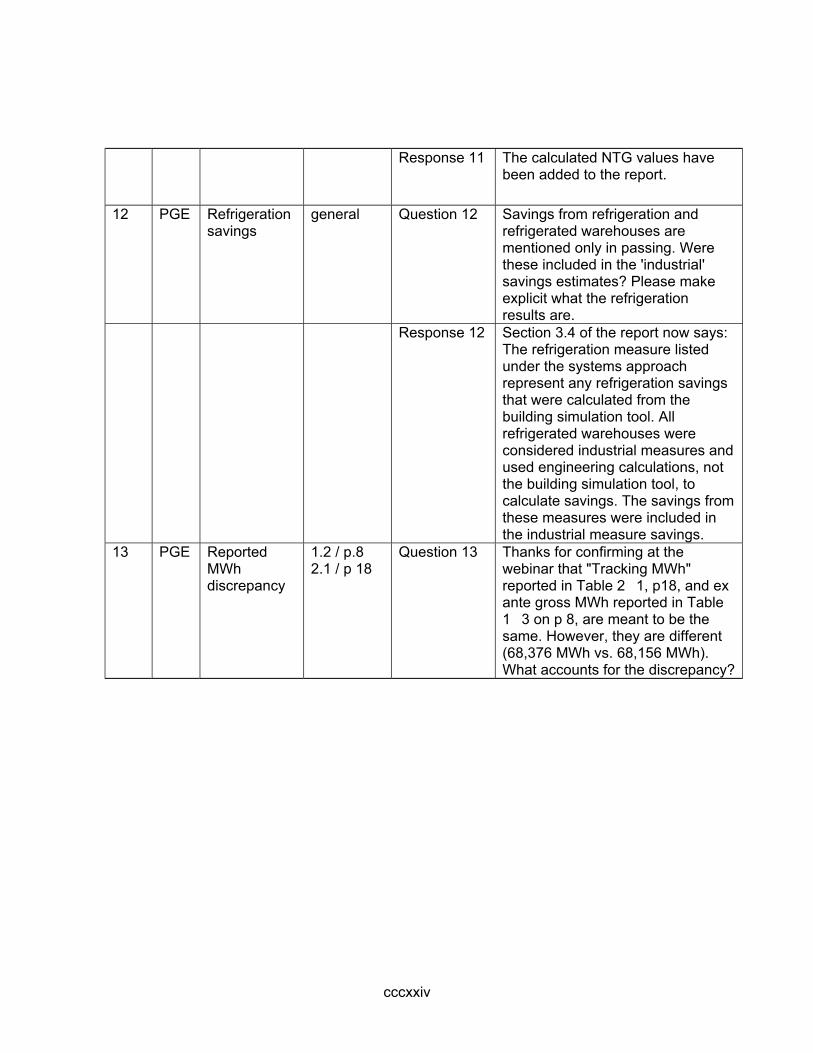
cccxxiv
Response 11 The calculated NTG values have been added to the report.
12 PGE Refrigeration savings
general Question 12 Savings from refrigeration and refrigerated warehouses are mentioned only in passing. Were these included in the 'industrial' savings estimates? Please make explicit what the refrigeration results are.
Response 12 Section 3.4 of the report now says: The refrigeration measure listed under the systems approach represent any refrigeration savings that were calculated from the building simulation tool. All refrigerated warehouses were considered industrial measures and used engineering calculations, not the building simulation tool, to calculate savings. The savings from these measures were included in the industrial measure savings.
13 PGE Reported MWh discrepancy
1.2 / p.8 2.1 / p 18
Question 13 Thanks for confirming at the webinar that "Tracking MWh" reported in Table 2�1, p18, and ex ante gross MWh reported in Table 1�3 on p 8, are meant to be the same. However, they are different (68,376 MWh vs. 68,156 MWh). What accounts for the discrepancy?
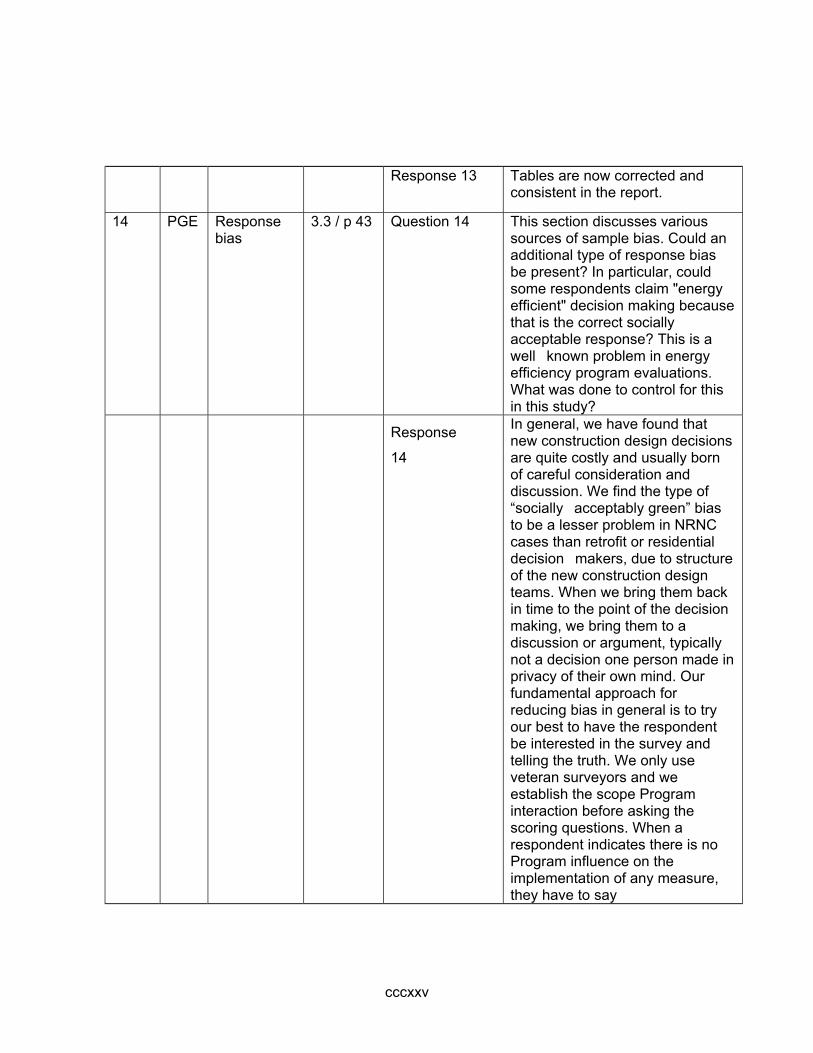
cccxxv
Response 13 Tables are now corrected and
consistent in the report.
14 PGE Response bias
3.3 / p 43 Question 14 This section discusses various sources of sample bias. Could an additional type of response bias be present? In particular, could some respondents claim "energy efficient" decision making because that is the correct socially acceptable response? This is a well�known problem in energy efficiency program evaluations. What was done to control for this in this study?
Response In general, we have found that new construction design decisions
14 are quite costly and usually born of careful consideration and discussion. We find the type of “socially�acceptably green” bias to be a lesser problem in NRNC cases than retrofit or residential decision�makers, due to structure of the new construction design teams. When we bring them back in time to the point of the decision making, we bring them to a discussion or argument, typically not a decision one person made in privacy of their own mind. Our fundamental approach for reducing bias in general is to try our best to have the respondent be interested in the survey and telling the truth. We only use veteran surveyors and we establish the scope Program interaction before asking the scoring questions. When a respondent indicates there is no Program influence on the implementation of any measure, they have to say

cccxxvi
it twice. When they are asked what would have occurred in the absence of Program interaction, they first must give a consistent answer and they have to explain their answer. A simple “we would have done it anyway” does not suffice. We probe until we are satisfied with their answer as to why they would have done it anyway. If we have established that the project received timely design assistance and/or design analysis, we ask them to confirm that these efforts had no bearing on the implementation. This is especially true if they rated Program components as valuable.
15 PGE Sample design
2.1 / p.17 Question 15 States that the sample was drawn before you could determine which sites were industrial or whole building. Then, as sampling discussion continues, this problem ripples through the entire evaluation process. How do you know that this sampling approach does not disadvantage either industrial or whole building sites? Later on (p. 19), you explain that the industrial and whole building results were expanded up to the population. How could you develop sample weights, if you can't identify which are which in the population?
Response Updated report (section 2.1) to explain that samples were drawn
15 and weights were calculated by utility and project and not by measure or type of project. The "by measure" and the commercial versus industrial results tables are just to provide some additional information but the sample design was
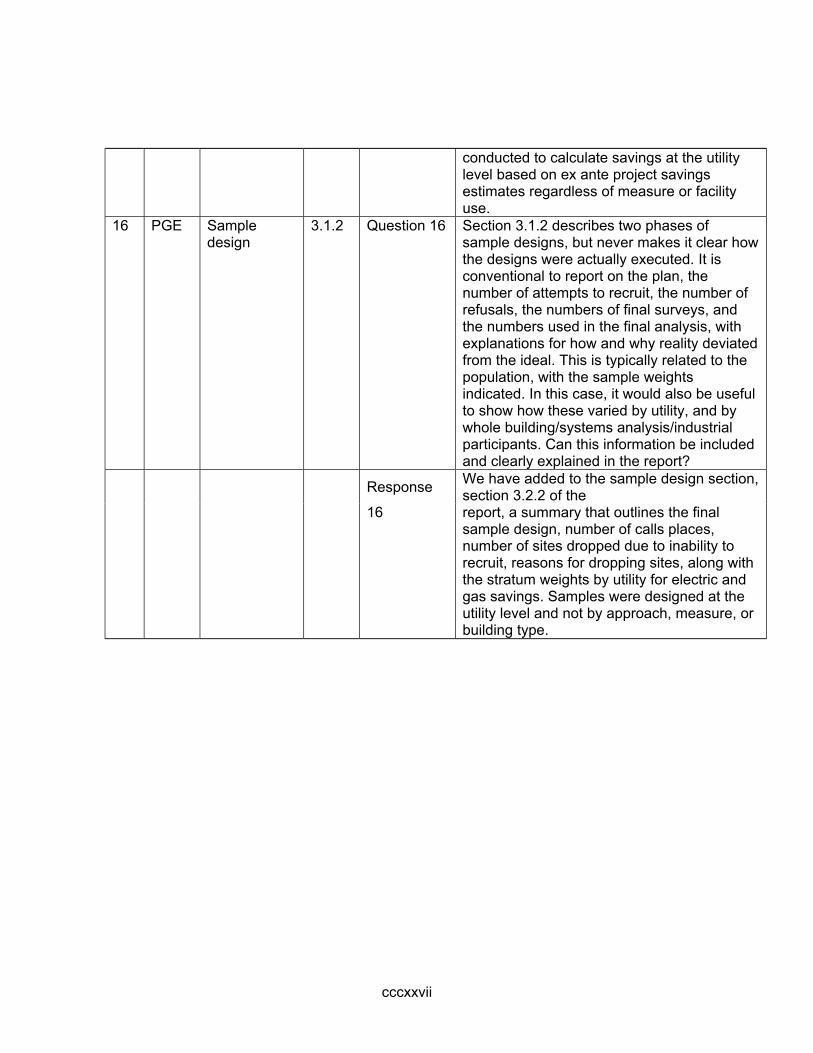
cccxxvii
conducted to calculate savings at the utility level based on ex ante project savings estimates regardless of measure or facility use.
16 PGE Sample design
3.1.2 Question 16 Section 3.1.2 describes two phases of sample designs, but never makes it clear how the designs were actually executed. It is conventional to report on the plan, the number of attempts to recruit, the number of refusals, the numbers of final surveys, and the numbers used in the final analysis, with explanations for how and why reality deviated from the ideal. This is typically related to the population, with the sample weights indicated. In this case, it would also be useful to show how these varied by utility, and by whole building/systems analysis/industrial participants. Can this information be included and clearly explained in the report?
Response We have added to the sample design section, section 3.2.2 of the
16 report, a summary that outlines the final sample design, number of calls places, number of sites dropped due to inability to recruit, reasons for dropping sites, along with the stratum weights by utility for electric and gas savings. Samples were designed at the utility level and not by approach, measure, or building type.
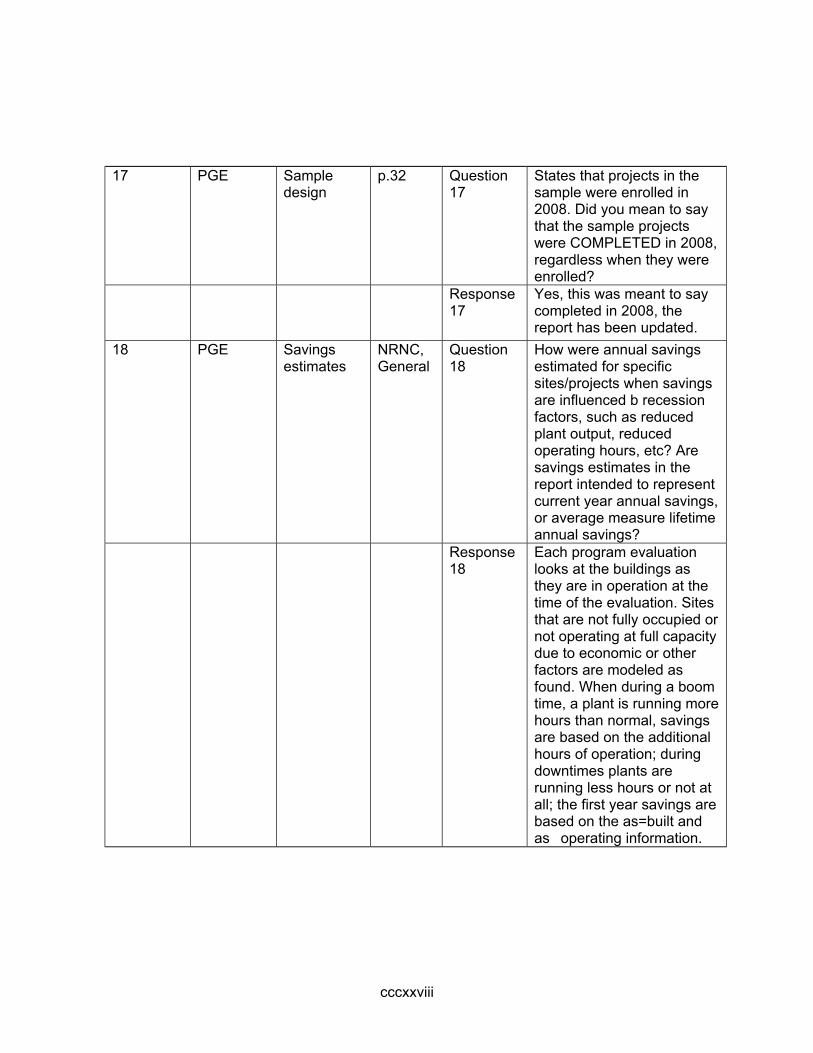
cccxxviii
17 PGE Sample
design p.32 Question
17 States that projects in the sample were enrolled in 2008. Did you mean to say that the sample projects were COMPLETED in 2008, regardless when they were enrolled?
Response 17
Yes, this was meant to say completed in 2008, the report has been updated.
18 PGE Savings estimates
NRNC, General
Question 18
How were annual savings estimated for specific sites/projects when savings are influenced b recession factors, such as reduced plant output, reduced operating hours, etc? Are savings estimates in the report intended to represent current year annual savings, or average measure lifetime annual savings?
Response 18
Each program evaluation looks at the buildings as they are in operation at the time of the evaluation. Sites that are not fully occupied or not operating at full capacity due to economic or other factors are modeled as found. When during a boom time, a plant is running more hours than normal, savings are based on the additional hours of operation; during downtimes plants are running less hours or not at all; the first year savings are based on the as=built and as�operating information.
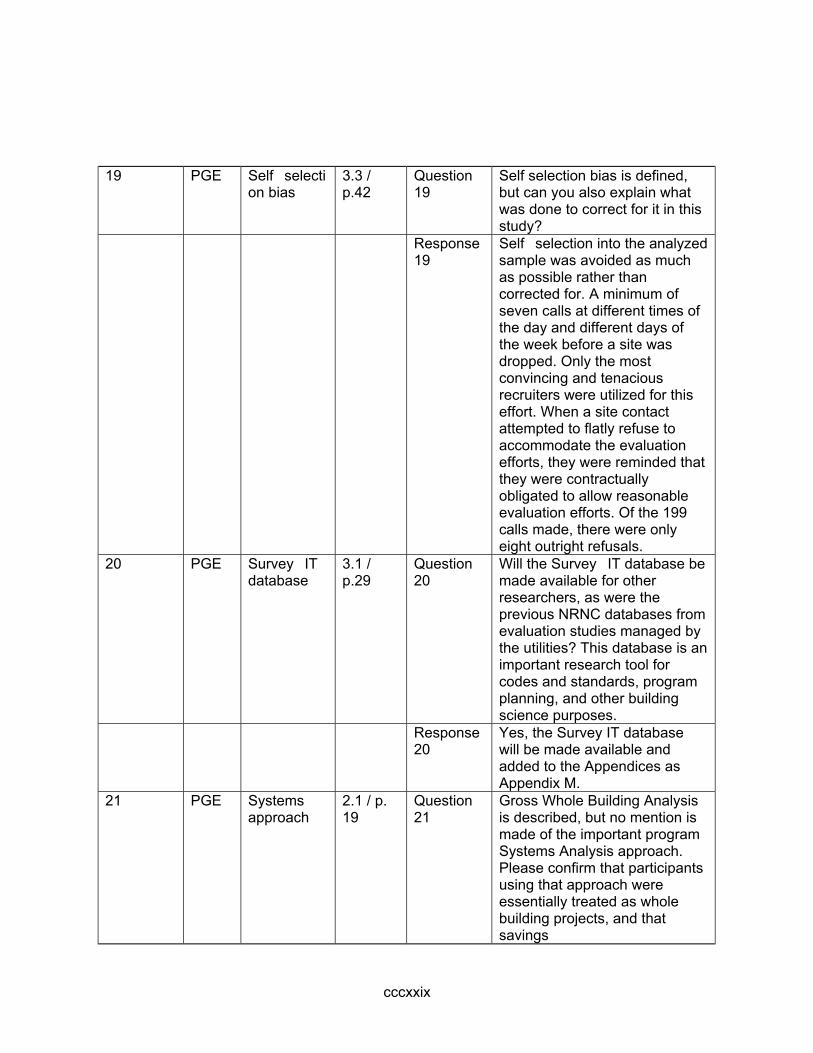
cccxxix
19 PGE Self�selection bias
3.3 / p.42
Question 19
Self selection bias is defined, but can you also explain what was done to correct for it in this study?
Response 19
Self�selection into the analyzed sample was avoided as much as possible rather than corrected for. A minimum of seven calls at different times of the day and different days of the week before a site was dropped. Only the most convincing and tenacious recruiters were utilized for this effort. When a site contact attempted to flatly refuse to accommodate the evaluation efforts, they were reminded that they were contractually obligated to allow reasonable evaluation efforts. Of the 199 calls made, there were only eight outright refusals.
20 PGE Survey�IT database
3.1 / p.29
Question 20
Will the Survey�IT database be made available for other researchers, as were the previous NRNC databases from evaluation studies managed by the utilities? This database is an important research tool for codes and standards, program planning, and other building science purposes.
Response 20
Yes, the Survey IT database will be made available and added to the Appendices as Appendix M.
21 PGE Systems approach
2.1 / p. 19
Question 21
Gross Whole Building Analysis is described, but no mention is made of the important program Systems Analysis approach. Please confirm that participants using that approach were essentially treated as whole building projects, and that savings
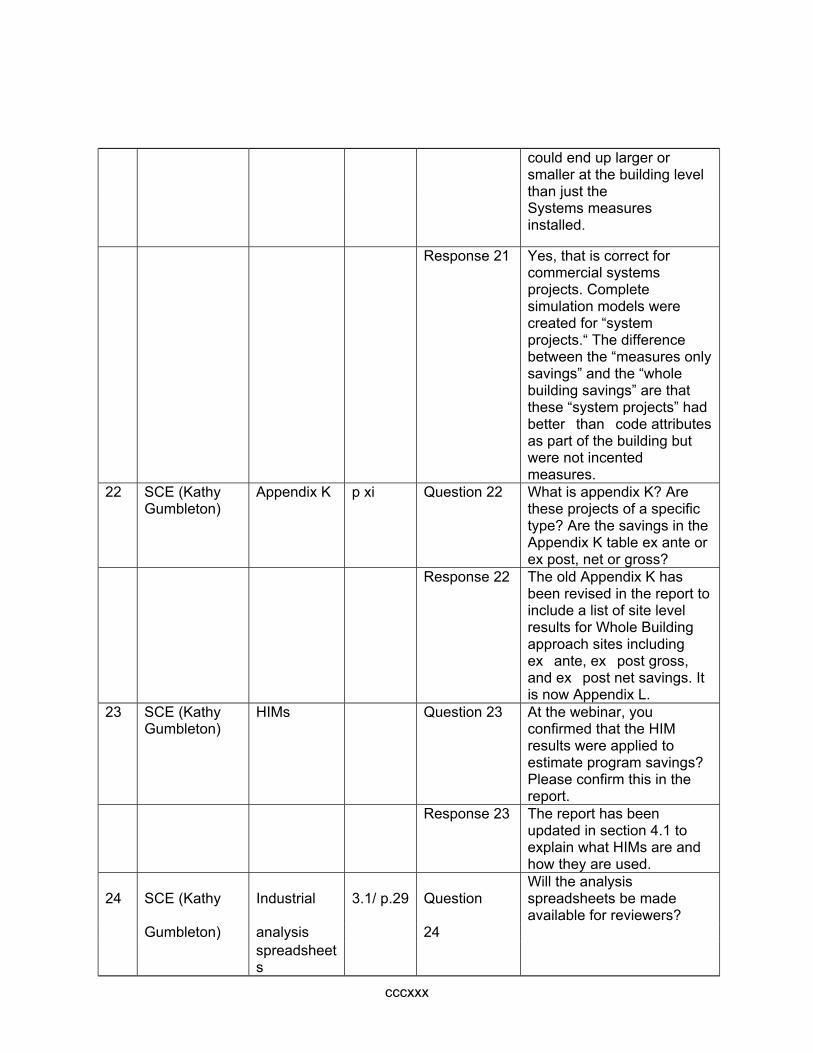
cccxxx
could end up larger or smaller at the building level than just the
Systems measures installed.
Response 21 Yes, that is correct for commercial systems projects. Complete simulation models were created for “system projects.“ The difference between the “measures only savings” and the “whole building savings” are that these “system projects” had better�than�code attributes as part of the building but were not incented measures.
22 SCE (Kathy Gumbleton)
Appendix K p xi Question 22 What is appendix K? Are these projects of a specific type? Are the savings in the Appendix K table ex ante or ex post, net or gross?
Response 22 The old Appendix K has been revised in the report to include a list of site level results for Whole Building approach sites including ex�ante, ex�post gross, and ex�post net savings. It is now Appendix L.
23 SCE (Kathy Gumbleton)
HIMs Question 23 At the webinar, you confirmed that the HIM results were applied to estimate program savings? Please confirm this in the report.
Response 23 The report has been updated in section 4.1 to explain what HIMs are and how they are used.
24 SCE (Kathy Industrial 3.1/ p.29 Question Will the analysis spreadsheets be made available for reviewers?
Gumbleton) analysis 24 spreadsheet
s
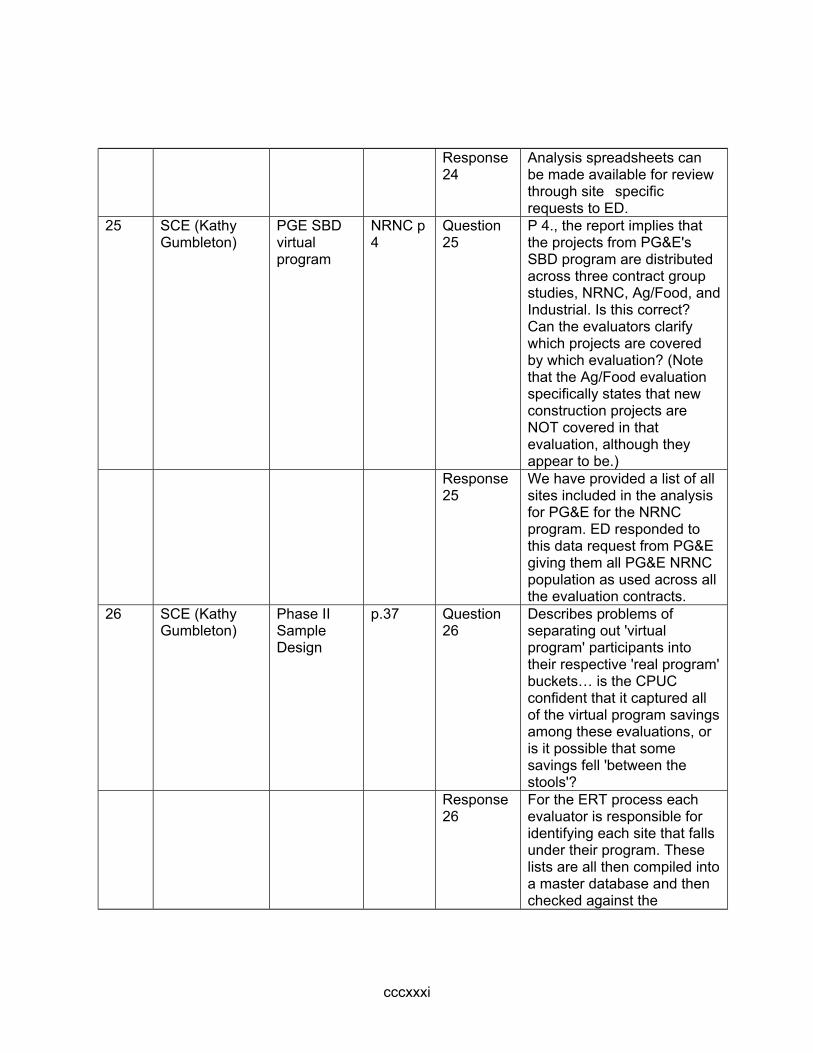
cccxxxi
Response 24
Analysis spreadsheets can be made available for review through site�specific requests to ED.
25 SCE (Kathy Gumbleton)
PGE SBD virtual program
NRNC p 4
Question 25
P 4., the report implies that the projects from PG&E's SBD program are distributed across three contract group studies, NRNC, Ag/Food, and Industrial. Is this correct? Can the evaluators clarify which projects are covered by which evaluation? (Note that the Ag/Food evaluation specifically states that new construction projects are NOT covered in that evaluation, although they appear to be.)
Response 25
We have provided a list of all sites included in the analysis for PG&E for the NRNC program. ED responded to this data request from PG&E giving them all PG&E NRNC population as used across all the evaluation contracts.
26 SCE (Kathy Gumbleton)
Phase II Sample Design
p.37 Question 26
Describes problems of separating out 'virtual program' participants into their respective 'real program' buckets… is the CPUC confident that it captured all of the virtual program savings among these evaluations, or is it possible that some savings fell 'between the stools'?
Response 26
For the ERT process each evaluator is responsible for identifying each site that falls under their program. These lists are all then compiled into a master database and then checked against the
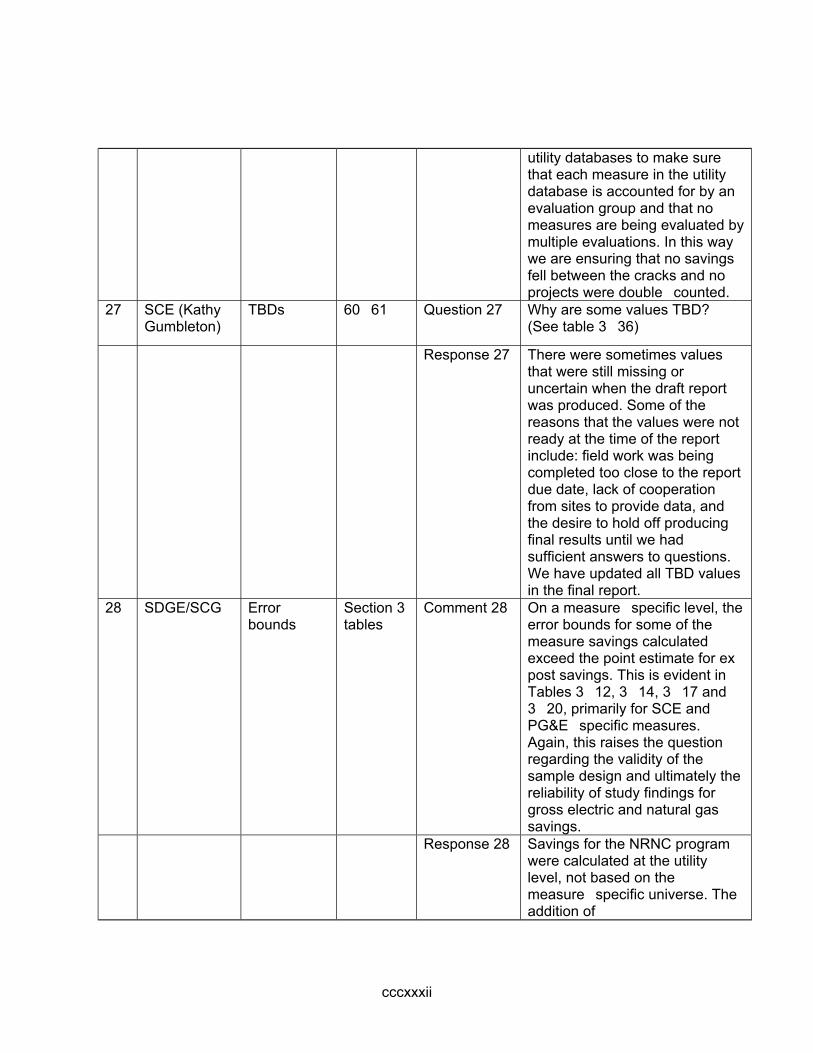
cccxxxii
utility databases to make sure that each measure in the utility database is accounted for by an evaluation group and that no measures are being evaluated by multiple evaluations. In this way we are ensuring that no savings fell between the cracks and no projects were double�counted.
27 SCE (Kathy Gumbleton)
TBDs 60�61 Question 27 Why are some values TBD? (See table 3�36)
Response 27 There were sometimes values that were still missing or uncertain when the draft report was produced. Some of the reasons that the values were not ready at the time of the report include: field work was being completed too close to the report due date, lack of cooperation from sites to provide data, and the desire to hold off producing final results until we had sufficient answers to questions. We have updated all TBD values in the final report.
28 SDGE/SCG Error bounds
Section 3 tables
Comment 28 On a measure�specific level, the error bounds for some of the measure savings calculated exceed the point estimate for ex post savings. This is evident in Tables 3�12, 3�14, 3�17 and 3�20, primarily for SCE and PG&E�specific measures. Again, this raises the question regarding the validity of the sample design and ultimately the reliability of study findings for gross electric and natural gas savings.
Response 28 Savings for the NRNC program were calculated at the utility level, not based on the measure�specific universe. The addition of

cccxxxiii
measure�level data was a post�analysis display of information. It was never a goal of the evaluation to obtain precision at the measure level in NCCS except for whole�building, which is an HIM. For MWh the relative precisions for PG&E, SDG&E and SCE were within +�10% at the 90% level of confidence (for SCG the majority of projects were evaluated due to the low number of projects in the program). For gas savings Mean Per Unit (MPU) estimation was used and the error bounds and relative precision do not represent the variation from the realization rate of tracking to evaluated savings, but rather the amount of variation between the estimates and the weighted mean. For gas savings over 70% of the total program tracking savings were evaluated, so we feel confident that our estimate for the IOU level savings is very good.
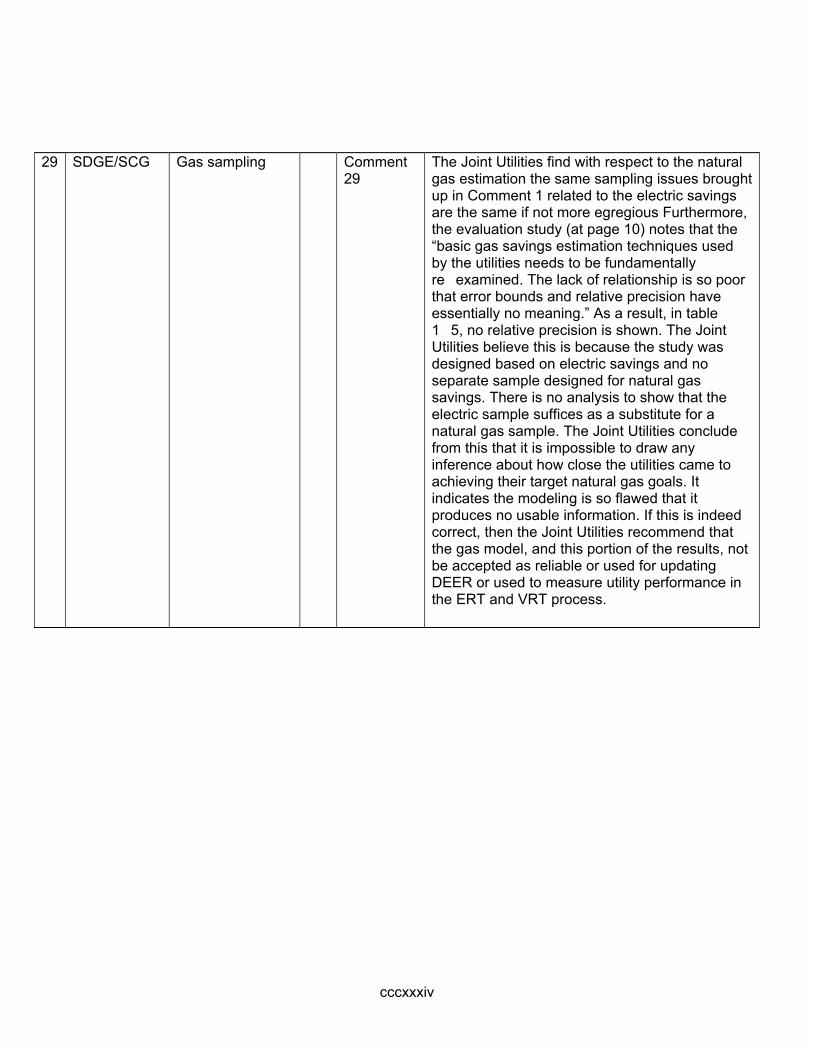
cccxxxiv
29 SDGE/SCG Gas sampling Comment 29
The Joint Utilities find with respect to the natural gas estimation the same sampling issues brought up in Comment 1 related to the electric savings are the same if not more egregious Furthermore, the evaluation study (at page 10) notes that the “basic gas savings estimation techniques used by the utilities needs to be fundamentally re�examined. The lack of relationship is so poor that error bounds and relative precision have essentially no meaning.” As a result, in table 1�5, no relative precision is shown. The Joint Utilities believe this is because the study was designed based on electric savings and no separate sample designed for natural gas savings. There is no analysis to show that the electric sample suffices as a substitute for a natural gas sample. The Joint Utilities conclude from this that it is impossible to draw any inference about how close the utilities came to achieving their target natural gas goals. It indicates the modeling is so flawed that it produces no usable information. If this is indeed correct, then the Joint Utilities recommend that the gas model, and this portion of the results, not be accepted as reliable or used for updating DEER or used to measure utility performance in the ERT and VRT process.
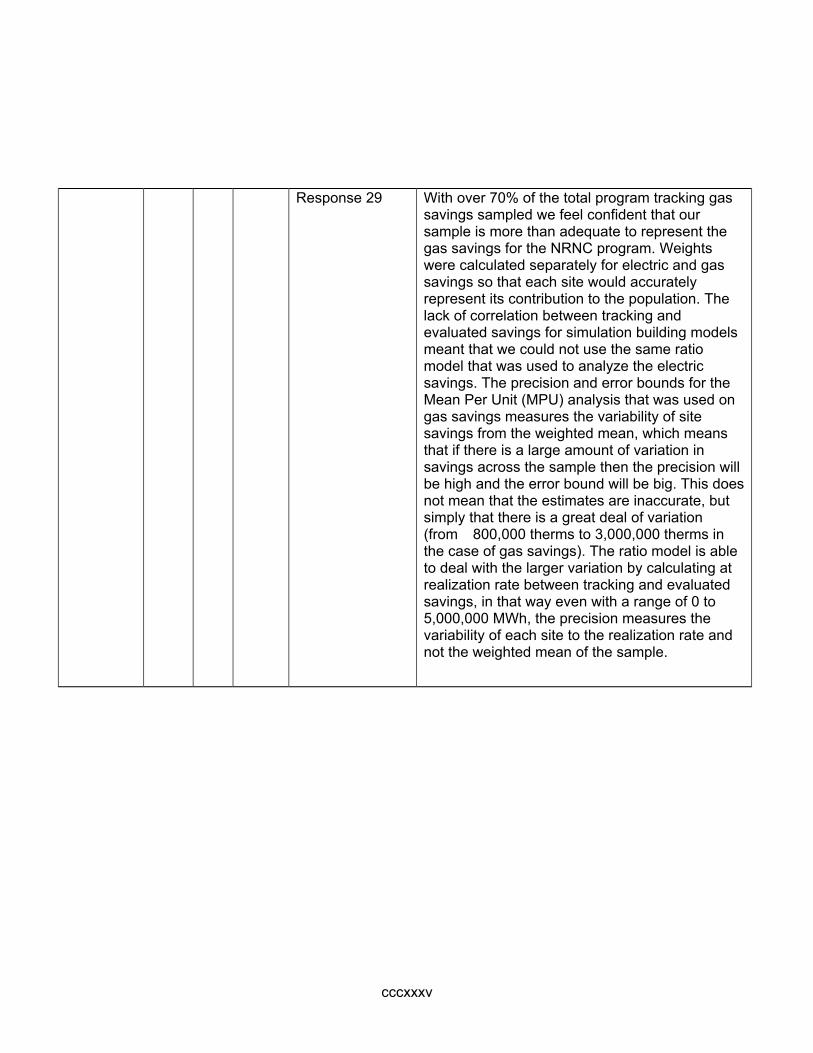
cccxxxv
Response 29 With over 70% of the total program tracking gas savings sampled we feel confident that our sample is more than adequate to represent the gas savings for the NRNC program. Weights were calculated separately for electric and gas savings so that each site would accurately represent its contribution to the population. The lack of correlation between tracking and evaluated savings for simulation building models meant that we could not use the same ratio model that was used to analyze the electric savings. The precision and error bounds for the Mean Per Unit (MPU) analysis that was used on gas savings measures the variability of site savings from the weighted mean, which means that if there is a large amount of variation in savings across the sample then the precision will be high and the error bound will be big. This does not mean that the estimates are inaccurate, but simply that there is a great deal of variation (from �800,000 therms to 3,000,000 therms in the case of gas savings). The ratio model is able to deal with the larger variation by calculating at realization rate between tracking and evaluated savings, in that way even with a range of 0 to 5,000,000 MWh, the precision measures the variability of each site to the realization rate and not the weighted mean of the sample.
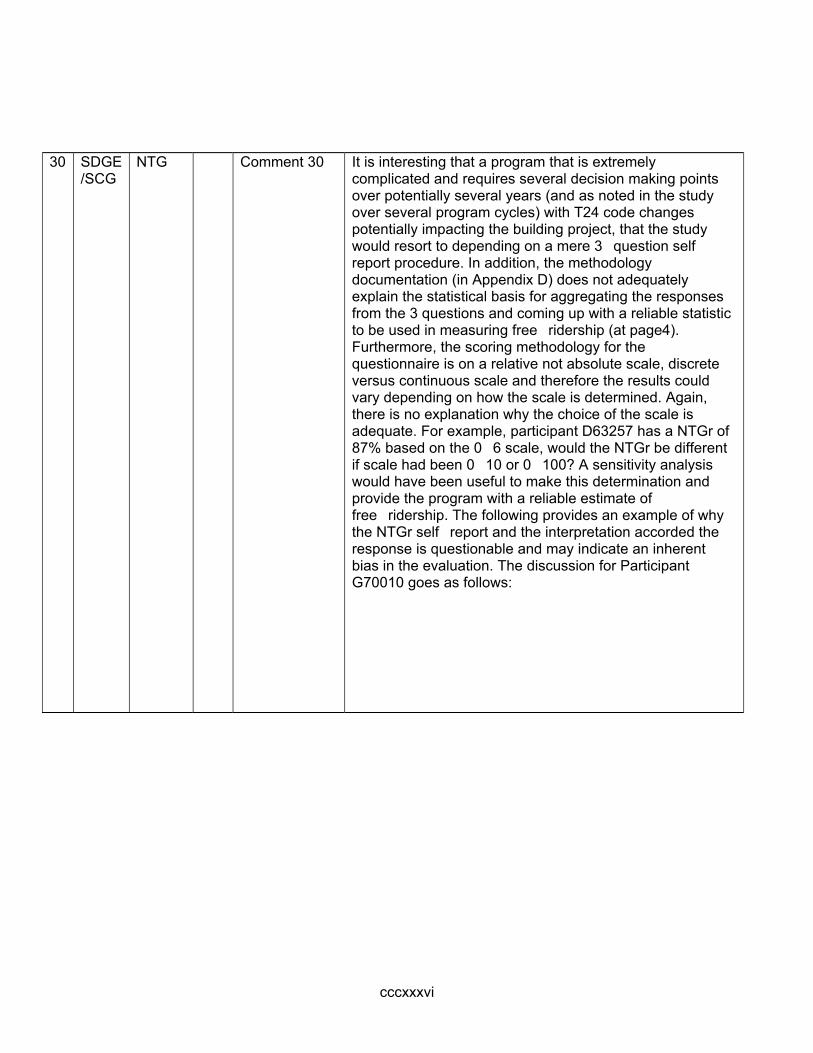
cccxxxvi
30 SDGE/SCG
NTG Comment 30 It is interesting that a program that is extremely complicated and requires several decision making points over potentially several years (and as noted in the study over several program cycles) with T24 code changes potentially impacting the building project, that the study would resort to depending on a mere 3�question self report procedure. In addition, the methodology documentation (in Appendix D) does not adequately explain the statistical basis for aggregating the responses from the 3 questions and coming up with a reliable statistic to be used in measuring free�ridership (at page4). Furthermore, the scoring methodology for the questionnaire is on a relative not absolute scale, discrete versus continuous scale and therefore the results could vary depending on how the scale is determined. Again, there is no explanation why the choice of the scale is adequate. For example, participant D63257 has a NTGr of 87% based on the 0�6 scale, would the NTGr be different if scale had been 0�10 or 0�100? A sensitivity analysis would have been useful to make this determination and provide the program with a reliable estimate of free�ridership. The following provides an example of why the NTGr self�report and the interpretation accorded the response is questionable and may indicate an inherent bias in the evaluation. The discussion for Participant G70010 goes as follows:
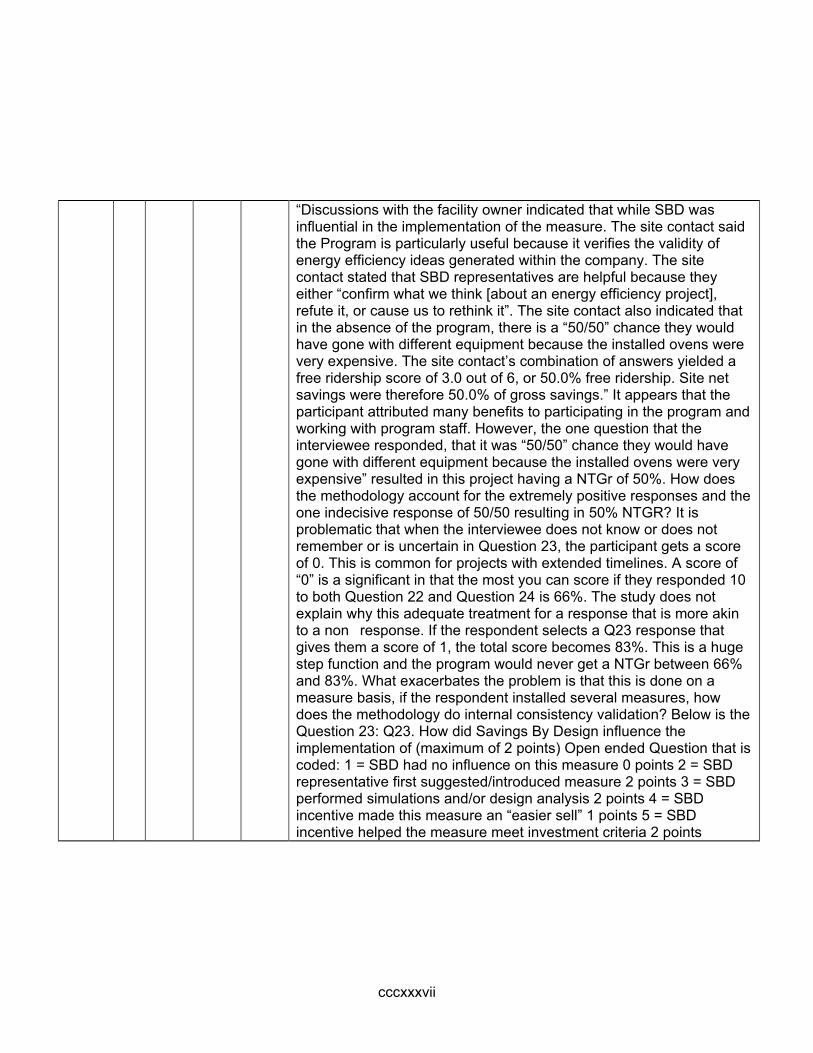
cccxxxvii
“Discussions with the facility owner indicated that while SBD was influential in the implementation of the measure. The site contact said the Program is particularly useful because it verifies the validity of energy efficiency ideas generated within the company. The site contact stated that SBD representatives are helpful because they either “confirm what we think [about an energy efficiency project], refute it, or cause us to rethink it”. The site contact also indicated that in the absence of the program, there is a “50/50” chance they would have gone with different equipment because the installed ovens were very expensive. The site contact’s combination of answers yielded a free ridership score of 3.0 out of 6, or 50.0% free ridership. Site net savings were therefore 50.0% of gross savings.” It appears that the participant attributed many benefits to participating in the program and working with program staff. However, the one question that the interviewee responded, that it was “50/50” chance they would have gone with different equipment because the installed ovens were very expensive” resulted in this project having a NTGr of 50%. How does the methodology account for the extremely positive responses and the one indecisive response of 50/50 resulting in 50% NTGR? It is problematic that when the interviewee does not know or does not remember or is uncertain in Question 23, the participant gets a score of 0. This is common for projects with extended timelines. A score of “0” is a significant in that the most you can score if they responded 10 to both Question 22 and Question 24 is 66%. The study does not explain why this adequate treatment for a response that is more akin to a non�response. If the respondent selects a Q23 response that gives them a score of 1, the total score becomes 83%. This is a huge step function and the program would never get a NTGr between 66% and 83%. What exacerbates the problem is that this is done on a measure basis, if the respondent installed several measures, how does the methodology do internal consistency validation? Below is the Question 23: Q23. How did Savings By Design influence the implementation of (maximum of 2 points) Open ended Question that is coded: 1 = SBD had no influence on this measure 0 points 2 = SBD representative first suggested/introduced measure 2 points 3 = SBD performed simulations and/or design analysis 2 points 4 = SBD incentive made this measure an “easier sell” 1 points 5 = SBD incentive helped the measure meet investment criteria 2 points
cccxxxviii
6 = Prior SBD projects have had success with this measure 1 points 7 = DK, Not Certain, Can’t Remember 0 points 50= other individually assessed The Joint Utilities, therefore, conclude that the NTGr estimate or the net savings impacts may not be as reliable as the results show and the Joint Utilities do not recommend the use of these results. Overall, the Joint Utilities find that the sample design and NTG methodology raise significant questions regarding the validity of the ex post results. The Joint Utilities recommend that these issues be addressed and the results re�evaluated prior to using any of the study results for DEER updates or for the Verification Report.
Response Although it is correct that the SBD decision�maker survey uses the 30 responses from three questions for each measure in order to assign
a NTG ratio, the approach goes beyond these questions. The survey uses a fairly lengthy set of warm�up questions to bring the respondent back to the time and place when the decisions were made. The respondents are asked when the first interaction with the Program regarding this project was and to rate the value of the individual Program components, specifically, the incentive, design assistance, and design analysis. The responses to the three NTG questions need to be consistent with these responses. If not, we ask the respondent to clarify these inconsistencies. Frequently, this results in going back and changing the score to reconcile the responses. Finally, the surveyor always asks “why” when the decision�maker responds with a low number for Q23, in order to be more informative as to the cause of the free�rider and be certain that respondent understands the question being asked. In essence, the two basic aspects of Program are being probed here. One is Program influence on the implementation of the measure, and the second is what would have happened in the absence of the Program. In the scoring, these are given equal weight. The program influence is assessed by asking the decision�maker how influential the Program was on the implementation the measure and how the Program came to influence the measure. The perceived influence is part of the score, but the “how” is given the twice the weight than the perceived influence. The six�point scoring was the way we balance the relative importance of the three questions. The linch pin of this approach is asking how the Program influenced the measure without prompting. This forces the decision�maker to remember back and articulate the mechanism
cccxxxix
of influence instead picking one of the prompts. This brings them back to the moment of decision, and doesn’t allow for uninterested respondent to continue without some serious thought to what happened at the time. The initial decision to not give credit for a respondent’s inability to remember or articulate the mechanism of influence was based on surveyor’s impression that most decision�makers could remember the decision process when they tried, and not being able to come with a mechanism was an indication there wasn’t any influence. In practice, this type of response so rarely comes into play that it has had no affect on results and the scoring has never been revisited. Note that the surveyor’s initial reply to someone who doesn’t know or can’t remember how the measure implementation was influenced by the Program was to ask for contact information for someone that would be better informed. For some projects, as many as four different decision�makers were contacted in order to get answers for this wide variety of questions. The write�up G70010 is in error, the tables are corrected; the measure net�to�gross ratio is 0.67, not the 0.50 as previously written in the text. .
cccxl
31 SDGE/SCG Outliers Study Appendix G120006
Question 31
In the Study Appendix, there is documentation provided for each of the study participants. In the case of participant G120006, it states that the customer did not provide requested data to adequately evaluate the site. In spite of this, the evaluators proceeded with their estimation using a different measure to determine its realization rate, resulting in an extremely low realization rate of 12%. The study does not explain either, why this is not an outlier and therefore removed from the study or why the substitute measure provides adequate representation and therefore the results are useable. The study should explain their treatment of outliers or non�responsiveness if they continue to use these sample points.
Response We were promised by the site contact that they would provide
31 the essential data to evaluate the second measure and held out hope that we would be receiving it in time until the very last day. The choice to apply the gross realization rate for the first measure to the second measure was an 11th hour decision and in retrospect was probably not the best way to establish savings for this site. The results have been revised and are based solely upon the results for just the single measure with sufficient data.

cccxli
32 SDGE/SCG
Realization rates
overall Question 32
Overall, the evaluation suggests that the non�residential new construction program is a success. However, the SDG&E and SCG results do not have the same realization rates as PG&E and SCE. There is no explanation of why SDG&E and SCG programs do not achieve at the level of SCE and PG&E’s programs. Is it perhaps a result of the sample design issue raised in the first comment or are there legitimate program design or program participant differences (e.g., mix of building types, greater free�ridership, modeling issues) or some other factors that account for these differences? The evaluation report should provide explanations for their findings.
Response 32
We consider the program to be a success because there are substantial gross savings with a substantial portion of those savings being program�induced. Each Utility operates the SBD program in its own manner. This kind of variation between utilities operating similar programs is normal and cannot be explained without an extensive process evaluation that would get into the way participants are recruited by account executives, the quality of the engineering analysis and over�sight, as well as the mix of known and innovative measures.
33 SDGE/SCG
Sample design
Comment 33
The study does not explain how the sample was stratified across the service territories. It is not clear why the sample percentage relative to the IOU program population and gross KWH savings for

cccxlii
SDG&E would have a relatively higher number of sample points compared to SCE and PG&E. It is interesting that the final sample selection results in relative precision rates for PG&E and SCE that are at least twice that of SDG&E. This would imply that if the results were applied on a utility�basis, that each utility’s results do not have the same level of reliability. This discrepancy should be adequately explained in the study and a thorough discussion how this disparity does not ultimately affect the reliability of individual IOU results. On the other hand, because the study does not explain how the results are to be used for the final verification report, the evaluation study should clearly discuss the applicability of the results when used either on a statewide basis or on an IOU�basis.
Response The sample was designed and stratified for each utility separately
33 to target +/�10% precision for electric energy savings. The sampling was conducted in two phases, the first phase sampling sites that were completed in 2006�07 and the second phase for sites completed in 2008. When we were designing the sample we forecasted the number of projects completed in 2008 based on the assumption that the Program population for each utility would be approximately half of the 2006�07 population. Using these predictions we allocated samples to utilities to achieve the targeted precision.
cccxliii
SDGE had a very low number of sites completed in 2008, so some of the sample points that were allocated for SDGE were allocated to PG&E and SCE in the phase 2 sample designs. Even with this reallocation, SDGE was still sampled at a higher percentage due to this downturn in 2008 completions. However, please keep in mind that when using ratio estimation, as we did for the electric evaluation, the relative precision is not strictly a function of sample size relative to the population. Even if each utility had the same number of sample points or % of sampled savings, the precisions would vary by utility based on the relationship between the tracking and the evaluated savings. The more consistent the relationship is, the smaller the relative precision will be. SDGE had more sample points than was necessary to achieve the targeted precision for kWh given the relationship between their tracking and evaluated savings, which is why the precision ended up being half that of the PGE and SCE. Likewise for the gas savings evaluation, that used a mean per unit approach, the variations from the weighted mean drive the relative precision to a larger degree that sample size and percentage of population. The variability of the precision between utilities is normal and the results of the analysis are valid at both the IOU and statewide level. Variability in precision does not make the estimate of savings invalid or unreliable; it is a measure of the variability between the utility tracking estimate and the evaluated savings estimate.