2013 nrnc eval final report - california measurement ... gl i table of contents 1 . executive...
TRANSCRIPT
FINAL REPORT
IALC4 NRNC Whole Building
Impact Evaluation Report PY-
2013 Energy Division
California Public Utilites Commission
505 Van Ness Ave. San Francisco, CA 94012
DNV GL Energy
155 Grand Ave. Oakland CA
July 24, 2015
CALMAC Study ID CPU0108.01

DNV GL
LEGAL NOTICE
This report was prepared as an account of work sponsored by the California Public Utilities Commission. It
does not necessarily represent the views of the Commission or any of its employees except to the extent, if
any, that it has formally been approved by the Commission at a public meeting. For information regarding
any such action, communicate directly with the Commission at 505 Van Ness Avenue, San Francisco,
California 94102. Neither the Commission nor the State of California, nor any officer, employee, or any of its
contractors or subcontractors makes any warranty, express or implied, or assumes any legal liability
whatsoever for the contents of this document
DNV GL i
Table of contents
. Executive Summary ................................................................................................................ 4 1
NRNC Whole Building Impact Evaluation Portfolio Context and Sample Sizes ................................... 4
High-Level NRNC Whole Building Gross Impact Results ................................................................ 7
High Level Custom Net-to-Gross Results .................................................................................... 9
Net Evaluation Realization Rate Results .................................................................................... 10
Summary of Findings and Recommendations ............................................................................ 11
. Introduction and Background .................................................................................................. 12 2
Background .......................................................................................................................... 12
Study Objectives and Researchable Issues ............................................................................... 14
Structure of the Report .......................................................................................................... 16
. Sample Design...................................................................................................................... 18 3
. Methods ............................................................................................................................... 21 4
. Gross Impact Results ............................................................................................................. 23 5
Program-Level Gross Impact Summary .................................................................................... 23
Project-Specific Gross Impact Summary ................................................................................... 28
Discrepancy Analysis ............................................................................................................. 35
Issues and Recommendations ................................................................................................. 42
. NTG Results ......................................................................................................................... 47 6
Number of Completed Surveys ................................................................................................ 47
Weighted NTG Results ............................................................................................................ 47
Weighted Net Savings Results ................................................................................................. 48
Key Factors Influencing NTGRs ................................................................................................ 51
Recommendations ................................................................................................................. 53
. Project Practice Assessment Results ........................................................................................ 54 7
Introduction .......................................................................................................................... 54
Project Practice Assessment Results ........................................................................................ 54
. Summary of Evaluation Findings and Recommendations ........................................................... 77 8
Gross Impact Findings and Recommendations ........................................................................... 77
Net-to-Gross Findings and Recommendations ........................................................................... 81
Program Findings and Recommendations Based on PPA Results .................................................. 81
DNV GL ii
List of Tables
Table 1: Summary of NRNC Whole Building Evaluation Sample Sizes for PA ............................................. 7
Table 2: Project Lifecycle Gross Realization Rates by Energy Metric ......................................................... 8
Table 3: Weighted Net-to-Gross Ratios by Fuel Type ........................................................................... 10
Table 4: PA Statewide First Year Net Realization Rate Estimates and Comparisons .................................. 10
Table 5: Claimed Energy Savings by PA for 2013 Projects in the NRNC Work Order ................................. 14
Table 6: Overall Organizational Structure of Report ............................................................................. 17
Table 7: Summary of NRNC WB Impact Population and Sample by PA ................................................... 18
Table 8: Comparison between Initial Sample Design and Final Sample Frame ......................................... 19
Table 9: Sample Points and Population by Stratum ............................................................................ 20
Table 10: Statewide First Year Weighted Gross Realization Rate Estimates and Comparisons .................... 24
Table 11: Statewide Life Cycle Weighted Gross Realization Rate Estimates and Comparisons ................... 24
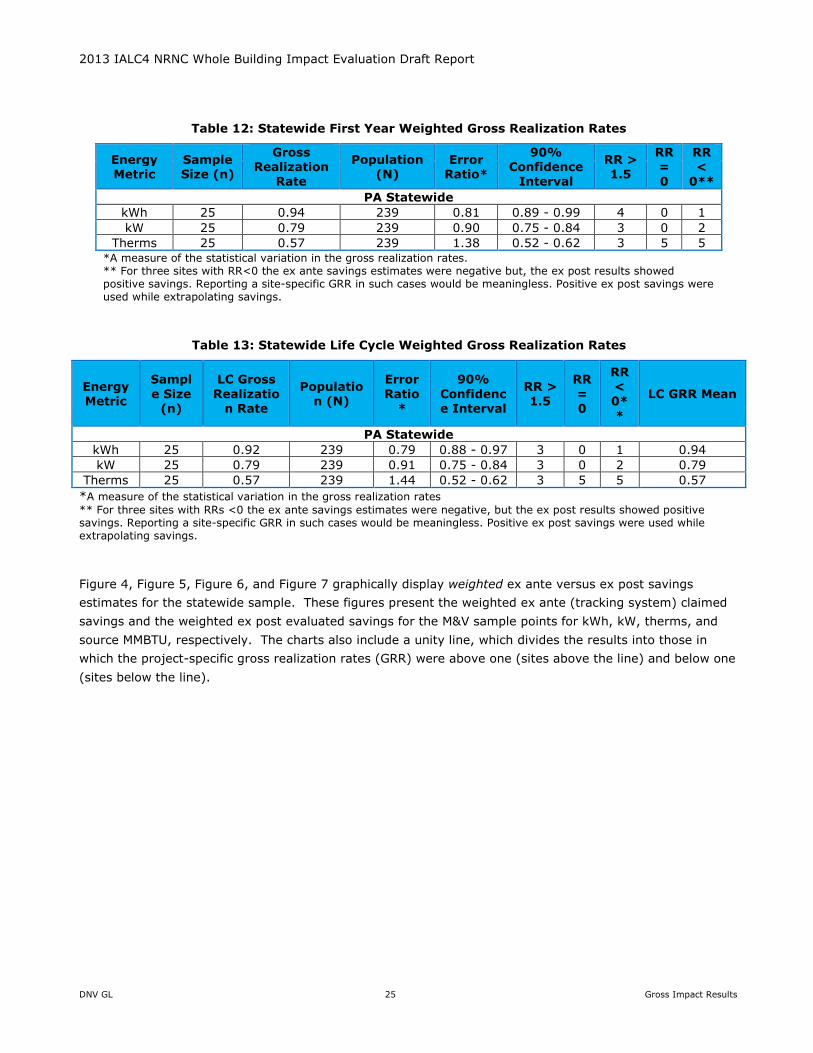
Table 12: Statewide First Year Weighted Gross Realization Rates .......................................................... 25
Table 13: Statewide Life Cycle Weighted Gross Realization Rates .......................................................... 25
Table 14: Evaluated Un-weighted Site Specific Ex-Post Savings and GRR Results .................................... 29
Table 15: Site Specific Model Calibration Impact Comparison ............................................................... 41
Table 16: Completed Surveys by PA .................................................................................................. 47
Table 17: Weighted Net-to-Gross Ratios by Fuel Type ......................................................................... 48
Table 18: PA Statewide Net Realization Rate Estimate and Comparisons ................................................ 51
Table 19: Comparison of PA and Ex-Post M&V Eligibility Considerations by Customer Agreement Date ...... 56
Table 20: PA Eligibility Ratings by Customer Agreement Date ............................................................... 58
Table 21: Comparison of PA and Ex-Post M&V Project Baseline Conclusions............................................ 60
Table 22: PA Baseline Documentation Ratings by Customer Agreement Date ......................................... 62
Table 23: PA Baseline Ratings by Customer Agreement Date ................................................................ 64
Table 24: Comparison of PA and Ex-Post EUL Assessment by Customer Agreement Date ......................... 66
Table 25: PA Incremental Cost Ratings by Customer Agreement Date ................................................... 68
Table 26: PA Incentive Calculation Assessment by Customer Agreement Date ........................................ 70
Table 27: Comparison of PA and Ex-Post M&V Calculation Considerations by Customer Agreement Date .... 72
Table 28: Assessment of PA Calculation Methods by Customer Agreement Date ...................................... 74
Table 29: Assessment of PA Calculation Inputs and Assumptions by Customer Agreement Date ............... 76
DNV GL iii
List of Figures
Figure 1: NRNC Whole Building Evaluation Share of Statewide PY2013 PA Claims ..................................... 5
Figure 2: Project Lifecycle Gross Realization Rates by Energy Metric (kWh, kW, and Therms) ..................... 8
Figure 3: Weighted Net-to-Gross Ratios by Fuel Type Statewide ............................................................. 9
Figure 4: First Year Weighted Ex-Ante and Ex-Post Electric Savings (kWh) for Sampled Projects ............... 26
Figure 5: First Year Weighted Ex-Ante and Ex-Post Electric Demand Savings (kW) for Sampled Projects ... 26
Figure 6: First Year Weighted Ex-Ante and Ex-Post Gas Savings (Therms) for Sampled Projects ............... 27
Figure 7: First Year Weighted Ex-Ante and Ex-Post Source MMBTU Savings for Sampled Projects.............. 27
Figure 8: kWh GRR for Sampled NRNC Whole Building Projects............................................................. 31
Figure 9: kW GRR for NRNC Whole Building Sampled Projects (Cropped) ............................................... 31
Figure 10: Therms GRR for NRNC Whole Building Sampled Projects (Cropped) ....................................... 32
Figure 11: kWh GRR Distribution for NRNC Whole Building Sample Projects ........................................... 33
Figure 12: kW GRR Distribution for NRNC Whole Building Sample Projects ............................................. 33
Figure 13: Therms GRR Distribution for NRNC Whole Building Sample Projects ....................................... 34
Figure 14: First Year Unweighted Gross Realization Rate (GRR) by Sample Domain ................................. 35
Figure 15: Frequency of Discrepancy Factors by Energy Metric ............................................................. 39
Figure 16: Factor Contribution to Total Discrepancy by Energy Metric .................................................... 40
Figure 17: Weighted Source MMBtu Net Savings Project Results ........................................................... 49
Figure 18: Weighted kWh Net Saving Project Results .......................................................................... 49
Figure 19: Weighted Therm Net Saving Project Results ........................................................................ 50
Figure 20: Weighted Peak kW Net Saving Project Results ..................................................................... 50

2013 IALC4 NRNC Whole Building Impact Evaluation Draft Report
DNV GL 4 Executive Summary
. EXECUTIVE SUMMARY 1
This report presents findings of the impact evaluation of California program administrators’ (PAs)1
2013 Non-Residential New Construction (NRNC) programs.2 This NRNC project impact evaluation is
one of multiple California Public Utilities Commission (CPUC) evaluations of the PAs 2013-2014
efficiency programs. This evaluation primarily focused on non-residential new construction (NRNC)
Whole Building projects and was conducted under the Industrial Agricultural Large Commercial (IALC)
roadmap.
The evaluation addresses non-residential new construction (NRNC) Whole Building projects that
received incentives under the statewide Savings by Design (SBD) program. The scope of work for this
new construction evaluation includes an independent estimation of gross and net savings and
development of findings and recommendations that can be used to improve program, project, and
measure effectiveness. Primarily, three main evaluation activities support the findings and
recommendations in this report:
1. M&V activities for estimating gross impacts for 25 projects across all PAs,
2. Professional telephone survey data collection supporting net-to-gross (NTG) estimation for the
25 gross sample points, and
3. Engineering reviews of the 25 gross sample points to support the qualitative project practices
assessment (PPA).
NRNC Whole Building Impact Evaluation Portfolio Context and Sample Sizes
This NRNC impact evaluation covers Whole Building projects that received incentives under the SBD
program in PY2013. This population of 239 projects is very diverse with regards to project size,
measures installed, and amount of savings claimed. The most common building types evaluated under
this impact study were schools, universities, healthcare facilities, grocery stores, refrigerated
warehouses, laboratories and office buildings.
1 California energy efficiency program administrators include PG&E, SCE, SCG, SDG&E, Marin Clean Energy, the Bay Area Regional Energy
Network (REN), and the Southern California REN. However, this evaluation only addresses programs under the administration of PG&E,
SCE, SCG and SDG&E.
2 This effort was completed for CPUC under the direction of staff responsible for evaluation of utility energy efficiency programs.
2013 IALC4 NRNC Whole Building Impact Evaluation Draft Report
DNV GL 5 Executive Summary
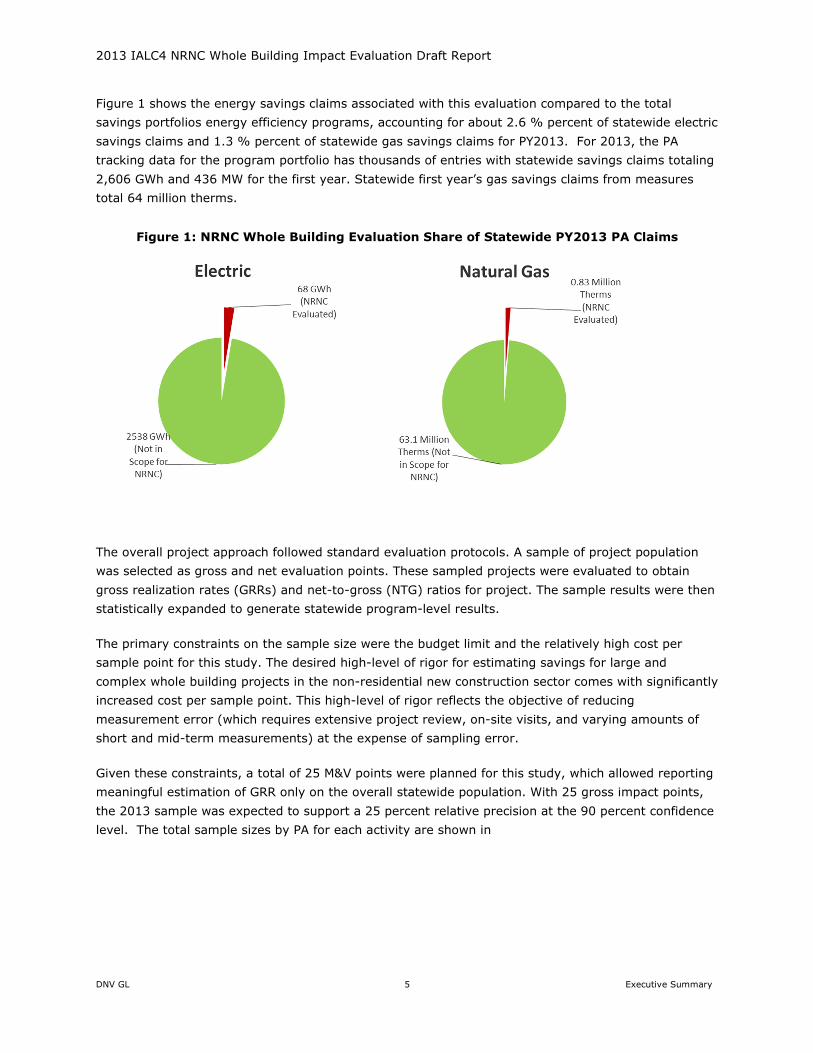
Figure 1 shows the energy savings claims associated with this evaluation compared to the total
savings portfolios energy efficiency programs, accounting for about 2.6 % percent of statewide electric
savings claims and 1.3 % percent of statewide gas savings claims for PY2013. For 2013, the PA
tracking data for the program portfolio has thousands of entries with statewide savings claims totaling
2,606 GWh and 436 MW for the first year. Statewide first year’s gas savings claims from measures
total 64 million therms.
Figure 1: NRNC Whole Building Evaluation Share of Statewide PY2013 PA Claims
The overall project approach followed standard evaluation protocols. A sample of project population
was selected as gross and net evaluation points. These sampled projects were evaluated to obtain
gross realization rates (GRRs) and net-to-gross (NTG) ratios for project. The sample results were then
statistically expanded to generate statewide program-level results.
The primary constraints on the sample size were the budget limit and the relatively high cost per
sample point for this study. The desired high-level of rigor for estimating savings for large and
complex whole building projects in the non-residential new construction sector comes with significantly
increased cost per sample point. This high-level of rigor reflects the objective of reducing
measurement error (which requires extensive project review, on-site visits, and varying amounts of
short and mid-term measurements) at the expense of sampling error.
Given these constraints, a total of 25 M&V points were planned for this study, which allowed reporting
meaningful estimation of GRR only on the overall statewide population. With 25 gross impact points,
the 2013 sample was expected to support a 25 percent relative precision at the 90 percent confidence
level. The total sample sizes by PA for each activity are shown in

2013 IALC4 NRNC Whole Building Impact Evaluation Draft Report
DNV GL 6 Executive Summary
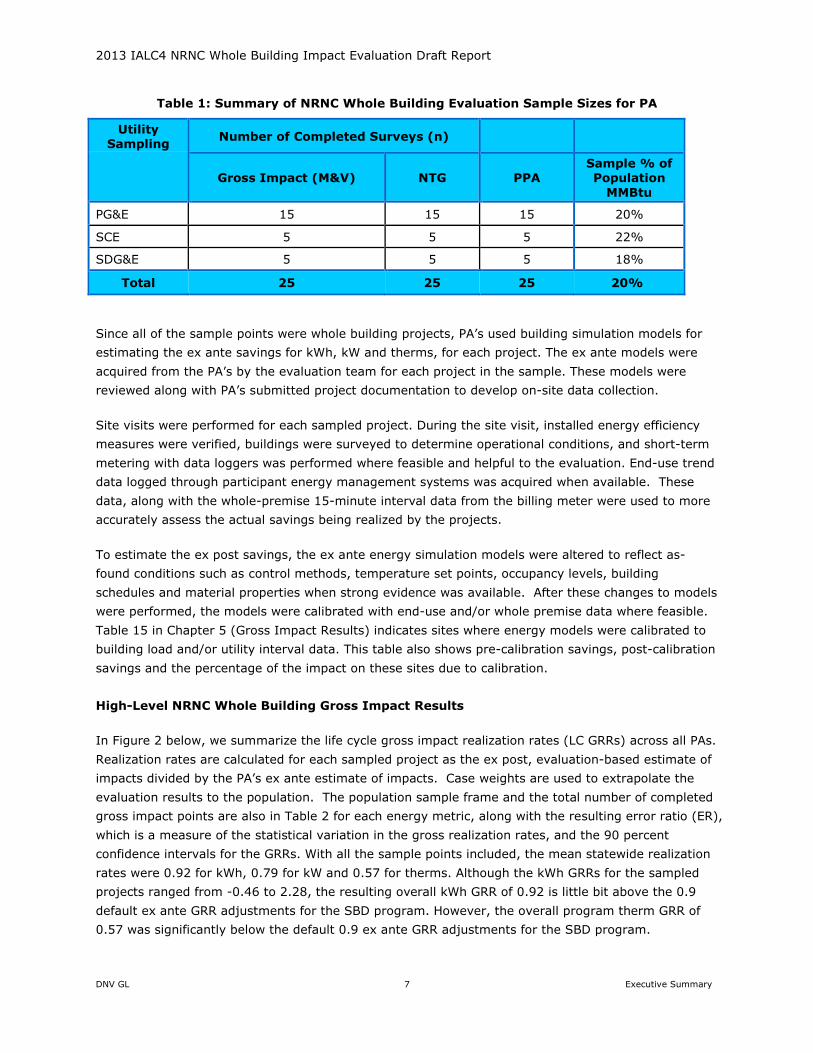
Table 1 below. This sample accounts for 20% of the total NRNC Whole Building ex ante statewide
source MMBTU savings.
2013 IALC4 NRNC Whole Building Impact Evaluation Draft Report
DNV GL 7 Executive Summary
Table 1: Summary of NRNC Whole Building Evaluation Sample Sizes for PA
Utility Sampling
Number of Completed Surveys (n)
Gross Impact (M&V) NTG PPA Sample % of Population
MMBtu
PG&E 15 15 15 20%
SCE 5 5 5 22%
SDG&E 5 5 5 18%
Total 25 25 25 20%
Since all of the sample points were whole building projects, PA’s used building simulation models for
estimating the ex ante savings for kWh, kW and therms, for each project. The ex ante models were
acquired from the PA’s by the evaluation team for each project in the sample. These models were
reviewed along with PA’s submitted project documentation to develop on-site data collection.
Site visits were performed for each sampled project. During the site visit, installed energy efficiency
measures were verified, buildings were surveyed to determine operational conditions, and short-term
metering with data loggers was performed where feasible and helpful to the evaluation. End-use trend
data logged through participant energy management systems was acquired when available. These
data, along with the whole-premise 15-minute interval data from the billing meter were used to more
accurately assess the actual savings being realized by the projects.
To estimate the ex post savings, the ex ante energy simulation models were altered to reflect as-
found conditions such as control methods, temperature set points, occupancy levels, building
schedules and material properties when strong evidence was available. After these changes to models
were performed, the models were calibrated with end-use and/or whole premise data where feasible.
Table 15 in Chapter 5 (Gross Impact Results) indicates sites where energy models were calibrated to
building load and/or utility interval data. This table also shows pre-calibration savings, post-calibration
savings and the percentage of the impact on these sites due to calibration.
High-Level NRNC Whole Building Gross Impact Results
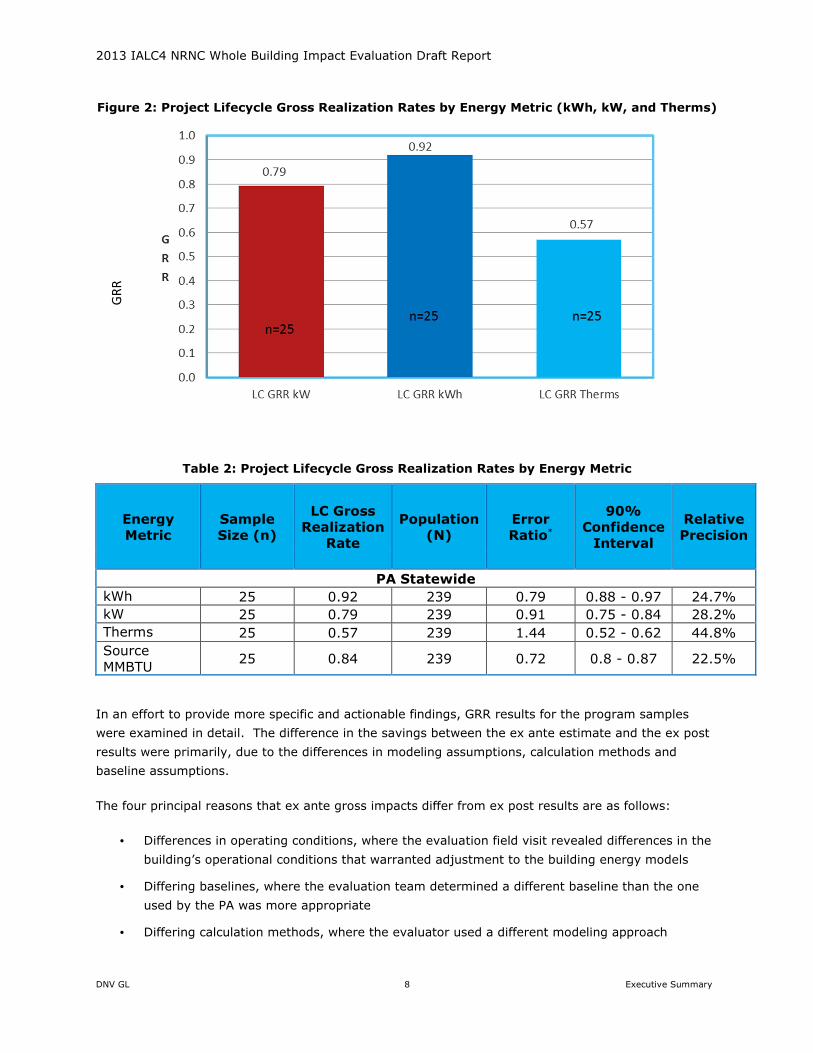
In Figure 2 below, we summarize the life cycle gross impact realization rates (LC GRRs) across all PAs.
Realization rates are calculated for each sampled project as the ex post, evaluation-based estimate of
impacts divided by the PA’s ex ante estimate of impacts. Case weights are used to extrapolate the
evaluation results to the population. The population sample frame and the total number of completed
gross impact points are also in Table 2 for each energy metric, along with the resulting error ratio (ER),
which is a measure of the statistical variation in the gross realization rates, and the 90 percent
confidence intervals for the GRRs. With all the sample points included, the mean statewide realization
rates were 0.92 for kWh, 0.79 for kW and 0.57 for therms. Although the kWh GRRs for the sampled
projects ranged from -0.46 to 2.28, the resulting overall kWh GRR of 0.92 is little bit above the 0.9
default ex ante GRR adjustments for the SBD program. However, the overall program therm GRR of
0.57 was significantly below the default 0.9 ex ante GRR adjustments for the SBD program.
2013 IALC4 NRNC Whole Building Impact Evaluation Draft Report
DNV GL 8 Executive Summary
Figure 2: Project Lifecycle Gross Realization Rates by Energy Metric (kWh, kW, and Therms)
Table 2: Project Lifecycle Gross Realization Rates by Energy Metric
Energy
Metric
Sample
Size (n)
LC Gross
Realization
Rate
Population
(N)
Error
Ratio*
90%
Confidence
Interval
Relative
Precision
PA Statewide
kWh 25 0.92 239 0.79 0.88 - 0.97 24.7%
kW 25 0.79 239 0.91 0.75 - 0.84 28.2%
Therms 25 0.57 239 1.44 0.52 - 0.62 44.8%
Source
MMBTU 25 0.84 239 0.72 0.8 - 0.87 22.5%
In an effort to provide more specific and actionable findings, GRR results for the program samples
were examined in detail. The difference in the savings between the ex ante estimate and the ex post
results were primarily, due to the differences in modeling assumptions, calculation methods and
baseline assumptions.
The four principal reasons that ex ante gross impacts differ from ex post results are as follows:
• Differences in operating conditions, where the evaluation field visit revealed differences in the
building’s operational conditions that warranted adjustment to the building energy models
• Differing baselines, where the evaluation team determined a different baseline than the one
used by the PA was more appropriate
• Differing calculation methods, where the evaluator used a different modeling approach
G
RR

2013 IALC4 NRNC Whole Building Impact Evaluation Draft Report
DNV GL 9 Executive Summary
• Model calibration3, where models were adjusted to calibrate model energy using billing-meter
or end-use data
These four discrepancy factors explain most of the differences in ex ante savings and ex post results.
A detailed investigation of all eight discrepancy factors is found in Chapter 5.
High Level Custom Net-to-Gross Results
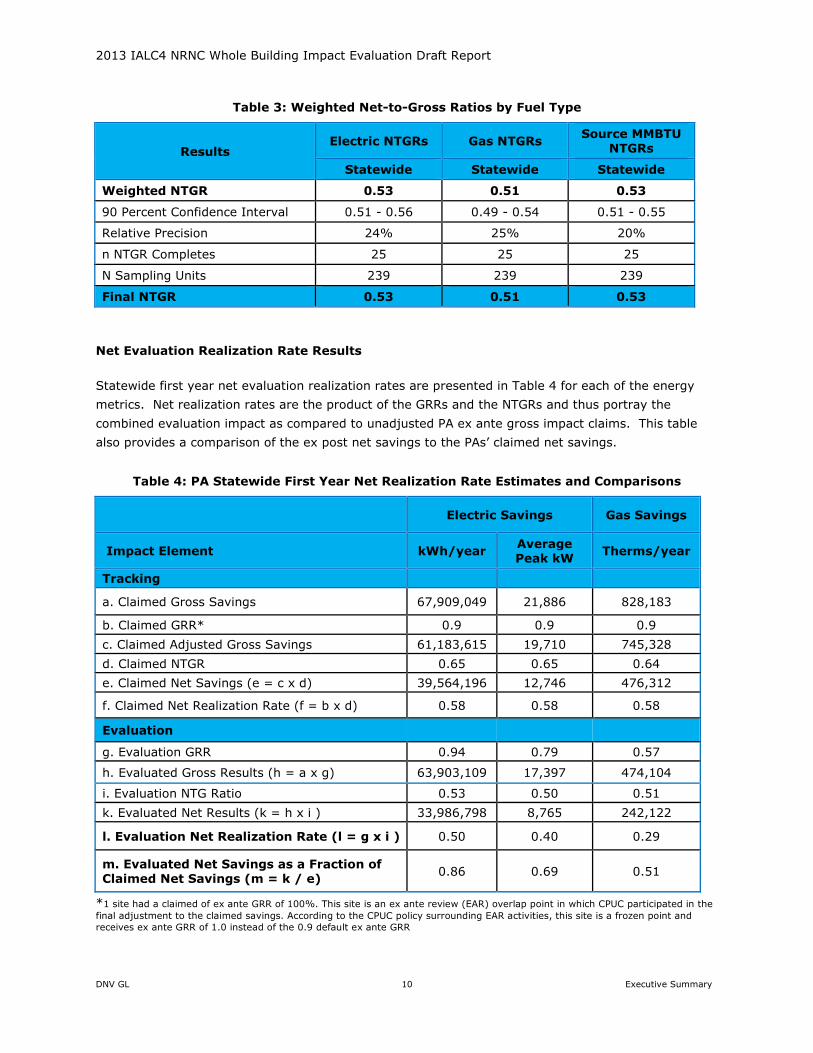
Statewide NTG results are presented in Figure 3 and Table 3. Evaluation net-to-gross ratio (NTGR)
results reveal that a moderate level free ridership has persisted into this program cycle. On a
statewide basis, the NTGR for Whole Building program is estimated at 0.53 for kWh and 0.51 for
therms and 0.53 based on source MMBTU which was the basis of sample design.
Figure 3: Weighted Net-to-Gross Ratios by Fuel Type Statewide
3 This discrepancy is primarily due to calibrating the model with either end-use or/and billing data.
2013 IALC4 NRNC Whole Building Impact Evaluation Draft Report
DNV GL 10 Executive Summary
Table 3: Weighted Net-to-Gross Ratios by Fuel Type
Results Electric NTGRs Gas NTGRs
Source MMBTU NTGRs
Statewide Statewide Statewide
Weighted NTGR 0.53 0.51 0.53
90 Percent Confidence Interval 0.51 - 0.56 0.49 - 0.54 0.51 - 0.55
Relative Precision 24% 25% 20%
n NTGR Completes 25 25 25
N Sampling Units 239 239 239
Final NTGR 0.53 0.51 0.53
Net Evaluation Realization Rate Results
Statewide first year net evaluation realization rates are presented in Table 4 for each of the energy
metrics. Net realization rates are the product of the GRRs and the NTGRs and thus portray the
combined evaluation impact as compared to unadjusted PA ex ante gross impact claims. This table
also provides a comparison of the ex post net savings to the PAs’ claimed net savings.
Table 4: PA Statewide First Year Net Realization Rate Estimates and Comparisons
Electric Savings Gas Savings
Impact Element kWh/year Average Peak kW
Therms/year
Tracking
a. Claimed Gross Savings 67,909,049 21,886 828,183
b. Claimed GRR* 0.9 0.9 0.9
c. Claimed Adjusted Gross Savings 61,183,615 19,710 745,328
d. Claimed NTGR 0.65 0.65 0.64
e. Claimed Net Savings (e = c x d) 39,564,196 12,746 476,312
f. Claimed Net Realization Rate (f = b x d) 0.58 0.58 0.58
Evaluation
g. Evaluation GRR 0.94 0.79 0.57
h. Evaluated Gross Results (h = a x g) 63,903,109 17,397 474,104
i. Evaluation NTG Ratio 0.53 0.50 0.51
k. Evaluated Net Results (k = h x i ) 33,986,798 8,765 242,122
l. Evaluation Net Realization Rate (l = g x i ) 0.50 0.40 0.29
m. Evaluated Net Savings as a Fraction of Claimed Net Savings (m = k / e)
0.86 0.69 0.51
*1 site had a claimed of ex ante GRR of 100%. This site is an ex ante review (EAR) overlap point in which CPUC participated in the
final adjustment to the claimed savings. According to the CPUC policy surrounding EAR activities, this site is a frozen point and
receives ex ante GRR of 1.0 instead of the 0.9 default ex ante GRR

2013 IALC4 NRNC Whole Building Impact Evaluation Draft Report
DNV GL 11 Executive Summary
Summary of Findings and Recommendations
This report provides a range of findings and recommendations aimed at improving NRNC Whole
Building program performance and supporting CPUC and PA program and policy enhancements for this
important element of the PAs’ energy efficiency portfolios. Findings and recommendations were
developed from each of the primary analysis activities. Extensive overarching findings and
recommendations are presented in Chapter 7 (Net to Gross) and Chapter 8 (Findings and
Recommendations) of this report. At a summary level, the detailed recommendations in this report fall
into the following primary areas:
• To better align ex ante and ex post savings, the PAs should:
o Use appropriate calculation methods, apply as-built building operating conditions, use
applicable Title-24 baseline or Industry Standard Practice (ISP) to improve the savings
estimation, and perform better quality control of the projects.
o Improve adjustments to project savings based on post-installation inspections and
M&V.
• Significant improvements in PA project documentation and tracking data are required to
increase consistency between project files and tracking data and minimize errors in reporting
project claims.
• To reduce continued moderate free ridership, PAs should design, implement, and test program
features and procedural changes focusing on increasing program-induced savings.
2013 IALC4 NRNC Whole Building Impact Evaluation Draft Report
DNV GL 12 Introduction
. INTRODUCTION AND BACKGROUND 2
This report presents the final results from the impact evaluation of 2013 Non-residential New Construction
Savings by Design (SBD) Program administered by Pacific Gas and Electric (PG&E), Southern California
Electric (SCE), San Diego Gas and Electric (SDG&E) and Southern California Gas (SCG). These program
administrators (PAs) implement the SBD programs within their respective service territories. This evaluation
study focuses specifically on non-residential new construction (NRNC) Whole Building projects. This study is
managed by CPUC Energy Division (ED) staff. The study is referenced as the IALC4 work order and is being
conducted under the Industrial Agricultural Large Commercial (IALC) roadmap. The IALC4 NRNC Whole
Building Research Plan was finalized and posted on ED public document website.4
This chapter provides background information and introduces the reader to the SBD Program and whole
building projects evaluated under the IALC4 work order. This chapter also references the research plan and
evaluation architecture at a very high level. In the following subsections, we provide additional study
background, highlight the percentage of portfolio-claimed savings associated with this IALC4 evaluation
effort, and present the study objectives and issues researched.
Background
This impact evaluation focuses on high priority evaluation objectives for the NRNC Whole Building Programs
and projects, and includes independent estimation of program and measure impacts, provision of
recommendations to improve programs, and feedback to support cost-effectiveness analyses, program
planning, and strategic planning.
SBD is the NRNC program administered by the PAs. SBD project savings are estimated via two separate
approaches, the “systems” approach and the “Whole Building” approach. Although interactive effects are
taken into account, the systems approach provides individual system estimates for energy efficiency
measures installed in building systems such as lighting, HVAC, and building shell. Alternatively, the “Whole
Building” approach utilizes building energy simulation models to forecast project-level estimates. This
evaluation was focused solely on the SBD projects that used the Whole Building approach. Systems
approach SBD projects were included in the custom impact evaluation under IALC2.5
4 http://www.energydataweb.com/cpuc/#
5 The Industrial, Agriculture and Large Commercial 2013 Impact Evaluation Report is available at http://www.energydataweb.com/cpuc/.

2013 IALC4 NRNC Whole Building Impact Evaluation Draft Report
DNV GL 13 Introduction
More than 200 hundred new Whole Building projects were completed and claimed by the PAs in the PY 2013
under the NRNC SBD Program. The Whole Building projects implemented within the non-residential new
construction group were very diverse. The size of the projects, the types of installed energy efficiency
measures, and the energy savings of the projects are highly variable across the population.
This evaluation effort investigates NRNC Whole Building claims to be evaluated, identifies those data sources
that were used, estimates the program gross realization rates, determines net-to-gross scores, and provides
qualitative assessments of sampled projects via project practice assessments(PPA).
The NRNC Whole Building gross impact assessment utilized standard M&V approaches to the extent
appropriate and practical, including on-site data collection, monitoring, and analysis for a representative
sample of Whole Building projects. The gross impact analysis: (a) developed ex post estimates of the energy
and demand savings for each project in the sample, and (b) applied those findings back against the full
participant population to obtain population estimates of program impacts. The evaluation team utilized PA
and implementer-collected site-specific information, including M&V data, supplemented by data collected
specifically for this evaluation. The site-level M&V rigor was “enhanced,” and projects were evaluated with
IPMVP option D, Whole Building simulation models that were calibrated to end use and billing data where
feasible.6
In addition, a net-to-gross assessment was conducted using telephone surveys and self-report methods to
derive net program impacts. More information regarding the net-to-gross assessment is found in Section 7
of this report.
The proposed sample sizes for the PY 2013 NRNC Whole Building evaluation are discussed in Section 7. In
brief, a total sample size of 25 gross impact sample points was planned for PY 2013. Project specific M&V
was slated for 25 points. All sample points were included in the gross impact and NTG samples. With 25
gross impact points, the 2013 sample the expected relative precision was 25% at 90% confidence interval,
but the achieved precision for the overall estimate across all three PAs for the PY 2013 cycle was 23% at the
90% confidence level.
This evaluation assessed the NRNC Whole Building projects within SBD program. The energy savings claims
associated with the scope of this evaluation account for about 2.6% percent of the total portfolio electric
savings claims and 1.3 % percent of total portfolio gas savings claims during PY2013. For 2013, the PA
tracking data for the program portfolio has thousands of entries with state-wide savings claims totaling
2,606 GWh and 436 MW for 2013. Statewide gas savings claims total 64 million therms in 2013.
6 From 25 projects, 10 projects were calibrated. Please refer to Table14 in the M&V chapter for calibration details.
2013 IALC4 NRNC Whole Building Impact Evaluation Draft Report
DNV GL 14 Introduction
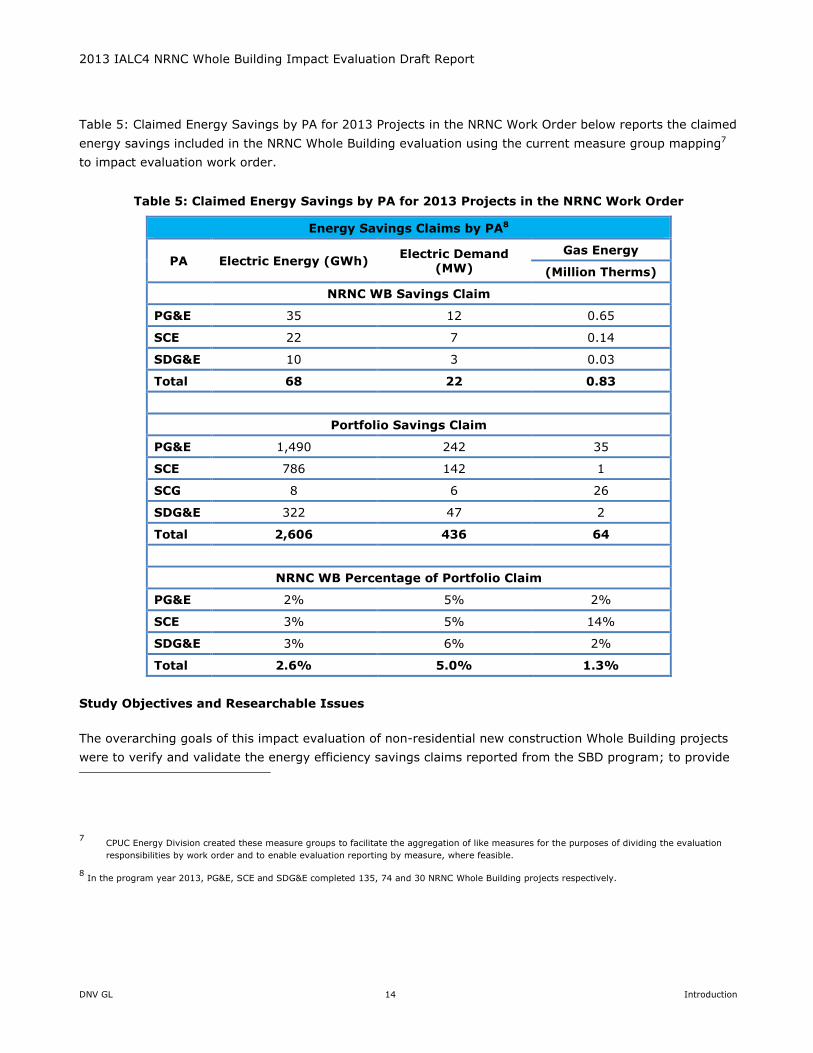
Table 5: Claimed Energy Savings by PA for 2013 Projects in the NRNC Work Order below reports the claimed
energy savings included in the NRNC Whole Building evaluation using the current measure group mapping7
to impact evaluation work order.
Table 5: Claimed Energy Savings by PA for 2013 Projects in the NRNC Work Order
Energy Savings Claims by PA8
PA Electric Energy (GWh) Electric Demand
(MW)
Gas Energy
(Million Therms)
NRNC WB Savings Claim
PG&E 35 12 0.65
SCE 22 7 0.14
SDG&E 10 3 0.03
Total 68 22 0.83
Portfolio Savings Claim
PG&E 1,490 242 35
SCE 786 142 1
SCG 8 6 26
SDG&E 322 47 2
Total 2,606 436 64
NRNC WB Percentage of Portfolio Claim
PG&E 2% 5% 2%
SCE 3% 5% 14%
SDG&E 3% 6% 2%
Total 2.6% 5.0% 1.3%
Study Objectives and Researchable Issues
The overarching goals of this impact evaluation of non-residential new construction Whole Building projects
were to verify and validate the energy efficiency savings claims reported from the SBD program; to provide
7 CPUC Energy Division created these measure groups to facilitate the aggregation of like measures for the purposes of dividing the evaluation
responsibilities by work order and to enable evaluation reporting by measure, where feasible.
8 In the program year 2013, PG&E, SCE and SDG&E completed 135, 74 and 30 NRNC Whole Building projects respectively.

2013 IALC4 NRNC Whole Building Impact Evaluation Draft Report
DNV GL 15 Introduction
feedback on how well program procedures and savings methods comport with energy efficiency policies,
requirements, and expectations; and to provide recommendations on how NRNC Whole Building programs
can be further improved or refined to support overall and NRNC-related energy efficiency goals and
objectives. Gross energy savings, free ridership levels, and net energy savings (in kWh, kW and therms) are
estimated and compared to PA savings claims using evaluation-based realization rates and NTG ratios.
More details on the evaluation priorities9 and the researchable issues for this effort are contained in the
IALC4 NRNC Whole Building Impact Evaluation Plan 2013.10
The priorities for this evaluation effort and the researchable issues that this evaluation examined are
described as follows:
• Estimating the level of achieved gross impact savings, determining what factors drive gross
realization rates, and, as necessary, assessing how realization rates can be improved; the evaluation
will identify issues with respect to impact methods, inputs, and procedures and make
recommendations to improve PA savings estimates and realization rates.
• Estimating the level of free ridership, determining the factors that characterize free ridership, and,
as necessary, providing recommendations on how free ridership might be reduced.
• Providing feedback to PAs to facilitate program design improvements.
• Determining whether the impact estimation methods, inputs, and procedures used by the PAs and
implementers are consistent with the CPUC’s policy directives, decisions, and best practices.
• Determining whether project baseline modeling approaches and simulation tools are appropriate
with respect to California Title 24 building code and industry standard practice where no code is
applicable.
• Collecting data and information to assist with other research or study areas, which could include
measure cost estimation, cost effectiveness, updates to DEER, strategic planning, and future
program planning.
In order to better answer these research questions and extract the greatest value from this study, the
evaluation effort used a combination of approaches that included a gross impact sample supplemented with
desk review (the latter desk reviews are part of what is referred to as the project practice assessment effort)
for all the sample points. Thus, in addition to the M&V-oriented gross impact work described in Chapters 3,
4, and 5, additional project-level evaluation efforts included site-specific project practice assessment efforts.
9 These priorities include energy savings, net to gross ratios and program assessments.
10 http://www.energydataweb.com/cpuc/search.aspx
2013 IALC4 NRNC Whole Building Impact Evaluation Draft Report
DNV GL 16 Introduction
Project practice assessment methods are described in greater detail in Chapter 7. Sample points were
analyzed to:
• Examine and comment on conformance with program procedures (including measure eligibility and
other rules);
• Analyze strengths and weaknesses of project applications; and
• Provide feedback on impact estimation processes.
For example, the project reviews and project practice assessment (PPA) examined whether the Title24
building codes were appropriate and program eligibility rules were consistent with overarching regulatory
guidance and program rules and whether calculation methods and inputs were appropriate. Some other
assessment categories included whether the PAs use appropriate incremental costs and incentive caps for
the project and whether the measure EULs were appropriately assigned to each project. PPA forms are
structured in a manner consistent with claims review requirements that are part of ESPI.
Given the expected range of error ratios (coefficient of variation for a ratio estimator) for the gross
realization rates (roughly 0.6 to 1.0 based on the 2010-2012 custom impact evaluation), and the small
number of impact (M&V) and NTG points implemented, no sampling sub-domains could be supported for the
2013 study. Since the IALC4 NRNC evaluation was expected to provide results at the statewide level, M&V
and NTG samples were designed and implemented at the statewide level.
To allow evaluation of both electric and gas projects in a single domain, all the PAs electric savings (kWh)
and gas savings (therms) at the project level were converted into source energy (MMBtu) savings for
stratification and sampling purposes.11
Structure of the Report
Table 6 shows the overall organizational structure of this report. The findings and recommendations from
this evaluation have been summarized in Chapter 8, and explained in more detail in Chapters 5, 6 and 7.
Readers seeking a more comprehensive assessment of opportunities for program improvement are therefore
encouraged to read these particular chapters.
11 Conversion rates obtained from “2001 Energy Efficiency Standards for Residential and Non-residential Buildings, California Energy Commission,”
June 2001: 1 kWh = 10,239 Btu source energy; 1 Therm = 100,000 Btu source energy. 1 MMBtu =1,000,000 Btu.

2013 IALC4 NRNC Whole Building Impact Evaluation Draft Report
DNV GL 17 Introduction
Table 6: Overall Organizational Structure of Report
Section # Title Content
1 Executive Summary Summary of results and high level findings
2 Introduction and Background
Evaluation objectives, research issues, and savings claims
3 Sample Design Sampling design and associated issues
4 Methods Approaches to gross impact determination, on-site M&V
activities, NTG surveys, and lower rigor assessment (desk review) activities
5 Gross Impact Results
Gross impacts and realization rates, measure and program differentiation, new construction highlights
6 Net Impact Results Net of free ridership ratios and results, spillover results, net realization rates and NTG result drivers
7 PPA Results Program assessments based on project documentation review using the lower rigor desk review approach
8 Detailed Findings and Recommendations
Presented by topic area, including operating conditions,
baseline issues, calculation methods, cross-cutting, net-to-gross/program influence, and lower rigor program related assessments
2013 IALC4 NRNC Whole Building Impact Evaluation Draft Report
DNV GL 18 Sample Design
. SAMPLE DESIGN 3
This chapter presents an overview and summary of the sample design used for the IALC4 NRNC Whole
Building impact evaluation. For the program year 2013, 25 whole building projects were sampled for this
study. These 25 projects were evaluated for gross and net savings and there were no other assessments of
gross or net set savings outside of this 25 project sample.
According to the sample design, the 2013 population was divided into three strata using the total source
MMBtu savings of each sampling unit (defined as a project). For this sample design, Stratum 1 contains the
largest projects and Stratum 3 contains the smallest projects. Projects were selected randomly from each
strata to achieve the proposed precision. The strata boundaries were set to optimize the relative precision
for the total source energy savings (MMBtu) estimate of the entire NRNC whole building 2013 population
across all PAs. As is typical in model-based statistical sampling, larger projects are oversampled. Of the 25
M&V points planned for 2013, 16 were allocated to large projects (Strata 1 and 2), and 9 to small projects.
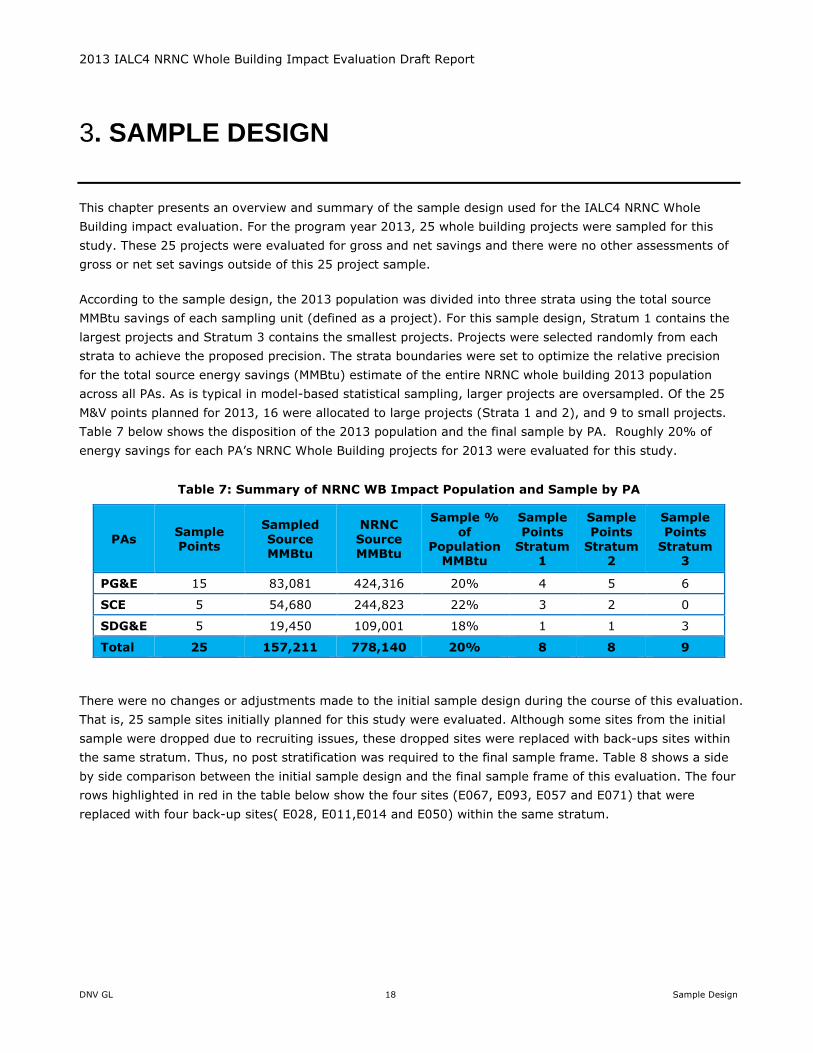
Table 7 below shows the disposition of the 2013 population and the final sample by PA. Roughly 20% of
energy savings for each PA’s NRNC Whole Building projects for 2013 were evaluated for this study.
Table 7: Summary of NRNC WB Impact Population and Sample by PA
PAs Sample Points
Sampled Source MMBtu
NRNC Source MMBtu
Sample %
of Population
MMBtu
Sample
Points Stratum
1
Sample
Points Stratum
2
Sample
Points Stratum
3
PG&E 15 83,081 424,316 20% 4 5 6
SCE 5 54,680 244,823 22% 3 2 0
SDG&E 5 19,450 109,001 18% 1 1 3
Total 25 157,211 778,140 20% 8 8 9
There were no changes or adjustments made to the initial sample design during the course of this evaluation.
That is, 25 sample sites initially planned for this study were evaluated. Although some sites from the initial
sample were dropped due to recruiting issues, these dropped sites were replaced with back-ups sites within
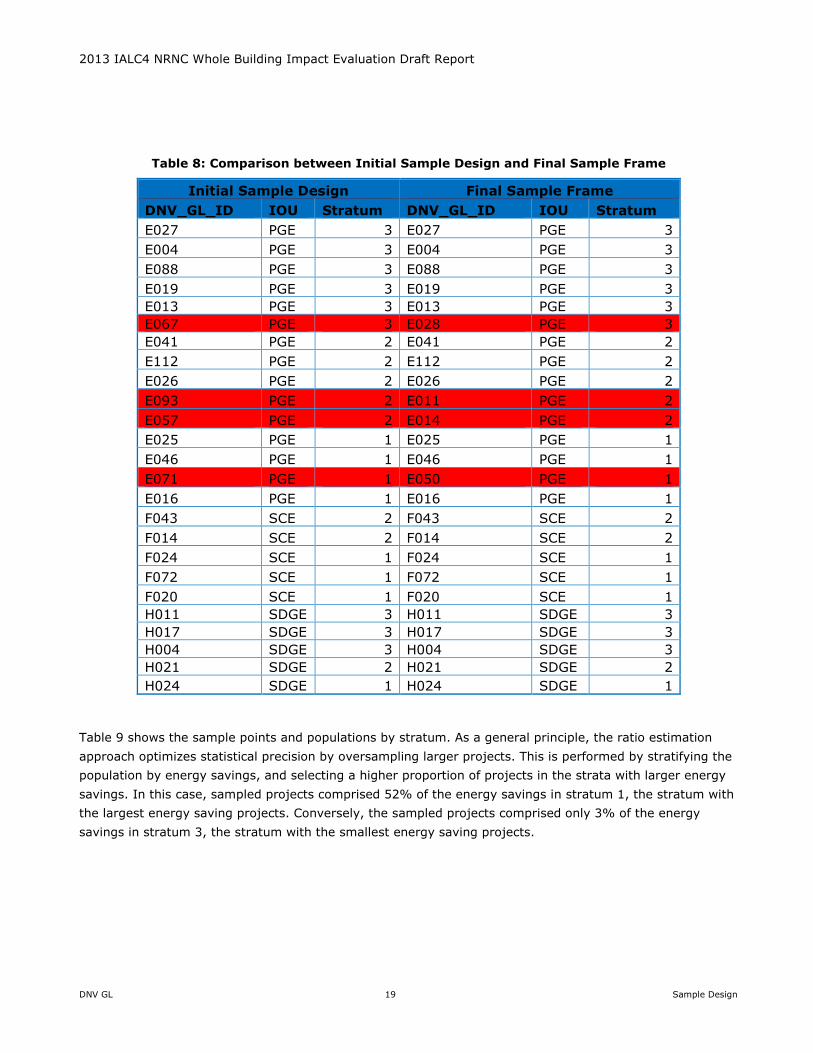
the same stratum. Thus, no post stratification was required to the final sample frame. Table 8 shows a side
by side comparison between the initial sample design and the final sample frame of this evaluation. The four
rows highlighted in red in the table below show the four sites (E067, E093, E057 and E071) that were
replaced with four back-up sites( E028, E011,E014 and E050) within the same stratum.
2013 IALC4 NRNC Whole Building Impact Evaluation Draft Report
DNV GL 19 Sample Design
Table 8: Comparison between Initial Sample Design and Final Sample Frame
Initial Sample Design Final Sample Frame
DNV_GL_ID IOU Stratum DNV_GL_ID IOU Stratum
E027 PGE 3 E027 PGE 3
E004 PGE 3 E004 PGE 3
E088 PGE 3 E088 PGE 3
E019 PGE 3 E019 PGE 3
E013 PGE 3 E013 PGE 3
E067 PGE 3 E028 PGE 3
E041 PGE 2 E041 PGE 2
E112 PGE 2 E112 PGE 2
E026 PGE 2 E026 PGE 2
E093 PGE 2 E011 PGE 2
E057 PGE 2 E014 PGE 2
E025 PGE 1 E025 PGE 1
E046 PGE 1 E046 PGE 1
E071 PGE 1 E050 PGE 1
E016 PGE 1 E016 PGE 1
F043 SCE 2 F043 SCE 2
F014 SCE 2 F014 SCE 2
F024 SCE 1 F024 SCE 1
F072 SCE 1 F072 SCE 1
F020 SCE 1 F020 SCE 1
H011 SDGE 3 H011 SDGE 3
H017 SDGE 3 H017 SDGE 3
H004 SDGE 3 H004 SDGE 3
H021 SDGE 2 H021 SDGE 2
H024 SDGE 1 H024 SDGE 1
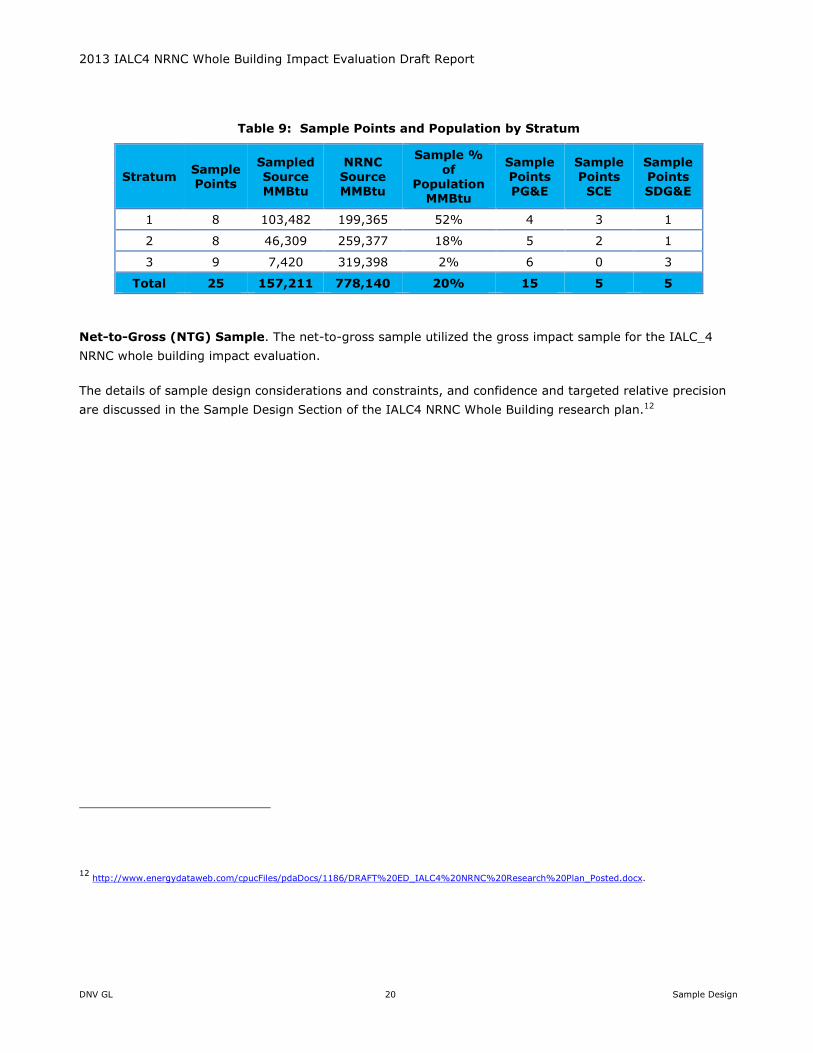
Table 9 shows the sample points and populations by stratum. As a general principle, the ratio estimation
approach optimizes statistical precision by oversampling larger projects. This is performed by stratifying the
population by energy savings, and selecting a higher proportion of projects in the strata with larger energy
savings. In this case, sampled projects comprised 52% of the energy savings in stratum 1, the stratum with
the largest energy saving projects. Conversely, the sampled projects comprised only 3% of the energy
savings in stratum 3, the stratum with the smallest energy saving projects.
2013 IALC4 NRNC Whole Building Impact Evaluation Draft Report
DNV GL 20 Sample Design
Table 9: Sample Points and Population by Stratum
Stratum Sample Points
Sampled Source MMBtu
NRNC Source MMBtu
Sample %
of Population
MMBtu
Sample Points PG&E
Sample Points
SCE
Sample Points SDG&E
1 8 103,482 199,365 52% 4 3 1
2 8 46,309 259,377 18% 5 2 1
3 9 7,420 319,398 2% 6 0 3
Total 25 157,211 778,140 20% 15 5 5
Net-to-Gross (NTG) Sample. The net-to-gross sample utilized the gross impact sample for the IALC_4
NRNC whole building impact evaluation.
The details of sample design considerations and constraints, and confidence and targeted relative precision
are discussed in the Sample Design Section of the IALC4 NRNC Whole Building research plan.12
12 http://www.energydataweb.com/cpucFiles/pdaDocs/1186/DRAFT%20ED_IALC4%20NRNC%20Research%20Plan_Posted.docx.

2013 IALC4 NRNC Whole Building Impact Evaluation Draft Report
DNV GL 21 Methods
. METHODS 4
This chapter addresses the methods used for the gross impact, net impact, and PPA efforts including an
examination of data sources and constraints associated with the evaluation methodology.
This NRNC Whole Building Impact Evaluation study was guided by the California Energy Efficiency Evaluation
Protocols: Technical, Methodological, and Reporting Requirements for Evaluation Professionals.13 The
following protocols were primarily used, along with other guidance provided by the CPUC:
• Impact Evaluation Protocol
• Gross Energy Impact Protocol
• Gross Demand Impact Protocol
• Participant Net Impact Protocol or Net-to-Gross Guidance Document if Applicable
• Measurement and Verification Protocol
• Sampling and Uncertainty Protocol
• Evaluation Reporting Protocol
The evaluation approaches were consistently applied. However, given the heterogeneity of the projects,
specialized and unique approaches were also utilized on a project-specific basis where necessary.
The NRNC Whole Building gross impact assessment involved standard M&V approaches to the extent
appropriate and practical, including on-site data collection, monitoring, and analysis for a representative
sample of Whole Building projects. The gross impact analysis: (a) developed ex post estimates of the energy
and demand savings for each project in the sample, and (b) applied those findings back against the full
participant population to obtain population estimates of program impacts. The evaluation team utilized PA
and implementer-collected site-specific information, including project-implementer’s submitted project
files/documentation, supplemented by data collected for this evaluation. The site-level M&V rigor was
“enhanced,” and projects were evaluated with IPMVP option D, Whole Building simulation models calibrated
to end use and billing data where feasible.
In addition, a net-to-gross assessment was implemented using telephone surveys and self-report methods
to derive net program impacts.
13 Available at http://www.calmac.org/events/EvaluatorsProtocols_Final_AdoptedviaRuling_06-19-2006.pdf.

2013 IALC4 NRNC Whole Building Impact Evaluation Draft Report
DNV GL 22 Methods
Also, project-level assessments were conducted using the PPA approach developed for all gross sample
points. The PPA approach provides cost-effective, impact-oriented findings and feedback on the NRNC Whole
Building program.
The details of gross and net evaluation methodologies, M&V activities, development of data collection
instrument, end-use metering, assessment of baseline, evaluation rigor levels, reliability, bias, uncertainty
and data sources and constraints are discussed in M&V Chapter of the IALC4 NRNC Whole Building research
plan.14
14 http://www.energydataweb.com/cpucFiles/pdaDocs/1186/DRAFT%20ED_IALC4%20NRNC%20Research%20Plan_Posted.docx.
2013 IALC4 NRNC Whole Building Impact Evaluation Draft Report
DNV GL 23 Gross Impact Results
. GROSS IMPACT RESULTS 5
This chapter presents quantitative and qualitative gross impact results for the 2013 IALC4 NRNC Whole
Building impact evaluation. Gross impact realization rates (GRRs) are presented in this chapter using
statewide and strata combinations of electric energy (kWh), electric demand (kW), gas energy (therms) and
source energy (MMBTU) metrics.15
Program-Level Gross Impact Summary
Weighted gross impact results are presented in this section by stratum. Gross impact evaluation results are
supported by 25 M&V sample points.
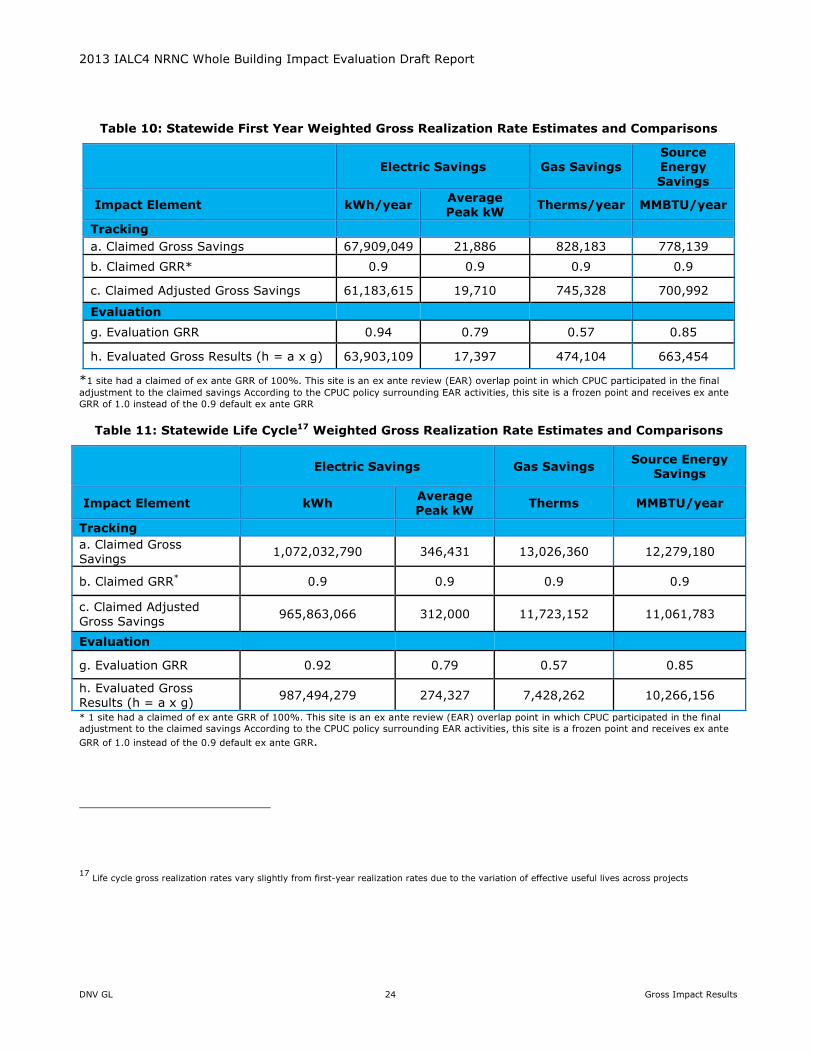
Table 10: Statewide First Year Weighted Gross Realization Rate Estimates and Comparisons and Table 11
show the first year and lifecycle PA Statewide ex ante claimed gross realization rate (GRR) estimates and
comparisons to the ex post evaluated GRR. Table 12 and Table 13 present the evaluated statewide first year
and lifecycle gross realization rates (GRR) with statistical boundaries. The life cycle savings are calculated by
multiplying the first year savings by the estimated useful life (EUL) of the whole building measure(s). Note
that the evaluated first year and life cycle GRR16 values are different because the ex ante (tracking) EULs
are different from the ex post (evaluated) EULs.
15 Conversion rates obtained from “2001 Energy Efficiency Standards for Residential and Non-residential Buildings, California Energy Commission,”
June 2001: 1 kWh = 10,239 Btu source energy; 1 Therm = 100,000 Btu source energy. 1 MMBtu =1,000,000 Btu.
16 PG&E did not submit EUL values in the tracking data. Hence, the evaluation team used the program EUL from the PY2013 Savings By Design E3
Calculator to estimate life cycle ex ante savings for PG&E projects.
2013 IALC4 NRNC Whole Building Impact Evaluation Draft Report
DNV GL 24 Gross Impact Results
Table 10: Statewide First Year Weighted Gross Realization Rate Estimates and Comparisons
Electric Savings Gas Savings Source Energy Savings
Impact Element kWh/year Average Peak kW
Therms/year MMBTU/year
Tracking
a. Claimed Gross Savings 67,909,049 21,886 828,183 778,139
b. Claimed GRR* 0.9 0.9 0.9 0.9
c. Claimed Adjusted Gross Savings 61,183,615 19,710 745,328 700,992
Evaluation
g. Evaluation GRR 0.94 0.79 0.57 0.85
h. Evaluated Gross Results (h = a x g) 63,903,109 17,397 474,104 663,454
*1 site had a claimed of ex ante GRR of 100%. This site is an ex ante review (EAR) overlap point in which CPUC participated in the final
adjustment to the claimed savings According to the CPUC policy surrounding EAR activities, this site is a frozen point and receives ex ante
GRR of 1.0 instead of the 0.9 default ex ante GRR
Table 11: Statewide Life Cycle17 Weighted Gross Realization Rate Estimates and Comparisons
Electric Savings Gas Savings Source Energy
Savings
Impact Element kWh Average Peak kW
Therms MMBTU/year
Tracking
a. Claimed Gross Savings
1,072,032,790 346,431 13,026,360 12,279,180
b. Claimed GRR* 0.9 0.9 0.9 0.9
c. Claimed Adjusted Gross Savings
965,863,066 312,000 11,723,152 11,061,783
Evaluation
g. Evaluation GRR 0.92 0.79 0.57 0.85
h. Evaluated Gross Results (h = a x g)
987,494,279 274,327 7,428,262 10,266,156
* 1 site had a claimed of ex ante GRR of 100%. This site is an ex ante review (EAR) overlap point in which CPUC participated in the final
adjustment to the claimed savings According to the CPUC policy surrounding EAR activities, this site is a frozen point and receives ex ante
GRR of 1.0 instead of the 0.9 default ex ante GRR.
17 Life cycle gross realization rates vary slightly from first-year realization rates due to the variation of effective useful lives across projects
2013 IALC4 NRNC Whole Building Impact Evaluation Draft Report
DNV GL 25 Gross Impact Results
Table 12: Statewide First Year Weighted Gross Realization Rates
Energy Metric
Sample Size (n)
Gross Realization
Rate
Population (N)
Error Ratio*
90% Confidence
Interval
RR > 1.5
RR = 0
RR <
0**
PA Statewide
kWh 25 0.94 239 0.81 0.89 - 0.99 4 0 1
kW 25 0.79 239 0.90 0.75 - 0.84 3 0 2
Therms 25 0.57 239 1.38 0.52 - 0.62 3 5 5 *A measure of the statistical variation in the gross realization rates. ** For three sites with RR<0 the ex ante savings estimates were negative but, the ex post results showed positive savings. Reporting a site-specific GRR in such cases would be meaningless. Positive ex post savings were used while extrapolating savings.
Table 13: Statewide Life Cycle Weighted Gross Realization Rates
Energy Metric
Sampl
e Size (n)
LC Gross
Realization Rate
Population (N)
Error
Ratio*
90%
Confidence Interval
RR > 1.5
RR
= 0
RR < 0**
LC GRR Mean
PA Statewide
kWh 25 0.92 239 0.79 0.88 - 0.97 3 0 1 0.94
kW 25 0.79 239 0.91 0.75 - 0.84 3 0 2 0.79
Therms 25 0.57 239 1.44 0.52 - 0.62 3 5 5 0.57
*A measure of the statistical variation in the gross realization rates ** For three sites with RRs <0 the ex ante savings estimates were negative, but the ex post results showed positive savings. Reporting a site-specific GRR in such cases would be meaningless. Positive ex post savings were used while extrapolating savings.
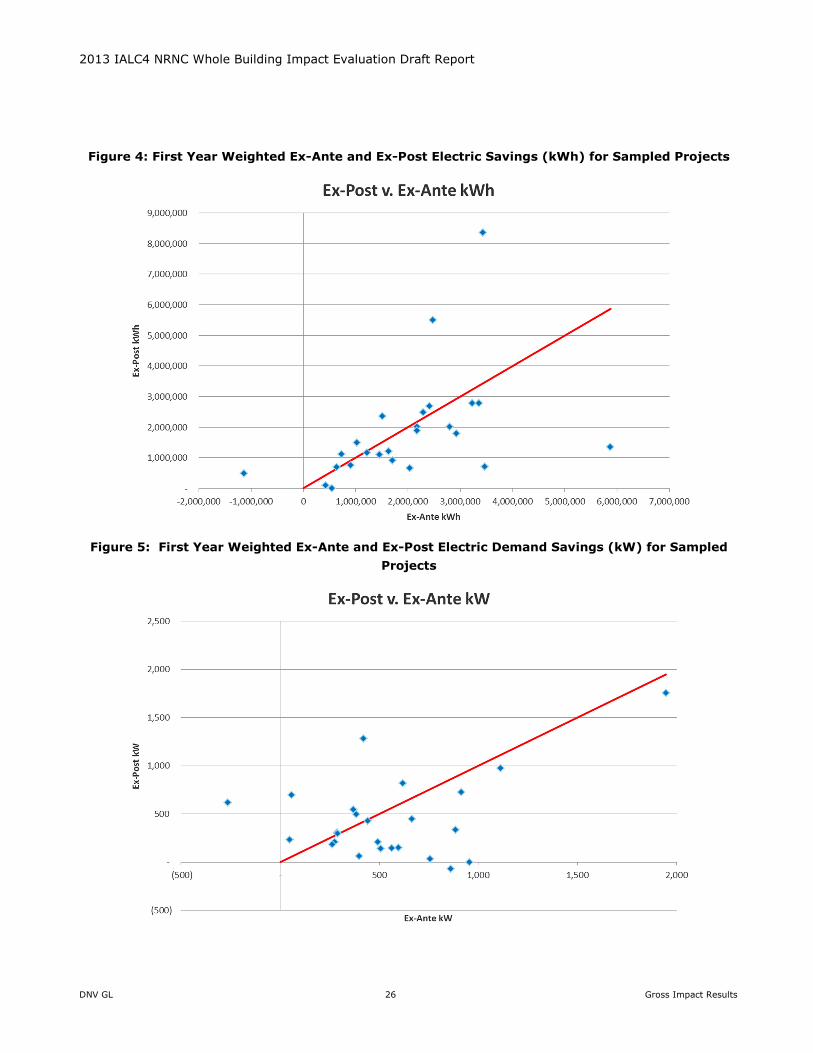
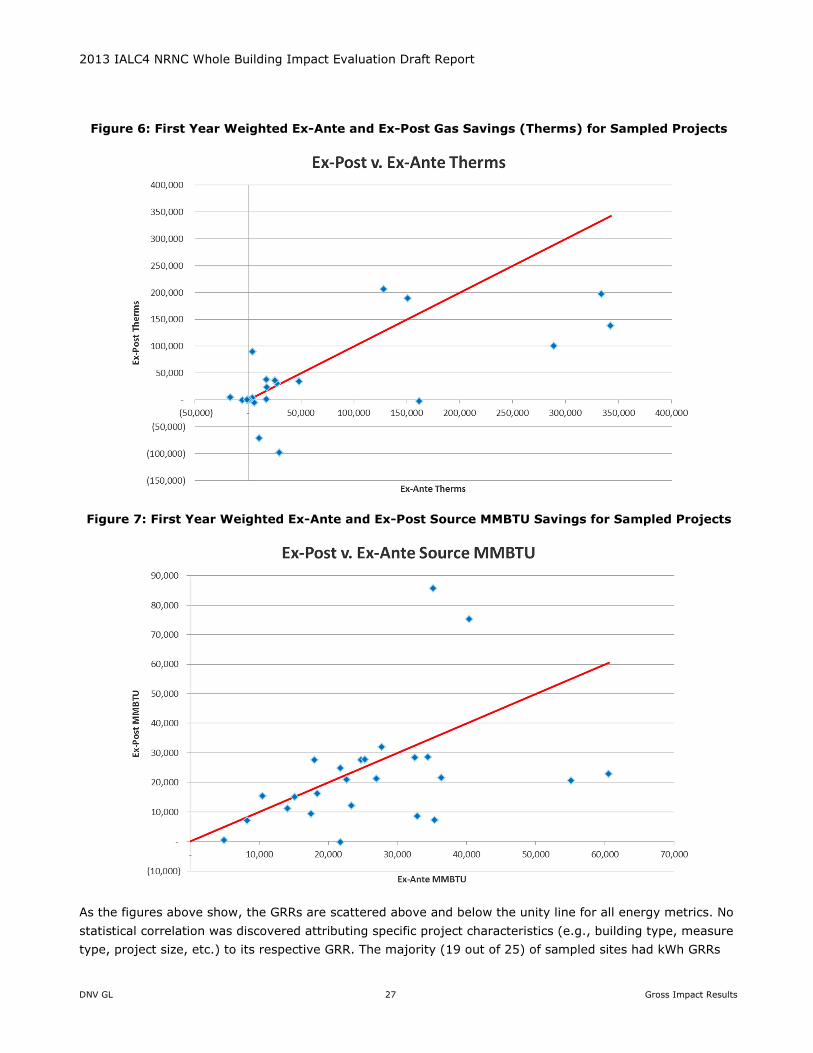
Figure 4, Figure 5, Figure 6, and Figure 7 graphically display weighted ex ante versus ex post savings
estimates for the statewide sample. These figures present the weighted ex ante (tracking system) claimed
savings and the weighted ex post evaluated savings for the M&V sample points for kWh, kW, therms, and
source MMBTU, respectively. The charts also include a unity line, which divides the results into those in
which the project-specific gross realization rates (GRR) were above one (sites above the line) and below one
(sites below the line).
2013 IALC4 NRNC Whole Building Impact Evaluation Draft Report
DNV GL 26 Gross Impact Results
Figure 4: First Year Weighted Ex-Ante and Ex-Post Electric Savings (kWh) for Sampled Projects
Figure 5: First Year Weighted Ex-Ante and Ex-Post Electric Demand Savings (kW) for Sampled
Projects
2013 IALC4 NRNC Whole Building Impact Evaluation Draft Report
DNV GL 27 Gross Impact Results
Figure 6: First Year Weighted Ex-Ante and Ex-Post Gas Savings (Therms) for Sampled Projects
Figure 7: First Year Weighted Ex-Ante and Ex-Post Source MMBTU Savings for Sampled Projects
As the figures above show, the GRRs are scattered above and below the unity line for all energy metrics. No
statistical correlation was discovered attributing specific project characteristics (e.g., building type, measure
type, project size, etc.) to its respective GRR. The majority (19 out of 25) of sampled sites had kWh GRRs
2013 IALC4 NRNC Whole Building Impact Evaluation Draft Report
DNV GL 28 Gross Impact Results
less than one. Ten sampled sites had weighted kW GRR greater than one. Gas energy GRRs appear the most
erratic with about half of the sampled sites having a weighted GRR greater than one. Site-specific
discussion regarding GRR and associated discrepancies are discussed in the next section.
Project-Specific Gross Impact Summary
This section covers site-specific gross impact findings for the 25 M&V sample points. The total ex ante
(tracking) savings claimed for the 25 sampled NRNC sites was 12,372,105 kWh, 3,068.3 kW, and 305,330
therms. The total evaluated (ex post) savings for these 25 sites was 10,333,755 kWh, 2,050.2 kW, and
221,126 therms. The un-weighted18 gross realization rates for the NRNC sites are 84 percent for electric
energy (kWh), 67 percent for electric demand (kW), and 72 percent for gas energy (therms).
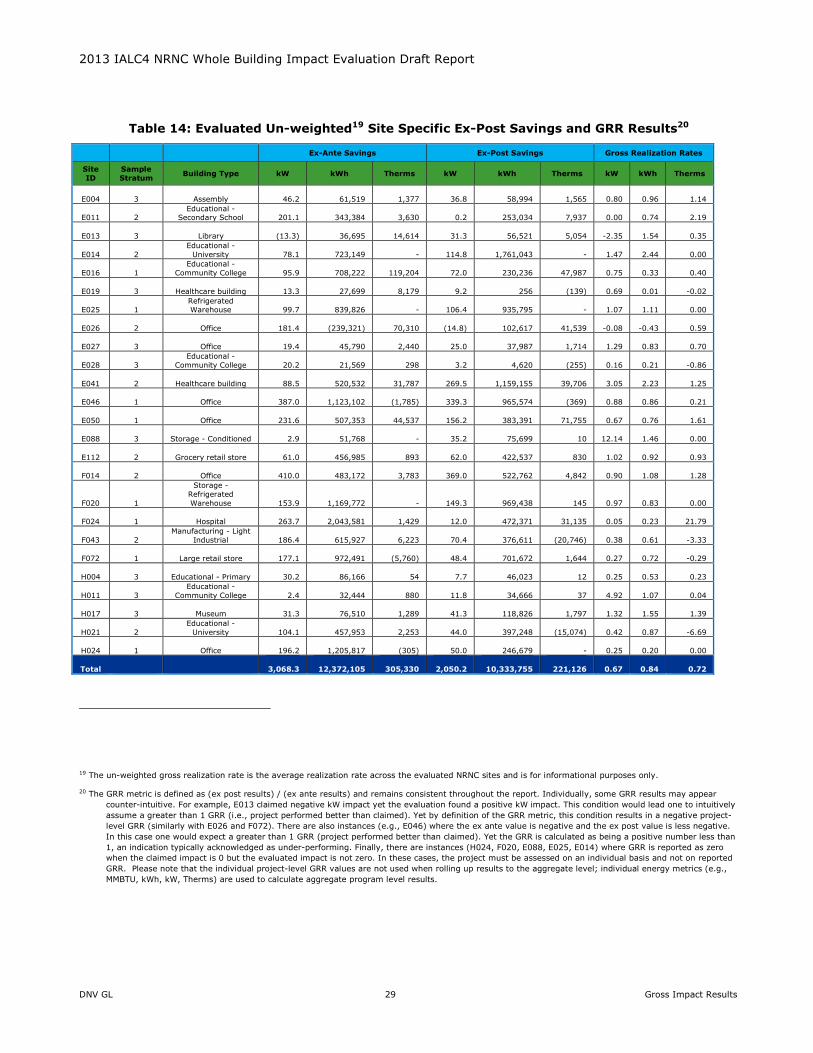
Table 14: Evaluated Un-weighted Site Specific Ex-Post Savings and GRR Results presents ex ante savings,
ex post savings, and GRRs for each fuel metric and all sample points. The table also shows each sample
point’s stratum and unique site ID.
18 The un-weighted gross realization rate is the average realization rate across the evaluated 25 NRNC sites
2013 IALC4 NRNC Whole Building Impact Evaluation Draft Report
DNV GL 29 Gross Impact Results
Table 14: Evaluated Un-weighted19 Site Specific Ex-Post Savings and GRR Results20
Ex-Ante Savings Ex-Post Savings Gross Realization Rates
Site
ID
Sample
Stratum Building Type kW kWh Therms kW kWh Therms kW kWh Therms
E004 3 Assembly
46.2
61,519
1,377
36.8
58,994
1,565 0.80 0.96 1.14
E011 2 Educational -
Secondary School
201.1
343,384
3,630
0.2
253,034
7,937 0.00 0.74 2.19
E013 3 Library
(13.3)
36,695
14,614
31.3
56,521
5,054 -2.35 1.54 0.35
E014 2 Educational -
University
78.1
723,149 -
114.8
1,761,043
- 1.47 2.44 0.00
E016 1 Educational -
Community College
95.9
708,222
119,204
72.0
230,236
47,987 0.75 0.33 0.40
E019 3 Healthcare building
13.3
27,699
8,179
9.2
256
(139) 0.69 0.01 -0.02
E025 1 Refrigerated Warehouse
99.7
839,826 -
106.4
935,795
- 1.07 1.11 0.00
E026 2 Office
181.4
(239,321)
70,310
(14.8)
102,617
41,539 -0.08 -0.43 0.59
E027 3 Office
19.4
45,790
2,440
25.0
37,987
1,714 1.29 0.83 0.70
E028 3 Educational -
Community College
20.2
21,569
298
3.2
4,620
(255) 0.16 0.21 -0.86
E041 2 Healthcare building
88.5
520,532
31,787
269.5
1,159,155
39,706 3.05 2.23 1.25
E046 1 Office
387.0
1,123,102
(1,785)
339.3
965,574
(369) 0.88 0.86 0.21
E050 1 Office
231.6
507,353
44,537
156.2
383,391
71,755 0.67 0.76 1.61
E088 3 Storage - Conditioned
2.9
51,768 -
35.2
75,699
10 12.14 1.46 0.00
E112 2 Grocery retail store
61.0
456,985
893
62.0
422,537
830 1.02 0.92 0.93
F014 2 Office
410.0
483,172
3,783
369.0
522,762
4,842 0.90 1.08 1.28
F020 1
Storage - Refrigerated Warehouse
153.9
1,169,772 -
149.3
969,438
145 0.97 0.83 0.00
F024 1 Hospital
263.7
2,043,581
1,429
12.0
472,371
31,135 0.05 0.23 21.79
F043 2 Manufacturing - Light
Industrial
186.4
615,927
6,223
70.4
376,611
(20,746) 0.38 0.61 -3.33
F072 1 Large retail store
177.1
972,491
(5,760)
48.4
701,672
1,644 0.27 0.72 -0.29
H004 3 Educational - Primary
30.2
86,166
54
7.7
46,023
12 0.25 0.53 0.23
H011 3 Educational -
Community College
2.4
32,444
880
11.8
34,666
37 4.92 1.07 0.04
H017 3 Museum
31.3
76,510
1,289
41.3
118,826
1,797 1.32 1.55 1.39
H021 2 Educational -
University
104.1
457,953
2,253
44.0
397,248
(15,074) 0.42 0.87 -6.69
H024 1 Office
196.2
1,205,817
(305)
50.0
246,679
- 0.25 0.20 0.00
Total
3,068.3
12,372,105
305,330
2,050.2
10,333,755
221,126 0.67 0.84 0.72
19 The un-weighted gross realization rate is the average realization rate across the evaluated NRNC sites and is for informational purposes only.
20 The GRR metric is defined as (ex post results) / (ex ante results) and remains consistent throughout the report. Individually, some GRR results may appear
counter-intuitive. For example, E013 claimed negative kW impact yet the evaluation found a positive kW impact. This condition would lead one to intuitively
assume a greater than 1 GRR (i.e., project performed better than claimed). Yet by definition of the GRR metric, this condition results in a negative project-
level GRR (similarly with E026 and F072). There are also instances (e.g., E046) where the ex ante value is negative and the ex post value is less negative.
In this case one would expect a greater than 1 GRR (project performed better than claimed). Yet the GRR is calculated as being a positive number less than
1, an indication typically acknowledged as under-performing. Finally, there are instances (H024, F020, E088, E025, E014) where GRR is reported as zero
when the claimed impact is 0 but the evaluated impact is not zero. In these cases, the project must be assessed on an individual basis and not on reported
GRR. Please note that the individual project-level GRR values are not used when rolling up results to the aggregate level; individual energy metrics (e.g.,
MMBTU, kWh, kW, Therms) are used to calculate aggregate program level results.
2013 IALC4 NRNC Whole Building Impact Evaluation Draft Report
DNV GL 30 Gross Impact Results
Of the 25 NRNC sample points, 13 of the sample points involved two building occupancy types – education
and office (7 education building types and 6 office building types). The remaining 12 sample points were
distributed among a variety of building types: 1 assembly, 1 grocery retail store, 2 healthcare buildings, 1
hospital, 1 large retail store, 1 library, 1 museum, 1 light industrial building, 2 refrigerated warehouses, and
1 conditioned storage building.
The evaluation team investigated whether there were any meaningful patterns in GRRs among similar
building types. The small number of sample points, especially for a given building type, limited this
assessment. One noteworthy observation involved sample points with refrigeration measures (Site IDs F020,
E025, and E112). These three projects had relatively tight GRR ranges with kWh GRR ranging from 0.83 to
1.11 and kW GRR ranging from 0.97 to 1.07.21 No other significant patterns were observed among the
sample points.
Site E026 has a negative kWh GRR of -0.43; this is actually a result of negative ex ante kWh savings and
positive ex post kWh savings. We found similar results with the Site E013 kW GRR and the Site F072 therm
GRR. These sites had negative ex ante kW and therms and positive ex post kW and therms, respectively.22
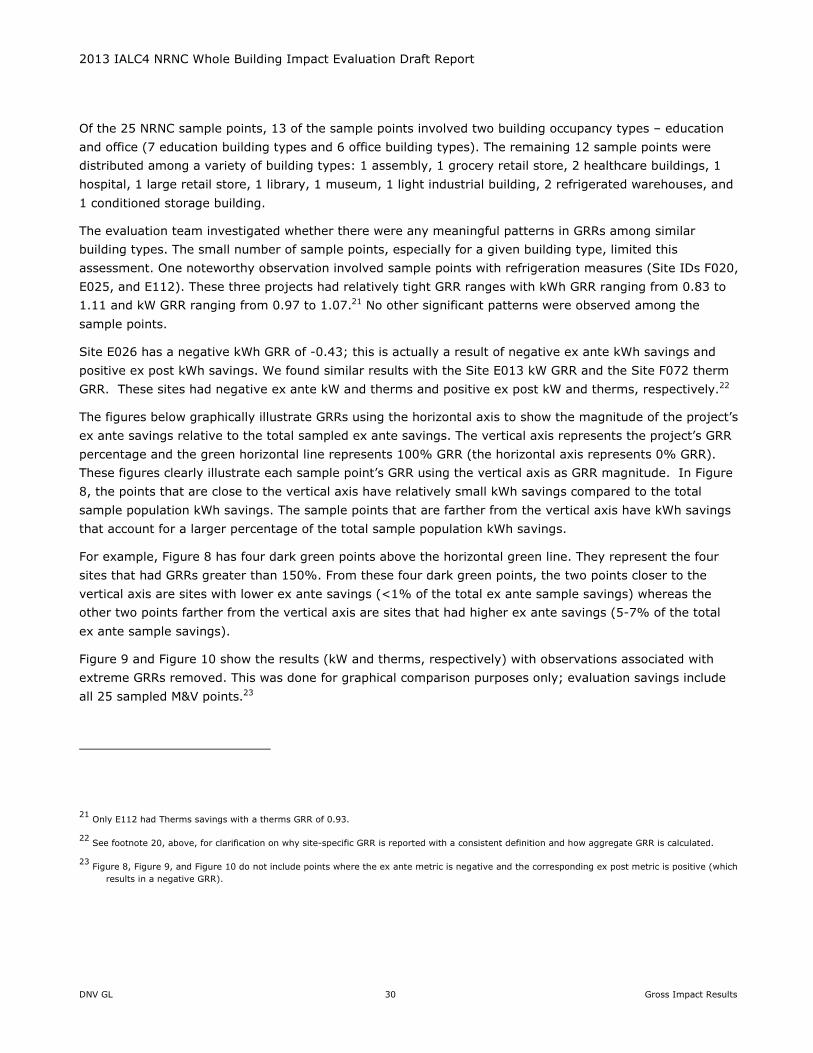
The figures below graphically illustrate GRRs using the horizontal axis to show the magnitude of the project’s
ex ante savings relative to the total sampled ex ante savings. The vertical axis represents the project’s GRR
percentage and the green horizontal line represents 100% GRR (the horizontal axis represents 0% GRR).
These figures clearly illustrate each sample point’s GRR using the vertical axis as GRR magnitude. In Figure
8, the points that are close to the vertical axis have relatively small kWh savings compared to the total
sample population kWh savings. The sample points that are farther from the vertical axis have kWh savings
that account for a larger percentage of the total sample population kWh savings.
For example, Figure 8 has four dark green points above the horizontal green line. They represent the four
sites that had GRRs greater than 150%. From these four dark green points, the two points closer to the
vertical axis are sites with lower ex ante savings (<1% of the total ex ante sample savings) whereas the
other two points farther from the vertical axis are sites that had higher ex ante savings (5-7% of the total
ex ante sample savings).
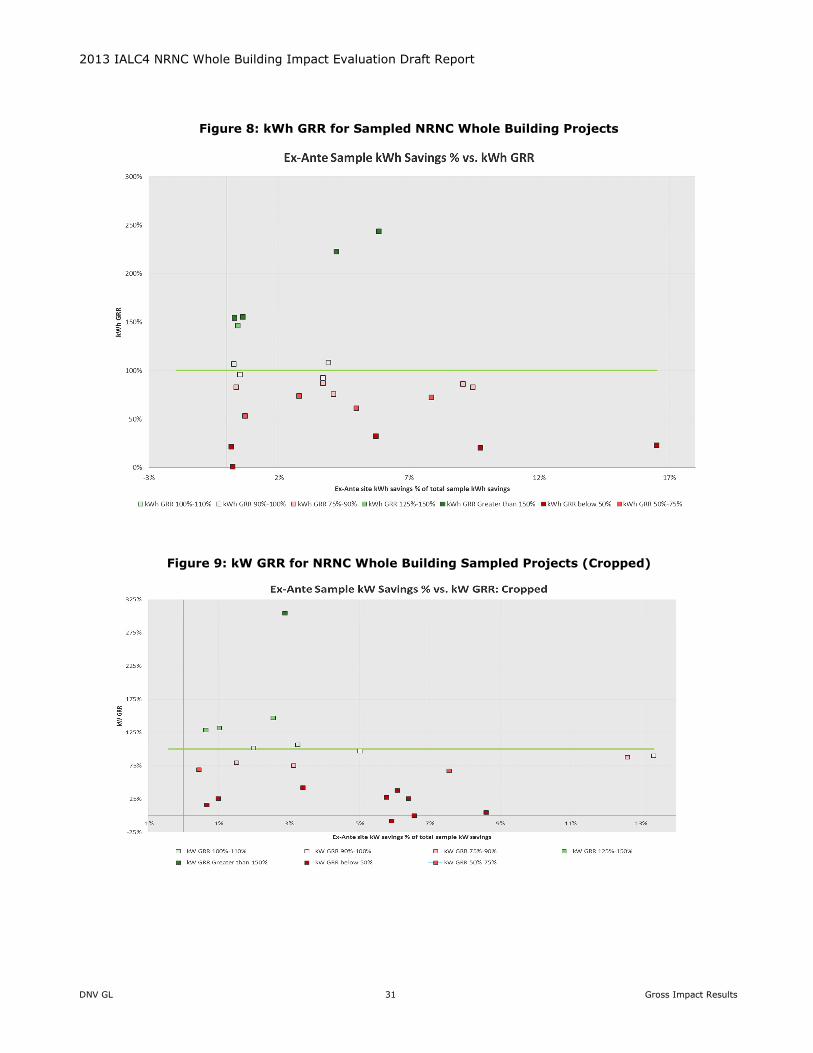
Figure 9 and Figure 10 show the results (kW and therms, respectively) with observations associated with
extreme GRRs removed. This was done for graphical comparison purposes only; evaluation savings include
all 25 sampled M&V points.23
21 Only E112 had Therms savings with a therms GRR of 0.93.
22 See footnote 20, above, for clarification on why site-specific GRR is reported with a consistent definition and how aggregate GRR is calculated.
23 Figure 8, Figure 9, and Figure 10 do not include points where the ex ante metric is negative and the corresponding ex post metric is positive (which
results in a negative GRR).
2013 IALC4 NRNC Whole Building Impact Evaluation Draft Report
DNV GL 31 Gross Impact Results
Figure 8: kWh GRR for Sampled NRNC Whole Building Projects
Figure 9: kW GRR for NRNC Whole Building Sampled Projects (Cropped)
2013 IALC4 NRNC Whole Building Impact Evaluation Draft Report
DNV GL 32 Gross Impact Results
Figure 10: Therms GRR for NRNC Whole Building Sampled Projects (Cropped)24
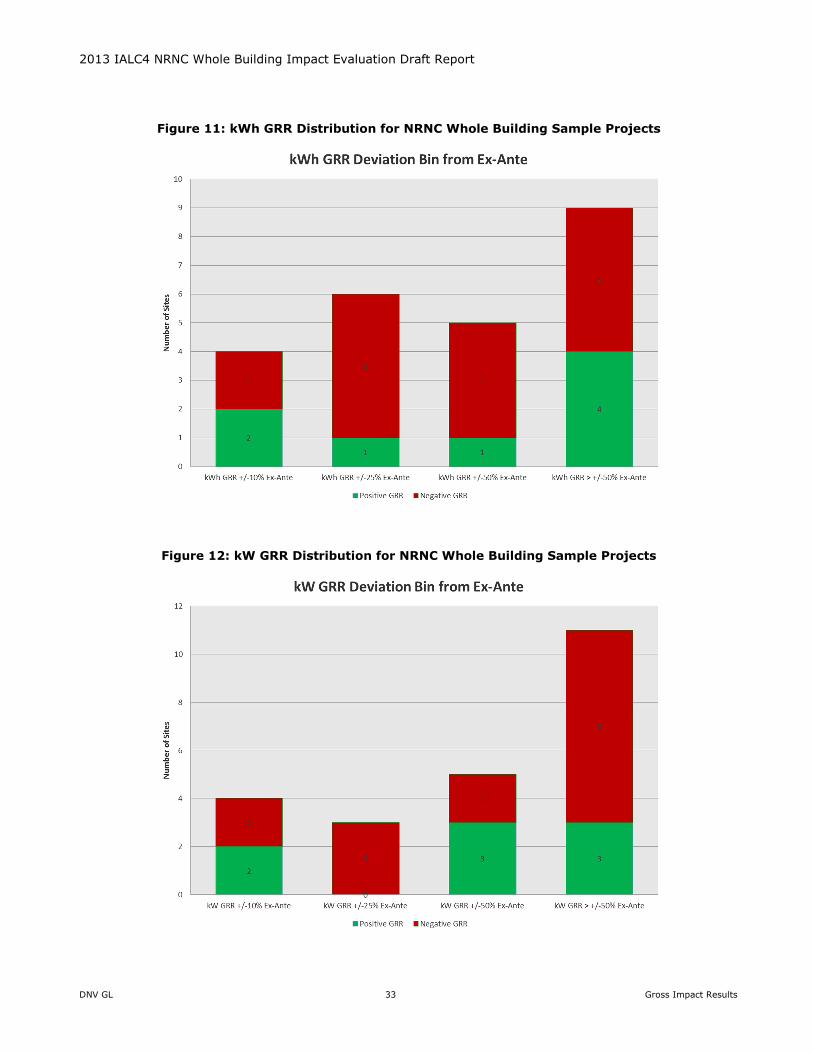
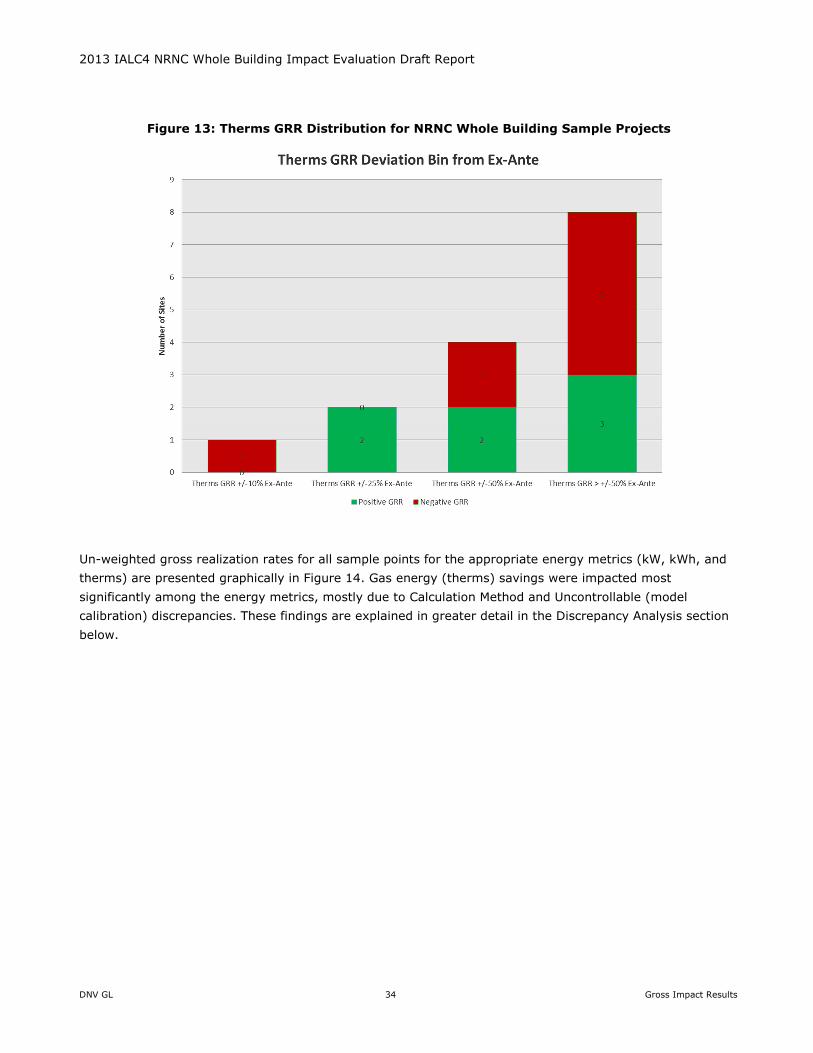
The next three bar charts show the distribution of GRR values categorized in to four bins relative to a 100%
realization rate: ± 10%, ± 25%, ± 50%, and more than ± 50%. The relatively large number of sample
points that were more than ± 50% away from the 100% realization rate suggests that these points had
evaluation findings that significantly affected the ex post results and caused them to vary considerably from
ex ante estimates. However, the mix of positive and negative GRRs and the randomness of sample point
savings magnitudes within each bin allowed the un-weighted average GRR values for each energy metric to
remain relatively moderate compared to the extreme GRR values.
24 The points with negative percentage values on the horizontal axis indicate that the ex post savings value was negative (i.e., negative therms
savings). Points with negative horizontal axis and negative vertical axis values indicate that the evaluated (ex post) savings was positive.
2013 IALC4 NRNC Whole Building Impact Evaluation Draft Report
DNV GL 33 Gross Impact Results
Figure 11: kWh GRR Distribution for NRNC Whole Building Sample Projects
Figure 12: kW GRR Distribution for NRNC Whole Building Sample Projects
2013 IALC4 NRNC Whole Building Impact Evaluation Draft Report
DNV GL 34 Gross Impact Results
Figure 13: Therms GRR Distribution for NRNC Whole Building Sample Projects
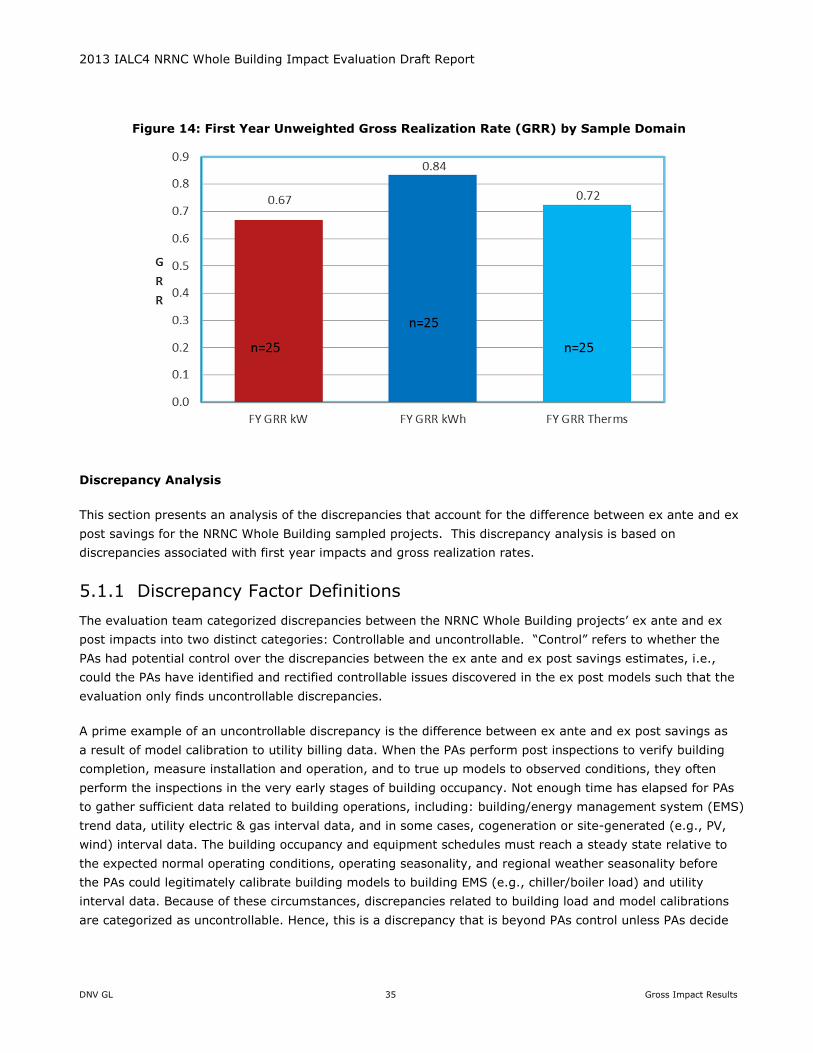
Un-weighted gross realization rates for all sample points for the appropriate energy metrics (kW, kWh, and
therms) are presented graphically in Figure 14. Gas energy (therms) savings were impacted most
significantly among the energy metrics, mostly due to Calculation Method and Uncontrollable (model
calibration) discrepancies. These findings are explained in greater detail in the Discrepancy Analysis section
below.
2013 IALC4 NRNC Whole Building Impact Evaluation Draft Report
DNV GL 35 Gross Impact Results
Figure 14: First Year Unweighted Gross Realization Rate (GRR) by Sample Domain
Discrepancy Analysis
This section presents an analysis of the discrepancies that account for the difference between ex ante and ex
post savings for the NRNC Whole Building sampled projects. This discrepancy analysis is based on
discrepancies associated with first year impacts and gross realization rates.
5.1.1 Discrepancy Factor Definitions
The evaluation team categorized discrepancies between the NRNC Whole Building projects’ ex ante and ex
post impacts into two distinct categories: Controllable and uncontrollable. “Control” refers to whether the
PAs had potential control over the discrepancies between the ex ante and ex post savings estimates, i.e.,
could the PAs have identified and rectified controllable issues discovered in the ex post models such that the
evaluation only finds uncontrollable discrepancies.
A prime example of an uncontrollable discrepancy is the difference between ex ante and ex post savings as
a result of model calibration to utility billing data. When the PAs perform post inspections to verify building
completion, measure installation and operation, and to true up models to observed conditions, they often
perform the inspections in the very early stages of building occupancy. Not enough time has elapsed for PAs
to gather sufficient data related to building operations, including: building/energy management system (EMS)
trend data, utility electric & gas interval data, and in some cases, cogeneration or site-generated (e.g., PV,
wind) interval data. The building occupancy and equipment schedules must reach a steady state relative to
the expected normal operating conditions, operating seasonality, and regional weather seasonality before
the PAs could legitimately calibrate building models to building EMS (e.g., chiller/boiler load) and utility
interval data. Because of these circumstances, discrepancies related to building load and model calibrations
are categorized as uncontrollable. Hence, this is a discrepancy that is beyond PAs control unless PAs decide

2013 IALC4 NRNC Whole Building Impact Evaluation Draft Report
DNV GL 36 Gross Impact Results
to wait a few months after the building completion and collect billing or/and end-use data and then calibrate
the models to update the ex ante savings.
Ex ante savings would likely change significantly in the hypothetical situation where PAs could reasonably
calibrate building models to building load and/or utility interval data; however, that change in ex ante
savings could increase or decrease depending on project and building circumstances.25 Uncontrollable
discrepancies therefore cannot be considered strictly a negative impact on ex ante savings.
The controllable discrepancy category is sub-categorized into seven factors in order to increase discrepancy
resolution and identify key problem areas. The following seven distinct controllable discrepancy factors are
described below:
• Tracking Data
• Ineligible Measure
• Measure Count
• Inappropriate Baseline
• Inoperable Measure
• Operating Conditions
• Calculation Method
Tracking Data
This discrepancy category captured instances when the final ex ante building model results from project
documentation did not match the final claimed ex ante savings as reported in the tracking data. These
discrepancies are typically random administrator error (e.g., final model is revised after tracking values have
been approved and tracking savings are not updated) and rounding errors, and no systemic patterns were
observed. However there may be site-specific exceptions where this category was considered to be the most
appropriate given the fixed discrepancy categories.
Ineligible Measure
When the evaluated building/measure was determined to be ineligible based on program rules or policy, the
discrepancy between ex ante and ex post energy impacts are assigned to this category. An example of an
ineligible measure involved Site E112 where the efficiencies of the installed HVAC packaged units did not
exceed the Title 24 standard efficiency. Note that if there were other additional measures that used the
ineligible measure as a means to define baseline conditions or efficiency, then the other measures’
discrepancies would be assigned to the inappropriate baseline discrepancy category as well.
25 There is no strong statistical correlation between building calibration and change in estimated energy savings. Table 15 lists projects whose models
were calibrated to utility data and/or building load data. The results show that savings could increase or decrease with varying magnitudes and
explanations for the change.
2013 IALC4 NRNC Whole Building Impact Evaluation Draft Report
DNV GL 37 Gross Impact Results
Measure Count
The “Measure Count” category is used when the observed number of measures (e.g., number of air
compressors, number of supply fan motors, number of identical buildings, calculated LPD based on fixture
count) does not match the number of respective measures incentivized in the ex ante project documentation.
An example of this discrepancy was observed for Site E004 where the calculated ex ante lighting power
density (LPD) was revised because the observed fixture count was different than what was described in the
ex ante project documentation.
Inappropriate Baseline
This discrepancy category is applied to instances where the baseline model does not reflect 2008 Title 24 or
Alternative Calculation Method (ACM) guidelines for establishing standard/baseline model characteristics. An
example of this discrepancy would be if the baseline model of a two story office building was created with a
built-up single zone HVAC system with a central plant (defined as System #5 in the ACM guidelines). The
ACM manual states that a low-rise nonresidential building (three stories or less) should use System #1
through #3, depending on whether the proposed system is single or multiple zone and gas or electric heat.
A specific example of this discrepancy was observed for Site E019 where a medical office baseline model was
inappropriately simulated using the SBD healthcare ISP which dictated constant volume HVAC systems. This
building was an out-patient clinic and didn’t have any special pressurized zones that require the HVAC
System to be constant volume. Therefore, the baseline should have been based around Title-24 building
code with variable volume HVAC systems.
Inoperable Measure
The Inoperable Measure category is assigned when the impact discrepancy is due to a measure that was not
observed to be operating as intended. For example, if glycol pumps were proposed to be fitted with variable
speed drives (VSDs) and operate between 30% and 90% speed and if during the site visit the drives were
observed to be installed but disabled such that the motors were running full speed, then the discrepancy
associated with this finding would be assigned to the Inoperable Measure category. There was only one
occurrence of this discrepancy in the sampled projects; Site E112 had gas savings associated with a heat
reclaim tank. The tank was installed as proposed; however, the valve allowing make-up flow to the tank was
closed, effectively zeroing the measure savings.
Operating Conditions
This discrepancy category is chosen for discrepancies that arise from differences in building or HVAC
operation between the ex ante model using assumed conditions and the ex post model using observed
operations. For example, the AHU supply fan brake horse power input value in one site’s building model
may be 20.0 hp at the design airflow based on the AHU specifications. Site visit findings may have indicated
the actual fan brake horse power was only 12.5 hp at the design airflow, due to a more efficient duct design.
The savings change due to the fan design brake horse power difference is counted as an Operating
Conditions discrepancy. Another example of this type of discrepancy may involve the difference between
the observed refrigeration load and the load that was estimated in the ex ante model. The ex ante model
may have assumed a continuous full design refrigeration load while the evaluated (ex post) model used the
observed refrigeration load based on trend/metered data or production/operating schedules. In this case,
the difference in refrigeration load and load schedule is a discrepancy in the operating conditions of the
building.
2013 IALC4 NRNC Whole Building Impact Evaluation Draft Report
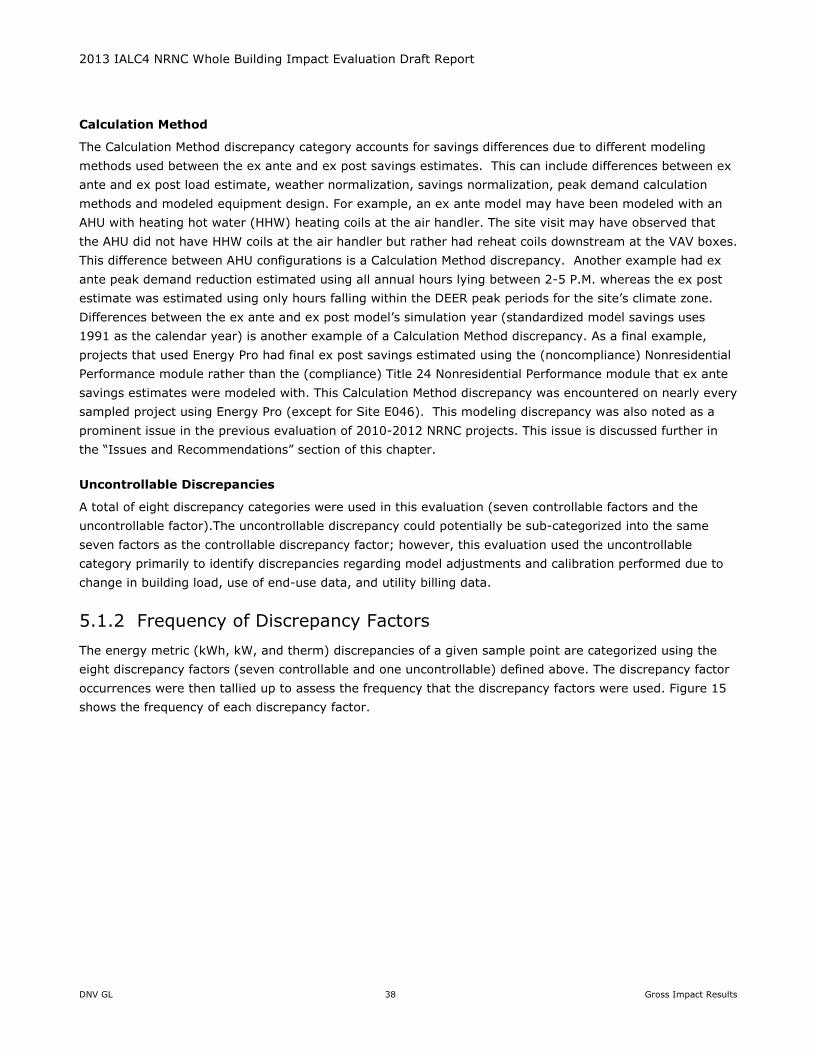
DNV GL 38 Gross Impact Results
Calculation Method
The Calculation Method discrepancy category accounts for savings differences due to different modeling
methods used between the ex ante and ex post savings estimates. This can include differences between ex
ante and ex post load estimate, weather normalization, savings normalization, peak demand calculation
methods and modeled equipment design. For example, an ex ante model may have been modeled with an
AHU with heating hot water (HHW) heating coils at the air handler. The site visit may have observed that
the AHU did not have HHW coils at the air handler but rather had reheat coils downstream at the VAV boxes.
This difference between AHU configurations is a Calculation Method discrepancy. Another example had ex
ante peak demand reduction estimated using all annual hours lying between 2-5 P.M. whereas the ex post
estimate was estimated using only hours falling within the DEER peak periods for the site’s climate zone.
Differences between the ex ante and ex post model’s simulation year (standardized model savings uses
1991 as the calendar year) is another example of a Calculation Method discrepancy. As a final example,
projects that used Energy Pro had final ex post savings estimated using the (noncompliance) Nonresidential
Performance module rather than the (compliance) Title 24 Nonresidential Performance module that ex ante
savings estimates were modeled with. This Calculation Method discrepancy was encountered on nearly every
sampled project using Energy Pro (except for Site E046). This modeling discrepancy was also noted as a
prominent issue in the previous evaluation of 2010-2012 NRNC projects. This issue is discussed further in
the “Issues and Recommendations” section of this chapter.
Uncontrollable Discrepancies
A total of eight discrepancy categories were used in this evaluation (seven controllable factors and the
uncontrollable factor).The uncontrollable discrepancy could potentially be sub-categorized into the same
seven factors as the controllable discrepancy factor; however, this evaluation used the uncontrollable
category primarily to identify discrepancies regarding model adjustments and calibration performed due to
change in building load, use of end-use data, and utility billing data.
5.1.2 Frequency of Discrepancy Factors
The energy metric (kWh, kW, and therm) discrepancies of a given sample point are categorized using the
eight discrepancy factors (seven controllable and one uncontrollable) defined above. The discrepancy factor
occurrences were then tallied up to assess the frequency that the discrepancy factors were used. Figure 15
shows the frequency of each discrepancy factor.
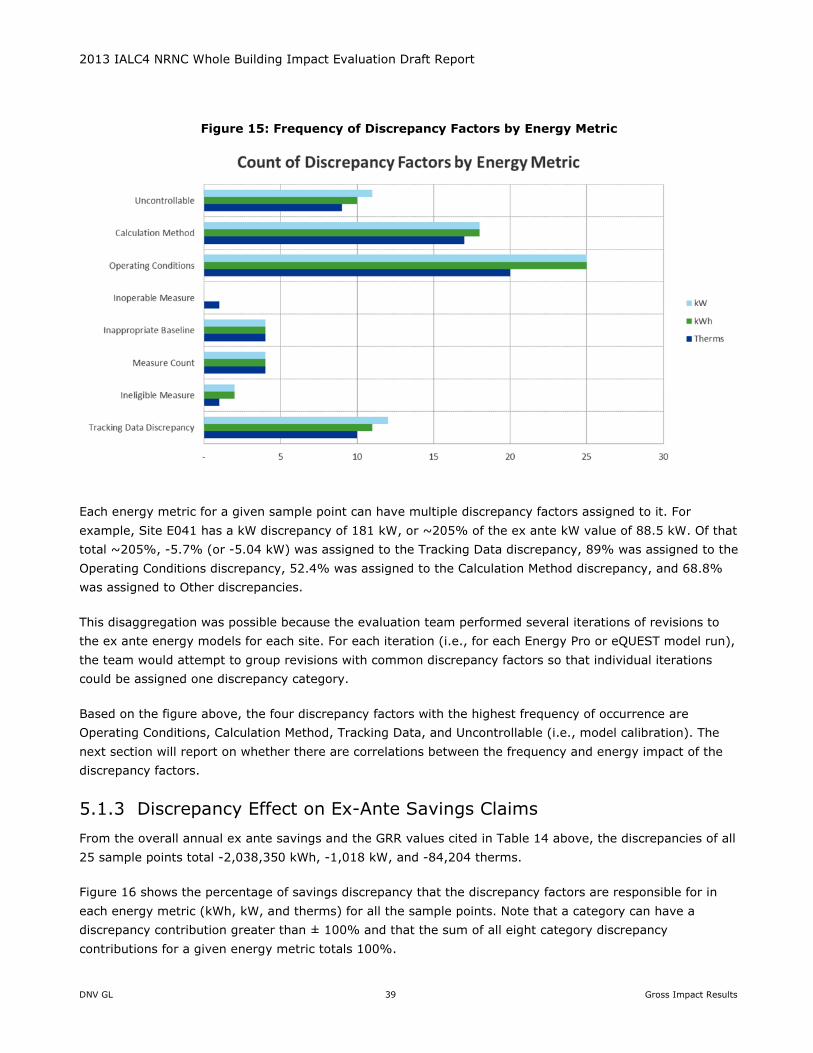
2013 IALC4 NRNC Whole Building Impact Evaluation Draft Report
DNV GL 39 Gross Impact Results
Figure 15: Frequency of Discrepancy Factors by Energy Metric
Each energy metric for a given sample point can have multiple discrepancy factors assigned to it. For
example, Site E041 has a kW discrepancy of 181 kW, or ~205% of the ex ante kW value of 88.5 kW. Of that
total ~205%, -5.7% (or -5.04 kW) was assigned to the Tracking Data discrepancy, 89% was assigned to the
Operating Conditions discrepancy, 52.4% was assigned to the Calculation Method discrepancy, and 68.8%
was assigned to Other discrepancies.
This disaggregation was possible because the evaluation team performed several iterations of revisions to
the ex ante energy models for each site. For each iteration (i.e., for each Energy Pro or eQUEST model run),
the team would attempt to group revisions with common discrepancy factors so that individual iterations
could be assigned one discrepancy category.
Based on the figure above, the four discrepancy factors with the highest frequency of occurrence are
Operating Conditions, Calculation Method, Tracking Data, and Uncontrollable (i.e., model calibration). The
next section will report on whether there are correlations between the frequency and energy impact of the
discrepancy factors.
5.1.3 Discrepancy Effect on Ex-Ante Savings Claims
From the overall annual ex ante savings and the GRR values cited in Table 14 above, the discrepancies of all
25 sample points total -2,038,350 kWh, -1,018 kW, and -84,204 therms.
Figure 16 shows the percentage of savings discrepancy that the discrepancy factors are responsible for in
each energy metric (kWh, kW, and therms) for all the sample points. Note that a category can have a
discrepancy contribution greater than ± 100% and that the sum of all eight category discrepancy
contributions for a given energy metric totals 100%.
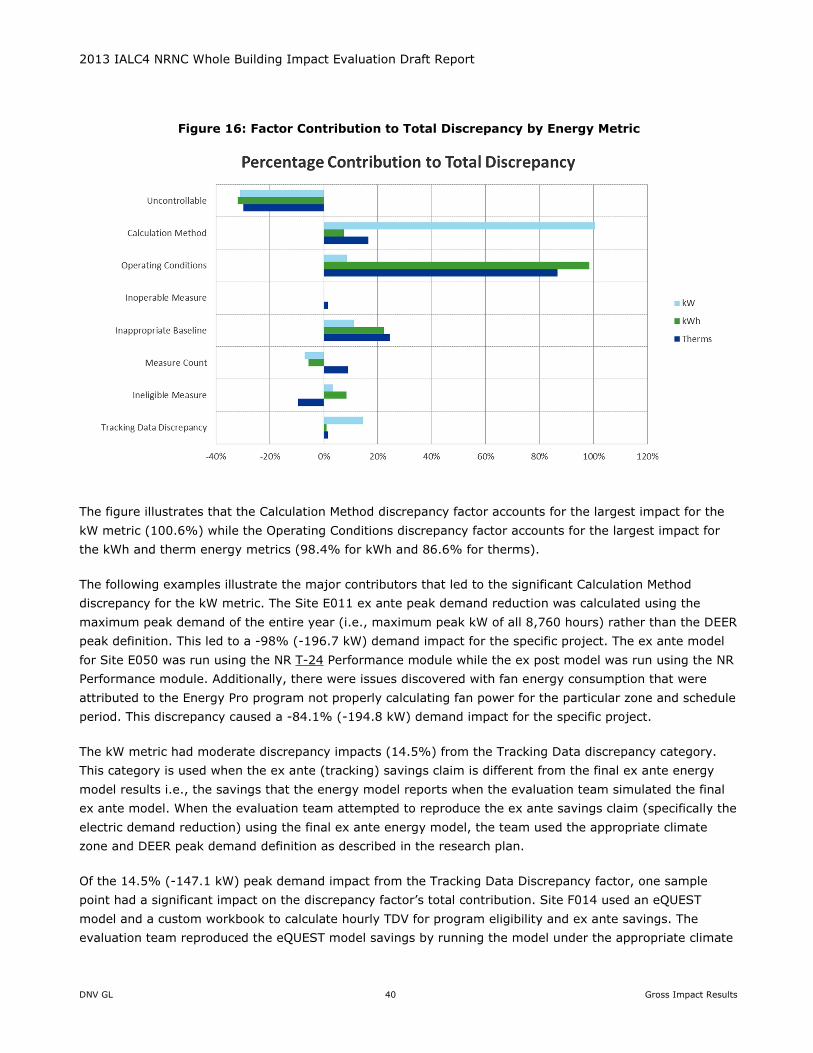
2013 IALC4 NRNC Whole Building Impact Evaluation Draft Report
DNV GL 40 Gross Impact Results
Figure 16: Factor Contribution to Total Discrepancy by Energy Metric
The figure illustrates that the Calculation Method discrepancy factor accounts for the largest impact for the
kW metric (100.6%) while the Operating Conditions discrepancy factor accounts for the largest impact for
the kWh and therm energy metrics (98.4% for kWh and 86.6% for therms).
The following examples illustrate the major contributors that led to the significant Calculation Method
discrepancy for the kW metric. The Site E011 ex ante peak demand reduction was calculated using the
maximum peak demand of the entire year (i.e., maximum peak kW of all 8,760 hours) rather than the DEER
peak definition. This led to a -98% (-196.7 kW) demand impact for the specific project. The ex ante model
for Site E050 was run using the NR T-24 Performance module while the ex post model was run using the NR
Performance module. Additionally, there were issues discovered with fan energy consumption that were
attributed to the Energy Pro program not properly calculating fan power for the particular zone and schedule
period. This discrepancy caused a -84.1% (-194.8 kW) demand impact for the specific project.
The kW metric had moderate discrepancy impacts (14.5%) from the Tracking Data discrepancy category.
This category is used when the ex ante (tracking) savings claim is different from the final ex ante energy
model results i.e., the savings that the energy model reports when the evaluation team simulated the final
ex ante model. When the evaluation team attempted to reproduce the ex ante savings claim (specifically the
electric demand reduction) using the final ex ante energy model, the team used the appropriate climate
zone and DEER peak demand definition as described in the research plan.
Of the 14.5% (-147.1 kW) peak demand impact from the Tracking Data Discrepancy factor, one sample
point had a significant impact on the discrepancy factor’s total contribution. Site F014 used an eQUEST
model and a custom workbook to calculate hourly TDV for program eligibility and ex ante savings. The
evaluation team reproduced the eQUEST model savings by running the model under the appropriate climate
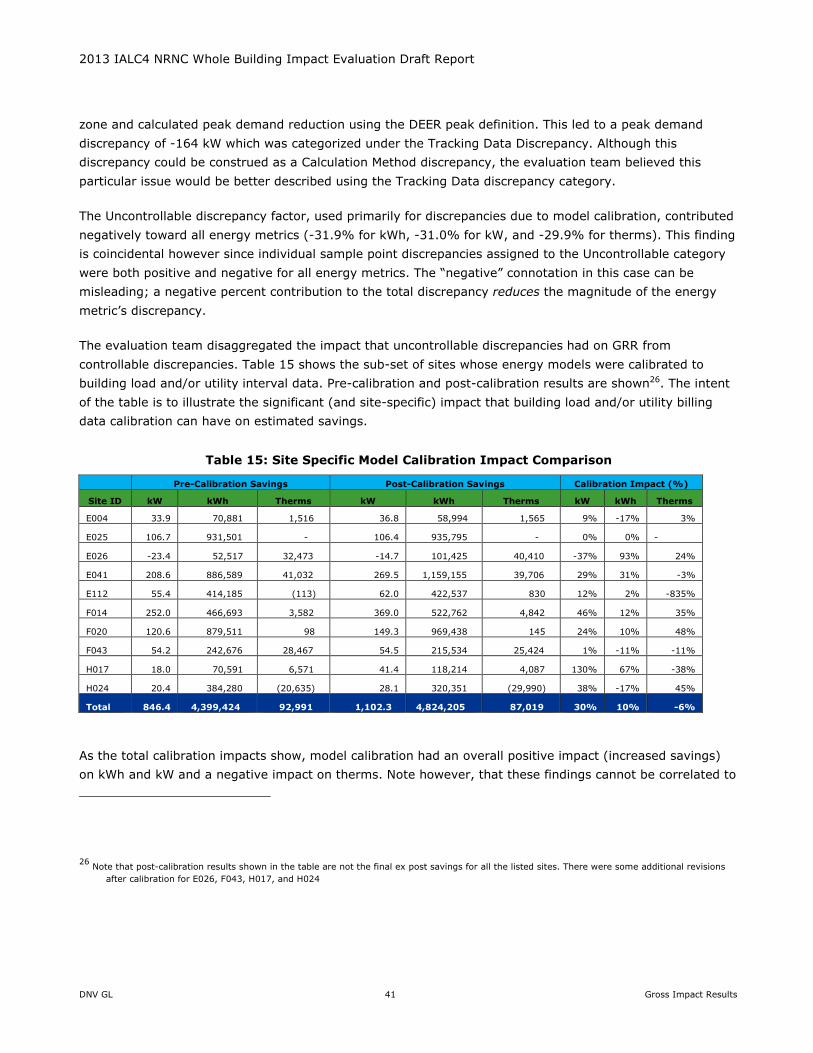
2013 IALC4 NRNC Whole Building Impact Evaluation Draft Report
DNV GL 41 Gross Impact Results
zone and calculated peak demand reduction using the DEER peak definition. This led to a peak demand
discrepancy of -164 kW which was categorized under the Tracking Data Discrepancy. Although this
discrepancy could be construed as a Calculation Method discrepancy, the evaluation team believed this
particular issue would be better described using the Tracking Data discrepancy category.
The Uncontrollable discrepancy factor, used primarily for discrepancies due to model calibration, contributed
negatively toward all energy metrics (-31.9% for kWh, -31.0% for kW, and -29.9% for therms). This finding
is coincidental however since individual sample point discrepancies assigned to the Uncontrollable category
were both positive and negative for all energy metrics. The “negative” connotation in this case can be
misleading; a negative percent contribution to the total discrepancy reduces the magnitude of the energy
metric’s discrepancy.
The evaluation team disaggregated the impact that uncontrollable discrepancies had on GRR from
controllable discrepancies. Table 15 shows the sub-set of sites whose energy models were calibrated to
building load and/or utility interval data. Pre-calibration and post-calibration results are shown26. The intent
of the table is to illustrate the significant (and site-specific) impact that building load and/or utility billing
data calibration can have on estimated savings.
Table 15: Site Specific Model Calibration Impact Comparison
Pre-Calibration Savings Post-Calibration Savings Calibration Impact (%)
Site ID kW kWh Therms kW kWh Therms kW kWh Therms
E004 33.9 70,881 1,516 36.8 58,994 1,565 9% -17% 3%
E025 106.7 931,501 - 106.4 935,795 - 0% 0% -
E026 -23.4 52,517 32,473 -14.7 101,425 40,410 -37% 93% 24%
E041 208.6 886,589 41,032 269.5 1,159,155 39,706 29% 31% -3%
E112 55.4 414,185 (113) 62.0 422,537 830 12% 2% -835%
F014 252.0 466,693 3,582 369.0 522,762 4,842 46% 12% 35%
F020 120.6 879,511 98 149.3 969,438 145 24% 10% 48%
F043 54.2 242,676 28,467 54.5 215,534 25,424 1% -11% -11%
H017 18.0 70,591 6,571 41.4 118,214 4,087 130% 67% -38%
H024 20.4 384,280 (20,635) 28.1 320,351 (29,990) 38% -17% 45%
Total 846.4 4,399,424 92,991 1,102.3 4,824,205 87,019 30% 10% -6%
As the total calibration impacts show, model calibration had an overall positive impact (increased savings)
on kWh and kW and a negative impact on therms. Note however, that these findings cannot be correlated to
26 Note that post-calibration results shown in the table are not the final ex post savings for all the listed sites. There were some additional revisions
after calibration for E026, F043, H017, and H024
2013 IALC4 NRNC Whole Building Impact Evaluation Draft Report
DNV GL 42 Gross Impact Results
project characteristics (e.g., project size, building type, measure types, etc.) because each site has unique
conditions that affect model calibration. Trends could possibly be determined with larger samples that
contain similar building types or occupancies (e.g., chain restaurants or retail stores).
Issues and Recommendations
In California, Energy-Pro was a state-approved energy simulation tool that was used to demonstrate
performance compliance for new construction buildings and eligibility for the statewide SBD program. Since
Energy Pro has not been certified by the CEC for use in assessing compliance with the 2013 T24, the IOUs
should use a software package that can provide results in the T-24 compliance mode as well as-built
performance mode (non-compliance).
The issues discussed below not only cover modeling related concerns but also go over other key issues such
as use of inappropriate baseline, applying default operating schedules and set points to the models, not
using appropriate weather files in simulations. These issues will still be relevant irrespective of software used
for simulation. Therefore, the evaluators believe that these issues and recommendations will be relevant
for future program years, regardless of the software choice made by the PAs.
The certified version of Energy-Pro that was used by PAs for the program year 2013 projects. The EP tool
was either (1) inappropriately used to estimate ex ante savings, or (2) limitations of the tool led to
inappropriate baseline characteristics in the standard model.
The ACM Manual clearly states the modeling rules for standard and proposed design to demonstrate
compliance with Title-24. However, there is no official document (e.g., the SBD Program Manual) to
articulate the modeling rules for standard and proposed design to estimate ex ante energy savings. This
limitation has led to inconsistencies in the interpretation of the ACM among different program implementers.
Energy-Pro uses two calculation modules related to the SBD program: (1) NR T-24 Performance and (2) NR
Performance. Both modules create standard and proposed building description files and estimate annual
building energy performance using the DOE-2.1E building energy simulation program. However, there are
distinct differences between these two modules that have been ignored or misunderstood by some SBD
program sponsors and administrators. The NR T-24 Performance module uses T-24 standard schedules in
both the baseline and post-retrofit models while the NR Performance module uses the current year as the
run period and as-built mechanical systems in the baseline model. As proposed in this section: as-built
design schedules should be used in both the baseline and post-retrofit models; the baseline mechanical
systems should be specified in accordance with the Title-24 ACM manual; and the run period should have
been the calendar year 1991 (to be consistent with the defined DEER peak periods which use standardized
CTZ weather data and the 1991 reference year). This problem has contributed to the inaccuracy of energy
savings estimates for this program. The significant difference in peak demand savings between the ex ante
estimate and the ex post results were largely due to the use of inappropriate calculation method in the ex
ante estimate.
In addition, neither of the standard building models created by the two modules is appropriate for use as the
baseline model for the SBD program. The NR T-24 Performance module uses T-24 standard schedules in

2013 IALC4 NRNC Whole Building Impact Evaluation Draft Report
DNV GL 43 Gross Impact Results
both the standard and proposed models while the NR Performance module uses the current year as the run
period and as-built mechanical systems in the baseline model.27
As proposed in this section: (1) program eligibility should be determined using the NR T-24 Performance
module and ex ante savings should be determined using the NR Performance module; (2) as-built design
schedules should be used in both the baseline and post-retrofit models when calculating savings; (3) the
baseline mechanical systems should be specified in accordance with the Title-24 ACM manual; and (4) the
run period should be consistent with the defined and applicable DEER peak periods.
Issue #1: Ex-Ante Energy Pro Model Schedules Do Not Match As-Built Design Schedules
For some of the whole building sites with energy savings simulated with Energy-Pro, the ex ante annual
energy savings were determined based on standard T-24 schedules instead of the building’s as-designed
schedules. “As- designed” schedules are based on full design occupancy and typical planned building
schedules. As-designed is usually different from the “standard” or “reference” T-24 schedules that this issue
describes.28 The as-designed schedules are also different from the “as-built” schedules, which are observed
once the building is completed and occupied, and “as-evaluated” schedules which are collected during
evaluation and used for calibration purposes.
The difference in building schedules can have a significant impact on the ex ante savings, especially for
seasonal buildings such as schools and recreation centers where as-built design schedules can typically have
larger variations, compared to T-24 schedules, than other high occupancy buildings like hospitals or large
office buildings.
Some ex ante Energy Pro models had “undefined” schedules which default to T-24 schedules in the NR T-24
Performance module but require definition in the NR Performance module. This can also have a significant
impact when the evaluation team runs the energy model using the NR Performance module to estimate
energy savings29.
Recommendation #1: Use As-Designed or As-Built Schedules
Generally speaking, the annual TDV energy use should be simulated using standard T-24 schedules to
determine the percentage of annual energy use below Title-24 and subsequent program eligibility. After
27 The “current” run year is dictated by the computer date that the Energy-Pro program and model was simulated on. So for example, if the computer’s calendar year was
changed from 2015 to 1991 the Energy Pro program running the NR Performance module would simulate the model based on the 1991 calendar year.
28 There were instances where the T-24 schedules were reasonably similar to the as-designed schedules
29 Adjusting the model to use the NR Performance module instead of the NR T-24 Performance module is a necessary step in order to adjust the building schedules to actual
conditions. However, the schedule change could not be isolated completely from other factors because when the modeler changes from NR T-24 Performance (compliance
module) to NR Performance (non-compliance module) several other inputs for the “standard” base case model (equipment and thermostat set points, artificial loads, and
run period) are automatically changed by the EnergyPro software. An isolated comparison to quantify the difference in savings due to a change in schedules from the T-
24 schedules to actual schedules must be performed outside of EnergyPro; this task requires significant effort that was not within the planned scope of the evaluation.
This “bundled” adjustment introduces some uncertainty around discrepancy assignment and discrepancy magnitude around change in building schedule(s).
2013 IALC4 NRNC Whole Building Impact Evaluation Draft Report
DNV GL 44 Gross Impact Results
eligibility is determined, the annual energy savings should be simulated using as-designed schedules to
estimate the ex ante savings.
This adjustment means the NR T-24 Performance module should first be selected to develop the baseline
model and conditions (e.g., baseline equipment types, equipment controls, equipment efficiencies, etc.), and
to determine the eligibility of the building. The post-retrofit TDV energy should be lower than the baseline
TDV energy by the program-required percentage to be eligible for SBD incentives.
If the project/building is eligible for incentives, the software package should then be switched from NR T-24
Performance to NR Performance in order to perform the ex ante pre-installation savings estimation. At this
point, as-designed schedules would be applied to both the baseline and post-retrofit models for the ex ante
savings estimation. Thus, the as-designed schedules are reflected in the baseline and proposed conditions
and savings are attributed only to the equipment/building design enhancements.
When the building construction is complete and the project is ready for the post-verification visit, the
inspector would verify that the as-built schedules are consistent with as-designed schedules. If not, further
adjustments should be made to the manually entered schedules in the post model; these adjustments will
also be automatically applied to the baseline model. The revised ex ante models are then re-simulated to
true-up the ex ante savings estimation based on the as-built conditions observed during the post-
construction inspection.
The recommended modeling process detailed above is currently manual, and might sometimes become labor
intensive. We suggest the PAs explore modifications to the PA selected software tool in order to automate
the recommended modeling process and automatically generate appropriate energy savings. Alternatively,
PAs can elect for additional training so that modelers are proficient with both the compliance and non-
compliance modules.
Issue #2: Ex-Ante Models are not trued-up to Physical As-built Conditions
Some of the ex ante energy models were not trued up (i.e., “physical calibration”) to reflect actual as-built
equipment specifications, sequencing, and controls. The system configuration modeled in the building
simulation did not always match the observed system configuration found by the evaluator during the site
visit.
For example, the ex ante proposed model for Site E013 had a HVAC system type that did not match the
actual observed HVAC system. The ex ante model utilized a VAV system with chilled and hot water coils; the
evaluator site visit determined that the HVAC system was actually VRF. This had a significant impact on all
energy metrics (kW by -324%, kWh by 57%, and therms by -66%). For another site, the HVAC systems’
heating hot water (HHW) coils were modeled as being packaged within the AHU, while the evaluator’s site
visit determined that the HHW coils were actually installed downstream before the VAV boxes. These
discrepancies in the modeled system configuration often have negative implications for the site’s GRR.
Recommendation #2: Require Title-24 Acceptance Test Submittal & Site Visits to Verify Key ECMs
and Revise Model to Physical “As-Built” Conditions
NRNC whole building projects are inherently unique because they do not involve any sort of pre-
implementation “verification.” Furthermore, building plans are often used by technical reviewers to “verify”

2013 IALC4 NRNC Whole Building Impact Evaluation Draft Report
DNV GL 45 Gross Impact Results
installation of particular energy conservation measures (ECMs) (e.g., efficient HVAC components, high
performance glazing or insulation, lighting controls). The importance of visual verification may be
considered less important for NRNC projects largely because the building is new and building plans are
readily available - there is less perceived risk for discrepancy.
However, based on the examples provided above, this form of verification is not adequate; PAs should
require their inspectors and engineers to perform on-site visits to visually verify that the proposed ECMs
have been installed and are operating as intended and as simulated in the building model. It is
recommended that the PA’s perform post inspection site visits and model true ups on all projects, regardless
of size, due to diversity of the NRNC projects. It should be noted that the smaller projects tend to take less
PA resources as compared to the larger projects, in terms of performing the site inspections and trueing up
the models, so performing these tasks on smaller projects most likely this will not have a disproportionately
large impact on the cost effectiveness of the projects.
It is also recommended that the program administrator should make it mandatory for program participants
to submit a Title-24 Acceptance Test Report before being paid an incentive. Title-24 acceptance tests
involves inspection checks and performance tests to determine whether specific building systems conform to
the criteria set forth in the standards and to the proposed building specifications and controls. The
acceptance test reports can also be used to true-up building models to as-built conditions.
It is recommended that the final approved model should be adjusted to physical “as-built” conditions
observed during the verification site visit. “As-built” conditions include observed construction & equipment
efficiencies and observed HVAC controls and sequencing. This effort should be performed in conjunction
with revising the standard schedules with as-built building schedules.
Issue #3: Ex-Ante Savings do not account for Cogeneration or Site-generated Power
There were multiple sites in the sample where cogeneration or other self-generated power (e.g., PV) was
not assessed by the PA for estimating eligible ex ante savings. The CPUC policy requires that the program
participants pay the Public Good Charge (PGC) for Public Purpose Programs (PPP). New construction
projects may not necessarily have had an active service account at the time of application but projects are
typically eligible if the buildings are built within the respective PA service territory and the participant
intends to purchase energy from the PA.
For NRNC projects where it is known by the PA that cogeneration or self-generation is planned and the
building design incorporates the design load of the cogeneration/site-generation, then the PA should assess
whether the magnitude of the ex ante savings for the project, for each fuel, exceeds the likely energy
purchases from the PA. Demonstrating the grid/system impact on an hourly basis is the CPUC policy
requirement to qualify for incentives.
Likewise for sites with cogeneration, the claimed ex ante electric (kWh) savings must be apportioned
according to the impacts on the grid (electric)/system (natural gas), depending on the fuel saved and its
coincidence with the timing of energy purchase profiles (hourly for electric and monthly for gas). In the case
where the cogeneration source fuel is purchased from the same PA as electric grid purchases, a portion of
kWh savings may need to be converted to therm savings during the periods electricity is not being
purchased from the PA.
2013 IALC4 NRNC Whole Building Impact Evaluation Draft Report
DNV GL 46 Gross Impact Results
Site H024 involves a campus with a 450 MW cogeneration plant. Natural gas is purchased from a third-party
and the campus also has PV generation on site. The evaluation team confirmed that the ex ante savings
were not appropriately accounting for the cogeneration and PV generation by claiming full kWh savings and
peak kW reductions without assessing the cogeneration fuel (therms) savings and PV-generated source
electricity. This issue affected all energy savings metrics (kWh, kW, and therms), reducing kWh savings by
14%, peak kW by 16%, and increasing therms savings by -2,668%.30
Recommendation #3: Clearly Assess Impact of Cogeneration or Other Site-generation on Ex-Ante Savings Claims
NRNC projects that have planned design for cogeneration or other site-generation should have their modeled
energy savings and demand reductions scrutinized and appropriately allocated and capped, if necessary.
Design loads and load shapes for cogeneration and site-generation equipment should be collected and
incorporated into the energy savings calculations. Assessment of the expected peak site generation (and
cogeneration) relative to the estimated source fuel savings is critical in order to reduce discrepancies related
to cogeneration and/or site-generation.
30 The percentage is very large and negative because ex post therms savings were relatively small and negative at -305 therms.
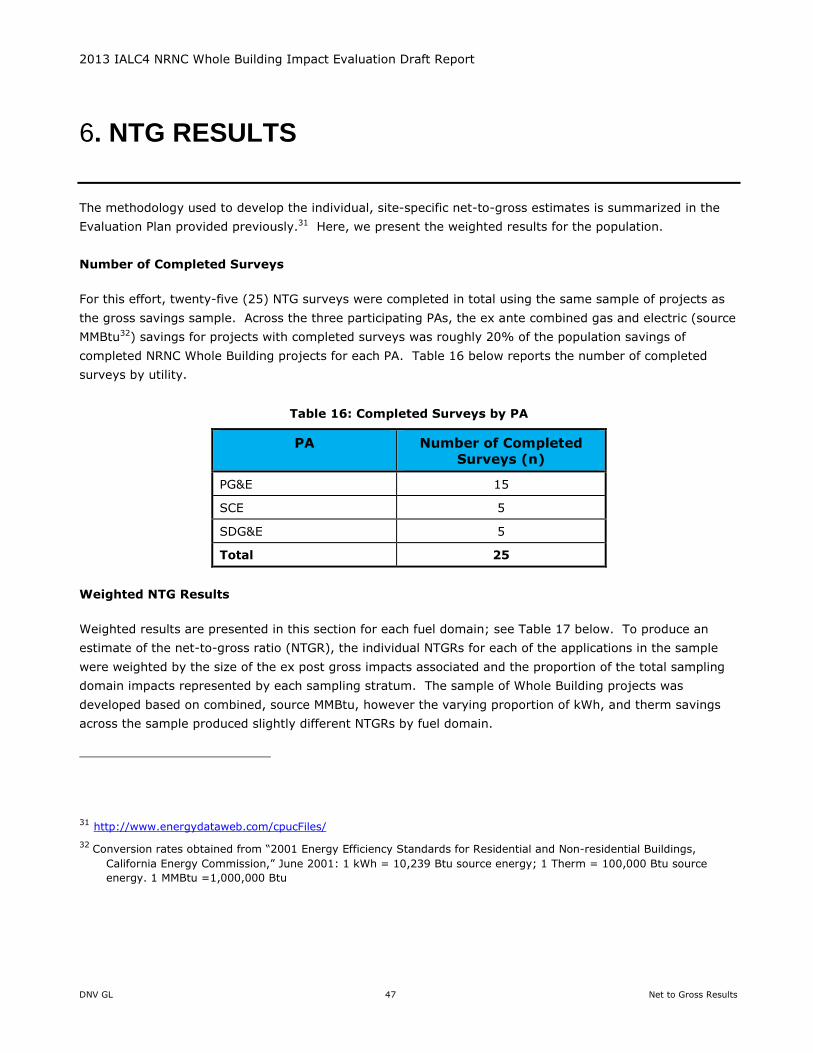
2013 IALC4 NRNC Whole Building Impact Evaluation Draft Report
DNV GL 47 Net to Gross Results
. NTG RESULTS 6
The methodology used to develop the individual, site-specific net-to-gross estimates is summarized in the
Evaluation Plan provided previously.31 Here, we present the weighted results for the population.
Number of Completed Surveys
For this effort, twenty-five (25) NTG surveys were completed in total using the same sample of projects as
the gross savings sample. Across the three participating PAs, the ex ante combined gas and electric (source
MMBtu32) savings for projects with completed surveys was roughly 20% of the population savings of
completed NRNC Whole Building projects for each PA. Table 16 below reports the number of completed
surveys by utility.
Table 16: Completed Surveys by PA
PA Number of Completed
Surveys (n)
PG&E 15
SCE 5
SDG&E 5
Total 25
Weighted NTG Results
Weighted results are presented in this section for each fuel domain; see Table 17 below. To produce an
estimate of the net-to-gross ratio (NTGR), the individual NTGRs for each of the applications in the sample
were weighted by the size of the ex post gross impacts associated and the proportion of the total sampling
domain impacts represented by each sampling stratum. The sample of Whole Building projects was
developed based on combined, source MMBtu, however the varying proportion of kWh, and therm savings
across the sample produced slightly different NTGRs by fuel domain.
31 http://www.energydataweb.com/cpucFiles/
32 Conversion rates obtained from “2001 Energy Efficiency Standards for Residential and Non-residential Buildings,
California Energy Commission,” June 2001: 1 kWh = 10,239 Btu source energy; 1 Therm = 100,000 Btu source
energy. 1 MMBtu =1,000,000 Btu

2013 IALC4 NRNC Whole Building Impact Evaluation Draft Report
DNV GL 48 Net to Gross Results
Table 17: Weighted Net-to-Gross Ratios by Fuel Type
Results
Electric NTGR Gas NTGR MMBTU NTGR
Statewide Statewide Statewide
Weighted NTGR 0.53 0.51 0.53
90 Percent Confidence Interval 0.51 - 0.56 0.49 - 0.54 0.51 - 0.55
Net Savings Relative Precision 24% 25% 20%
n Survey Completes 25 25 25
N Sampling Units 239 239 239
Final NTGR 0.53 0.51 0.53
Prior to this study, NTGR for SBD Whole Building projects had not been evaluated separately, so there is no
real historical trend to be obtained for this metric. In the 2010-12 program cycle, SBD was evaluated with
other programs as part of the Custom Evaluation group, Work Order 33. While net-to-gross ratios were
calculated by PA and fuel domain, there was no specific SBD NTGR. In the 2006-08 program cycle, the NTGR
for the SBD Program electric energy domain was 0.62; however this included systems projects as well as
Whole Building analyses and NTGRs for Whole Building projects were not tabulated separately. While the
combined NTGR of 0.53 is likely not viewed as favorable, and it is below the PA claim of 0.65, it cannot be
determined if the free ridership trend is changing for this component of the program.
Weighted Net Savings Results
The following charts show the net savings results of the sampled projects against the ex ante net savings
estimates for each project. The ex ante net savings for all projects are 58% of the ex ante gross savings
since the ex ante net savings are estimated by assuming a 0.9 gross realization rate and applying 0.65 net-
to-gross ratio to the assumed GRR. The red line across the chart is where the sampled project result equals
forecast. Data points above the line indicate projects have greater net savings than forecasted and points
below indicate where the forecast overestimated the net savings. Note that many more projects are below
the line than above in all fuel domains, which explains the program net savings results shown below in Table
18.
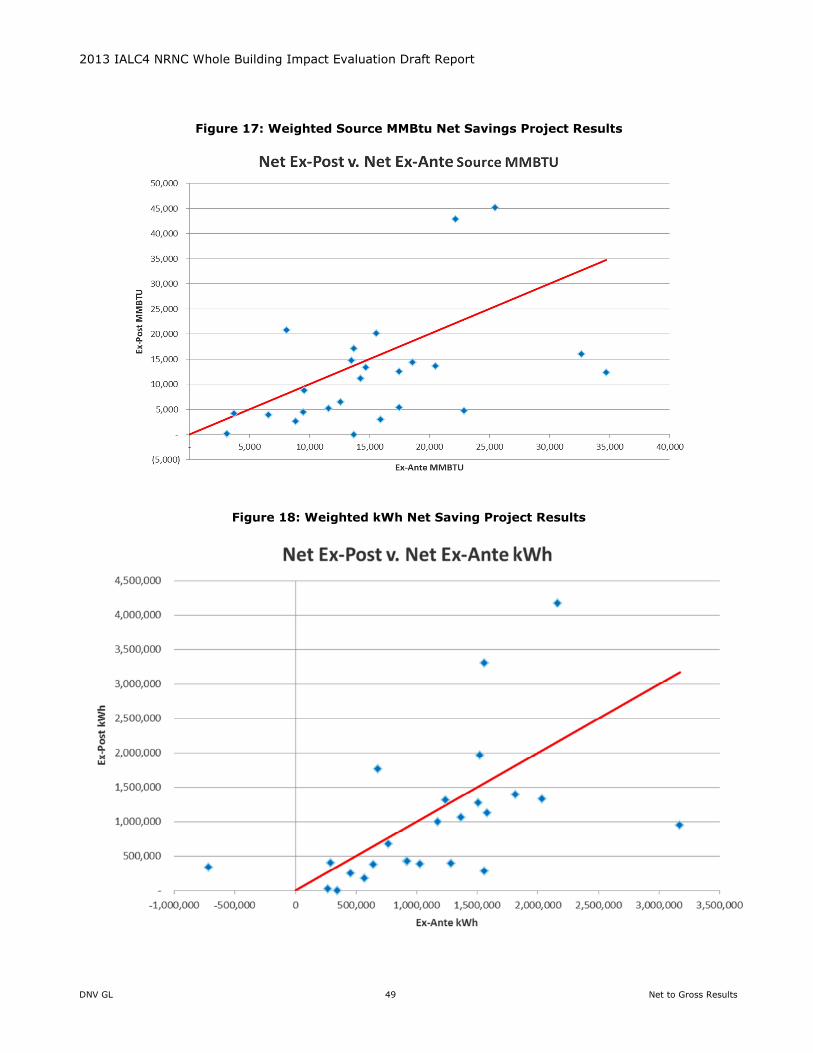
2013 IALC4 NRNC Whole Building Impact Evaluation Draft Report
DNV GL 49 Net to Gross Results
Figure 17: Weighted Source MMBtu Net Savings Project Results
Figure 18: Weighted kWh Net Saving Project Results
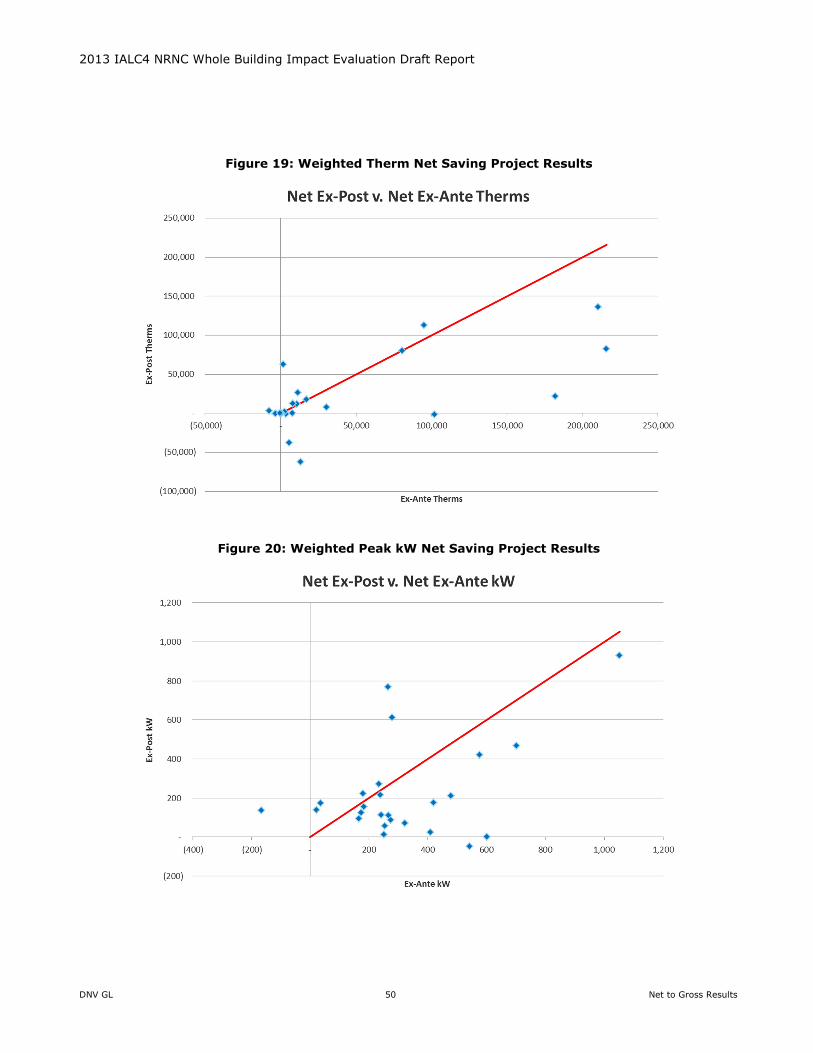
2013 IALC4 NRNC Whole Building Impact Evaluation Draft Report
DNV GL 50 Net to Gross Results
Figure 19: Weighted Therm Net Saving Project Results
Figure 20: Weighted Peak kW Net Saving Project Results

2013 IALC4 NRNC Whole Building Impact Evaluation Draft Report
DNV GL 51 Net to Gross Results
Table 18: PA Statewide Net Realization Rate Estimate and Comparisons
Electric Savings Gas Savings Source Energy Savings
Impact Element kWh/year Peak kW Therms/year MMBTU/year
Tracking
a. Claimed Gross Savings 67,909,049 21,886 828,183 778,139
b. Claimed GRR* 0.9 0.9 0.9 0.9
c. Claimed Adjusted Gross Savings
61,183,615 19,710 745,328 700,992
d. Claimed NTGR 0.65 0.65 0.64 0.65
e. Claimed Net Savings (e = c x d)
39,564,196 12,746 476,312 453,116
f. Claimed Net Realization Rate (f = b x d)
0.58 0.58 0.58 0.58
Evaluation
g. Evaluation GRR 0.94 0.79 0.57 0.85
h. Evaluated Gross Results (h = a x g)
63,903,109 17,397 474,104 663,454
i. Evaluation NTG Ratio 0.53 0.50 0.51 0.53
k. Evaluated Net Results (k = h x i )
33,986,798 8,765 242,122 353,595
l. Evaluation Net Realization Rate (l = g x i )
0.50 0.40 0.29 0.45
m. Evaluated Net Savings as a Fraction of Claimed Net
Savings (m = k / e)
0.86 0.69 0.51 0.78
** 1 site had a claimed of ex ante GRR of 100%. This site is an ex ante review (EAR) overlap point in which CPUC participated in the final
adjustment to the claimed savings According to the CPUC policy surrounding EAR activities, this site is a frozen point and receives ex ante
GRR of 1.0 instead of the 0.9 default ex ante GRR
Key Factors Influencing NTGRs
Behind the NTGR calculation for each project is a host of contextual factors that may have influenced the
project, directly or indirectly. The contextual factors were examined for each project primarily within three
main categories described as follows:
• Program service: This includes design assistance, analysis, and information and support, energy
design resources and training courses
• Program incentives: This category relates to Whole Building approach, design team and kicker
incentives (e.g. LEED, enhanced commissioning and end use monitoring)
• Non-program factors: This comprises eleven possible influences including non-energy benefits,
payback on the investment or ROI, recommendation from a consultant, standard practice, corporate
guidelines, prior measure experience and prior program influence

2013 IALC4 NRNC Whole Building Impact Evaluation Draft Report
DNV GL 52 Net to Gross Results
The intent was to look holistically at the energy-efficiency drivers including isolating the relative importance
of the program (services and incentives) compared to non-program factors and the likelihood the project
would have been built exactly the same without the program. The numerical responses feed into the NTGR
algorithm, which include three calculations to develop the final score. Across all program groupings analyzed,
financials were the most significant driver. Evaluating project drivers or influences on a ten point scale with
10 being the most important, design team and Whole Building approach incentives scored the highest at
8.75 and 8.32 and return on investment (ROI) and lifecycle cost almost exactly the same at 8.6 and 8.5.
Design analysis was also rated very high at 8.5. The second most important grouping with averages in the
7’s included recommendations from a consultant, compliance with organizations normal maintenance or
equipment policies, corporate policy or guidelines, followed by non-energy benefits. Less important factors
included industry standard practice, and prior experience with the measure(s) and program and the lowest
score was recommendation from a vendor or manufacturer.
Additionally there are some possibly helpful responses to open-ended survey questions:
• Certain factors can contribute to a lower level of program influence, and include:
o Documentation requirements are onerous and not worth the incentives
o Enhanced commissioning requirement is confusing and/or not considered valuable by some
respondents
o The incentives are too small to provide influence
o Long wait time for incentive check cuts into program participation value
• Other factors that can contribute to higher program influence at the project level include:
o Incentives help to offset higher first cost of energy efficiency enhancements
o Energy modeling reinforces the values proposition of EE measures
o Incentives reduce measure payback periods
o Secondary peer-review of projects is valued by survey respondents
o Design team incentives provide motivation for energy efficiency enhancements
• There are several factors that add uncertainty to the NTG survey results:
o The survey relies primarily on human memories of events that happened years prior.
Construction delays may increase the lag time between energy efficiency decision-making
and survey completion beyond a decade in extreme cases.
o Decision maker may have moved on to other employment or retirement, and the remaining
decision-makers may not have been as well-informed
o Some primary decision makers are unresponsive, so secondary (and possibly sub-optimal)
decision-makers are left to complete the survey
The evaluation team is cognizant of these factors, and uses all means available to mitigate these
uncertainties using veteran and qualified surveyors. In the case of failing memories, the surveyor will
discuss project details in order to precipitate recall and will move on to another decision-maker or design
team member if the designated decision maker can’t remember the decision. Similarly, we have located
decision-makers to the current employer when they have moved on, and have even called them after
retirement. We monitor the quality, consistency and confidence in the survey responses and will ask for a
more informed individual, such as a design team member, if the designated decision-maker answers

2013 IALC4 NRNC Whole Building Impact Evaluation Draft Report
DNV GL 53 Net to Gross Results
inconsistent or a disinterested fashion. The evaluation team believes that this provides the most valid and
defensible surveys results as possible.
Recommendations
Medium high NTGR is an issue for the program.
Since many design features and equipment choices are established in the early stages of whole building new
construction projects, it follows that the earlier the involvement with the program, the greater the potential
influence that the program has on the project. For example, the average NTGR of 17 projects in the sample
that reported that initial contact with the program was during or before the design phase was 0.53. The six
projects that indicated initial contact with the program was after the design phase had an average NTGR of
0.45.
One possible solution to reduce free ridership is to shift program delivery to attract earlier project
involvement. One suggestion is to reduce incentive payments or disqualify projects that have completed and
committed designs before program interactions began. Conversely, greater incentives could be extended to
projects that get involved with the program in the early design stages. This scenario would require some
sort of “litmus test” to determine whether participants could be influenced by the program or not. This
approach could separate out the projects that are “applying for an incentive for a pre-determined design”
from those that are willing to consider better design alternatives.
The PAs should verify the decisionmakers are still with the organization as part of post-installation
verification or incentive payment. This way the most recent contact information can be recorded in the
project files, reducing the difficulties evaluators may face in locating decisionmakers(s) if they have moved
on.
2013 IALC4 NRNC Whole Building Impact Evaluation Draft Report
DNV GL 54 Project Practice Assessment Results
. PROJECT PRACTICE ASSESSMENT RESULTS 7
Introduction
This chapter discusses the results of the Project Practice Assessment (PPA) effort. The goal of the
PPAs is to provide qualitative, cost-effective, program-specific, impact-oriented findings and feedback
to the NRNC Whole Building program. PPAs are largely an application review process. Each claim
review evaluated conformity with policy guidance, with an emphasis on program administrator (PA)
NRNC Whole Building ex ante gross impact development methods. Furthermore, all M&V and
application review/verification points were reviewed for ESPI requirements for project EUL
assessments.
The PPA process was conducted on all the gross impact sample points. This process entailed a “desk
review” of project application paper work received from the PAs as part of the evaluation data request.
Project Practice Assessment Results
The following subsections present un-weighted PPA result for the 25 NRNC whole building projects33.
The PPA process, intended to group categories for comparison, is generally done by PA and by
customer agreement date (pre-2013 or 2013+). This segregation is meant to capture any effects of
the policy guidance issued based on precedents established in the EAR process (CPUC’s Decision D.
11-07-030 and subsequent ex ante-review-related decisions34). The evaluation team assumed that
guidance issued by ex ante reviews may take some time to get fully adopted by the PAs. Therefore, a
system wide impact of guidance from ex ante reviews would not likely get reflected in projects
committed before 2013.35 Some of these results are displayed but due to a small sample size it was
not possible to draw conclusions from the groupings. Only 3 of the 25 projects had customer signature
dates from 2013+, however the results by time period are still displayed in the following tables. All but
33 One whole building site was split into two measures which totals to 26 measures sampled.
34 http://docs.cpuc.ca.gov/published/FINAL_DECISION/139858.htm. Decision 11-07-030
The EAR process involves an M&V-level of review for PA projects that are under development, prior to claims. CPUC staff and their
contractors participate in these reviews and seek to actively influence the outcome of associated ex ante project savings estimates, as
well as PA within-program engineering processes and procedures more generally. Importantly, D. 11-07-030 features detailed baseline
requirements that were hypothesized to have significant influence on PA project results, including remaining useful life/effective useful
life (RUL/EUL) treatment and the need to demonstrate and document all associated early replacement (ER) claims.
35 Ex ante reviews commenced from September 2011 through February 2012 and reached a steady state in 2013 when review processes
were largely settled.
2013 IALC4 NRNC Whole Building Impact Evaluation Draft Report
DNV GL 55 Project Practice Assessment Results
one site had customer agreement dates missing from PA tracking data. The missing customer
agreement date was estimated for the PPA based on the project application and installation date
based on similar project patterns for that PA.
7.1.1 Overview of the Project Practice Assessment
The PPA is broken down into several main categories. The discussion below summarizes
recommendations from the following subsections of the PPA. Each subcategory contains findings listed
in tables and written form along, with recommendations based on evaluator and PA comparison. The
categories addressed are:
• Project eligibility
• Baseline selection and documentation
• EUL/RUL
• Cost and incentive documentation and calculations
• Calculation methods; models/methods, inputs, and assumptions
These categories were assessed based on documentation provided by the PA’s along with the quality
and appropriateness of the ex ante methods and results. Assessments were ranked on a scale from 1
to 5, with 1 indicating the ex ante conclusion did not meet expectations and 5 indicating the ex ante
conclusion consistently exceeded expectations. A score of 3 means the ex ante approach meets
expectations for a given PPA This scoring scale was derived from ex ante ESPI scoring criteria
identified in Attachment 5 of CPUC Decision R.12-01-005.
7.1.2 Project Eligibility Considerations
This section of the PPA form addresses relevant project eligibility considerations such as program rules,
CPUC decisions/guidance, and ex ante review (EAR) guidance. The evaluator reviewed PA project
documentation to determine which eligibility considerations were taken into account during the claim
review process for a given measure. Project Eligibility assessment entails reviewing PA-provided
documentation such as calculation results, spreadsheets, energy models, project documents, etc. to
determine if the program criteria are met for the project to be eligible for incentive. Then, the
evaluator indicated which eligibility requirements should have been examined for that measure type
and application based on their own review.
Findings
Table 19 shows the summary of eligibility considerations. Overall, PA and evaluator conclusions all
matched in this category
Recommendations
The evaluator does not see a need for further recommendations in this category.

2013 IALC4 NRNC Whole Building Impact Evaluation Draft Report
DNV GL 56 Project Practice Assessment Results
Table 19: Comparison of PA and Ex-Post M&V Eligibility Considerations by Customer
Agreement Date
Parameter Examined PA Ex-Post
M&V
Pre-2013 Customer Agreement Date
Number of measures evaluated (N) 23
Number of measures with eligibility considerations documented (N) 23 23
Frequency of eligibility considerations documented (N)
Program rules 100% 100%
Normal maintenance 0% 0%
Operating practice change 0% 0%
CPUC decisions 0% 0%
CPUC guidance 0% 0%
Requirement that measures exceed baseline 100% 100%
Previous EAR guidance 0% 0%
Previous evaluation findings 0% 0%
Project boundary condition 0% 0%
EE Policy Manual 0% 0%
Multiple PA fuels (includes cogeneration and fuel switching) 0% 0%
Three prong test 0% 0%
Non-PA fuels and ancillary impacts (i.e., cogen, refinery gas, waste heat recovery, etc.) 0% 0%
Other 0% 0%
2013+ Customer Agreement Date
Number of measures evaluated (N) 3
Number of measures with eligibility considerations documented (N) 3 3
Frequency of eligibility considerations documented (N)
Program rules 100% 100%
Normal maintenance 0% 0%
Operating practice change 0% 0%
CPUC decisions 0% 0%
CPUC guidance 0% 0%
Requirement that measures exceed baseline 100% 100%
Previous EAR guidance 0% 0%
Previous evaluation findings 0% 0%
Project boundary condition 0% 0%
EE Policy Manual 0% 0%
Multiple PA fuels (includes cogeneration and fuel switching) 0% 0%
Three prong test 0% 0%
Non-PA fuels and ancillary impacts (i.e., cogen, refinery gas, waste heat
recovery, etc.) 0% 0%
Other 0% 0%
7.1.3 Project Eligibility Ratings
The two primary objectives of this portion of the PPA are to rate the Quality of the documentation
supporting measure eligibility and then to rate the Appropriateness of the PA assessment of eligibility
requirements. Quality of the documentation is the extent in which details are specified relative to the
scope of the project and its key parameters. Appropriateness is the how pertinent the provided
documentation was in relation to the measure or project.
2013 IALC4 NRNC Whole Building Impact Evaluation Draft Report
DNV GL 57 Project Practice Assessment Results
Findings
Table 20 addresses the assessment of eligibility documentation and appropriateness. Overall each PA
provided adequate information that met expectations for examining eligibility. Based on PA
documentation the evaluator determined that all ex ante measures were eligible except one. For this
one project the ex ante chosen baseline was inappropriate and didn’t follow the appropriate building
use type which resulted in the savings that were less than 10% of Title-24 building TDV standard
which is below the SBD program’s eligibility requirements. The ranges of appropriateness ratings were
2.8 to 3. Two of twenty-six measures received ratings below expectations and one measure had a
rating of four, exceeding expectations. Whereas the range for the documentation quality category
ratings were slightly higher, from 3.0 to 3.2, consisting of 3 measures receiving ratings of 4 where
documentation quality exceeded expectations.
Recommendations
In order to continue to minimize this eligibility discrepancy, PAs should carefully review the model
baseline and make sure that the baseline equipment and conditions meet the applicable Title-24 code
and ACM manual.
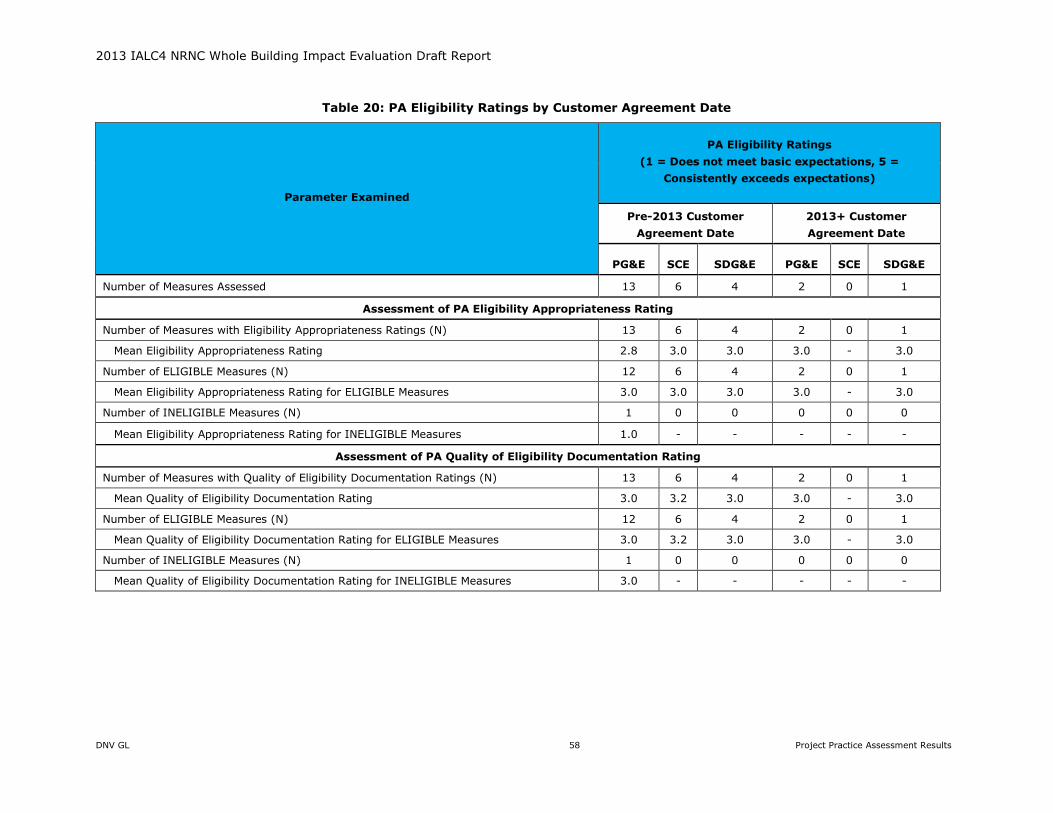
2013 IALC4 NRNC Whole Building Impact Evaluation Draft Report
DNV GL 58 Project Practice Assessment Results
Table 20: PA Eligibility Ratings by Customer Agreement Date
Parameter Examined
PA Eligibility Ratings
(1 = Does not meet basic expectations, 5 =
Consistently exceeds expectations)
Pre-2013 Customer
Agreement Date
2013+ Customer
Agreement Date
PG&E SCE SDG&E PG&E SCE SDG&E
Number of Measures Assessed 13 6 4 2 0 1
Assessment of PA Eligibility Appropriateness Rating
Number of Measures with Eligibility Appropriateness Ratings (N) 13 6 4 2 0 1
Mean Eligibility Appropriateness Rating 2.8 3.0 3.0 3.0 - 3.0
Number of ELIGIBLE Measures (N) 12 6 4 2 0 1
Mean Eligibility Appropriateness Rating for ELIGIBLE Measures 3.0 3.0 3.0 3.0 - 3.0
Number of INELIGIBLE Measures (N) 1 0 0 0 0 0
Mean Eligibility Appropriateness Rating for INELIGIBLE Measures 1.0 - - - - -
Assessment of PA Quality of Eligibility Documentation Rating
Number of Measures with Quality of Eligibility Documentation Ratings (N) 13 6 4 2 0 1
Mean Quality of Eligibility Documentation Rating 3.0 3.2 3.0 3.0 - 3.0
Number of ELIGIBLE Measures (N) 12 6 4 2 0 1
Mean Quality of Eligibility Documentation Rating for ELIGIBLE Measures 3.0 3.2 3.0 3.0 - 3.0
Number of INELIGIBLE Measures (N) 1 0 0 0 0 0
Mean Quality of Eligibility Documentation Rating for INELIGIBLE Measures 3.0 - - - - -

2013 IALC4 NRNC Whole Building Impact Evaluation Draft Report
DNV GL 59 Project Practice Assessment Results
7.1.4 Project Types
Project Type Assessment is an overview of the PA versus ex post project type designations. Project
Type may be defined as early replacement, natural replacement, replace-on-burnout, capacity
expansion, new construction, add-on measure, or system optimization.
Findings
The NRNC Whole Building Program consisted of 25 projects (26 measures). Twenty two of these
measures were listed as a New Construction project type and 4 were listed as Major Renovations. All
Major Renovation project types had a listed customer agreement date pre-2013. In all cases the
evaluator agreed with PA conclusion for project type.
Recommendations
The evaluator does not see a need for further recommendations in this category.
7.1.5 Project Baselines
This section presents an overview of the PA versus ex post project baseline designations. Baseline
designations are crucial when computing savings from the proposed energy models. The baseline is
defined based on the building type and scope of the project.
Findings
NRNC PA designations were primarily Title 24 code and Industry Standard Practices (when applicable).
Examples of Industry Standard Practice documents applicable for Whole Building projects include
refrigerated warehouses, laboratories, grocery store refrigeration measures, and hospital baselines.
For project baseline designations in the NRNC Whole Building Program, the evaluator and PA
conclusion were identical with the exception of one case. A PA designated baseline for one project was
indicated as a healthcare facility when in fact the evaluator deemed this project as a clinic/office
building that did not need to comply with healthcare specific ISP. Table 21 displays these findings. The
reason evaluator’s findings display 8 ISP measures as compared to PA’s ex ante claim of 9 ISP
measures is due to the fact that one of the PA’s ISP claimed project didn’t meet the ISP criteria for the
healthcare facility. As stated above, this project should have used T-24 building standard as baseline
because this building is a medical clinic with no special pressurization requirements that could have
triggered to use healthcare ISP as baseline. In all but one industrial related project, which used ISP
baselines, Title 24 was a part of the project baseline for whole building.
Recommendations
To avoid this discrepancy PAs should thoroughly review healthcare-related building projects and
determine the occupancy categories of these projects. If the building occupancy is subjected to review
and approval by the Office of Statewide Health Planning and Development (OSHPD), the building is
not required to comply with the Title 24 standards but should be covered by the SBD Healthcare
Modeling Procedures. Any other types of hospital buildings that are not subject to the OSHPD
requirements must use the appropriate Title 24 baseline. For example, medical office buildings that
are not subject to any specific design requirements dictated by OSHPD and therefore should be
approached using conventional Savings by Design procedures and occupancies that are already in
place in Title -24.
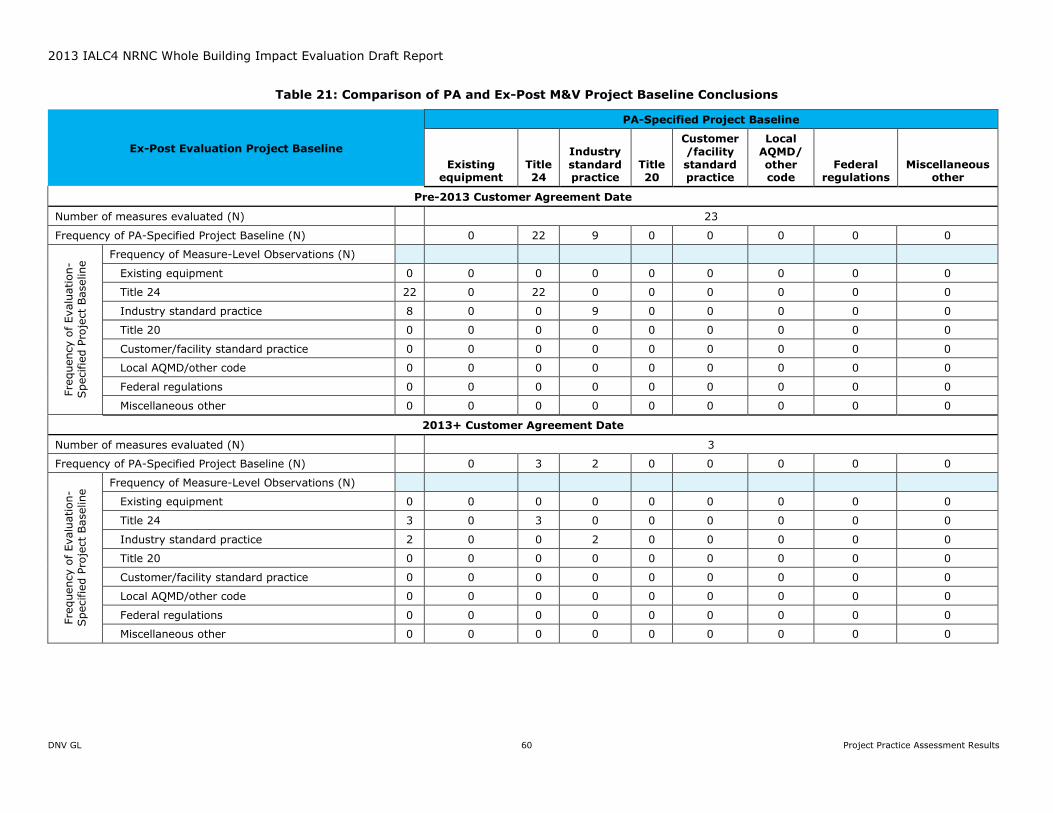
2013 IALC4 NRNC Whole Building Impact Evaluation Draft Report
DNV GL 60 Project Practice Assessment Results
Table 21: Comparison of PA and Ex-Post M&V Project Baseline Conclusions
Ex-Post Evaluation Project Baseline
PA-Specified Project Baseline
Existing equipment
Title 24
Industry
standard practice
Title 20
Customer
/facility standard practice
Local
AQMD/ other code
Federal regulations
Miscellaneous other
Pre-2013 Customer Agreement Date
Number of measures evaluated (N) 23
Frequency of PA-Specified Project Baseline (N) 0 22 9 0 0 0 0 0
Fre
quency o
f Evalu
ation-
Specifie
d P
roje
ct
Baseline Frequency of Measure-Level Observations (N)
Existing equipment 0 0 0 0 0 0 0 0 0
Title 24 22 0 22 0 0 0 0 0 0
Industry standard practice 8 0 0 9 0 0 0 0 0
Title 20 0 0 0 0 0 0 0 0 0
Customer/facility standard practice 0 0 0 0 0 0 0 0 0
Local AQMD/other code 0 0 0 0 0 0 0 0 0
Federal regulations 0 0 0 0 0 0 0 0 0
Miscellaneous other 0 0 0 0 0 0 0 0 0
2013+ Customer Agreement Date
Number of measures evaluated (N) 3
Frequency of PA-Specified Project Baseline (N) 0 3 2 0 0 0 0 0
Fre
quency o
f Evalu
ation-
Specifie
d P
roje
ct
Baseline Frequency of Measure-Level Observations (N)
Existing equipment 0 0 0 0 0 0 0 0 0
Title 24 3 0 3 0 0 0 0 0 0
Industry standard practice 2 0 0 2 0 0 0 0 0
Title 20 0 0 0 0 0 0 0 0 0
Customer/facility standard practice 0 0 0 0 0 0 0 0 0
Local AQMD/other code 0 0 0 0 0 0 0 0 0
Federal regulations 0 0 0 0 0 0 0 0 0
Miscellaneous other 0 0 0 0 0 0 0 0 0
2013 IALC4 NRNC Whole Building Impact Evaluation Draft Report
DNV GL 61 Project Practice Assessment Results
7.1.6 Project Baseline Documentation Quality
Baseline documentation includes the code year, equipment detail, project use type, and other
parameters defining the standard project type defined by appropriate code. Assessment of the quality
presents how clear data pertaining to establishment of the baseline was presented in PA’s submitted
documents.
Findings
Table 22 outlines the summary of the PA documentation quality used for establishing project baselines.
In projects pre-2013 and 2013+, applicable codes were documented and the mean scores by PA
ranged between 2.5 and 3.0. In the NRNC Whole Building Program the Title 24 code would be the
baseline in most cases due to the nature of whole building new construction projects. There were also
a few cases where ISP determined the baseline. The evaluator confirmed the correct baseline
documentation in the ex post comparison.
Two projects used additional baseline information as listed in the table. The SCE project was an
industrial based measure that needed to factor in other equipment and facility baseline parameters.
For one of the PG&E 2013+ sites, the implementer-provided ISP documents were not available in the
ex ante review and had to be requested for the ex post analysis, as noted in the first source line item
in Table 22. The industrial SCE site took into consideration some other baseline information seen in
Table 22. Most NRNC Whole Building Projects rely on whole building simulation software that
generates the baseline to the appropriate Title 24 standards, which is evident in 100% of baselines
sources utilizing this code. There are several places within PA documentation in which the Title 24
Standards compared to the proposed design are referenced which meets expectations and received a
rating of 3. More granular Title-24-specific details related to equipment or design scope were
sometimes absent, but this will be discussed further in baseline ratings. Circumstances where specifics
within the Title 24 documentation were missing or unclear are what caused the ratings to fall below
expectations.
Recommendations
The evaluator recommends making sure any relevant baseline documents and any ISP documents are
included.
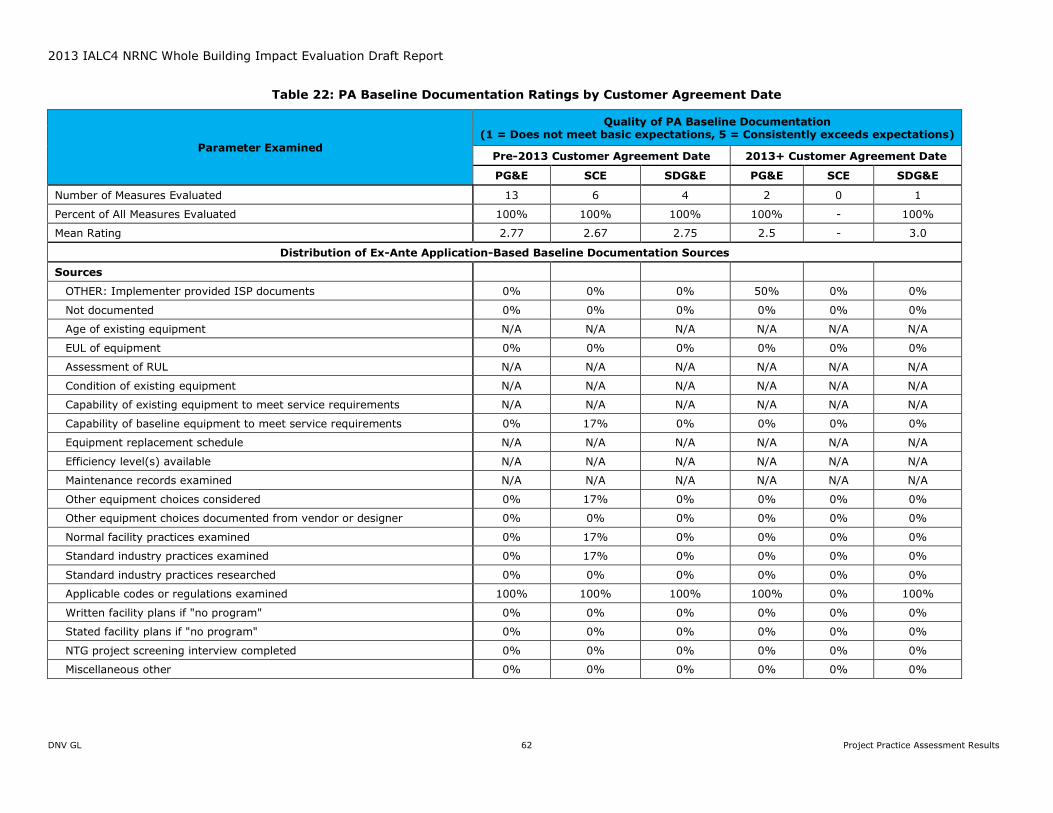
2013 IALC4 NRNC Whole Building Impact Evaluation Draft Report
DNV GL 62 Project Practice Assessment Results
Table 22: PA Baseline Documentation Ratings by Customer Agreement Date
Parameter Examined
Quality of PA Baseline Documentation (1 = Does not meet basic expectations, 5 = Consistently exceeds expectations)
Pre-2013 Customer Agreement Date 2013+ Customer Agreement Date
PG&E SCE SDG&E PG&E SCE SDG&E
Number of Measures Evaluated 13 6 4 2 0 1
Percent of All Measures Evaluated 100% 100% 100% 100% - 100%
Mean Rating 2.77 2.67 2.75 2.5 - 3.0
Distribution of Ex-Ante Application-Based Baseline Documentation Sources
Sources
OTHER: Implementer provided ISP documents 0% 0% 0% 50% 0% 0%
Not documented 0% 0% 0% 0% 0% 0%
Age of existing equipment N/A N/A N/A N/A N/A N/A
EUL of equipment 0% 0% 0% 0% 0% 0%
Assessment of RUL N/A N/A N/A N/A N/A N/A
Condition of existing equipment N/A N/A N/A N/A N/A N/A
Capability of existing equipment to meet service requirements N/A N/A N/A N/A N/A N/A
Capability of baseline equipment to meet service requirements 0% 17% 0% 0% 0% 0%
Equipment replacement schedule N/A N/A N/A N/A N/A N/A
Efficiency level(s) available N/A N/A N/A N/A N/A N/A
Maintenance records examined N/A N/A N/A N/A N/A N/A
Other equipment choices considered 0% 17% 0% 0% 0% 0%
Other equipment choices documented from vendor or designer 0% 0% 0% 0% 0% 0%
Normal facility practices examined 0% 17% 0% 0% 0% 0%
Standard industry practices examined 0% 17% 0% 0% 0% 0%
Standard industry practices researched 0% 0% 0% 0% 0% 0%
Applicable codes or regulations examined 100% 100% 100% 100% 0% 100%
Written facility plans if "no program" 0% 0% 0% 0% 0% 0%
Stated facility plans if "no program" 0% 0% 0% 0% 0% 0%
NTG project screening interview completed 0% 0% 0% 0% 0% 0%
Miscellaneous other 0% 0% 0% 0% 0% 0%
2013 IALC4 NRNC Whole Building Impact Evaluation Draft Report
DNV GL 63 Project Practice Assessment Results
7.1.7 Project Baseline Ratings
To determine Project Baseline Ratings the evaluator reviews the relevant documentation, baseline
appropriateness scores reflect whether or not the PA correctly identified the project baseline. Baseline
description scores capture the extent to which PAs described the baseline equipment / efficiency rating.
Findings
Table 23 summarizes scores for baseline appropriateness and the baseline description, based on our
documentation review. The scores indicate whether or not the PA baseline conclusion was correctly identified.
In most cases the appropriateness rating met expectations. The appropriateness of the baseline was on
average higher than the documentation rating. Only 1 site received a rating of 1 or 2 for appropriateness,
but for documentation rating, 7 of the 26 measure received a score of either 1 or 2 for reasons listed in
Table 23.
In several instances, provided baseline documentation did not necessarily match the type of equipment
being modeled. One example involves ex ante documentation indicating a Variable Speed Air Handling Unit
serving VAV and CAV boxes in a lab zone, but in the ex ante model all zones were VAV. The correct baseline
could not be determined until ex post inspection because of contradictory information. Ex-post verification
provides this insight, but the documentation alone what not clear enough to resolve the discrepancy. In
other cases it was not clear which parameters or models were intentionally revised, and there were no
details accompanying documentation. This resulted either in more PA data requests, reaching out to
implementers for baseline related documents, or in-depth investigating simulation software files.
Recommendations
The evaluator recommends including more details on any project baseline changes and updating
documentation if the project scope changes over the course of construction.
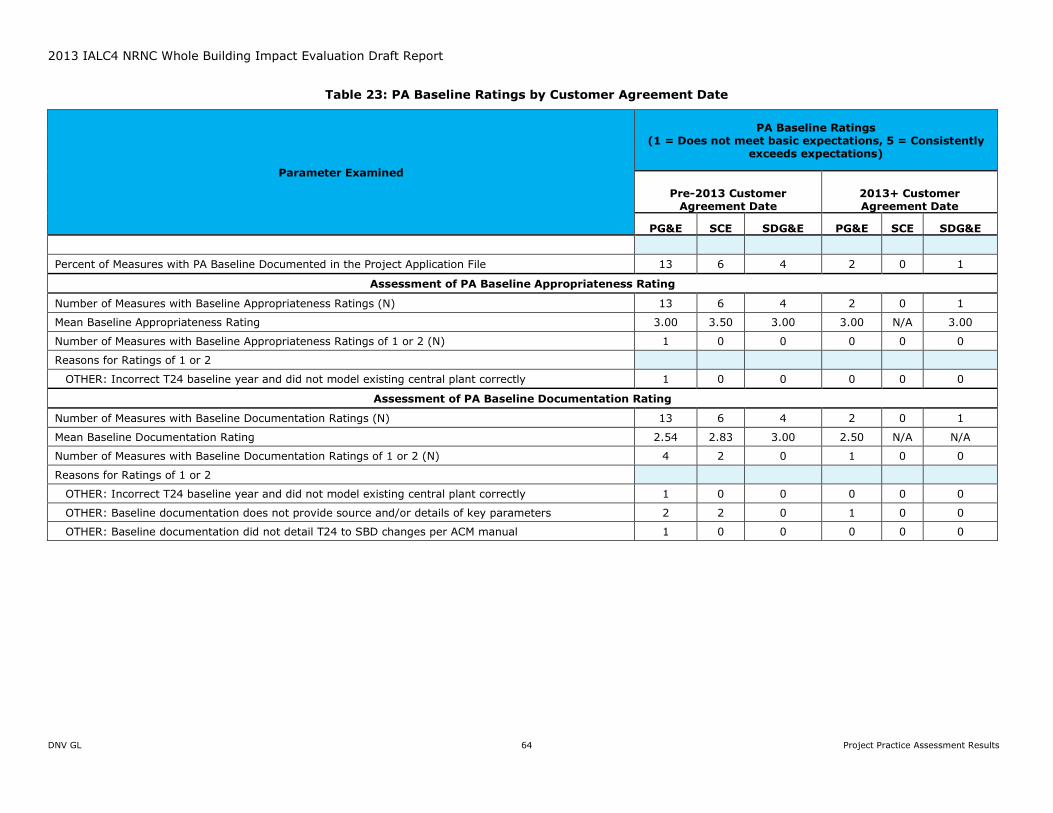
2013 IALC4 NRNC Whole Building Impact Evaluation Draft Report
DNV GL 64 Project Practice Assessment Results
Table 23: PA Baseline Ratings by Customer Agreement Date
Parameter Examined
PA Baseline Ratings (1 = Does not meet basic expectations, 5 = Consistently
exceeds expectations)
Pre-2013 Customer Agreement Date
2013+ Customer Agreement Date
PG&E SCE SDG&E PG&E SCE SDG&E
Percent of Measures with PA Baseline Documented in the Project Application File 13 6 4 2 0 1
Assessment of PA Baseline Appropriateness Rating
Number of Measures with Baseline Appropriateness Ratings (N) 13 6 4 2 0 1
Mean Baseline Appropriateness Rating 3.00 3.50 3.00 3.00 N/A 3.00
Number of Measures with Baseline Appropriateness Ratings of 1 or 2 (N) 1 0 0 0 0 0
Reasons for Ratings of 1 or 2
OTHER: Incorrect T24 baseline year and did not model existing central plant correctly 1 0 0 0 0 0
Assessment of PA Baseline Documentation Rating
Number of Measures with Baseline Documentation Ratings (N) 13 6 4 2 0 1
Mean Baseline Documentation Rating 2.54 2.83 3.00 2.50 N/A N/A
Number of Measures with Baseline Documentation Ratings of 1 or 2 (N) 4 2 0 1 0 0
Reasons for Ratings of 1 or 2
OTHER: Incorrect T24 baseline year and did not model existing central plant correctly 1 0 0 0 0 0
OTHER: Baseline documentation does not provide source and/or details of key parameters 2 2 0 1 0 0
OTHER: Baseline documentation did not detail T24 to SBD changes per ACM manual 1 0 0 0 0 0
2013 IALC4 NRNC Whole Building Impact Evaluation Draft Report
DNV GL 65 Project Practice Assessment Results
7.1.8 EUL Assessment
EUL assessment provides a comparison of the EUL values that were documented in the PA tracking data,
project application, and the ex post site reports and provides a summary of the EUL sources. EUL is used in
lifecycle savings calculations on the whole building projects. Since these are newly constructed whole
building projects RUL (remaining useful life) and dual baseline considerations in lifecycle savings are not
relevant.
Findings
Table 24 summarizes EUL comparisons from PA tracking data and project documentation. The most
prominent differences between PA EUL data and evaluator ex post EULs were the fact that PG&E tracking
data did not include any EUL values. All site EULs were populated with zeroes. In addition, not one single
project had an EUL documented in the project documents. This shortcoming resulted in large differences
between PA and evaluator conclusions. Projects that had an EUL included in tracking data, but no EUL in
project documents received a rating of 2. Projects with no EUL reported anywhere, received a rating of 1.
For analysis, we had to extract PG&E EUL values from the PG&E’s 2013 SBD E3 calculator.
Since all NRNC Whole Building projects fall under New Construction or Major Renovation baselines, there is
no applicability for RUL values in the savings calculations, and there were no RUL data to be assessed. All
lifecycle savings are computed with EULs alone.
Ex-post EUL values were created from end-use savings-weighted 2014 DEER EUL values. The SCE and
SDG&E EUL values that existed in the tracking data were not accompanied by a source, therefore the
evaluator was not able to determine how the PA’s calculated project EUL values. It was not possible to
further investigate EUL differences without this data. There was no distinction between these patterns
between pre-2013 and 2013+ EUL documentation.
Recommendations
EUL is crucial for lifecycle savings calculations, and the evaluator recommends collecting EULs for each
measure of the Whole Building project from DEER and calculating the project EUL by weighting them by
measure savings. Then this weighted average EUL should be assigned to the project level for the Whole
Building projects to estimate project life cycle savings. Additionally, it is recommended to include EUL as a
required field on the utility incentive worksheet or on project application.
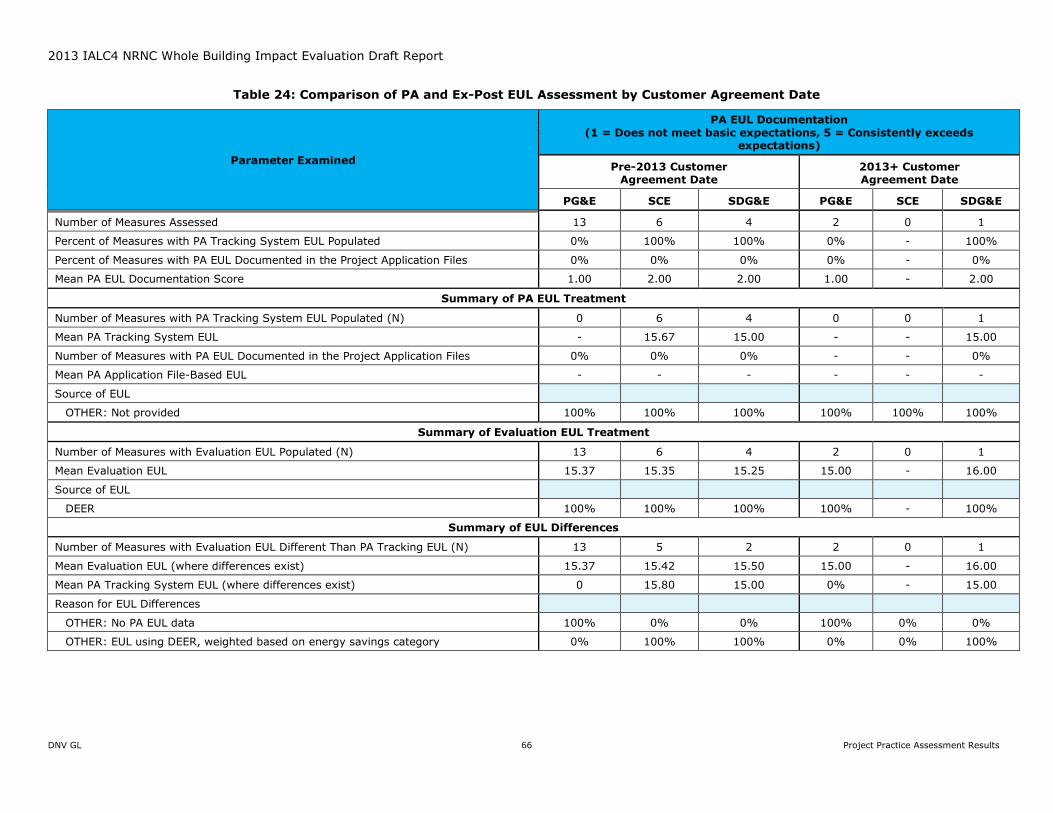
2013 IALC4 NRNC Whole Building Impact Evaluation Draft Report
DNV GL 66 Project Practice Assessment Results
Table 24: Comparison of PA and Ex-Post EUL Assessment by Customer Agreement Date
Parameter Examined
PA EUL Documentation
(1 = Does not meet basic expectations, 5 = Consistently exceeds expectations)
Pre-2013 Customer Agreement Date
2013+ Customer Agreement Date
PG&E SCE SDG&E PG&E SCE SDG&E
Number of Measures Assessed 13 6 4 2 0 1
Percent of Measures with PA Tracking System EUL Populated 0% 100% 100% 0% - 100%
Percent of Measures with PA EUL Documented in the Project Application Files 0% 0% 0% 0% - 0%
Mean PA EUL Documentation Score 1.00 2.00 2.00 1.00 - 2.00
Summary of PA EUL Treatment
Number of Measures with PA Tracking System EUL Populated (N) 0 6 4 0 0 1
Mean PA Tracking System EUL - 15.67 15.00 - - 15.00
Number of Measures with PA EUL Documented in the Project Application Files 0% 0% 0% - - 0%
Mean PA Application File-Based EUL - - - - - -
Source of EUL
OTHER: Not provided 100% 100% 100% 100% 100% 100%
Summary of Evaluation EUL Treatment
Number of Measures with Evaluation EUL Populated (N) 13 6 4 2 0 1
Mean Evaluation EUL 15.37 15.35 15.25 15.00 - 16.00
Source of EUL
DEER 100% 100% 100% 100% - 100%
Summary of EUL Differences
Number of Measures with Evaluation EUL Different Than PA Tracking EUL (N) 13 5 2 2 0 1
Mean Evaluation EUL (where differences exist) 15.37 15.42 15.50 15.00 - 16.00
Mean PA Tracking System EUL (where differences exist) 0 15.80 15.00 0% - 15.00
Reason for EUL Differences
OTHER: No PA EUL data 100% 0% 0% 100% 0% 0%
OTHER: EUL using DEER, weighted based on energy savings category 0% 100% 100% 0% 0% 100%
2013 IALC4 NRNC Whole Building Impact Evaluation Draft Report
DNV GL 67 Project Practice Assessment Results
7.1.9 Incremental Cost Ratings Assessment
The incremental cost ratings for each measure, the appropriateness, the quality, and the
documentation were rated. In order for a given measure to obtain appropriateness score of 3 (meets
expectations) the incremental cost data must be provided and must be relevant for the chosen
baseline. The incremental cost quality rating is a measurement of the reliability of the cost data
sources. Reliable sources would include invoices, price quotes from manufacturers, and etc. Finally,
the documentation score reflects the level of detail included in the cost data sources. A
documentation quality score of 3 would indicate that costs were itemized by measures and include
some level of detail on the measure specifications.
Findings
PA cost documentation was provided for all 26 assessed measures. Some measures included both full
cost data and incremental cost data, but for this assessment of the NRNC Whole Building Program,
only an incremental cost assessment was applicable. Incremental cost findings are presented in Table
25. Evaluator examination of the cost documents indicate that while incremental cost data existed, it
did not always meet quality or appropriate expectations. This is evident in the fact that 17 of 26
measures received a score of 1 or 2 for the incremental cost documentation rating. These low ratings
of 1 or 2 were usually due to unreferenced sources or unclear cost data, i.e. not separated out by
measure but just a total reported incremental cost. Some of the referenced sources were the names of
previous implementer project documents, which were not provided, nor did documentation contain
any links to referenced documents to verify the incremental cost claims.
Program rules indicate incentive caps relative to incremental cost, which makes these pieces of data
crucial to other aspects of the project. In several projects incremental cost documentation was
provided at various project stages while the scope or equipment types were still changing. Having a
final sheet listing incremental cost by equipment type or a traceable category to match with
equipment and the final savings model and incentive would make the final PA conclusion more
prominent and increase project cost/incentive transparency.
Recommendations
The evaluator recommends standardizing incremental cost documentation where both the baseline
and the installed measure cost data should be provided along with their reference sources to validate
the incremental cost estimates.
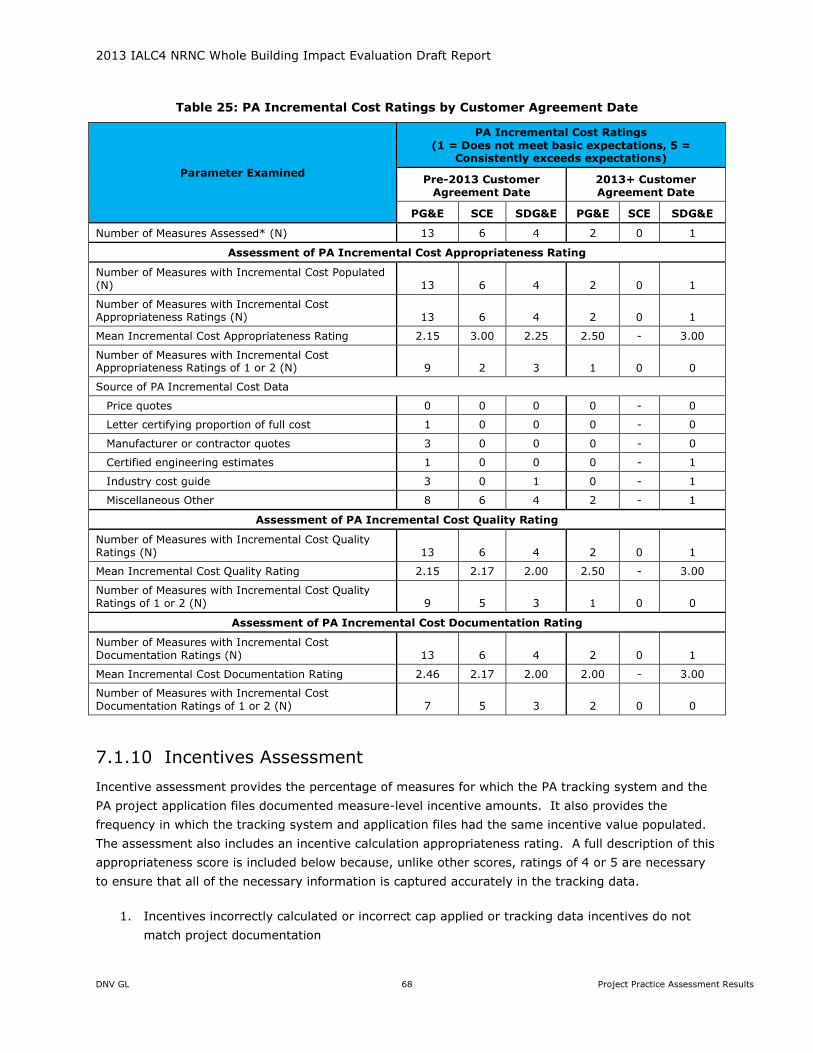
2013 IALC4 NRNC Whole Building Impact Evaluation Draft Report
DNV GL 68 Project Practice Assessment Results
Table 25: PA Incremental Cost Ratings by Customer Agreement Date
Parameter Examined
PA Incremental Cost Ratings
(1 = Does not meet basic expectations, 5 = Consistently exceeds expectations)
Pre-2013 Customer Agreement Date
2013+ Customer Agreement Date
PG&E SCE SDG&E PG&E SCE SDG&E
Number of Measures Assessed* (N) 13 6 4 2 0 1
Assessment of PA Incremental Cost Appropriateness Rating
Number of Measures with Incremental Cost Populated (N) 13 6 4 2 0 1
Number of Measures with Incremental Cost Appropriateness Ratings (N) 13 6 4 2 0 1
Mean Incremental Cost Appropriateness Rating 2.15 3.00 2.25 2.50 - 3.00
Number of Measures with Incremental Cost Appropriateness Ratings of 1 or 2 (N) 9 2 3 1 0 0
Source of PA Incremental Cost Data
Price quotes 0 0 0 0 - 0
Letter certifying proportion of full cost 1 0 0 0 - 0
Manufacturer or contractor quotes 3 0 0 0 - 0
Certified engineering estimates 1 0 0 0 - 1
Industry cost guide 3 0 1 0 - 1
Miscellaneous Other 8 6 4 2 - 1
Assessment of PA Incremental Cost Quality Rating
Number of Measures with Incremental Cost Quality Ratings (N) 13 6 4 2 0 1
Mean Incremental Cost Quality Rating 2.15 2.17 2.00 2.50 - 3.00
Number of Measures with Incremental Cost Quality Ratings of 1 or 2 (N) 9 5 3 1 0 0
Assessment of PA Incremental Cost Documentation Rating
Number of Measures with Incremental Cost Documentation Ratings (N) 13 6 4 2 0 1
Mean Incremental Cost Documentation Rating 2.46 2.17 2.00 2.00 - 3.00
Number of Measures with Incremental Cost Documentation Ratings of 1 or 2 (N) 7 5 3 2 0 0
7.1.10 Incentives Assessment
Incentive assessment provides the percentage of measures for which the PA tracking system and the
PA project application files documented measure-level incentive amounts. It also provides the
frequency in which the tracking system and application files had the same incentive value populated.
The assessment also includes an incentive calculation appropriateness rating. A full description of this
appropriateness score is included below because, unlike other scores, ratings of 4 or 5 are necessary
to ensure that all of the necessary information is captured accurately in the tracking data.
1. Incentives incorrectly calculated or incorrect cap applied or tracking data incentives do not
match project documentation

2013 IALC4 NRNC Whole Building Impact Evaluation Draft Report
DNV GL 69 Project Practice Assessment Results
2. Incentives correctly calculated but incorrect incentive cap applied or tracking data incentives
do not match project documentation
3. Incentive and cap correctly calculated but tracking data incentives do not match project
documentation
4. Incentives correctly calculated, appropriate cap used and the tracking data incentives match
the project calculations
5. Incentives correctly calculated, appropriate cap used and the tracking data incentives match
the project calculations for both full and incremental measure costs for an ER measure.
Findings
Table 26 outlines incentive assessment findings. Overall the PA incentive calculation methods and
incentive caps agreed with evaluator findings. The table first outlines the percentage of measures with
incentive amounts documented in the tracking data and then the project documentation. Tracking
data and project documents for every project scored a 100% for including incentive details. Based on
information from project documents, all of the appropriate incentive caps were applied when
necessary, resulting in all the incentives assessments receiving passing approval.
However there were some large discrepancies between the tracking data incentive amount and the
project document’s incentive amount for some PG&E and SCE sites. To account for rounding errors,
the evaluator documented that tracking data incentives matched the project documents if the values
were within ± $5. The sum of differences between tracking data incentives and project documents for
the 26 measures was -$148,661. There were 3 projects in particular that made up more than 90% of
this difference. These discrepancies between project documents and tracking data ranged
from -$70,850 to -$21,825. Having no further insight into the tracking data incentive values, it
appears there could be some significant inconsistencies in how design team incentives and other
incentives, such as LEED and Commissioning kickers, could be documented. It is also possible that
improper data calculation and entry occurred.
The approximately 5% difference in incentive amounts between project documents and tracking data
(just for the sampled projects) indicates there is uncertainty around tracking incentives associated
with various projects.
Recommendations
The evaluator recommends having more transparency and thoroughness when documenting incentive
data. Incentive amounts in the project documents should be verified to match what is listed in the
tracking data.
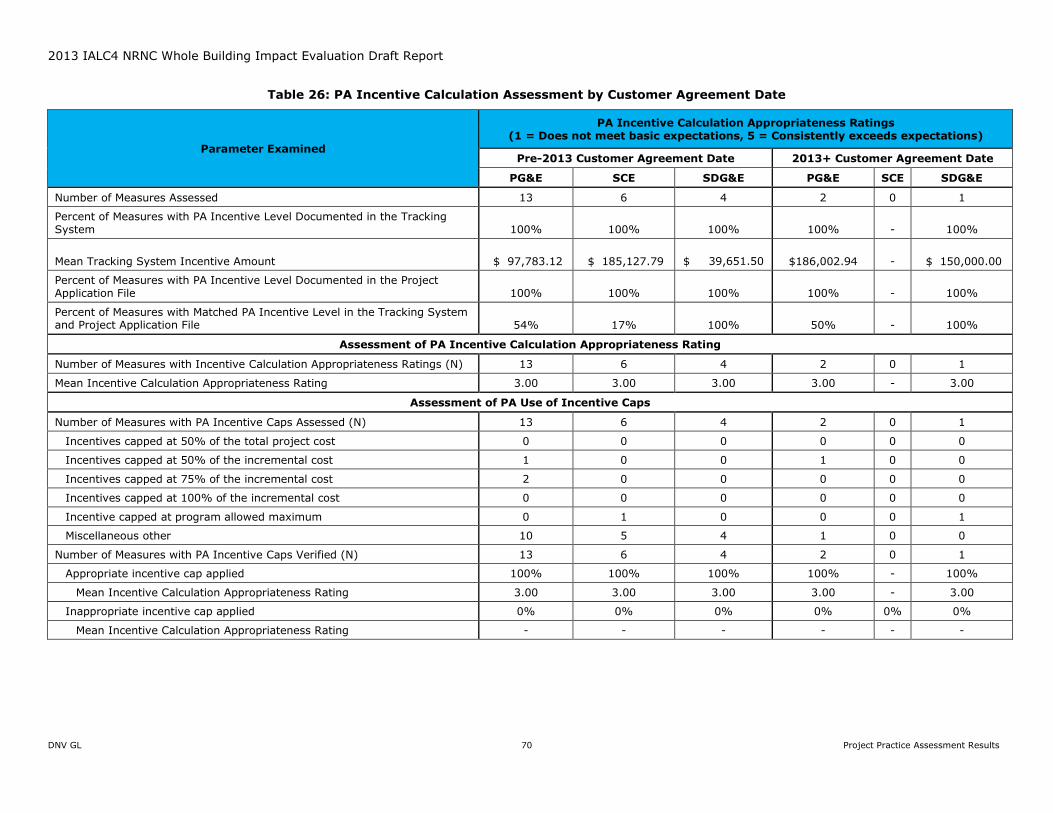
2013 IALC4 NRNC Whole Building Impact Evaluation Draft Report
DNV GL 70 Project Practice Assessment Results
Table 26: PA Incentive Calculation Assessment by Customer Agreement Date
Parameter Examined
PA Incentive Calculation Appropriateness Ratings (1 = Does not meet basic expectations, 5 = Consistently exceeds expectations)
Pre-2013 Customer Agreement Date 2013+ Customer Agreement Date
PG&E SCE SDG&E PG&E SCE SDG&E
Number of Measures Assessed 13 6 4 2 0 1
Percent of Measures with PA Incentive Level Documented in the Tracking System 100% 100% 100% 100% - 100%
Mean Tracking System Incentive Amount $ 97,783.12 $ 185,127.79
$ 39,651.50 $186,002.94 - $ 150,000.00
Percent of Measures with PA Incentive Level Documented in the Project Application File 100% 100% 100% 100% - 100%
Percent of Measures with Matched PA Incentive Level in the Tracking System and Project Application File 54% 17% 100% 50% - 100%
Assessment of PA Incentive Calculation Appropriateness Rating
Number of Measures with Incentive Calculation Appropriateness Ratings (N) 13 6 4 2 0 1
Mean Incentive Calculation Appropriateness Rating 3.00 3.00 3.00 3.00 - 3.00
Assessment of PA Use of Incentive Caps
Number of Measures with PA Incentive Caps Assessed (N) 13 6 4 2 0 1
Incentives capped at 50% of the total project cost 0 0 0 0 0 0
Incentives capped at 50% of the incremental cost 1 0 0 1 0 0
Incentives capped at 75% of the incremental cost 2 0 0 0 0 0
Incentives capped at 100% of the incremental cost 0 0 0 0 0 0
Incentive capped at program allowed maximum 0 1 0 0 0 1
Miscellaneous other 10 5 4 1 0 0
Number of Measures with PA Incentive Caps Verified (N) 13 6 4 2 0 1
Appropriate incentive cap applied 100% 100% 100% 100% - 100%
Mean Incentive Calculation Appropriateness Rating 3.00 3.00 3.00 3.00 - 3.00
Inappropriate incentive cap applied 0% 0% 0% 0% 0% 0%
Mean Incentive Calculation Appropriateness Rating - - - - - -
2013 IALC4 NRNC Whole Building Impact Evaluation Draft Report
DNV GL 71 Project Practice Assessment Results
7.1.11 Calculation Considerations Assessment
Calculation Considerations Assessment is a measure by measure comparison of PA versus evaluator
calculations along with the frequency in which the PA uses different methods of savings calculations.
Findings
Table 27 displays the calculation considerations used by the PAs and the ex post evaluators. Findings
from the Calculation Considerations assessment indicate an overall good match between the PA and
evaluator considerations. As a result of whole building modeling, both the PA and evaluator
considerations for all 25 projects included the following:
• CPUC policy and guidance
• Weather Normalization
• Seasonality considerations
• Interactive effects (all but one measure)
• Facility-based custom elements/inputs
• DEER inputs and assumptions
The main difference between PA and evaluator considerations was that PA post-installation activities
included only verification, while evaluator considerations included post-installation measurement and
verification. In addition 10 of the 25 projects underwent model calibration following evaluator M&V.
See Table 27 below for details. The one measure using PA calculation tools was part of an industrial
measure on a whole building project.
Recommendations
The evaluator does not see a need for further recommendations in this category.
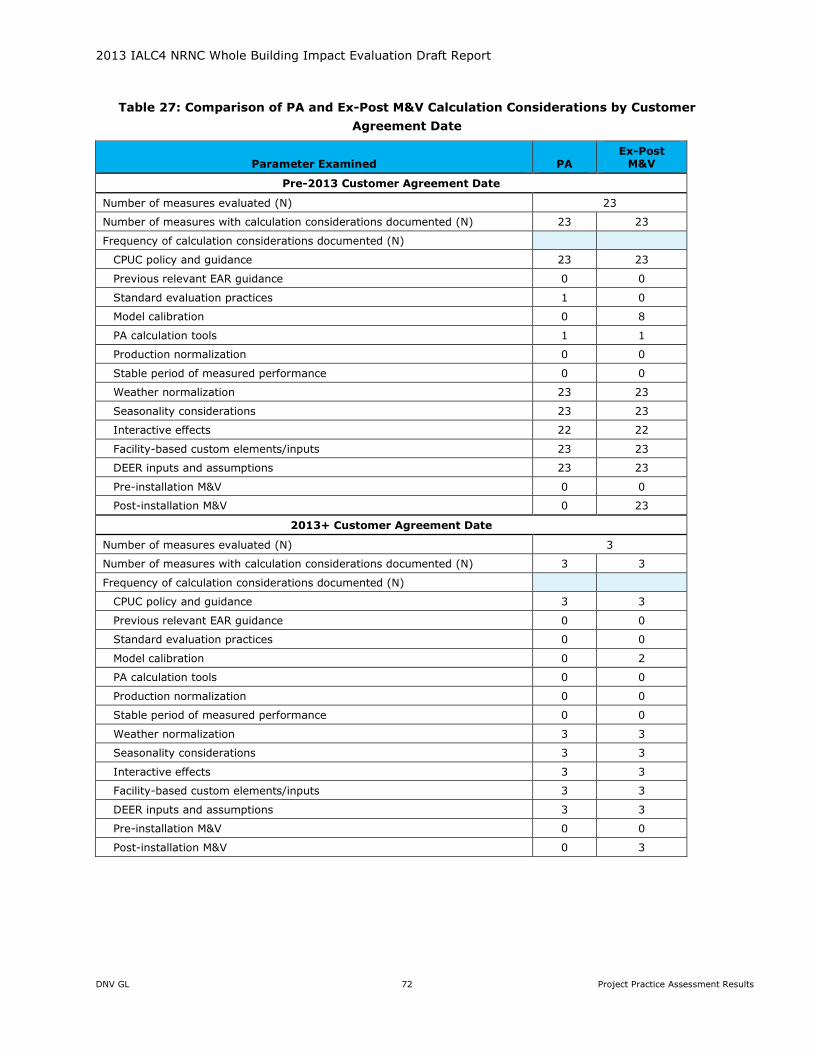
2013 IALC4 NRNC Whole Building Impact Evaluation Draft Report
DNV GL 72 Project Practice Assessment Results
Table 27: Comparison of PA and Ex-Post M&V Calculation Considerations by Customer
Agreement Date
Parameter Examined PA Ex-Post
M&V
Pre-2013 Customer Agreement Date
Number of measures evaluated (N) 23
Number of measures with calculation considerations documented (N) 23 23
Frequency of calculation considerations documented (N)
CPUC policy and guidance 23 23
Previous relevant EAR guidance 0 0
Standard evaluation practices 1 0
Model calibration 0 8
PA calculation tools 1 1
Production normalization 0 0
Stable period of measured performance 0 0
Weather normalization 23 23
Seasonality considerations 23 23
Interactive effects 22 22
Facility-based custom elements/inputs 23 23
DEER inputs and assumptions 23 23
Pre-installation M&V 0 0
Post-installation M&V 0 23
2013+ Customer Agreement Date
Number of measures evaluated (N) 3
Number of measures with calculation considerations documented (N) 3 3
Frequency of calculation considerations documented (N)
CPUC policy and guidance 3 3
Previous relevant EAR guidance 0 0
Standard evaluation practices 0 0
Model calibration 0 2
PA calculation tools 0 0
Production normalization 0 0
Stable period of measured performance 0 0
Weather normalization 3 3
Seasonality considerations 3 3
Interactive effects 3 3
Facility-based custom elements/inputs 3 3
DEER inputs and assumptions 3 3
Pre-installation M&V 0 0
Post-installation M&V 0 3
2013 IALC4 NRNC Whole Building Impact Evaluation Draft Report
DNV GL 73 Project Practice Assessment Results
7.1.12 Calculations Assessment
Calculation Assessment provides an assessment of the appropriateness, the documentation quality,
and the accuracy of the PA models in determining measure savings. The assessment also indicates if
the evaluator used the PA provided model, a similar model, or a different model for savings
calculations.
Findings
Table 28 provides Calculation Consideration comparison between PA and the evaluator. Findings show
that the PA and evaluator may have been in agreement, but the proper implementation of the
calculations was more inconsistent. Whole building energy simulation software was used in
calculations, but the correct modes, inputs, and assumptions were not always correct. Only 1 of the 25
projects was calculated in noncompliance mode using actual building schedules. Model calibration for
sites where it was applicable had significant impact on ex post results.
Mean scores for this assessment category ranged at mostly 2.0 - 2.5 due to the lack of using or
updating site specific parameters such as actual buildings schedules to run in noncompliance
simulation mode.
Recommendations
If PA post-installation verification could become measurement and verification focused, model
accuracy could increase using more accurate facility inputs, regardless of whether there is enough
data for calibration.

2013 IALC4 NRNC Whole Building Impact Evaluation Draft Report
DNV GL 74 Project Practice Assessment Results
Table 28: Assessment of PA Calculation Methods by Customer Agreement Date
Parameter Examined
PA Calculation Method Ratings (1 = Does not meet basic expectations, 5 = Consistently exceeds expectations)
Pre-2013 Customer Agreement Date 2013+ Customer Agreement Date
PG&E SCE SDG&E PG&E SCE SDG&E
Number of Measures Assessed 13 6 4 2 0 1
Assessment of Appropriateness of PA Savings Model
Number of Measures with PA Model Appropriateness Ratings (N) 13 6 4 2 0 1
Mean PA Model Appropriateness Rating 2.31 2.33 2.25 3.00 - 2.00
Median PA Model Appropriateness Rating 2.00 2.50 2.00 3.00 - 2.00
Assessment of Quality of PA Model Documentation
Number of Measures with PA Model Documentation Quality Ratings (N) 13 6 4 2 0 1
Mean PA Model Documentation Quality Rating 2.23 2.00 1.75 3.00 - 2.00
Median PA Model Documentation Quality Rating 2.00 2.00 2.00 3.00 - 2.00
Assessment of Accuracy of PA Model
Number of Measures with PA Model Accuracy Ratings (N) 13 6 4 2 0 1
Mean PA Model Accuracy Rating 2.08 1.83 2.00 2.50 - 2.00
Median PA Model Accuracy Rating 2.00 2.00 2.00 2.50 - 2.00
Assessment of Evaluation Use of PA Models
Number of Measures with an Assessment of Evaluation Use of PA Models (N) 13 6 4 2 0 1
Evaluation used a different model 0% 0% 0% 0% - 0%
Evaluation used a similar model 0% 0% 0% 0% - 0%
Evaluation adjusted PA model 100% 100% 100% 100% - 100%
2013 IALC4 NRNC Whole Building Impact Evaluation Draft Report
DNV GL 75 Project Practice Assessment Results
7.1.13 PA Inputs and Assumptions Assessment
Input and Assumptions Assessment summarizes the comprehensiveness, documentation, and accuracy
ratings for the PAs’ calculation methods’ inputs and assumptions and provides and assessment of the
evaluation’s use of the PAs’ inputs and assumptions. The evaluation team documented whether they used
different, similar, or adjusted inputs and assumptions compared to those used in the PAs’ calculation
methods.
Findings
Table 29 summarizes the comparison of calculation input and assumptions scores. PA and evaluator inputs
varied at some level in most projects. The majority of changes involved adjusting the PA inputs, but a
significant portion also used different PA inputs as seen below in the table. As shown, the mean
comprehensiveness, documentation, and accuracy ratings for each PA are below average indicating the PA
did not meet the evaluation team’s expectations.
Numerous savings models were not trued up to site findings even though the PA post verification indicated
differences between initial model assumptions and the verified findings. Calculating savings using incorrect
simulation modes, not using as built schedules, and not adjusting the as-found measure count in the PA
inspections are some of the reasons for lower calculation method scores. These parameters significantly
affect model accuracy and savings.
Recommendations
The evaluator recommendations that the PAs conduct more post-installation measurement and more
detailed post-installation verification, and include the updated inputs into their energy savings models and
calculations so that the ex ante claims appropriately reflect as-found parameters.
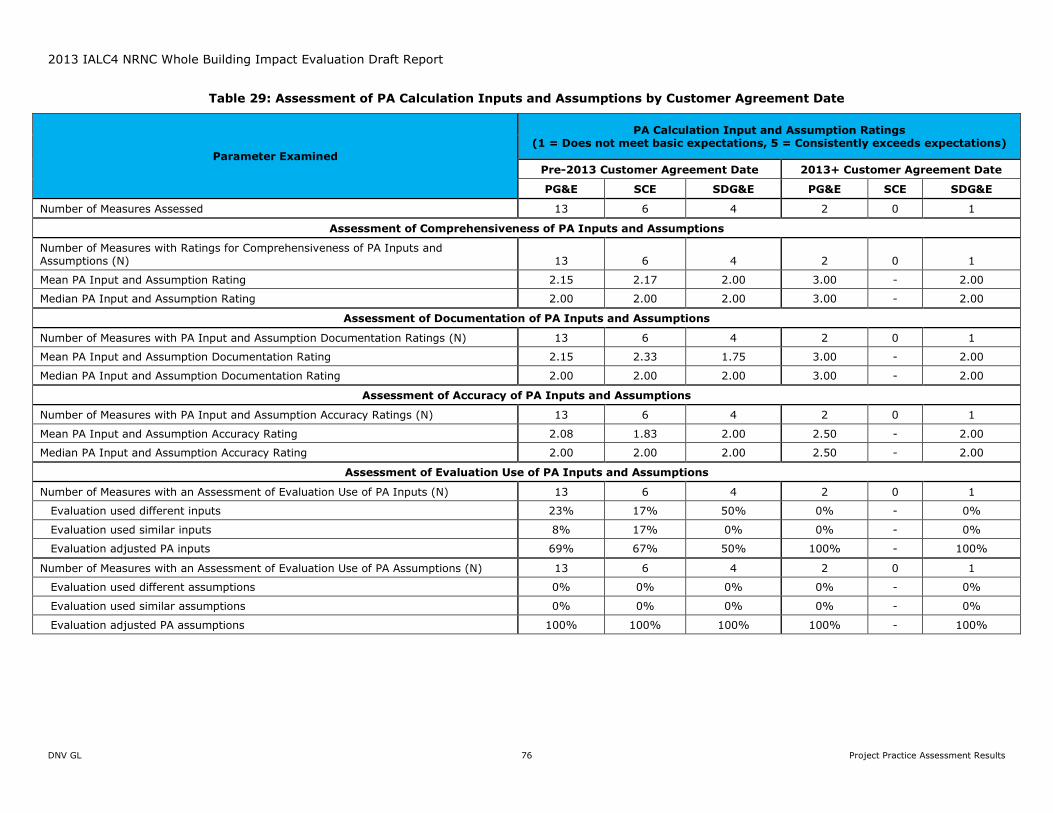
2013 IALC4 NRNC Whole Building Impact Evaluation Draft Report
DNV GL 76 Project Practice Assessment Results
Table 29: Assessment of PA Calculation Inputs and Assumptions by Customer Agreement Date
Parameter Examined
PA Calculation Input and Assumption Ratings (1 = Does not meet basic expectations, 5 = Consistently exceeds expectations)
Pre-2013 Customer Agreement Date 2013+ Customer Agreement Date
PG&E SCE SDG&E PG&E SCE SDG&E
Number of Measures Assessed 13 6 4 2 0 1
Assessment of Comprehensiveness of PA Inputs and Assumptions
Number of Measures with Ratings for Comprehensiveness of PA Inputs and Assumptions (N) 13 6 4 2 0 1
Mean PA Input and Assumption Rating 2.15 2.17 2.00 3.00 - 2.00
Median PA Input and Assumption Rating 2.00 2.00 2.00 3.00 - 2.00
Assessment of Documentation of PA Inputs and Assumptions
Number of Measures with PA Input and Assumption Documentation Ratings (N) 13 6 4 2 0 1
Mean PA Input and Assumption Documentation Rating 2.15 2.33 1.75 3.00 - 2.00
Median PA Input and Assumption Documentation Rating 2.00 2.00 2.00 3.00 - 2.00
Assessment of Accuracy of PA Inputs and Assumptions
Number of Measures with PA Input and Assumption Accuracy Ratings (N) 13 6 4 2 0 1
Mean PA Input and Assumption Accuracy Rating 2.08 1.83 2.00 2.50 - 2.00
Median PA Input and Assumption Accuracy Rating 2.00 2.00 2.00 2.50 - 2.00
Assessment of Evaluation Use of PA Inputs and Assumptions
Number of Measures with an Assessment of Evaluation Use of PA Inputs (N) 13 6 4 2 0 1
Evaluation used different inputs 23% 17% 50% 0% - 0%
Evaluation used similar inputs 8% 17% 0% 0% - 0%
Evaluation adjusted PA inputs 69% 67% 50% 100% - 100%
Number of Measures with an Assessment of Evaluation Use of PA Assumptions (N) 13 6 4 2 0 1
Evaluation used different assumptions 0% 0% 0% 0% - 0%
Evaluation used similar assumptions 0% 0% 0% 0% - 0%
Evaluation adjusted PA assumptions 100% 100% 100% 100% - 100%
DNV GL 77 Findings and Recommendations
. SUMMARY OF EVALUATION FINDINGS AND 8RECOMMENDATIONS
In this chapter we present key findings, drawn from the previous results chapters of this report and
associated recommendations. Findings and recommendations are organized into the following sections:
• 8.1 Gross impact-related findings and recommendations
• 8.2 Net-to-gross-related findings and recommendations
• 8.3 Program findings and recommendations based on PPA results
As summarized in Chapter 5 across all PAs, the mean life cycle ex post gross impact realization rates were
0.92 for kWh and 0.57 for the therms. The average electricity ex post GRR was a little above the program
calculated default ex ante GRR (0.9) whereas the ex post gas GRR was significantly below the default 0.9 ex
ante GRR adjustments for the 2013 program year. On a statewide basis, the net-to-gross ratio was
estimated at 0.53 for kWh and 0.51 for therms. At a summary level, the detailed recommendations in this
chapter fall into the following primary areas:
• To better align ex ante and ex post savings, the PAs should:
o Use appropriate calculation methods, apply as-built building operating conditions, use
applicable Title-24 baselines or Industry Standard Practices (ISPs) to improve the savings
estimation, and perform better quality control of the projects
o Improve adjustments to project savings based on post-installation inspections and M&V.
• Improvements in PA project documentation and tracking data are required to increase consistency
between project files and tracking data, and minimize errors of project claims.
• To reduce continued moderate to high free ridership, PAs should test program features and
procedures changes focused on increasing program-induced savings.
Gross Impact Findings and Recommendations
This subsection presents gross impact issues and recommendations associated with the 2013 NRNC Whole
Building program. As presented in Chapter 5, the four primary discrepancy factors that contributed to impact
related differences between evaluated ex post savings and PA estimated ex ante savings were Operating

DNV GL 78 Findings and Recommendations
Conditions, Calculation Method, Inappropriate Baseline, and Uncontrollable factors.36 The following sub
sections summarize these discrepancy factors, issues pertaining to these discrepancy factors, and
recommendations that, if implemented, could reduce the impact these controllable discrepancy factors have
on PA-estimated ex ante savings. The issues and recommendations discussed below are based on the site
specific discrepancy analyses that were performed on the 25 M&V sample points.
8.1.1 Operating Conditions – Issues and Recommendations
This discrepancy category represents the differences in building or HVAC operation between the ex ante
model assumed conditions and the ex post observed conditions. The discrepancies categorized as Operating
Conditions contributed a total negative impact of -2,061,209 kWh, -87.2 kW, and -73,062 therms on
evaluated ex post non-weighted project-level savings or -2.8% of ex ante kW, -16.7% of ex ante kWh,
and -23.9% of ex ante therm savings of the sample savings.
The primary issue regarding the Operating Conditions discrepancy involved ex ante models that are not
properly trued-up to match physical as-built conditions. Some of the ex ante energy models were not trued
up (i.e., “physical calibration”) to reflect actual as-built equipment specifications, sequencing, and controls.
The evaluation team believes there is room for improvement regarding the true-up of the ex ante models’
equipment specifications, sequences, and controls to the as-built conditions observed during the PA
verification site visit.
PAs should require their inspectors and engineers to perform on-site visits to visually verify that the
proposed ECMs have been installed and are operating as intended and as simulated in the building model.
The latter point is very important because if the ex ante model is not revised based on site inspection notes,
collected building characteristics, and observed operating conditions then these impact discrepancies will
continue to be substantial, regardless of whether comprehensive site verifications were conducted. It is
recommended that the final approved model should be adjusted to physical “as-built” conditions observed
during the verification site visit. “As-built” conditions include observed construction and equipment
efficiencies and observed HVAC controls and sequencing. This effort should be performed in conjunction
with revising the standard schedules with as-built building schedules.
It is also recommended that the program administrator should make it mandatory for program participants
to submit a Title-24 Acceptance Test Report before being paid an incentive. Title-24 acceptance tests
36 The first three primary discrepancy factors – Operating Conditions, Calculation Method, and Inappropriate Baseline –
are controllable discrepancy factors. The evaluation team categorized discrepancy factors in to two distinct categories:
controllable and Uncontrollable. “controllable” refers to whether the PAs had potential control over correcting the
discrepancies that contribute to the difference between the ex ante and ex post savings estimates, i.e., could the PAs
have identified and rectified controllable issues discovered in the ex ante models such that the ex post evaluation
needs to assess the impact of only uncontrollable factors.
DNV GL 79 Findings and Recommendations
involve inspection checks and performance tests to determine whether specific building systems conform to
the criteria set forth in the standards and to the proposed building specifications and controls. The
acceptance test reports can also be used to true-up building models to as-built conditions.
8.1.2 Calculation Method – Issues and Recommendations
The Calculation Method discrepancy category accounts for savings differences due to different modeling
methods used between the ex ante and ex post savings estimates. This discrepancy can include differences
between ex ante and ex post load estimate, weather normalization, savings normalization, peak demand
calculation methods and modeled equipment design. The discrepancies categorized as Calculation Method
contributed a total negative impact of -156,060 kWh, -1,021.5 kW, and -13,918 therms on evaluated ex
post savings or -33.3% of ex ante kW, -1.3% of ex ante kWh, and -4.6% of ex ante therm savings.
The primary issue regarding the Calculation Method discrepancy involves how the Energy Pro model is used
in the SBD Program to both assess eligibility of the NRNC projects and to estimate ex ante savings.
Energy-Pro uses two calculation modules related to the SBD Program: (1) NR T-24 Performance and (2) NR
Performance. Both modules create standard and proposed building description files and estimate annual
building energy performance using the DOE-2.1E building energy simulation program. However, there are
distinct differences between these two modules that have been ignored or misunderstood. This problem has
contributed to the inaccuracy of energy savings estimates for this program. The significant difference in
peak demand savings between the ex ante estimate and the ex post results were due to the use of
inappropriate calculation method in the ex ante estimate.
To develop more accurate ex ante energy savings estimates, the evaluators recommend that: (1) when
using Energy-Pro, program eligibility should be determined using the NR T-24 Performance module and ex
ante savings should be determined using the NR Performance module; (2) as-built design schedules should
be used in both the baseline and post-retrofit models; and(3) the run period should be consistent with the
defined and applicable DEER peak periods.
8.1.3 Inappropriate Baseline – Issues and Recommendations
The Inappropriate Baseline discrepancy category is applied to instances where the baseline model does not
reflect 2008 Title 24 or ACM guidelines for establishing standard/baseline model characteristics. The
discrepancies categorized as Inappropriate Baseline contributed a total negative impact of -469,036
kWh, -113.2 kW, and -20,571 therms on evaluated ex post savings or -3.7% of ex ante kW, -3.8% of ex
ante kWh, and -6.7% of ex ante therm savings of the total non-weighted sample savings.
DNV GL 80 Findings and Recommendations
The primary issue regarding the Inappropriate Baseline discrepancy is similar to the issue discussed for the
Calculation Method discrepancy – how Energy Pro is used in the SBD Program to create the
standard/baseline model37. Neither of the standard building models created by the two Performance modules
in Energy Pro is appropriate for use as the baseline model for the SBD Program. The NR T-24 Performance
module uses T-24 standard schedules in both the standard and proposed models while the NR Performance
module uses the current year as the run period and as-built mechanical systems in the baseline model38.
It is recommended that the PA modelers verify that the baseline model, specifically the mechanical and
HVAC systems, is in accordance with the Title-24 ACM manual. This recommendation and the
recommendation given in the Calculation Method section above are the most critical improvement areas that
could be used to improve ex ante savings estimation. This adjustment requires proficient modeling
experience, with the modeler able to work outside of the Energy Pro program, using the DOE-2 input files
(e.g., .doe files) and the ACM manual to verify that the standard model generated by Energy Pro applies the
Title 24 and ACM rules correctly. Furthermore, buildings that are modeled within Energy Pro but do not have
baseline requirements stipulated in Title 24 (i.e., hospitals, data center, labs, and other buildings requiring
special ventilation, pressurization, or process-related provisions) need extra scrutiny to assess whether
Energy Pro produces a reasonable standard/baseline model.
The recommended modeling adjustment process detailed above is a manual, labor intensive process and can
be very tedious at times. If the PAs desire to continue to use Energy-Pro in the future for energy savings
estimation (as opposed to T24 compliance), we suggest the PAs explore modifications to the Energy-Pro or
any other PA selected software tool in order to automate the recommended modeling process and
automatically generate appropriate energy savings.
8.1.4 Uncontrollable – Comments
The uncontrollable discrepancy category was used primarily to identify discrepancies regarding model
adjustments and calibration performed due to changes in building load, use of end-use data in building, and
utility billing data. However, the Uncontrollable discrepancy category covers all discrepancies that PAs have
no potential control over.
37 Issues involving Inappropriate Baseline have also been discovered with projects that used eQUEST but projects using
Energy Pro to estimate savings are relatively unique because Energy Pro automatically creates the baseline model
based on the proposed model inputs. This is distinctly different from how eQUEST models are typically developed.
eQUEST modelers typically create the baseline model first, based on ACM guidelines, Title 24 defaults imbedded in
the program, and ISP guidelines where appropriate. Then, the proposed model is developed with the baseline model
as the starting point.
38 The “current” run year is dictated by the computer date that the Energy-Pro program and model was simulated on. So
for example, if the computer’s calendar year was changed from 2015 to 1991 the Energy Pro program running the
NR Performance module would simulate the model based on the 1991 calendar year.
DNV GL 81 Findings and Recommendations
The discrepancies categorized as uncontrollable contributed a total positive impact of 669,053 kWh, 314.9
kW, and 25,193 therms on evaluated ex post savings or 10.3% of ex ante kW, 5.4% of ex ante kWh, and
8.3% of ex ante therm savings of the total sample savings.
These positive impacts of the uncontrollable discrepancy are considered to be coincidental and no statistical
correlation has been determined between the process of model calibration and positive impacts on GRR. In
fact, the WO033 evaluated results for 2010-2012 SBD Whole Building projects showed that model calibration
had a negative impact on the site-specific GRR for that sample – the opposite effect from the current sample.
Net-to-Gross Findings and Recommendations
This subsection presents findings and recommendations related to net-to-gross and program influence.
Detailed NTG evaluation results are discussed in Chapter 6 of this report.
The net-to-gross ratios (NTGRs) discussed here are strictly “net-of-free ridership” as no spillover is
considered in this analysis. The NTGRs were estimated at 0.50 to 0.53 across fuel domains based on 25 sites.
These NTGRs indicate a moderate level of free ridership.
The evaluation team has noticed evidence suggesting that the earlier the involvement with the program, the
greater influence that the program has on the project. One possible solution to reduce free ridership is to
shift program delivery to attract earlier project involvement. One suggestion is to reduce incentive payments
or even disqualify projects that have completed and committed designs before program interactions began.
Conversely, greater incentives could be extended to projects that get involved with the program in the early
design stages. This scenario would require some sort of “litmus test” to determine whether participants
could be influenced by the program or not. This approach could separate out the projects that are “applying
for an incentive for a pre-determined design” from those that are willing to consider design alternatives.
Program Findings and Recommendations Based on PPA Results
This subsection presents PPA findings and recommendations associated with 2013 NRNC Whole Building
program. As presented in Chapter 7, the PPAs rate project documentation and provide recommendations to
improve the PA assessment and documentation of the following categories:
• Project Eligibility
• Baseline selection and documentation
• EUL/RUL
• Cost and Incentive Documentation and Calculations
• Calculation methods; models/methods, inputs, and assumptions
Each aspect was rated on a 1 to 5 where a 3 was given where the documentation was considered acceptable.
Ratings of 4 or 5 were for documentation with more detail than expected, and ratings of 1 or 2 were for
given for missing or inadequate documentation. Summary findings and recommendations from each PPA
subsection are listed below.
DNV GL 82 Findings and Recommendations
Project Eligibility Considerations
After reviewing the PA project documents regarding eligibility requirements and program documentation, the
evaluator eligibility conclusions were almost identical to PA conclusions, and the evaluator provides no
recommendations to change eligibility considerations.
Project Eligibility Ratings
The two primary objectives of this portion of the PPA are to rate the quality of the documentation supporting
measure eligibility and then to rate the Appropriateness of the PA assessment of eligibility requirements.
Overall each PA provided adequate information that met expectations for examining eligibility. Based on PA
documentation the evaluator determined that all ex ante measures were eligible.
To continue to minimize this eligibility discrepancy, PAs should carefully review the model baseline and make
sure that the baseline equipment and conditions meet the applicable Title-24 code and ACM manual.
Project Types
Project Type Assessment is an overview of the PA versus ex post project type designations. In all cases the
evaluator agreed with PA conclusion for project type designation and has no further recommendation.
Project Baselines
For the NRNC Whole Building projects, baseline designations are usually based on either Title 24 code or
Industry Standard Practices, and this designation, which is driven by type of building, will affect estimated
savings. For project baseline designations in the NRNC Whole Building Program, the evaluator and PA
conclusions were identical with the exception of one case. A site designated by the PA as a healthcare facility
was in fact deemed ex post as a medical office building that did not need to comply with healthcare specific
ISP, but rather the Title-24 building code. This baseline change from healthcare ISP to T-24 building code
had a drastic impact on the GRR of this site.
The evaluator recommends reviewing baseline building use type selection and confirming that it is the most
appropriate option while generating the energy model.
Project Baseline Documentation Quality
Applicable codes were documented by the PAs and the mean scores by PA ranged between 2.5 and 3.0. In
the NRNC Whole Building Program, the Title 24 code is the baseline for most projects, and the evaluator
confirmed this correct code documentation in the ex post review.
One SCE and one PG&E project used additional baseline information. The SCE project was an industrial
based measure that needed to factor in other equipment and facility baseline parameters. For one of the
PG&E sites, implementer-provided ISP documents were not available in the ex ante review and had to be
requested for the ex post analysis. Most NRNC Whole Building Projects rely on whole building simulation
software that generates the baseline to the appropriate Title 24 standards.
The evaluator recommends including all baseline documentation files such as implementer ISP files used in
the project design in the project file.
DNV GL 83 Findings and Recommendations
Project Baseline Ratings
The baseline rating indicates whether or not the PA baseline conclusion was correctly identified. In most
cases the appropriateness rating met expectations. The appropriateness of the baseline was on average
higher than the documentation rating. Only 1 site received a rating of 1 or 2 for appropriateness, but 7 of
the 26 measures received a score of either 1 or 2 for documentation. In several instances baseline
documentation provided did not necessarily match the type of equipment being modeled. In other cases it
was not clear which parameters or models were intentionally revised, and there was no detailed
accompanying documentation.
The evaluator recommends including more details from any project equipment changes and updating
documentation if project scope changes over the course of construction in the project file.
EUL Assessment
The EUL assessment is an examination of PA tracking data and project documentation on EUL values. The
most notable difference between PA EUL data and evaluator EUL findings was the fact that PG&E tracking
data did not include any EUL values. All site EULs were populated with zeroes. In addition not a single
project had the EUL documented in the project documents. This resulted in large differences between PA and
evaluator EUL designations. For our analysis, PG&E EUL values were obtained from PG&E ‘s 2013 SBD E3
calculator. The SCE and SDG&E EUL values that existed in the tracking data were not accompanied by a
source, therefore the evaluator was not able to determine how the PAs calculated project EUL values. It was
not possible to further investigate EUL differences without this data.
EUL is crucial for lifecycle savings calculations, and the evaluator recommends collecting EULs for each
measure of the Whole Building project from DEER and calculating the project EUL by weighting them by
measure savings. Then this weighted average EUL should be assigned to the project level for the Whole
Building projects to estimate project life cycle savings. Additionally, it is recommended to include EUL as a
required field on the utility incentive worksheet or on project application.
Incremental Cost Ratings Assessment
PA cost documentation was provided for all 26 measures. For this assessment only incremental costs are
relevant. Program rules identify incentive caps relative to incremental cost, which makes this cost element
crucial for appropriate incentive calculations.
Evaluator examination of the cost documents indicate that while incremental cost data existed, it did not
always meet quality or appropriate expectations. This is evident in the fact that 17 of 26 measures received
as score of 1 or 2 for incremental cost documentation rating, usually due to unreferenced sources or unclear
cost data (i.e. not separated out by measure, but just a total reported incremental cost). Some referenced
sources were the names of previous implementer project documents, which were not accessible to
evaluators to verify the incremental cost claims.
We recommend standardizing incremental cost documentation where both the baseline and the installed
measure cost data should be provided along with their reference sources to validate the incremental cost
estimates.
DNV GL 84 Findings and Recommendations
Incentives Assessment
Overall the PA incentive calculation methods and incentive caps agreed with evaluator findings. Tracking
data and project documents for every project scored a 100% for including incentive details. Based on
information from project documents, all of the appropriate incentive caps were applied when necessary.
Consequently, all PAs received a rating of 3.0 which is meeting the expectations for documentation for the
incentive assessment category.
However there were some large discrepancies between the tracking data incentive amount and the project
documents incentive amount for some PG&E and SCE sites. Having no further insight into the tracking data
incentive values it appears there could be some significant inconsistencies in how design team incentives
and other incentives such as LEED and Commissioning kickers were documented. It is also possible that
improper data calculation and entry occurred.
The evaluator recommends having more transparency and thoroughness when documenting incentives.
Incentive amounts in the project documents should match what was listed in the tracking data.
Calculation Considerations Assessment
Findings from the Calculation Considerations Assessment indicate that the PA and evaluator considerations
have an overall good match. The main difference between PA and evaluator considerations was that PA
post-installation activities included verification only and evaluator considerations included post-installation
measurement and verification.
Calculations Assessment
Calculation considerations between the PA and the evaluator may have been in agreement, but the proper
implementation of the calculations was inconsistent. Whole building energy simulation software was used in
calculations, but the simulation modes, inputs, and assumptions were not always correct. Only 1 of the 25
projects was calculated in noncompliance mode using actual building schedules. Model calibration for sites
where it was applicable had significant impact on ex post results.
If PA post-installation verification could become measurement and verification focused, model accuracy
could increase using more accurate facility inputs, regardless of whether there is enough data for calibration.
PA Inputs and Assumptions Assessment
Numerous savings models were not trued up to site findings even though the PA post verification indicated
otherwise. Calculating savings using incorrect simulation modes, not using as built schedules, and not
adjusting the as-found measure count in the PA inspections are some of the reasons for lower calculation
method scores. These parameters significantly affect model accuracy and savings.
The evaluator recommendations that the PAs conduct more post-installation measurement and more
detailed post-installation verification, and include the updated inputs into their energy savings models and
calculations so that the ex ante claims appropriately reflect as-found parameters.
