research report september 2021 english learners in …
TRANSCRIPT

RESEARCH REPORT SEPTEMBER 2021
English Learners in Chicago Public Schools An Exploration of the Influence of Pre-K and Early Grade Years
Marisa de la Torre, Silvana Freire, and Alyssa Blanchard

TABLE OF CONTENTS
1 Executive Summary
5 Introduction
Chapter 1
11 Factors Associated with Stronger Outcomes for English Learners (ELs)
Chapter 2
21 Identifying ELs Who Would Benefit from Additional Support
Chapter 3
31 Interpretative Summary
35 References
37 Appendices
TABLE OF CONTENTS
This report was produced by the UChicago Consortium’s publications and communications staff: Lisa Sall, Director of Outreach and Communication; Jessica Tansey, Communications Manager; and Jessica Puller, Communications Specialist.
Graphic Design: Jeff Hall Design Photography: Eileen Ryan Editing: Jessica Tansey and Jessica Puller
09.2021/PDF/[email protected]
ACKNOWLEDGEMENTS
Thank you to the Latino Policy Forum (the Forum) for their collaboration and contribution to this work. Without the expertise of the Forum staff, and their leadership, in convening an advisory committee of experts, this research would not have been possible. A special thanks to Rebecca Vonderlack-Navarro, PhD, Manager of Education Policy and Research, who has been a tireless champion of this project. We have also benefited from the expertise of Sylvia Puente, Karen Garibay-Mulattieri, Steven Arroyo, Rosario Hernández, José Marco-Paredes, Erika Méndez, and Roberto Valdez Jr. Prior to writing this report, we presented preliminary findings to the members of our Steering Committee and to the advisory committee convened by the Forum. The advisory committee included Annette Acevedo, Samuel Aguirre, Meg Bates, Patricia Chamberlain, Marion Friebus-Flaman, Cornelia Grumman, Sergio Hernández Jr., Lorena Mancilla, Debra Pacchiano, Cristina Pacione-Zayas, Elliot Regenstein, Juanita A. Rodríguez, Cristina Sánchez-López, Ushma Shah, Sonia Soltero, Robin Steans, Wendy Uptain, Wilma Valero, Ann Whalen, and Josie Yanguas, as well as CPS staff members Javier Arriola-López, Jenny Li, Jorge Macías, Ryan Marron, and Anna Szuber. Additionally, we received extensive written feed-back on the final draft from Steering Committee members Rito Martínez and Rebecca Vonderlack-Navarro, and we thank them for their thorough and thoughtful comments. The authors thank Anna Szuber, Ryan Marron, Jorge Macías, and Anna Colaner for their extensive help in understand-ing district policy and data on English Learners in the early grades. We appreciate the contributions of our Consortium colleagues who read multiple drafts of this report and provided us with valuable suggestions for improvement, including Vanessa Gutiérrez, Alexandra Usher, John Easton, Elaine Allensworth, Lisa Sall, and Jessica Tansey. We also thank our colleague Sanya Khatri who conducted a thorough technical read of the report. We also appreciate the help of Consortium research assistants Arya Muralidharan and Paloma Blandon, who provided background research and technical assistance on this report. We are grateful for funding from the Robert McCormick Foundation that made this work possible. The UChicago Consortium gratefully acknowledges the Spencer Foundation and the Lewis-Sebring Family Foundation, whose operating grants support the work of the UChicago Consortium, and also appreciates the support from the Consortium Investor Council that funds critical work beyond the initial research: putting the research to work, refreshing the data archive, seeding new studies, and replicating previous studies. Members include: Brinson Foundation, CME Group Foundation, Crown Family Philanthropies, Lloyd A. Fry Foundation, Joyce Foundation, Lewis-Sebring Family Foundation, McDougal Family Foundation, Polk Bros. Foundation, Robert McCormick Foundation, Spencer Foundation, Steans Family Foundation, Square One Foundation, and The Chicago Public Education Fund.
Cite as: de la Torre, M., Freire, S., & Blanchard, A. (2021). English Learners in Chicago Public Schools: An exploration of the influence of pre-k and early grade years. Chicago, IL: University of Chicago Consortium on School Research.

UCHICAGO Consortium Research Report | English Learners in Chicago Public Schools 1
Executive Summary
English Learners (ELs) are students from whom much is expected: they are tasked with mastering grade-level content while also learning English, a language in which they are not fully proficient.1 Mastering academic English—the set of language skills necessary for success in school—is a developmental process that takes at least five to seven years.
Over time, most students who begin school classified
as ELs demonstrate English proficiency and their
status changes from that of an active EL to a former
EL.2 Because of this, active ELs are concentrated in
the early grades.3 Hence, schools and teachers need
to focus educational resources in the early years to
support ELs’ instructional needs and set them on a
path to academic success.
We know that some ELs struggle more in school than
others. Previous Consortium work found that ELs who
did not demonstrate English proficiency by the end of
eighth grade had lower educational outcomes in terms
of grades, attendance, and test scores.4 Importantly,
this study also found that academic differences were
visible as early as the first grade, between the ELs who
would go on to demonstrate English proficiency and
those who did not. This suggests that ELs who struggle
the most academically could be identified early on
and provided with additional supports.
To provide new and needed knowledge about what
student and school characteristics are associated
with EL success in pre-k and the early grades, this
study examines attendance, grades, test scores, and
English proficiency from two groups of Chicago Public
Schools (CPS) ELs (14,058 students in pre-k and 16,651
students in the early grades K-3) to answer the follow-
ing research questions:
• What are the factors associated with stronger
outcomes for ELs in pre-k and the early grades?
• To what extent can schools identify ELs who
would benefit from additional support?
1 An EL is a student “whose home language background is a language other than English and whose proficiency in speak-ing, reading, writing, or understanding English is not yet suf-ficient to provide the student with: 1) The ability to meet the State’s proficient level of achievement on State assessments; 2) the ability to successfully achieve in classrooms where thelanguage of instruction is English; or 3) the opportunity toparticipate fully in the school setting” (Illinois Admin. Codetit. 23, § 228.10 (2017)). We used the term “English Learner”throughout the report to be consistent with Illinois State Boardof Education terminology. However, we acknowledge that thisis a controversial term, as it focuses on what students do notknow instead of the strengths that they bring with them.
2 An active EL is a student who is currently identified as an EL. These students have not yet reached the state-determined cut score of English proficiency on the English proficiency test. A former EL is a student who was once designated as an EL but demonstrated English proficiency (scored above a certain cut score on the English proficiency test) and exited out of EL status.
3 For the purposes of this study, “the early grades” refers to the academic years spanning from kindergarten to the third grade.
4 de la Torre, Blanchard, Allensworth, & Freire (2019).

2
Key Findings
Factors Associated with Stronger Outcomes for English Learners
Attending a full-day classroom was associated with
stronger EL pre-k attendance and kindergarten readi-
ness in terms of English language development and
early literacy. Between 2016 and 2018, only one in five
ELs enrolled in a CPS pre-k attended a full-day class-
room (19 percent), compared to the district average of 34
percent. ELs who were enrolled in a CPS pre-k full-day
classroom attended about 2.5 additional school days,
compared to ELs who were enrolled in a half-day class
but were alike in all other measured factors. Similarly,
we found that ELs in full-day CPS pre-k demonstrated
stronger oral English skills and were more likely to dem-
onstrate reading proficiency, relative to similar ELs in
half-day classes, by the fall of kindergarten.
Enrolling earlier in CPS pre-k (prior to age four vs.
at age four) supported ELs’ kindergarten readiness
in terms of English language development and early
reading skills. In our sample, 54 percent of ELs enrolled
before the age of four in a CPS pre-k and most of them (90
percent) stayed in the same pre-k site when they turned
four. In terms of their English development, ELs who en-
rolled in CPS pre-k early scored, on average, almost one
level higher on a test of English proficiency, compared to
ELs alike in all other measurable factors. We also found
that ELs who attended a CPS pre-k before the age of four
were more likely to demonstrate reading proficiency in
the fall of kindergarten. Attendance in pre-k did not dif-
fer significantly among ELs who enrolled before or after
they were four years old.
The differences in outcomes were still detectable—
even as far as third grade—between students who
attended a school-based CPS pre-k and those who
did not. By the time ELs reached third grade, ELs who
had enrolled in a CPS pre-k still had slightly stronger
Executive Summary
performance than similar ELs who did not enroll in a
CPS pre-k. Compared to their peers, third-grade ELs
who had enrolled in a CPS pre-k had better attendance,
reading and math grades, and test scores, and were
more likely to demonstrate English proficiency.
ELs who received language supports through their
schools’ Bilingual Education Services had higher at-
tendance and academic outcomes in the long run than
students who refused bilingual services in kinder-
garten. In kindergarten, ELs who received Bilingual
Education Services had lower English proficiency scores
in the ACCESS test (particularly in the oral compo-
nents of speaking and listening) than similar ELs whose
parents or guardians refused those services. However,
by end of third grade, students who received services
were 4 percentage points more likely to demonstrate
English proficiency on the ACCESS test, which suggests
that ELs who refused services stagnated in their English
language development, compared to ELs who received
services. ELs who received Bilingual Education Services
not only improved in their English development, but
also had stronger attendance, grades, and test scores in
third grade than similar ELs who refused services.
Attending higher-rated schools, based on CPS’ School
Quality Rating Policy, was associated with positive
outcomes for ELs in terms of standardized test
scores in math, reading, and English proficiency. After
accounting for student and school differences, we found
that the rating a school received was positively associ-
ated with the scores ELs obtained in their third-grade
math and reading NWEA standardized assessments and
their English proficiency levels. For example, an average
student enrolled in a Level 1+ school, the highest rating,
scored in the 54th national percentile on the math NWEA
in third grade while a similar student in a Level 2 school,
one of the lowest ratings, scored in the 39th national
percentile. It is worth noting that a school rating was
not associated with ELs’ attendance, grades, or whether
students demonstrated English proficiency in third grade.
UCHICAGO Consortium Research Report | English Learners in Chicago Public Schools 3
Identifying ELs Who Would Benefit From Additional Support
Starting school with low levels of English proficiency
was related to lower academic performance, measured
by standardized test scores and grades; however,
screener data were, in general, not related to atten-
dance. When ELs first enroll in CPS they are screened
for English proficiency within 30 days of enrollment.5
More than one-half of ELs served in CPS in pre-k and
kindergarten started with low levels of oral English
proficiency, as measured by the screener tests. Our
study found that lower (and higher) scores on screener
tests when students entered pre-k and kindergarten
were correlated with lower (and higher) later scores of
English proficiency and other assessments in reading
and math, commonly administered in English. Those
differences by incoming English proficiency persisted
even after four years in school and were larger in reading
than in math assessments. For example, when compar-
ing students alike in all other student characteristics and
school factors who only differed in their screener score
in kindergarten, ELs at the entering level (lowest level)
in kindergarten scored in the 32nd national percentile
in reading and in the 42nd national percentile in math in
third-grade standardized tests; while ELs in the expand-
ing level ( just below the threshold that designates them
as English proficient) in kindergarten scored in the 55th
national percentile in reading and 57th national per-
centile in math. ELs with low incoming screener scores
also had lower grades, especially in reading, compared to
their EL peers but similar attendance.
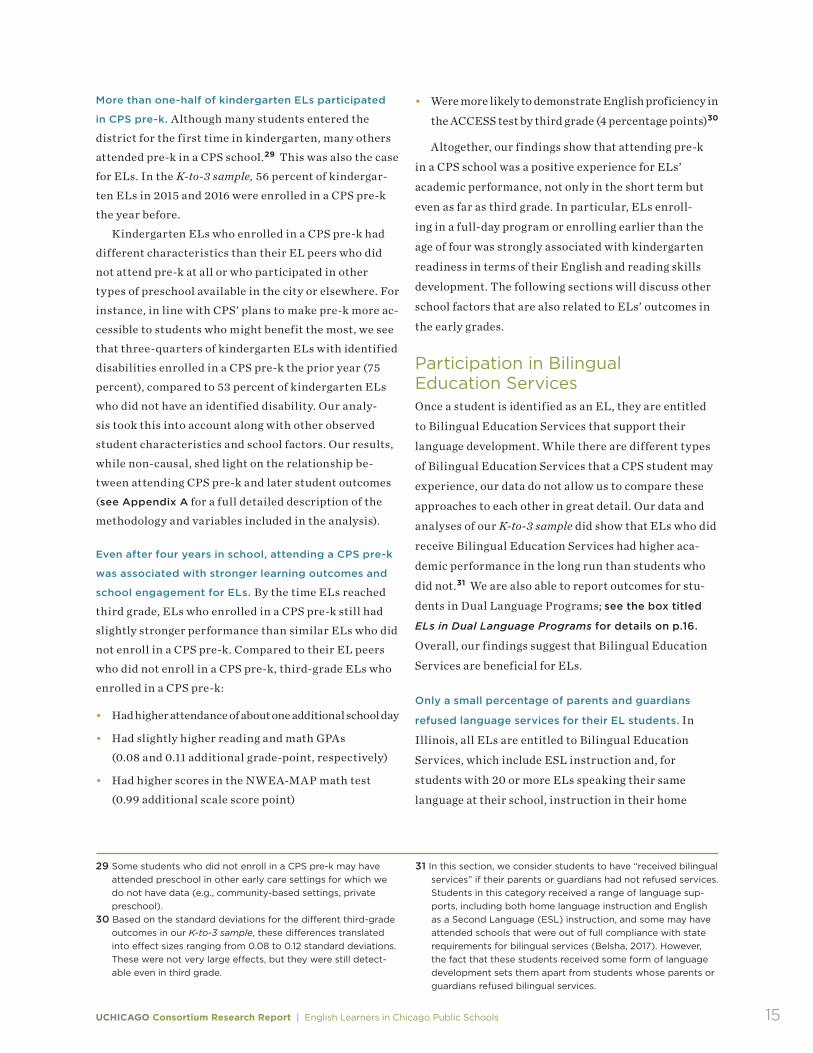
ELs with identified disabilities made progress, but
at a slower pace, toward acquiring English skills and
most students with identified disabilities had lower
attendance. Among ELs in our two samples, we found 17
percent had an identified disability in pre-k and 12 per-
cent in kindergarten. Most ELs who were identified with
a disability were classified as having a developmental
delay, followed by students with a speech and language
disability, and cognitive disability. ELs with identified
disabilities made progress toward acquiring English
skills, but it was slower than the progress of similar ELs
with no identified disabilities. These differences emerged
very early, even when comparing ELs with similar
English proficiency levels upon entering kindergarten.
We also found that ELs with identified disabilities
were more likely to miss school, except those with
speech and language disabilities. Given the importance
of being in school in order to receive services and make
progress in learning, this data shows that interventions
to improve attendance in the early grades, especially in
pre-k and kindergarten, might help ELs with identified
disabilities to get the supports they need.
ConsiderationsOur findings provide valuable information to help prac-
titioners and policymakers strategize ways to better
support ELs and help them succeed in the early grades
and beyond. Our work also has insights that could
help parents and families make decisions about their
children’s education, but the responsibility for making
changes that would support all ELs belongs with the
policymakers and educators who serve them.
Considerations for Policymakers
• Policymakers may want to prioritize ELs for access to
pre-k programs, particularly subgroups of ELs who
seem to need additional support, such as ELs with
low incoming English skills and ELs with identified
disabilities. As ELs have increased access to pre-k
services that will benefit their future academic suc-
cess, policymakers may need to develop strategies
around training and retaining a bilingual workforce
qualified to teach ELs in early childhood settings.
• Policymakers might consider providing some schools
with additional resources to support them and in
turn to ensure the success of ELs these schools
serve. Our findings demonstrate that some schools,
particularly schools with lower school quality
ratings, may need additional support to help ELs
achieve academic success.
5 For more detail on screener tests see the box titled Screener Tests in Pre-K and Kindergarten in Chapter 2.

4
Considerations for Practitioners
• Once families enroll their ELs in a school, practi-
tioners can help them understand that Bilingual
Education Services are beneficial for their students’
learning. Without the scaffolding that bilingual
services provide, students start falling behind, not
only in English skills, but also in mastering the grade
level content. Practitioners should ensure that par-
ents who are choosing whether to refuse bilingual
services are aware of these potential consequences.
• Practitioners can rely on data from screener tests
to support ELs early on. Our findings indicate
ELs who start school in the early stages of English
development tend to struggle with their academic
performance. Practitioners could use interventions
that focus on improving reading and listening, as
these were two areas in which these students were
farther behind, compared to other ELs.
• Practitioners may need to pay particular attention to
ELs who are also identified for special education ser-
vices. Understanding and remedying lower attendance
patterns for ELs with disabilities should be a priority
for practitioners. In addition, practitioners could help
families understand that their children are entitled
to both Bilingual Education Services and special
education services, as the data shows that students
with identified disabilities were more likely to refuse
bilingual services.
Considerations for Parents and Families of ELs
• Families may want to prioritize early enrollment
in CPS pre-k and enrollment in full-day programs,
when possible. Our findings show that attending
public school-based pre-k was related to better
outcomes for ELs, both in kindergarten and the
third grade, even five years after students attended
a CPS pre-k.
• Before deciding about whether their children should
receive Bilingual Education Services, parents and
guardians should be aware of the long-term benefits
of participating in such services. Our results suggest
that some of the benefits of bilingual services are
not immediately apparent but show up later in a
students’ education.
• Families looking to enroll their children in CPS
could consider the rating of a school as a valuable
metric to add among other school characteristics.
Our findings suggest that a school accountability
rating is a good indicator for an EL’s academic
success on some dimensions that may matter to
parents and families as they consider school choices.
Executive Summary
UCHICAGO Consortium Research Report | English Learners in Chicago Public Schools 5
6 Hussar et al. (2020).7 Chicago Public Schools [CPS] (n.d.).8 Throughout this report we use the term “preschool” as an
umbrella term for all formalized early education programs avail-able to three- to five-year-old children prior to kindergarten. When preschool is offered within a school setting, we use the more specific term “pre-k” most commonly used by districts.
9 ELs in pre-k are often called “dual language learners” rather than “English Learners” to reflect the fact that at this age students are still developing their knowledge of their home languages, in addition to English. However, for the purposes of this report, we will refer to any student classified as not yet fully proficient in English as an English Learner.
10 CPS (n.d.).11 de la Torre et al. (2019).
IntroductionEnglish Learners (ELs) are students from whom much is expected: they are tasked with mastering grade-level content while also learning English, a language in which they are not fully proficient. Because so much is expected from these students, it is important to remember that the responsibility for providing them with a strong and equitable education lies with adults—teachers, school leaders, and policymakers. ELs have unique educational needs, and teachers and schools must provide strong support to help them succeed.
How to best instruct ELs is a matter of particular
urgency given the growing number of ELs in the United
States. Across the nation, the number of ELs attend-
ing public schools increased by 32 percent between fall
2000 and fall 2017.6 In Chicago Public Schools (CPS),
EL enrollment has grown by 35 percent in the last de-
cade, while the district’s total enrollment declined.7
Many students are classified as ELs when they enter
pre-k and kindergarten. Over time, most students who
begin school classified as ELs demonstrate English
proficiency and their status changes from that of an
active EL to a former EL. Because of this, active ELs
are concentrated in the early grades. For example, in
2019, nearly one-half (47 percent) of CPS active ELs
were in pre-k through third grade, while only 16 percent
of active ELs were in high school. Since elementary
schools serve larger numbers of ELs, they may be
well-positioned to focus more resources on students in
these early years and prepare them for academic suc-
cess. Public pre-k sites,8 which have been expanding in
recent years, serve large numbers of ELs.9 In 2019, one
out of every three CPS pre-k students was an EL.10 As
access to public pre-k grows in the district and across
the nation, practitioners have the opportunity to pro-
vide strong instruction for ELs that will prepare them
for kindergarten and set them up for future success.
We know that some ELs struggle more in school
than others. Previous work from the University of
Chicago Consortium on School Research (UChicago
Consortium) found that students who started kinder-
garten as ELs and demonstrated English proficiency
by the end of eighth grade had academic outcomes that
were comparable to or stronger than those of CPS stu-
dents who were never classified as ELs. ELs who did not
demonstrate English proficiency by the end of eighth
grade had lower educational outcomes in terms of
grades, attendance, and test scores.11 Importantly, this
study also found that academic differences were visible
as early as the first grade, between the ELs who would
go on to demonstrate English proficiency and those who
did not. This suggests that ELs who struggle the most
academically could be identified early on and provided

6
In schools, ELs are expected to develop academic English, the language necessary for success in school, in addition to social English, the language of every day communication. Social English is the language students would use to talk to their friends in the playground. It usually takes a couple of years for ELs to develop social English. However, just because students can communi-cate with their peers, understand teachers’ questions, and use every-day English does not mean that they are up to speed in academic English. Their school work and exams may not reflect their social English fluency.
Academic English is more demanding and complex,
and it involves vocabulary in different content areas such as math, science, social studies, and English language arts. ELs must master academic English to understand textbooks, solve mathematical word problems, write papers, and take tests. Without a mastery of academic English, ELs cannot develop the critical-thinking and problem-solving skills needed to understand and express the new and abstract concepts taught in an English-based classroom. Mastering these language skills is a developmental process that takes at least five to seven years, and it can take longer for students who are not strong in their native language when they start school.A
A Collier & Thomas (2009).
Developing a Second Language
12 Garrett, Davis, & Eisner (2019); Parker, O’Dwyer, & Irwin (2014).
with additional supports, such as specific instructional
strategies, increased time, and well-trained teachers.
All of the above suggests that ELs, particularly those
who might otherwise go on to struggle to demonstrate
English proficiency, would benefit from targeted aca-
demic support early in their academic careers. However,
more information about EL performance in pre-k and
the early grades is necessary to help schools set these
students up for success. Previous research on ELs in the
early grades suggests that some student characteristics,
such as having an identified disability and school factors
like school climate and quality, are associated with out-
comes for ELs.12 But earlier studies of ELs in the early
grades have limits in their applicability: most study
only a small sample of students; focus on a subsample
of ELs, such as Latinx ELs; or examine limited student
outcomes. Previous studies of ELs in pre-k are similarly
limited, as most focus on whether pre-k matters for ELs,
instead of what aspects of pre-k matter for ELs.
To provide new and needed knowledge about what
student and school characteristics are associated with
EL success, this study examines outcomes from two
samples of CPS ELs in pre-k and the early grades to
answer the following research questions:
• What are the factors associated with stronger
outcomes for ELs in pre-k and the early grades?
• To what extent can schools identify ELs who would
benefit from additional support?
We looked at ELs’ performance in terms of atten-
dance, grades, English development, and test scores and
explored how these outcomes relate to school contexts
and student factors. Most standardized assessment out-
comes examined in this study, such as English develop-
ment and test scores in reading and math, are measured
in English, a language that ELs are still learning. As
such, looking into ELs’ attendance and grades, as well
as their test performance in Spanish early literacy skills
where available, provides us with information beyond
ELs’ English skills that helps us to understand their
learning more holistically. We included demonstrat-
ing English proficiency as an outcome for this study,
but prior research has found that developing academic
English skills typically takes between five to seven
years. So, in the span of years we are examining, we
would not necessarily expect many ELs to reach this
milestone (see the box titled Developing a Second
Language for more information).
Bilingual services can be very different, depending
on the program model: some ELs receive much of their
instruction in their home language, while others are
taught exclusively in English with English as a Second
Language (ESL) instruction as linguistic support. Other

UCHICAGO Consortium Research Report | English Learners in Chicago Public Schools 7
research13 suggests that the type of bilingual services
received matters for ELs, but because of the quality
and timeline of the available data, we were unable to
analyze the effects of different program models.
However, in Chapter 1, we provide evidence on the
effect of receiving any Bilingual Education Services,
and on the early impacts of Dual Language Programs.
Because we want to shed light on what matters for
ELs, we conducted our analyses among ELs who have
different characteristics and school experiences, rather
than comparing ELs to students never classified as
ELs. We conducted analyses on two separate samples
of CPS ELs which allowed us to learn about different
aspects of ELs’ experiences in the early years.
• The pre-k-to-K sample followed ELs as they transi-
tioned from CPS pre-k to kindergarten. With this
analysis, we examined what aspects of the pre-k
experience matter for ELs, which is a timely ques-
tion given the expansion of public pre-k in CPS and
throughout the country.
• The K-to-3 sample followed ELs from kindergarten
through third grade. This analysis provided some
evidence on the medium-term effects of ELs’ early
experiences.
Our two samples include tens of thousands of ELs
in CPS who spoke dozens of different languages and
brought diverse experiences and strengths to the class-
room. These large samples allowed us to learn much
about what matters for ELs in the early grades, but ELs
who came to CPS after kindergarten were not included
in either of our samples (see Appendix B on p.41 for
information about sample selection). If these students
had different experiences and educational needs than
other ELs, our study would not address them.
We examined how dozens of student and school fac-
tors (see Appendix A) related to ELs’ outcomes. Thus,
while the relationships we report are not necessarily
causal, they represent a strong step in determining which
factors are most important for EL success. An overview
of the study’s sample, outcomes, and methodology is pre-
sented in the box titled Sample and Methods Used in This
Study (see Appendix A, p.37-40 for more details).
In this report, we highlight those factors most closely
associated with ELs’ academic performance in the early
grades. In Chapter 1, we discuss factors that support
EL success, while in Chapter 2, we focus on identifying
students who seem to need additional attention, as they
are likely to struggle in later years. Finally, we conclude
with a discussion of the implications of these findings.
13 Umansky & Reardon (2014); Collier & Thomas (2004).

8
Pre-k-to-K Sample
The pre-k-to-K sample includes 14,058 ELs across three cohorts of students who attended a CPS pre-k in the school years 2015–16, 2016–17, and 2017–18, and enrolled in a CPS kindergarten the following year (see Table A).B The ELs in the sample represented around 40 percent of all pre-k students. For the pre-k-to-K sample, we examined ELs’ performance by the time they finished their pre-k year. Specifically, we looked at their attendance rate by the end of pre-k, the English proficiency level score they obtained in the English language screener test (WIDA Model K) they took at the beginning of kindergarten, and their early reading proficiency rate in the Text and Reading Comprehension (TRC) test in the fall of the kindergarten year. Although ELs took the Model K and TRC tests when in kindergarten, because these outcomes were measured at the beginning of the year (fall semester) they represent students’ skills after finishing pre-k and are thus appropriate outcomes for our pre-k analyses (see Appendix A and B for more details on the sample and outcomes).
K-to-3 Sample
The K-to-3 sample includes 16,651 ELs across two co-horts of first-time kindergarteners in the school years 2014–15 and 2015–16 (see Table B). ELs represented around 30 percent of all kindergarten students. Some of the students in the K-to-3 sample previously attend-ed a CPS pre-k and some did not (see Chapter 1). We followed these cohorts of students through the third grade (school years 2017–18 and 2018–19).C Although all students in the sample were classified as ELs at some point between kindergarten and third grade, some may have demonstrated English proficiency on the ACCESS test by third grade. For the K-to-3 sample, we looked at ELs’ outcomes in kindergarten and third grade. In kindergarten, we examined their attendance rate and their English pro-ficiency scores in the ACCESS test, considering all four domains (reading, writing, speaking, and listening) in addition to their composite proficiency level. In third grade, we looked at their attendance rate, grades in math and reading, NWEA-MAP test scores in math and reading, whether they demonstrated English proficiency on the ACCESS test by third grade, and English profi-ciency scores for students taking the ACCESS test.D
Sample and Methods Used in This Study
TABLE A
Sample Demographics for ELs in the Pre-k-to-K Sample
TABLE B
Sample Demographics for ELs in the K-to-3 Sample
Analytic Sample
pre-k ELs
All CPS pre-k
Analytic Sample K
ELs
All CPS K
Number of Students 14,058 34,814 Number of Students 16,651 55,458
Number of Pre-K Sites 262 371 Number of K Schools 356 466
Male* 53% 51% Male* 52% 51%
Spanish Speakers** 85% 40% Spanish Speakers** 85% 36%
Eligible for Free or Reduced-Price Lunch (FRPL)
92% 87% Eligible for FRPL 93% 83%
Had an Identified Disability***
17% 14% Had an Identified Disability***
12% 9%
* Historically, CPS has collected data that groups students into one of two gender categories: male and female. Not all students identify with one of these categories, and we hope in the future to be able to report data that more fully describes the identities of CPS students.
** Students who speak Spanish at home are considered Spanish Speakers. However, not all Spanish Speakers in CPS (right columns in Tables A and B) are classified as ELs.
*** We refer to students with an Individualized Education Plan (IEP) as students with an identified disability throughout the report. In CPS, they are also referred to as diverse learners. An IEP is created after a child has been evaluated and found eligible to receive special education and related services.
B Our pre-k-to-K sample comprises most ELs enrolled in a CPS pre-k, as most four-year-old ELs in a CPS pre-k (about 93 percent) enrolled in a CPS kindergarten the following year.
C Eighty-nine percent of ELs in the K-to-3 sample remained enrolled in a CPS school by third grade.
D Eighty-four percent of K-to-3 sample students who remained in CPS in the third grade took the ACCESS test in third grade, while the other 16 percent demonstrated proficiency before third grade.
UCHICAGO Consortium Research Report | English Learners in Chicago Public Schools 9
Methodology
Our analysis aimed at understanding how outcomes differed among ELs who 1) had different student char-acteristics, and 2) attended CPS schools with different characteristics. To explore the relationship between ELs’ outcomes and student and school factors, we conducted a series of hierarchical linear models (HLM). HLM is a statistical technique used when data are grouped, in our case students grouped within schools. HLM allows for simultaneously investigating the rela-tionships of student and school factors with outcomes, making it more efficient at accounting for variation between students and among schools. ELs in the pre-k-to-K sample were nested in their pre-k site, while ELs in the K-to-3 sample were nested in their kindergarten school. Analyses were run separately for each sample. Student characteristics that were accounted for in our HLM models included gender, home language, whether a student was living in a temporary situation, socioeconomic status, age, identified disability, and English proficiency level at the time of enrollment. In addition, we included some individual factors related to choices families made when enrolling their students in CPS such as full-day pre-k enrollment. We also ac-counted for whether Bilingual Education Services were refused, participation in Dual Language programs, and whether students were enrolled in a school with fewer than 20 students speaking the same language. School characteristics that were accounted for in our HLM models included the composition of the student body (i.e., racial/ethnic composition, percent receiving free or reduced-price lunch, and percent with identified disabilities), the school’s accountability rating, climate measures, ELs’ student-body compo-
sition (i.e., percent ELs, number of non-English lan-guages represented, percent of ELs in the early stage of English language development), the ratio of ELs per bilingual and ESL teachers, EL program audit rating, whether a school was a charter, and the grade-level structure of the school (e.g. pre-k–5 or pre-k–8; for further detail on the methodology and variables used in the analyses see Appendix A). Accounting for these student and school factors allowed us to measure the association of a particular characteristic to an outcome. The analysis statistically removed differences that could be explained by other measurable factors. This means that the relationship of a factor to an outcome can be interpreted as comparing students who are alike on all other mea-sured characteristics except the particular factor of interest. For example, when we explored differences in outcomes among ELs who attended full-day pre-k vs. ELs who attended half-day pre-k, we compared students who were identical in terms of all the students level characteristics and school factors in our models except whether they participated in full-day or half-day pre-k. We can therefore interpret any differences among these groups as differences associated with participation in full-day vs. half-day pre-k. There is a possibility that unmeasured factors may be responsible for the relationships we found. As such, our analysis does not intend to determine causal impacts of these student and school factors. Because we have accounted for many of the factors related to outcomes that we examined, we believe these analyses are a strong step forward in determining which factors are most important for EL success.
Sample and Methods... continued

11UCHICAGO Consortium Research Report | English Learners in Chicago Public Schools
CHAPTER 1
Factors Associated with StrongerOutcomes for English LearnersThe environments and supports that young ELs are
exposed to during pre-k and the early grades play an
important role in the opportunities these students
have, ultimately influencing their academic success.
Understanding which factors are related to ELs’ aca-
demic performance will provide valuable information
to practitioners and policymakers who focus on improv-
ing the services available to ELs. Parents and families
will also benefit from understanding these factors when
making decisions about the schools and programs that
will best support their children.
In our study, we examine different student and school
characteristics to investigate whether they were associ-
ated with the performance of EL students. These analy-
ses looked at the relationship between these factors and
student outcomes in pre-k, kindergarten, and third grade
after statistically accounting for differences that could
be explained by other student characteristics and school
factors (see Appendix A for details on the statistical models).
This section highlights some of the factors that were
associated with ELs’ academic success in the early
grades.14 These include attending a CPS pre-k, partici-
pating in Bilingual Education Services, and enrolling
in a highly rated school. To preview our results:
• Attending full-day programs (vs. half-day) or
enrolling earlier in CPS pre-k (prior to age four vs.
at age four) supported EL kindergarten readiness
in terms of English development and early reading
skills. The benefits of attending a CPS pre-k were
still detectable even as far as third grade.
• ELs who received home language instruction
through their schools’ Bilingual Education Services
had higher attendance and academic outcomes in
the long run than students who refused Bilingual
Education Services in kindergarten.
• Attending higher rated schools, based on CPS’ School
Quality Rating Policy (SQRP), was associated with
higher test scores for ELs on math and reading stan-
dardized tests and English proficiency assessments.
Throughout the years, Chicago has made sustained efforts to expand access to and improve the quality of publicly-funded preschool across the city. As early as the 1960s, the city has provided early education services to students most at risk of academic failure through federally-funded programs like Head Start and Child-Parent Centers (CPC). Since 2006, the Preschool for All (PFA) program has also provided state funding to offer quality preschool to three- and four-year-olds. Beginning in 2013, CPS prioritized pre-k enrollment for students who were most likely to benefit from it (i.e., students of color, with special education needs, in temporary living situations, from
low-income families, and/or with a home language other than English). Most recently, efforts to expand full-day pre-k programs came into place through the city’s Universal Pre-k (UPK) initiative launched in 2018. Illinois has a long history of serving ELs in K-12 settings, and since 2008 the state has made explicit efforts to regulate the provision of bilingual services in publicly funded preschools. In 2010, the State Board of Education mandated that starting in 2014–15 (with a compliance deadline of 2016–17), all ELs in public preschools must have a teacher with a bilingual or ESL certification in addition to early childhood education.
Preschool in CPS
14 We highlight in the report factors that: 1) were statistically sig-nificant (i.e., the estimate was precise and showed a positive or negative relationship with outcomes); 2) had a meaningful
relationship (i.e., the size of the estimated coefficients was large compared to the variation in outcomes we observed among ELs); and 3) were important across different outcomes.
Chapter 1 | Factors Associated with Stronger Outcomes for English Learners12
Engagement with a CPS Pre-KA vast body of literature highlights the importance
of early experiences and participation in preschool
programs for children’s later academic success.15 Our
study found that a longer exposure to a school-based
pre-k (i.e., enrolling earlier than age four, attending a
full-day pre-k), was associated with better performance
for pre-k ELs in terms of pre-k attendance and early
English and reading development by the beginning
of kindergarten. In fact, the benefits of attending a
school-based pre-k were still detectable even as far as
third grade, across different outcomes (e.g., attendance,
English proficiency, test scores, grades). These findings
are consistent with research in early childhood suggest-
ing that preschool might be particularly beneficial for
children from low-income backgrounds or with specific
educational needs.16 For instance, prior studies have
shown that attending preschool raises school readiness
and English-language proficiency among children of
immigrants17 and low-income Latinx ELs.18
In Chicago, publicly-funded preschool services are
offered both through district-managed schools and
community-based organizations (CBOs). In this study,
we only focus on school-based pre-k,19 with special
attention to ELs who enrolled in full-day programs or
who enrolled before age four. ELs who did not enroll in a
CPS pre-k might have attended another form of pre-
school, either publicly-funded or private. In that sense,
our findings provide an estimate of the relationship
between attending a school-based CPS pre-k and early-
grades outcomes compared to ELs who did not partici-
pate in a school-based program in CPS.
Our analyses did not intend to assess the causal impact
of pre-k, but rather to examine the relationship between
attending a CPS pre-k and ELs’ early-grades outcomes.
This provides relevant information to begin understand-
ing some pre-k factors that may relate to ELs early perfor-
mance and identify areas for further exploration.
In this section, we highlight the differences in ELs
early-grades performance that were related with CPS
pre-k enrollment. First, we focus on ELs from the
pre-k-to-K sample 20 and describe how attending a full-
day program or enrolling before age four was associated
with their attendance in pre-k and their English and
early reading skills measured in the fall of kindergar-
ten. Then, we shift to the K-to-3 sample to analyze the
extent to which attending a CPS pre-k was related to
ELs’ outcomes by the time they reached third grade.
Between 2016 and 2018, only one in five CPS
pre-k ELs enrolled in a full-day pre-k. In recent years,
Chicago has focused on increasing the number of full-
day pre-k options available in the city. In our study, we
saw an increase in ELs’ participation in CPS full-day
programs. The share of ELs from the pre-k-to-K sample
enrolled in a full-day class more than doubled from
only 12 percent in 2016 to 26 percent in 2018. However,
across these years, only one in five ELs enrolled in a
CPS pre-k attended a full-day classroom (19 percent),
compared to the district average of 34 percent.
Attending a full-day classroom was associated with
stronger EL pre-k attendance and kindergarten
readiness in terms of English development and early
literacy. Even though availability of full-day pre-k
options had been increasing in Chicago, in the years
of the study (2016–18) not every CPS pre-k serving
ELs was offering a full-day program.21 Students who
enrolled in a full-day classroom during these years
differed in some ways from their peers who enrolled in
a half-day session. For example, ELs in full-day classes
were more likely to be eligible for free or reduced-price
lunch, but less likely to have an identified disability
when compared to ELs in half-day classrooms (see
Table B.1. in Appendix B). However, even after
accounting for these observed differences among ELs
15 Camilli, Vargas, Ryan, & Barnett (2010); Phillips et al. (2017); Yoshikawa et al. (2013).
16 Ladd (2017); Yoshikawa et al. (2013).17 Magnuson, Lahaie, & Waldfogel (2006).18 Ansari et al. (2017).19 CPS offers different types of school-based programs: Head
Start (also offered at CBOs), state-funded Preschool for All, Child-Parent Centers, tuition-based programs, and magnet
pre-k programs. This study focuses on pre-k offered in district schools, but we do not differentiate among specific types of school-based programs.
20 See the box titled Sample and Methods Used in This Study in the Introduction for a description of the samples.
21 In 2016, only 34 percent of pre-k sites serving ELs offered a full-day classroom compared to 52 percent in 2018.
13UCHICAGO Consortium Research Report | English Learners in Chicago Public Schools
(e.g., home language, socioeconomic status, identified
disabilities, incoming English skills), we still find that
students who participated in a full-day CPS pre-k pro-
gram had better outcomes at the end of the school year
than those who enrolled in a half-day program.
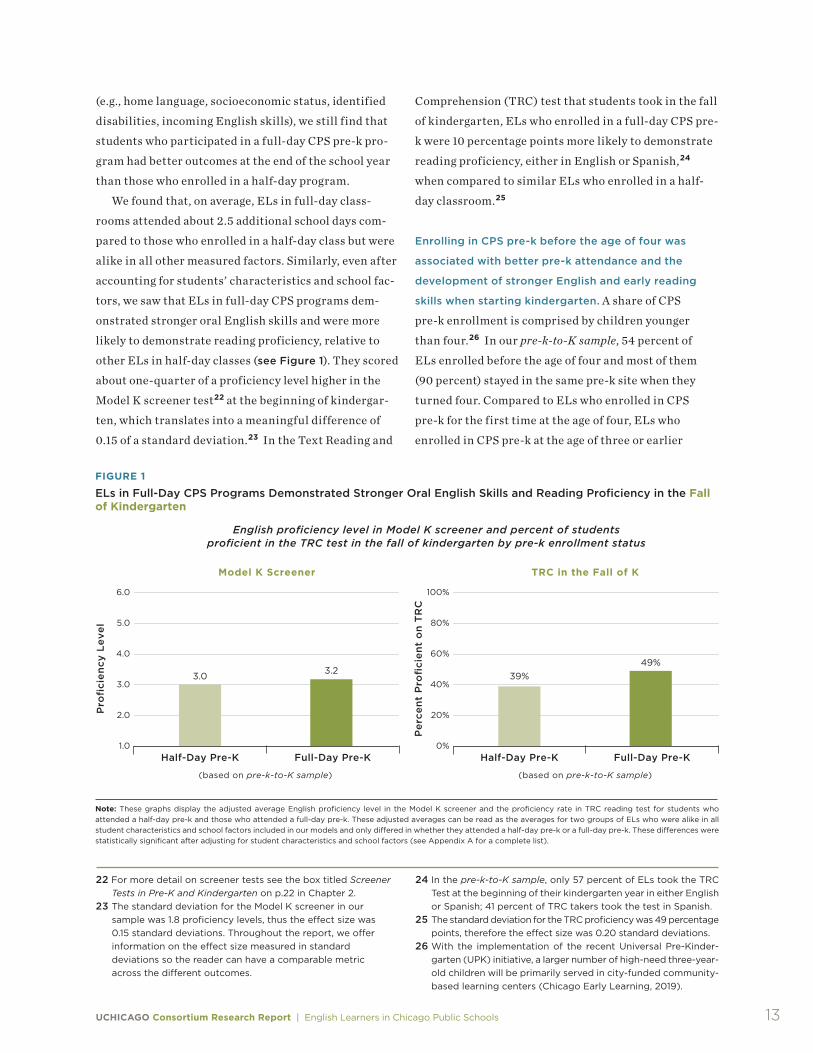
We found that, on average, ELs in full-day class-
rooms attended about 2.5 additional school days com-
pared to those who enrolled in a half-day class but were
alike in all other measured factors. Similarly, even after
accounting for students’ characteristics and school fac-
tors, we saw that ELs in full-day CPS programs dem-
onstrated stronger oral English skills and were more
likely to demonstrate reading proficiency, relative to
other ELs in half-day classes (see Figure 1). They scored
about one-quarter of a proficiency level higher in the
Model K screener test22 at the beginning of kindergar-
ten, which translates into a meaningful difference of
0.15 of a standard deviation.23 In the Text Reading and
Comprehension (TRC) test that students took in the fall
of kindergarten, ELs who enrolled in a full-day CPS pre-
k were 10 percentage points more likely to demonstrate
reading proficiency, either in English or Spanish,24
when compared to similar ELs who enrolled in a half-
day classroom.25
Enrolling in CPS pre-k before the age of four was
associated with better pre-k attendance and the
development of stronger English and early reading
skills when starting kindergarten. A share of CPS
pre-k enrollment is comprised by children younger
than four.26 In our pre-k-to-K sample, 54 percent of
ELs enrolled before the age of four and most of them
(90 percent) stayed in the same pre-k site when they
turned four. Compared to ELs who enrolled in CPS
pre-k for the first time at the age of four, ELs who
enrolled in CPS pre-k at the age of three or earlier
22 For more detail on screener tests see the box titled Screener Tests in Pre-K and Kindergarten on p.22 in Chapter 2.
23 The standard deviation for the Model K screener in our sample was 1.8 proficiency levels, thus the effect size was 0.15 standard deviations. Throughout the report, we offer information on the effect size measured in standard deviations so the reader can have a comparable metric across the different outcomes.
24 In the pre-k-to-K sample, only 57 percent of ELs took the TRC Test at the beginning of their kindergarten year in either English or Spanish; 41 percent of TRC takers took the test in Spanish.
25 The standard deviation for the TRC proficiency was 49 percentage points, therefore the effect size was 0.20 standard deviations.
26 With the implementation of the recent Universal Pre-Kinder- garten (UPK) initiative, a larger number of high-need three-year-old children will be primarily served in city-funded community-based learning centers (Chicago Early Learning, 2019).
FIGURE 1
ELs in Full-Day CPS Programs Demonstrated Stronger Oral English Skills and Reading Proficiency in the Fall of Kindergarten
Note: These graphs display the adjusted average English proficiency level in the Model K screener and the proficiency rate in TRC reading test for students who attended a half-day pre-k and those who attended a full-day pre-k. These adjusted averages can be read as the averages for two groups of ELs who were alike in all student characteristics and school factors included in our models and only di�ered in whether they attended a half-day pre-k or a full-day pre-k. These di�erences were statistically significant after adjusting for student characteristics and school factors (see Appendix A for a complete list).
English proficiency level in Model K screener and percent of students proficient in the TRC test in the fall of kindergarten by pre-k enrollment status
Pro
fici
ency
Lev
el
6.0
5.0
3.0
2.0
1.0
4.0
Half-Day Pre-K
3.0
Full-Day Pre-K
3.2
Per
cen
t P
rofi
cien
t o
n T
RC
100%
80%
40%
20%
0%
60%
Half-Day Pre-K
39%
Full-Day Pre-K
49%
(based on pre-k-to-K sample) (based on pre-k-to-K sample)
Model K Screener TRC in the Fall of K

Chapter 1 | Factors Associated with Stronger Outcomes for English Learners14
were more likely to have an identified disability (22
percent compared to 11 percent) and were more likely
to enroll in a full-day program at the age of four (23
percent compared to 15 percent).
Analysis showed that even after taking into account
the differences in students’ observed characteristics,
ELs who enrolled in a CPS pre-k before the age of
four had stronger performance than their peers who
enrolled only for one year at the age of four, both in
terms of pre-k attendance and the development of
English and early reading skills at the beginning of
kindergarten. In terms of their English development,
ELs who enrolled in CPS pre-k early scored, on aver-
age, almost one proficiency level higher in the Model K
screener.27 Similarly, ELs who attended a CPS pre-k
before the age of four were 7 percentage points more
likely to meet the proficiency threshold in the TRC
reading test administered in English or Spanish
(see Figure 2).28
Although pre-k attendance rates did not differ
significantly by ELs’ age at the time they enrolled in
a CPS pre-k, we did find that ELs who enrolled younger
than age four and stayed in the same CPS school during
their pre-k years had stronger attendance in pre-k
as four-year-olds.
Participation in CPS pre-k and K-to-3 OutcomesIn order to explore the relationship between attending
a school-based pre-k and ELs’ performance in the early
grades, we turned to the K-to-3 sample. Among kinder-
garten ELs, we compared outcomes between those who
enrolled in a CPS pre-k and those who did not. Students
who did not attend a CPS school for pre-k might have
participated in other types of early education programs.
Thus, our findings would provide an estimate of the
relationship between attending a CPS pre-k and early-
grades outcomes compared to students who might have
enrolled in other preschool settings or might not have
any preschool experience.
FIGURE 2
ELs Who Enrolled in CPS Pre-K Younger Than Four Had Stronger Oral English Skills and Early Reading Proficiency by the Fall of Kindergarten
Note: These graphs display the adjusted average English proficiency level in the Model K screener and the proficiency rate in TRC reading test for students who enrolled before the age of four and those who enrolled only at the age of four. These adjusted averages can be read as the averages for two groups of ELs who were alike in all student characteristics and school factors included in our models and only di�ered in whether they enrolled in a CPS pre-k before age four or only enrolled in pre-k at the age of four. These di�erences were statistically significant after adjusting for student characteristics and school factors (see Appendix A for a complete list).
English proficiency level in Model K screener and percent of students proficient in the TRC test in the fall of kindergarten by age at pre-k enrollment
Pro
fici
ency
Lev
el
6.0
5.0
3.0
2.0
1.0
4.0
Only Enrolled at Age 4
2.6
Enrolled Before Age 4 Only Enrolled at Age 4 Enrolled Before Age 4
3.4
Per
cen
t P
rofi
cien
t o
n T
RC
100%
80%
40%
20%
0%
60%
37%44%
(based on pre-k-to-K sample) (based on pre-k-to-K sample)
Model K Screener TRC in the Fall of K
27 A large difference given that the standard deviation for the Model K screener in our sample was 1.8 proficiency levels, thus the effect size was 0.44 standard deviations.
28 Given that the standard deviation for the TRC proficiency was 49 percentage points, a difference of 7 percentage points translated into an effect size of 0.14 standard deviations.
15UCHICAGO Consortium Research Report | English Learners in Chicago Public Schools
More than one-half of kindergarten ELs participated
in CPS pre-k. Although many students entered the
district for the first time in kindergarten, many others
attended pre-k in a CPS school.29 This was also the case
for ELs. In the K-to-3 sample, 56 percent of kindergar-
ten ELs in 2015 and 2016 were enrolled in a CPS pre-k
the year before.
Kindergarten ELs who enrolled in a CPS pre-k had
different characteristics than their EL peers who did
not attend pre-k at all or who participated in other
types of preschool available in the city or elsewhere. For
instance, in line with CPS’ plans to make pre-k more ac-
cessible to students who might benefit the most, we see
that three-quarters of kindergarten ELs with identified
disabilities enrolled in a CPS pre-k the prior year (75
percent), compared to 53 percent of kindergarten ELs
who did not have an identified disability. Our analy-
sis took this into account along with other observed
student characteristics and school factors. Our results,
while non-causal, shed light on the relationship be-
tween attending CPS pre-k and later student outcomes
(see Appendix A for a full detailed description of the
methodology and variables included in the analysis).
Even after four years in school, attending a CPS pre-k
was associated with stronger learning outcomes and
school engagement for ELs. By the time ELs reached
third grade, ELs who enrolled in a CPS pre-k still had
slightly stronger performance than similar ELs who did
not enroll in a CPS pre-k. Compared to their EL peers
who did not enroll in a CPS pre-k, third-grade ELs who
enrolled in a CPS pre-k:
• Had higher attendance of about one additional school day
• Had slightly higher reading and math GPAs
(0.08 and 0.11 additional grade-point, respectively)
• Had higher scores in the NWEA-MAP math test
(0.99 additional scale score point)
• Were more likely to demonstrate English proficiency in
the ACCESS test by third grade (4 percentage points)30
Altogether, our findings show that attending pre-k
in a CPS school was a positive experience for ELs’
academic performance, not only in the short term but
even as far as third grade. In particular, ELs enroll-
ing in a full-day program or enrolling earlier than the
age of four was strongly associated with kindergarten
readiness in terms of their English and reading skills
development. The following sections will discuss other
school factors that are also related to ELs’ outcomes in
the early grades.
Participation in Bilingual Education ServicesOnce a student is identified as an EL, they are entitled
to Bilingual Education Services that support their
language development. While there are different types
of Bilingual Education Services that a CPS student may
experience, our data do not allow us to compare these
approaches to each other in great detail. Our data and
analyses of our K-to-3 sample did show that ELs who did
receive Bilingual Education Services had higher aca-
demic performance in the long run than students who
did not.31 We are also able to report outcomes for stu-
dents in Dual Language Programs; see the box titled
ELs in Dual Language Programs for details on p.16.
Overall, our findings suggest that Bilingual Education
Services are beneficial for ELs.
Only a small percentage of parents and guardians
refused language services for their EL students. In
Illinois, all ELs are entitled to Bilingual Education
Services, which include ESL instruction and, for
students with 20 or more ELs speaking their same
language at their school, instruction in their home
29 Some students who did not enroll in a CPS pre-k may have attended preschool in other early care settings for which we do not have data (e.g., community-based settings, private preschool).
30 Based on the standard deviations for the different third-grade outcomes in our K-to-3 sample, these differences translated into effect sizes ranging from 0.08 to 0.12 standard deviations. These were not very large effects, but they were still detect-able even in third grade.
31 In this section, we consider students to have “received bilingual services” if their parents or guardians had not refused services. Students in this category received a range of language sup-ports, including both home language instruction and English as a Second Language (ESL) instruction, and some may have attended schools that were out of full compliance with state requirements for bilingual services (Belsha, 2017). However, the fact that these students received some form of language development sets them apart from students whose parents or guardians refused bilingual services.

Chapter 1 | Factors Associated with Stronger Outcomes for English Learners16
language. However, not all students identified as ELs
receive services to aid their language development.
Parents and guardians may refuse services for their
child, which would prevent students from participat-
ing in the Bilingual Education Services their school
offers. ELs whose parents or guardians refuse Bilingual
Education Services have experiences that are analogous
to an English-immersion setting: they do not receive any
instruction in their home language or ESL support. Thus,
understanding how their outcomes compare to other ELs
in CPS may shed light on how a lack of targeted language
development relates to their academic performance.
Students whose parents or guardians refuse
Bilingual Education Services are still classified as ELs
Dual language programs provide core instruction in both English and a target language (usually Spanish in CPS), with the goal of students becoming bilingual and biliterate. ELs participating in Dual Language Programs receive a high level of instruction in their home lan-guage: dual language program models in CPS require that students receive between 50 and 80 percent of instruction in their home language. Dual language programs strengthen ELs’ skills in their home languageE and may also be beneficial for their cultural identity development.F Prior research has found that ELs in dual language settings scored lower on English-language tests in the early grades, but by middle school they had stron-ger scores on ELA tests.G Our study only follows ELs through the end of third grade, and thus might not capture the true long-term effects of Dual Language Programs. Furthermore, for the K-to-3 sample, we are unable to measure home language proficiency or cultural identity development, two areas likely to be
positively influenced by Dual Language Programs. Dual language programs are growing in popularity in CPS but are still relatively uncommon. In the K-to-3 sample, 7 percent of students attended Dual Language Programs. In the K-to-3 sample, ELs who attended Dual Language Programs had similar attendance across years and grades in reading and math in third grade, com-pared to other ELs. In outcomes measured in English, they generally scored lower than similar ELs. They received lower scores in the ACCESS test of English pro-ficiency in kindergarten, and by the end of third grade they had lower reading standardized test scores and were slightly less likely to demonstrate English profi-ciency on the ACCESS test. However, it is important to interpret these results with caution, since the long-term effects of Dual Language Programs may not be detect-able by the third grade, and the K-to-3 sample analysis includes no outcomes in students’ home language, which is a major focus of Dual Language Programs.
E Barnett, Yarosz, Thomas, Jung, & Blanco (2007); Collier & Thomas (2004).
F Reyes & Vallone (2007); Casesa (2019).
G Umansky & Reardon (2014).
ELs in Dual Language Programs
and, like other ELs, take the ACCESS test of English
proficiency each year to determine if they can demon-
strate sufficient English skills to become former ELs.
In the K-to-3 sample, refusals to Bilingual Education
Services were uncommon: 3 percent of ELs’ parents
or guardians refused Bilingual Education Services
for their student by the end of kindergarten.32 Even
though these students made up a small proportion of
the EL population, understanding how they perform
in school is important for parents and guardians
trying to make the best decision for their students.
It stands to reason that families who choose to
refuse services for their children may differ in some
ways from families who do not make this choice, and
32 In the pre-k-to-K sample, less than 1 percent of ELs’ parents or guardians refused bilingual services for their student by the end of pre-k. We generally do not find significant effects of
refusal status on outcomes for the pre-k-to-K sample, so we do not report results for this sample here.

17UCHICAGO Consortium Research Report | English Learners in Chicago Public Schools
we find some demographic differences between ELs
who received Bilingual Education Services and those
whose parents or guardians refused services. Compared
to other ELs, students whose parents or guardians
refused Bilingual Education Services were more likely
to be Spanish speakers, more likely to have an identi-
fied disability, and less likely to be eligible for free or
reduced-price lunch. ELs whose parents or guardians
refused services also entered CPS with higher average
English skills (see Table B.2. in Appendix B on p.42).
Our models accounted for the differences we observed,
and when we compare ELs who refused services to simi-
lar ELs who received Bilingual Education Services, we
find educational advantages in the long-run for those
who received services.
In the long run, students who received Bilingual
Education Services had higher academic and atten-
dance outcomes than those who refused. We find that
ELs who received services had higher attendance across
grades than ELs whose parents or guardians refused EL
FIGURE 3
ELs Who Received Bilingual Education Services Had Higher Attendance than ELs Whose Parents or Guardians Refused Services
Note: This graph shows kindergarten and third grade adjusted average attendance rates for students whose parents or guardians refused Bilingual Education services and those who did not. These adjusted averages can be read as the averages for two groups of ELs who were alike in all student characteristics and school factors included in our models and only di�ered in whether their parents or guardians refused Bilingual Education Services or not. These di�erences were statistically significant after adjusting for student characteristics and school factors (see Appendix A for a complete list).
Percent of days attended in kindergarten and third grade by refusal of Bilingual Education Services
Per
cen
t o
f D
ays
Att
end
ed
100%
98%
94%
92%
90%
96%
Received Services Refused Services
94.8%
93.8%
Per
cen
t o
f D
ays
Att
end
ed
100%
98%
94%
92%
90%
96%96.3%
95.4%
Average Attendance in K Average Attendance in Third Grade
(based on K-to-3 sample)
Received Services Refused Services
(based on K-to-3 sample)
services (Figure 3). In the third grade, ELs who received
services attended two more days of school than similar
students whose parents or guardians refused services.33
Even after controlling for incoming English proficiency,
ELs who received services had lower kindergarten
English proficiency scores in the ACCESS test (particu-
larly in speaking and listening) than similar ELs whose
parents or guardians refused EL services. However, by
end of third grade, students who received services were
4 percentage points more likely to demonstrate English
proficiency on the ACCESS test (Figure 4)—which sug-
gests that ELs whose parents or guardians refused ser-
vices stagnated in their English language development,
compared to ELs who received services.34
Furthermore, students who received services had
higher academic outcomes in the third grade. Compared
to similar students who refused services, students who
received services had higher GPAs in both math and
reading and scored almost two points higher on the
math NWEA test and one point higher on the reading
NWEA test.35
33 Given that the standard deviation for attendance in third grade was 4.3 percentage points, a difference of 0.9 percentage points, or two days, translated into an effect size of 0.21.
34 A difference of 4 percentage points in the likelihood of demonstrating English proficiency was equivalent to an effect size of 0.11 standard deviations.
35 Based on the standard deviations for the different third-grade outcomes in our K-to-3 sample, these differences translated into effect sizes ranging from 0.08 to 0.16 standard deviations.

Chapter 1 | Factors Associated with Stronger Outcomes for English Learners18
FIGURE 4
ELs Who Received Bilingual Education Services Were More Likely to Demonstrate English Proficiency in Third Grade than ELs Whose Parents or Guardians Refused Services
Note: This graph shows adjusted di�erences in the likelihood of demonstrating English proficiency by third grade between students whose parents or guardians refused Bilingual Education Services and those who did not. These adjusted aver-ages can be read as the averages for two groups of ELs who were alike in all student characteristics and school factors included in our models and only di�ered in whether their parents or guardians refused Bilingual Education Services or not. These di�erences were statistically significant after adjusting for student charac-teristics and school factors (see Appendix A for a complete list).
Percent of students who demonstrated English proficiency in ACCESS test by
the end of third grade by refusal of Bilingual Education Services
Per
cen
t E
ng
lish
Pro
fici
ent
by
Th
ird
Gra
de
20%
16%
8%
4%
0%
12%
18%
14%
6%
2%
10%
Received Services Refused Services
16%
12%
(based on K-to-3 sample)
Adjusting for their incoming characteristics, stu-
dents who refused services had higher English profi-
ciency scores at the end of kindergarten—but by the
third grade, they were no longer ahead of their peers on
virtually any metric.36 The disadvantages of refusing
Bilingual Education Services might not be obvious at
first, but these findings offer important considerations
for teachers and families of future ELs to consider.
Enrollment in a Highly Rated SchoolIn line with the increased focus on school accountabil-
ity throughout the nation, CPS assigns most schools a
quality rating every year based on the CPS accountabil-
ity system, SQRP.37 These ratings reflect a school’s per-
formance based on several metrics (see the box titled
School Quality Rating Policy) and are easily available
to the public. Our findings show that ELs who enrolled
in highly rated schools (Level 1+) had stronger outcomes
in standardized tests compared to their peers attending
schools with lower SQRP ratings.
Critics of SQRP argue that these ratings can be more
highly correlated with the composition of the student
SQRP is the Chicago Board of Education’s policy for evaluating school performance.H Ratings are calculated based on different metrics, depending on whether schools are elementary schools, high schools, or option schools. Rating in a particular year is based on prior year data. For elementary schools, the indicators used include student attainment and growth on the NWEA MAP tests, student attendance, 5Essentials survey data, student growth on ACCESS for ELs, and a data quality indicator. Student growth on
the NWEA MAP tests and student attendance are weighted more heavily on the calculation of the overall rating. Most of the metrics are based on students enrolled in kindergarten and above, even when elementary schools also serve pre-k students. Under the current district accountability system, there are five different ratings schools can get: Level 1+, Level 1, Level 2+, Level 2, and Level 3. CPS determines that Level 3 schools are in need of intensive support, Level 2 schools are in need of targeted support, while others are meeting the quality expectations set by the district.
School Quality Rating Policy (SQRP)
H For more information see https://www.cps.edu/about/district-data/metrics/sqrp/
36 Students whose parents or guardians refused services had higher scores on the listening domain of the third-grade AC-CESS test than similar students who received services. How-ever, students whose parents or guardians refused services were less likely to demonstrate proficiency by the end of third grade, so they were more likely to be taking the ACCESS test in third than students who received services. Thus, the results of these groups may not be comparable for that outcome. On all other third-grade outcomes, students whose parents or
guardians refused services had results that were lower (attendance, math and reading GPA, math and reading NWEA, ACCESS reading and writing proficiency levels, likelihood of demonstrating English proficiency) or similar (ACCESS composite and speaking proficiency levels) to students who received services.
37 This accountability system is currently under review (see https://www.cps.edu/strategic-initiatives/accountability-redesign).

19UCHICAGO Consortium Research Report | English Learners in Chicago Public Schools
body being served in schools than to school practices.38
We acknowledge that the SQRP metric does not capture
all the different dimensions one could consider when
measuring school quality. However, it still reflects as-
pects that parents and families may value about schools.
We included SQRP in our analyses to be consistent with
the district’s accountability policy and recognize the
practicality of this metric for different stakeholders.
In our K-to-3 sample, two-thirds of ELs were attend-
ing kindergarten in a school with one of the highest
ratings, Level 1+ or Level 1. An additional 21 percent of
students were enrolled in a Level 2+ school. In com-
parison, few students were enrolled in schools that the
district deemed in need of supports. Only 10 percent of
the students were enrolled in a Level 2 school and less
than 1 percent attended Level 3 schools.39
Attending higher-rated schools, based on CPS’ School
Quality Rating Policy, was associated with higher
standardized test scores in math and reading.
Analyses that accounted for student and school
differences showed that the rating a school received
was positively associated with the scores ELs obtained
in their third-grade math NWEA standardized assess-
ments. For example, an average student enrolled in a
Level 1+ school, the highest rating, scored 205 on the
math NWEA in third grade while a similar student in
a Level 2 school scored 200 (Figure 5). Not only were
these differences statistically significant, they were
also meaningful in practice as a score of 205 in math in
third grade places a student in the 54th national per-
centile while a score of 200 places a student in the 39th
national percentile. Similar differences were also mea-
sured in the third-grade reading NWEA results: five
scale score points separated similar students in schools
in Level 1+ and those attending Level 2 schools.40
Attending schools with a higher SQRP rating was also
positively associated with ELs’ English proficiency
scores, as measured by the ACCESS test. School
ratings were also associated with ELs’ scores on the
ACCESS test of English proficiency, with students
FIGURE 5
ELs With Similar Characteristics Who Attended Highly Rated Schools Had Higher Math Scores on the NWEA Test and Higher Proficiency Levels on the ACCESS Test in Third Grade
Note: These graphs depict the adjusted average test scores in schools where the majority of ELs were enrolled. As few students were enrolled in schools in Level 3 or schools with no ratings, these groups are not shown in the figures. These adjusted averages can be read as the average test scores for two groups of ELs who were alike in all student characteristics and school factors included in our models and only di�ered in whether they attended schools with di�erent SQRP ratings. These di�erences were statistically significant after adjusting for student characteristics and school factors (see Appendix A for a complete list).
Third-grade test scores in Math NWEA and proficiency levels in ACCESS by SQRP level
Sca
le S
core
Po
ints
215
210
205
195
190
185
200
Level 1+ Level 1 Level 2+ Level 2 Level 1+ Level 1 Level 2+ Level 2
205
200201203
Pro
fici
ency
Lev
el
6.0
5.0
3.0
2.0
1.0
4.0
(based on K-to-3 sample) (based on K-to-3 sample)
Third-Grade Math NWEA Third-Grade ACCESS Composite
3.73.43.53.6
38 Walker Burke (2020, January 27).39 There are a few schools in the district that do not receive a
rating; 3 percent of students in our K-to-3 sample were enrolled in those schools.
40 In our sample, the variation in NWEA test scores, measured in standard deviations, is 16 points in reading and 13 points in math. These estimated differences attributed to attending schools with different ratings represent an effect size of 0.31 standard deviations in reading and 0.38 in math.

Chapter 1 | Factors Associated with Stronger Outcomes for English Learners20
attending higher-rated schools scoring higher in terms
of English proficiency than students at lower-rated
schools. In kindergarten, the differences in proficiency
levels were small, even though they were statistically
significant, but in third grade those differences became
more pronounced. For example, the average EL enrolled
in a Level 1+ school scored 0.3 proficiency levels, or
about one-third of a standard deviation, higher on the
composite ACCESS compared to a similar EL at a Level
2 school (Figure 5). It is worth noting that SQRP ratings
were not related to whether students demonstrated
English proficiency by third grade.
Figure 5 shows the adjusted average test score in
math NWEA and ACCESS in third grade between the
average EL attending schools with different ratings,
based on the K-to-3 sample.
While prior year’s attendance is one of the metrics
included as part of the SQRP ratings, the relationship
with ELs’ attendance was statistically significant only
in kindergarten. However, differences in attendance
attributed to schools with different ratings were small
and not meaningful in practice. Our analyses also
showed that school ratings were not associated with
the math and reading grades ELs received in their
third-grade classes.
For pre-k ELs, attending schools with a higher
SQRP rating was positively associated with English
proficiency and somewhat related to attendance. Even
though school ratings are based on data from students
in grades kindergarten and above, elementary school’s
SQRP ratings were associated with advancing English
skills in pre-k, based on the pre-k-to-K sample. The
average pre-k EL in a Level 1+ school compared to a
similar student attending a Level 2 school scored 0.4
proficiency levels higher in the Model K screener they
took at the beginning of kindergarten, which represents
a difference of 0.2 standard deviations. Attendance
in pre-k was also positively related to school ratings,
but again this association was not strong enough to be
meaningful.
In this chapter, we highlighted circumstances in
which we saw some ELs showing stronger academic
success than their peers who were also ELs. Those
cases included when students participated in a CPS
pre-k, especially in a full-day program, when ELs
received Bilingual Education Services, and when ELs
were attending higher-rated schools. The next chapter
will explore whether in the early years we can identify
young ELs who might benefit from additional assis-
tance to support their academic performance.

21UCHICAGO Consortium Research Report | English Learners in Chicago Public Schools
CHAPTER 2
Identifying ELs Who Would Benefit from Additional SupportOur prior work on ELs pointed out that one in five
students who began kindergarten as ELs were still clas-
sified as ELs in eighth grade.41 This group of ELs was
unable to demonstrate English proficiency by eighth
grade, attended school at lower rates than other ELs,
and had lower grades and test scores. This suggests that
they were less engaged in school and struggled in their
classes. These ELs would benefit from additional sup-
ports to keep them engaged and improve their learning
if they could be identified early on. In this chapter, we
focus on whether we can identify among ELs those in
need of further learning opportunities.42
Here, we highlight two factors that were associated
with ELs’ academic performance: 1) students’ English
proficiency level at the time of enrollment in CPS; and
2) whether students had identified disabilities. Similar
to the prior chapter, we present analyses based on two
different samples, the pre-k-to-K sample and the K-to-3
sample, to show these relationships. Practitioners could
use these findings to target students in the early grades.
To preview the results:
• Entering pre-k or kindergarten with low levels of
English language proficiency (i.e., in the early stages
of English development) was related to lower academ-
ic performance, measured by standardized test scores
and grades. However, the initial English language
proficiency was, in general, not related to attendance.
• We found that schools with large numbers of
ELs starting school with low levels of English
language proficiency might also benefit from
more supports. The ELs served in these schools
had lower grades and lower proficiency English lev-
els in their ACCESS test in third grade, compared
to similar students across similar schools that dif-
fered only in the number of students who started
school with a low English proficiency level.
• Certain identified disabilities were associated
with students having a harder time in school. ELs
with identified disabilities made progress toward
acquiring English skills, but at a slower pace than
their peers. Students with most types of identified
disabilities, except those with speech and language
disabilities, had lower attendance.
English Language Skills Measured at Time of School Enrollment When a student enrolls in CPS, the student is screened
for English proficiency within 30 days of enrollment,
based on the answers to the Home Language Survey.
Our analyses of the scores from these screener tests
among ELs show that they were related to students’
outcomes in school even a few years after the screener
was taken. ELs in the early stages of acquiring English
skills, reflected by their lower screener scores, tended
to have lower grades and test score performance com-
pared to other ELs. However, attendance was not relat-
ed to screener test scores. This information is available
to practitioners very soon after students enrolled in
school and could be useful to target further supports.
41 de la Torre et al. (2019).42 Once more, the analyses we present here looked at the relation-
ship between student and school factors and student outcomes in pre-k, kindergarten, and third grade after statistically account-ing for differences that could be explained by other student characteristics and school factors (see Appendix A for details on the statistical models). In other words, the differences attributed to a particular factor we present here can be interpreted as
comparing students who are alike on all other measured characteristics except the particular factor of interest. We again highlight in this chapter factors that: 1) were statistically significant (i.e., the estimate was precise and showed a positive or negative relationship with outcomes); 2) had a meaningful relationship (i.e., the size of the estimated coefficients was large compared to the variation in outcomes we observed among ELs); and 3) were important across different outcomes.

Chapter 2 | Identifying ELs Who Would Benefit from Additional Support22
More than one-half of the ELs served in CPS in pre-k
and kindergarten were in the early stages of develop-
ing English language skills. Close to one-half of the
EL students starting pre-k and kindergarten in our
two samples demonstrated the acquisition of some
oral skills in English (on the pre-k screener: “Early
Intermediate, Intermediate, or Early Advanced”; on
the K screener: “emerging, developing, or exploring”)
as measured by the screener tests; the other one-half
scored in the beginning/entering levels (see Figure 6),
which we consider to be the early stages of developing
English language skills.
Students who score in the beginning (pre-k)/entering
(K) levels in the screener test most likely will be listening
and responding in non-verbal ways to show understand-
ing or starting to use single words, one- or two-word
phrases, and repetitive language with limited compre-
hension (see the box titled Screener Tests in Pre-K and
Kindergarten for a description of English proficiency
levels). As students advance their English language skills,
they move to using simple sentences to communicate
and their comprehension starts to improve. Eventually
they can communicate more complete thoughts with
sentences of increasing length and complexity and can
participate in everyday conversations without highly
contextualized support. Ultimately, students reach the
advanced fluency stage where their language skills are
similar to that of a native speaker.
A few demographic differences were apparent
between students who joined school in the early
developmental stages of their English skills and stu-
dents with higher scores in the screener tests. In the
group of ELs who scored in the beginning (pre-k)/
entering (K) levels in the screener test, there were
relatively more male students, more Spanish speakers,
more students eligible for free or reduced-price lunch,
and more students with an identified disability. In
addition, students with higher scores in the screener
tests in kindergarten were more likely to refuse
Bilingual Education Services. It could be the case that
Pre-k students (aged 3, 4, and 5) are screened for English language proficiency using the Pre-IPT Oral English Language Proficiency Test. The test is admin-istered individually, ideally by a bilingual educator, and assesses four areas of oral language proficiency (Vocabulary, Comprehension, Syntax, and Verbal Expression) by displaying story pieces on a board and asking students scripted questions about them. The test is scored in five proficiency levels:
• A or beginning (non-English speaking),
• B or early intermediate (limited English speaking),
• C or intermediate (limited English speaking),
• D or early advanced (limited English speaking),and
• E or advanced (fluent English speaking).
Four-year-old students who score below E are eligible for bilingual services and identified as ELs.
Students are only screened once during pre-k, but every student whose Home Language Survey indicated they spoke a language other than English at home must be re-screened upon kindergarten entry using the Model K screener test. Kindergarten students screened in the
fall only take the oral portion (speaking and listening domains) of the test. The Model K screener test is divided into six proficiency levels:
• Level 1 or entering (use minimal social language and academic language with visual and graphic support),
• Level 2 or emerging (use some social English and general academic language with visual and graphic support),
• Level 3 or developing (use social English and some specific academic language with visual and graphic support),
• Level 4 or expanding (use social English and some technical academic language),
• Level 5 or bridging (use social English and academic language working with grade-level material), and
• Level 6 or reaching (use social and academic lan-guage at the highest level measured by this test).
Kindergarten students who do not obtain a proficiency level of 5 or above are identified as ELs and will need to take the ACCESS test of English proficiency during the spring each year until they reach the English proficiency threshold.
Screener Tests in Pre-K and Kindergarten

23UCHICAGO Consortium Research Report | English Learners in Chicago Public Schools
parents or guardians were more likely to refuse services
if their student exhibited higher levels of oral English
skills, suggesting to them that the student was ready
to perform in an English immersion environment. For
more information on ELs’ characteristics by screener
scores, see table B.4 in Appendix B.
Differences in screener English proficiency levels were
associated with academic performance.
We found that lower (and higher) scores on screener
tests when students entered pre-k and kindergarten
were correlated with lower (and higher) later scores of
English proficiency and other assessments in reading
and math, commonly administered in English. Those
differences by incoming English proficiency persisted
even after four years in school.
In general, ELs in the pre-k-to-K sample who enrolled
in a CPS pre-k with higher incoming English scores were
more likely to attain proficiency in the TRC assessment
in the fall of kindergarten. In CPS, this assessment
can be administered in either English or Spanish.43
Figure 7 shows the percent of students who were
FIGURE 6
At the Time of Enrollment, ELs Exhibited a Range of Developmental Stages of English Language Skills
Note: Not included in the above K figure are 1 percent of sample students who were missing Model K screener scores or passed the screener but were still labeled as ELs.
Percent of ELs at di�erent proficiency levels on the IPT screener and Model K screener
Per
cen
t o
f E
Ls
100%
80%
60%
20%
0%
40%
All K ELs(based on K-to-3 sample)
Per
cen
t o
f E
Ls
All pre-k ELs(based on pre-k-to-K sample)
IPT Screener Test (pre-K ELs) Model K Screener Test (K ELs)
53%
30%
9%8%
100%
80%
60%
20%
0%
40%
55%
16%
17%
12%Early Advanced (Level D) Expanding (Level 4)
Beginning (Level A)
Early Intermediate (Level B)
Intermediate (Level C)
Entering (Level 1)
Emerging (Level 2)
Developing (Level 3)
proficient in the TRC when comparing students alike
in all other student characteristics and school factors.
We estimate that students who were in the beginning
proficiency level upon entering pre-k were 7 percentage
points less likely to be proficient on the TRC test than
students in the next level (early intermediate) and 13
percentage points lower than other similar ELs in the
following levels.44
It is worth noting that when students were tested
in Spanish, they were more likely to demonstrate
proficiency on the TRC than students with the same
screener score who were tested in English; a differ-
ence of 7 percentage points. This indicates that being
assessed in English prevented some ELs from showing
the full extent of their early literacy skills. However, if
a student scored high on the screener, they tended to
score higher on the TRC, regardless of whether it was
conducted in English or Spanish.
Based on the students in our K-to-3 sample, we find
that differences in the screener scores in kindergarten
were still detectable in ELs’ third-grade NWEA scores
in both reading and math (see Figure 8). Differences
43 Among the TRC takers, 41 percent took the Spanish version. It was less likely for ELs in the Early Advanced screener level to take the TRC in Spanish (16 percent) than for ELs in the Beginning screener level (52 percent).
44 Given that the standard deviation for the TRC proficiency was 49 percentage points, a difference of 7 percentage points represented an effect size of 0.14 standard deviations and 13 percentage points represented an effect size of 0.27 standard deviations.

Chapter 2 | Identifying ELs Who Would Benefit from Additional Support24
FIGURE 7
ELs Who Started Pre-k in the Beginning Stages of Developing English Skills Were Less Likely to Demonstrate Proficiency on the TRC
Note: Fifty-seven percent of the pre-k-to-K sample took the TRC assessment in the fall of kindergarten (with similar rates regardless of their screener scores). This graph shows adjusted di�erences in TRC proficiency rates. These adjusted averages can be read as the averages for di�erent groups of ELs who were alike in all student characteristics and school factors included in our models and only di�ered in their English proficiency level from the pre IPT screener test. These di�erences were statistically significant after adjusting for student characteristics and school factors (see Appendix A for a complete list).
Percent of students proficient in TRC test in the fall of kindergarten
Per
cen
t P
rofi
cien
t o
n T
RC
100%
80%
60%
20%
0%
40%
Beginning Early Intermediate Early AdvancedIntermediate
37%44% 50% 50%
English Proficiency Levels from the Pre IPT Screener(based on the pre-k-to-K sample)
90%
70%
50%
10%
30%
Sca
le S
core
Po
ints
215
210
205
195
190
185
200
FIGURE 8
Di�erences in English Proficiency Levels Measured by the Screener Test in Kindergarten Were Related to Performance in Reading and Math in NWEA Test in Third Grade
Note: Based on ELs who took NWEA assessment in third grade (90 percent of third-grade ELs in our K-to-3 sample took the reading portion of NWEA and 92 percent took the math assessment). This graph shows adjusted di erences in NWEA scale score points. These adjusted averages can be read as the average test scores for di erent groups of ELs who were alike in all student characteristics and school factors included in our models and only di ered in their English proficiency level from the Model K screener.These di erences were statistically significant after adjusting for student characteristics and school factors (see Appendix A for a complete list).
Third-grade NWEA reading and math scores by Model K screener proficiency levels
Sca
le S
core
Po
ints
215
210
205
195
190
185
200
Entering Emerging Developing Expanding Entering Emerging Developing Expanding
32nd percentile
192
55th percentile
201
42nd percentile
201
57th percentile
206
198196
Third-Grade Reading NWEA Third-Grade Math NWEA
204203
English Proficiency Levels from the Model K Screener(based on K-to-3 sample)
English Proficiency Levels from the Model K Screener(based on K-to-3 sample)

25UCHICAGO Consortium Research Report | English Learners in Chicago Public Schools
45 The standard deviation for the reading NWEA was 16 points, therefore a difference of nine points between students in entering and expanding levels translated into an effect size of 0.56 standard deviations. In terms of math, the difference of five points between students in entering and expanding levels represented an effect size of 0.38 standard deviations given that the standard deviation of math NWEA scores was 13 points in our K-to-3 sample.
46 Grades in reading had a standard deviation of 0.88 GPA points and 0.89 GPA points in math. The differences reported in grades indicated an effect size of 0.34 and 0.22 standard deviations respectively.
47 Collier & Thomas (2009).
were larger in the reading test than the math test. When
comparing students alike in all other student charac-
teristics and school factors who only differed in their
screener score in kindergarten, students at the enter-
ing level in kindergarten scored in the 32nd percentile
in reading and in the 42nd percentile in math in third
grade, while students in the expanding level in kinder-
garten scored in the 55th percentile in reading and
57th percentile in math.45
Screener scores were not only related to standardized
test performance, but they were also related to grades
in third-grade classes. Differences were estimated to
be 0.3 GPA points lower for reading and 0.2 GPA points
lower for math between students in the entering group
vs. students in the expanding group.46 Grading protocol
for ELs in CPS establishes that grades should be based
on students’ content knowledge, and ELs should not re-
ceive a failing grade due to limited English proficiency.
These differences in grades indicate that the screener
scores were related to later content knowledge, which
might signal that students who enter school with lower
screener scores need additional instruction and help to
be successful in school.
Generally, we found that the screener data was not
related to students’ attendance. Although students
with the lowest screener scores had higher average
attendance in pre-k (based on pre-k-to-K sample),
attendance later on, in kindergarten and third grade,
was not related to screener differences (based on K-to-3
sample). This is encouraging, as students’ attendance is
important for their learning and it signals engagement
with school, even for those students whose English
language skills were in the early stages of development.
The fact that they were attending school at similar rates
indicated that students would be present in school to
receive additional assistance.
Not surprisingly, screener scores that measured
English oral language skills were related to ACCESS
test scores that measure English language proficiency.
Students who entered kindergarten with higher levels of
English skills were more likely to demonstrate English
proficiency on the ACCESS test and become former ELs
by the end of third grade. Ten percent of students in the
entering level demonstrated English proficiency on the
ACCESS test by the end of third grade, while for stu-
dents who entered CPS in the expanding level, it was 33
percent. Recall that prior research has found that devel-
oping academic English skills typically takes between
five to seven years.47 So, in third grade, we would not
necessarily expect many ELs to reach this milestone.
Among ELs who took the ACCESS test of English
proficiency in third grade, their scores in speaking and
writing domains were not that different based on their
incoming English skills. But students who started kin-
dergarten with lower K-screener scores had significant-
ly lower third-grade scores in the listening and reading
domains (see Figure 9). They also scored lower in the
reading portion of the NWEA assessment compared to
the math portion. Practitioners may want to provide
differentiated instructional strategies to help ELs
develop their English skills in these different domains:
• Interventions aimed at strengthening skills in the
listening and reading domains might be beneficial
for ELs with low incoming English skills.
• Interventions aimed at improving skills in speaking
and writing, which are productive language skills,
might provide general strategies to help all ELs.

Chapter 2 | Identifying ELs Who Would Benefit from Additional Support26
FIGURE 9
ACCESS Listening and Reading Domains Showed the Largest Dierences Among Students with Dierent Incoming Screener English Proficiency Levels
Note: Based on ELs who took the ACCESS test in third grade (90 percent of third-grade ELs in our K-to-3 sample took the reading portion of NWEA and 92 percent took the math assessment). This graph shows adjusted di�erences in NWEA scale score points. These adjusted averages can be read as the average test scores for di�erent groups of ELs who were alike in all student characteristics and school factors included in our models and only di�ered in their English proficiency level from the Model K screener. These di�erences were statistically significant after adjusting for student characteristics and school factors (see Appendix A for a complete list).
Third-grade English proficiency levels in ACCESS composite and domains by Model K screener proficiency levels
Pro
fici
ency
Lev
el
6.0
5.0
4.0
2.0
1.5
1.0
3.0
5.5
4.5
3.5
2.5
Composite Listening Speak Read Write
3.43.7 3.8 3.9
4.4
4.9 5.05.3
English Proficiency Levels from the Model K Screener(based on K-to-3 sample)
2.72.9 2.9 3.0
3.5 3.6 3.6 3.73.74.1
4.34.5
Entering (Level 1) Emerging (Level 2) Developing (Level 3) Expanding (Level 4)
We found that, not only did students across schools who were in early stages of English language devel-opment need additional support, but schools serving large numbers of these ELs might need further re-sources to help advance learning for all ELs they serve. In the K-to-3 sample, ELs who attended schools with a concentration of ELs who scored at lower screener levels in kindergarten were less likely to demonstrate English proficiency in the ACCESS test by third grade, compared to ELs at schools that were similar in all other characteristics. That is, if two similar ELs entered CPS at the lowest screener score level, but attended schools that differed on this dimension, we would expect the EL who attended the school with a higher percent of ELs at the early stage of English development to be less likely to demonstrate English
proficiency by the end of third grade than their peer. Moreover, among ELs who took the ACCESS test in third grade, their scores were on average lower com-pared to their EL peers in other schools. But more importantly, students’ grades in reading and math were also lower in the third grade. Schools with large numbers of ELs in the early stages of English language development might have different needs than other schools. For instance, it might be particularly challenging for teachers to provide extensive support to larger numbers of students. It is important for district leaders and policymakers to consider how to provide additional resources and support to schools that serve large numbers of ELs who are early in their English development.
Schools Serving a Large Proportion of ELs with Low Screener Scores Might Need Additional Support

27UCHICAGO Consortium Research Report | English Learners in Chicago Public Schools
Identified Disabilities ELs with disabilities are a diverse group of students
with unique educational needs. Among EL students,
we found 17 percent had an identified disability in the
pre-k-to-K sample (identified during their pre-k years)
and 12 percent in the K-to-3 sample (identified during
or prior to their kindergarten year). Most students who
were identified with a disability were classified as hav-
ing a developmental delay (9 percent in the pre-k-to-K
sample; 6 percent in the K-to-3 sample), followed by stu-
dents with a speech and language disability (4 percent
in the pre-k-to-K sample; 3 percent in the K-to-3 sample),
and cognitive disability (2 percent in both samples).48
Our prior study found that ELs with identified disabili-
ties were more likely to be among students who did not
demonstrate English proficiency by eighth grade, had
lower attendance, and worse academic outcomes in
the long run.49
Our analyses among ELs who had identified dis-
abilities showed that, with the exception of students
identified with a speech and language disability, they had
lower attendance and, even though they made progress
toward acquiring English skills, their progress was slower.
The listening and reading domains on ACCESS were the
areas in which these students showed larger differences in
their path toward English proficiency.
ELs who had an identified disability were more
likely to be male, be in the early stages of develop-
ing English skills, and more likely to refuse Bilingual
Education Services. There was an overrepresentation of
male students in the population of ELs with disabilities:
close to three-quarters were male. We found that stu-
dents with disabilities were more likely to score in the
lowest proficiency level of the screeners. While in our
K-to-3 sample we found that 3 percent of families
refused Bilingual Education Services, the likelihood
of refusing services was greater among ELs with dis-
abilities. This number increased to 6 percent among
students with developmental delays and 5 percent for
students with speech and language disabilities (see
table B.5. in Appendix B for detailed information).
The Individuals with Disabilities Education Act (IDEA) is the federal law that requires public schools to pro-vide special education services to children ages 3-21 who meet certain criteria. Districts have a process in place to determine which students are eligible for special education. This process involves a comprehensive evaluation that looks at aspects of students’ development. Special education is tailored to meet the needs of students with disabilities. The services and sup-ports one child receives may be very different from what another child receives. For our analyses we divided students with disabilities into the following four categories:
1. Developmental DelayApplies to children aged 3 to 9 experiencingdelays in one or more of the following areas:physical development; cognitive development;communication development; social or emotionaldevelopment; or adaptive development.
2. Speech and Language DisabilityDefined as a communication disorder such asstuttering, impaired articulation, a languageimpairment, or a voice impairment that adverselyaffects a child’s educational performance.
3. Cognitive DisabilityGenerally refers to any disability affecting mentalprocesses. Autism, for example, would be includedin this category.
4. Other DisabilitiesIncludes behavioral, learning, and other physicaldisabilities. Because there were few students inthese categories in our samples at early grades,we present the results of our analyses as a singlecategory, not because they represent a similartype of disability.
Students with Disabilities and Special Education
48 See the box titled Students with Disabilities and Special Education for a description of these categories.
49 de la Torre et al. (2019).
Chapter 2 | Identifying ELs Who Would Benefit from Additional Support28
ELs with identified disabilities were more likely to
miss school, except those with speech and language
disabilities. This is true for attendance in pre-k, in
kindergarten, and in third grade (see Figure 10).
Attendance increased for all students during the early
grades. One trend to notice is that differences among
ELs with disabilities and those not identified for special
education were smaller by the time they reached third
grade. For example, for students with developmental
delay, the difference in attendance in pre-k was 3 per-
centage points lower, which translated into more than
five days; in kindergarten the difference was about two
days; it narrowed to one day in third grade.50 Given
the importance of being in school in order to receive
services and make progress in learning, this data shows
that interventions to improve attendance in the early
grades, especially in pre-k and kindergarten, might help
students to get the supports they need.
FIGURE 10
ELs With Identified Disabilities Were Less Likely to Attend School, But Their Attendance Improved Over Time
Percent of days attended in pre-k, kindergarten, and third grade, by disability category
Note: These graphs show adjusted di�erences in attendance rates. These adjusted averages can be read as the average attendance rate for di�erent groups of ELs who were alike in all student characteristics and school factors included in our models and only di�ered in whether they had an identified disability and the type of identified disability. These di�erences were statistically significant between all groups of students with disabilities (except for students with speech and language disabilities) and students without identified disabilities, after adjusting for student characteristics and school factors (see Appendix A for a complete list).
100%96%92%88%84%80%
Without Identified Disabilities
Developmental Delay
Speech / Language Disability
Cognitive Disability
Other Disability
91.6%
88.8%
86.0%
88.2%
Attendance in Pre-K
98%94%90%86%82%
Percent of Days Attended(based on the pre-k-to-K sample)
91.8%
100%96%92%88%84%80%
Without Identified Disabilities
Developmental Delay
Speech / Language Disability
Cognitive Disability
Other Disability
95.1%
93.8%
90.3%
91.0%
Attendance in K
98%94%90%86%82%
Percent of Days Attended(based on the K-to-3 sample)
95.0%
100%96%92%88%84%80%
Without Identified Disabilities
Developmental Delay
Speech / Language Disability
Cognitive Disability
Other Disability
96.3%
95.3%
93.1%
94.0%
Attendance in Third Grade
98%94%90%86%82%
Percent of Days Attended(based on the K-to-3 sample)
96.1%
50 The standard deviations for attendance in pre-k was 7.6 per-centage points, 5.2 in kindergarten and 4.3 in third grade. This implies that the difference in attendance in pre-k estimated between students with developmental delay and students with
no identified disabilities of 3 percentage points was equiva-lent to 0.39 standard deviations; 0.38 standard deviations in kindergarten attendance; and 0.23 standard deviations in third-grade attendance.

29UCHICAGO Consortium Research Report | English Learners in Chicago Public Schools
Progress toward acquiring English skills was slower for
ELs with identified disabilities; listening and reading
domains were the areas with the largest differences.
Figure 11 compares the proficiency level in ACCESS
for students without identified disabilities and those
with disabilities after accounting for other measurable
differences like initial English skills assessed in the
screener tests. When we compared their ACCESS scores
with similar students except for their disability status,
we found that their scores were lower, both in kinder-
garten and in third grade. However, when comparing
their scores in kindergarten and third grade, we see
that students with disabilities were making progress
toward their English proficiency, but at a slower rate.
These differences emerged very early, even when we
controlled for their initial English proficiency.
Figure 12 shows the third-grade English proficiency
levels for different ACCESS domains for ELs with dis-
abilities, compared to students with no identified dis-
abilities and after controlling for all other observable
differences. Speaking was the domain with the lowest
proficiency levels for all students. But the largest dif-
ferences between the proficiency levels of students with
no identified disabilities and students with identified
disabilities were in the listening and reading domains of
ACCESS. Students with a speech and language disabili-
ty were performing closer to students with no identified
disability, among students with identified disabilities.
This chapter presented information on identifying
ELs who might benefit from additional help in the early
grades. We found that students with low English profi-
ciency levels—as measured by screener tests—were not
on par with other ELs by the time they reached third
grade. It was particularly difficult for ELs who had an
identified disability. Our findings suggest the importance
of prioritizing supports for these students, particularly
those that will help them strengthen their reading skills.
ELs with identified disabilities also had lower attendance
than their peers, so schools should focus on addressing
attendance issues among this group of students.
FIGURE 11
ELs With Identified Disabilities Made Progress Toward Acquiring English Skills, but Started Lower Than Other Similar Students Without Identified Disabilities
ACCESS composite proficiency levels in kindergarten and third grade, by disability status
Note: Not many students with cognitive disabilities and other disabilities were tested with the regular ACCESS test in third grade; there is an alternate ACCESS test for students with the most significant disabilities. This graph shows adjusted di�erences in proficiency levels in the ACCESS test. These adjusted averages can be read as the average proficiency level for di�erent groups of ELs who were alike in all student characteristics and school factors included in our models and only di�ered in whether they had an identified disability and the type of identified disability. These di�erences were statistically significant after adjusting for student characteristics and school factors (see Appendix A for a complete list).
6.05.04.03.02.01.0
Without Identified Disabilities
Developmental Delay
Speech / Language Disability
Cognitive Disability
Other Disability
2.1
1.8
1.8
1.7
5.54.53.52.51.5
6.05.04.03.02.01.0 5.54.53.52.51.5
Proficiency Level(based on the K-to-3 sample)
2.4
Without Identified Disabilities
Developmental Delay
Speech / Language Disability
Cognitive Disability
Other Disability
3.4
2.9
2.9
2.7
Third GradeACCESS Composite
Proficiency Level(based on the K-to-3 sample)
3.7
KindergartenACCESS Composite

Chapter 2 | Identifying ELs Who Would Benefit from Additional Support30
FIGURE 12
Listening and Reading Were the Domains Where ELs with Identified Disabilities Struggled the Most Compared to their Peers Without Identified Disabilities
ACCESS domains proficiency levels in third grade, by disability status (based on the K-to-3 sample)
Note: These graphs show adjusted di�erences in the proficiency level measured in the di�erent domains tested in ACCESS. These adjusted average proficiency levels can be read as the averages for di�erent groups of ELs who were alike in all student characteristics and school factors included in our models and only di�ered in whether they had an identified disability and the type of identified disability. These di�erences were statistically significant between all groups of students with disabilities and students without identified disabilities, after adjusting for student characteristics and school factors (see Appendix A for a complete list).
Without Identified Disabilities
Developmental Delay
Speech / Language Disability
Cognitive Disability
Other Disability
4.5
3.7
3.8
3.0
Listen
Proficiency Level
4.8
6.05.04.03.02.01.0 5.54.53.52.51.5
Without Identified Disabilities
Developmental Delay
Speech / Language Disability
Cognitive Disability
Other Disability
2.8
2.5
2.5
2.3
Speak
Proficiency Level
2.9
6.05.04.03.02.01.0 5.54.53.52.51.5
Proficiency Level
Without Identified Disabilities
Developmental Delay
Speech / Language Disability
Cognitive Disability
Other Disability
3.5
3.0
3.0
3.0
Read
4.0
6.05.04.03.02.01.0 5.54.53.52.51.5
Without Identified Disabilities
Developmental Delay
Speech / Language Disability
Cognitive Disability
Other Disability
3.4
3.0
2.9
2.9
Write
Proficiency Level
3.6
6.05.04.03.02.01.0 5.54.53.52.51.5
31UCHICAGO Consortium Research Report | English Learners in Chicago Public Schools
CHAPTER 3
Interpretative SummaryIn this report we have focused on ELs, students tasked with mastering grade-level content while also learning English. Many ELs go on to have successful academic outcomes, but some start to have difficulties early in school. The environments and supports that young ELs are exposed to during pre-k and the early grades play an important role in the opportunities these students have, ultimately influencing their academic success. It is in the early grades when adults can intervene and take the responsibility for changing the odds for these students.
We show that factors such as enrolling in a CPS pre-k,
participating in Bilingual Education Services, and
attending a highly rated school were positively associ-
ated with better academic outcomes for ELs in terms
of attendance, English development, grades, and test
scores. Additionally, we found that having low scores
on the screener assessments taken at the time of enroll-
ment and certain identified disabilities were associated
with ELs having a harder time in school. These students
would benefit from additional help to not only advance in
their acquisition of academic English, but also to master
the content of their classes and improve their learning.
Our findings provide valuable information to help
practitioners and policymakers strategize ways to
create the conditions to better support EL students
and help them succeed in the early grades and beyond.
Our work also has insights that could help parents and
families make decisions about their children’s educa-
tion. And while parents and families must make deci-
sions for their children, the responsibility for making
changes that would support all ELs belongs with adults
and institutions in Chicago.
Considerations for Policymakers In order to ensure the future success of ELs attend-
ing the public schools they serve, policymakers at the
local, state, and national level must set a course to
provide these students with the support that they need.
Our results have important implications for policies
that educational leaders may want to consider around
public pre-k, Dual Language Programs, and supporting
schools where ELs are not thriving.
Policymakers may want to include ELs in priority
groups for access to pre-k programs. Our report
suggests that participation in publicly provided pre-k
programs, particularly in full-day and early programs,
is beneficial to ELs’ academic success both in the short-
and medium-term. As public pre-k programs, including
full-day and early opportunities, expand, policymakers
may want to prioritize ELs for participation, whether by
creating programs in neighborhoods and communities
where ELs are likely to live or by granting ELs priori-
tized access to programs where seats are scarce. Our
analyses have identified subgroups of ELs, including
ELs with low levels of incoming English skills and ELs
with identified disabilities, who seem to need additional
support in school—policymakers might consider priori-
tizing these subgroups for pre-k access. However, as ELs
have increased access to pre-k services that will benefit
their future academic success, it is important that pre-k
programs are able to hire and retain bilingual teachers
who can provide adequate language support. As such,
policymakers may need to develop strategies around
training and retaining a bilingual workforce qualified
to teach ELs in early childhood settings.

Chapter 3 | Interpretive Summary 32
In order to evaluate Dual Language Programs that
aim to develop bilingual citizens, policymakers may
need to provide tools to assess the development of
both languages and the necessary time to fully under-
stand their benefits. Our findings also have implica-
tions for policymakers’ consideration of Dual Language
Programs, particularly as they evaluate these programs.
We found that ELs attending Dual Language programs
had somewhat lower results in terms of English profi-
ciency and reading standardized test scores by the end
of the third grade. However, our study may not have
been well-positioned to capture the true long-term
effects of Dual Language Programs, as other research
cited in Chapter 1 finds that ELs in Dual Language
Programs have equal or stronger English skills than
their EL peers by middle school. Dual Language
Programs strengthen ELs’ skills in their home language
and may also be beneficial for their cultural identity
development. This suggests that policymakers seeking
to evaluate Dual Language Programs should consider as
many years of data as possible. Furthermore, another
reason our study may not have been well positioned to
capture the full impacts of Dual Language Programs
is that none of the outcomes we examined in the third
grade were measured in students’ home language.
Development of ELs’ home language proficiency is a
major goal of Dual Language Programs, and policy-
makers seeking to discern the complete effects of
such programs may need to provide their schools
with adequate tools that will allow them to assess
and monitor students’ language development.
Policymakers might consider providing some schools
with additional resources to support them and to
ensure the success of ELs these schools serve. Our
findings demonstrate that some schools, particularly
schools with lower school quality ratings and schools
with large percentages of ELs with low English profi-
ciency level measured by screener tests may need
additional support to help ELs achieve academic
success. Policymakers might consider providing
these schools with additional resources to ensure the
success of their ELs recognizing that these schools
might need very different supports.
Considerations for PractitionersAs the population of ELs grows in Chicago and across
the nation, more and more practitioners will be
involved in making schools engaging places where
ELs can learn and thrive. Our findings can be used
by practitioners to provide helpful information for
parents and families making decisions regarding
Bilingual Education Services offered in school. Like-
wise, our results provide relevant data that practitio-
ners can use to identify students early who may benefit
from additional supports and targeted assistance.
Once families enroll their EL in a school, practitioners
can help them understand that Bilingual Education
Services are beneficial for their students’ learning.
While some families might believe that refusing ser-
vices will help their children develop English skills
faster, our findings show that is true only in the short-
run. Eventually, without the scaffolding that Bilingual
Education Services provide, students start falling
behind, not only in English skills but in mastering
grade-level content. In addition, students who refused
services did not come to school as often as those who
did not. This is worrisome as attendance is related to
academic success and it could indicate a problem with
school engagement. Being excited to come to school
might be harder for students when it is difficult to
follow and participate in their classes. Practitioners
should ensure that parents who are choosing whether to
refuse Bilingual Education Services are aware of these
potential consequences.
Practitioners can rely on data from screener tests to
support ELs early on. Early warning indicators have
become very popular in the last few years because
they can help practitioners to identify students for
targeted resources and interventions, and their use
has improved student outcomes. Practitioners involved
with ELs do not need to wait a few years to identify
which ELs struggle in their academic performance
because they have an available tool in the early days to
help them identify students for targeted assistance. Our
findings indicate that data from screener tests admin-
istered to determine the level of students’ English skills
can be used to identify students for further support.

33UCHICAGO Consortium Research Report | English Learners in Chicago Public Schools
ELs who start school in the early stages of English devel-
opment are the ones who struggle with their academic
performance. Practitioners could use interventions in
both English and the home language that focus on im-
proving reading and listening as these are two areas in
which these students were farther behind compared to
other ELs. In addition, ELs who are in the early stages of
developing English skills have similar or higher school
attendance compared to other ELs. This is encouraging,
since attendance is essential for student learning and
growth, and also means that these ELs are likely to be
present at normal rates for any targeted instructional
strategies practitioners may want to implement.
Practitioners may need to pay particular attention to
ELs who are also identified for special education ser-
vices. We found that when entering CPS, students with
identified disabilities were also more likely to score
in the lower English proficiency level of the screeners.
This will allow targeting these students early on for
support as noted in the previous point about relying
on data from screener tests. In addition, we found that
families of students with identified disabilities were
more likely to refuse Bilingual Education Services,
which was related to lower school performance in the
future. Practitioners could help families understand
that their children are entitled to both special educa-
tion and Bilingual Education Services. Practitioners
and departments that support ELs and students with
identified disabilities should work together to ensure
that students can smoothly receive both types of ser-
vices. However, perhaps the biggest task when it comes
to ELs with identified disabilities is the issue of atten-
dance. We found that their attendance was lower than
other ELs. Understanding why students are not coming
to school and providing the support needed to remedy
this should be a top priority for practitioners working
with ELs with disabilities. When students are not in
school, they cannot receive services of any kind.
Considerations for Parents and Families of ELsParents and guardians of ELs must make important
decisions regarding their child’s education and select
options that will adequately support them in achieving
their full potential. Our findings can be useful for
families, although families need for policymakers,
practitioners, and institutions to take responsibility to
increase access to pre-k, especially full-day pre-k, and
strengthen the schools that serve their children.
Families may want to prioritize early enrollment in CPS
pre-k and enrollment in full-day programs when pos-
sible. When it comes to their children’s early education,
parents have many options, including school-based
pre-k programs. Our findings show that attending pub-
lic school-based pre-k was related to better outcomes
for ELs, both in kindergarten and the third grade, five
years after students attended CPS pre-k. In particular,
we found that more exposure to CPS pre-k, such as
enrolling earlier than four-years-old and participating
in full-day programs, was associated with ELs’ kinder-
garten readiness in terms of English development and
early reading skills. Amid the ongoing efforts to expand
full-day pre-k access across the city, these findings are
especially relevant for ELs’ families making decisions
about where to enroll their children and prioritizing
early-enrollment and full-day programs when possible.
Before deciding about whether their children should
receive Bilingual Education Services, parents and
guardians should be aware of the long-term ben-
efits of participating in such services. Families have
the right to refuse Bilingual Education Services. Our
results suggest that some of the benefits of Bilingual
Education Services are not immediately apparent but
show up later in a students’ education. For instance,
although ELs whose parents or guardians refused
services had stronger English proficiency scores in kin-
dergarten, by the end of the third grade, they were less
likely to demonstrate English proficiency on ACCESS
and had lower GPA and math and reading NWEA
outcomes. Similarly, in the short term, the ELs in our
sample who were enrolled in Dual Language Programs
did not show positive results on outcomes measured in
English when compared to their peers. However, prior
research has found that despite obtaining lower scores
in the early grades, ELs in dual language settings score
higher than other ELs by middle school. Importantly,
Chapter 3 | Interpretive Summary 34
for students learning English as a second language, it
takes between five to seven years to develop the academic
language skills often measured on standardized tests.
Families looking to enroll their children in CPS could
consider the rating of a school as a valuable metric in
addition to other school characteristics. Ultimately,
parents look at different characteristics when choos-
ing schools and programs for their children. One useful
and publicly available metric for parents and families
is a school’s accountability rating. While not a flawless
measure of school quality, CPS accountability ratings
include indicators of the school’s academic success
and contributions to student learning as well as other
measures that reflect the composition of the student
body. Our study found that ELs enrolled in higher-rated
schools had better outcomes on standardized tests than
those who attended lower-rated schools. These findings
suggest that a school accountability rating is a good in-
dicator for EL academic success on some outcomes that
may matter to parents and families as they consider
school choices.
Supporting ELs is a matter of urgency given the grow-
ing number of ELs in the U.S. Many ELs go on to be very
strong students, but some need more support in order
to have a successful experience in school. As parents,
teachers, and policymakers make decisions on how to
best support ELs, we have identified a few priority areas
that require particular attention. Our findings were
based on students from pre-k to third grade, an impor-
tant time to set students on a positive path in school.
With the right supports early on, ELs can participate
and thrive in school and beyond, contributing their tal-
ents and skills in their communities and society at large.

UCHICAGO Consortium Research Report | English Learners in Chicago Public Schools 35
References
Ansari, A., Manfra, L., Hartman, S., López, M., Bleiker, C., Dinehart, L., & Winsler, A. (2017)Differential third-grade outcomes associated with attend-ing publicly funded preschool programs for low-income Latino children. Child Development, 88(5), 1743-1756.
Barnett, W.S., Yarosz, D., Thomas, J., Jung, K., & Blanco, D. (2007)Two-way and monolingual English immersion in preschool education: An experimental comparison. Early Childhood Research Quarterly, 22(3), 277-293.
Belsha, K. (2017, June 28)English learners often go without required help at Chicago schools. Chicago Reporter. Retrieved from https://www.chicagoreporter.com/english-learners-often-go-without-required-help-at-chicago-schools/
Camilli, G., Vargas, S., Ryan, S., & Barnett, W.S. (2010)Meta-analysis of the effects of early education interven-tions on cognitive and social development. The Teachers College Record, 112(3), 579-620.
Casesa, R. (2019)Latinx students’ perceptions of bicultural identity in English-only and two-way immersion elementary programs. Schools: Studies in Education, 16(1), 84-108.
Chicago Public Schools. (n.d.)School data. Retrieved from https://cps.edu/SchoolData/Pages/SchoolData.aspx
Chicago Early Learning. (2019)Chicago’s roadmap for implementing universal Pre-K: A plan for investment in Chicago’s Early Learning System. Chicago, IL: Chicago Early Learning; Chicago Public Schools Family & Support Services.
Collier, V.P., & Thomas, W.P. (2004)The astounding effectiveness of dual language education for all. NABE Journal of Research and Practice, 2(1), 1-20.
Collier, V.P., & Thomas, W.P. (2009)Educating English learners for a transformed world. Albuquerque, NM: Dual Language Education of New Mexico/Fuente Press.
Garrett, R., Davis, E., & Eisner, R. (2019)Student and school characteristics associated with academic performance and English language proficiency among English learner students in grades 3-8 in the Cleveland Metropolitan School District (REL 2019-003). Washington, DC: U.S. Department of Education, Institute of Education Sciences, National Center for Education Evaluation and Regional Assistance, Regional Educational Laboratory Midwest. Retrieved from https://ies.ed.gov/ncee/edlabs
Hussar, B., Zhang, J., Hein, S., Wang, K., Roberts, A., Cui, J., Smith, M., Bullock Mann, F., Barmer, A., & Dilig, R. (2020)The condition of education 2020 (NCES 2020-144). U.S. Department of Education. Washington, DC: National Center for Education Statistics. Retrieved from https://nces.ed.gov/pubsearch/pubsinfo.asp?pubid=2020144
Illinois Admin. Code tit. 23, § 228.10. (2017)Transitional bilingual education. Retrieved from https://www.isbe.net/Documents/228ARK.pdf
Ladd, H.F. (2017)Do some groups of children benefit more than others from pre-kindergarten programs?. In D.A. Phillips (Ed.). The current state of scientific knowledge on pre-kindergarten effects (pp. 31-36). Washington, DC: Brookings Institution.
Magnuson, K., Lahaie, C., & Waldfogel, J. (2006).Preschool and school readiness of children of immigrants. Southwestern Social Science Association, 87(5), 1241-1262.
Parker, C.E., O’Dwyer, L.M., & Irwin, C.W. (2014)The correlates of academic performance for English language learner students in a New England district (REL 2014–020). Washington, DC: U.S. Department of Education, Institute of Education Sciences, National Center for Education Evaluation and Regional Assistance, Regional Educational Laboratory Northeast & Islands. Retrieved from http://ies.ed.gov/ncee/edlabs
Phillips, D., Lipsey, M., Dodge, K., Haskins, R., Bassok, D., Burchinal, M., Duncan, G., Dynarski, M., Magnuson, K., & Weiland, C. (2017)The current state of scientific knowledge on Pre-Kindergarten effects. Washington, DC: Brookings Institution.
Reyes, S.A., & Vallone, T.L. (2007)Toward an expanded understanding of tow-way bilingual immersion education: Constructing identity through a critical, additive bilingual/bicultural pedagogy.Multicultural Perspectives, 9(3), 3-11.
de la Torre, M., Blanchard, A., Allensworth, E.M., & Freire, S. (2019)English Learners in CPS: A new perspective. Chicago, IL: University of Chicago Consortium on School Research.
Umansky, I., & Reardon, S. (2014)Reclassification patterns among Latino English learner students in bilingual, dual immersion, and English immersion classrooms. American Educational Research Journal, 51(5), 879-912.

References 36
Walker Burke, C. (2020, January 27)Can Chicago design a better school ratings system? Principals, parents, and teachers think so. Chalkbeat Chicago. Retrieved from https://chicago.chalkbeat.org/2020/1/27/21121085/can-chicago-design-a-better-school-ratings-system-principals-parents-and-teachers-think-so
Yoshikawa, H., Weiland, C., Brooks-Gunn, J., Burchinal, M.R., Espinosa, L.M., Gormley, W. T., Ludwig, J., Magnuson, K.A., Phillips, D., & Zaslow, M.J. (2013)Investing in our future: The evidence base on preschool education. New York, NY: Foundation for Child Development.

UCHICAGO Consortium Research Report | English Learners in Chicago Public Schools 37
Appendix AData and Methods
Data Data for the analysis comes from CPS administrative
records, including information on demographics,
school enrollment, grades, test scores and personnel
information, and public data. All these data sources
are linked together using a unique student identifier
and school identifiers.
TABLE A.1.
Description of Variables and Data Sources
Variables Descriptions
Student Characteristics Demographic variables such as gender, date of birth, race/ethnicity, identified disability (having an IEP), free or reduced-price lunch eligibility (FRPL), socioeconomic status at the census block level, temporary living situation status (homelessness), EL status, and home language.
English Language Screener Tests
Analyses included students’ incoming English skills in terms of the proficiency level attained in the screener test they take when first enrolling in CPS. Students with a home language other than English—based on parents answers to the Home Language Survey—must be assessed through an English language screener within the first 30 days of the students’ enrollment.
• Preschool students (aged 3, 4, and 5) are screened using the Pre-IPT Oral EnglishLanguage Proficiency Test. The test is administered individually, ideally by a bilingualeducator, and is scored in five proficiency levels (A to E). Four-year-old students whoscore below E are eligible for Bilingual Education Services and identified as ELs.
• Students are only screened once during pre-k but every student whose Home LanguageSurvey indicated they spoke a language other than English at home must be re-screenedupon kindergarten entry using WIDA Model for Kindergarten (Model K) Test. The MODELK is an individually administered, adaptive assessment. Kindergarten students only takethe oral portion (speaking and listening domains) of the test. Test scores are divided intosix proficiency levels and students who score below level 5 are eligible to receive BilingualEducation Services.
Bilingual Programs CPS Office of Language and Culture (OLCE) provided administrative records regarding ELs whose parents or guardians refused Bilingual Education Services and schools’ bilingual programs.
• We were able to identify schools who were offering Dual Language services and thegrade-levels in which those Bilingual Education Services were available. In CPS all DualLanguage programs in CPS are offered in Spanish-English. We generated a student-level indicator equal to 1 if the student was enrolled in a school offering a Dual Languageprogram in their grade-level, did not refuse Bilingual Education Services and their homelanguage was Spanish
• Additionally, CPS conducts audits to schools providing Bilingual Education Servicesto assess their compliance with State mandates. Schools were assessed using a rubricbased on different criteria (i.e., compliance with State mandates, consistency of servicesprovided) and rated in one of four levels: Minimal, Partial, Established, and Exemplary.
During 2016 to 2018, not all schools participated in the audits. We created a binary indicator equal to one if schools were not rated during those years. For schools rated in at least one year, we created an indicator equal to one if the school was ever rated as minimal (the lowest level).

Appendix A 38
Variables Descriptions
Test Scores Students’ performance in standardized assessments that measured their early reading skills in kindergarten, their English proficiency level in K-3 grade, and their skills in math and reading in third grade.
• Student performance on the Text Reading Comprehension Test (TRC) administeredin the fall of kindergarten. The TRC assessment is an early literacy formative assessmentfor grades K-2 that measures a range of skills including reading fluency, accuracy andcomprehension. Tests are administered three times a year (fall, winter, and spring). Thekindergarten fall test assesses early print concepts and reading behaviors in pre-readers,as well as students’ instructional reading level using a series of leveled books. Theirperformance on the test will then be classified in one of four proficiency levels: WellBelow Proficient, Below Proficient, Proficient, or Above Proficient. We created a binaryindicator equal to one if students performed at or above proficient. TRC is also availablein Spanish to assess Spanish literacy development for ELs whose primary language ofinstruction is Spanish. When available, we used students’ Spanish test data and includedin the models a binary indicator equal to one if the language ofthe test administered was Spanish.
• Student performance on the ACCESS for ELLs Test (ACCESS). The test measuresstudents’ academic English proficiency in four domains: reading, writing, speaking, andlistening. ELs take the ACCESS K-12, until they score above the state-determined cut-off and are considered English proficient. Students’ ACCESS scores reflect their Englishproficiency levels ranging from Level 1 (Entering) to Level 6 (Reaching).
• Student performance on the NWEA-MAP Test (NWEA) in math and reading in thespring testing window. Students’ scaled scores are transformed into percentile ranksto describe how well they are performing relative to other students in a nationwidenormative sample. Generally, students take the NWEA tests in English. However, in ourK-to-3 sample, 3.27 percent of third-grade ELs who took the math portion of the NWEAtook the test in Spanish.
Grades Students’ third-grade grades (GPA) in reading and math. Students’ GPA is the average of final grades earned in these on a 4-point scale where an A=4. Reading GPA was computed based on the final grades earned in the Chicago Reading Framework.
Attendance Percent of days attended is the proportion of the number of days attended (present in school) out of the number of days enrolled. Students who were enrolled for fewer days than a school quarter (45 days) were excluded from the sample.
School Ratings The CPS School Quality Rating Policy (SQRP) is the district’s policy for measuring annual school performance. The SQRP uses a five-tiered performance system based on a broad range of indicators of success, including students’ test score performance and academic growth, attendance, school culture and climate, among other measures at the school-level. A schools’ quality rating is based on the weighted points it receives in each of the indicators measured. For example, a rating of Level 1+ or 1 indicates a good standing status, while a Level 3 Rating indicates schools in need of intensive support. For more information on SQRP see https://www.cps.edu/about/district-data/metrics/sqrp/
5Essentials Every year, the UChicago Consortium administers the 5Essentials Survey (formerly known as My Voice, My School) to CPS principals, teachers, and students in middle school and high school. Surveys ask about learning climate, student-teacher relationships, leadership, and quality of the school’s instructional program. to learn their views on and experiences in our public schools. Some of the measures included in the survey were conceptualized into the 5Essentials framework, which identified five key elements that influenced a school’s effectiveness and students’ learning: Effective Leaders, Collaborative Teachers, Involved Families, Supportive Environment, and Ambitious Instruction (for more information on the 5Essentials framework and specific measures see https://uchicagoimpact.org/our-offerings/5essentials).
As a way of measuring a school’s climate, our analysis included 5Essentials measures captured as school-level precision-weighted means that aggregated individual Rasch survey measures. We only included those 5Essentials measures that rely on principal’s and teachers’ reports (Effective Leaders, Collaborative Teachers, Involved Families), since many of the elementary schools included in our sample did not enroll students in grades 6-12, and we did not have enough data on the Supportive Environment and Ambitious Instruction measures which rely on students’ self-report.

UCHICAGO Consortium Research Report | English Learners in Chicago Public Schools 39
Variables Descriptions
Personnel Data Data on teachers is based on 20th day employment files and accomplishment files from the Talent Office at CPS. The accomplishment files provide information on teachers’ bilingual and English as a Second Language (ESL) endorsements. Based on this information and the number of ELs at the school we computed the ratio of ELs per bilingual endorsed teacher and the ratio of ELs per ESL endorsed teacher. For pre-k, these ratios were based on the number of ELs and endorsed teachers at the pre-k level only. For kindergarten (K-to-3 sample) ratios reflect the number of ELs in the whole school divided by the number of endorsed teachers at the school. For the analysis, these ratios were divided into terciles.
Preschool Variables In addition to data on student’s enrollment in a CPS pre-k, the Early Childhood Education Office at CPS provided capacity files with information regarding full-day program participation in CPS pre-k. These files indicated whether a classroom was a full-day class, a half-day class, or third shift (which we considered as half-day). Files were matched to a students’ homeroom class as of the fall of the school year. The full-day variable used in the analysis is a binary indicator equal to 1 if the student was attending a full-day classroom, and 0 otherwise.
School Characteristics Schools in our samples were characterized based on whether it was a charter school, the grade-levels available to students, the general student-body composition, and EL-specific student-body composition.
• Charter school: Binary indicator equal to 1 if the school was charter.
• Grade-level structure: Schools in our sample offered different grade-level structures totheir students. While some schools only offered pre-k through fifth grade or pre-k to K,most schools extended to sixth grade and beyond. We included indicators for these threecombinations in our analyses.
• School composition: We included variables based on the demographic characteristicsof the student body served at the school. For the pre-k-to-K sample, these variablesconsidered pre-k students only and for the K-to-3 sample these variables consideredkindergarten students only. These variables included the percent of students who werefree or reduced-price lunch eligible, the percent of students with an IEP, and the racial/ethnicity composition of the school. Racial/ethnic composition variables were mutuallyexclusive and indicated whether the school’s student body was at least 85 percent Black,at least 85 percent Latinx, at least 85 percent Black/Latinx combined or over 15 percentWhite/Asian.
• EL student-body composition: Included the percent of the student body identified asELs at the school, and a binary variable indicating if four or more non-English languageswere represented at the school among ELs. In accordance to the way CPS determines thenumber of ELs for Bilingual Education Services purposes, the pre-k-K sample variablesincluded ELs at the pre-k level only, and the K-to-3 sample variables considered ELs in thewhole school. Additionally, we included the English proficiency level of pre-k and K ELsbased on their performance on the screener tests. For the pre-k-to-K sample, we includedthe percent of ELs scoring at lowest screener level (Beginning) in the Pre-IPT test. For theK-to-3 sample, we computed the average score in the Model K screener at the school leveland divided it into terciles.

Appendix A 40
Methods To explore the relationship between ELs’ outcomes and
student and school factors in the early grades, we con-
ducted a series of two-level hierarchical linear models
(HLM) where students were nested within schools.
ELs in the pre-k-to-K sample were nested in their pre-k
site, while ELs in the K-to-3 sample were nested in their
kindergarten school. This statistical technique allows
for simultaneously investigating the relationships of
student and school factors with outcomes, making it
more efficient at accounting for variation between
students and among schools.
Level one in the models is the student level, where
we have one observation per student. Level two models
schools (with one observation of each school in each year).
The models for all outcomes were specified as follows:
Level-1 Model (students):
Outcome ij = π0j + ∑k=1 πkj *(Student Controlsij ) + eij
Level-2 Model (schools):
π0j = β00 + ∑m=1 β0m *(School Controlsj ) + r0j
πkj = βk0 , for all k
where eij is an error term normally distributed with a
mean of zero and variance σ2 and r0j is a random effect
associated with schools. It is assumed to have a mean of
zero and variance τ00. Student and school character-
istics that were accounted for in our HLM models are
presented in Table A.2.
K
M
TABLE A.2
Variables Used in Pre-k-to-K Sample and K-to-3 Sample Analyses and Outcomes Analyzed
Student–Level Covariates School–Level Covariates Outcomes
Pre-k-to-K Cohort, gender, home language, homeless, FRPL, SES, identified disability, age at pre-k, refused Bilingual Education Services in pre-k, attended CPS pre-k when 3 years-old, attended pre-k at same site as 3 and 4 years-old, full-day pre-k, enrolled in school with fewer than 20 same-language ELs, enrolled in a Dual Language program.
• School composition
• School ratings and 5Essentials
• EL student-body composition
• Ratio of ELs per certifiedESL/Bilingual teachers
• EL program audits
• Other school characteristics(charter, grade-level structure).
• Attendance in pre-k
• Model K screener oralproficiency at K entry
• TRC (Text ReadingComprehension) proficiencyduring fall semester (smallersample of students).
K-to-3 Cohort, gender, home language, homeless, FRPL, SES, identified disability, age at K, refused Bilingual Education Services in K, attended CPS pre-k, attended same pre-k and K school, attended same K and third school, enrolled in school with fewer than 20 same-language ELs, enrolled in a Dual Language program.
• School composition
• School ratings and 5Essentials
• EL student-body composition
• Ratio of ELs per certifiedESL/Bilingual teachers
• EL program audits
• Other school characteristics(charter, grade-level structure).
Kindergarten:• Attendance• ACCESS (composite & domains)
Third Grade:• Attendance
• English proficient by 3rd
• ACCESS – if not proficient –(composite & domains)
• NWEA (Read & Math)
• GPA (Read & Math)

UCHICAGO Consortium Research Report | English Learners in Chicago Public Schools 41
Appendix BSample Characteristics
Pre-k-to-K SampleWe identified students in the pre-k-to-K sample as ELs
based on a state flag that indicated whether students
were active ELs by the 20th day of enrollment. Given
that some students may have enrolled later in the year
or may have taken the Pre-IPT English proficiency
screener test past the 20th day, our EL group also
includes 655 students who were not flagged as active
ELs but took the test and didn’t meet the exit criteria.
Namely, students who obtained a letter score of A-C, or
a D if they haven’t enrolled in preschool as three-year-
olds. The Pre-IPT screener test establishes different
exit criteria depending on students’ age. From our data,
we cannot tell the exact date when students were tested.
For this reason, if a student was enrolled in preschool as
a three-year-old and took the Pre-IPT test we assume
that the students’ exit criteria was applied to determine
the eligibility for Bilingual Education Services.
In the pre-k-to-K sample, not every student took the
Text Reading Comprehension Test (TRC) at the begin-
ning of their kindergarten year. Only 56 percent of ELs
took the TRC in either English or Spanish (41 percent of
TRC takers took the test in Spanish). Compared to ELs
who did not take the TRC at the beginning of kindergar-
ten, tested ELs were more likely to be eligible for free or
reduced-price lunch (93 percent) and less likely to have
an IEP (14 percent).
K-to-3 SampleWe identified students in the K-to-3 sample as ELs
based on whether they took the ACCESS test of English
proficiency, regardless of the scores they obtained. The
large majority of ELs in the K-to-3 sample (97 percent)
took the ACCESS test for the first time in kindergarten.
Students who took ACCESS when in first, second, or
third grade were also included as part of the sample.
Because ACCESS is required by the state for all ELs,
identifying ELs based on who took the test allows us
to follow both ELs who received services and those
who did not. ELs in grades 1-12 who have significant
cognitive disabilities can take the alternate ACCESS,
a modified version of the exam. In our sample, only six
students took the alternate ACCESS in kindergarten
and 247 students (1.5 percent of the sample) took it in
third grade. Since we did not have proficiency scores
for students taking the alternate version of the test,
these students were excluded from the analyses where
ACCESS proficiency levels were set as outcomes.
ELs in CPS take the ACCESS test each year to
examine their English proficiency. If they score above
the state-determined threshold they are no longer
classified as ELs. In our K-to-3 sample, 9 percent of ELs
demonstrated proficiency in the ACCESS test before
third grade. These students no longer took the ACCESS
test in third grade, thus were not included in the analy-
ses on ACCESS proficiency scores in third grade.
The box Sample and Methods Used in This Study on
p.8-9 in the introduction describes the two samples that
were included in this study. The following tables pres-
ent the demographic characteristics of these samples
broken down by the different subgroups that were ana-
lyzed throughout the report in each specific section.

42 Appendix B
Chapter 1: Engagement with a CPS Pre-K
TABLE B.1
Demographic Characteristics by CPS Pre-K Enrollment
Pre-k-to-K Sample K-to-3 Sample
Half-Day Full-Day CPS pre-k Before Age 4
CPS pre-k Only at Age 4
No CPS pre-k
CPS pre-k
Number 2,701 11,357 7,656 6,402 7,388 9,263
Male* 50.2% 53.5% 52.8% 52.9% 51.6% 52.4%
Spanish Speaker 90.0% 83.5% 83.7% 86.0% 80.9% 88.4%
Eligible for FRPL 94.4% 91.7% 92.1% 92.3% 90.3% 94.8%
Having an IEP** 13.6% 17.2% 21.6% 10.5% 6.8% 16.1%
Refused Bilingual Education Services
0.7% 0.5% 0.9% 0.2% 3.0% 3.5%
Screener pre-IPT Beginner
55.5% 53.0% 64.4% 40.3% — —
Screener Model K Entering
— — — — 53.2% 55.9%
* Historically, CPS has collected data that groups students into one of two gender categories: male and female. Not all students identify with one of these categories, and we hope in the future to be able to report data that more fully describes the identities of CPS students.
** We refer to students with an Individualized Education Plan (IEP) as students with an identified disability throughout the report. In CPS, they are also referred to as diverse learners. An IEP is created after a child has been evaluated and found eligible to receive special education and related services.
Chapter 1: Participation in Bilingual Education Services
TABLE B.2
Demographic Characteristics by Bilingual Education Services
K-to-3 Sample
Refused Bilingual Education Services
Received Bilingual Education Services
Enrolled in Dual Language Program
Did not enroll in Dual Language Program
Number 547 16,104 1,162 15,489
Male* 59.8% 51.8% 50.2% 52.2%
Spanish Speaker 94.7% 84.7% 100.0% 84.0%
Eligible for FRPL 88.5% 93.0% 92.0% 92.9%
Having an IEP** 22.3% 11.6% 9.0% 12.2%
Full-Day Pre-K 1.8% 0.8% 0.3% 0.8%
Attended CPS Pre-K 58.9% 55.5% 55.0% 55.7%
Screener Model K Entering
40.2% 55.2% 53.4% 54.8%
* Historically, CPS has collected data that groups students into one of two gender categories: male and female. Not all students identify with one of these categories, and we hope in the future to be able to report data that more fully describes the identities of CPS students.
** We refer to students with an Individualized Education Plan (IEP) as students with an identified disability throughout the report. In CPS, they are also referred to as diverse learners. An IEP is created after a child has been evaluated and found eligible to receive special education and related services.

UCHICAGO Consortium Research Report | English Learners in Chicago Public Schools 43
Chapter 1: Enrollment in a Highly Rated School
TABLE B.3
Sample Demographics for English Learners by School’s Quality Ratings (SQRP)
Pre-k-to-K Sample K-to-3 Sample
Level 1+ Level 1 Level 2+ Level 2 Level 3 Level 1+ Level 1 Level 2+ Level 2 Level 3
Number 4,860 10,171 2,276 3,132 3 5,381 10,990 3,503 5,130 13
Male* 52.6% 52.3% 53.8% 53.5% 66.7% 51.7% 51.7% 52.9% 52.6% 84.6%
Spanish Speaker 75.0% 82.8% 90.5% 90.6% 33.3% 71.0% 80.4% 93.9% 94.9% 84.6%
Eligible for FRPL 89.2% 91.5% 96.2% 96.2% 100.0% 88.4% 91.5% 96.1% 96.6% 100.0%
Having an IEP** 15.3% 15.1% 14.6% 16.2% 0.0% 11.2% 11.2% 12.4% 12.5% 61.5%
Full-Day Pre-K 14.3% 16.0% 30.8% 31.1% 66.7% — — — — —
Attended CPS Pre-K
— — — — — 52.6% 54.2% 57.4% 58.7% 76.9%
Refused Bilingual Education Services
0.4% 0.5% 0.5% 0.4% 0.0% 2.2% 2.8% 4.1% 4.0% 0.0%
Screener pre-IPT Beginner
50.8% 52.3% 56.8% 56.3% 33.3% — — — — —
Screener Model KEntering
— — — — — 46.4% 51.0% 58.5% 60.7% 53.8%
* Historically, CPS has collected data that groups students into one of two gender categories: male and female. Not all students identify with one of these categories, and we hope in the future to be able to report data that more fully describes the identities of CPS students.
** We refer to students with an Individualized Education Plan (IEP) as students with an identified disability throughout the report. In CPS, they are also referred to as diverse learners. An IEP is created after a child has been evaluated and found eligible to receive special education and related services.
Chapter 2: English Language Skills Measured at Time of School Enrollment
TABLE B.4
Sample Demographics for ELs by Screener Test Level
Pre-k-to-K Sample K-to-3 Sample
Beginner Early Intermediate
Intermediate Early Advanced
Entering Emerging Developing Expanding
Number 7,514 4,255 1,213 1,072 9,105 2,607 2,729 1,965
Male* 54.8% 50.4% 52.3% 49.6% 52.8% 52.4% 50.9% 49.6%
Spanish Speaker
86.7% 83.0% 82.6% 80.7% 88.1% 81.9% 81.3% 81.2%
Eligible for FRPL
94.8% 91.0% 88.0% 83.8% 95.2% 91.6% 90.4% 87.5%
Having an IEP**
23.6% 10.4% 5.7% 3.6% 15.3% 10.1% 7.6% 4.4%
Full-Day Pre-K
19.9% 19.2% 19.3% 14.2% — — — —
Attended CPS Pre-K
— — — — 56.9% 53.9% 55.4% 52.8%
Refused Bilingual Education Services
0.5% 0.9% 0.6% 0.1% 2.4% 3.0% 5.1% 5.6%
* Historically, CPS has collected data that groups students into one of two gender categories: male and female. Not all students identify with one of these categories, and we hope in the future to be able to report data that more fully describes the identities of CPS students.
** We refer to students with an Individualized Education Plan (IEP) as students with an identified disability throughout the report. In CPS, they are also referred to as diverse learners. An IEP is created after a child has been evaluated and found eligible to receive special education and related services.
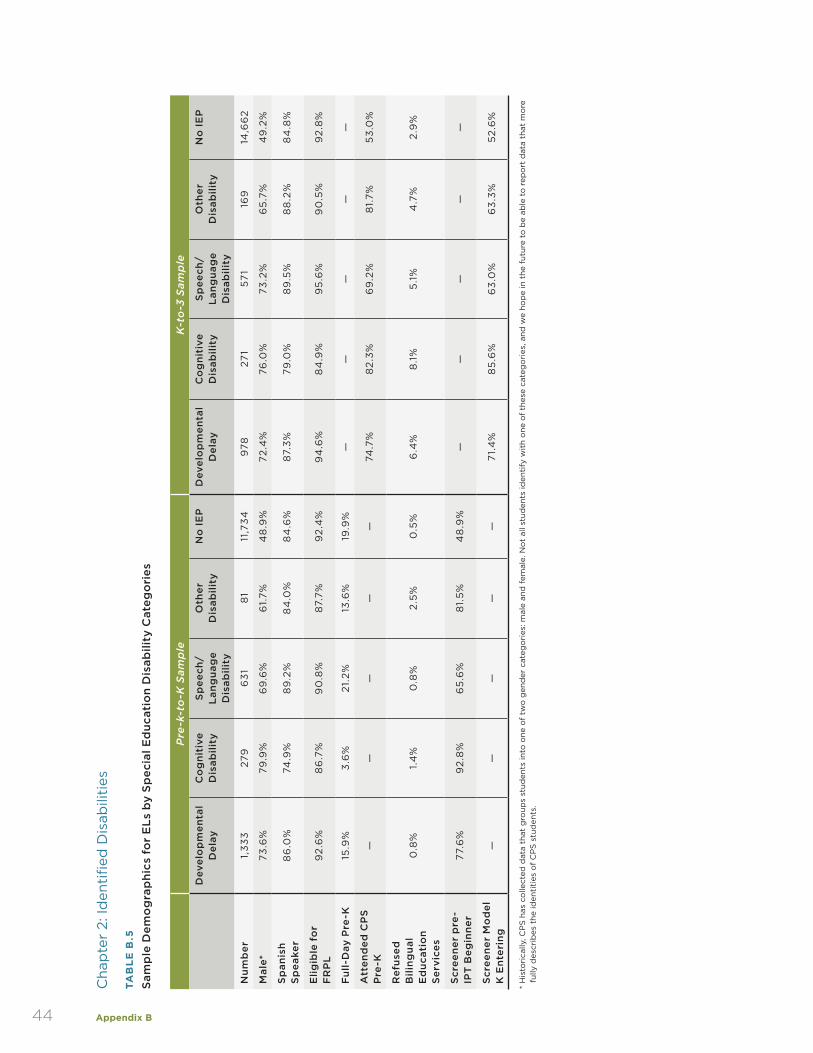
44 Appendix B
Cha
pte
r 2:
Iden
tifi
ed D
isab
iliti
es
TAB
LE
B.5
Sam
ple
Dem
og
rap
hics
fo
r E
Ls
by
Sp
ecia
l Ed
ucat
ion
Dis
abili
ty C
ateg
ori
es
Pre
-k-t
o-K
Sam
ple
K-t
o-3
Sam
ple
Dev
elo
pm
enta
l D
elay
Co
gn
itiv
e D
isab
ility
Sp
eech
/ L
ang
uag
e D
isab
ility
Oth
er
Dis
abili
tyN
o I
EP
Dev
elo
pm
enta
l D
elay
Co
gn
itiv
e D
isab
ility
Sp
eech
/ L
ang
uag
e D
isab
ility
Oth
er
Dis
abili
tyN
o I
EP
Nu
mb
er1,
33
327
96
31
81
11,7
34
978
271
57
116
914
,66
2
Mal
e*7
3.6
%79
.9%
69
.6%
61.
7%
48
.9%
72
.4%
76.0
%7
3.2
%6
5.7
%4
9.2
%
Sp
anis
h S
pea
ker
86
.0%
74.9
%8
9.2
%8
4.0
%8
4.6
%8
7.3
%79
.0%
89
.5%
88
.2%
84
.8%
Elig
ible
fo
r F
RP
L9
2.6
%8
6.7
%9
0.8
%8
7.7
%9
2.4
%9
4.6
%8
4.9
%9
5.6
%9
0.5
%9
2.8
%
Fu
ll-D
ay P
re-K
15.9
%3
.6%
21.
2%
13.6
%19
.9%
——
——
—
Att
end
ed C
PS
Pre
-K—
——
——
74.7
%8
2.3
%6
9.2
%8
1.7
%5
3.0
%
Ref
use
d
Bili
ng
ual
E
du
cati
on
Ser
vice
s
0.8
%1.
4%
0.8
%2
.5%
0.5
%6
.4%
8.1
%5
.1%
4.7
%2
.9%
Scr
een
er p
re-
IPT
Beg
inn
er7
7.6
%9
2.8
%6
5.6
%8
1.5
%4
8.9
%—
——
——
Scr
een
er M
od
el
K E
nte
rin
g—
——
——
71.
4%
85
.6%
63
.0%
63
.3%
52
.6%
* H
isto
rica
lly, C
PS
has
co
llect
ed d
ata
that
gro
ups
stud
ents
into
one
of
two
gen
der
cat
ego
ries
: mal
e an
d f
emal
e. N
ot
all s
tud
ents
iden
tify
wit
h o
ne o
f th
ese
cate
go
ries
, and
we
hop
e in
the
fut
ure
to b
e ab
le t
o r
epo
rt d
ata
that
mo
re
fully
des
crib
es t
he id
enti
ties
of
CP
S s
tud
ents
.
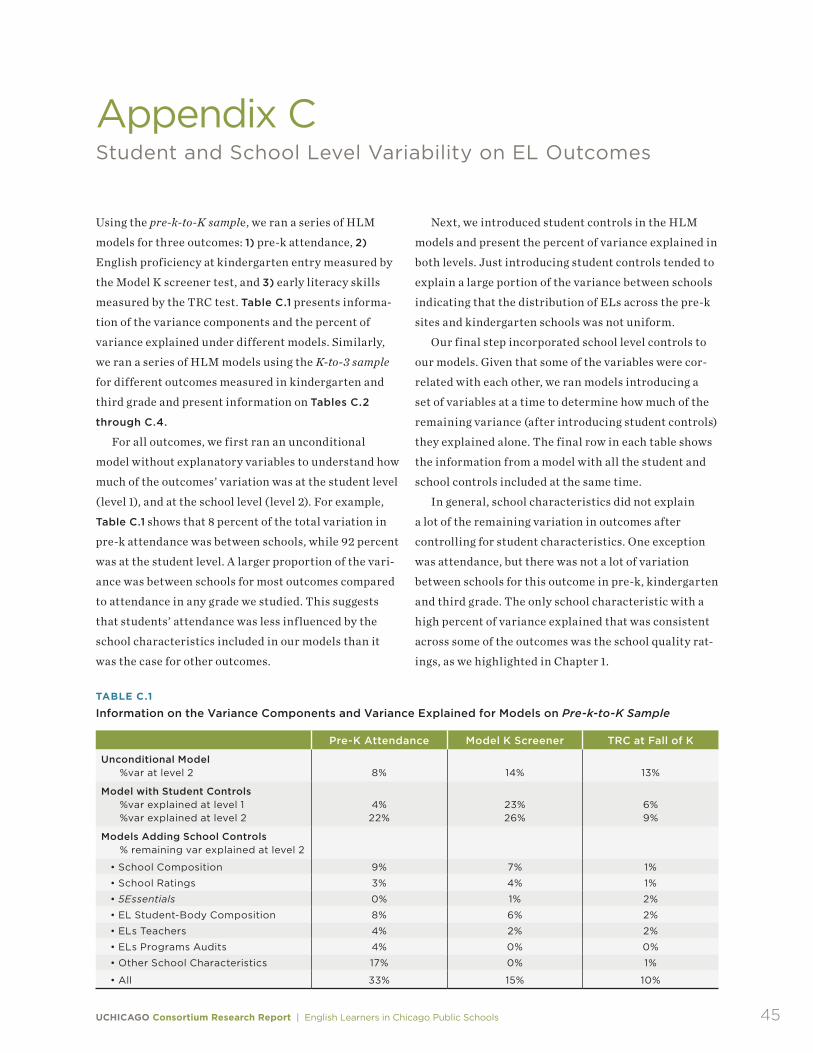
UCHICAGO Consortium Research Report | English Learners in Chicago Public Schools 45
Appendix CStudent and School Level Variability on EL Outcomes
Using the pre-k-to-K sample, we ran a series of HLM
models for three outcomes: 1) pre-k attendance, 2)
English proficiency at kindergarten entry measured by
the Model K screener test, and 3) early literacy skills
measured by the TRC test. Table C.1 presents informa-
tion of the variance components and the percent of
variance explained under different models. Similarly,
we ran a series of HLM models using the K-to-3 sample
for different outcomes measured in kindergarten and
third grade and present information on Tables C.2
through C.4.
For all outcomes, we first ran an unconditional
model without explanatory variables to understand how
much of the outcomes’ variation was at the student level
(level 1), and at the school level (level 2). For example,
Table C.1 shows that 8 percent of the total variation in
pre-k attendance was between schools, while 92 percent
was at the student level. A larger proportion of the vari-
ance was between schools for most outcomes compared
to attendance in any grade we studied. This suggests
that students’ attendance was less influenced by the
school characteristics included in our models than it
was the case for other outcomes.
Next, we introduced student controls in the HLM
models and present the percent of variance explained in
both levels. Just introducing student controls tended to
explain a large portion of the variance between schools
indicating that the distribution of ELs across the pre-k
sites and kindergarten schools was not uniform.
Our final step incorporated school level controls to
our models. Given that some of the variables were cor-
related with each other, we ran models introducing a
set of variables at a time to determine how much of the
remaining variance (after introducing student controls)
they explained alone. The final row in each table shows
the information from a model with all the student and
school controls included at the same time.
In general, school characteristics did not explain
a lot of the remaining variation in outcomes after
controlling for student characteristics. One exception
was attendance, but there was not a lot of variation
between schools for this outcome in pre-k, kindergarten
and third grade. The only school characteristic with a
high percent of variance explained that was consistent
across some of the outcomes was the school quality rat-
ings, as we highlighted in Chapter 1.
TABLE C.1
Information on the Variance Components and Variance Explained for Models on Pre-k-to-K Sample
Pre-K Attendance Model K Screener TRC at Fall of K
Unconditional Model %var at level 2 8% 14% 13%
Model with Student Controls %var explained at level 1 %var explained at level 2
4% 22%
23% 26%
6% 9%
Models Adding School Controls % remaining var explained at level 2
• School Composition 9% 7% 1%
• School Ratings 3% 4% 1%
• 5Essentials 0% 1% 2%
• EL Student-Body Composition 8% 6% 2%
• ELs Teachers 4% 2% 2%
• ELs Programs Audits 4% 0% 0%
• Other School Characteristics 17% 0% 1%
• All 33% 15% 10%

46 Appendix C
TABLE C.2
Information on the Variance Components and Variance Explained for Kindergarten Outcomes—K-to-3 Sample
Attendance ACCESS Composite
ACCESS Speaking
ACCESS Listening
ACCESS Reading
ACCESS Writing
Unconditional Model %var at level 2 9% 28% 21% 16% 21% 30%
Model with Student Controls %var explained at level 1 %var explained at level 2
4% 32%
22% 42%
27% 32%
26% 37%
11% 41%
15% 33%
Models Adding School Controls % remaining var explained at level 2
• School Composition 20% 4% 3% 4% 3% 4%
• School Ratings 5% 3% 1% 1% 3% 5%
• 5Essentials 0% 3% 0% 1% 3% 5%
• EL Student-Body Composition 8% 6% 2% 5% 5% 4%
• ELs Teachers 16% 13% 10% 9% 12% 10%
• ELs Programs Audits 7% 4% 1% 0% 5% 3%
• Other School Characteristics 11% 10% 8% 7% 10% 7%
• All 39% 22% 17% 19% 21% 19%
TABLE C.3
Information on the Variance Components and Variance Explained for Third-Grade Outcomes—K-to-3 Sample
Attendance Reading GPA Math GPA Reading NWEA
Math NWEA
Unconditional Model 8% 8% 9% 13% 16%
Model With Student Controls %var explained at level 1 %var explained at level 2
3% 60%
6% 21%
4% 21%
13% 47%
10% 43%
Models Adding School Controls % remaining var explained at level 2
• School Composition 25% 3% 1% 3% 3%
• School Ratings -4% 1% 1% 13% 19%
• 5Essentials 0% 4% 3% 2% 4%
• EL Student-Body Composition 1% 7% 7% 1% 1%
• ELs Teachers 7% 3% 4% 2% 3%
• ELs Programs Audits 2% 0% 1% 0% 0%
• Other School Characteristics -2% 0% 0% 0% 0%
• All 33% 18% 18% 18% 23%

UCHICAGO Consortium Research Report | English Learners in Chicago Public Schools 47
TABLE C.4
Information on the Variance Components and Variance Explained for Third-Grade ACCESS Outcomes—K-to-3 Sample
Proficient by Third
ACCESS Composite
ACCESS Speaking
ACCESS Listening
ACCESS Reading
ACCESS Writing
Unconditional Model 11% 9% 10% 4% 6% 10%
Model With Student Controls %var explained at level 1 %var explained at level 2
7% 60%
15% 40%
6% 26%
10% 47%
10% 37%
13% 31%
Models Adding School Controls % remaining var explained at level 2
• School Composition 4% 1% 1% 4% 0% 1%
• School Ratings 6% 15% 6% 8% 14% 16%
• 5Essentials 10% 1% 1% 4% 1% 1%
• EL Student-Body Composition 7% 3% 3% 2% 5% 2%
• ELs Teachers 6% 7% 6% 17% 4% 5%
• ELs Programs Audits 0% 0% 0% 10% 0% 1%
• Other School Characteristics 0% 2% 0% 16% 0% 2%
• All 25% 29% 16% 40% 27% 23%
48
MARISA DE LA TORRE is a Senior Research Associate and Managing Director at the UChicago Consortium. Her re-search interests include urban school reform, school choice, early indicators of school success, and English Learners. Before joining the UChicago Consortium, Marisa worked for the Chicago Public Schools in the Office of Research, Evaluation, and Accountability. She received a master’s degree in economics from Northwestern University.
SILVANA FREIRE is a Research Analyst at the UChicago Consortium. In this role, she conducts quantitative research to learn more about the experiences of CPS students and to identify relevant factors that play a key role in students’ academic success and equitable learning opportunities. Before joining the UChicago Consortium, Silvana worked as a Research Assistant at the Graduate School of Education at Stanford University, while she was getting her MA degree in international education policy analysis.
ABOUT THE AUTHORS
This report reflects the interpretation of the authors. Although the UChicago Consortium’s Steering Committee provided technical advice, no formal endorsement by these individuals, organizations, or the full Consortium should be assumed.
ALYSSA BLANCHARD is a Research Analyst at the UChicago Consortium. Her current research focuses on the academic experiences of English Learners and on the principal pipeline in Chicago. Prior to joining the UChicago Consortium, she worked at the Tennessee Education Research Alliance. She received an MPP in educational policy and a BA in public policy from Vanderbilt University.

Steering Committee PAIGE PONDERCo-Chair One Million Degrees
REBECCA VONDERLACK-NAVARROCo-Chair Latino Policy Forum
Institutional Members
SARAH DICKSONChicago Public Schools
BRENDA DIXONIllinois State Board of Education
BOGDANA CHKOUMBOVAChicago Public Schools
TROY LARAVIEREChicago Principals and Administrators Association
JESSE SHARKEY Chicago Teachers Union
MAURICE SWINNEY Chicago Public Schools
Individual Members
NANCY CHAVEZOneGoal
JAHMAL COLEMy Block, My Hood, My City
ACASIA WILSON FEINBERGThe Cleveland Avenue Foundation for Education
VERNEE GREENMikva Challenge
MEGAN HOUGARDChicago Public Schools
GREG JONESThe Academy Group
PRANAV KOTHARIRevolution Impact, LLC
AMANDA LEWISUniversity of Illinois at Chicago
RITO MARTINEZRito Martinez Consulting LLC
SHAZIA MILLERNORC at the University of Chicago
KAFI MORAGNE-PATTERSON UChicago Office of Civic Engagement
CRISTINA PACIONE-ZAYASErikson Institute
LES PLEWAWilliam H. Taft High School
BEATRIZ PONCE DE LEÒN Illinois Department of Human Services
CRISTINA SALGADOCity Bureau
ELLEN SCHUMERCOFI
PAM WITMERGolden Apple Foundation
JOHN ZEIGLER DePaul University

50
OUR MISSION With the goal of supporting stronger and more equitable educational
outcomes for students, the UChicago Consortium conducts research of high technical
quality that informs and assesses policy and practice in the Chicago Public Schools.
We seek to expand communication among researchers, policymakers, practitioners,
families, and communities as we support the search for solutions to the challenge of
transforming schools. We encourage the use of research in policy action and practice
but do not advocate for particular policies or programs. Rather, we help to build capacity
for systemic school improvement by identifying what matters most for student success,
creating critical indicators to chart progress, and conducting theory-driven evaluation
to identify how programs and policies are working.
1313 East 60th Street Chicago, Illinois 60637
T 773.702.3364 F 773.702.2010
@UChiConsortiumconsortium.uchicago.edu