research program for an environmentally-friendly coal
TRANSCRIPT

Survey Report NEDO-C-9929
RESEARCH PROGRAM FOR
AN ENVIRONMENTALLY-FRIENDLY COAL UTILIZATION SYSTEM
IN THE PHILIPPINES
March 2000
NEW ENERGY & INDUSTRIAL TECHNOLOGY DEVELOPMENT ORGANIZATION
CENTER FOR COAL UTILIZATION, JAPAN
020005 7-5

RESEARCH PROGRAM FOR
AN ENVIRONMENTALLY FRIENDLY COAL UTILIZATION SYSTEM
IN THE PHILIPPINES
March 2000
NEW ENERGY & INDUSTRIAL TECHNOLOGY DEVELOPMENT ORGANIZATION
CENTER FOR COAL UTILIZATION, JAPAN

Preface
This paper describes the results of “Research Program For Environmentally-Friendly Coal Utilization System (Research Program For Environmentally-Friendly Coal Utilization System in the Philippines)” which was implemented by Center for Coal Utilization, Japan (CCUJ) in fiscal 1998-1999 under a contract with the New Energy and Industrial Technology Development Organization (NEDO).
Coal has secured the position of important primary energy in the world owing to the vast amount of reserves and to the superior economy. On the other hand, coal raises anxiety of increasing environmental load caused by SOx, NOx, CO2, and ash generated by the coal use. Thus, for the production countries and also for the user countries, it has become an important issue to establish an efficient coal utilization system compatible with environment (an envi- ronmentally-friendly coal utilization system) covering from the production to the final consumption of coal.
Japan is the country of coal import at the largest volume of coal in the world. Accordingly, Japan is strongly requested to play an important role of stabilizing the supply and demand of coal, and to contribute to the world in terms of development, introduction, and transfer of clean coal technology.
Southeast Asia is expected to continue the economy growth. Consequently, the area will increase the energy consumption, particularly increasing in the coal use. Among Asian countries, the Philippines has been developing energy alternative to oil as a national policy emphasizing the development of coal resources and the widening the coal uses, though the Philippines has not large coal production capacity.
With the background described above, an object of the survey is, under a cooperation of Japan and the Philippines, to survey and investigate the possibility of introduction of environmentally friendly coal utilization system and to formulate a plan of introduction of the system.
The survey implemented in fiscal 1998-1999 focuses on grasping the present situation of the coal utilization technologies in electric power industry, cement industry, and household fuel sector in the Philippines, and investigates the feasibility of introduction of environmentally friendly coal utilization system which should be necessary in the future, and makes a proposal of the subject.
The survey team would express their appreciation to Energy Utilization Management Bureau, especially Database Development Project Team, Department of Energy in the Philippines, the Coal Industry Division of Coal and New Energy Department, Agency of Natural Resources and Energy and NEDO in Japan, for their instructions and cooperation.
I wish to express my sincere gratitude for their assistance and cooperation.
March, 2000 Eiichi Yugeta, President
Center for Coal Utilization, Japan

CONTENTS
Preface
I Outline1. Items of Survey..................................................................................................................................12. Objective.............................................................................................................................................. 13. Contents of Survey...........................................................................................................................14. Outline of Survey Results............................................................................................................... 2
4.1 Outline of Survey Results in Fiscal 1998-1999............................................................... 24.1.1. Outline of Economy / Energy Situation in the Philippines.................................24.1.2. Outline of Coal Supply / Demand in the Philippines............................................34.1.3. Present Situation of Coal Utilization Technology in the Philippines................34.1.4. Outline of Environmental Conservation in the Philippines.................................34.1.5. Studies of Environmentally-Friendly Coal Utilization Technologies
Applicable to Electric Power Industry...................................................................... 44.1.6. Studies of Environmentally-Friendly Coal Utilization Technologies
Applicable to Cement Industry...................................................................................44.1.7. Studies of Environmentally-Friendly Coal Utilization Technologies
Applicable to Household Fuel Sector........................................................................55. Survey Items and Sites Conducted Surveys...........................................................................5
5.1 Survey Items............................................................................................................................ 55.2 Sites Conducted Survey........................................................................................................ 5
6. Members of the Survey................................................................................ 67. Committee........................................................................................................................................... 7
II Contents of SurveyChapter 1 Present Situation of Economy / Energy in the Philippines.......9
1.1 Present Status and Future Forecast of Economy...........................................................91.1.1 Outline of Economy in 1998.........................................................................................91.1.2 Outline of Economy in 1999.........................................................................................91.1.3 Future Forecast of Economy....................................................................................... 11
1.2 Present Status and Future Forecast of Energy Supply / Demand.......................... 121.2.1 Present Status of Primary Energy Supply / Demand....................................... 121.2.2 Future Forecast of Energy Supply / Demand........................................................131.2.3 Future Forecast of Energy Demand............................................................. 17
1.3 Current and Future Problems of Economy and Energy Supply / Demand...........231.4 Environmental Impact............................................................................................................24
Chapter 2 Environmental Policy and Situation in the Philippines............... 252.1 Trends in the Environmental Regulation.........................................................................25
2.1.1 Enforcement of Laws and Regulations Relating toEnvironmental Conservation...................................................................................... 25
i
2.1.2 Mitigation of Global Climate Change....................................................................... 252.1.3 Energy Resources Development in Protected Areas and
Ancestral Domains.........................................................................................................262.1.4 Prevention and Minimization of Incidence of Oil Spill....................................... 262.1.5 Recognition and Integration of the Philippine Agenda 21
in Energy Management...............................................................................................262.1.6 Philippine Water Act......................................................................................................27
2.2 Philippine Clean Air Act..........................................................................................................282.2.1 Status of Clean Air Act................................................................................................ 282.2.2 Cost and Effect Relating to Clean Air Act...............................................................282.2.3 Ban on Incineration................................. 29
2.3 Regulation on Emission in Industries.................................................................................302.3.1 Regulation on Emission in Electric Power Industry.............................................302.3.2 Current Situation of Pollution Preventive Facilities at Existing Power
Generation Plants..........................................................................................................312.3.3 Regulation on Emission in Cement Industry........................................................34
Chapter 3 Situation of Coal Utilization by Industries .........................373.1 Situation of Coal Utilization in Electric Power Industry................................................. 37
3.1.1 Present and Future Outlook of Electric Power Industry.................................... 373.1.2 Electricity Generation........ ................. ....403.1.3 System Reserve................................................... 423.1.4 Status of Electrification.............................................................................................. 423.1.5 Electricity Rates..................................................... 443.1.6 Electricity Outlook..................................................................... 443.1.7 Mine-Mouth Power Plants...................... 503.1.8 Present Situation of Coal Utilization in Electric Power Plants......................... 52
3.2 Situation of Coal Utilization in Cement Industry................. 553.2.1 Present and Future Situation on the Use of Cement Kilns........... .............553.2.2 Present Status of Coal Utilization in Cement Plants............................ 613.2.3 Effective Use of Low-Rank Coals in Cement Kilns..............................................653.2.4 Plans by Cement Plants to Utilize Coal Ash........................ 683.2.5 APO Cement Corporation............................................................................................703.2.6 Grand Cement Manufacturing Corporation.................................. 743.2.7 Northern Cement Corporation.................................................................................. 783.2.8 Solid Cement Corporation.......................................................................................... 823.2.9 Summary of Cement Companies in the Philippines........................................... 85
Chapter 4 Studies to Introduce Environmentally-FriendlyCoal Utilization System by Industries.................................................. 87
4.1 Study to Introduce Coal Utilization System in Electric Power Industry.................. 874.1.1 Present Situation of Coal Utilization System in the Philippines.....................874.1.2 Study to Introduce Coal Combustion Technology............................................... 88
ii
4.1.3 Study to Introduce Flue Gas Treatment Technology...........................................944.2 Study to Introduce CFB Boiler System in Cement Industry................................... 101
4.2.1 Features of CFB Boiler................................................................................................1014.2.2 Principle of Combustion in CFB Boiler.................................................................. 1024.2.3 . Simple and Compact Facility................................................................................... 1044.2.4 Introduction of CFB Boiler to Cement Plant............................. .......................1054.2.5 Feasibility Study on the Introduction of CFB Boiler in Power Plant.............106
4.3 Study to Introduce New Cement Kiln Technology in Cement Industry..............1094.3.1 Problems on Cement Kiln and Study on Improvement Measures.............. 1104.3.2 Outline of Fluidized Bed Advanced Cement Kiln System............................... 1104.3.3 Elemental Technologies for FAKS...........................................................................1124.3.4 Features of FAKS......................................................................................................... 1134.3.5 Test Results and Scale Up on FAKS...................................................................... 1144.3.6 Expected Effect of the Application of FAKS........................................................ 1154.3.7 Problems on Other Coal Firing Technologies and Study on Improvement
Measures.............................................................................. 1174.4 Study to Introduce Coal Ash Utilization Technology.....................................................120
4.4.1 Super Pulverized Coal Combustion Technology................................................1204.4.2 Combustion Diagnosis Equipment............................................................ 1244.4.3 Technologies for Effective Coal Ash Utilization in Cement Industry..........1264.4.4 Problems on Coal Ash and Study on Improvement Measures ....................127
4.5 Study to Introduce Coal Utilization Technology in Household Fuel Sector.......1334.5.1 Study to Introduce Coal Briquetting Technology................................................133
Chapter 5 Study to Introduce Environmentally-Friendly CoalUtilization System for Effective Use of Domestic Coals.........135
5.1 Study for the Introduction of Coal Water Mixture Production Technology........ 135
III Summary
1. Introduction of Environmentally-Friendly Coal Utilization Systems forElectric Power Industry...............................................................................................................141
2. Introduction of Environmentally-Friendly Coal Utilization Systems forCement Industry............................................................................................................................142
3. Introduction of Environmentally-Friendly Coal Utilization Systems forHousehold Fuel Sector................................................................................................................ 143
Conclusion

I Outline
Outline
1. Items of SurveyResearch Program for an Environmentally-Friendly Coal Utilization System (Research
Program for Environmentally-Friendly Coal Utilization System in the Philippines)
2. ObjectiveWhile worldwide demand for coal is expected to increase in the future, on establishment
of efficient and environmentally-friendly coal utilization system is essential to promote coal utilization in harmony with the global environment.
The survey targets the Republic of the Philippines which intends the widening of coal uses as a part of oil-substitute energy. The survey aims to grasp the present state of coal production and development, the present state of coal imported and domestic distribution, the present state of coal utilization, and the environmental issues relating to coal, further to analyze the present state of coal utilization and of propagation of coal uses in electric power industry, cement industry and household fuel sector, thus to formulate a master plan relating to the introduction of coal utilization system compatible with environment.
3. Contents of SurveyThe survey was implemented by the Center for Coal Utilization, Japan under a contract
with the New Energy and Industrial Technology Development Organization (NEDO) settled.The bodies in charge of the survey are the Center for Coal Utilization, Japan and the Da
tabase Development Project Team, Department of Energy of the Philippines, performing joint work.
The survey covered the overview of the present state of energy and economy, the present and future forecast of coal supply and demand, coal uses, and environmental problem in the Philippines, then focused on the electric power industry, the cement industry, and the household fuel sector in terms of present state of coal utilization and issues relating to coal use. In addition, the survey conducted review of issues relating to the formulation of master plan, and carried out an investigation on the environmentally-friendly coal utilization system to be applied.
A part of the survey was conducted by the Database Development Project Team of the Department of Energy in the Philippines, which Team is an organization in charge of the survey at the Philippine side. The detail of the report of the final fiscal year is in the following.
(1) Present state of economy and energy in the Philippines(2) Environmental state in the Philippines, and national environmental policy(3) Present state of coal utilization in individual industries(4) Study on introduction of environmentally-friendly coal utilization system relating to en
vironmental measures in individual industries(5) Study on introduction of environmentally-friendly coal utilization system relating to ef
fective use of domestic coal
1

This investigation lasted for two years beginning in 1998. Details of planning and implementation were as follows:
Basic Schedule of the Joint Survey
Item FY 1998 FY 1999
Status of coal utilization in individual industrial sectorsStudy on introduction of the environmentally-friendly coal utilization systemFeasibility study on the environmentally-friendly coal utilization system
Survey Organization
On the Republic ofOn the Japan Side the Philippines Side
Entrusted Organized
CooperationDatabase Development
Project Team, DOEThe Center for
Coal Utilization, Japan
The New Energy and Industrial Technology Development
Organization
Department of Energy, Republic of the Philippines
(CCUJ entrust DDPT with a portion of the survey)
4. Outline of Survey Results4=1 Outline of Survey Results in Fiscal 1998-19994.1.1 Outline of Economy / Energy Situation in the Philippines
The Philippines showed a low level of economic growth rate of -0.5% over the whole year of 1998, though the level is not so bad as in other ASEAN countries struggling in the after-effect of the unprecedented currency crisis. In 1999, the Philippines has enjoyed the increased harvest of farm products such as rice owing to the plenty of rain by La Nina. With the help of that favorable agricultural production, and with the contribution of increased export of electronics parts and of clothing items, the business of the Philippines has recovered.
Expecting the recovery of business and enjoying the tax incentives in the Philippines, investment from overseas significantly increased. As a result, the whole year Gross Domestic Product (GDP) of the Philippines in 1999 has turned to positive score, +3.3%. Nevertheless, the price of fuels such as gasoline was increased for three times resulted from the increase in the crude oil import price, which has become a cause of lowering the approval rate to the President Estrada.
Based on the experience of energy crisis in the ’70s, the Philippines has been conducting an energy plan aiming at the development of domestic energy resources and the reduction of
2

dependency on oil import.In the current state, however, although the share of domestic energy in the total energy
consumption has leveled off, the quantity of importing oil and coal has increased responding to the demand growth of energy. Thus, the Philippines is still depending on the import energy.
4.1.2. Outline of Coal Supply / Demand in the PhilippinesThe coal demand in 1998 was 5.71 million tons, accounting for 20.8% increase from the
preceding year. As of the demand, the domestic coal is 1.23 million tons, resulting in 78.4% share of the import coal. After the start up of the Masinloc coal fired power plant, the power generation sector has occupied the coal demand.
DOE formulated the Coal Development Plan (CDP) to promote the exploitation, the investment, and the development at individual mine-mouths. During the period of from 2007 to 2009, DOE plans to install five mine-mouth power plants.
Although the expected annual domestic coal demand during the period of from 1999 to 2004 is around 1.85 million tons, the count is expected to increase to 3.6 million tons in 2006, and to 5.1 million tons in 2008.
4.1.3. Present Situation of Coal Utilization Technology in the PhilippinesThe domestic coal in the Philippines does not increase its consumption compared with the
import coal because of the poor quality (high sulfur content, high water content, low calorific value) and of cost. Since the start of operation of coal fired power plants rapidly increases the coal consumption, the share of import coal should show a rapid increase and the kinds of grades of coal would increase.
The regulations against SOx emissions have become stricter than ever, and the technologies to responding to the movement are also wanted. To enhance the use of domestic coal, it should be emphasized to improve the low quality of domestic coal for its utilization.
The cement industry has not yet fully utilize the coal and the coal ash, and the Philippines should emphasize on the energy saving measures to strengthen the cost competitiveness, the strengthening of environmental measures such as dust prevention, and the effective use of fly ash discharged from power plants.
In the Philippines, household and small to medium scale firms such as tobacco curing firms currently use large quantity of wood base fuels such as charcoal and firewood, and the wood base fuels account for about 86% (in 1995) of total civil consumption energy. As an alternative fuel, the activities of development and distribution of coal briquettes have been increasing in the Philippines, and, as a part, the manufacturing and sales of the coal briquettes have already entered to practical level. Although the currently used coal for briquettes is only semi-anthracite, the consumption is still at a low level and there is a necessity of improvement to prevent emissions of smoke and malodor during the initial stage of combustion.
4.1.4. Outline of Environmental Conservation in the PhilippinesIn June 1999, the Philippines approved the Clean Air Act (CAA) which is the law to es
tablish overall and comprehensive air pollution preventive policy aiming at the assurance of public health and welfare. The law specifies the policy to ease, prevent, and control the air pollution from both the fixed emission sources (industries) and the mobile emission sources
3

(vehicles).According to the Law, CAA orders the power plants to install pollution preventive facili
ties that satisfy the current regulations. The power plants that fail to satisfy the current regulations have already under a schedule of scrapping.
4.1.5. Studies of Environmentally-Friendly Coal Utilization Technologies Applicable to Electric Power Industry
The properties of coal give significant influence on the combustion characteristics, and the emission characteristics of NOx, SOx, unburnt matter in ash differ with coal grades. Accordingly, the introducing environmentally-friendly coal utilization technologies relating to the environmental policy in the power industry should respond to wide range of coal grades. In addition, the regulations on SOx emissions have become stricter than ever, and the technologies to respond to the regulations are also waited. On the basis of above-described situations, the environmentally-friendly coal utilization technologies for the power sector were investigated from the standpoint of combustion technology, flue gas treatment technology, and coal effective utilization technology. Regarding the combustion technology, the two stage combustion which has already been in practical application, and the in furnace denitrification process and new type low NOx burner, which are further developed versions from the existing low NOx burner, are effective. As for the flue gas treatment technology, the simplified wet lime stone - gypsum process is an expectedly introducing technology. For the coal ash effective utilization technology, the introduction of ultrafine pulverized coal technology and of combustion diagnosis technology provides high quality ash.
For enhancing the use of domestic coal, it should be emphasized to improve the low rank domestic coals. An expectedly effective means to respond to the request is the power business applying the modification of low rank coal and the coal water mixture (CWM) process.
4.1.6. Studies of Environmentally-Friendly Coal Utilization Technologies Applicable to Cement Industry
Being helped by the economic growth began from the early in the ’90s, the cement industry of the Philippines enjoyed bid demand of cement. Thus, they stopped wet and lepol type cement kilns which are in poor calcination efficiency, and they have modified and newly installed large scale and high calcination efficiency kilns. As a result, the improvement of energy efficiency as the total cement industry has been progressed.
Nevertheless, even with the kilns which have recently been modified or which have been installed or added are not necessarily the ones that fully pursued the improvement in energy consumption efficiency, and they should further be improved.
Furthermore, the introduction of circulating fluidized bed boiler (CFB boiler) to cement plants allows the effective use of CFB boiler combustion ash as a raw material of cement, and provides a feature of low pollution combustion of various types of fuels compared with conventional pulverized coal fired boilers. Thus, the CFB boiler is a boiler that satisfies the current requirements of environmental issue and of energy saving.
As described above, for the cement firms to conduct improvement of energy consumption efficiency, project for shifting to coal, and dust-preventive measures for environmental conservation are important and essential issues.
4
4.1.7. Studies of Environmentally-Friendly Coal Utilization Technologies Applicable Household Fuel Sector
Rural districts (farm sector) in the Philippines consume large quantity of wood base fuels such as firewood and charcoal as the main energy source of civil and small scale industries. In recent years, flood disasters often occurred at many places caused from deforestation. To this point, the government enforced regulations such as the Ordinance to Forbid Illegal Deforestation. Under the situation, a tobacco farmland district at northern part of Luzon promotes the project to shift to coal briquettes as the substitute for firewood. Although the scale is still small, the project is positively promoted centering on the local government and the national tobacco administration bureau.
The Philippines National Oil Corporation (PNOC) operates a commercial plant of briquettes for civil use. The Coal Association at Cebu strongly requests for the development and popularization of civil use coal briquettes for activating the Cebu coal mine which is in declining their coal production rate and also for protecting the forests. As seen in these activities, centering on the local area, the development and popularization of coal briquettes have shown progress. At present, however, there are many problems in both the technology and the quality. Aiming at further improvement and popularization of the technology, the feasibility of introduction of new systems is investigated, and the coal briquettes having superiority in both quality and environmental viewpoint and the manufacturing technology are proposed.
5. Survey Items and Sites Conducted Survey5.1 Survey Items
(1) Present state of economy and energy in the Philippines(2) Environmental state in the Philippines, and national environmental policy(3) Present state of coal utilization in individual industries(4) Study on introduction of environmentally-friendly coal utilization system relating to en
vironmental measures in individual industries
5.2 Sites Conducted SurveyBodies in charge of the survey(In Japan) Center for Coal Utilization, Japan (CCUJ)(Overseas) Department of Energy (DOE), the Republic of the Philippines
Database Development Project Team
5
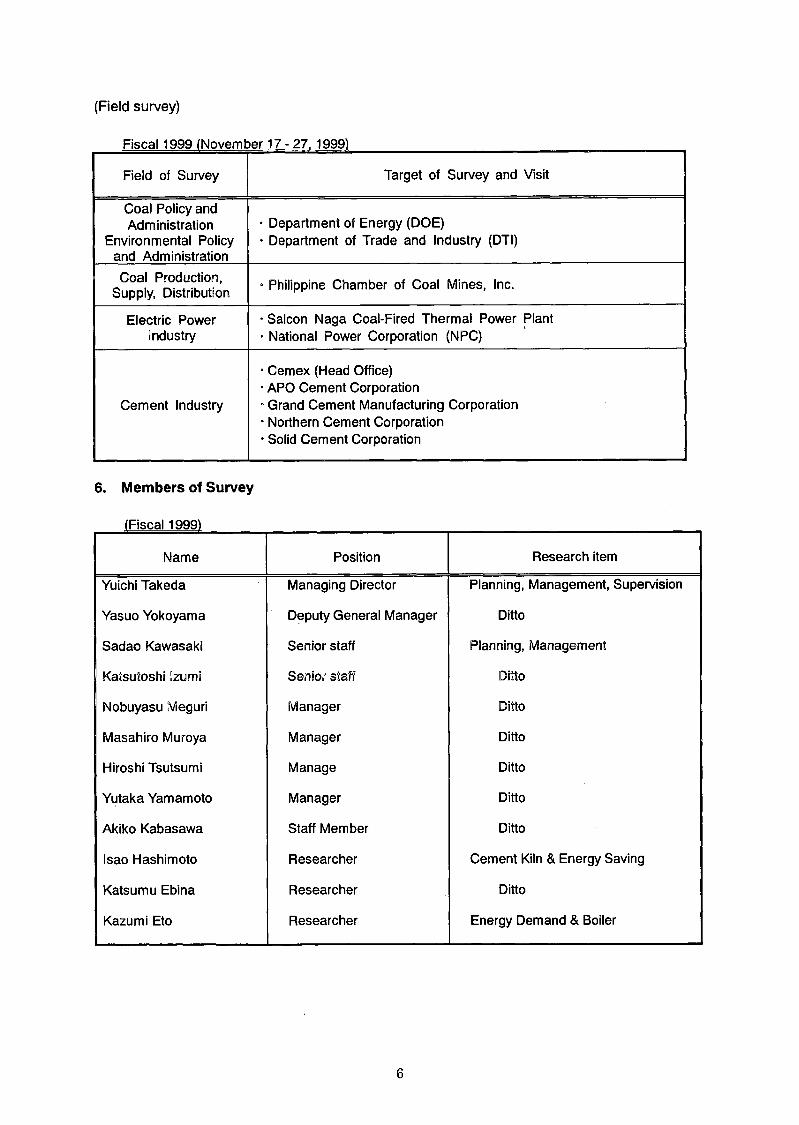
(Field survey)
Fiscal 1999 (November 17-27. 1999)
Field of Survey Target of Survey and Visit
Coal Policy and Administration
Environmental Policy and Administration
• Department of Energy (DOE)• Department of Trade and Industry (DTI)
Coal Production, Supply, Distribution ° Philippine Chamber of Coal Mines, Inc.
Electric Power Industry
• Salcon Naga Coal-Fired Thermal Power Plant• National Power Corporation (NPC)
Cement Industry
• Cemex (Head Office)• APO Cement Corporation• Grand Cement Manufacturing Corporation• Northern Cement Corporation• Solid Cement Corporation
6. Members of Survey
(Fiscal 1999)_______
Name Position Research item
Yuichi Takeda Managing Director Planning, Management, Supervision
Yasuo Yokoyama Deputy General Manager Ditto
Sadao Kawasaki Senior staff Planning, Management
Katsutoshi Izumi Senior staff Ditto
Nobuyasu Meguri Manager Ditto
Masahiro Muroya Manager Ditto
Hiroshi Tsutsumi Manage Ditto
Yutaka Yamamoto Manager Ditto
Akiko Kabasawa Staff Member Ditto
Isao Hashimoto Researcher Cement Kiln & Energy Saving
Katsumu Ebina Researcher Ditto
Kazumi Eto Researcher Energy Demand & Boiler
6

Project members of the Philippine team (FY 1998 to FY 1999)
Name Position Office
Mr. Ben-Hur C.SalcedoMr. Francisco A. BenitoMr. Gerry D. BoadoMs. Marilou B. RualesMs. Josette Q. InocencioMs. Lilybeth A. CapidMr. Antonio M. Lorenzo
UndersecretaryOfficer-in-ChargeActing ChiefSupervising Science Research Specialist Senior Science Research SpecialistScience Research SpecialistScience Research Specialist
DOEEUMB,DOECED,EUMB,DOE CED,EUMB,DOE CED,EUMB,DOE CED,EUMB,DOE CED,EUMB,DOE
DOE: Department of EnergyEUMB: Energy Utilization Management BureauCED: Conventional Energy Division
7. Committee
To implement the study, the “Committee for feasibility study of the environmentally-friendly coal utilization system” was organized to discuss the process and the contents of the activity and to assure smooth progress of the study. A meeting of the Committee was held at the Center for Coal Utilization, Japan, on September 29, 1999. The members of the Committee are listed below.
Name Position
Chairman Masayoshi Sadakata Professor of Dept, of Chemical System Engineering, University of Tokyo
Member Toshihiko Maruyama Executive Director & Director of Research and Development Dept, of Hokkaido Science and Technology Promotion Foundation
Atsushi Inaba Director of Energy Resources Dept., National Institute for Resources and Environment of the Agency of Industrial Science and Technology
Yoshimitsu Mimuroto Deputy General manager of International Cooperation Dept, the Institute of Energy Economics, Japan
Masakazu Ishiguro Director of First Development Dept., Japan Bank for International Cooperation
Katsunori Kudo Director of Administration Dept., Japan Bank for International Cooperation
7

II Contents of Survey

Chapter 1 Present Situation of Economy / Energy in the Philippines
This Chapter overviews the present state and the issues of economy and energy in the Philippines, and the policy on and present state of supply and demand of coal in the Philippines.
1.1 Present Status and future Forecast of Economy / Energy1.1.1 Outline of Economy in 1998
With the support of public, President Estrada appeared in June 1998. President Estrada declared to succeed the basic policy of ex. President Ramos who promoted the free economy. Thus, President Estrada enforces the policy including strengthening of foundation of revenue, encourage of private operation of economy sector, enhancement of credit to medium to small scale firms by governmental organizations, and confiscation of illegally accumulated properties. Overcoming the economy crisis is a critical issue of the Estrada administration.
Table 1.1-1 shows the major economy indexes of the Philippines.Under the ex. President Ramos, the economy of the Philippines achieved a growth of
7.24% of GNP (Gross National Product) in 1996, and 5.3% of GNP in 1997 supported by the steady economy policy of introduction of overseas capital and the export-oriented policy. On the currency crisis in July 1997, however, the GNP dropped to 1.6% in the first quarter of 1998, and further dropped to -0.8% in the second quarter of 1998. Owing to significant fall in Peso and to increased inflation, the investment activities were discouraged, thus the net investment reduced. Furthermore, the reduction in agricultural production caused from El Nino gave bad influence on the economy of the Philippines. In the past, both the export and the individuals import were the driving force of the growth of the Philippine economy. However, drop of the demand at export partner countries led significant drop of export as the total. Nevertheless, the individual consumption kept the steady level independent of the stagnant income and of the worsened employment state, and supported the economy. After the period, however, the negative growth of economy continued, and the Philippine economy has counted -0.5% of growth throughout the year of 1998, though the damage is not so bad as seen in other ASEAN countries which struggle in the aftereffect of the unprecedented currency crisis.
1.1.2 Outline of Economy in 1999In the preceding year, the drought accompanied with the El Nino became serious, and the
agricultural products suffered significant damages. In 1999, however, La Nina brought heavy rain to increase the crop of agricultural products such as rice and corn.
With the help of that favorable agricultural production, and with the contribution of increased export of electronics parts and of clothing items, the business of the Philippines has recovered.
Expecting the recovery of business and enjoying the tax incentives in the Philippines, investment from overseas significantly increased. As a result, the whole year Gross Domestic Product (GDP) of the Philippines in 1999 has turned to positive score, +3.3%. Nevertheless, the price of fuels such as gasoline was increased for three times resulted from the increase in
9

the crude oil import price, which has become a cause of lowering the approval rate to the President Estrada.
Table 1.1 -1 Main Economy Indexes in the Philippines (1995 - 1999)
1995 1996 1997 1998 1999
Nominal gross domestic product (GDP) (100 million US$)
741 828 822 652 767
Nominal gross national product (GNP) (100 million US$)
762 863 857 683 802
GNP per capita (US$) 1,084 1,200 1,166 909 1,051
Net GDP growth rate (%) 4.68 5.85 5.17 -0.54 3.3
Net GDP growth rate (%) 4.88 7.24 5.30 0.8 3.7
Inflation rate 8.1 9.1 6.0 9.8 6.6Unemployment rate, year average (%) 9.5 8.5 8.7 10.13 9.7
Trade balance (100 million US$) -90.9 -118.8 -107.1 -1.7 43.0• Export 174.5 205.4 252.3 294.9 350.3• Import 265.4 324.3 359.4 269.6 307.3Trade amount between Japan and the Philippines (100 million yen)• Export to Japan 3,263 4,920 6,065 42.34 46.59• Import from Japan 6,674 9,1.47 10,513 60.30 61.36
Ordinary balance (100 million US$) -33.0 -39.5 -43.0 12.9 71.9
Total balance (100 million US$) 6.3 41.1 -33.6 13.4 38.4
Foreign investment (Approved by BOI) (100 million pesos)• Japan
481.1226.02
253.5715.16
587.3737.20
372.9927.85
707.2332.31
Investment to Economy Special Section (Note 1)• Japan
413.08 165.48 508.88 369.13 .
310.16 96.90 255.73 250.50 -
Reserve in foreign currency (100 million US$)
76.3 116.2 86.5 106.8 149.9
Exchange rate to dollar (peso/ US$) 25.71 26.21 29.47 40.89 39.09
Foreign debt (100 million US$) 393.7 418.8 454.3 478.2 -
Financial balance (100 million pesos) 110.7 62.6 15.6 - -[Ratio to GDP %] [0.571 [0.281 [0.061 H H
Interest rate of government financialbond (%) (Note 2)
11.3 12.4 13.1 15.3 10.2
Source: The Central Bank in the Republic of the Philippines, the National Statistics Bureau Note 1: The Export Processing Zone Agency (EPZA) was reorganized to the Particular Economy Zone Agency
(PEZA), and the covering range was widened in 1995. Accordingly, there is no continuation in thestatistics.
Note 2: The interest rate on a 91 -day deposit. It indicates the average of whole period.
10
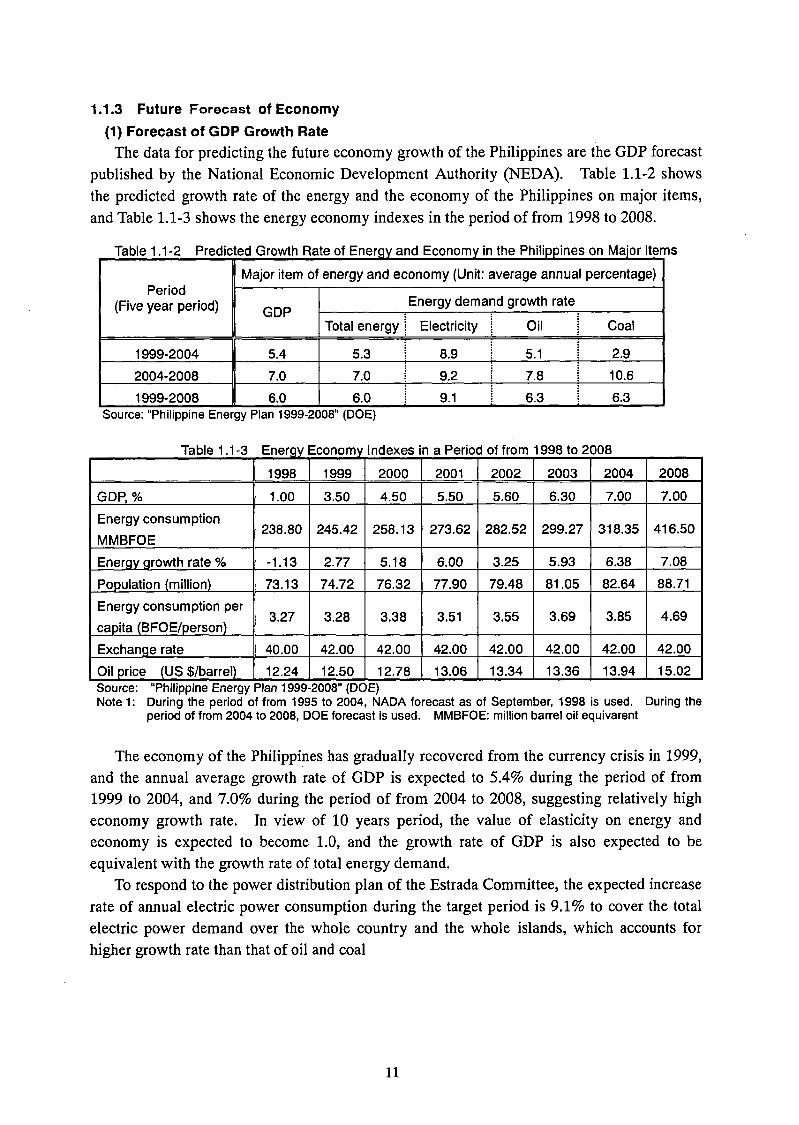
1.1.3 Future Forecast of Economy(1) Forecast of GDP Growth Rate
The data for predicting the future economy growth of the Philippines are the GDP forecast published by the National Economic Development Authority (NEDA). Table 1.1-2 shows the predicted growth rate of the energy and the economy of the Philippines on major items, and Table 1.1-3 shows the energy economy indexes in the period of from 1998 to 2008.
Table 1.1-2 Predicted Growth Rate of Energy and Economy in the Philippines on Major Items
Period(Five year period)
Major item of energy and economy (Unit: average annual percentage)
GDPEnergy demand growth rate
Total energy Electricity Oil | Coal
1999-2004 5.4 5.3 8.9 5.1 2.92004-2008 7.0 7.0 9.2 7.8 10.61999-2008 6.0 6.0 9.1 6.3 6.3
Source: “Philippine Energy Plan 1999-2008” (DOE)
Table 1.1-3 Energy Economy Indexes in a Period of from 1998 to 2008
1998 1999 2000 2001 2002 2003 2004 2008
GDP, % 1.00 3.50 4.50 5.50 5.60 6.30 7.00 7.00
Energy consumptionMMBFOE
238.80 245.42 258.13 273.62 282.52 299.27 318.35 416.50
Energy growth rate % -1.13 2.77 5.18 6.00 3.25 5.93 6.38 7.08
Population (million) 73.13 74.72 76.32 77.90 79.48 81.05 82.64 88.71Energy consumption per capita (BFOE/person)
3.27 3.28 3.38 3.51 3.55 3.69 3.85 4.69
Exchange rate 40.00 42.00 42.00 42.00 42.00 42.00 42.00 42.00Oil price (US $/barrel) 12.24 12.50 12.78 13.06 13.34 13.36 13.94 15.02Source: “Philippine Energy Plan 1999-2008” (DOE)Note 1: During the period of from 1995 to 2004, NADA forecast as of September, 1998 is used. During the
period of from 2004 to 2008, DOE forecast is used. MMBFOE: million barrel oil equivarent
The economy of the Philippines has gradually recovered from the currency crisis in 1999, and the annual average growth rate of GDP is expected to 5.4% during the period of from 1999 to 2004, and 7.0% during the period of from 2004 to 2008, suggesting relatively high economy growth rate. In view of 10 years period, the value of elasticity on energy and economy is expected to become 1.0, and the growth rate of GDP is also expected to be equivalent with the growth rate of total energy demand.
To respond to the power distribution plan of the Estrada Committee, the expected increase rate of annual electric power consumption during the target period is 9.1% to cover the total electric power demand over the whole country and the whole islands, which accounts for higher growth rate than that of oil and coal
11
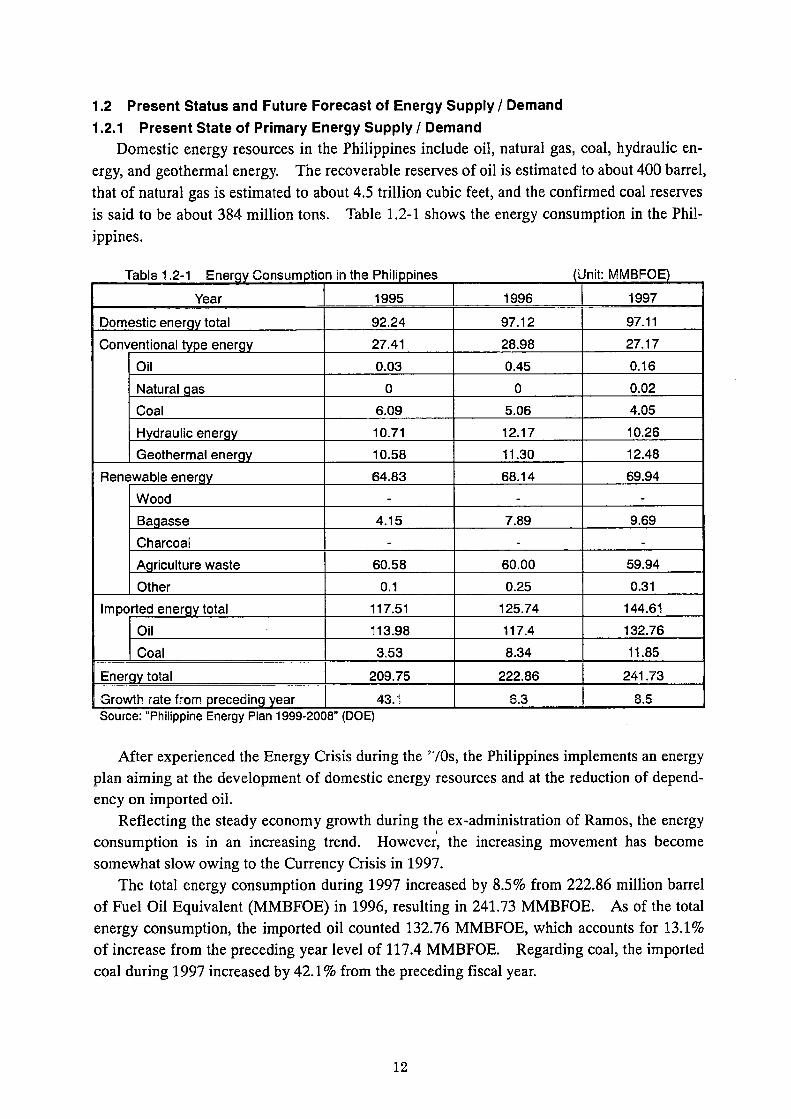
1.2 Present Status and Future Forecast of Energy Supply / Demand1.2.1 Present State of Primary Energy Supply / Demand
Domestic energy resources in the Philippines include oil, natural gas, coal, hydraulic energy, and geothermal energy. The recoverable reserves of oil is estimated to about 400 barrel, that of natural gas is estimated to about 4.5 trillion cubic feet, and the confirmed coal reserves is said to be about 384 million tons. Table 1.2-1 shows the energy consumption in the Philippines.
Table 1.2-1 Energy Consumption in the Philippines _________________(Unit: MMBFOE)
Year 1995 1996 1997
Domestic energy total 92.24 97.12 97.11
Conventional type energy 27.41 28.98 27.17Oil 0.03 0.45 0.16
Natural gas 0 0 0.02Coal 6.09 5.06 4.05
Hydraulic energy 10.71 12.17 10.26Geothermal energy 10.58 11.30 12.48
Renewable energy 64.83 68.14 69.94Wood - . -
Bagasse 4.15 7.89 9.69Charcoal . . .
Agriculture waste 60.58 60.00 59.94Other 0.1 0.25 0.31
Imported energy total 117.51 125.74 144.61Oil 113.98 117.4 132.76Coal 3.53 8.34 11.85
Energy total 209.75 222.86 241.73| Growth rate from preceding year 43.1 6.3 8.5
Source: “Philippine Energy Plan 1999-2008” (DOE)
After experienced the Energy Crisis during the ’70s, the Philippines implements an energy plan aiming at the development of domestic energy resources and at the reduction of dependency on imported oil.
Reflecting the steady economy growth during the ex-administration of Ramos, the energy consumption is in an increasing trend. However, the increasing movement has become somewhat slow owing to the Currency Crisis in 1997.
The total energy consumption during 1997 increased by 8.5% from 222.86 million barrel of Fuel Oil Equivalent (MMBFOE) in 1996, resulting in 241.73 MMBFOE. As of the total energy consumption, the imported oil counted 132.76 MMBFOE, which accounts for 13.1% of increase from the preceding year level of 117.4 MMBFOE. Regarding coal, the imported coal during 1997 increased by 42.1% from the preceding fiscal year.
12

Table 1.2-2 Forecast of Energy Mix in the Phi ippines (Unit: MMBFOE)
Year 1998 1999 2000 2002 2004 2006 2008
Domestic energy 93.87 103.81 107.00 129.72 145.59 166.28 195.43Conventional type energy 25.46 33.58 34.90 53.72 65.54 81.66 104.11
Oil 0.26 0.16 0.00 0.00 3.16 8.35 13.94Natural gas 0.02 0.02 0.03 17.42 21.45 21.43 28.74Coal 4.24 5.57 6.11 6.70 7.05 12.68 17.28Hydraulic energy 7.20 9.06 9.86 10.02 10.93 16.28 16.62Geothermal energy 13.74 18.77 18.90 19.58 22.95 22.92 27.53
Renewable energy 68.42 70.22 72.10 76.00 80.06 84.63 91.32Wood 38.33 39.30 40.29 42.27 44.30 46.33 48.41Bagasse 10.13 10.40 10.68 11.24 11.81 12.41 13.02Charcoal 4.38 4.47 4.56 4.73 4.91 5.07 5.24Agriculture waste 15.48 15.93 16.42 17.49 18.57 19.69 20.92Other 0.09 0.12 0.15 0.27 0.47 1.12 3.73
Imported energy 144.93 141.61 151.13 152.81 172.76 198.58 221.07Oil 129.94 114.17 122.65 130.34 141.73 161.90 181.36Coal 14.99 27.44 28.47 22.46 31.03 36.68 39.71
Total energy 238.80 245.42 258.13 282.52 318.35 364.86 416.50Growth rate (%/year) -1.21 2.77 5.18 3.25 6.37 7.12 7.08Energy saving through energy efficiency improvement, etc.
2.52 3.12 3.63 6.01 9.87 8.62 9.89
(Total energy) - (Energy sav- ing)
236.28 242.29 254.50 276.51 308.48 256.24 406.61
Consumption in electric power industry
69.26 70.32 75.73 83.41 98.35 120.10 142.82
Energy self-supply ratio 39.31 42.30 41.45 45.91 45.73 45.57 46.92Source: “Philippine Energy Plan 1999-2008”
As for the absolute quantity of the energy total demand, the expectation is given to increase from 245.42 MMBFOE in 1999 to 318.35 MMBFOE in 2004, and further to 416.50 MMBFOE in 2008.
The cause of that increase in the energy demand is the significant increase in the fuel demand in the electric power sector. The share of the demand of the electric power sector in the total energy demand is expected to become 28.7% in 1999, 30.9% in 2004, and 34.3% in 2008.
In the state of rapid growth of the energy demand, the development of domestic energy was emphasized, and the self-supply rate of the energy has increased to override the growth rate of the imported energy (oil, coal). In addition, energy saving owing to the improvement of energy efficiency is also taken into account, giving energy saving of 2.4% to the total energy in 2008.
14
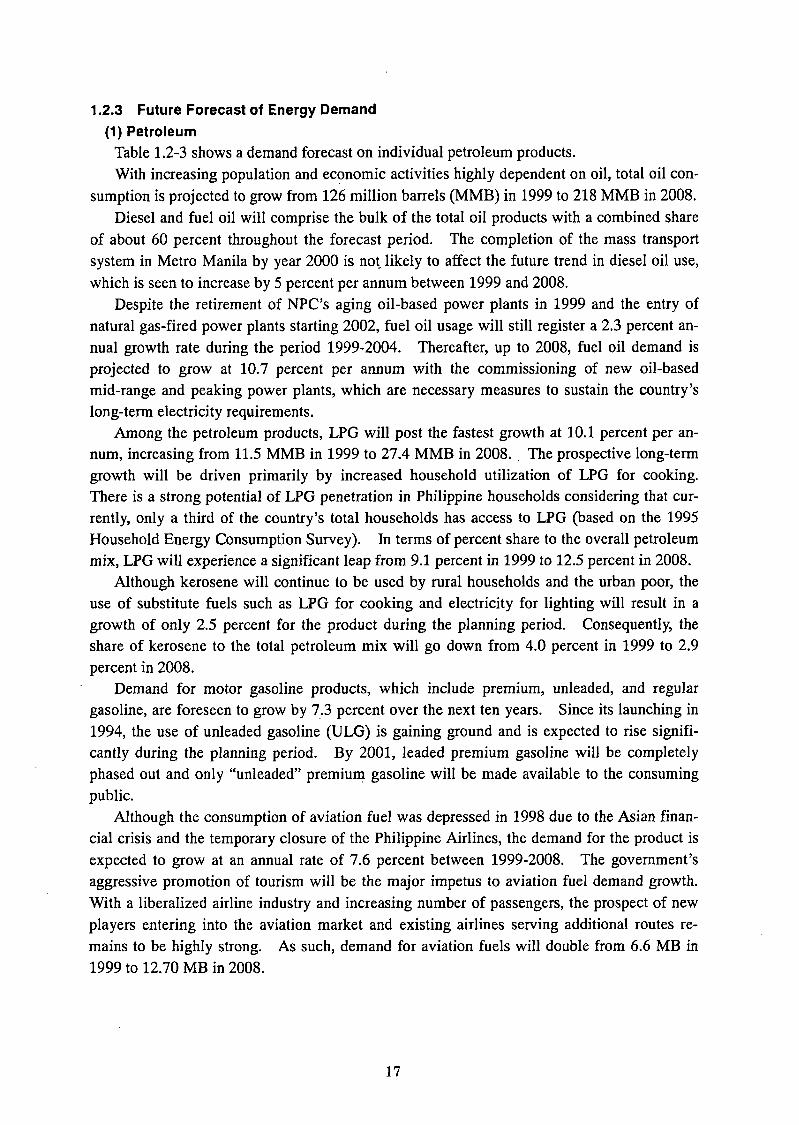
1.2.3 Future Forecast of Energy Demand(1) Petroleum
Table 1.2-3 shows a demand forecast on individual petroleum products.With increasing population and economic activities highly dependent on oil, total oil con
sumption is projected to grow from 126 million barrels (MMB) in 1999 to 218 MMB in 2008.Diesel and fuel oil will comprise the bulk of the total oil products with a combined share
of about 60 percent throughout the forecast period. The completion of the mass transport system in Metro Manila by year 2000 is not likely to affect the future trend in diesel oil use, which is seen to increase by 5 percent per annum between 1999 and 2008.
Despite the retirement of NPC’s aging oil-based power plants in 1999 and the entry of natural gas-fired power plants starting 2002, fuel oil usage will still register a 2.3 percent annual growth rate during the period 1999-2004. Thereafter, up to 2008, fuel oil demand is projected to grow at 10.7 percent per annum with the commissioning of new oil-based mid-range and peaking power plants, which are necessary measures to sustain the country’s long-term electricity requirements.
Among the petroleum products, LPG will post the fastest growth at 10.1 percent per annum, increasing from 11.5 MMB in 1999 to 27.4 MMB in 2008. The prospective long-term growth will be driven primarily by increased household utilization of LPG for cooking. There is a strong potential of LPG penetration in Philippine households considering that currently, only a third of the country’s total households has access to LPG (based on the 1995 Household Energy Consumption Survey). In terms of percent share to the overall petroleum mix, LPG will experience a significant leap from 9.1 percent in 1999 to 12.5 percent in 2008.
Although kerosene will continue to be used by rural households and the urban poor, the use of substitute fuels such as LPG for cooking and electricity for lighting will result in a growth of only 2.5 percent for the product during the planning period. Consequently, the share of kerosene to the total petroleum mix will go down from 4.0 percent in 1999 to 2.9 percent in 2008.
Demand for motor gasoline products, which include premium, unleaded, and regular gasoline, are foreseen to grow by 7.3 percent over the next ten years. Since its launching in 1994, the use of unleaded gasoline (ULG) is gaining ground and is expected to rise significantly during the planning period. By 2001, leaded premium gasoline will be completely phased out and only “unleaded” premium gasoline will be made available to the consuming public.
Although the consumption of aviation fuel was depressed in 1998 due to the Asian financial crisis and the temporary closure of the Philippine Airlines, the demand for the product is expected to grow at an annual rate of 7.6 percent between 1999-2008. The government’s aggressive promotion of tourism will be the major impetus to aviation fuel demand growth. With a liberalized airline industry and increasing number of passengers, the prospect of new players entering into the aviation market and existing airlines serving additional routes remains to be highly strong. As such, demand for aviation fuels will double from 6.6 MB in 1999 to 12.70 MB in 2008.
17
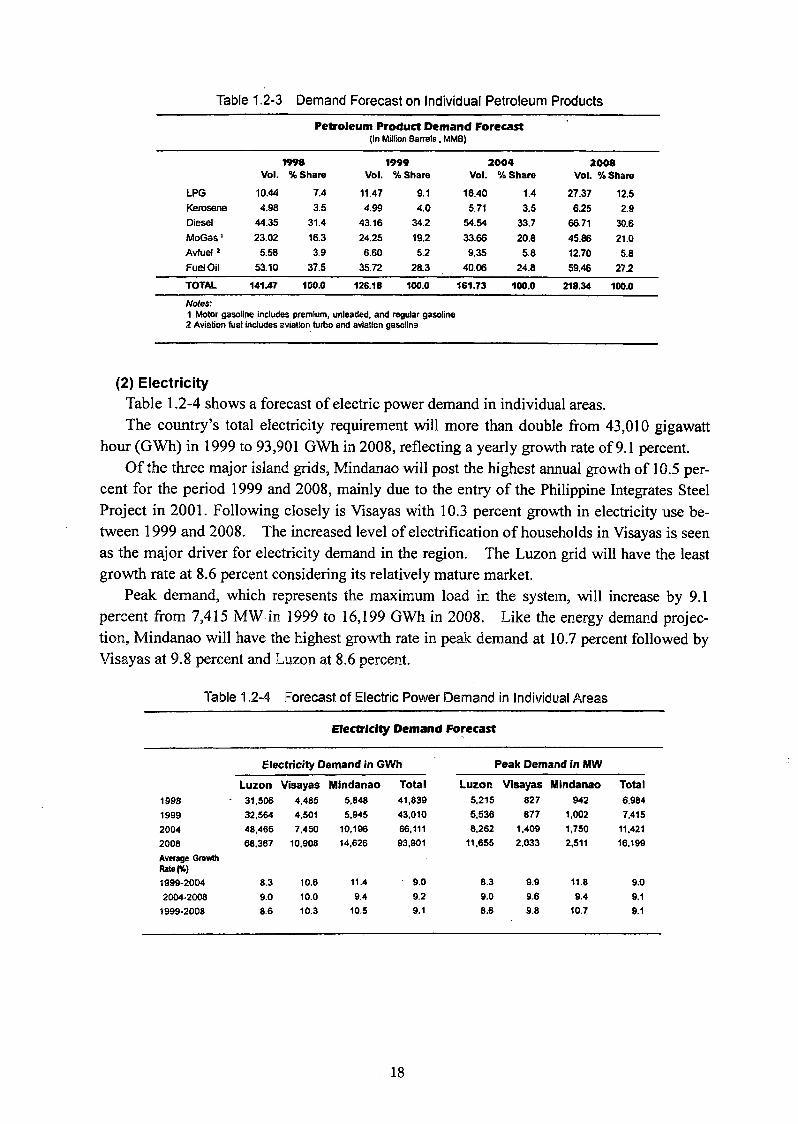
Table 1.2-3 Demand Forecast on Individual Petroleum Products
Petroleum Product Demand Forecast -
(In Million Barrels, MMB)
1998 1999 2004 2008Vol. % Share Vol. % Share Vol. % Share Vol. % Share
LPG 10.44 7.4 11.47 9.1 18.40 1.4 27.37 12.5Kerosene 4.98 3.5 4.99 4.0 5.71 3.5 6.25 2.9Diesel 44.35 31.4 43.16 34.2 54.54 33.7 66.71 30.6MoGas' 23.02 16.3 24.25 19.2 33.66 20.8 45.86 21.0Avfuel 2 5.58 3.9 6.60 5.2 9.35 5.8 12.70 5.8Fuel Oil 53.10 37.5 35.72 28.3 40.06 24.8 59.46 27.2
TOTAL 141.47 100.0 126.18 100.0 161.73 100.0 218.34 100.0
Notes:1 Motor gasoline Includes premium, unleaded, and regular gasoline2 Aviation fuel includes aviation turbo and aviation gasoline
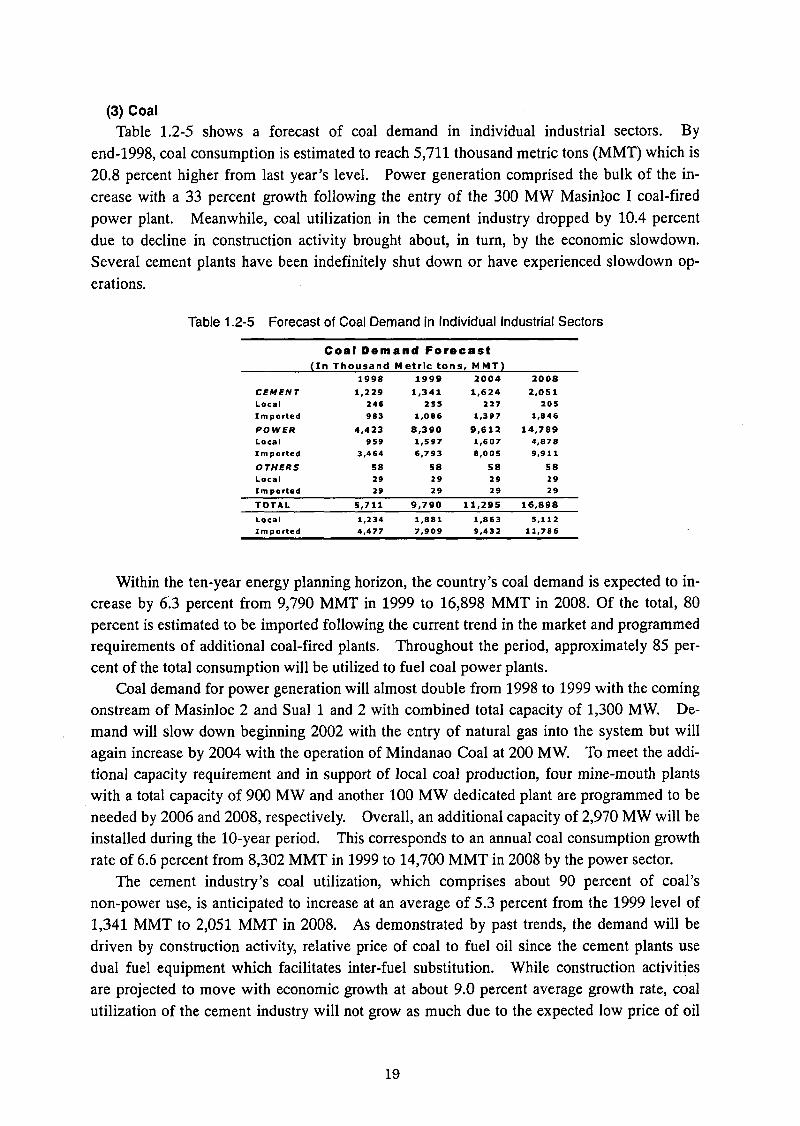
(2) ElectricityTable 1.2-4 shows a forecast of electric power demand in individual areas.The country’s total electricity requirement will more than double from 43,010 gigawatt
hour (GWh) in 1999 to 93,901 GWh in 2008, reflecting a yearly growth rate of 9.1 percent.Of the three major island grids, Mindanao will post the highest annual growth of 10.5 per
cent for the period 1999 and 2008, mainly due to the entry of the Philippine Integrates Steel Project in 2001. Following closely is Visayas with 10.3 percent growth in electricity use between 1999 and 2008. The increased level of electrification of households in Visayas is seen as the major driver for electricity demand in the region. The Luzon grid will have the least growth rate at 8.6 percent considering its relatively mature market.
Peak demand, which represents the maximum load in the system, will increase by 9.1 percent from 7,415 MW in 1999 to 16,199 GWh in 2008. Like the energy demand projection, Mindanao will have the highest growth rate in peak demand at 10.7 percent followed by Visayas at 9.8 percent and Luzon at 8.6 percent.
Table 1.2-4 Forecast of Electric Power Demand in Individual Areas
Electricity Demand Forecast
Electricity Demand in GWh Peak Demand in MWLuzon Visayas Mindanao Total Luzon Visayas Mindanao Total
1998 • 31,506 4,485 5,848 41,839 5,215 827 942 6,984
1999 32,564 4,501 5.945 43,010 5,536 877 1,002 7,4152004 48,465 7.450 10,196 66,111 8,262 1,409 1,750 11,4212008 68,367 10.908 14,626 93,901 11,655 2,033 2,511 16,199Average Growth Rate(%)1999-2004 8.3 10.6 11.4 9.0 8.3 9.9 11.8 9.02004-2008 9.0 10.0 9.4 9.2 9.0 9.6 9.4 9.1
1999-2008 8.6 10.3 10.5 9.1 8.6 9.8 10.7 9.1
18
(3) CoalTable 1.2-5 shows a forecast of coal demand in individual industrial sectors. By
end-1998, coal consumption is estimated to reach 5,711 thousand metric tons (MMT) which is 20.8 percent higher from last year’s level. Power generation comprised the bulk of the increase with a 33 percent growth following the entry of the 300 MW Masinloc I coal-fired power plant. Meanwhile, coal utilization in the cement industry dropped by 10.4 percent due to decline in construction activity brought about, in turn, by the economic slowdown. Several cement plants have been indefinitely shut down or have experienced slowdown operations.
Table 1.2-5 Forecast of Coal Demand in Individual Industrial Sectors
Coal Demand Forecast(In Thousand M etric tons, MMT)
1998 1999 2004 2008CEMENT 1,229 1,341 1,624 2,051Local 246 255 227 205Imported 983 1,086 1,397 1,846
POWER 4,423 8,390 9,612 14,789Local 959 1,597 1,607 4,878Imported 3,464 6,793 8,005 9,911
OTHERS 58 58 58 58Local 29 29 29 29Imported 29 29 29 29
TOTAL 5,711 9,790 11,295 16,898
Local 1,234 1,881 1,863 5,112Imported 4,477 7,909 9,432 11,786
Within the ten-year energy planning horizon, the country’s coal demand is expected to increase by 6.3 percent from 9,790 MMT in 1999 to 16,898 MMT in 2008. Of the total, 80 percent is estimated to be imported following the current trend in the market and programmed requirements of additional coal-fired plants. Throughout the period, approximately 85 percent of the total consumption will be utilized to fuel coal power plants.
Coal demand for power generation will almost double from 1998 to 1999 with the coming onstream of Masinloc 2 and Sual 1 and 2 with combined total capacity of 1,300 MW. Demand will slow down beginning 2002 with the entry of natural gas into the system but will again increase by 2004 with the operation of Mindanao Coal at 200 MW. To meet the additional capacity requirement and in support of local coal production, four mine-mouth plants with a total capacity of 900 MW and another 100 MW dedicated plant are programmed to be needed by 2006 and 2008, respectively. Overall, an additional capacity of 2,970 MW will be installed during the 10-year period. This corresponds to an annual coal consumption growth rate of 6.6 percent from 8,302 MMT in 1999 to 14,700 MMT in 2008 by the power sector.
The cement industry’s coal utilization, which comprises about 90 percent of coal’s non-power use, is anticipated to increase at an average of 5.3 percent from the 1999 level of 1,341 MMT to 2,051 MMT in 2008. As demonstrated by past trends, the demand will be driven by construction activity, relative price of coal to fuel oil since the cement plants use dual fuel equipment which facilitates inter-fuel substitution. While construction activities are projected to move with economic growth at about 9.0 percent average growth rate, coal utilization of the cement industry will not grow as much due to the expected low price of oil
19
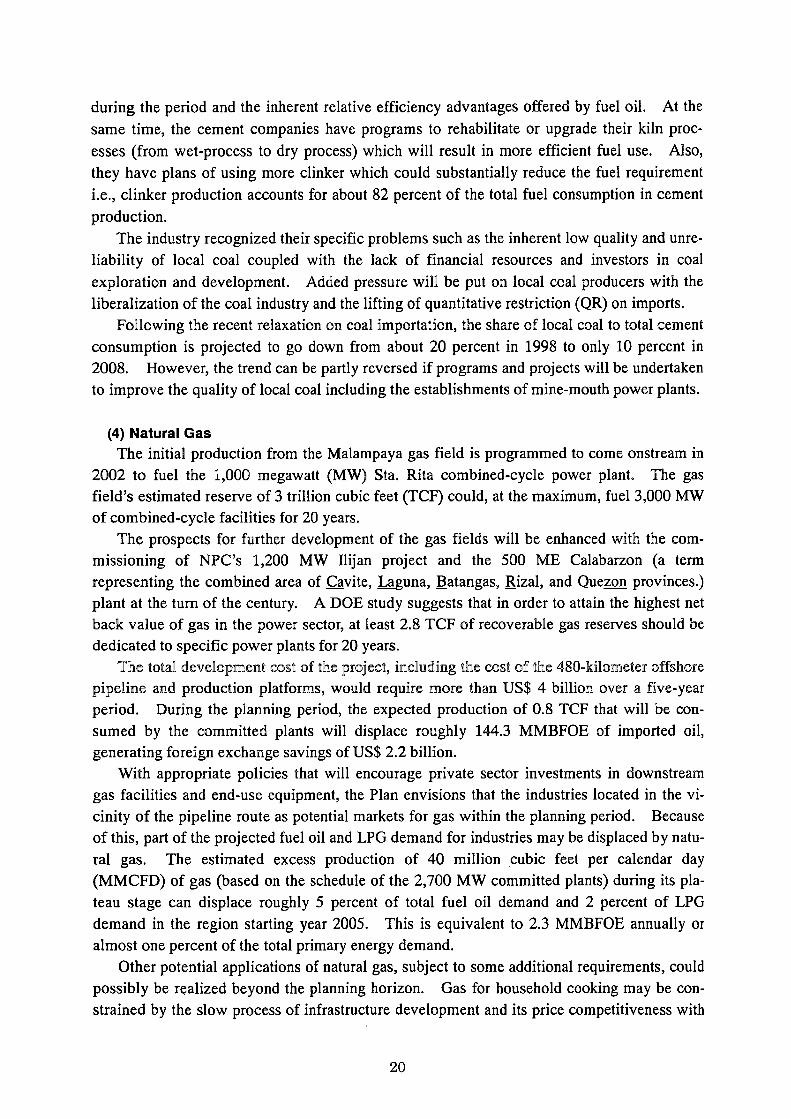
during the period and the inherent relative efficiency advantages offered by fuel oil. At the same time, the cement companies have programs to rehabilitate or upgrade their kiln processes (from wet-process to dry process) which will result in more efficient fuel use. Also, they have plans of using more clinker which could substantially reduce the fuel requirement i.e., clinker production accounts for about 82 percent of the total fuel consumption in cement production.
The industry recognized their specific problems such as the inherent low quality and unreliability of local coal coupled with the lack of financial resources and investors in coal exploration and development. Added pressure will be put on local coal producers with the liberalization of the coal industry and the lifting of quantitative restriction (QR) on imports.
Following the recent relaxation on coal importation, the share of local coal to total cement consumption is projected to go down from about 20 percent in 1998 to only 10 percent in 2008. However, the trend can be partly reversed if programs and projects will be undertaken to improve the quality of local coal including the establishments of mine-mouth power plants.
(4) Natural GasThe initial production from the Malampaya gas field is programmed to come onstream in
2002 to fuel the 1,000 megawatt (MW) Sta. Rita combined-cycle power plant. The gas field’s estimated reserve of 3 trillion cubic feet (TCF) could, at the maximum, fuel 3,000 MW of combined-cycle facilities for 20 years.
The prospects for further development of the gas fields will be enhanced with the commissioning of NPC’s 1,200 MW Hijan project and the 500 ME Calabarzon (a term representing the combined area of Cavite, Laguna, Batangas, Rizal, and Quezon provinces.) plant at the turn of the century. A DOE study suggests that in order to attain the highest net back value of gas in the power sector, at least 2.8 TCF of recoverable gas reserves should be dedicated to specific power plants for 20 years.
The total development cost of the project, including the cost of the 480-kilometer offshore pipeline and production platforms, would require more than US$ 4 billion over a five-year period. During the planning period, the expected production of 0.8 TCF that will be consumed by the committed plants will displace roughly 144.3 MMBFOE of imported oil, generating foreign exchange savings of US$ 2.2 billion.
With appropriate policies that will encourage private sector investments in downstream gas facilities and end-use equipment, the Plan envisions that the industries located in the vicinity of the pipeline route as potential markets for gas within the planning period. Because of this, part of the projected fuel oil and LPG demand for industries may be displaced by natural gas. The estimated excess production of 40 million cubic feet per calendar day (MMCFD) of gas (based on the schedule of the 2,700 MW committed plants) during its plateau stage can displace roughly 5 percent of total fuel oil demand and 2 percent of LPG demand in the region starting year 2005. This is equivalent to 2.3 MMBFOE annually or almost one percent of the total primary energy demand.
Other potential applications of natural gas, subject to some additional requirements, could possibly be realized beyond the planning horizon. Gas for household cooking may be constrained by the slow process of infrastructure development and its price competitiveness with
20

other energy products. In the transport sector, the constraint is on the adaptability of current vehicle fleets, which are not designed for gaseous fuel, as well as establishment of appropriate retailing facilities.
(5) New and Renewable Energy (NRE)Table 1.2-6 shows a forecast of new and renewable energy demand. The contribution of
NRE sources to the total energy mix is projected to increase from 70,200 MBFOE in 1999 to 91,300 MBFOE in 2008, at the average annual growth rate of 3 percent during the planning period.
Table 1.2-6 Forecast of New and Renewable Energy Demand
Demand for New and Renewable Energy by Resource(In Thousand Barrels of Fuel-Oil-Equivalent, MBFOE)
1998 1999 2004 2008
Hydro 26 38 134 332Wind 1 4 80 1.621Solar 61 74 258 540Ocean 0 0 0 534Biomass 68.329 70,105 79.586 88,293
Animal Waste 17 71 359 610Municipal Solid Waste 0 0 0 701Bagasse 10.134 10.404 11,814 13.018Coconut Residues 11.013 11.287 12,757 14.065Rice Residues 3.408 4,564 5.443 6,239Industrial Waste 42 6 7 7Fuelwood (Household) 34,231 34,998 38.807 41.731Fuelwood (Industrial) 4,100 4,305 5.494 6.678Charcoal 4.383 4.470 4.905 5.244
TOTAL 68,417 70,221 80,058 91,321
Biomass fuels - mainly of fuelwood, bagasse and coconut residues - will continue to account for the large share of the demand for NRE during the period. Fuelwood, charcoal and ricehull are used mainly for cooking by the household sector, in particular those in the rural and isolated areas.
On the other hand, bagasse and coconut residues are consumed by the agro-industrial sector as these are generated either as wastes or as by-products from their feedstock. Animal wastes will have minimal contribution by 1999 but will increase to about 61,000 MBFOE by 2008 due to the increasing installations of biogas systems in the country. From 70,100 MBFOE in 1999, demand for biomass will reach 88,300 MBFOE by 2008 with anticipated requirements for in-plant power generation and process heating.
While present consumption is predominantly biomass, the use of the more exotic NRE systems like solar, ocean and small hydro systems is programmed to increase during the planning period. For an archipelago consisting of more than 7,000 islands, these technologies appear to be more attractive and feasible energy sources for households, villages and baran- gays not readily accessible to the main grid.
By end of the period, energy for lighting, domestic heating, water pumping and cooking coming from these NRE sources will reach about 3,027 MBFOE.
21

(6) Electricity from NREIn 1999, about 100 MBFOE of NRE sources will be supplied to the national grid. This
will be provided by the 8 MW grid-connected capacity from bagasse by the BUSCO Milling Company in Bukidnon, which has been operational since 1995. Grid contribution by NRE will increase to about 600 MBFOE in year 2001 with the operation of communal ricehull (CRH) power plants with capacities of 1-3 MW or a total of about 40 MW in selected sites. Furthermore, the contribution of NRE for grid-based power will increase to about 3,700 MBFOE by year 2008. This increased contribution will be realized as the total aggregate capacity of about 325 MW from NRE sources will be connected to the main grids during the 10-year period. Major capacity additions in the latter years of the planning period include an 80 MW wind farm, 50 MW MSW-fired power plant, 50 MW ricehull-fired power plant and another 30 MW tidal current power system.
22

Chapter 2 Environmental Policy and Situation in the Philippines
The most serious problems of the environment in the Philippines are vehicle exhaust gas and solid waste treatment. Although the environmental problems relating to coal are limited to the coal production areas and the consumption areas, there is no significant damage and is no social problem at least at present owing to the small numbers of large scale consumption areas such as those having coal-fired thermal power plants.
In the future, however, the construction and operation of coal-fired thermal power plants under planning will induce influence on the environment unless adequate measures to the environment is applied.
2.1 Trends in the Environmental Regulation2.1.1 Enforcement of Laws and Regulations Relating to Environmental Conservation
The government’s call and response to the local and global environmental awareness is evident in its recently enacted laws such as Executive Order No. 15 (Creating a Philippine Council for Sustainable Development), Republic Act No. 7586 (National Integrated Protected Areas System Act of 1992), Republic Act No. 8371 (Indigenous People’s Right Act of 1997), Republic Act No. 8479 (Downstream Oil Industry Deregulation Act of 1998) and Republic Act No. 8749 (Philippine Clean Air Act of 1999). Through these measures, existing energy policies are now being reviewed and programs are being restructured consistent with the goals of sustainable development. It is envisioned that through these guidelines, the development and utilization of energy resources will be carefully guided not solely by economics but also by the principles of cultural and ecological sensitivity.
2.1.2 Mitigation of Global Climate ChangeGlobal climate change is the most prominent environmental issue and lays a tremendous
responsibility that has to be addressed within the millennium. The PEP is providing greater utilization of clean fuels. The power generation mix for the plan will increase the contribution of clean fuels from 42.6% to about 59% by 2009. A high scenario contribution of 41% in 2000 to 60.6% in 2009 is being targeted which will make possible, the minimum utilization of oil for capacity addition, the retirement of aging oil-based power plants, and enhanced use of natural gas, geothermal, hydropower and new and renewable energy.
To enable the Philippines to develop an appropriate local strategy in the mitigation of global climate change, the government, in cooperation with the United States Agency for International Development (USAID), is undertaking the Philippine Climate Change Mitigation Program (PCCMP) whose objective is to provide technical assistance, training and improved access to information and technology to government and private agencies in the Philippines in implementing various activities to reduce power sector greenhouse gases.
25

2.1.3 Energy Resources Development in Protected Areas and Ancestral DomainsThe National Integrated Protected Areas System Act (NIPAS) and the Indigenous People’s
Rights Act (IPRA) are laws which are principally aimed at preserving biological and cultural diversity and heritage. It may prohibit, restrict or delay the implementation of energy projects sited in protected areas and ancestral domain.
To address critical concerns on these areas, a MOA for Cooperation and Assistance on Energy Projects was signed between the DOE and DENR and a Committee on Energy Projects in NIPAS Areas (CEPNA) was created to work for this purpose.
The CEPNA identifies and delineates all energy projects within the protected areas and formulates measures which are in complement with sustainable development principles.
2.1.4 Prevention and Minimization of Incidence of Oil SpillAs provided in RA 8479 and its supplementary law, Executive Order No. 377 (Providing
the Institutional Framework for the Administration of the Deregulated Local downstream Oil Industry), the DOE is responsible for the overall monitoring of the downstream oil industry, including ensuring the compliance of petroleum businesses with quality, safety and environmental standards. As a safeguard against the unavoidable circumstance of oil spill incidence, the DOE will assist the Department of Transportation and Communication (DOTC) in setting of standards for safety and roadworthiness or seaworthiness of petroleum carriers such as trucks, haulers, tankers, and barges; and the regulation of routes of service, zones or areas of operation of tank trucks and other petroleum transport facilities. Moreover, the DOE will closely coordinate with the Department of National Defense (DND) in preventing and controlling marine pollution through inspection of vessel design and equipment, oil transfer procedures and operation, and communications requirement.
2=1.5 Recognition and Integration of the Philippine Agenda 21 in Energy ManagementThe Philippine Agenda 21 (PA21) is a framework that should be placed highest priority
for development, and is to give opportunity to solve the concern about and threat on global and regional environment existing in the energy sector. The PA21 implements the following-listed strategies in the energy sector.
(1) Establishing sustainable development indexes in the energy sector.(2) Strengthening assessment of whole energy industries on the environment.(3) Improving the energy efficiency in the management at both supply and demand sides.(4) Controlling profit to the regional government which applies energy project and/or en
ergy generation facilities.
The PA21 also encourages the Philippine Council for Sustainable Development (PCS) to establish the implementation means and to join to the sub-committees of atmosphere, science, technology, and information and education.
26
2.1.6 Philippine Water ActAnother Law being pushed for its passage is Senate Bill 1710, also known as the 1999
Philippine Water Act, which seeks to protect and safeguard the country’s water resources. Currently, the government lacks a comprehensive water utilization policy.
The Philippines has one of the longest shoreline in the world with an aquatic area of 2.2 million square kilometers, which is seven times larger than its total land area. It also boasts of at least 384 major river systems and 59 lakes, more than 100,000 hectares of freshwater swamps, 380,000 hectares of swamplands and 19,000 hectares of reservoirs. The sad fact is that government fails to recognize all these. Rivers are dying and have become dumped with all kinds of garbage, ranging from oil, toxic chemicals, industrial human waste.
Based on a water quality assessment study, at least 50 major river systems are heavily polluted, while a number of our gulfs and rivers suffer from heavy siltation and sedimentation caused by mine tailings and industrial waste.
Under this Act, a water management and development framework shall be formulated, aimed at providing the necessary infrastructure input for economic development as well as the preservation of a healthy environment. This framework shall include the efficient use of water, long-term resource protection, river-basin management, safe-drinking water development, proper handling and rehabilitation of toxic and contaminated groundwater.
27

2.2 Philippine Clean Air Act2.2.1 Status of Clean Air Act
Republic Act No. 8749, otherwise known as Philippine Clean Air Act of 1999, is a law which provides for an integrated and comprehensive air pollution policy in order to safeguard public health and welfare. It lays down the policy abatement, prevention and control of air pollution from both stationary (industries) and mobile (motor vehicles) sources.
The DOE, together with the DENR, is spearheading the setting up of specifications for all types of fuel and fuel-related products to improve fuel composition for an increased efficiency and reduced emissions.
This will be done in cooperation with the Bureau of Product Standards (BPS) of the Department of Trade and Industry (DTI), Department of Science and Technology (DOST), fuel and automotive industry, the academe and the consumers.
2.2.2 Cost and Effect Relating to Clean Air ActThe Clean Air Act, which was passed last June 23, 1999, is considered significant because
it sets precedents for all legislative measures in the country and is proof that the Estrada administration is serious about eradicating air pollution in the country. However, throughout the birth cycle of the Act, protests and concerns have been raised by different sectors of society.
And in the center of dilemma is the oil industry. The people behind the oil industry expressed that they are not against the Act, but are only worried that the imposition of some stringent regulations in terms of environmental protection would entail a lot of cost which eventually ends up to the consumers.
One of the major provisions in the Act concerns specification for gasoline and diesel. Lead in gasoline will have to be phased out nationwide by January 2001 and the aromatics and benzene content of the unleaded gasoline will have to be reduced by 45% and 4%, respectively by December 1999, to 35% and 2%, respectively by 2003. The sulfur content of automotive and industrial diesel will have to be reduced to 0.20% and 0.30%, respectively by January 2001, and eventually to 0.05% by 2004.
The law requires oil companies to upgrade their facilities to enable them to process cleaner fuels. With these, the oil companies may have to spend P6 billion to P10 billion to improve their facilities. This investment may result in a P2 per liter increase in the retail prides of petroleum products.
Another sector that will be greatly affected is the power sector. The enactment of the CAA superseded Memorandum Circular 29 (M.C.29) which allows existing sources to continuously operate below the standard requirement of DENR DAO 14. In the M.C. 29, existing sources are allowed to comply only at Ambient Standard. The CAA is the retroactivity of the air quality standards adopted from the DENR Administrative Order (DAO) 14 of April 1993. With the new set of standards of CAA, both the existing and new stationary sources will have to comply with the standard measured at point source. The CAA specifies the standards for pollution from stationary sources.
New plants will have to comply with the standards under the CAA. Only existing plants are given an 18 month grace period to comply and install appropriate pollution control de
28

vices. As stated in the last paragraph of Section 19, “Existing industries, which are proven to exceed emission rates established by the Department, in consultation with stakeholders, after a through, credible and transparent measurement process, shall be allowed a grace period of eighteen (18) months for the establishment of an environmental management system and the installation of an appropriate air pollution control device: Provided, that an extension of not more than twelve (12) months may be allowed by the Department on meritorious grounds”.
A total of 153 existing power plants are covered by the exemption of M.C. 29. It is expected that some of these units using diesel, oil, bunker and coal-fired, might consider closing or shutting down. This means that some are already old and are no longer economically viable to rehabilitate in order to comply with the new standard. Some plants have partially complied and are looking into the possibility of continuing their operation by installing new anti-pollution devices. In order to comply, they are seeking incentives from the government such as the granting of lesser tax or tax exemption as these facilities will have to be acquired abroad. Untimely shutting down of some facilities might result to a massive brownout or energy crisis such as those experienced in the early 90’s. However, the current oversupply of power in the country can sustain the demand until the year 2004.
2.2.3 Ban on IncinerationThe ban on incineration limits its coverage based on the definition stated in the Section 20
of the Act. The Act defines incineration as “the burning of municipal, bio-medical and hazardous wastes, which process emits poisonous and toxic fumes”. On the other hand, “Incinerators” as defined in Energy Terminology means the ignition and burning of solid, semi-solid, liquid or gaseous combustible waste matter in combustion equipment especially designed to reduce the bulk of waste materials prior to disposal of ash residue and render toxic materials harmless. Therefore, combustion systems which are also defined as “incinerators” but do not emit poisonous and toxic fumes are not covered by this Act. Another reason is that heat of combustion from these equipment are utilized for steam generation and electricity production. Most energy industries and power plants in the country use this type of process to generate electricity. Almost all sugar mills have this kind of facility which produces electricity by burning bagasse.
The Implementing Rules and Regulations of the CAA is still being formulated. It will clearly define the status of all the plants that will be affected by this law. All industries and sectors involved, while simultaneously complying with standards, are still trying to come up with some proposals and plans on how to salvage their plants especially those that were covered by M.C. 29. Since the CAA is the retroactivity of the air quality adopted from DENR DAO 14, it is believed that pending rationalization of emission standards, existing plants will comply only within the Ambient Standard. Moreso, the Integrated Air Quality Improvement Framework where the entire comprehensive plan to improve air quality is founded, is still being defined and established.
This framework will prescribe emission reduction standards, control strategies and control measures to be undertaken within a specified time period. It will serve as the fundamental blueprint of the roles to be performed by government agencies, which shall include the for-
29
mutation of cost-effective use, economic incentives, management strategies, collective action and environment related education and information.
2.3 Regulations on Emission in Industries2.3.1 Regulation on Emission in Electric Power Industry
Regarding coal-fired thermal power plant, the environmental measures certificate need to be submitted, prior to the approval of construction, to DENR, which is the responsible agency of environmental measures.
These contents should be reviewed by an environmental supervisor to be placed at the plant, and the environmental management program should be examined and the have to be reported to DENR. Budget for these measures to follow the regulations should be included in the plant operation cost. The maximum penalty is 5,000 Pesos per day, however, when the violation is continued for a certain period, plant shut down or closing can be ordered.
If the violation is continued further, additional penalty of 1,000 Pesos will be applied. It is specified that 2-6 years imprisonment could be applied.
(1) Sulfur Oxides (SOx)According to the base of operation start-up on January 1, 1994, SO2 emission of the new
plant was specified to be under l,000mg/Nm3. Limitation for coal to be used is 1% max as mixed-coal base, and a desulfurization equipment need to be installed if exceeding this limit.
In case that the operation was started on January 1, 1998, the further severe emission limit of 700mg/Nm3 is applied, and desulfurization equipment needs to be installed. Saul and Masinloc plants need to introduce desulfurization plants.
(2) Nitrogen Oxides (NOx)There is no regulation regarding nitrogen oxides (NOx). In the future, it should be
exam-ined as well as SOx regulations. NOx level at existing plants will be approximately l,500mg/Nm3, and NOx at the newly introduced plant will be approximately l,000mg/Nm3.
(3) DustDust emission needs to be limited more severely compared with other emissions. Each
coal-fired thermal power plant already introduced high efficiency ER However, some plants, such as a fluidized bed boiler at Sangi power plant, only installed baghouse.
(4) Future Emission TrendBy increasing electric power generation, it is expected that emission of SOx, NOx, CO2
and H2S from power plants could be reduced in the future.The reason is that old-type diesel, coal and geothermal power generation plant are closed
in 1998, and old-type natural gas plant will be closed in 2002.Further, it is predicted that during 2003 through 2010, environmentally-friendly fuel will
be introduced and it could achieve further emission reduction, instead of base-load or peak-load power.
30

2.3.2 Current Situation of Pollution Preventive Facilities at Existing Power Generation Plants
(1) Current StateAs of 1999, electric power plants (NPC and NPC-IPP) showed Table 2.3-1 are equipped
with pollution control facilities and equipment and comply with the Philippine Clean Air Act’s emission standards.
Table 2.3-1 Electric Power PlantsPower Plant Pollution preventive facilities and fuels
Original Year CommissionedPlace
PowerCapacity
MWFGD EP Low Nox
Burner Fuel
Limay BataanGT CombinedCycle Power Plant 600 - - Nox Emission
Control
Use Special Lower Sulfur
Bunker Fuel
May 1993/1994
ZamboangaDiesel Power Plant 100 O - - - December 1997
General SantosDiesel Power Plant 50 - O O - March 1998
Calaca CFTPP 600 - o O Use Low Sulfur Coal
September 1984 (Unit 1) July 1995 (Unit 2)
Masinloc CFTPP 600 o o Use Low Sulfur Coal
June 30,1998 (Unit 1) November 1998 (Unit 2)
Sual CFTPP 1,000 o o o - October 1999Pagbilao CFTPP 700 - o o Use Low
Sulfur Coal March 1999
Naga CFTPP 110 - o o Use Low Sulfur Coal
September 1981 (Unit 1) December 1986 (Unit 2)
Note) FGD: Fuel Gas Desulfurizer, EP: Electric Precipitator
The Clean Air Act requires power plants to install pollution control facilities in order to comply with present standards. With regard to de-SOx installation, the Sual power plant (commissioned in 1999) is the first coal-fired power plant to be built with a flue gas desulfurizer (FGD). Another plant, the Zamboanga Diesel Power Plant was commissioned in December 1997 and is also equipped with an FGD. No power plant in the country that was built prior to April 1993, has installed a de-SOx system in their facility. Those plants that have not complied with the present standards, are already being reserved for retirement.
Due to the high cost of installing an FGD system, other plants comply with SOx emission standards by using a low sulfur fuel.
Since most of the power plants contracted with the IPPs during the power crisis in the early 90’s can no longer comply with the present emission standards, NPC plants to reduce the emissions of these plants through the retirement of old and inefficient fossil-fuel based plants. NPC has proposed to DENR to allow them to continue operating some of their old power plants with existing contracts since they are nearing their expiration and have a relatively short remaining plant life. It will be uneconomical to retrofit them with emission abatement facilities. Better quality fuels, when available and affordable, will be used instead.
For other existing plants that will undergo repowering, improvement, alteration, modification, and retrofitting with emission abatement facilities, a conduct of a feasibility study, detailed design, funding, tendering, construction and operation and maintenance is needed. The gestation period for these projects will take about five years.
31

(2) Actions Responding to the Air Cleaning Law of NPCAs part of NPC’s compliance to the 1999 Philippine Clean Air Act, NPC has adopted the
following strategies:
a. A revised Power Development Program (PDP), these includes:
(i) Development of clean, renewable and indigenous power sources.NPC supports the development and utilization of renewable and indigenous power sources,
such as hydro, geothermal, natural gas, wind, solar and tidal energy, in response to a need to develop locally available resources for a national sustainable power supply and an international demand for the reduction of fossil fuel through the adoption of clean energy alternatives.
(ii) Reduction of power plant emissions through the retirement of old and inefficient fossil-fuel burning power plants.
b. NPC’s 1997 PDP included environmental externalities for future power projects highlighting a 30% reduction of emissions during the next 14 year period, inspite of the projected 104% increase in generation output.
Owing to the full scale utilization of geothermal energy and to the introduction of natural gas in 2002, the increase rate of emissions of NOx and fine particles is expected to be minimized. Table 2.3-2 shows the average emissions from power plants.
TableZ3^^^verag2Emission^frorr^owe^Plant^UnitJ<g/GWI^
Emissions 1997 2000 2005 2010' S02 6,204 4,759 3,649 3,968
NO, 2,241 2,349 2,309 2,503CO, 551,928 633,681 467,659 3,388,282H,S 2,553 2,362 1,813 1,327Part. M. 267 307 282 305Generation (GWh) 36,905 41,153 54,771 75,482
Source: NPC Strategy for Clean Air Act Compliance
c. Installation of pollution control facilities for power plants. (See list of power plants on Table 2.3-1).
d. Use of clean fuelAnother NPC thrust is to use cleaner fuels. NPC will rely on the assured sustainable and
affordable supply of cleaner fuels for power plant emission reduction.The indicative characteristics of cleaner fuels for NPC thermal power plants are:
32
(i) Bunker Fuel Oil < 1% Sulfur ContentBFO’s % Sulfur was reduced in 1996, from 3.8% (max.) to 3%. NPC has been using
max. 3% BFO since
(ii) Coal < 0.5% Sulfur ContentNPC has been using coal with max. 1% (range 0.3-1) Sulfur content as specified in envi
ronmental Compliance Certificates of NPC’s CFTPP’S
(iii) Diesel Fuel Oil < 0.3% Sulfur ContentNPC’s DFO has a max. of 0.5%, range 0.2-0.5, Sulfur content
e. The compliance to ambient air quality standardsThe ambient air quality in the residential vicinity of NPC power plants has not been ad
versely affected by the operations of the power plants. To date, based on the available air quality monitoring data measured nationwide using portable and permanently-installed automatic air quality measuring instruments, the upwind and downwind of power plants generally indicate compliance to ambient air quality standards. With this reason, NPC proposes to retain the compliance to ambient air quality standards, rather than emission standards for its existing thermal power plants, geothermal power plants, start-up, peaking, standby, grid/voltage-stabilizing power sources, emergency power supply such as power barges fired with diesel and bunker fuel oil, and power plants serving the missionary electrification program of the DOE and NPC.
33

2.3.3 Regulations of Emissions in Cement IndustryThe degree of influence of cement industry on environment significantly differs with the
plant status and the process applied.Emissions to the air are mainly caused by dust from raw materials and clinker. Emis
sions occur primarily in the handling of materials and in the calcinations process. The latter components are highly dependent on the equipment employed. Factors such as design criteria, status of equipment, quality of operation, fuel quality and requirements are of great importance.
Pollution control is a major problem of any cement plant due to the large amount of drypowder which is processed daily and also of the large volume of combustion waste. Bag- house filters of various capacities are being used in the process, such as transporting, storing and grinding.
(1) DustTo prevent dust emission, the kilns are equipped with Electrostatic Precipitators (EP).
Some of these are recently installed and well maintained, while the others are old, worn down and in great need of comprehensive rehabilitation. To have an EP installed is not always a guarantee for low dust emission.
Table 2.3-3 shows the standard of emissions at emission source. The concept of “new source” and “existing source” is applied. When an existing plant moves or transfers to a separate area or site, the plant is counted as a “new source”.
Table 2.3-3 Source Emission Standards for Cement Industry
Source Allowable concentration mg/m3
Existing sources 1,000
New sources 500
Source: DBF Environmental Report
For comparison, Table 2.3-4 shows the guidelines adopted in individual countries.
Table 2.3-4 Guidelines for Particulate Matters from Kiln in Different Countries
Country New source mg/m3 Existing source mg/m3
UK 100 (50) 300
Germany 30 50
EU 50 150
Malaysia 100 200
Thailand 50 200
Indonesia 100 400 - 600Source: DBF Environmental Report
34
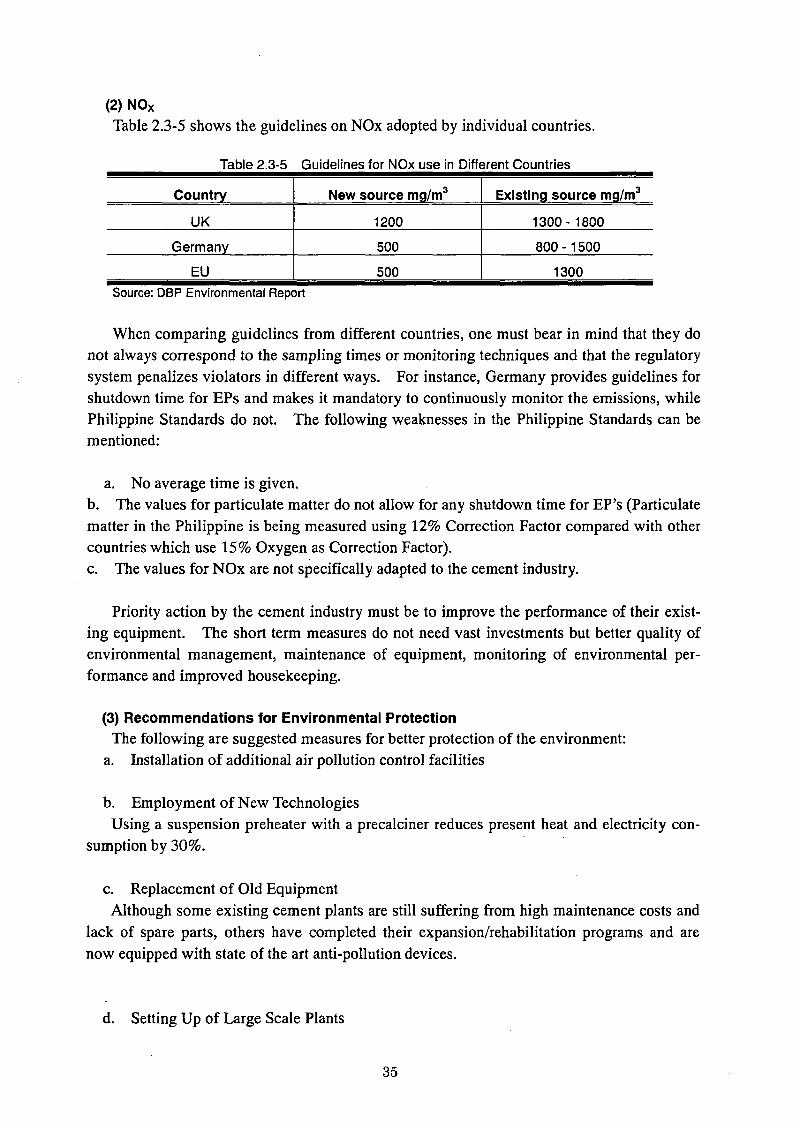
(2) N0XTable 2.3-5 shows the guidelines on NOx adopted by individual countries.
Table 2.3-5 Guidelines for NOx use in Different Countries
Country New source mg/m3 Existing source mg/m3
UK 1200 1300 - 1800
Germany 500 800- 1500
EU 500 1300Source: DBF Environmental Report
When comparing guidelines from different countries, one must bear in mind that they do not always correspond to the sampling times or monitoring techniques and that the regulatory system penalizes violators in different ways. For instance, Germany provides guidelines for shutdown time for EPs and makes it mandatory to continuously monitor the emissions, while Philippine Standards do not. The following weaknesses in the Philippine Standards can be mentioned:
a. No average time is given.b. The values for particulate matter do not allow for any shutdown time for HP’s (Particulate matter in the Philippine is being measured using 12% Correction Factor compared with other countries which use 15% Oxygen as Correction Factor).c. The values for NOx are not specifically adapted to the cement industry.
Priority action by the cement industry must be to improve the performance of their existing equipment. The short term measures do not need vast investments but better quality of environmental management, maintenance of equipment, monitoring of environmental performance and improved housekeeping.
(3) Recommendations for Environmental ProtectionThe following are suggested measures for better protection of the environment:
a. Installation of additional air pollution control facilities
b. Employment of New TechnologiesUsing a suspension preheater with a precalciner reduces present heat and electricity con
sumption by 30%.
c. Replacement of Old EquipmentAlthough some existing cement plants are still suffering from high maintenance costs and
lack of spare parts, others have completed their expansion/rehabilitation programs and are now equipped with state of the art anti-pollution devices.
d. Setting Up of Large Scale Plants
35
The relatively small average production capacity of each plant prevents them from enjoying economies of scale. This can be taken cared of by setting up large scale plants or merging of existing cement plants.
e. Intensification of Training on Environmental Protection ProgrammeSuch program can consist of improved monitoring of process parameters and emissions,
scheduled reports and supervision programme, etc.
(4) Awards
a. ISO 9002 Certification AwardNorthern Cement Corporation (NCC) received an ISO 9002 Certification Award from
Certification International Philippines, Inc. last September 2, 1999. The award validates the company’s Quality Management System which assures consumers that what they have been getting from them is quality.
NCC has been augmenting its initiative to preserve its green environment through an Environmental Management Plan. The plan consists of mitigating and introducing enhancement measures in order to minimize the adverse effects of its plant operation to the environment, while maximizing its production.
b. Buhay AwardThe Buhay Award for Greenhouse Gas Abatement is a citation government has given for
the first time. It was awarded by DENR and DOE for energy efficiency improvement to Hi Cement Corporation (now Union Cement). Hi Cement received the award for measures ithas undertaken to reduce energy consumption by 12.4%, conserving more than 29.9 million liters of oil equivalent. The measures adopted included the use of a new process that reduced fuel consumption of Its new production line and the installation of a capacitor bank which improved power efficiency by 10%.
Hi Cement has also used an automated bag house which further raised its energy efficiency and has also improved its compressed air system by reducing air pressure and used recycled water.
Note) The term “Buhay” is a Tagalog of the Philippines expressing “Life”.
36
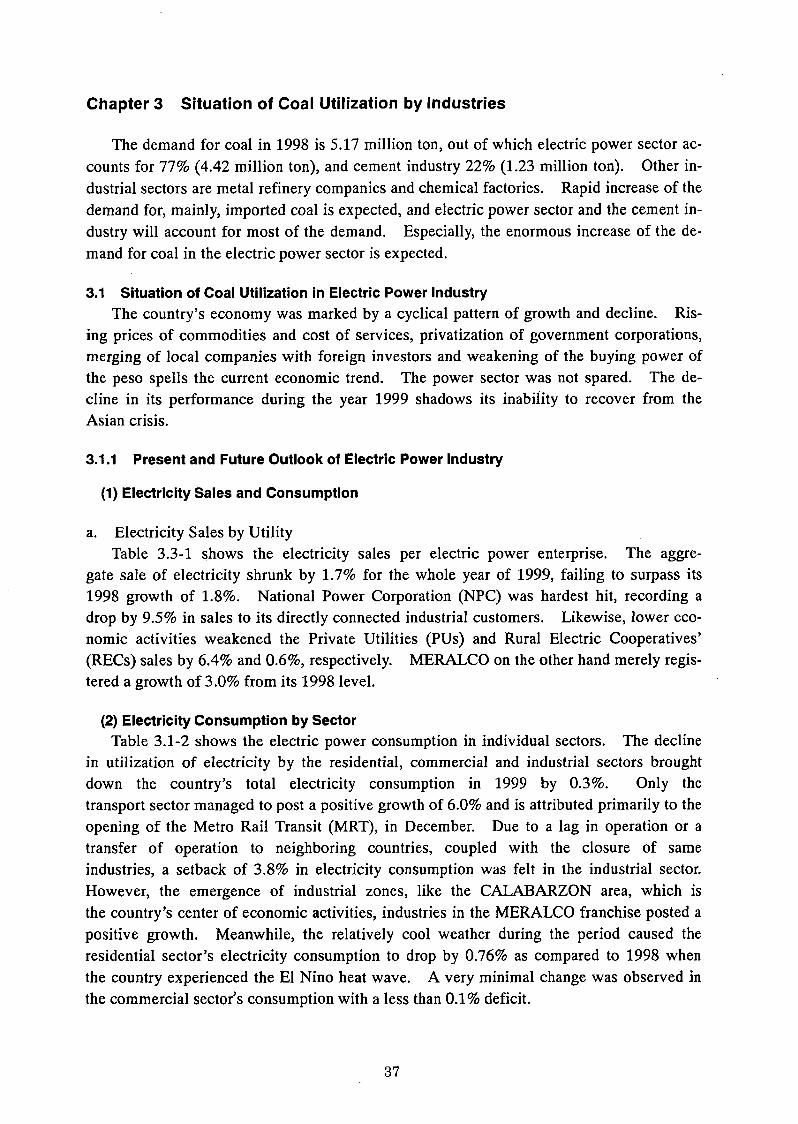
Chapter 3 Situation of Coal Utilization by Industries
The demand for coal in 1998 is 5.17 million ton, out of which electric power sector accounts for 77% (4.42 million ton), and cement industry 22% (1.23 million ton). Other industrial sectors are metal refinery companies and chemical factories. Rapid increase of the demand for, mainly, imported coal is expected, and electric power sector and the cement industry will account for most of the demand. Especially, the enormous increase of the demand for coal in the electric power sector is expected.
3.1 Situation of Coal Utilization in Electric Power IndustryThe country’s economy was marked by a cyclical pattern of growth and decline. Ris
ing prices of commodities and cost of services, privatization of government corporations, merging of local companies with foreign investors and weakening of the buying power of the peso spells the current economic trend. The power sector was not spared. The decline in its performance during the year 1999 shadows its inability to recover from the Asian crisis.
3.1.1 Present and Future Outlook of Electric Power Industry
(1) Electricity Sales and Consumption
a. Electricity Sales by UtilityTable 3.3-1 shows the electricity sales per electric power enterprise. The aggre
gate sale of electricity shrunk by 1.7% for the whole year of 1999, failing to surpass its 1998 growth of 1.8%. National Power Corporation (NPC) was hardest hit, recording a drop by 9.5% in sales to its directly connected industrial customers. Likewise, lower economic activities weakened the Private Utilities (PUs) and Rural Electric Cooperatives’ (RECs) sales by 6.4% and 0.6%, respectively. MERALCO on the other hand merely registered a growth of 3.0% from its 1998 level.
(2) Electricity Consumption by SectorTable 3.1-2 shows the electric power consumption in individual sectors. The decline
in utilization of electricity by the residential, commercial and industrial sectors brought down the country’s total electricity consumption in 1999 by 0.3%. Only the transport sector managed to post a positive growth of 6.0% and is attributed primarily to the opening of the Metro Rail Transit (MRT), in December. Due to a lag in operation or a transfer of operation to neighboring countries, coupled with the closure of same industries, a setback of 3.8% in electricity consumption was felt in the industrial sector. However, the emergence of industrial zones, like the CALABARZON area, which is the country’s center of economic activities, industries in the MERALCO franchise posted a positive growth. Meanwhile, the relatively cool weather during the period caused the residential sector’s electricity consumption to drop by 0.76% as compared to 1998 when the country experienced the El Nino heat wave. A very minimal change was observed in the commercial sector’s consumption with a less than 0.1% deficit.
37

^^b^^S^I^J^^EIectricIt^End^Us^^ales^b^Utnit^^l^Me^^Watt-hours^^MWjT^
Utility Full YearPercentChange
%
Percent Share %
1999 1998 1999 1998
NPC 3,321,789 3,666,657 A9.41 9.90 10.74
MERALCO 20,364,966 20,306,400 0.29 60.69 59.48
RECs 6,033,808 6,069,996 A0.60 17.98 17.78
Pus 3,833,031 4,095,261 A6.40 11.42 12.00
Total 33,553,595 34,138,313 A 1.71 100.00 100.00
Note: Details may not add to total due to rounding off.Source: Power and Electrification Report, Full Year 1999, DOE
Tabl^^^^lectricit^Consumgtior^b^Sector^ln^Mega^atMTourSjJylW^
Full Year PercentChange
%
Percent Share %
1999 1998 1999 1998
Residential 11,845,471 11,936,049 A0.76 28.58 28.71
Commercial 8,693,030 8,696,722 A0.04 20.97 20.92
Industrial 12,068,851 12,542,924 A3.78 29.12 30.17
Transport 30,312 28,602 5.98 0.07 0.07
Others 915,931 934,016 A 1.94 2.21 2.25
Total End-use 33,535,595 34,138,313 A1.71 80.95 82.11
Own-use 1,601,648 1,590,427 0.71 3.86 3.83
Losses 6,296,653 5,849,364 7.65 15.19 14.07
Total 41,451,895 41,578,105 A0.30 100.00 100.00
Note: Details may not add to total due to rounding off.Source: Power and Electrification Report, Full Year 1999, DOE
(3) Electricity Consumption by GridTable 3.1-3 shows the electric power consumption in each electric power network.
Despite a 1.1% decline in end-use consumption, the Luzon grid showed a positive growth in electricity consumption of 0.2%. This was so due to a higher systems loss in the area during the period. Conversely, all sectors in the Visayas grid posted an increase in electricity consumption, except for the industrial sector which experienced a drop of 13.9%, the highest among the grid. On the other hand, Mindanao grid’s total consumption declined by 1.5%, while losses, on the other hand, increased by 6.0%.
38

Table^^3^ElectricityConsum£tionJ)^Gri(^
GridFull Year Percent
Change%
Percent Share %
1999 1998 1999 1998
LUZON 31,813,147 31,754,636 0.18 100.00 100.00
Residential 9,323,351 9,446,119 A 1.30 29.31 29.75
Commercial 7,640,239 7,646,004 A0.08 24.02 24.08
Industrial 8,258,034 8,405,410 A 1.75 25.96 26.47
Transport 30,312 28,602 5.98 0.10 0.09
Others 447,122 470,016 A4.87 1.41 1.48
Total End-use 25,699,057 25,996,152 A1.14 80.78 81.87
Own-use 1,317,605 1,343,330 A1.91 4.14 4.23
Losses 4,796,484 4,415,155 8.64 15.08 13.90
VISAYAS 4,376,363 4,480,518 A 2.32 100.00 100.00
Residential 1,263,731 1,226,762 3.01 28.88 28.03
Commercial 449,154 445,134 0.90 10.26 10.17
Industrial 1,351,231 1,568,820 A13.87 30.88 35.85
Others 280,666 272,232 3.10 6.41 6.08
Total End-use 3,344,781 3,512,947 A4.79 76.43 78.40
Own-use 259,107 219,896 17.83 5.92 4.91
Losses 772,474 747,675 3.32 17.65 16.69
MINDANAO 5,262,385 5,342,950 A 1.51 100.00 100.00
Residential 1,258,388 1,263,168 A0.38 23.91 23.64
Commercial 603,638 605,584 A0.32 11.47 11.33
Industrial 2,459,586 2,568,694 A4.25 46.74 48.04
Others 188,143 191,768 A 1.89 3.58 3.59
Total End-use 4,509,756 4,629,214 A2.58 85.70 86.64
Own-use 24,935 27,201 A8.33 0.47 0.51
Losses 727,694 686,535 6.00 13.83 12.85
Note: Details may not add to total due to rounding off.Source: Power and Electrification Report, Full Year 1999, DOE
(4) MERALCO Franchise AreaTable 3.1-4 shows the power consumption in MERALCO franchise areas. Compared
to 1998, total electricity consumption in 1999 by the MERALCO franchise area registered a positive growth of 0.5%, with a total end-use of 0.3%. Most of the sectors hardly recorded an increase in electricity consumption with the commercial and industrial sector managing only a slight growth of 0.79 and 0.34%, respectively. The transport sector’s consumption grew by only 6%, while that of the residential sector declined by 0.3%.
39

TableSJ^Ejlectricit^Consumgtion^MeralcoFranchisef^
Meralco Franchise Full Year PercentChange
%
Percent Share %
1999 1998 1999 1998
Residential 7,329,164 7,348,400 A0.26 31.58 31.82
Commercial 6,896,181 6,841,898 0.79 29.71 29.63
Industrial 5,973,164 5,952,700 0.34 25.74 25.78
Transport 30,312 28,602 5.98 0.13 0.12
Others 136,145 134,800 1.00 0.59 0.58
Total End-use 20,364,966 20,306,400 0.29 87.75 87.94
Own-use 85,860 103,072 A16.70 0.37 0.45
Losses 2,757,857 2,681,629 2.84 11.88 11.61
Total 23,208,684 23,091,101 0.51 100.00 100.00
Note: Details may not add to total due to rounding off.Source: Power and Electrification Report, Full Year 1999, DOE
3.1.2 Electricity Generation
(1) Generation by GridTable 3.1-5 shows the total electric power generation in each electric power network.
As a result of the lower demand level in almost all sectors, induced by the slow recovery in the economy, the combined generation from the country’s three main grids fell by 0.3%. The positive growth of 0.2% registered by the Luzon grid was not enough to offset the reduction in the generation of the Visayas and Mindanao grids of 2.3% and 1.5%, respectively.
Table 3.1-5 Gross Generation by Grid (In Mega Watt-hours, MWh)
Grid Full Year PercentChange
%
Percent Share %
1999 1998 1999 1998
Luzon 31,813,147 31,754,636 0.18 76.75 76.37
Visayas 4,376,363 4,480,518 A2.32 10.56 10.78
Mindanao 5,262,385 5,342,950 A1.51 12.70 12.85
Total 41,451,896 41,578,104 A0.30 100.00 100.00
Note: Details may not add to total due to rounding off.Source: Power and Electrification Report, Full Year 1999, DOE
(2) Generation by Plant TypeTable 3.1-6 and Fig. 3.1-1 show the electric power generation at each plant type. Oil-
based generation still dominates the power generation mix with a share of 29.7% of the total. The decline by 14% from the 1998 level can be attributed to the 788 MW of oil-based generating plants that were retired during the year. This reflects the country’s lesser dependency on imported oil. On the other hand, coal, geothermal and hydro plants registered an increase in their respective generation by 13.8%, 18.9% and 54.6%, respectively. Accordingly, share of fuels in the energy mix increased to 25.8% for coal, 25.6% for geothermal, and 18.9% for hydro.
40
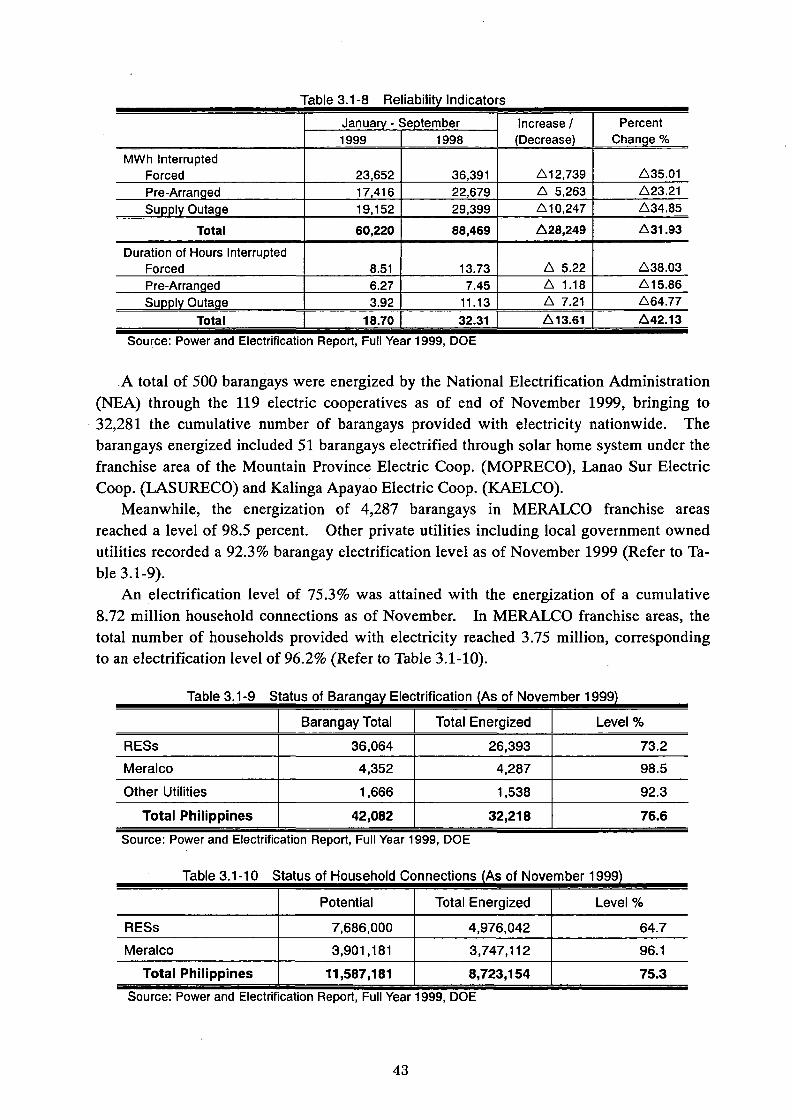
Table 3.1-8 Reliability IndicatorsJanuary - September Increase / Percent1999 1998 (Decrease) Change %
MWh InterruptedForced 23,652 36,391 A12,739 A35.01
Pre-Arranged 17,416 22,679 A 5,263 A23.21
Supply Outage 19,152 29,399 A10.247 A34.85
Total 60,220 88,469 A28.249 A31.93
Duration of Hours Interrupted Forced 8.51 13.73 A 5.22 A38.03
Pre-Arranged 6.27 7.45 A 1.18 A15.86Supply Outage 3.92 11.13 A 7.21 A64.77
Total 18.70 32.31 A13.61 A42.13
Source: Power and Electrification Report, Full Year 1999, DOE
A total of 500 barangays were energized by the National Electrification Administration (NEA) through the 119 electric cooperatives as of end of November 1999, bringing to 32,281 the cumulative number of barangays provided with electricity nationwide. The barangays energized included 51 barangays electrified through solar home system under the franchise area of the Mountain Province Electric Coop. (MOPRECO), Lanao Sur Electric Coop. (LASURECO) and Kalinga Apayao Electric Coop. (KAELCO).
Meanwhile, the energization of 4,287 barangays in MERALCO franchise areas reached a level of 98.5 percent. Other private utilities including local government owned utilities recorded a 92.3% barangay electrification level as of November 1999 (Refer to Table 3.1-9).
An electrification level of 75.3% was attained with the energization of a cumulative 8.72 million household connections as of November. In MERALCO franchise areas, the total number of households provided with electricity reached 3.75 million, corresponding to an electrification level of 96.2% (Refer to Table 3.1-10).
Table 3.1-9 Status of Barangay Electrification (As of November 1999)
Barangay Total Total Energized Level %
RESs 36,064 26,393 73.2Meralco 4,352 4,287 98.5
Other Utilities 1,666 1,538 92.3
Total Philippines 42,082 32,218 76.6
Source: Power and Electrification Report, Full Year 1999, DOE
Table>34Ji0^tatusof^louseholdjGonnectionsJAsBOfBNovembeM999^
Potential Total Energized Level %
RESs 7,686,000 4,976,042 64.7Meralco 3,901,181 3,747,112 96.1
Total Philippines 11,587,181 8,723,154 75.3Source: Power and Electrification Report, Full Year 1999, DOE
43

(2) Supply
a. Generation Expansion PlanTable 3.1-12 shows the plan of new installation of power plants. A total of 9,875 MW
of additional capacity will be needed over the next ten years to meet the long-term growth in electricity demand. Realization of the continuity and reliability of power supply can only be ensured once the link between the Luzon and Visayas grid are fully completed and integrated with the Mindanao grid.
Of the total capacity requirement, 5,255 MW are committed projects (i.e., under construction or have been awarded contracts for development) that are mostly located in Luzon. These include the 1,000 MW First Gas Philippines Corporation (FGPC) natural gas- fired plant and the 470 MW Quezon coal power plant which are contracted by MERALCO and are scheduled for commissioning by 2000.
Commissioning of the power projects outlined in Philippine Energy Plan of 1999 will push through, except for the 300-MW San Pascual Cogen which was deferred to a later year (from 2001 to 2003) and the 500-MW San Lorenzo natural gas which was advanced to an earlier year (from 2003 to 2003). Contracts for the development of four hydropower projects (totaling 650 MW) in Mindanao which were all under the bidding process in last year's PDP have already been awarded by NPC.
The balance of 4,620 MW represents the uncommitted capacity requirement expected to be put-up under a liberalized power market. This indicative capacity requirement is expected to fill in the projected gap in capacity after 2005 which could be composed of 1,600 MW of baseload capacity, 1,170 MW of mid-range and 1,850 MW of peaking power plants.
One main issue in the outlook relates to the choice of a new generating capacity. In a restructured electricity environment, government will take a hands-off approach to generation planning and will allow the market to determine the quantity of generation needed, location, and type of technology that will be employed. Estimates of additional capacity requirement will still be provided by the DOE to meet the growing demand for electricity. It may still influence the choice of fuel by setting the appropriate policy guidelines in the development and utilization of energy resources. It will only enter the market to correct potential barriers of competition or to ensure compliance with environmental and other social policies. The DOE will continue to monitor generation diversity and fuel market supply risks to ensure the security of energy supply.
46

Table 3.1-12 Plan of New Installation of Power Plants
Power Plant Line-Up
Year LUZONGAP(MW) VISAYAS
GAP(MW) MINDANAO
GAP(MW) Total
2000 Sta. Rita Nat. Gas 1,000
1,680
Mauban Coal 470
Casecnan Hydro 140
Bakun A/C Hydro 70
2001 Bulacan Biomass 40 Peaking Plant 60 100
2002 llijan Nat. Gas
San Lorenzo Nat. Gas
1,200
500
Peaking Plant 20 *Baseload Plant 100
1,820
2003 San Pascual Cogen 300 Mambucal Geo
Peaking Plant
40
90
*Peaking Plant 50
390
2004 Kalayaan Hydro 300 Baseload Plant
Peaking Plant
100
50 450
2005 San Roque Hydro 345 Midrange Plant
Peaking Plant
50
140 535
2006 Peaking Plant 300 Baseload Plant
Peaking Plant
100
90
Mindanao Coal
Tagaloan Hydro
200
68 758
2007 Peaking Plant 300 Midrange Plant 100 Agus III Hydro 225
695Peaking Plant 70
2008 Baseload Plant 600 Peaking Plant 130 Puiangi V Hydro 225
1,555Midrange Plant 300
Peaking Plant 300
2009 Baseload Plant 600 Baseload Plant 100 Peaking Plant 50
1,802
Midrange Plant
Peaking Plant
600
150
Midrange Plant 120
50
Bulanog-Batang
Hydro Plant
132
Total 7,515 1,310 1,050 9,875
Legend: Committed Projects, Indicative Projects, Conditional (Depends on the demand of Jacinto Steel) Source: Draft DOE-PEP 2000
b. Plant Retirement ScheduleTable 3.1-13 shows the capacity of power generation for each primary energy, and Table
3.1-14 shows the schedule of stopping the power plants. Plant retirement schedule is one major consideration in determining additional capacity requirement. A total of 1,926 MW of aging plants, mostly oil-thermal power plants with an average life of more than 25 years, will be pulled out of the system in the next ten years.
Of the original schedule under the 1999 Philippine Energy Plan, retirement of Bataan 1, Manila 1 and Sucat 3-4 Thermal Power Plants were deferred to year 2000 due to a delay in the commissioning of critical delivery points in Manila.
47

Tabl^OJ^^^chedul^o^Stogging^he^owei^PlantsCumulative Installed Capacity, in MW
Installed Capacity (As of 1999)
Capacity Additions
ScheduledRetirement
Cumulative Installed Capacity
Oil-based 4,909 300 1,868 3,341Coal 3,200 470 55 3,615
Local 850 - 55 795Imported 2,350 670 3,020
Hydro 2,308 1,505 3,813Geothermal 1,955 40 1,995Natural Gas 3 2,700 3 2,700Biomass 40 40Others* - 4,620 4,620
Baseload 1,600 1,600Midrange 1,170 1,170Peaking 1,850 1,850Total 12,375 9,875 1,926 20,324
* Indicative capacity requirement Source: Draft DOE - PEP 2000
Table 3.1-14 Plant Retirement Schedule
Year Month Plant Name CAP (MW)2000 January Bataan 1 Thermal 75
Manila 1 Thermal 100Sucat 3-4 Thermal 500Sucat 1-2 Thermal 350
2001 January B Bohol Diesel I 222003 January Toledo Coal 552004 June Edison Global Diesel 58
January Panay Diesel l 372005 December Magellan Cogen 48
January Diesel Power Barges 128San Antonio Natural Gas 3
2006 January Bataan Gas Turbines 120Malaya Gas Turbines 90
2007 January Duracom Power Barge 1302009 January Hopewell Gas Turbine 210
Total 1,926
Source: Draft DOE - PEP 2000
With the imminent privatization of NPC, the decision of retiring some of the generating facilities will rest on the hands of the prospective investors or purchasers. Rehabilitation or re-powering of facilities might be taken into consideration instead of retirement as these require less activities and the facilities are already in place. With the above, it is foreseen that the net installed capacity for the national grid that will be entirely run by the private sector will reach 20,324 MW by 2009.
48

3.1.7 Mine-Mouth Power Plants
(1) Plans and Progress on the EstablishmentTable 3.1-15 shows the plan of construction of thermal power plants at coal min
ing sites. The projected coal-fired capacity addition projects are envisioned for mine-mouth power plants. However, under a re-structured power industry, the amount of generation, location and type of technology that will be employed will be left on the hands of the proponent. The current over-supply of power coupled with the inter-connection of the Luzon and Visayas grid to the Mindanao grid, as well as the entry of natural gas power plants by 2001 will affect the commissioning of these projects.
Table 3.1-15 Plan of Construction of Thermal Power Plants at Coal Mining Sites
Location CapacityMW Proponent Expected
Completion Year Status
1. Cagayan 300 DMWAI 2009 Indicative based on resource potential and projected demand
2. Isabela 300 PNOC 2007 Negotiating NAPOCOR for the power purchase agreement
3. Panay 100 - 2007 Indicative based on resource potential and projected demand
4. Zamboanga 150 Filsystem 2007 Negotiating with NAPOCOR for the power purchase agreement
5. Zamboanga 150 ■ 2008 Indicative based on resource potential and projected demand
DMWAI: D. M. Wenceslao & Associates, Inc., Filsystem: Private enterprises built on Philippine capital
Presently the only on-going mine-mouth plant is located at the Semirara coal mine which generates electric power mainly for its in-house facilities and for the general electricity demand of the island.
In Isabela, PNOC-EC has already completed Phase 1 confirmatory in-fill drilling of its Coal Operating Contract (COC) area and has validated the presence of an in-situ lignite resource of 42 million metric tons, sufficient to support a 150 MW power plant for 25 years. Although there is a huge amount of reserves in the area for a 300 MW (2 x 150 MW) mine-mouth power plant, the current capacity demand is only 150 MW. It is currently undergoing a Phase 2 drilling to further elevate the degree of confidence on mine feasibility to a bankable level and ultimately, for the conduct of an Integrated Mine Mouth Power Plant study. Presently PNOC has entered into a Memorandum of Agreement with Meralco to deliver 150 MW of electricity.
The Cagayan coal project has mineable reserves of 32.385 million metric tons and in- situ reserves of 38.1 million metric tons. D.M. Wenceslao & Associates, Inc. has already finished conducting the exploration stage. For future production conversion, Montan Consulting, Gmbh is currently conducting a feasibility study. A future plan includes putting up of a mine-mouth power plant.
The coal production in Zamboanga, which is currently being operated by Filsystems, is sold to PNOC. Part of its plan is to put up a mine-mouth power plant in the near future. As per existing agreement with PNOC, Filsystems has the option to buy back its coal production once the plan for putting-up a mine-mouth power comes underway.
50

(2) Mine DevelopmentThe expected commencement of the coal mining operations of PNOC/Taiwan Overseas-
Mining Operations Integrated Little Baguio Project and Filsystems/PNOC Lalat Coal Project, both located in Zamboanga, is expected to increase local coal production this year by 1,560,00 MT, a 331,212 MT (21%) increase from the 1999 production level. A large contribution will also come from the development of the Panian Coal Project of the Semirara Coal Corporation.
Mining efficiency is foreseen to improve through the application of the programmed ventilation simulation study of Philippine underground coalmines. Likewise, reduced accidents in coal mine is expected to increase mining efficiency. This could be accomplished by continuous promotion of safety in the local coal mining industry through the conduct of safety lectures and training among local coal operators and workers and mine safety inspections and audits.
Philippine coal reserves are expected to increase during the year with the conduct of semi-detailed geological mapping in Sarangani and Sultan Kudarat by geologists of the DOE, as well as the continuing coal exploration activities of PNOC in Isabela and of Axis Development Inc. in Southern Cotabato and Sultan Kudarat.
(3) Coal Development ProgramThe local coal industry is dying an instant death. The inability of local producers
to compete with low-priced and better quality imported coal, coupled with the poor geological condition and quality of local coal continuously besets the local industry. It is further weakened by the relaxation of the quantitative restrictions, and the reduction in tariff of imported coal from 10% to 7% starting year 2000.
This assailing problem led to the formulation of the Coal Development Program (CDP) with the aim of safeguarding the local industry through the following strategies.
• Provision for a ready market for local coal producers;• Improvement in supply and delivery infrastructure facilities;• Conduct of intensive and semi-detailed exploration activities especially in areas with
high potential for hosting mine-mouth power plants; and• Improvement of local coal mining system through the conduct of mine technol
ogy and safety training programs.
However, some of the proposed strategies outlined in the CDP are no longer consistent with the current policy thrust of the government which is geared towards liberalization and globalization. To address the incoherence in coal policy, the 2000 Philippine Energy Plan proposes policy reform for the sector. These proposed policy reforms have long been delayed since both the executive and legislative branches of the government agreed in principle to dovetail the said proposals in other policy programs awaiting legislative approval. Dovetailing the said proposals are necessary to ensure consistency and coherence among the various programs, strategies and policy thrust for the energy and other sectors. The finalization of the following legislative proposals will spell out the direction for the local coal industry:
51
3.2 Situation of Coal Utilization in Cement Industry
3.2.1 Present and Future Situation on the Use of Cement KilnsTriggered by the Asian financial crisis in 1997, the economy of the Philippines became
unstable. The influence was serious, and some plants and factories had to stop their operation. The cement industry also suffered the damages. The crisis occurred amid the period that most of the cement companies were in the implementation of long term of expansion and restructuring programs. As a result, the cost of paying the debt of overseas capital increased, and the domestic loan was under high interest rate. Adding to the economy crisis, the competition with newly appeared imported cement induced oversupply in the market. Thus, some cement plants entered their operation below the nominal production capacity. Consequently, five plants had to stop operation for some period.
(1) Capacities of Cement PlantsTable 3.2-1 shows the capacity of facilities in domestic cement companies. The
local cement industry in the country has a total of 42 cement kilns. The oldest kilns belong to Bacnotan Cement (now Union Cement, La Union Plant) and Rizal Cement. The former’s wet lines were mothballed since 1998, while the latter’s plant was on shutdown indefinitely for it no longer is efficient and competitive. The youngest kiln belongs to Apo Cement Corporation which showed a notable increase in clinker capacity. The plant’s output increased from 150,000 tons per year (tpy) in 1996 to 2.4 million tpy in 1999. Its cement refining capacity rose accordingly from 180,000 tpy to 2.88 million tpy. Apo Cement is now the second largest cement manufacturer in the country after the conversion its Line 1 from wet to dry process.
One of the most modern cement plant in the Philippine is Union Cement Corporation (formerly Hi-Cement Corporation, Bulacan Plant). In 1990, the plant undertook a Php 1.3 billion expansion project employing local engineering in collaboration with foreign experts like FL Smith and Asea Brown Boveri. The modernized plant started operating in December 1991 and, to date, has the distinction of having the biggest capacity at 2.46 and 2.95 million tpy of clinker and cement, respectively.
Alsons Cement Corporation is one of the biggest companies in Mindanao which produces Type I Portland and Pozzolan cement. This dry cement manufacturing plant had a rated capacity of 480,000 in 1995.
On February 1, 1996, the company started a plant expansion program and was commissioned in 1998. The new plant is now producing Portland cement at a capacity of 4,400 tpd. Presently, the cement plant has a rated capacity of 1.78 million tpy of clinker and 2.14 million tpy of cement.
Republic Cement Corporation started operating at an average of 10,000 bags per day, and is now the third largest cement manufacturer in Luzon. An entirely new and state of the art cement production line with a capacity of 3,300 tons of clinker per day has been installed. It has increased clinker production capacity by 950,000 tons, i.e., from 580,000 tpy in 1996 to 1.57 million tpy. Its cement production capacity rose from 696,000 tpy to 1.89 million tpy.
Davao Union Cement Corporation is the only cement manufacturing plant situated in Mindanao which underwent an expansion program in 1995. A new kiln (Line 3)
55
with a capacity of 3,500 tpd of Portland cement was constructed and completed in the latter part of 1996. Clinker production rose from 1.32 million tpy in 1996 to 1.74 million tpy in 2000, while cement production rose from 1.58 million tpy to 2.09 million tpy.
The last five years of the twentieth century was marked by extensive improvements to increase plant production and operating capacity. Except for Iligan, Pacific and Solid, all other cement manufacturers have increased their respected capacities. On the contrary, Rizal, Lloyds, Titan and Bacnotan (Bulacan plant) have been on shutdown indefinitely since 1998 due to a depressed market condition for cement.
(2) Projected Cement and Clinker CapacityTable 3.2-2 shows the production capacity and expansion plan of cement plants.
Clinker capacity of the industry has doubled over the past five years, from 11.8 million tons to 22.0 million tons, while the cement capacity climbed from 14.1 million tons to 26.4 million tons.
The local cement industry believes that modernizing their technology and processes will not only enhance quality and customer satisfaction but will also enable cement manufacturers to survive in the competitive local and global market.
Such drastic capacity increases and modernization programs entail substantial investment outlays. Philcemcor’s projected cement and clinker capacity for the year 2001 - 2004 show that cement manufacturers have no immediate plans for another round of expansion projects within the next five years. The completion of the industry’s capacity build up programs which started since 1992 coincided with the sudden decline in consumption, which resulted in a glut. The local cement industry suffered financial losses in 1999 because of low prices of cement products and high production costs, coupled with stronger competition. Overcapacity may also intensify the entrants of new players such as, Goodfound Cement Corporation and Lucky Star (Northern) Cement. Although cement manufacturers are optimistic in the eventual recovery of the industry, there will be no sharp recovery in selling prices due to a weaker peso, rising fuel prices and higher financing charges. This is in spite of widespread cost reduction programs, including the mothballing and closure of some plants.
(3) Production ProcessCement manufacturers use three types of production processes: dry, wet, and semi
dry. The dry process is more heat efficient and advanced, while the wet process is regarded as obsolete and inefficient.
In 1988, the dry process accounted for more than fifty percent of the kilns in the cement industry. After a decade and with the inclusion of additional eight more kilns by various cement companies, 55% had utilized the dry process, 31% had used the wet process, while the remaining 14% were semi-dry process. To date, 60% of the local cement industry is utilizing the dry process and 11.2% - the wet process. Apo Cement Corporation and Pacific Cement Corporation have switched from wet to dry line technology since 1998 (see Table 3.2-3).
With today’s tight competition, high cost of operation and cost cutting programs due to the lingering glut in the industry, all wet kilns have been temporarily mothballed as it is not profitable and competitive to operate them at this point in time.
56

TableS^aj^Jnstalled^Ca^acities^o^emen^Pla^ts^^Com^an^ggs^^^Un^^housancnbns^,
Company(Abbrevi
ated name)
| Kiln I Type of
I processAnnual Capacity
No. | Age Clinker Cement
1. Alsons Cement Corp(ACC)
1 28 Dry 582
1 Dry 1,200 2,138
2. Apo Cement Corp.(APO)
1 29 Dry 750 2,880
1 Dry 1,650
3. Union Cement Corp.(Formerly Bacnotan Cement Corp.)
a. La Union
b. Bulacan
(UCC)
1 6 Dry 720
1 46 Wet 93
1 37 Wet 93
1 33 Wet 114
1 29 Semi-Dry 234 1,505
4. Continental Operating Corp. (COC) 1 26 Dry 480
1 - Dry 990 1,764
5. Union Cement Corp.(Formerly Davao Union Cement Corp)
(UCC) 1 16 Dry 533
1 2 Dry 1,050
1 30 Wet 159 2,091
6. Fortune Cement Corp. (FCC) 1 27 Dry 900
1 Dry 360 1,512
7. FR Cement Corp. (FR) 1 - Dry 990
1 34 Semi-Dry 87
1 34 Semi-Dry 93
1 32 Semi-Dry 360 1,836
8. Grand Cement Manufacturing Corp. (GCMC) Dry 840 1,008
9 Union Cement Corp. (Formerly Hi Cement Corp.) (UCC) 1 30 Dry 810
1 2 Dry 1,650 2.952
10. Lloyds Richfield Industrial Corp. (LIRC) 1 40 Semi-Dry 127.5
1 34 Semi-Dry 127.5
1 30 Wet 336 709
11. Mindanao Portland Cement Corp. (MPCC) 37 Dry 450 540
12. Northern Cement Corp. (NCC) 1 28 Dry 480
1 28 Dry 480 1,152
13. Pacific Cement Co., Inc. (PCCI) 33 Dry 180 216
14. Republic Cement Corp. (RCC) 1 Dry 127.5
1 Dry 127.5
1 Dry 330
1 Dry 990 1,890
15. Rizal Cement Co., Inc. (RCCI) 1 44 Wet 114
1 40 Wet 111
1 34 Wet 150 450
16. Solid Cement Corp. (SCC) 1 6 Dry 990
1 29 Wet 435
1 32 Wet 435 2,232
17. Iligan Cement Corp. (ICC) 27 Dry 465 556
18. Titan Cement Manufacturing Corp. (TCMC) 28 Wet 378 464
19. Limay Grinding Mill Corp. (LGMC) - - 475
Total | 42 21,572 | 26,362
Source: PHILCEMCO
57

Table 3^2 PhiliggineCement^anufactures Corgoration Cement P^Actual Projected Capacity Planned Projected Capacity
1996 1997 1998 1999 2000 2001-2004Clinker Cement Clinker Cement Clinker Cement Clinker Cement Clinker Cement Clinker Cement
1. Existing Cement PlantA. LUZON
1. Bacnotan (a) 1,220 1,464 1,200 1,400 1,254 1,505 1,254 1,505 1,254 1,505 1,254 1,5052. Northern 960 1,152 930 1,116 960 1,152 960 1,162 960 1,152 960 1,152
3. Limay (b) - - - - 396 475 396 475 396 475 396 4754. Continental 770 924 1,520 1,824 1,470 1,764 1,470 1,764 1,470 1.764 1,470 1,7645. Hi Cement 810 972 2,310 2,772 2,460 2,952 2,460 2,952 2,460 2,952 2,460 2,952
6. Republic 580 696 1,585 1,902 1,575 1,890 1,575 1,880 1,575 1,890 1,575 1,8907. FR 560 672 1,390 1,668 1,530 1,836 1,530 1,836 1,530 1,836 1,530 1,836
8. Solid 1,680 2,016 1,725 2,070 1,860 2,232 1,860 2,232 1,860 2,232 1,860 2,2329. Rizal 370 444 360 432 375 450 375 450 375 450 375 45010. Titan 340 408 395 474 378 454 378 454 378 454 378 454
11. Fortune 630 756 720 864 1,260 1,512 1,260 1,512 1,260 1,512 1,260 1,512Sub-Total 7,920 9,504 12,135 14,562 13,518 16,222 13,518 16,222 13,518 16,222 13,518 16,222
B. VISAYAS-MINDANAO Area 12. Apo 150 180 150 180 1,800 2,160 2,400 2,880 2,400 2,880 2,400 2,880
13. Grand 600 720 600 720 840 1,008 840 1,008 840 1,008 840 1,00814. Lloyds 500 600 500 600 591 709 591 709 591 709 591 70915. Iligan 450 540 470 564 465 558 465 568 465 558 465 558
16. Mindanao 150 180 340 408 450 540 450 540 450 540 450 54017. Pacific 210 252 185 222 180 216 180 216 180 216 180 21618. Alsons 480 576 570 684 1,782 2,138 1,782 2,138 1,782 2,138 1,782 2,138
1,320 1,584 1,680 2,016 1,742 2,091 1,742 2,081 1,742 2,091 1,742 2,091Sub-Total 3,860 4,632 4,495 5,394 7,850 9,240 8,450 10,140 8,450 10,140 8,450 10,140
Total 11,780 14,136 16,630 19,956 21,368 25,642 21,968 26,362 21,968 26,362 21,968 26,362II. New Cement Plant Announced
to be Set Up1. Lucky Star (Northern) - - - - - - - - - - 1,500 1,8002. Goodfound Group 350 420 400 480
Grand Total 11,780 14,136 16,630 19,956 21,368 25,642 21,968 26,362 22,318 26,782 23,868 23,642
cn00
Notes: Clinker to cement conversion, Add 20% allowance for gypsum and other additivesa) La Union and Bulacan Plantsb) Grinding Mill, grinding equivalent of cement milling capacity. Source: PHILCEMCOR

Table 3.2-3 Changes in Philippine Cement Plants
1988 2000
Number of Kilns 32.0 42.0
Type of Process:
Dry 13.0 25.0
Semi-Dry 6.0 6.0
Wet 13.0 11.0
Average Age of Kilns 24.0 23.6
Clinker Capacity (In Million Tons) 7.4 22.4
Cement Capacity (In Million Tons) 9.6 26.8
(4) Future Situation on the Use of Cement KilnsThe outbreak of the Asian Financial Crisis had struck at a time (July 1997) when ce
ment companies were in the midst of long term expansion in anticipation of a continued economic upswing. This resulted in a drastic increase in financing costs for foreign denominated debts, as well as, higher interest rates from local loans.
In the latter part of 1998 and in the early months of 1999, a spate of foreign buy- ins changed the industry’s ownership profile. International cement companies came in and provided the advantage of long term investment at a time when several multi-national companies were pulling out.
Resulting from this, Alsons, Hi-Cement, Davao Union and Bacnotan now belong to Holderbank of Switzerland. Except for Alsons, the three companies have merged and will now operate under the name of Union Cement Corporation. JG-Apo and Solid-Rizal Cement, on the other hand, is now owned by Cemex of Mexico, while Fortune, Iligan, Mindanao and Republic Cement has been bought by Blue Circle of the United Kingdom. FR- Lloyds and Continental (Continental Operating Corporation) Cement now belong to La Far- ge of France (refer to Table 3.2-4).
These foreign companies have invested about US 1.7 billion dollars and for some persons in the cement industry, merging with these foreign companies meant survival.
59

Table 3.2-4 A Changing of Ownership Structure
1989 1999Company / Group Clinker Capacity Company / Group Clinker Capacity
OPhinma OHolderbankBacnotan 231 Alsons 1,782Hi-Cement 409 Hi-Cement 2,460Davao Union 455 Davao 1,742
Bacnotan 1,254OAlcantaraAlsons 429 O Cemexlligan 399 JG-Apo 2,400
Solid-Rizal 2,235OMadrigal-GokongweiRizal 404 OBIue CircleSolid 537 Fortune 1,260Apo 190 Mindanao 450
Republic 1,575OSeacem/Lim lligan 465FR Cement 515Lloyds - OLa Farge
FR-Lloyds 2,121OSy Continental 1,470Mindanao 128Fortune Cement 309
OOthers 2,119 OOthers 2,358
Total 6,125 Total 21,572
Source: University of Asia and the Pacific
The Cement Industry will continue to experience- capacity underutilization, even as it has doubled its operating capacity over the past five years and has successfully restructured its operations and has expanded capacity by tapping the latest processing technologies. Considering that the Cement Industry is highly dependent on construction demand whichpeaks during dry months in the Philippines, infrastructure development would not be able to fully utilize the overcapacity of the Philippine Cement Industry. Another factor that may reduce the industry’s competitiveness is the high cost of electricity. Since power is the highest component in cement manufacturing, some industry players are now considering generating their own energy requirements in the future.
With the rising cost of fuel, manufacturers will continue to shutdown small and inefficient plants so they can focus on new production lines which are more cost efficient. Others will find it necessary to convert their wet process to dry since the latter is more heat- efficient.
(5) Expansions / New Cement PlantsIn anticipation of the country’s fast economic recovery and with President Estrada’s
Mass Housing Program as priority project, coupled with the projected improvement in the construction industry and the drive by local cement manufacturers for competitive advantage, cement plants have been constantly modernizing their technology either thru reha
60

bilitation, modernization, modification or introduction of new technologies with the objective of:
a. upgrading facilities in order to improve operating efficienciesb. improve product quality and cost of competitiveness of existing cement plants, andc. ensure adequate supply of quality cement in the domestic market at reasonable prices
Northern Cement Corporation (NCC), the only major local player in the industry without a foreign partner, is undertaking the installation of a third production line. Line #3 is expected to increase the plant’s annual capacity by an additional 1.5 million metric tons, equivalent to about 37 million bags of cement per year. The new line will be fully commissioned after 24 months of estimated construction period and will start anytime between October to December 2000.
In 1994, Pacific Cement Company (PACEMCO) started a rehabilitation program, followed by an upgrading for the conversion of its process from wet to dry. In the next few years, PACEMCO will embark on an expansion and modernization program that would entail the addition of two more dry process manufacturing lines to its existing line.
The newest player to tnter the local cement industry is Good Found Cement Corporation (GFCC). GFCC is located in Palanog, Camalig, Albay and is presently owned by Taiwanese Nationals. Its holding company is Meridian Investment International. The cement plant will produce Portland Cement and Pozzolan Portland Cement with a combined rated capacity of 30,000 bags per day or 350,000 MT per year using the dry process. GFCC will be carrying the brand name MAYON.
3.2.2 Present Status of Coal Utilization in Cement Plants
(1) Historical Coal ConsumptionGovernment efforts to stimulate coal development, production and utilization began
during the first oil crisis in 1973. As part of its fuel diversification program, the government promoted the creation of a market for domestic coal. It mandated the conversion of bunker fueled cement plants to use coal.
To do this, the Philippines National Oil Corporation (PNOC) jointly with the Department of Trade and Industry (DTI) supplied domestic coal at a price not exceeding 65% of the bunker fuel price. At that moment, 17 cement plants among 18 of them successfully converted to the coal-firing system. The activity significantly increased the domestic coal consumption for the first time. However, only one plant continued to use bunker fuel.
Table 3.2-5 and Fig. 3.2-1 show the yearly trend of coal consumption. The cement sector was the major user of coal, accounting for as much as 70% of the total consumption in 1978. Eight years later, coal utilization by National Power Corporation’s (NPC) coal-fired power plants surpassed the consumption level by cement companies as it commissioned more coal-based generating plants. By 1999, NPC’s coal consumption accounted for 76% of the total coal demand while the share of cement companies was reduced to 20%.
61

their rated capacities. Given the scenario, cement companies continued to experience big losses due to a lower capacity utilization, coupled with a higher cost of production.
(2) Current State of Fuel Use in Cement PlantsCurrently, the country has nineteen (19) cement plants operating nationwide. Of the
total, two (2) are fueled by 100% bunker fuel (Continental and Mindanao Portland) and the rest are still into coal firing. However, five cement manufacturers have already ceased operation due to economic reasons. One of the five cement plants has continued operating by purchasing clinker from outside local sources.
The decline in coal utilization was also aggravated as four (4) cement plants supplemented its fuel requirements with petcoke (a by-product from petroleum distillation), by approximately 3.5% of its total requirement. Accordingly, petcoke is cheaper than coal. Majority of the cement plants are, however, not seriously considering petcoke as its sulfur content is high, causing clogging to the system. Moreover, cement plants are designed to allow for dual firing operation, either with bunker fuel or coal. Several cement plants alternately use bunker fuel or coal in their operation, whichever is cheaper and readily available.
While the cement industry is committed to give priority to use local coal, most of the cement plants are presently not designed to utilize low-rank coal. Only two companies are using a minimum volume of domestic coal blended with imported coal in their operation.
The cost of transporting limited volumes of locally produced coal from small mines using outloading facilities and shipment in small vessels to cement plants is much higher than bringing in large volumes of coal from foreign sources, using modern ouloading facilities and bigger vessels. Consequently, imported coal posted cheaper prices as compared with locally produced coal.
Further, in the cement industry, deliveries or inconsistent quality of local coal causes trouble to instrumentation and quality control personnel as utilizing it involves a perennial and constant adjustment of controls in order to achieve the desired clinker quality. Cement Plants require a consistent high-quality coal in order to achieve high quality and well-burnt or uniformly cooked clinker. Otherwise, some clinker will come out of the kiln uncooked and some are over-burned, as the required heat rate is not maintained with the use of varied heating value coal.
(3) Coal Supply and ImportCoal supply arrangements for cement companies operate simply and is done by their
own marketing arm. Accredited suppliers submit their sealed price offers for every purchase order issued by the company’s marketing arm. Accordingly, the most competitively priced bidder is awarded the deal. Presently, coal supply to cement companies is largely sourced from Australia, China and Indonesia either through direct importation or through coal traders like the Philippine National Oil Company - Coal Corporation (PNOC - CC), Asia Coal and others (refer to Table 3.2-6).
The Philippine energy sector has, in a manner, completed the structural cycle to respond to the immediate issue and needs of time. It started from a fully liberalized regime in the
63
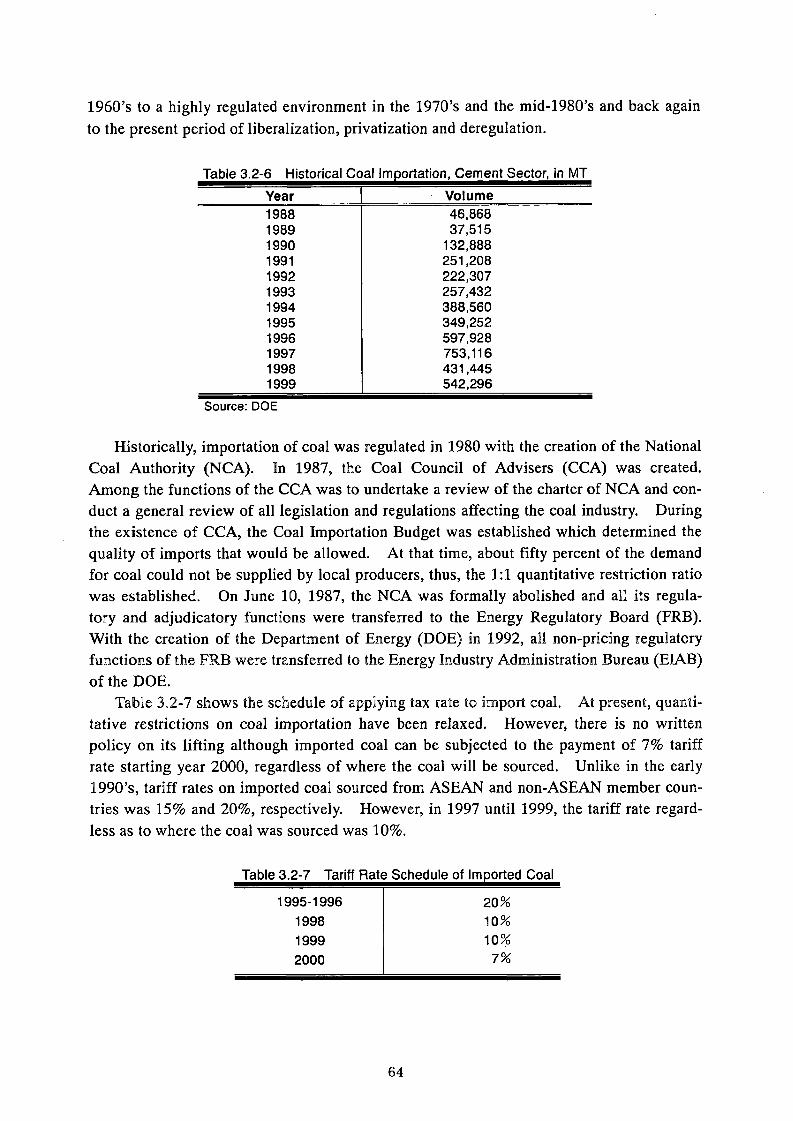
1960’s to a highly regulated environment in the 1970’s and the mid-1980's and back again to the present period of liberalization, privatization and deregulation.
Table 3.2-6 Historical Coal Importation, Cement Sector, in MTYear Volume1988 46,8681989 37,5151990 132,8881991 251,2081992 222,3071993 257,4321994 388,5601995 349,2521996 597,9281997 753,1161998 431,4451999 542,296
Source: DOE
Historically, importation of coal was regulated in 1980 with the creation of the National Coal Authority (NCA). In 1987, the Coal Council of Advisers (CCA) was created. Among the functions of the CCA was to undertake a review of the charter of NCA and conduct a general review of all legislation and regulations affecting the coal industry. During the existence of CCA, the Coal Importation Budget was established which determined the quality of imports that would be allowed. At that time, about fifty percent of the demand for coal could not be supplied by local producers, thus, the 1:1 quantitative restriction ratio was established. On June 10, 1987, the NCA was formally abolished and all its regulatory and adjudicatory functions were transferred to the Energy Regulatory Board (FRB). With the creation of the Department of Energy (DOE) In 1992, all non-pricing regulatory functions of the FRB were transferred to the Energy Industry Administration Bureau (EIAB) of the DOE.
Table 3.2-7 shows the schedule of applying tax rate to import coal. At present, quantitative restrictions on coal importation have been relaxed. However, there is no written policy on its lifting although imported coal can be subjected to the payment of 7% tariff rate starting year 2000, regardless of where the coal will be sourced. Unlike in the early 1990’s, tariff rates on imported coal sourced from ASEAN and non-ASEAN member countries was 15% and 20%, respectively. However, in 1997 until 1999, the tariff rate regardless as to where the coal was sourced was 10%.
Table 3.2-7 Tariff Rate Schedule of Imported Coal
1995-1996 20%1998 10%1999 10%2000 7%
64
With the advent of the Coal Import Liberalization, the cement industry could now easily acquire good quality coal at lower price, and there is an assurance that supply can be sustained by foreign producers. With this new policy, utilization of low rank coal by end- users will be further hampered in tandem with the depressed market condition of domestically produced coal.
In another development, the Philippine cement industry has undergone remarkable changes with the entry of foreign companies in the latter part of 1998 until the early months of 1999. Foreign companies led by Holderbank financiere Glarus of Switzerland, Mexico’s Cemex, Britain’s Blue Circle Industries Pty., of the United Kingdom, La Farge S.A. and a new entrant to the industry, the Goodfound Cement Corporation which is owned by Taiwanese nationals, is now dominating the Philippine cement industry by 90% while Filipino investors hold the remaining 10%.
These foreign companies will enhance the cement industry’s competitiveness and efficiency and sustained access to export markets, utilizing the industry’s excess capacity. Demand for cement products in the year 2000 is foreseen likely to be flat to slightly higher than in 1999. The cement market has shown improvement as prices began moving toward normal levels, although the upward climb has been erratic on a monthly basis. But, what could keep cement companies occupied this year is the expected internal reorganization and consolidation of cement companies with the entry of foreign players/investors.
3.2.3 Effective Use of Low-Rank Coals in Cement Kilns
(1) Coal DepositsPhilippine coal deposits are vast and dispersed throughout the archipelago and are gen
erally located far from industrial centres. Most are either of low quality and cannot be viably transported over long distances, or are located in complex geological environments such that most underground mines employ small-scale labor intensive methods.
Table 3.2-8 shows coal reserves at individual areas. As of end 1999, coal reserves were estimated at 291 million tons and the total coal reserve potential was estimated at 2.3 billion metric tons. The biggest coalfield, representing 45 percent of the proven reserves, is located in the island of Semirara in the eastern part of central Philippines. Lignite deposits in the Cagayan Valley, located in northeastern Luzon constitute 23% of the proven reserves.
While Philippine coal varies in rank from lignite to semi-anthracite, the bulk of the country’s coal deposits are of sub-bituminous rank and are therefore good only for steaming purposes. Coal quality can be judged by its properties, i.e., moisture content, volatile matter, ash, sulfur content and calorific value.
(2) Coal property
a. Water ContentThe moisture content of coal is important primarily for the slacking of coal on stor
age and on spontaneous combustion. Normally the moisture content of Philippine sub- bituminous coal varies from 7.70 to 25.60% and the cement industry requires coal with
65

moisture content varying from 3 to 12% (as received basis).The moisture content of coal affects both the grindability and the drying capacity of
the system. As a rule of thumb, a moisture increase from 1 to 3% decreases the capacity of the tube ball mill by about 45 to 50%, with an proportionate increase in specific energy consumption of about 10% for the same particle size. The Philippine cement plants prefer moisture content of not more than 12%. Coal with moisture content above 12% can not be dried sufficiently in conventional milling equipment. With moisture content below 12%, the moisture content of coal can be reduced to 1 to 1.5% by using air from the clinker cooler and kiln waste gas as heat sources. However, a completely dry coal is difficult to ignore. Moisture content of 1 to 1.5% in the pulverized coal promotes combustion. Likewise, a high moisture content increases thermal inertia of reacting species, shifts the flame away from the burner slightly, and reduces the flame temperature.
Tabl^^^^Regiona^oal Reserves^Unit^Thousandjons^As oj^1 DecembeM999ResourcePotential
PositiveReserves
ProbableReserves
In-SituReserves
MineableReserves
Cagayan Valley 336,000,000 68,483,800 53,180,000 103,937,133 88,346,563
Cebu (Central) 40,000,000 3,355,458 4,763,160 6,530,898 3,918,879
Cebu (Northern) 75,000,000 2,229,719 655,727 2,666,870 1,600,122
Cebu (Southern) 50,000,000 1,374,135 1,752,036 2,542,159 1,525,295
Davao 100,000,000 208,000 - 208,000 124,800
Masbate 2,500,000 74,994 - 74,994 44,996
Mindoro 100,000,000 1,310,641 198,000 1,442,641 865,585
Negros 4,500,000 1,233,827 1,213,387 2,042,752 1,225,651
Polilio, Batan & Catanduanes 17,000,000 5,145,399 1,604,675 6,215,182 3,729,109
Quezon 2,000,000 93,000 - 93,000 55,800
Samar 27,000,000 7,474,890 1,667,725 8,586,707 7,278,807
Semirara 550,000,000 126,403,434 43,820,358 155,617,006 132,274,455
Surigao 209,000,000 29,390,648 60,978,034 70,042,671 47,854,777
Zamboanga 45,000,000 34,755,922 5,984,679 38,745,708 23,247,425
Bukidnon 50,000,000
Maguindanao 108,000,000
Sarangani 120,000,000
South Cotabato 230,400,000
Sultan Kudarat 300,300,000
Total (Hundred tons) 2,366.7 291.5 175.8 398.7 312.1
Source: DOE - CNMD Notes)
*1) Positive reserves are those sufficiently explored by drilling and/or tunneling to warrant inclusion in a company’s five- year development/production program.Drillholes are generally spaced not more than 200 meters apart and in highly disturbed areas like Cebu, holes are not more than 100 meters apart.
*2) Provable reserves are those also explored by drilling and/or tunneling, but still need confirmatory drilling and/or tunneling. Drillholes are generally spaced at 200 to 400 meters apart except in fairly undisturbed areas like Cagayan.
*3) Mineable reserves are computed by multiplying the total in-situ reserves (positive reserves + 2/3 probable reserves ) by a mining recovery factor of 60% for underground areas and 85% for open pit areas.
*4) Except for Cagayan, Semirara, part of Samar and part of Surigao, all other areas are treated as underground areas.
b. Volatile MatterThe volatile matter of Philippine sub-bituminous coal varies from 30.60 to 40.60%.
However, the cement industry normally use coal of 25 to 42% volatile matter (as received basis).
66

A high volatile coal allows easy ignition and maintenance of stable combustion conditions without excessive coal fines. The volatile rich coal has high porosity offering a larger surface area for combustion hence, requiring a lower ignition temperature than a low volatile coal. Thus, coal with high volatile matter (more than 30%) decomposes at high speed and promotes fast combustion through a short section of the rotary kiln, generating a short flame. Low volatile coals (less than 20%) generates a long flame when burned in a rotary kiln.
c. AshThe ash content of Philippine coal varies from 5.30 to 24.60% while the cement indus
try typically utilizes coal having 10 to 18% ash (as received basis).Depending upon the kiln type, ash absorption rate ranges from 30 to 100%. An in
crease in coal ash content lowers the combustion characteristics of coal; consequently it requires finer grinding for good combustion. As reported by several plants, the basic problem related to ash content were problems on ash ring formation and slagging on the kiln lining.
d. SulfurTypical sulfur content of Philippine sub-bituminous coal varies from 0.50 to 3.60%. Majority of the cement plants prefer to use coal with sulfur content ranging from 0.72 to 1.5% (as received basis). Higher sulfur content in coal causes corrosion on refractories and thus, leads to problems in the system.
e. Calorific valueThe most important property of coal is the calorific value. Philippine sub-
bituminous coal has a calorific value ranging from 7,000 to 11,500 Btu/lb (3,890 to 6,390 kcal/kg). All cement plants in the country are currently utilizing coal with a heating value ranging from 9,881 to 12,419 Btu/lb (5,490 to 6,900 kcal/kg) (as received basis).
Coal with a lower calorific value increases the specific heat consumption for clinker burning while decreasing the specific kiln throughput. Likewise, erratic heating value of coal causes unstable kiln operation due to unstable flame conditions. The kiln when subjected to changes in temperature may cause clinker coating to collapse along with the brick lining.
The mismatch in local coal properties vis-a-vis the required quality specifications of cement plants has forced cement companies to import coal from 1983 onwards. Moreover, lack of sustainability of local coal supply and lower price of imported coal are impetus for the cement companies to consider importation.
At the start, the practice of cement plants is to blend local coal with imported coal in order to attain homogeneity on calorific value. Since majority of the plants have no sophisticated blending equipment, this has often resulted to inconsistent quality of coal feed. During firing with blended coal, low quality coal predominates along the process which consequently affects clinker quality and creates operational problems.
67

3.2.4 Plans by Cement Plants to Utilize Coal AshThe amount of ash introduced into a kiln depends both on the ash content of
the coal and heat consumption of the kiln. Under normal circumstances, about 60 to 80% of the ash gets absorbed in the clinker and the rest is lost with the dust.
The dust recovered in many dust collectors of modern cement plants is normally all returned to the process and thus constitutes no waste.
The amount of ash resulting from the combustion of coal is important in assessing its suitability for utilization. Most cement plants are using 100% coal in their operation and the quality of coal utilized has an ash content of about 12%. Thus, when coal is burned, the ash in the coal is automatically combined with the clinker.
Coal ash is a supply source substituting for silica. Silica is one of the raw materials added for manufacturing clinker. Considering that the raw materials for clinker production have various substituents abundant and available in the country, the preferential position of coal ash use is low.
In the past, Grand Cement has shown interest in utilizing ash produced by the Salcon power plant. It conducted a study and sampled the ash from both Salcon and Toledo power plants. However, based on the result of the analysis, the ash contained high chloride and carbon content. Presence of these chemicals in the clinker will affect the curing time and strength of cement produced. Moreover, the ash had no consistent quality. Aside from its chemical composition, it was not economical to haul the ash to the cement plant since its volume requirement was too small.
The typical practice of ash handling and disposal by Salcon power plant is to transport the ash collected from the different parts of the plant by pipeline using seawater to the ash pond. Sea sand is mixed with the fly ash due to the high suction pressure of the seawater.
Recently, Grand Cement is planning to use fly ash in the raw feed, however, it is restricted with the cost of fly ash which is very expensive. The system of the plant is so flexible that it can accommodate to use both fly and bottom ash provided the ash quality is consistent. A proposal to construct a 98 MW power plant within the cement plant is an idea being considered. The construction was shelved due to the economic crisis. In addition, the National Power Corporation-Salcon, who will be buying the electricity, has excess power supply resulting to the entry of the Independent Power Producers. Evident to this, Unit I Thermal Power Plant of NPC-Salcon had to be put on economic shutdown.
In the case of NPC-Calaca, a portion of the ash generated by its two (2) units is collected by Pozzolanic Philippines and the remaining is mixed with seawater at the ash tank and discharged by high pressure pumps to its sixty seven (67) hectare ash pond. Seawater then passes thru a process of sedimentation where it is separated and discharged to the seashore.
Fly ash price from NPC-Calaca is based on a long-term contract of Php 50 per metric ton. However, the base price changes depending on the increase in price of cement in the market. In addition, the fly ash produced by this power plant is subjected to quality control, and only those with properties that suit the specification of Pozzolanic Philippines are taken. Additional fly ash requirements of Pozzolanic Philippines is purchased from the Masinloc Power Plant at a price of Php 75 per metric ton. In Masinloc, the bottom ash is transported to a silo via a chain conveyor and the moistened ash is transported by truck to
68

the ash disposal area. Fly ash from hoppers of economizers, air heaters and the electrostatic precipitator is extracted by vacuum pumps into the fly ash silo and is transported to the ash disposal area by trucks. NPC-Calaca and Toledo Power are using Semirara coal blended with imported coal. Some local coals, notably Semirara, have low ash fusion temperatures. This is due to the presence of salt in the coal, as mining operation is done adjacent to the sea. The ash fusion temperature of Semirara ranges between 1,211 to 1,337 °C, so the ash is normally in the fused or molten state at flame temperature. As a result it causes fouling and slagging in the boiler. Since the fused ash is hard to remove from the boiler tubes, it would mean lower heat transfer efficiency and more costly maintenance and longer downtime.
To date, Pozzolanic Philippines is the sole user and buyer of fly ash from NPC- Calaca and Masinloc. The fly ash produced by Pagbilao and Sual has no buyer, though bidding for the contract price is ongoing. Pozzolanic Philippines is the lone bidder for Pagbilao while Sual has a total of eight (8) bidders, including Alsons and Hi-Cement. The type of fly ash that the Pagbilao plant produces can not be used for cement manufacturing as the power plant employs a wet ash process. Cement plants will entail an additional cost if the wet ash is used in their raw feed.
Majority of the cement plants in the country are looking into the possibility of using coal ash tin their raw mix. Davao Cement has already made a study on the quality of fly ash to match the specification of its clinker quality. The study indicated a positive result, however, the issue of price and supply were of primary concern. There is also an ongoing study by the Phinma group where the price of fly ash is at focus. The company is looking for cheaper and reliable sources of “concrete grade ash” and the Phinma group is currently negotiating with qualified NPC coal fired power plants on the price of the coal ash.
All cement plants are showing interest in using coal ash. The decision to pursue utilization of coal ash is very much dependent on its price. The quality of the coal ash is also another issue considering that power plants are using different sources and properties of coal. Thus, there will be no guarantee with regard to the consistency of the quality of fly ash that they will be buying. Moreover, the sustainability of supply is another consideration since bulk of the coal ash produced by the existing coal-fired power plants are already used by Pozzolanic Philippines. Finally, cement companies have no assurance that cement with fly ash will be accepted in the market.
69

3.2.5 APO Cement Corporation
(1) Overview of the Cement PlantNo. 1 kiln is a newly installed dry type kiln having a production capacity of 5,500 t/d,
which was made by Polyjuce Inc. The kiln began its operation in 1997. No. 2 kiln is an increased capacity of 2,500 t/d modifying an old wet type kiln having a capacity of 500 t/d. The plant adopted an ILC system preheater made by F.L.Smith Inc., and began the operation in 1999 with a production capacity of 270,000 ton-cli/y (as 330 days operation in a year). The company entered financial cooperation with Cemex Inc. in 1999. The company gained 100% stock of Triple Dime Inc. which had acquired 30% stock of APO Cement Inc., and also obtained stocks of other companies.
(2) Applied coal grades and their propertiesThe plant uses only coal as the fuel, accounting for 90% of import coal (most of
them are Indonesian coal), and 10% of domestic coal. They use the coal mixing high volatile ones (36% or more of volatile matter content) with low volatile ones. They plan to use also petrocoke in the near future. The coal consumption in FY 1998 was 12,000 t/m for two kilns, corresponding to about 180 thousand tons a year. Average properties of the used coal are the following.
Calorific value (kcal/kg) Price (1,000 peso/t-coal)
Imported coal 6,000 1,000
Domestic coal 5,700 1,200
(3) Operational Status of KilnFig. 3.2-2 shows a limestone mining site. Limestone is pulverized at the mining site
before delivered to the plant. The limestone is soft, which suggests that the limestonewas significantly weathered.
Fig. 3.2-3 shows total view of the No. 1 preheater, Fig. 3.2-4 shows the No. 2 rotary kiln. The oxygen content in the preheater exhaust gas is 3 to 5%, the carbon monoxide content is 0%, and NOx content is not determined. The NOx meter will be mounted by March 2000 to begin continuous monitoring. The temperature of preheater exhaust gas is in a range of from 370 to 390 °C, which is a reasonable level for this type of unitThe total power consumption of the plant is 38 MW. To that power consumption level, the plant introduced a diesel power generator of 66 MW (11 MW x 6 units). Currently, no electricity is purchased. The purchasing unit price of power from NPC is 3.3 peso/kW. Since the plant has a surplus power, the plant has notified the intention to join IPP to NPC. If NPC approved the offer, the plant will supply power to the NPC line. Since free aid for the waste heat recovery system from NEDO is expected, they study the waste heat power generation of 5,000 kW. For the turbine generator, they have already received an estimation from Takuma Co., Ltd.
70

3.2.6 Grand Cement Manufacturing Corporation
(1) Overview of the Cement PlantAt the introduction, a dry kiln made in the U.S. having 840 t/d of capacity. In 1993, the
kiln was modified to a four stage preheater to increase the capacity to 2,800 t/d.During the two years of 1998 and 1999, the demand stayed stagnant, and the market was
in excessive production status. However, the industry expects the recovery of market during and after 2000. Most of the cement companies in the Philippines entered financial cooperation with foreign capital firms. The Grand Cement Inc. is one of the independent firms in the Philippines, (other firms of this group are Pacific Cement Inc. and Nothern Cement Inc.) The company does not intend to enter financial cooperation with foreign capital firms. Main demand is limited to Visayan and periphery area of Cebu, (central area). Once the demand increased and the supply became short in the whole area of the Philippines, Grand Cement Inc. supplied the products to south (Davao) and to north (Manila) covering the whole Philippine islands. At present, however, the company supplies the products only to the Visayan area and periphery districts. Since Manila has its own supply source, and the plant is not required to supply products, thus the sales to Manila stopped since 1997.
The market price of cement is in a decreasing trend. Similar with the condition of Japan, the cement production can be profitable if the demand is high. To gain profit, a part of the production facilities should be modified, and an private power generator should be introduced to reduce cost. Existing facility is not known weather thermal power generation or diesel power generator. They study the introduction of private power generation.
(2) Applied Coal Grades and PropertiesThe plant uses only coal as the fuel. They store coal in open yard, which induces prob
lems in rain to increase the water content of coal, which then raises the clogging problem. Ninety percent of the coal is imported coal, mostly come from Indonesia. Although 10% of the coal is domestic coal, they use the domestic coal umwantedly conforming to a domestic agreement to mix them with imported coal. The domestic coal shows significant fluctuations of calorific value, and they receive the domestic coal at 7,500 ton/lot at an in-house berth, where they mix the coal with imported coal. Average consumption of coal is 9,000 t/m, or about 100,000 t/y. Average properties of the used coal are the following.
Calorific value (kcal/kg) Volatile matter content (%)
Imported coal 6,500 - 6,800 40 - 44
Domestic coal 5,800 - 6,200 35 - 38
(3) Operational status of kilnFig. 3.2-7 shows the total view of the preheater. At the full load operation of 2,800 t/d,
the operating days are about 300 days a year. The oxygen content in the preheater exhaust gas is significantly high, max. 5%, and the carbon oxide content is also high, 2%. The thermal unit requirement is 950 - 970 kcal/kg-cil, which is significantly high for the four stage preheater. They say that the target combusting point temperature is 950 - 1,000
74

°C. Actually, a recorder in the central operation room gave that degree of temperatures, which are significantly low as the target temperature.
The day of the plant visit was non-scheduled shut down because of peeled off of bricks in the kiln. They say that deformation of kiln is large, thus the accidents of brickpeeling supposedly frequently occur. Although there occurs coating adhesion on the surface of preheater rising duct, the deposit is removed by plaster.
The water content of limestone is high, about 13%. The contained water is dried by the preheater exhaust gas. Limestone is pulverized at the production site before delivered to the plant. The limestone is soft, which suggests that the limestone was significantly weathered. As other raw materials, they use silica rock and iron raw materials. The raw materials mill is a vertical type mill.
The raw materials are charged to the kiln through a blending silo of aeration type and a 9,000 ton storage silo. The coal mill is a 15 t/h Raymond Ball mill.
The operation of the plant is given by the centralized control at the central operation room covering from the raw materials system to the finishing system. All the operational switches, indicators, and recorders are arranged on the panel, showing delayed modernizing design. As for the total power consumption, the plant is investigating the introduction of a private power generation unit having a capacity of around 45 MW***. The type is, however, not decided whether thermal power generation or diesel power generation. Nevertheless, they have already completed the documentation procedure for application to governmental organizations. Owing to the worsened economic condition in the country, they are in waiting mode at least at present.
For the power purchasing from NPC, the unit purchasing price is 2.6 peso/kWh during daytime and at night. Introduction of private power generator will significantly reduce the cost. However, even when the coal fired thermal power generation is adopted, they will think little about the treatment of generating ash. The construction site for the power plant is near the coast. A berth and adjacent stock yard for coal and other materials are planed to construct. Currently, groundwater is used as the process cooling water. If a 300 t/h cooling tower is installed, the cooling water for the power plant will be fully covered by the current groundwater supply rate.
The executives of the plant said that, if they invest for the facilities, the priority should be given to the introduction of automated analyzers in the raw materials mill system, the large modification of preheater system, the modification of coolers, and the extension of finish mill.
Fig. 3.2-8 shows the cement loading site.
75
(4) Effective Use of Coal AshIn the past, the plant tested coal ash generated from nearby thermal power plant. At
present, however, the plant does not use coal ash. The instruction of NPC to each power plant may not be adequate. The quality of ash generated from individual power plants is not on the same level, and the ash leaves 20% or more of calorific value unused in some cases owing to poor combustion state at thermal power plant, which surplus calorific value induces disturbance to kiln. Although the coal for cement is preliminarily mixed, the coal for thermal power plants is not mixed in advance to assure uniform quality. As far as the state continues in the future, the plant does not have a positive stance to use the coal ash. However, the plant studies the coal fired thermal power plant, so if the ash quality is improved, it will be applicable as a substitute for silica.
(5) ProblemsCarbon oxide content in the preheater exhaust gas is very high, and the thermal unit re
quirement is significantly high for the four stage preheater. Also in the existing facility, the heat exchange efficiency at the preheater is poor, and the calcination furnace supposedly gives low combustion efficiency. The improvement of heat exchange rate at preheater including individual cyclones and the improvement of combustion efficiency at the calcining furnace should be performed. Since the oxygen content in the preheater exhaust gas is high, the leak air rate at preheater system and the burner primary air rate are expected high. Consequently, prevention of air leak and the improvement of burner efficiency should be done to reduce the air rate.
77

3.2.8 Solid Cement Corporation
(1) Overview of the PlantIn 1964, Manidoke Mining Inc. gained the mining right of the present limestone mine.
In 1967, Allied Cement Inc. was organized responding to the cement demand at that time. After that, however, the cement demand extremely fell, so that Manidoke Mining Inc. sold Allied Cement Inc. to Materikal Family which is a financial group. During a period of from 1967 to 1969, when the demand recovered, the plant added two wet type kilns (each having a capacity of 1,300 t/d) which exist at present. After that, owing to the continued cement demand increase accompanied with the economy growth, the plant began the construction of a dry type kiln (made by Fuller, having a capacity of 3,000 t/d, existing one) in 1992, which entered operation in 1993.
In 1997, Cemex Inc. overtook Materikal Family, and Cemex Inc. has the management right of the plant since 1998. At the time of buying Apo Cement Inc., Cemex Inc. modified the existed wet line. The plant did not touch the existed facilities but added a dry type kiln. In the current low demand period, modification and operation of the wet kiln cannot expect any profit. Accordingly, currently two wet type kilns are in stopped operation, and only one dry type kiln is in operation.
As far as the present demand level continues, they have no plan of addition or extension of kiln. Major investment is limited only to the environment-relating items. Plant production and shipment are only normal grade cement. The market cement price is around 105 peso/bag (40 kg). Even in the low demand state, there observed no price cut trend.
(2) Applied Coal Grades and Their PropertiesThe applied fuel is only coal, most of which are imported coal (mainly from Australia).
Under the Marcos administration, there was a law to enforce the use of domestic coal at 50 parts per 50 parts of imported coal. At present, however, there is no rule to forcefully usethe domestic coal. The imported coal is used while mixing the low volatile grade and themedium volatile grade. Main coal properties are the following.
Calorific value Volatile matter Price(kcal/kg) (%) (Peso/t)
Low volatile grade 6,700 - 6,800 22 - 28 1,900
Medium volatile grade 6,700 - 6,800 28-32 2,000
Other cement plants use large quantity of Indonesia coal. There is no special reason for the plant to use Australia coal. The procurement staff decides the coal grade depending on quality, price, and delivery time. The coal consumption is 2,610 thousand tons during 1998.
82

(3) Operational Status of KilnLimestone is subjected to primary pulverizing (jaw crusher), secondary pulverizing
(hammer crusher), and is stored at stockyard using claimer at the mining site. The mining site is distant about 2 km from the plant, so the limestone is transported to the plant using belt conveyers. The water content of limestone is relatively low, 1-3%. Other raw materials include silica (having somewhat high water content, 10 -12%), and pearlite.
The raw material mill is a vertical type one made by Fuller Inc., having a capacity of 240 t/h. Although the nominal capacity of kiln is 3,000 t/d, it produces as high as 3,200 t/d. The operating days is 330 days a year, and regular shut down is given once a year. The plant has no clinker silo, and the clinker is stored at a clinker storage (40,000 tons of capacity).
The thermal unit requirement is 820 Mcal/t-cli, which is a normal level for Fuller Inc. facility. The temperature of preheater exhaust gas is 360 °C, with the oxygen content of 4 to 5%, the carbon monoxide content of 0%. Both the kiln and the supporting furnace show good combustion state. The combustion ratio between the kiln and the support furnace is [kiln/supporting furnace] = 40:60. However, the plant currently operates at 50:50 owing to, supposedly, poor combustion in the supporting furnace. The finish mill has a spare pulverizing unit (made by IHI, having a capacity of 140,000 t/m) followed by a ball mill (120,000 t/m). The fineness of the cement is around 15% at 45 \iR.
The number of cement silos is eight, having 120,000 tons of capacity. The plant produces only normal grade Portland cement. The shipment facilities are three load packers having a capacity of 2,500 bags/unit. The number of plant employees is 120. The plant schedules to introduce a high efficiency cooler from IKN Inc. (Germany) by April 2000 aiming at reduction of heat consumption by 4 to 6 Mcal/t-cli.
The total power consumption of the plant is 25 MW. They have four diesel power generators as the private power generation unit, 5.3 MW for the three and 4.5 MW for the other one, accounting for total 20.4 MW. The short in power is purchased from Meralco Power Inc. at a purchasing unit price of 1.8 peso/kW. The plant will further introduce a diesel power generation unit of 6 MW to fully supply the power themselves. As for the surplus power, they intend to sell to Meralco Power Inc.
Fig. 3.2-13 shows the total view of the preheater.
83
3.2.9 Summary of Cement Companies in the Philippines
(1) Overview of the PlantAt this time of survey, we visited plants (Apo Inc. and Solid Inc.) which entered finan
cial cooperation with foreign capital firms, and independent firms (Grand Inc. and Northern Inc.) Our impression is that there is a distinct technological difference between the foreign capital group and the independent group.
The foreign capital group has strong financial capability and has sufficient investment capability. To the contrary, the independent group has not enough financial power and is difficult in investment under the current stagnant domestic demand. For the foreign capital firms, the technology know how accumulated in Europe and in the U.S. firmly rooted in the plant, and the recognition on energy saving is high.
Since most of the cement companies in the Philippines have been overtaken by the four cement majors, Holderbank (Switzerland), Cemex (Mexico), LaFaje (France), and Blue Circle (the U.K.), the foreign capital plants where we did not visit should have reached to the same technology level as that of foreign capital firms we visited. However, since the plants of these foreign capital firms have high exhaust gas temperature of preheater compared with that of Japanese plants, have high oxygen content, and have high thermal unit requirement, so there is a margin of energy saving.
Also the plants of independent firms have plenty of problems including construction of kiln with suspension preheater, full scale modification of preheater system, and introduction of high efficiency cooler.
(2) Operational Status of CoalAs for the use of coal at plants, most of them use imported coal, and the consumption of
domestic coal is very low level. The use of domestic coal is done by NPC. Most of the domestic coal is lignite (brown coal), containing lots of impurities (silica) and giving low calorific value. In addition, the price of domestic coal is higher than that of imported coal. Therefore, the domestic coal has few advantages for the cement plant use. Nevertheless, in the present state that there increases the number of countries that use domestic coal, for example, Vietnam uses anthracite, Thailand uses brown coal, as the national policy, the cement plants in the Philippines should study to use the brown coal of domestic coal. The existing facilities, however, have a limitation of using the domestic coal, thus there require measures such that a) kiln burners and the combustion facility should increase their efficiency, b) preheater should be modified to NSP type, c) improvement of supporting furnace (distribution combustion) should be actualized, d) to improve heat recovery rate and the combustion efficiency, and e) high efficiency cooler should be introduced. In addition, there require a special policy to reduce the price of domestic coal compared with that of imported coal.
85

(3) Effective Use of Coal AshAs for the effective use of fly ash and bottom ash generated from thermal power plants,
the situation is far behind the situation in Japan. The number of cement plants that use these ashes is small.
Accordingly, the generated coal ash is left in basins in the individual plants at a large volume. The state has a possibility of environmental destruction such as emissions of ash and contamination of groundwater. The quality of thus generated coal ash significantly varies with lots, and the combustion state in power plants is significantly poor to fail in complete combustion leaving calorific value in the ash. That ash should give disturbance to the kiln operation. The NPC which purchases coal should avoid unprincipled procurement stance and should assure homogenized compositions of coal through a scheduled purchasing plan. In some cases, premixing should be adopted. In addition, the combustion control at power plant should be firmly established. Improvement in burners and combustors should be given to assure complete combustion.
At the visit to Cemex Inc., we were told that their overtaken Apo, Solid, and HI firms had already use coal ash, and they gave us questions about the Japanese standard of fly ash and users of fly ash, and the quality of fly ash itself. Accordingly, we expect the future increase in volume of coal ash used in cement plants if only the quality of coal ash becomes stable.
86

Chapter 4 Studies to Introduce Environmentally-Friendly Coal Utilization System by Industries
4.1 Studies to Introduce Coal Utilization System in Electric Power IndustryThis chapter describes the present situation of coal utilization system in the electric power
industry in the Philippines based on the result of our research, and presents the result of our study for the necessary introduction of coal utilization system.
4.1.1 Present Situation of Coal Utilization System in the PhilippinesThe research this year has covered large scale coal fired power plants in the Philippines.
Table 4.1-1 presents the state of coal utilization system and possible problems estimated for future from the view points of coal combustion, fuel gas treatment, and coal ash utilization.
The power plants, which we surveyed mainly, used pulverized imported coals.Domestic coals, such as Semirara coal used in Bantagas coal fired power plant, have high
sulfur content, and are mixed with imported coals with low sulfur content to clear the regulation value (sulfur content below 1%) for use.
Also a coal with the sulfur content below 1% is chosen for only coal combustion.
able 4.1-1 Present Situation and Problems of Coal Utilization System in Electric Power Industry
Technology field Status Problems
Coal combustion
* Use as pulverized coal in large scale thermal power plants
* Utilization of domestic coals is limited
* Domestic coals are mainly used by mixing with imported coals
* Use of two stage combustion system
* Use of low NOx burners
* As the regulation on S02 content (below 1 %) in fuels will be lifted, the types of coal to use will be expanding.1NOx and unburnt matter in ash will increase, depending upon coal types.
Flue gas treatment
* Use of electrostatic precipitator* Denitrification plant is not provided* Desulfurization plant is not pro
vided(They will be installed in future)
* Desulfurization plant will be required, due to the change in the regulation
Coal ash utilization* Utilization as a cement material is
limited* Basic practice is the disposal to
ponds
* Control of unburnt matter in the ash* Securing of ponds
The power plants under our survey do not use domestic coals due to the following reasons, and the domestic coals, together with its limited production size, restricts the total utilization of coals.
a. In order to cover the low quality of domestic coals, it is necessary to mix high quality (low sulfur content, high heating value) coals, (mixed domestic and imported coals are used as in Bantagas power plant)
b. Under the environment regulation, it is necessary for currently operating plants to use fuels with a sulfur content below 1%.
c. Imported coals are cheaper than domestic coals.As to the combustion system to suppress NOx emission, the two-stage combustion system
87
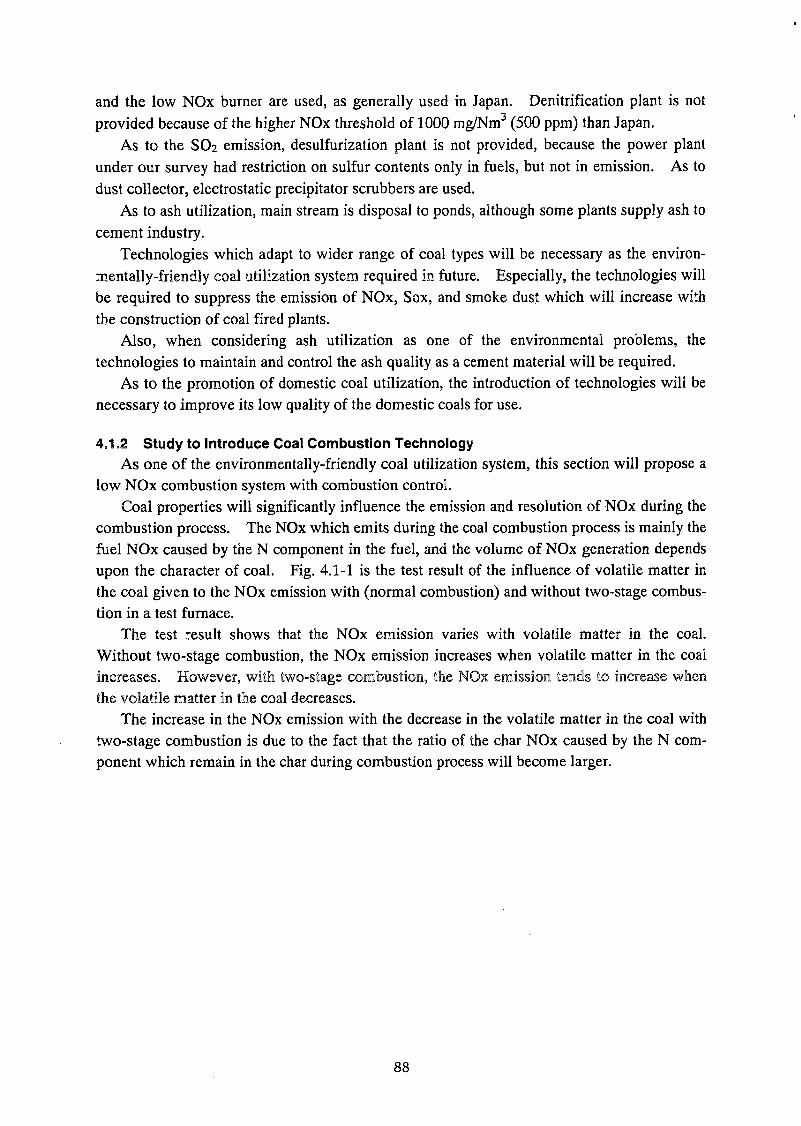
and the low NOx burner are used, as generally used in Japan. Denitrification plant is not provided because of the higher NOx threshold of 1000 mg/Nm3 (500 ppm) than Japan.
As to the SO2 emission, desulfurization plant is not provided, because the power plant under our survey had restriction on sulfur contents only in fuels, but not in emission. As to dust collector, electrostatic precipitator scrubbers are used.
As to ash utilization, main stream is disposal to ponds, although some plants supply ash to cement industry.
Technologies which adapt to wider range of coal types will be necessary as the environ- mentally-friendly coal utilization system required in future. Especially, the technologies will be required to suppress the emission of NOx, Sox, and smoke dust which will increase with the construction of coal fired plants.
Also, when considering ash utilization as one of the environmental problems, the technologies to maintain and control the ash quality as a cement material will be required.
As to the promotion of domestic coal utilization, the introduction of technologies will be necessary to improve its low quality of the domestic coals for use.
4.1.2 Study to Introduce Coal Combustion TechnologyAs one of the environmentally-friendly coal utilization system, this section will propose a
low NOx combustion system with combustion control.Coal properties will significantly influence the emission and resolution of NOx during the
combustion process. The NOx which emits during the coal combustion process is mainly the fuel NOx caused by the N component in the fuel, and the volume of NOx generation depends upon the character of coal. Fig. 4.1-1 is the test result of the influence of volatile matter in the coal given to the NOx emission with (normal combustion) and without two-stage combustion in a test furnace.
The test result shows that the NOx emission varies with volatile matter in the coal. Without two-stage combustion, the NOx emission increases when volatile matter in the coalincreases. However, with two-stage combustion, the NOx emission tends to increase when the volatile matter in the coal decreases.
The increase in the NOx emission with the decrease in the volatile matter in the coal with two-stage combustion is due to the fact that the ratio of the char NOx caused by the N component which remain in the char during combustion process will become larger.
88
O Normal combustion O Two stage combustion rate 15% A Two stage combustion rate 30%
Volatile matter (%)
Fig. 4.1-1 The Influence of the Volatile Matter to the NOx Emission
The power plants, which we surveyed this time mainly, used the imported coals from Australia, Indonesia, and China. For example, Bantagas plants have used Drayton coal, which contains the volatile matter about 35%, and emissions, a relatively low level of NOx.
Pagbilao power plant is planned on the basis to use high-grade coals with a low volatile matter of 34.33 - 40.26%. When combusting a low grade coal in the boiler of Pagbilao power plant, the NOx emission also tends to be higher, on the same condition of the two-stage combustion rate (ratio of the two-stage combustion air against the total combustion air) and excess air rate.
(1) In-Furnace NOx RemovalThe power plants under our survey use the two-stage combustion system for NOx re
moval.The two-stage combustion is the system to supply a part of the combustion air to the
burner zone, decreasing the air ration of the zone to reduce NOx, and supply the rest of the air from the down stream to achieve complete combustion. With the increase in two-stage combustion rate, NOx reduction rate increases, but the unburnt matter in the ash also increases. Also, It is necessary to pay care for the slugging and corrosion of the furnace wall with the strengthening of the reducing atmosphere in the furnace, and the metal temperature increase and slugging of the rear heat conduction tube with the increase in the gas temperature of the furnace outlet.
In the recent years, the imported coals used in Japan tend to have high NOx emission as they have less volatile matter and more char NOx ratio than domestic coals. Characteristics of the imported coals are spreading wider with the increasing variety of supply sources.
89
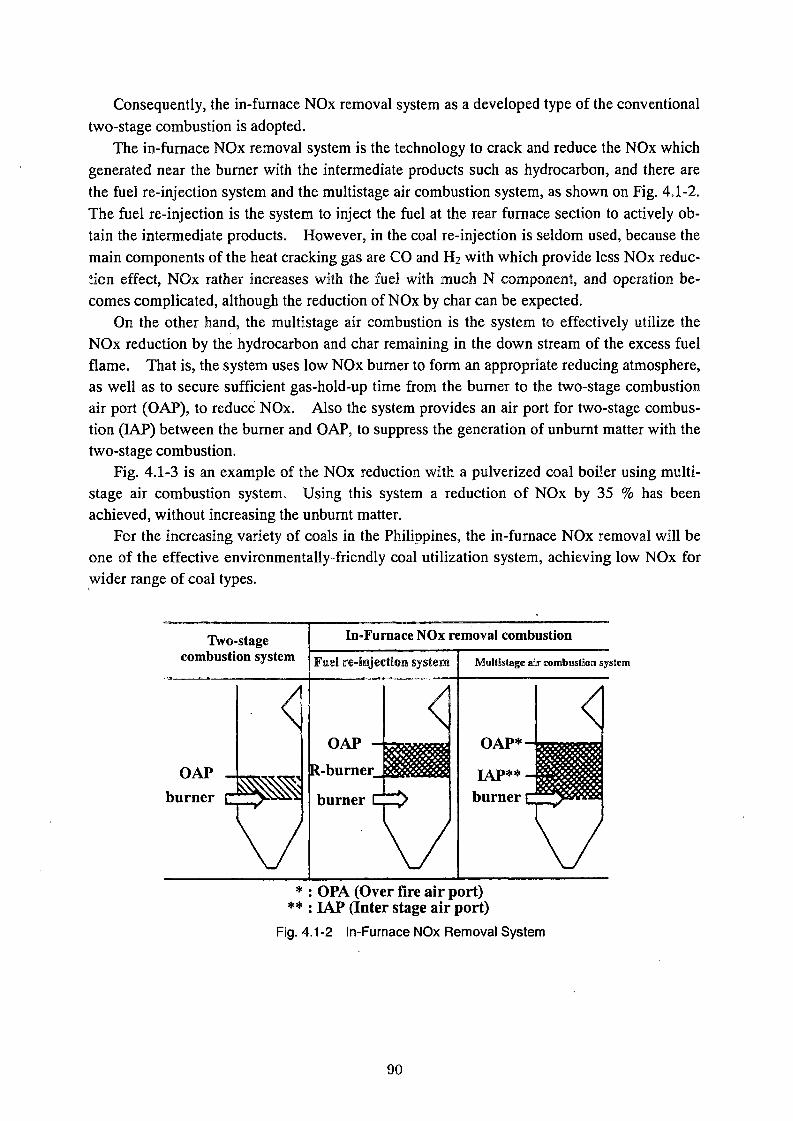
Consequently, the in-fumace NOx removal system as a developed type of the conventional two-stage combustion is adopted.
The in-fumace NOx removal system is the technology to crack and reduce the NOx which generated near the burner with the intermediate products such as hydrocarbon, and there are the fuel re-injection system and the multistage air combustion system, as shown on Fig. 4.1-2. The fuel re-injection is the system to inject the fuel at the rear furnace section to actively obtain the intermediate products. However, in the coal re-injection is seldom used, because the main components of the heat cracking gas are CO and H2 with which provide less NOx reduction effect, NOx rather increases with the fuel with much N component, and operation becomes complicated, although the reduction of NOx by char can be expected.
On the other hand, the multistage air combustion is the system to effectively utilize the NOx reduction by the hydrocarbon and char remaining in the down stream of the excess fuel flame. That is, the system uses low NOx burner to form an appropriate reducing atmosphere, as well as to secure sufficient gas-hold-up time from the burner to the two-stage combustion air port (OAP), to reduce NOx. Also the system provides an air port for two-stage combustion (LAP) between the burner and OAP, to suppress the generation of unburnt matter with the two-stage combustion.
Fig. 4.1-3 is an example of the NOx reduction with a pulverized coal boiler using multistage air combustion system. Using this system a reduction of NOx by 35 % has been achieved, without increasing the unbumt matter.
For the increasing variety of coals in the Philippines, the in-fumace NOx removal will be one of the effective environmentally-friendly coal utilization system, achieving low NOx for wider range of coal types.
Two-stage combustion system
In-Furnace NOx removal combustion
Fuel re-injection system Multistage air combustion system
* : OPA (Over fire air port)** : LAP (Inter stage air port)
Fig. 4.1-2 In-Furnace NOx Removal System
90

' -— Boiler A Boiler BUsage Power generation Private power gen
erationBoiler capacity 600 MW 410 t/h
Fuel used Overseas bituminous coal
Overseas bituminous coal
Combustionsystem
Counter firing Front firing
Coal pulverizer Horizontal mill Horizontal mill
Exhaust gas 02: 3.6% dry
O# Boiler A <>♦ Boiler B
. Two-stage combustion systemto 300
INPACT system
Average air ratio in the combustion area
Fig. 4.1-3 Reduction of NOx Emission by the Multistage Air Combustion System
(2) New Low-NOx BurnersThe power plant under our survey had low NOx burners. The report in 1996 FY intro
duced the concept of the low-NOx burner. This report studies the possibility to introduce the new low NOx burners recently developed.
Fig. 4.1-4 is the structure of low-NOx burner. Any burner basically divide the combustion air into several sections to control the mixing with pulverized coal stream.
New low-NOx burners with further improved NOx reduction principle are under development and operation. Fig. 4.1-5 is an example of new low-NOx burner.
This burner is to optimize its structure, air turning force, and air allocation volume based on the conventional low-NOx burner, to form a strong internal high temperature stream circulation near the burner, as well as to help ignition and combustion of the pulverized coal and to quickly form an optimum reducing atmosphere.
Fig. 4.1-6 is the performance characteristics of the burner obtained at a combustion test furnace with the coal combustion capacity of 1.5 t/h. The figure shows significant improvement in the both NOx and unbumt matter.
91

Thus the realization of large reduction in NOx by the burner alone, without increasing unburnt matter in ash, will provide the following merits, and this technology is considered to be applicable to the Philippines.
a. With the in-fumace NOx removal technology, it is necessary to give longer holdup time of gas between the burner to OAP. However, with the low-NOx burner, the furnace size does not necessary increase, and NOx can be reduced with a furnace of the conventional size.
b. Modification of existing boilers can be achieve with a minor change, by providing a newburner which fit to the combustion technology (horizontal firing or comer firing).
a) Pulverized coal PM burner structure b) Pulverized coal burner structure
tb Pulverized coal
Thin air comb
Thick air comOuter cylinder of
pulverized coal burner Inner cylinder of pul
verized coal burnerInner bane Outer bane
fpjy-' Combustion air
Flow divider
Side view (cross section) | I Separatorrear view
Burner throat
Densitv distribution regulator
Reinforcement of ignition and flame holding by the combination of pulverized coal density regulation
mechanism and the stepped flame holding bane (Securement of stable reducing flame)
Promotion of flame denitration combustion by the stepped feeding of combustion air
Air separate:
ring ^ pulverized coal throat Rectifying Secondary bafflerib
c) NR-2 burner structured) Structure of Kawasaki CCV burner
Fig. 4.1-4 Structure of Low-NOx Burners
92

T '6"
Tertiary air
Secondary air
Note: ® Pulverized coal nozzle @ Flow divider(2) Outer bane (D Burner throat(D Inner bane (D Ignition torch
Fig. 4.1-5 New Type Low-NOx Burner
CD .g3 L_
II3Second stage combustion rate (%)
o0 0)
_3
1
Q)cc
: DF burner : New burner
Second stage combustion rate (%)
Fig. 4.1-6 NOx/Unburnt Matter in Ash Exhaust Characteristics WhenUsing a New Low-NOx Burner
93

4.1.3 Study to Introduce Flue Gas Treatment TechnologyThis section will propose environmentally-friendly coal utilization system for additional
installation of desulfurization unit to existing plants. Among the environmental problems, the SOx emission standard and the air pollution regulation are especially going to be globally severed, and the power plants in advanced countries are already planned and operated on these severe standards.
(1) Current Trend of Desulfurization TechnologyThe flue gas treatment technology in Japan is regarded as the most technically advanced in
the world. The US, Germany and other European countries are developing desulfurization and denitrification technologies based on Japanese Technologies to meet their severe environmental standard.
For the reduction of SOx emission, the installation of desulfurizaiton unit is most suitable, based on its wide range of application and proven reliability. The desulfurizaiton unit can be classified to the following three types.
• Wet type desulfurization system• Semi-dry type desulfurization system• Dry type desulfurization system
Currently, the most widely used system is the wet type desulfurization which purifies the flue gas by removing SOx with absorbent. Fig. 4.1-7 is the flow diagram of major wet type desulfurization systems, and Table 4.1-2 is the comparison of these systems. The limestone - gypsum process which uses limestone as the absorbent is the leading system in the world. Limestone can be steadily supplied at a low cost in many countries and has advantage in cost and operation. Fig. 4.1-8 is the ration of desulfurization byproducts per industry in Japan, and Fig. 4.1-9 is the number of installation of desulfurization unit of commercial coal fired power plants in Japan.
The both figure shows that 69% of total industry, and 92% of total commercial powerplants use limestone - gypsum process.
94

Scrubber
Limestone - Gypsum Process
FlueGas
To Stack To Stack
CaCO'
\/\/
CaSO,
Reheat
Double - Alkali Process
FlueGas
Scrubber>To Stack
NaOH (MgO)
NaHSO.CaSO,CaSO
Reheat
AbsorbRegen.
Wellman - Lord Process
Pre-Scrubber Scrubber
FlueGas
> To Stack
NaOH
NaHSO.
Steam
Reheat
SulfatePurge
Na2S04
Fig. 4.1 -7 Flow Diagram of Major Wet Type Desulfurization Processes
95

Table 4.1-2 Comparison of Major Wet Type Desulfurization Processes
FGD Process Limestone - Gypsum Double Alkali Wellman - Lord
Performance 90% or more 90% or more 90% or more
System Constitution Relatively Simple Complicated Complicated
Reliability Good Fair Fair
Economical FactorEquipment Cost Fair Large Large
Running Cost Fair Fair Large
Installation RequiredSpace
Medium Large Medium
AbsorbentLimestone
(Lime)Limestone
Sodium HydroxideSodium Sulfite
By-product Gypsum Gypsum SulfuricTreatment of Byproduct Re-use Re-use Re-use
100 -|
By-product
| | Gypsum
I I Others
Iron Non- fer- Ceramics, Chemical Textile& Paper & steel rous soil & petroleum dyeing & pulp
Electricpower
metals
Fig. 4.1-8 The Ratio of Major Wet Type Desulfurization Process ByproductsPer Industry in Japan
96

CumulativeAs of 1997
Capacity
(77 units)
(68 units!
20001990 19951970 1975
(Year)
Fig. 4.1-9 The Number of Installation of Desulfurization Unit of Commercial Coal-Fired Power Plants in Japan
Table 4.1-3 is the comparison of the following major dry type desulfurization unit
• Manganese oxide process• Activated carbon absorbent process• Electron beam process
97

Table 4.1 -3 Comparison of the Following Major Dry Type Desulfurization UnitMethod Activated Carbon Adosorption
(Washing Desorption)Electron - BeamManganese Oxide
Absorber
CollectorAbsorber > Regenerator
3 CollectorBy-ProductRecovery
ReactorSystem “5 Absorber
Electron - Beam By-ProductI Bv-Product I By-Product
A. C. (Activated Carbon)Absorbent (Adsorbent)
(NH4)2S04, nh4no3Sulfuric AcidBy - Product
: S02 AND NOx Simultaneous Treatment
• System• Waste Water Treatment: Not Required
: Re-Usable
• Gas Reheat
• By-Product : Not Required
: Not Required
: Re-Usable
• Gas Reheat
• By-Product • Waste Water TreatmentAdvantage Not Required
Not Required
Re-Usable (Or Waste)
• Gas Reheat
• By-Product
: Electricity Consumption Very High
• Reliability : Low
• Protection of X-Ray: Required
: Required for Drying & Regenerating
• Utility• System : Complicated
• Auxiliary Equipment : Much
• Utility Consumption : Much
• Spare Module
Disadvantage • Activated Carbon : Expensive
• Inlet Dust Loading : Limited
NoneCommercial Unit
The oxide magnesium process removes SO2 by turning it into sulfurated manganese with oxide magnesium sprayed to gas stream. Also, it is possible to reproduce oxide magnesium from sulfurated magnesium and use it again as absorbent. During the reproduction of oxide magnesium, sulfurated magnesium is obtained as the byproduct. However, this process is seldom used now, due to its complication.
The activated carbon absorbent process takes much time for absorbing reaction with SO2, and the height of the absorbent stack have to be as three times higher as the wet process. Also, it by-produces sulfur, the multi-stage Claus reactor makes the system complicated, and increases the installation space.
The electronic beam process uses a high potential electron to turn SOx and NOx to sul- furate acid and nitrate acid, and removes them as sulfurate acid ammonium and nitrate acid ammonium out of the exhaust gas. However, the process is under the development stage yet, and it is necessary to minimize the source power, to up-scale the equipment, and to add commercial value to the byproducts.
Based on the above background, the limestone-gypsum process, which is most widely used as the desufurization unit, is considered appropriate for additional installations in the existing power plants in the Philippines. The next chapter will describe some key points for the additional installation of desufurization unit of limestone-gypsum process.
(2) Points to Consider for Additional Installation of Desulfurization Unit to Existing Power Plants
SOx emission standard in the Philippines have been revised to 700 mg/Nm3 from January, 1998. In order to meet this emission standard, it is necessary to install desulfurization unit. Based on the reasons mentioned above, we take up the limestone-gypsum process for desulfurization system, and describes here some points to consider in the planning.
• Selection of desulfurization capacity• Securing of the limestone supply source• Outlet for reuse of the gypsum• Securing of water supply• Discharge water processing equipment• Space for additional installation• Funding
The following describes the selection of the desulfurization capacity, as the most important factor.
Selection of the desulfurization unit depends upon the SO2 emission standard and the maximum value of the rate of sulfur content of the coal to use. First, when using currently used coal with the sulfur content of 1 % under the emission standard of 700 mg/Nm3 (254
ppm), the SO2 density in the flue gas becomes about 600 - 800 ppm, and the desulfurization efficiency of 60 - 70 % is required. Under such relatively modest requirement for desulfurization, the simplified wet limestone-gypsum will be the most economical process.
Fig. 4.1-10 is the flow diagram of the simplified desulfurization process.
99
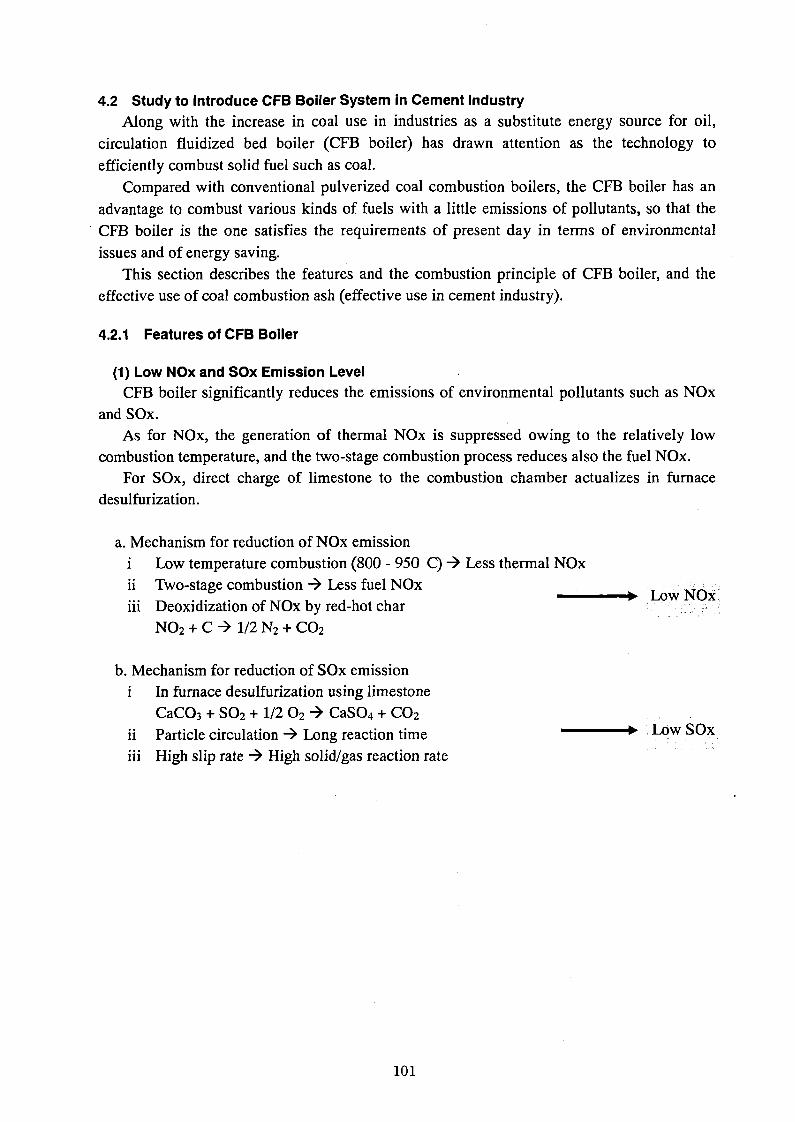
4.2 Study to Introduce CFB Boiler System in Cement IndustryAlong with the increase in coal use in industries as a substitute energy source for oil,
circulation fluidized bed boiler (CFB boiler) has drawn attention as the technology to efficiently combust solid fuel such as coal.
Compared with conventional pulverized coal combustion boilers, the CFB boiler has an advantage to combust various kinds of fuels with a little emissions of pollutants, so that the CFB boiler is the one satisfies the requirements of present day in terms of environmental issues and of energy saving.
This section describes the features and the combustion principle of CFB boiler, and the effective use of coal combustion ash (effective use in cement industry).
4.2.1 Features of CFB Boiler
(1) Low NOx and SOx Emission LevelCFB boiler significantly reduces the emissions of environmental pollutants such as NOx
and SOx.As for NOx, the generation of thermal NOx is suppressed owing to the relatively low
combustion temperature, and the two-stage combustion process reduces also the fuel NOx.For SOx, direct charge of limestone to the combustion chamber actualizes in furnace
desulfurization.
a. Mechanism for reduction of NOx emissioni Low temperature combustion (800 - 950 C) -> Less thermal NOxii Two-stage combustion -> Less fuel NOxiii Deoxidization of NOx by red-hot char
N02 + c -» 1/2 N2 + C02
» Low NOx
b. Mechanism for reduction of SOx emissioni In furnace desulfurization using limestone
CaC03 + S02 + 1/2 02 CaS04 + C02ii Particle circulation -> Long reaction timeiii High slip rate High solid/gas reaction rate
» Low SOx
101
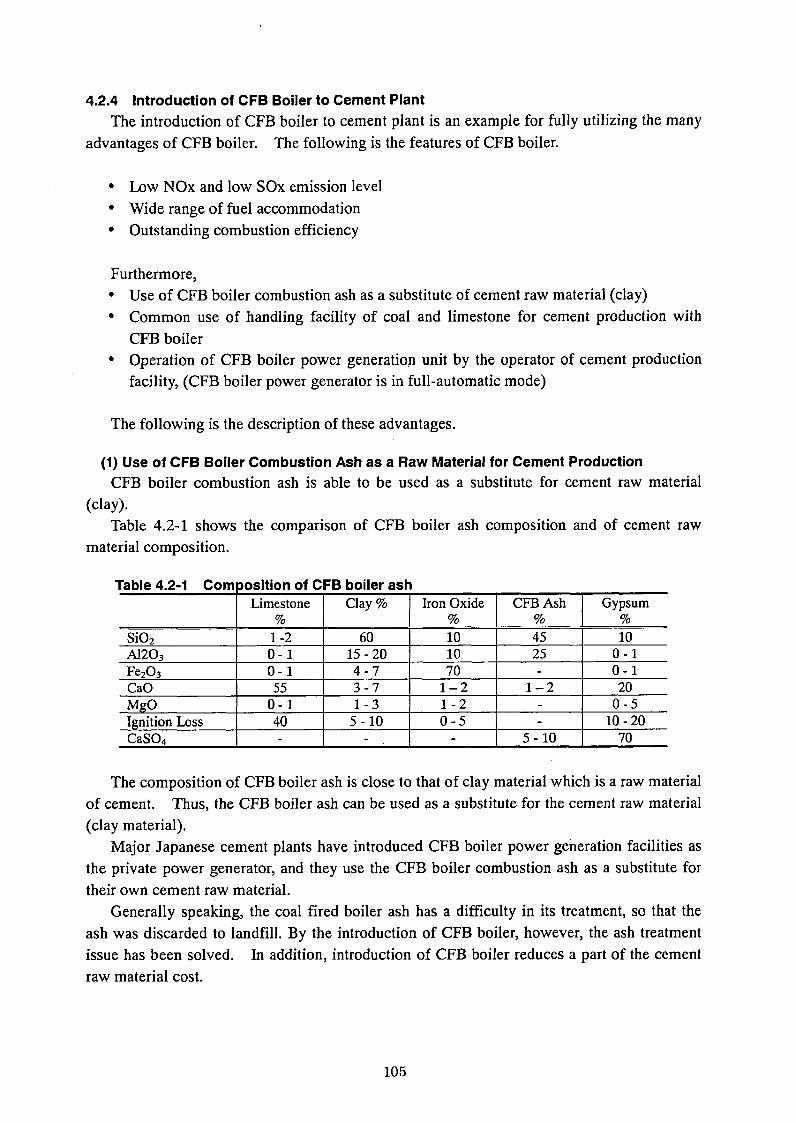
4.2.4 Introduction of CFB Boiler to Cement PlantThe introduction of CFB boiler to cement plant is an example for fully utilizing the many
advantages of CFB boiler. The following is the features of CFB boiler.
• Low NOx and low SOx emission level• Wide range of fuel accommodation• Outstanding combustion efficiency
Furthermore,• Use of CFB boiler combustion ash as a substitute of cement raw material (clay)• Common use of handling facility of coal and limestone for cement production with
CFB boiler• Operation of CFB boiler power generation unit by the operator of cement production
facility, (CFB boiler power generator is in full-automatic mode)
The following is the description of these advantages.
(1) Use of CFB Boiler Combustion Ash as a Raw Material for Cement ProductionCFB boiler combustion ash is able to be used as a substitute for cement raw material
(clay).Table 4.2-1 shows the comparison of CFB boiler ash composition and of cement raw
material composition.
Table 4.2-1 Com position of CFB boiler ashLimestone Clay % Iron Oxide CFB Ash Gypsum
% % % %Si02 1-2 60 10 45 10A1203 0-1 15-20 10 25 0-1Fe203 0-1 4-7 70 - 0-1CaO 55 3-7 1-2 1-2 20MgO 0-1 1-3 1-2 - 0-5Ignition Loss 40 5-10 0-5 - 10-20CaS04 - - - 5-10 70
The composition of CFB boiler ash is close to that of clay material which is a raw material of cement. Thus, the CFB boiler ash can be used as a substitute for the cement raw material (clay material).
Major Japanese cement plants have introduced CFB boiler power generation facilities as the private power generator, and they use the CFB boiler combustion ash as a substitute for their own cement raw material.
Generally speaking, the coal fired boiler ash has a difficulty in its treatment, so that the ash was discarded to landfill. By the introduction of CFB boiler, however, the ash treatment issue has been solved. In addition, introduction of CFB boiler reduces a part of the cement raw material cost.
105
(2) Common Use of Handling Facility of Coal and Limestone for Cement Production With CFB Boiler
CFB boiler uses coal as fuel, and limestone as intrafumace desulfurization agent. The coal and limestone can be the same as the fuel and raw material for cement production, respectively.
CFB boiler needs the handling facilities for these fuel and raw material, (such as coal yard, coal conveyers, limestone yard, limestone conveyers). Cement plant has already have the handling facilities for these fuel and raw material. And, these existing facilities can be used common with CFB boiler.
(3) Operation of CFB Boiler Power Generation Unit by the Operator of Cement Production Facility
Basically, the CFB boiler power generation unit is operated in automatic mode under normal operating conditions. The operation of CFB boiler power generation unit is normally done in centralized control mode at the central operation control room, under CRT screen monitoring by operators.
It is possible that the central operation control room for the CFB boiler power generation unit is located in the cement production operation control room, and that the operator of the cement production unit also operates the CFB boiler unit.
4.2.5 Feasibility Study on Introduction of CFB Boiler in Power PlantAs a private power generation unit of cement plant, a feasibility study (FS) on the
introduction of CFB boiler power generation unit was given. The result is shown in Table 4.2-2.
As a case study, a cement plant having a daily production capacity of 5,000 tons with the plant power consumption of about 30,000 kW was assumed. Fig. 4.2-5 shows perspective view of the plant.As seen in Table 4.2-2, the payback period is slightly less than four years.
As described above, CFB boiler has an advantage of combustion of wide variety of fuels at high efficiency while emitting less pollutants, and also has a feature of simple and compactfacility design.
Furthermore, the introduction of CFB boiler to cement plant promises, adding to the above-described advantages of CFB boiler, effective use of CFB boiler combustion ash as a raw material of cement, and common use of fuel and raw material handling facilities of cement plant with the handling of CFB boiler fuel.
In Japan, the demand of CFB boiler having those advantages has been increasing year after year, and particularly in the power generation facility field, CFB boiler of high temperature and high pressure version has already been adopted.
106

Table 4.2-2 FS for Introduction of CFB Boiler to a Cement Plant
FEASIBILITY STUDY OF 3QMW CFB POWER PLANT FOR CEMENT COMPANY
Bituminous Coal: Calorific Value=6,000 kcal/kg (LHV)
1 GROSS OUTPUT (MW) 30.0
2 NET OUTPUT (MW) 26.0
3 OPERATION CONDITION AVAILABILITY 91.32%
4 OPERATION HOURS/ANNUM (hours) 8.000
5 COS>T
6 VARIABLE COST
7 CONSUMPTION EFFICIENCY AT GENERATOR 31.5%
8 HEAT VALUE (kcal/kg) 6,000
9 CONSUMPTION / ANNUM (t) 109.380
10 UNIT COST (US$/t) 47.0
11 COST/ANNUM (USD 5,140,860
12 COST/kWh (US 4 /kWh) 2.14
13 LIMESTONE CONSUMPTION (t/h) 0.48
14 CONSUMPTION CONSUMPTION / ANNUM (t) 3,840
15 UNIT COST (US$/t) 1.4
16 COST/ANNUM (usd 5,376
17 COST/kWh (US 4 /kWh) 0.002
18 OTHER VARIABLE OTHER VARIABLE COST / ANNUM (USD 59,666
19 COST COST/kWh (US 4 /kWh) 0.02
20 VARIABLE COST (USD 5,205,902
21 VARIABLE COST / kW (US 4/kWh) 2.17
22 FIXED COST (US$) 708,600
23 COST/kWh (US 4/kWh) 0.30
24 TOTAL OF COST (USD 5,914,502
25 COST/kWh (US 4 /kWh) 2.46
26 INCOME
27 ELECTRICITY PRICE UNIT PRICE (US 4/kWh) 7.90
28 ELECTRICITY PRICE (USD 16.432.00029 RAW MATERIAL COST TO BE SAVED
30 ASH PRODUCTION/ANNUM (t) 22,160
31 COST OF CLAY (US$/t) 5.0
32 MATERIAL COST SAVED/ ANNUM (USD 110,800
33 TOTAL OF INCOME (usd 16,542,800
34 INCOME/kWh (US 4 /kWh) 6.89
35 YEARLY PROFIT (USD 10,628,298
36 INITIAL INVESTMENT INITIAL INVESTMENT (USD 33.000.000
37 INTEREST INTEREST RATE/ANNUM 10.0%
38 PAYBACK PERIOD YEAR 3.9
107

RAW MEAL
SUSPENSION PREHEATER
PULVERIZED COAL
sc CALCINER
FCK FLUIDIZED BED CEMENT KILN
FBQ FLUIDIZED BEDQUENCHING COOLERPULVERIZED COAL
PDC PACKED BED COOLER
BLOWER
HEAVY OIL
BLOWER
BLOWER
CEMENT CLINKER
Fig. 4.3-3 Fluidized Bed Advanced Cement Kiln System (FAKS)
(2) Fluidized Bed Cement Kiln (FCK)This is the core of the system to granulate the cement materials, which has been
pre-heated and calcinated, to the size of 1 - 2 mm(|) at a high temperature level of 1,300 °C.The FCK have the special distributor, the material powder blower, and the bottom
classifying discharge system and the FCK can perform a stable granulation without the supply of seeds for granulation from outside. This is an innovative technology called “Hot granulation” designed to remove the problem of heat loss accompanying to the supply of seed clinker for granulation, to improve the heat cost efficiency.
(3) Cooling SystemThe cooling system comprises the fluidized bed quenching cooler (FBQ) to rapidly cool
down from the level of 1,300 °C down to near 1,150 °C, and the packed bed cooler (PBC) to effectively collect the sensible heat of clinker and economically anneal down to below 200 °C. The FBQ is located directly under the bottom classifying discharging system of the FCK, and has the function of the tertiary classifying .
This system performs an effective heat collection during the cooling process of the clinker, and reduces the air volume needed for the cooling, by the combination of the FBQ and the PBC.
The conventional grate cooler has an insufficient heat collection rate, and requires much excess cooling air and disposes the excess cooling air to outside FAKS has no excess air to dispose out. Consequently, the heat consumption and CO2 emission can be reduced accordingly.
Ill

(3) Raw Meal BlowerThe raw meal blower accelerates the dispersion of the raw meal into the FCK, and
performs the prevention of the scorching adhesion to the inside of the FCK near the raw meal supply port and the promotion of granulation. At the same time it has an important function to control the generation volume of hot self granulation seeds, and plays an important role for the stable control of granulation.
4.3.4 Features of FAKSFAKS has the following features when comparing with the newest rotary kiln.
(1) Significant Expansion in the Selection Range of Coal TypesThanks to the heat exchange provided by the contact conduction on the fluidized bed, the
sintering temperature needs to be secured only up to the level of 1,300 °C as needed for sintering reaction, and by the superior combustion and heat conduction characteristics which are particular with the fluidized bed reactors, it is possible to efficiently burn low quality coals or high fuel cost rate coals, thus significantly expanding the selection range of coal types.
On the other hand, the rotary kiln provides the heat exchange through the radiation of the flame, and requires to form a high temperature flame at 1,800 - 2,000 °C, thus limiting the selection range of coal types.
(2) Reduction of the Heat Consumption Rate by 10 - 25%The clinkers granulated and sintered in the FCK are homogenized fine grains to which the
combined the FBQ and the PBC, with high heat exchange performance, can be applied, and the heat collection rate will increase to above 80%. The heat emitting surface will decrease, and the heat consumption rate will accordingly drop by 10 - 25%.
(3) C02 Emission Drops by 10 - 25%, and N02 Emission Drops by Above 40%CO2 emission of the combustion system decreases by 10 - 25% in accordance with the
decrease in the heat consumption rate.Further reduction in the CO2 emission is feasible, as the selection of the coal types with
less carbon content becomes possible.Also, the thermal NOx decreases, and NOx emission can decrease by more than 40%, as
the performs fluidized bed combustion at a relatively low temperature.
(4) Improvement in Multi-Type Switching ProductivityAs a precise control of granulating-sintering temperature control is made possible, it is
easy to produce a variety of cements by switching.
(5) The Scale-Up of the Production Size is Possible with a Single KilnWith the conventional fluidized bed cement kiln system studied so far, the large size
production has been tried to achieve by placing multiple systems of small size furnace. However FAKS is able to expand the size of production to 3,000 t/day with a single furnace, and to provide a large economic effect also to large scale equipment.
113

(6) Reduction in the Costs of Equipment, Operation and MaintenanceAs bulky rotary kilns can be avoided, the installation space will decrease by about 70%.
Also, as the large capacity can be achieved with a single furnace, the equipment cost will decrease by 10 - 30%. As there are no moving part as rotary kiln and grate cooler, the life time of machines and fire resistant structure will increase, and the cost of operation and maintenance will decrease.
4.3.5 Test results and Scale Up on FAKSThe most important thing on scaling up the fluidized bed advanced cement kiln system
(FAKS) is to conduct scale up while maintaining the granulation characteristics and the clinker quality. To this point, we conducted detail study on these characteristics using both a pilot plant test with a capacity of 20 t/d and a scale up test to a capacity of 200 t/d. The tests showed similar tendency on the granulation characteristics in the granulation furnace at both plant scales, thus confirming that the scale up is actualized by a similar method. Also the tests confirmed that, if only the granular characteristics are not changed, the retention time in the granulation and firing furnace, which directly relates to the clinker quality, is almost unchanged, and the stable quality can be assured.
The second important thing is to conduct scale up while maintaining various performance such as heat consumption rate and power consumption rate at a high level. The heat consumption rate relates to the air flow rate unit requirement and the heat recovery rate, and the power consumption rate relates to the air flow rate unit requirement and the pressure loss at each unit. Therefore, the air flow rate unit requirement shall be kept to a lowest level. Thus, the air flow rate necessary for firing and the necessary heat recovery rate are determined taking into account of the optimum condition. The heat recovery rate shows similar value and tendency in both test plants. It was confirmed that, when the scale up is carried out using a combination of the fluidized bed cooler with the moving bed cooler, the specified heat recovery rate is maintained. In addition, it was confirmed that the scale up can be done under a constant pressure loss in each facility.
The series of confirmation tests confirmed that it is possible to scale up the granulation and firing furnace, the fluidized bed cooler, and the moving bed cooler, which structure FAKS, under the condition of constant pressure loss.
In scale up under the condition of constant effective bed height, the share of heat loss to the total heat consumption decreases with the increase in the facility scale. Consequently, the clinker ratio production rate increases and the heat consumption rate decreases. Although the retention time decreases with the decrease in the heat consumption rate, there occurs no problem such as insufficient clinker reaction time. As a result, the scale up of FAKS only needs to enlarge the diameter of furnace on the basis of the heat consumption rate and the capacity under the condition of constant effective bed height.
Table 4.3-1 shows scale up data for FAKS, and Fig. 4.3-5 shows the basic construction of FAKS at a capacity of 1,000 t/d.
114

4.3.6 Expected Effect of the Application of FAKSFAKS provides, as mentioned above, the environment conservation, resources utilization,
and economic advantage. That is, the system is environment conservation type, by suppressing CO2 and NOx emissions, and is resources utilization type to be able to use as the fuel a wide range of coal resources from low quality coals with low heating value, and is highly economical with low costs of construction and operation to be able to reduce the cost of cement production.
Table 4.3-1 Scale Up Data for FAKSUnit 200 t/d 500 t/d 1,000 t/d 3,000 t/d
Heat consumption rate kcal/kq-cl 771 734 713 690Power consumption rate kWh/t-cl 43 42 41.5 37Retention time FCK minutes 48 45 42 37
FBQ minutes 3 3 3 3PBC minutes 220 220 220 220
Diameter FCK m x quantity 2.5 x 1 4.0 x 1 5.7 x 1 9.7 x 1FBQ m x quantity 0.7 x 2 1.1 x 2 1.6x2 1.9x4PBC m x quantity 3.1 x 2 4.9 x 2 7.0 x 2 8.6 x 4
Accordingly, the system can provide a large effect to the environment conservation, resources utilization, and economic advantage, not only for new plants, but also for existing plants. Especially, it will give a larger effect to the high heat-consumption type of kilns such as wet rotary kiln, dry rotary kiln without suspension pre-heater, and shaft kiln. Because FAKS can significantly reduce the heat consumption rate even comparing with the newest type of existing rotary kiln with NSP, and the reduction rate increases as the size of the plant become smaller. The reduction effect of green-house effect gasses emission will be still larger for the replacement of wet rotary kiln, dry rotary kiln, and shaft kiln of relatively small size less than 300 t/day.
115
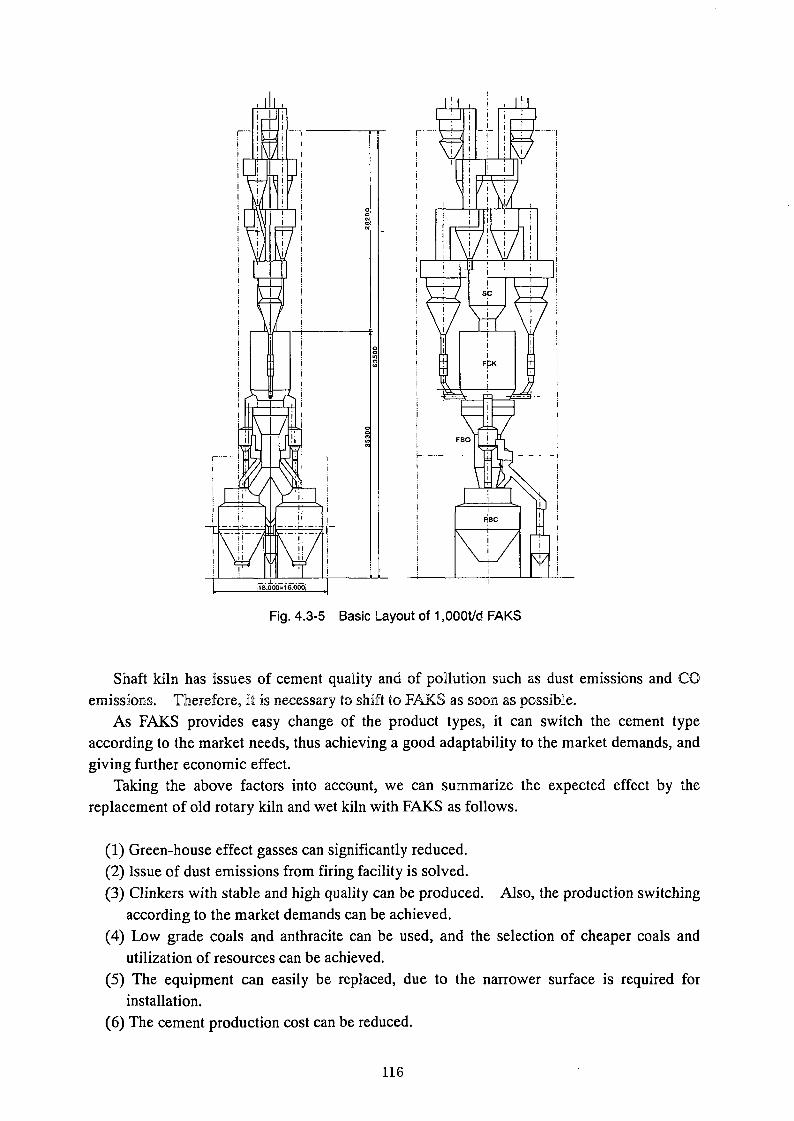
I------
Fig. 4.3-5 Basic Layout of 1,000t/d FAKS
Shaft kiln has issues of cement quality and of pollution such as dust emissions and CO emissions. Therefore, it is necessary to shift to FAKS as soon as possible.
As FAKS provides easy change of the product types, it can switch the cement type according to the market needs, thus achieving a good adaptability to the market demands, and giving further economic effect.
Taking the above factors into account, we can summarize the expected effect by the replacement of old rotary kiln and wet kiln with FAKS as follows.
(1) Green-house effect gasses can significantly reduced.(2) Issue of dust emissions from firing facility is solved.(3) Clinkers with stable and high quality can be produced. Also, the production switching
according to the market demands can be achieved.(4) Low grade coals and anthracite can be used, and the selection of cheaper coals and
utilization of resources can be achieved.(5) The equipment can easily be replaced, due to the narrower surface is required for
installation.(6) The cement production cost can be reduced.
116

For the adoption of FAKS with such advantages as mention above, it is necessary to conduct a detailed check on the existing plant, and look into the return on investment, to make an optimum system.
4.3.7 Problems on Other Coal Firing Technologies and Study on Improvement MeasuresAfter the Second Oil Crisis, the Japanese cement industry completely shifted from oil to
coal for strengthening the cost competitiveness. From the beginning of shifting to coal, various improvements have been given aiming at the combustion of coal in a similar manner with oil. It has already become common knowledge that the coal combustion gives equivalent combustion efficiency with that for oil combustion. Thus, in recent years, if only the cost competitiveness per calorific value is attained, low grade coal such as not only general bituminous coal but also anthracite and lignite, or oil coke can be used.
In the Philippines, recognition on the energy saving has become popular. In particular, the domestic firms of cement industry in recent years have been occupied almost completely by foreign capital firms having plenty of financial power. As a result, the shift to coal proceeds. In the future, it is expected that, for strengthening the cost competitiveness, they promptly promote the securing further inexpensive coal source and the accompanying introduction of most advanced coal combustion technology.
Different from oil, coal has various grades such as bituminous coal, anthracite, and lignite. With the same grade of coal, quality significantly differs with the mining sites. Therefore, to conduct long time of stable operation of kiln using coal in the cement kiln, particular care should be given for designing the facilities.
This section describes the issues on coal use and their countermeasures.
(1) Securing Stable Supply Source of CoalA cement plant has facilities which consume large amount of thermal energy.
Accordingly, it is important for the stable operation of plant to secure inexpensive and stable coal supply source. In the Philippines, every cement firm can independently purchase coal and secure the coal supply, so that the firm should select the coal supplier which assures most stable and most inexpensive coal taking into account of the site condition of the cement plant.
(2) Homogenizing Coal QualitySince coal is a solid fuel, it has wide variety of quality such as calorific value, ash content,
and chemical composition of ash, compared with oil. With a coal mined from the same site, there often occurs significant difference in quality.
In the case of cement kiln, frequent fluctuations in calorific value of coal become a disturbance, which results in critical trouble. Thus, variations in calorific value often stop the facility to hinder the long period of stable plant operation. Furthermore, there should be emphasized the bad influence of variations in ash content and chemical composition of coal to inhibit quality control of clinker.
117

Some of the Japanese cement firms homogenize the coal grade by jointly operate a coal center to purchase and premix coals and to supply them to each users. Minimizing the variations of calorific value of coal through the preliminarily mixing the purchased coals of wide variety of grades is an essential means for stable operation of cement kilns.
All the Philippine cement firms visited at this time conduct no premixing of coal. Under the circumstance, variations of coal quality will induce troubles on stable operation of cement kilns, which degrades the energy saving effect and further decreases the energy use efficiency. In view of cost competitiveness of every cement firms in the Philippines, the kinds of coal grades and the quantity of low grade coal will increase in the future. Under the situation, premixing of coal should become a critical condition.
(3) Coal Pulverization FacilityThere are many methods for pulverizing coal. These methods are largely grouped to the
tube mill and the dry pulverizing in a tower mill. In view of power unit requirement and pulverizing efficiency, the tower mill giving low unit requirement and high pulverizing efficiency is superior.
As for the coal drying heat source, there are a method to effectively use exhaust gas of preheater and a method to use exhaust gas of air-quenching cooler. Each method has merits and demerits. For the case of generally used bituminous coal, cooler exhaust gas which contains large quantity of oxygen has no danger of ignition. However, the cooler exhaust gas needs special care for maintenance and safety measures. For the case of preheater exhaust gas which is an inert gas, the danger of ignition is less than the case of cooler exhaust gas. However, the preheater exhaust gas contains raw material dust so that the dust elimination is essential to prevent reduction in calorific value of coal.
As described above, the coal dry pulverization systems have various methods. The design and selection study of the system should carefully be done considering the plant operating conditions and the applying coal grades.
For the drying of lignite which contains large amount of volatile matter, tower mill is normally used. In that case, however, considering that the lignite is likely ignited, the heat source should be the preheater exhaust gas. Since the drying of lignite is relatively easy, and the drying of lignite which is in the group of low grade coals is possible to attain 5,000 kcal/kg-coal or higher calorific value. Actual operations revealed that lignite is used in cement kilns without any trouble.
The main stream of coal mills adopted in the Philippines is tower mill. The status is favorable in view of future energy saving and of future widening of coal grades.
(4) Pulverized Coal Combustion FacilityThere are two major categories of pulverized coal combustion with kiln burners: direct
combustion method and indirect combustion method. For the case of cement kilns, it is important to minimize the primary air flow rate at burner, to increase the high temperature recovered air flow rate (kiln secondary air) from cooler, thus to increase the combustion efficiency of pulverized coal. In this respect, the indirect combustion method is superior.
118

However, since the pulverized coal combustion facilities in the Philippines are occupied by the direct combustion method, the primary air flow rate at burner is large, and the combustion state at burner is supposedly not in a favorable state. Modifying the existing direct combustion method to the indirect combustion method and stably supplying accurately weighed pulverized coal to kiln will increase the energy use efficiency.
(5) Kiln Burner FacilityIn a cement kiln, the kiln burners are the most important component, and they give
significant influence to the energy use efficiency. Particularly in pulverized coal combustion, the current development focuses on the achievement of complete combustion through the improvement of mixing effect of air and pulverized coal, and the reduction of air ratio. The kiln burners adopted by most of the cement firms in the Philippines leave improvement margin. Therefore, they should study to introduce most advanced type of burners.
(6) Pulverized Coal Combustion Facility in Calcining FurnaceThe calcining furnace mounted to the preheater has variety of configurations. For
combusting pulverized coal, care should be paid on the calcining furnace. If the pulverized coal failed to completely bum in the calcining furnace, and if the unburnt matter leaves the calcining furnace, the heat effective use efficiency degrades. In the case of combusting pulverized coal, the design should be given to secure satisfactory combustion time of pulverized coal and to select thermal load suitable for pulverized coal. The fineness of pulverized coal should naturally be fine to a necessary degree in relation to the volatile matter content. In addition, a means to raise the extracted gas temperature from the cooler to the assistant furnace, (for example, introduction of a high efficiency cooler) may be required. Furthermore, the number of burners in the assistant furnace may be required to increase to reduce the load per burner for establishing dispersion combustion.
The above-described important matter may not be fully considered in the Philippines. Grand Cement Inc. and Nothern Cement Inc., where we have visited at this survey, showed significant decrease in the heat use efficiency owing to incomplete combustion of pulverized coal within calcining furnace, thus inducing secondary combustion outside of the system. Even after shifting to coal, detail investigation on the calcining furnace should be given for maintaining the heat use efficiency, and modification or replace of calcining furnace should be done. In addition, it is important to apply instruments for continuous monitoring oxygen content and carbon monoxide content of preheater exhaust gas to assure the combustion control. In some of the cement firms in the Philippines, however, that kind of simple combustion control is not given, and the basic control should fully be implemented.
119
4.4 Study to Introduce Coal Ash Utilization TechnologyThis section will study the feasibility of introduction of technologies to utilize the coal ash
generated at the power plants, and will propose the technology to reduce the unbumt matter in the ash to promote the coal ash utilization.
As for the current use of coal ash, only a part of them (fly ash) is effectively used as an additive to cement. And, the bottom ash is not used at all. At Salcon Power plant which we surveyed at this time, they cannot find users of coal ash, and they leave the ash in a basin within the plant site. We suppose that other power plants also leave their ash outdoor. Both the fly ash and the bottom ash cannot be effectively used if they contain unbumt matter. Therefore, the power plants should introduce technology to reduce the unbumt matter in the ash. The following is the description on technologies to reduce uburnt matter in ash.
4.4.1 Super Pulverized Coal Combustion TechnologyUsually coals are pulverized by the crusher, to use as pulverized coal. Raw coals are
thrown in the crusher and, in the case of vertical crusher, pulverized by the roller mill, and fed with air to the classifier provided at the top of the crusher. The device classifies large grains, to produce the pulverized coal of 200 mesh pass at 70 - 80 %, and average grain size of 40 pm. Crushers are roughly divided to the fixed bane system and rotary classifying system. The rotary system has a superior performance to the bane system classify large grains. To keep the grading of the pulverized coal to produce constant, the classifying performance (the rotation speed at a rotary classifier) and the roller pressure of the classifier in accordance with the properties (moisture, HGI, etc.) of the coal to crush.
Fig. 4.4-1 is an example of the crusher (vertical roller mill, rotary crusher) and the super pulverized mill with a significantly improved crushing performance achieved by the optimization of roller and table shapes.
Fig. 4.4-2 is an example of average grain size versus the change in revolution of the rotary classifier.
The average grain size of the produced pulverized coal goes down as the revolution of the classifier goes up. Super pulverized coal at an average grain size of 20 pm can be producedby further adding up the roller pressure. Fig. 4.4-3 is the comparison of grain distribution between the super pulverized coal and the pulverized coal. There are few large grains above 74 pm in the super pulverized coal. The grain size distribution of pulverized coal significantly influence the combustion performance, and especially to the discharge performance of unburnt matter in ash.
120

121
Pulverized coal Coal charge
Reduction gear for classifier
Motor for classifier
Classifier housing
Reject chute
Coal charge pipe
Hydraulic roller pressing
Housing ot pulverizing section
Table segment
Rotary airport
Primary air
Inclusion discharge scraperPulverizing table
Inclusion discharge chute
MDI reduction gear
Coal flow Mixed phase flowVertical mill equipped with rotary classifier
Raw coal
Super pulverizedcoal F
Hydraulic roller pressure device
Shape optimization (Improvement of
classifying efficiency) Hvdraulic roller pressure
device
Primary air
Super pulverized coal mill
Fig. 4.4-1 Crasher Structure

Mes
h pa
ssin
g vo
lum
e (%
) A
vera
ge g
rain
size
of s
uper
pulv
eriz
ed co
al (a
m)
Conventional pulverized coal
Pulverization with the increase in the roller pressure
Roller pressure of conventional mill
Pulverization with the increase in the revolution of classifier
Super pulverized coal
The roller pressure of 1.3 times
(Note) Test sample coal: A coal (HGI=50)
Fig. 4.4-2 Revolution and the Average Grain Size of Pulverized Coal
O Conventional pulverized coal 0 Super pulverized coal
5 10 50 f 100
Diameter of super pulverized coal (am) 74
500 1000
Fig. 4.4-3 Grain Size Distribution of the Super Pulverized Coal
122

Fig. 4A.-4 is the NOx emission and unburnt matter in ash at the super pulverized coal combustion, compared with conventional pulverized coal, with the parameter of exhaust gas O2 of the flue gas. The super pulverized coal gives a larger reduction of unburnt matter in ash than the pulverized coal. Also, it is clear that the exhaust gas O2 can be reduced from the conventional 3.5% to 1.5% when burning the super pulverized coal at a level of exhaust gas O2: 3.5% for pulverized coal. That is, by super pulverizing, NOx emission will decrease due to an early discharge of N component in the coal and promotion of reduction, and together with the exhaust gas O2 reduction, the total NOx reduction of about 20% can be achieved, comparing with the pulverized coal.
Thus, by using the rotary classifier for the crusher, and by using super pulverized coal mill with an improved crushing technology, we can maintain the unbumt matter in ash at the levels required for a variety of coals.
O ! Conventional pulverized coal # : Super pulverized coal (urn)
-3 15020% Decrease
( b ) Unburnt matter in ash
80% Decrease
Exhaust gas 02 (%)
(Note) Test sample coal: A coal (Coal fuel ratio=2.25)
Fig. 4.4-4 Combustion Improvement with the Super Pulverized Coal
123
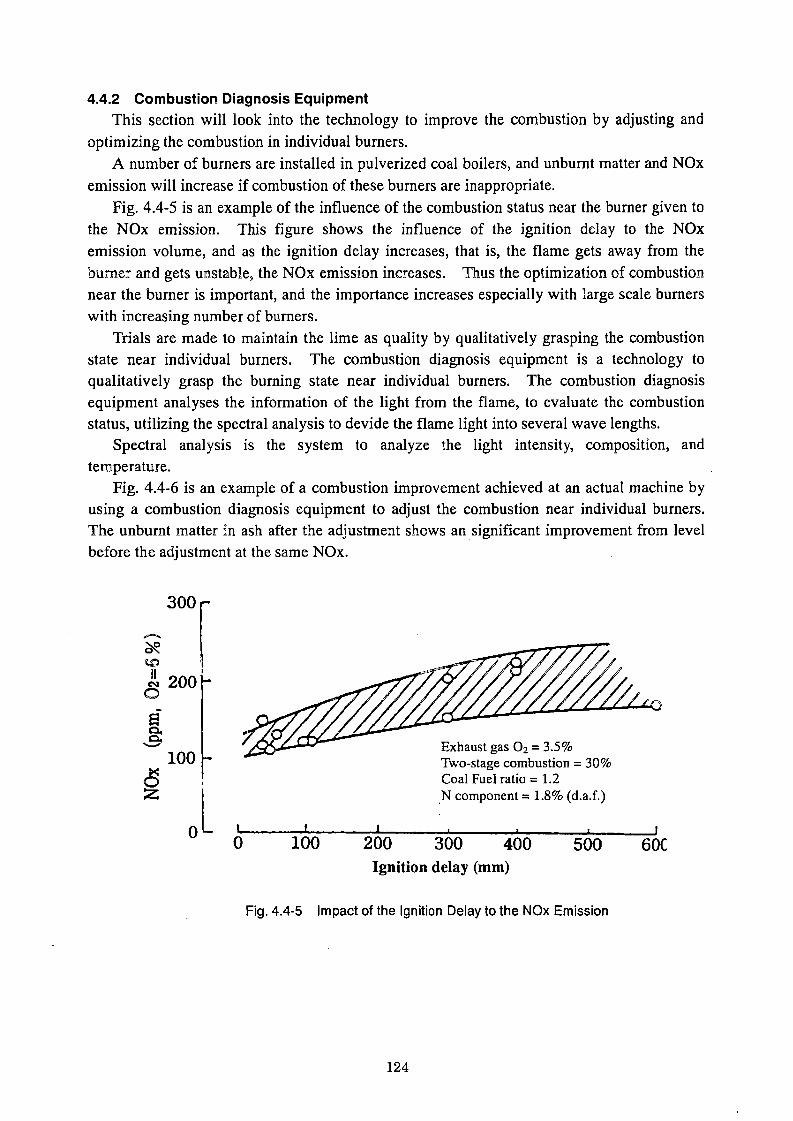
4.4.2 Combustion Diagnosis EquipmentThis section will look into the technology to improve the combustion by adjusting and
optimizing the combustion in individual burners.A number of burners are installed in pulverized coal boilers, and unburnt matter and NOx
emission will increase if combustion of these burners are inappropriate.Fig. 4.4-5 is an example of the influence of the combustion status near the burner given to
the NOx emission. This figure shows the influence of the ignition delay to the NOx emission volume, and as the ignition delay increases, that is, the flame gets away from the burner and gets unstable, the NOx emission increases. Thus the optimization of combustion near the burner is important, and the importance increases especially with large scale burners with increasing number of burners.
Trials are made to maintain the lime as quality by qualitatively grasping the combustion state near individual burners. The combustion diagnosis equipment is a technology to qualitatively grasp the burning state near individual burners. The combustion diagnosis equipment analyses the information of the light from the flame, to evaluate the combustion status, utilizing the spectral analysis to devide the flame light into several wave lengths.
Spectral analysis is the system to analyze the light intensity, composition, and temperature.
Fig. 4.4-6 is an example of a combustion improvement achieved at an actual machine by using a combustion diagnosis equipment to adjust the combustion near individual burners. The unbumt matter in ash after the adjustment shows an significant improvement from level before the adjustment at the same NOx.
Ignition delay (mm)
Fig. 4.4-5 Impact of the Ignition Delay to the NOx Emission
124

In the Philippines, Future construction of 500MW boilers are planned, and the combustion adjustment support technology for individual burners will be important. Pagbilao plant changes the type of coals every one to two months. At the change of coal types, it is important to maintain the optimum combustion without inviting the increase in unburnt matter in ash by easily performing qualitative adjustment of combustion.
Therefore the above combustion diagnosis equipment could be one of the environment-adapting environmentally-friendly coal utilization system.
- I Before adjustment •%— : After adjustment
x 300A O. 2)
Boiler outlet unburnt matter in ash (%)
Note: ( ) is boiler outlet 0%
Fig. 4.4-6 Combustion Improvement with Combustion Diagnosis Equipment
125
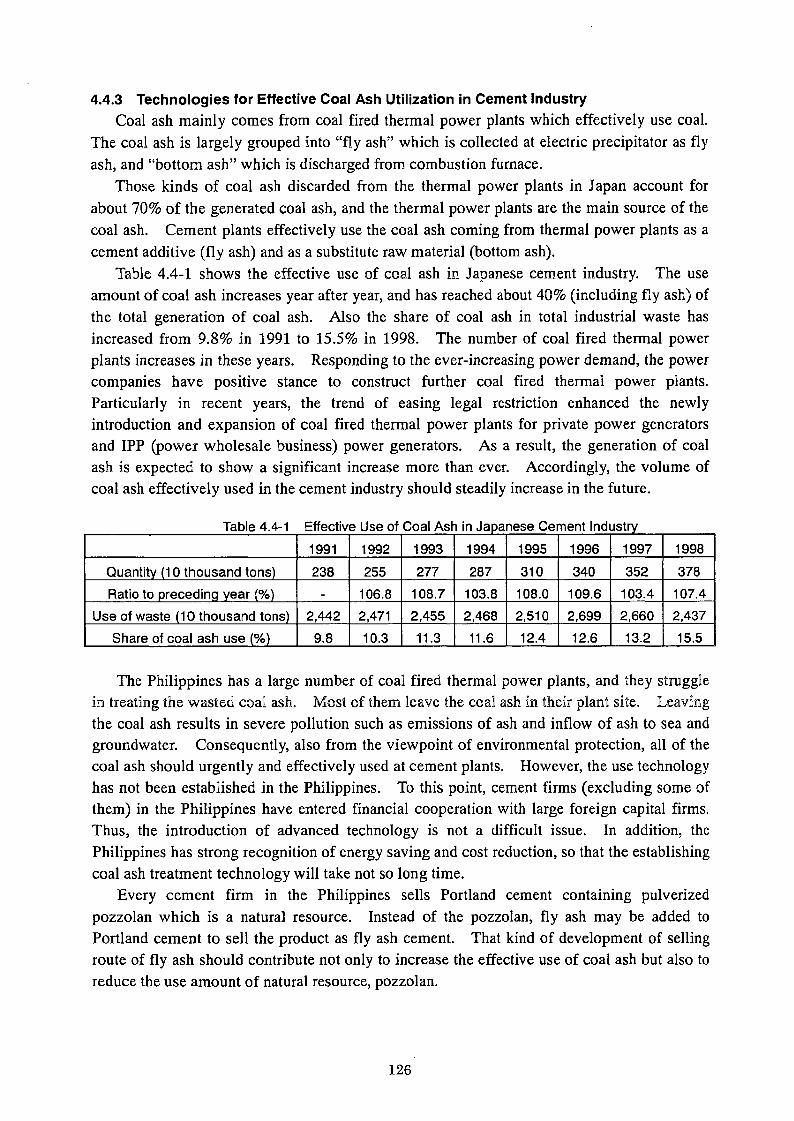
4.4.3 Technologies for Effective Coal Ash Utilization in Cement IndustryCoal ash mainly comes from coal fired thermal power plants which effectively use coal.
The coal ash is largely grouped into “fly ash” which is collected at electric precipitator as fly ash, and “bottom ash” which is discharged from combustion furnace.
Those kinds of coal ash discarded from the thermal power plants in Japan account for about 70% of the generated coal ash, and the thermal power plants are the main source of the coal ash. Cement plants effectively use the coal ash coming from thermal power plants as a cement additive (fly ash) and as a substitute raw material (bottom ash).
Table 4.4-1 shows the effective use of coal ash in Japanese cement industry. The use amount of coal ash increases year after year, and has reached about 40% (including fly ash) of the total generation of coal ash. Also the share of coal ash in total industrial waste has increased from 9.8% in 1991 to 15.5% in 1998. The number of coal fired thermal power plants increases in these years. Responding to the ever-increasing power demand, the power companies have positive stance to construct further coal fired thermal power plants. Particularly in recent years, the trend of easing legal restriction enhanced the newly introduction and expansion of coal fired thermal power plants for private power generators and IPP (power wholesale business) power generators. As a result, the generation of coal ash is expected to show a significant increase more than ever. Accordingly, the volume of coal ash effectively used in the cement industry should steadily increase in the future.
Table 4.4-1 Effective Use of Coal Ash in Japanese Cement Industry
1991 1992 1993 1994 1995 1996 1997 1998
Quantity (10 thousand tons) 238 255 277 287 310 340 352 378Ratio to preceding year (%) 106.8 108.7 103.8 108.0 109.6 103.4 107.4
Use of waste (10 thousand tons) 2,442 2,471 2,455 2,468 2,510 2,699 2,660 2,437Share of coal ash use (%) 9.8 10.3 11.3 11.6 12.4 12.6 13.2 15.5
The Philippines has a large number of coal fired thermal power plants, and they struggle in treating the wasted coal ash. Most of them leave the coal ash in their plant site. Leavingthe coal ash results in severe pollution such as emissions of ash and inflow of ash to sea and groundwater. Consequently, also from the viewpoint of environmental protection, all of the coal ash should urgently and effectively used at cement plants. However, the use technology has not been established in the Philippines. To this point, cement firms (excluding some of them) in the Philippines have entered financial cooperation with large foreign capital firms. Thus, the introduction of advanced technology is not a difficult issue. In addition, the Philippines has strong recognition of energy saving and cost reduction, so that the establishing coal ash treatment technology will take not so long time.
Every cement firm in the Philippines sells Portland cement containing pulverized pozzolan which is a natural resource. Instead of the pozzolan, fly ash may be added to Portland cement to sell the product as fly ash cement. That kind of development of selling route of fly ash should contribute not only to increase the effective use of coal ash but also to reduce the use amount of natural resource, pozzolan.
126
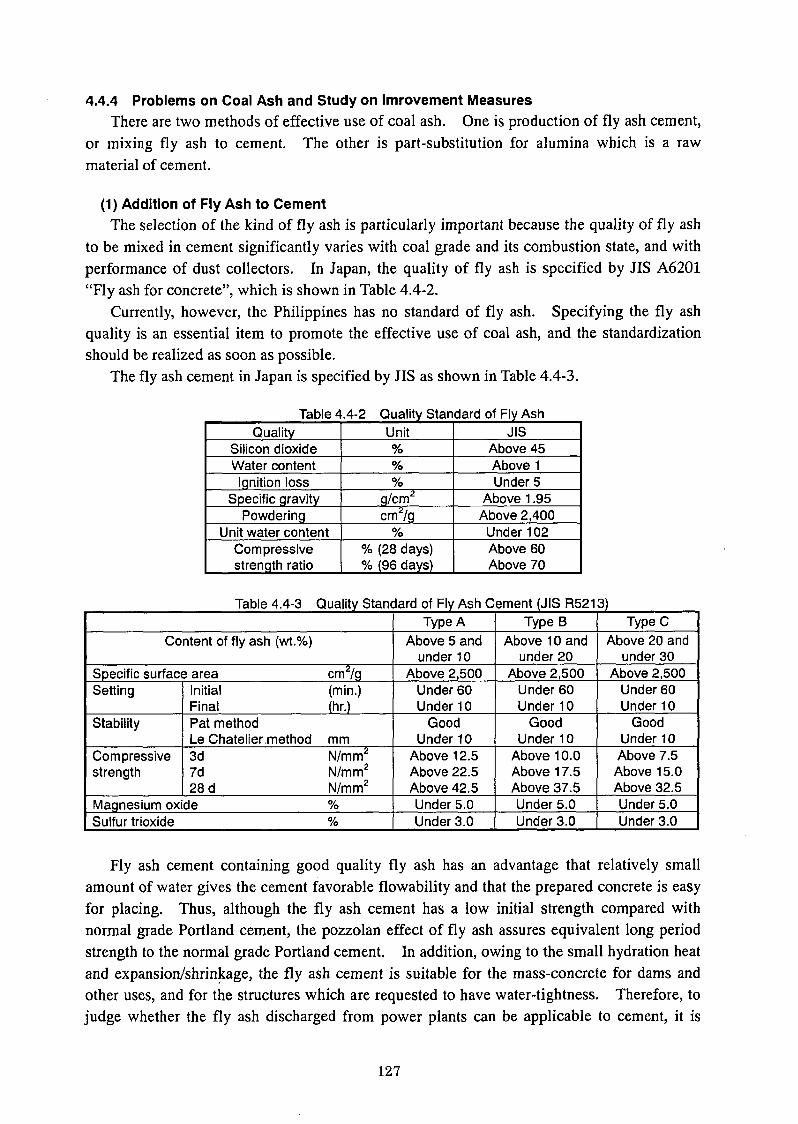
4.4.4 Problems on Coal Ash and Study on Imrovement MeasuresThere are two methods of effective use of coal ash. One is production of fly ash cement,
or mixing fly ash to cement. The other is part-substitution for alumina which is a raw material of cement.
(1) Addition of Fly Ash to CementThe selection of the kind of fly ash is particularly important because the quality of fly ash
to be mixed in cement significantly varies with coal grade and its combustion state, and with performance of dust collectors. In Japan, the quality of fly ash is specified by JIS A6201 “Fly ash for concrete”, which is shown in Table 4.4-2.
Currently, however, the Philippines has no standard of fly ash. Specifying the fly ash quality is an essential item to promote the effective use of coal ash, and the standardization should be realized as soon as possible.
The fly ash cement in Japan is specified by JIS as shown in Table 4.4-3.
Table 4.4-2 Quality Standard of Fly AshQuality Unit JIS
Silicon dioxide % Above 45Water content % Above 1
Ignition loss % Under 5Specific gravity g/cm2 Above 1.95
Powdering cm2/g Above 2,400Unit water content % Under 102
Compressive strength ratio
% (28 days)% (96 days)
Above 60 Above 70
Table 4.4-3 Quality Standard of Fly Ash Cement (JIS R5213)Type A Type B Type C
Content of fly ash (wt.%) Above 5 and under 10
Above 10 and under 20
Above 20 and under 30
Specific surface area cm2/g Above 2,500 Above 2,500 Above 2,500Setting Initial (min.)
Final (hr.)Under 60 Under 10
Under 60 Under 10
Under 60 Under 10
Stability Pat methodLe Chatelier method mm
Good Under 10
Good Under 10
GoodUnder 10
Compressivestrength
3d N/mm27d N/mm228 d N/mm2
Above 12.5 Above 22.5 Above 42.5
Above 10.0 Above 17.5 Above 37.5
Above 7.5 Above 15.0 Above 32.5
Magnesium oxide % Under 5.0 Under 5.0 Under 5.0Sulfur trioxide % Under 3.0 Under 3.0 Under 3.0
Fly ash cement containing good quality fly ash has an advantage that relatively small amount of water gives the cement favorable flowability and that the prepared concrete is easy for placing. Thus, although the fly ash cement has a low initial strength compared with normal grade Portland cement, the pozzolan effect of fly ash assures equivalent long period strength to the normal grade Portland cement. In addition, owing to the small hydration heat and expansion/shrinkage, the fly ash cement is suitable for the mass-concrete for dams and other uses, and for the structures which are requested to have water-tightness. Therefore, to judge whether the fly ash discharged from power plants can be applicable to cement, it is
127
important to identify the quality of fly ash and to perform satisfactory quality control. For example, if the combustion control at power plant is poor to result in existence of unburnt carbon in the fly ash, that kind of fly ash cannot be used as the additive to cement. Nevertheless, that poor quality fly ash is possible to be used as a substitution raw material for cement.
In the past, it is reported that there are some firms in the Philippines which purchased fly ash from power plants to effectively use as a cement additive. The firms surveyed at this time, however, do not use fly ash. The main reasons of not using the fly ash are: that the price of fly ash as an industrial waste is as high as that of cement under the current state even under a current state that the power plants have problem of fly ash treatment (securing discarding sites); that insufficient combustion control at power plant leaves unburnt carbon in the fly ash; and that significant fluctuations in composition of fly ash occur between lots. Consequently, it is essential for the power plants to conduct correct combustion control and to improve burners and combustion units for assuring complete combustion. As for the coal purchasing side, it should be emphasized that a scheduled coal purchase should be done and that the fluctuations in composition of fly ash generated from power plants should be minimized, for example, by applying premixing.
At present, a part of fly ash are reported to be used as an aggregate of concrete. The use of fly ash cement which utilizes fly ash should be studied. To do this, the standardization of fly ash cement and the development of users of fly ash are the most important issues. Particularly for the application development, there is a model in Japan, in which the features of fly ash are fully grasped to steadily develop users suitable for individual features. If the fly ash cement is used at an application that does not fit the properties of fly ash cement in an easy-going style and if the reliability to fly ash cement is lost, then the recovery of once-lost reliability will take a long time. As seen in recent Japan, it might be an expected method to change the product mode to a blast furnace cement mixed with fly ash cement, not the sole fly ash cement. Inside the Philippines, pozzolan cement has long been used and is accepted by the users. The fly ash cement, however, is not accepted by the users owing partly to the insufficient distribution. Anyhow, it should also be emphasized that, in view of environmental protection, the government and the Philippines Cement Association should jointly popularize the effectiveness of fly ash generated from thermal power plants and of fly ash cement produced using the fly ash.
For reference, Fig. 4.4-7 shows the trend of fly ash cement production in Japan.
128

The fraction of each cement raw material depends on the chemical composition of every raw material. Generally speaking, however, about 200 kg of clay raw material is used to produce one ton of normal grade Portland cement. Accordingly, if poor quality fly ash and bottom ash are used to a part of the natural clay raw material, the effective use rate of coal ash generated from power plants should markedly increase.
Example: 3,000 t-cli/d kiln (cliiclinker)The use amount of coal ash as a substitute raw material is assumed to 100 kg/t-cli, about half the clay use amount,100 kg/t-cli x 3,000 t/cli-d x 30 d = about 10,000 t/mThat is, the coal ash is used at about ten thousand tons a month.
In using coal ash as a substitute raw material, there needed no severe quality control for adding the coal ash to cement. And, any type of fly ash are applicable without problem: for example, poor quality fly ash containing unbumt matter and coarse fly ash generated from old power plants using stoker incineration.
In the case that coal ash is used as a raw material of cement, powder is difficult for handling and may raise dust problem. Therefore, in that case, water may be added to the coal ash, (wetting coal), to apply similar handling with normal raw materials. In general, coal ash has an advantage that existing facilities of raw material (clay) acceptance, storage, and supply can be used to mix it with specified raw material at a specified ratio, and that existing raw material mill is applicable. The coal ash, however, has a problem of clogging at several sections. In the case that coal ash is not wetted, or dry coal ash, dust emission problem may occur, and exclusive-use transfer vehicles and exclusive-use acceptance, storage, and discharge units are required, which increases the investment cost. However, the dry coal ash does not need to pulverize by existing raw material mill, and allows the direct mixing in a transfer machine at exit of raw material mill, in a raw material blending silo, or in a raw material storage silo. In addition, the dry coal ash raises no clogging problem at any section. Fig. 4.4-8 shows a cement production process diagram.
For the case of the Philippines, the technology for using coal ash such as fly ash and bottom ash as a raw material of cement shows very little progress. However, for the case that wet ash is used as a substitute for raw material of cement, the existing facilities can be used with little modification, so that the use of wet ash is possible if only the handling technology of coal ash is obtained. Consequently, positive use of coal ash should promptly be considered.
130

For cement plants, however, the increase in coal ash use may be difficult, in view of cost competitiveness of the plants, unless the price of fly ash at plant site is less than the price of natural clay raw material at plant site. Therefore, it may be a feasible means that each cement firm grasps the relative location between their plant and the target power plant, and selects a nearby power plant as the supplier (with less transportation cost).
131

4.5 Study to Introduce Coal Utilization Technology in Household Fuel Sector 4.5.1 Study to Introduce Coal Briquetting Technology
(1) Quality of Briquette for Household Fuel SectorWhen the briquettes are used as public energy, if anthracite can be adopted as the raw
material, smokeless and odorless briquettes are supplied. The production of anthracite is, however, limited over the world in terms of both quantity and area, so that the use of anthracite as the raw material of briquettes is impossible.
That is, as of the total global coal production of about 3.8 billion tons, the share of anthracite is only about 2 to 3%, accounting for 100 million tons, and the anthracite is found only in China, Vietnam, Korean peninsula, Russia, and limited areas in South Africa.
Consequently, the low temperature carbonization process (developed by the Agency of Science and Technology of the Ministry of International Trade and Industry) invented for manufacturing raw material of smokeless and odorless clean briquettes is applied to anthracite, thus supplying the smokeless and odorless briquettes as public energy source.
(2) Features of Smokeless Briquettes
a. Smokeless and odorlessSince the briquettes emit no smoke and odor under combustion, no stack is necessary.
Accordingly, no smoke problem is induced even when the briquettes are burnt in houses.
b. Igniting performanceSince the raw material coal is treated by low temperature carbonization, the prepared
briquettes have good igniting performance because they hold sufficient quantity of volatile matter within a smokeless range and because the coal particles give lots of air bubbles. Compared with simple anthracite briquettes, the prepared briquettes give good igniting performance. By adding an ignition agent, a lighted match can ignite the briquette.
c. EconomyA low grade coal can be used as the raw material, and unused materials such as powdered
portion can be used without treatment. The carbonized gas consisting mainly of volatile matter generated in the carbonization process can be recycled as heat source for drying the raw material coal and the products.
d. Extended effect• Protection of forest resource as the source of absorption of global warming gas CO2
and prevention of disaster.• Effect of energy saving and effect of reduction in total volume of CO2 owing to the
high combustion efficiency.• Effective use of low grade coal by quality improvement.• Promotion of coal industry in Cebu, (domestic coal).• Inexpensive and simple use method.• Possible for manufacturing only with local raw materials, (utilization of low grade
133

coal of Cebu)• Easy for technology transfer.• Easy introduction to regional small to medium industries, giving effect of
employment.• Free from smoke and odor, without air pollution. No possibility of contamination
of interior of houses by tar in coal.• Environmental improvement and public living improvement through the supply of
good quality and inexpensive household energy.® Contributing to living improvement particularly of poor people.• Offering opportunities for the business on CO2 emitting right in the future.
134
Chapter 5 Studies to Introduce Environmentally-Friendly Coal Utilization System for Effective Use of Domestic Coals
The most of the Philippine’s domestic coals under mining are semi-bituminous coals. The largest user of the biggest coal mine, Semirara coal, is the power generation of the single coal combustion (Unit #2) and the mixed coal combustion (Unit #1) at Calaca electric power plant. There are lignites with still less heat capacity, about 2,000 - 3,000 kcal/kg, than semi-bituminous coals in various locations centering at Northern Luzon Island. Theoretical reserve volume at Cagayan area is about 340 million tons, and the definite reserve amount is about 100 million tons, and DOE has a strong motivation for development of this lignite. As the development plan could be accelerated depending upon the users and the consumption volume, we propose the power generation by the improvement of low rank coals and the shift to CWM (Low Rank Coal-Coal Water Mixture), as a measure to support the development.
5.1 Study for Introduction of Coal Water Mixture Production TechnologyThe following is a brief description of the estimated coal character in the case that we im
prove the quality of lignite of Cagayan Basin mine in Cagayan area by the HWD (Hot Water Drying)process, treat it on CWM, and then combust by a power generation boiler, and the equipment and cost required for the series of quality improvement and CWM process. For detail, refer to the Report of NEDO-C-9829, FY 1998.
(1) Estimated LRC-CWM CharacteristicsTable 5.1-1 is the properties of the low coal, estimated properties of the coal after the im
provement and the estimated CWM characteristics of the coal after the CWM process.Here, the coal selection has been made as the pre-process.
As the improvement up to the pores in the grain is necessary, to maintain good and irreversible improvement, it is necessary to crush the raw coal down to the grain size of below 3 mm. The pulverized coal after the improvement is consequently difficult to handle. CWM is the technology to most efficiently handle such pulverized coal. Despite that the high density CWM contains 30 - 40% of water, it can present the combustibility that is equivalent to the bituminous coal, by the direct injection into the boiler. Also, CWM has a number of merits such as pipe line transportation, tank storage, etc., and in addition in the case of LRC-CWM, as the grain surface is covered with water, there is no risk of self ignition.
The calorific value after the processing to CWM can be expected at 4,200 kcal/kg-CWM, that is nearly two times of 2,000 - 3,000 kcal/kg-coal (after the coal selection) of the original raw coal.
135
The process is structured as follows;a. Store the raw coal, after the coal selection and deliming, in the coal bin.b. Crush the coal down to the grain size of below 1 mm. The raw coal contains about
50% of water content, but still add water to make a liquid slurry of the density at about 30%.
c. Pressurize by the high pressure slurry pump up to 130 - 150 kg/cm2, and send the slur
ry by pressure to the improvement reaction kiln.d. Hold up the slurry in the reaction kiln of the temperature at about 300 °C, to improve
the quality of the raw lignite to the level of bituminous coal.e. After the improvement, return to the normal pressure, send the improved powder coal
slurry to the dehydrator.f. Dehydrate down to the coal density of 65 - 70%.g. Then, add small amounts of dispersant, stabilizer, and density adjustment water, and
mix with the powder coal in the mill, to adjust to the grain size distribution for the CWM process.
h. Further mix the high viscosity slurry of insufficient mixing from the mill, to do the final adjustment of CWM.
i. Store the CWM product in the storage tank until the delivery. From then, the handling will be all by the through-pipe transportation by pumping, which is very simple, unlike the conventional coal bulk handling.
(3) The Production Cost of LRC-CWM
a. Conditions for the cost calculationA thermal power plant having 350 MW of capacity is selected as the target plant.
The conditions for computing the production cost of CWM for the plant boiler are the following.
• Modification-CWM process:• Power generation size:• CWM production size:• Annual operation time:• Raw coal consumption:• Improvement conditions:• CWM coal density:• Admixture:• Product coal grain size:
HWD-JGC Corp.350 MW (utilization rate of 70%) 1,000,000 t/year (500,000 t/y x 2 systems)7.000 hour1.300.000 t/year320 °C, 150 kg/cm2, 30 minutes
65%Didpersant 0.5%, stabilizer 0.02%Max. 500 pm, Average 30 pm
137

b. Major devices of equipmentThe following is the major devices of equipment from the acceptance of the raw coal
to the delivery of the improved CWM product.Raw coal handling equipment: Raw coal slurrying equipment: Improvement equipment:
CWM processing equipment:
Storage/delivery equipment: ingAdmixture injection apparatus Waist water treatment equipment: Electric/instrumentation equipment: Quality control equipment:
Unloader, Sairo, Conveyor Pulverizer, Slurry mixing layer Pressure pump, heating furnace, heat exchanger, reactor, depressurizing valveDehydrator, Pulverizer, high speed cutter mixerDome roof tank, delivery pump, and pip-
Chemical tank, injection pump 1 system 1 system 1 system
c. Plant construction costThe coal produced from a mining in Sierra Madre mountains is transported to nearby
Cagayan River, which is then transported by barges to Apari, a port town facing the Babuyan Channel, (about 70 km of river transportation), where the coal is prepared in CWM. From the port to the consumers' site, a CWM ship is applied. Naturally, detail survey on construction environment centering on infrastructure, port, water depth, etc. is required in the future.
Approximate estimation of investment for one million ton per year of LRC-CWM manufacturing plant excluding sea pier facilities was calculated.
Equipment cost:Material cost:Transportation cost:Direct cost:Test operation and SV cost: Design and administration cost: Work cost:Total:
75.000. 000 US$12.000. 000 US$ 8,000,000 US$8.000. 000 US$1.000. 000 us$
10.000. 000 us$29,000 000 US$
143,000,000 US$(Production plant of 1 million tons per year)
d. Plant cost of CWMA rough price, on the plant yard delivery basis, covering a series of production flow
such as to purchase the raw coal from the mine, improve it and process it to CWM, store the product in the delivery tank. (Production profit is not included)
Table 5.1-2 shows the result.
138

Fable 5.1-2 LRC-CWM Production Cost EstimationItem Content US$/t-CWM Remark
(Raw coal) (5.0 US$/t-coal) Plant acceptance priceCoal cost 6.5 Coal cost in CWMAdmixture 5.0 Dispersant + AtabilizerOthers 2.0 Royalty, etc.Maintenance 2.9 2% of the construction costLabor cost 1.5 500 persons, 10US$/dayIndirect labor cost 1.0 Water, heat, electricity, administration costInterest/Cost depreciation 12.4 Interest 7%, repayment in 15 years
Total (FOB-Apari Port) 31.3 US$/t-CWMCalorific value cost 0.75 US t /1,000 kcal
The estimated LRC-CWM production cost of one million tons is based on the condition that the raw coal price from the mine, including coal selection, is 5 US$/t, and it does not include the construction cost of the port peer. Adding the profit of the plant and the transportation cost to the power plant in the suburban area of cities, the total price will be nearly US$40 per CWM ton. The current domestic sub-bituminous coal (Semirara coal) GIF power plant price at about US$30. We can not but admit it is too high compared with import coals of US$25 - 35.
However, as the cost will be lower in a large scale production plant (3,000 - 5,000 ktons/y) and the merit that unused domestic lignites can be presented for combustion at the quality equivalent to bituminous coals, and allows the use of existing bituminous coal combustion boilers, is a large merit. As it requires no coal yard, and simplifies the coal lifting equipment, the cost at the power plant will be lower than the powder coal combustion.
The problems to meet the expanding electric power demand which can be estimated on the economic growth potential in the Philippines after 2000, and to get out of the current dependency of the most of energy source to overseas sources, the solution by the utilization of domestic resources by using such new technologies as this system is desired.
(4) Simplification of the Power Plant by the Application of CWMFig. 5.1-2 shows that there is no basic difference between the conventional pulverized
coal-fired power plant and the improved CWM power plant. Simplification of the coal lifter and the reduction in the desulfurization and deliming equipment (needs coal selection) are large advantaged.
At the pulverized coal-fired power plant, the coal yard as the coal storage facility requires such heavy machines as the unloader, the reclaimer, and the belt conveyer as well as. a wide lot. On the other hand, the CWM combustion requires only such compact equipment as the pipeline, load lifting pump, and the tank. As it is a closed system, it will not cause dust problems, and will keep the environment clean.
139

Ill Summary

Summary
On November 20, 1998 New Energy and Industrial Technology Development Organization (NEDO) entrusted a project, “Research Program for Environmentally-Friendly Coal Utilization System in the Philippines” to Center for Coal Utilization, Japan (CCUJ). In 1999 CCUJ concluded a contract to continue the survey of 2nd year with NEDO, and conducted the survey in cooperation with Data Base Development Project Team, Department of Energy, the Republic of the Philippines.
Both parties prepared the contents and plan of the survey. According to the program, the survey is conducted in the following items.
(1) Present state of economy and energy in the Philippines(2) Environmental state in the Philippines and national environmental policy(3) Present state of coal utilization in individual industries Study on introduction of
environmentally-friendly coal utilization system(4) Study on introduction of environmentally-friendly coal utilization system relating to
effective use of domestic coal
As survey team dispatched to the Philippines for eleven days from November 17, 1999, visited DOE and DENR, NPC and individual industries and its utilization and conducted an environmental analysis.
Based on the survey conducted over two years, the introduction of environment friendly coal utilization system relating to each industry is described below.
1. Introduction of Environmentally-Friendly Coal Utilization System for Electric Power Industry
At this survey, four coal-fired thermal power plants among six of them in the Philippines, and one coal mine at Cebu were investigated. DOE has a policy to promote utilization of domestic coals under the leadership by the government. However power plants uses a large amount of imported coals, and the use of domestic coals have not been much increased compared with imported coals, due to the low rank coal (High Sulfur content, high moisture content, low calorific value, etc.) and the high price. Also the mechanization has not progressed yet in the mines, and the provision of infrastructure is delayed. It will be difficult to drastically increase the production amount of domestic coals.
The Philippines has a plan to install coal mining site thermal power plants at five locations by 2009. The installation of these plants is expected to increase the domestic coal consumption. Nevertheless, the share of imported coal will show a significant increase, and the kinds of coal grades will also increase.
The property of coals will significantly influence the combustion characteristics, and the discharge characteristics of NOx, SOx, and unburnt matter in ash vary depending on the types of coal. Therefore, the environmentally-friendly coal utilization system under the environ
141

ment policy of power industry should be able to comply with a wide range of coal types. Also, as the restriction on the SOx emission level is being severed, the technology to meet this requirement is required.
Based on such situation, we have conducted the study for the introduction of environmen- tally-friendly coal utilization system to the electric power industry. As the result, we have come to the conclusion that the combustion improvement technologies such as the in-fumace denitrification process, the new low NOx burner, the super coal pulverizing technology, and the combustion diagnosis technology, to cope with the expanding use of imported coals. As to the exhaust smoke processing technology, the simplified wet lime-gypsum and other technologies should be introduced.
For the promotion of domestic coal utilization, it is the most important to utilize domestic coals by improving their low quality. The power generation by the improvement and CWM processing of low rank coals (LRC-CWM) will be very effective, as the technology to meet this requirement.
We would like to expect that these technologies will be introduced into the Philippines, and will contribute as a means for the environment preservation in the Philippines.
2. Introduction of Environmentally-Friendly Coal Utilization System for Cement IndustryThe survey at this time revealed that the cement industry does not effectively use coal and
coal ash. Since a part of the cement plants do not apply combustion control, it should be emphasized the full scale implementation of combustion control using instruments which continuously analyze the oxygen concentration and carbon monoxide concentration in the preheater flue gas.
Since fly ash discharged from power plants and other facilities is possible to be effectively used as fly ash cement by adding the fly ash to cement, and is possible to be effectively used as a cement raw material, it is wanted to establish further close relationship between the power industry and the cement industry to make efforts to effectively use the fly ash.
The introduction of circulating fluidized bed boiler (CFB boiler) to cement plants allows the effective use of CFB boiler combustion ash as a raw material of cement. Compared with the conventional pulverized coal fired boiler, the CFB boiler has an advantage that various kinds of fuels can be combusted in low pollution state. Therefore, the CFB boiler is a boiler that satisfies the requirements of environmental issues and of energy saving issue.
Furthermore, since the cement industry is not difficult to effectively use the low grade domestic coal, if the cost-competitive domestic coal is developed, the consumption of domestic coal should increase.
For the cement industry, sustainable improvement in energy consumption efficiency, promotion in coal-shift business and in dust-preventive measures for environmental conservation are important and essential requirements.
142

3. Introduction of Environmentally-Friendly Coal Utilization System for House hold Fuel Sector
The Philippines consumes a huge volume of wood fuel such as charcoal and wood in households, tobacco curing, etc., and it takes 80 % (predicted in 2000) of total consumer energy consumption. The consciousness to substitute these forest resources by briquettes is growing stronger in the Philippines, and the production and distribution are practiced in some parts of the country.
The briquette coal, currently used in the Philippines, is the semi-anthracite produced inside the country. But it is limited to a small quantity, and is not likely to be able to meet a huge amount of demand in the future. Also it gives out smoke and smell in the early stage of combustion, some improvement will be needed. To break through this problem in the material side, it is being studied either to imported anthracite coal, or to improve domestic coal (smoke coal) to anthracite, and the latter is expected as the new demand for small and medium size mines in the country.
Under the above mentioned conditions, it is required to improve the domestic coal to smokeless/odorless, in order to supply as coal briquettes for consumer energy in the Philippines, and there is a good background for the introduction of the environmentally-friendly coal utilization system.
143

Conclusion
The Republic of the Philippines is not a country of abundance of energy resources. However, the country has various kinds of energy resources such as oil, natural gas, coal, hydraulic energy, and geothermal energy. And, particularly for the production and utilization of geothermal energy, the Philippines is the second to the U.S.A. On the other hand, oil still occupies the largest share of the total energy consumption, and coal share is not necessarily high. Currently, about 22% of the domestic coal consumption is supplied from domestic coal, and 80% is imported coal coming from Indonesia, Australia, and other countries.
Owing to the reduced investment in the current economy recession, to the low quality of domestic coal, and to the labor problems in the country, the production of domestic coal in the Philippines shows a reducing trend during and after 1993. Several coal mine firms had to shutdown the mines resulted from free-import of coal and from the resolution of the restriction of import coal quantity. In this situation, the Philippines government has formulated the Coal Development Plan (CDP) for solving the various problems related to coal and for implementation of future plan, thus promotes the activation of existing coal mines and the exploration, investment, and development of coal production.
The main part of the coal demand is occupied by electric power industry and cement industry. The coal demand in 1998 was only a level of 5.71 million tons. The government, however, plans to raise the current domestic annual coal production rate from 1.20 million tons to 5 million tons by 2008, expecting the reduction of the share of imported coal to the total coal demand from 78% in 1998 to 70% in 2008.
According to the national energy policy during a period of from 1999 to 2008, the development of electric power industry includes the shut down of old-fashioned oil-fired power plants, and the start of operations of three units of combined cycle gas turbine power generation plants (CCGT) using natural gas in 2002 - 2003.
Furthermore, during a period of from 2007 to 2009, construction of mine mouth coal-fired power plant using domestic coal is planned at Isabera, Cagayan Valley, and Zamboanga.
On the basis of the survey on the electric power industry, the cement industry, and the household fuel sector, over two years of period, we investigated the environmentally-friendly coal utilization system which can be introduced to the Philippines, and have proposed coal utilization system for individual sectors.
The effective use of domestic coal is extremely important for sustaining and activating the Philippines’ coal industry. Thus, the Japan and the Philippines governments should give every effort under a close mutual cooperation to realize the object.
144