*research paper mapping of variability in major · pdf file11 saifur kale 34-16-41n 71-41-53e...
TRANSCRIPT

1
*Research Paper 1 MAPPING OF VARIABILITY IN MAJOR AND MICRO NUTRIENTS FOR 2
SITE-SPECIFIC NUTRIENT MANAGEMENT 3
4
Mohammad Jamal Khan1, Muhammad Rashid
1, Shamsher Ali
1 5
Inayat Khattak2 and Shahida Naveed
3 6
7
1Department of Soil and Environmental Sciences, KPK Agricultural University 8
Peshawar, Pakistan 9 2NRM Coordinator BKPAP,SRSP,KARAK 10
3 Department of Botany,University of Peshawar 11
12
13
ABSTRACT 14
15
A survey was made to determine the spatial variability of soil properties and their mapping in 16
Charsadda district (KPK) of Pakistan. Soil sampling was done on a grid system using Global 17
Position System (GPS) from two depths (0-15, and 15-45 cm) during 2004 and were analyzed 18
for soil physical properties (soil texture and saturation percentage), soil chemical properties 19
(pH, ECe, SAR, lime, and organic matter) and soil fertility status (mineral N, AB-DTPA 20
extractable P, K, Zn, Cu, Fe, Mn and HCl extractable B). Geostatistical techniques of 21
semivariogram analysis and kriging were used to model the spatial variability and interpolation 22
of data values at unsampled locations and mapping of the district. Semivariogram analyses of 23
data showed some spatial patterns for soil properties. Silt (r2=0.48) and clay (r
2=0.71) contents 24
and saturation percentage (r2=0.71) were described by linear model in the surface soil in both 25
the depths. Electrical conductivity was described by a linear model in both the depths with 26
strong spatial structure in surface soil (r2=0.81). Lime content (CaCO3) in the surface soil have 27
strong spatial structure (r2=0.59), organic matter content in the surface soil was described by a 28
spherical model with a range of influence 6.65 km while in the subsoil, it was described by a 29
linear model with moderate spatial structure (r2=0.41). Mineral N and P were described by 30
linear models with strong spatial structure for P in both the depths (r2=0.77, 0.73) and moderate 31
spatial structure (r2=0.36) for surface soil N. Potash content was described by a linear model in 32
surface soil with moderate structure (r2=0.24), while in subsoil it was explained by a spherical 33
model with strong spatial structure (r2=0.64) and a range of about 9 km. Zinc and Cu in the 34
surface soil were randomly distributed, while they have strong spatial structure (r2=0.63 and 35
0.54, respectively) with a linear model in subsoil. Boron content in both the depths was 36
described by a linear model with strong spatial structure in surface (r2=0.61) and moderate 37
structure (r2=0.31) in subsoil. The data on various measured soil properties and the 38
semivariogram models developed were used to estimate the soil test values at unsampled 39
2
locations using geostatistcal technique of kriging. Maps were developed using Surfer 6.04 40
programme and the areas were delineated into low, medium and high level of plant nutrients 41
for site-specific nutrient management using variable rate fertilizer technology. 42
43
INTRODUCTION 44
45
Crop production is affected by various factors that vary both in space 46
(spatial variability) and time (temporal variability). Spatial variability of soil 47
chemical and physical properties influences soil and crop management efficiency 48
as well as the design and effectiveness of field research trial (Bhatti, etal., 1991; 49
Warren and Mendez, 1981; Bhatti and Rashid, 2005; Van Es etal., 1989; Brownie 50
etal., 1993; Fagroud and Van Meirvenne, 2002). Spatial variability in soil 51
properties causes uneven crop growth, confounds treatment effects in field 52
experiments, and decreases the effectiveness of uniformly applied fertilizer or 53
chemical amendments on field scale (Mulla etal., 1990a; Kang and Moorman, 54
1977; Bhatti etal., 1999; Bhatti and Mulla, 1995). Understanding the magnitude 55
and pattern in spatial variability of soil properties is necessary for improved 56
management options relating to application of fertilizers and strategies for 57
sampling and design of field research trials and mapping of field on small scale 58
and districts on large scale (Bhatti and Mulla, 1995; Bhatti etal., 1998a, b; Rafique 59
etal., 2001; Wendroth etal., 2001). Soil variability has been extensively studied in 60
the past by soil scientists (Vieira etal., 1981; Tabor etal., 1985; Trangmar etal., 61
1987; Mulla etal., 1990; Miller etal., 1988). 62
Geostatistical approaches involve analysis and modeling of spatial patterns using 63
semivariograms and pattern interpolation and mapping using punctual kriging. 64
Kriging method of interpolation has been successfully applied to regionalized 65
variables in mining (David, 1977), hydrology (Delhome, 1978), soil science (Hajra 66
Suliha etal., 1980; Trangmar etal., 1987; Nash etal., 1988; West etal., 1989; Mulla, 67
1988; Bhatti etal., 1991; Bhatti etal., 1998), heavy metals in soils (Andronikov 68
etal., 1997; Burgos etal., 2000; Navas and Machin, 2002) and crop science 69
3
(Trangmar etal., 1987; Perrier and Wilding, 1986; Bhatti etal., 1999; Vieira etal., 70
1983; Sadler etal., 2005). 71
Keeping in view the importance of spatial variability, this project was 72
carried out to model the spatial variability of soil properties and their mapping in 73
Charsadda district of Khyber Pakhtoon Khwa (KPK) of Pakistan with the 74
objective to assess the spatial variability and current nutritional status of the soils, 75
delineate the area into different categories low, medium and high nutrients status 76
for site-specific plant nutrients management. (Mulla et al., 1992; Bhatti and Mulla, 77
1995; Wielsh etal., 2003; Juang et al., 2002; Bhatti et al., 1998c). 78
These information can be used for the best management of soil resources 79
for enhancing agricultural production and provided as base for further research by 80
the scientists. 81
MATERIALS AND METHODS 82
83
Intensive soil sampling from district Charsadda of KPK Province of 84
Pakistan was done on a grid system using Global Positioning System (GPS) during 85
2004. Stratified systematic unaligned sampling design (Webster and Olive, 1990) 86
was used for sampling. Whole area was divided into different roads i.e. Peshawar-87
Charsadda road, Tangi-Charsadda road, Rajarh-Takhtbai road, Umarzai-Harichand 88
road, Charsadda – Mardan road, and Charsadda – Nowshera road. Along each 89
road, soil samples were collected at a regular interval of 5 km and their 90
coordinates were recorded by GPS. Soil samples were collected from two depths 91
i.e. 0-15 and 15-45 cm depth. All the soil samples i.e. 88 samples from each depth 92
were collected from agricultural fields growing wheat crop. 93
Soil samples thus collected were brought to the laboratory of Soil and 94
Environmental Sciences, KPK Agricultural University, Peshawar, Pakistan. Soil 95
samples were air dried and sieved through a 2 mm sieve. Soil samples thus 96
prepared were analyzed for soil properties viz. texture (Gee and Bunder, 1986), 97
saturation percentage (Richards, 1954), pH (Mclean, 1982), electrical conductivity 98

4
(Richards, 1954), organic matter (Nelson and Sommers, 1982), lime i.e. CaCO3 99
using acid neutralization method (Nelson, 1982), SAR (Richards, 1954), total 100
mineral N (Keeney and Nelson, 1982), AB-DTPA extractable P, K, Cu, Zn, Fe and 101
Mn (Sultanpour, 1985), and boron by HCl acid method (Ryan etal., 2001). 102
Phosphorus was read on spectrophotometer, K on flamephotometer, and Cu, Zn, 103
Fe and Mn on atomic absorption spectrophotometer. Texture of the sampling 104
locations is given in Table 1. 105
106
107
108
109
110
111
112
113
114
115
116
117
118
119
120
121
122
123
124
125
126
127
128
129
130
131
132
133
134
135
136
137
138
139
140

5
Table 1: Location and Soil Texture of Sampling Sites (Soil Depth 0-15cm) 141
Location and Soil Texture of Sampling Sites (Soil Depth 15-45cm) 142
S.No Road
Location
GPS
Reading
Textural
Class
S.No Road
Location
GPS
Reading
Textural
Class
1 Arif abad 34-07-13N
71-39-34E
Silt loam 41 Mahmood
abad
34-09-27N
71-52-56E
Silt
2 Station kalla 34-18-24N
71-38-04E
Sandy
loam 42 Malagi kalle 34-08-48N
71-53-20E
Silt
3 Tangi bazaar 34-17-37N
71-39-20E
Silt loam 43 Patwari kalle 34-08-16N
71-53-32E
Silt
4 Tangi 34-17-27N
71-39-46E
Silt loam 44 Dusahara kalle 34-08-36N
71-54-02E
Silt loam
5 Hoara 34-17-23N
71-40-44E
Silt loam 45 Nazo kale 34-08-04N
71-52-57E
Silt loam
6 Shoakano
kalle
34-17-26N
71-41-28E
Loam 46 Aziz abad 34-07-47N
71-52-06E
Silt
7 Karhi wal 34-17-20N
71-41-35E
Loam 47 Ahmad khan
kalle
34-07-34N
71-51-24E
Silt loam
8 Tani wal
kalle
34-17-00N
71-40-55E
Silt loam 48 Captan kalle 34-07-42N
71-51-49E
Silt loam
9 Ummer zai 34-16-44N
71-41-24E
Sandy
loam 49 Sher bhadar
kakke
34-07-12N
71-50-18E
Silt loam
10 Hagi
Awaldin
kale
34-16-50N
71-41-26E
Sandy
loam 50 Nisatta 34-07-30N
71-48-03E
Silt loam
11 Saifur kale 34-16-41N
71-41-53E
Loam 51 Khan zada
kalle
34-07-32N
71-46-57E
Silt loam
12 Noor Muhd
kale
34-17-05N
71-42-05E
Silt loam 52 Policeline 34-08-04N
71-46-17E
Silt loam
13 Chacha khan
kale
34-17-25N
71-42-25E
Silt loam 53 Banda 34-07-58N
71-46-43E
Silt loam
14 Mamano
dhari
34-17-38N
71-42-45E
Silt loam 54 Gulballa 34-07-13N
71-39-19E
Silt loam
15 Zarin abad 34-17-56N
71-43-10E
Silt loam 55 Sardhariab
(mumtaz abad)
34-07-32N
71-41-01E
Silt loam
16 Zaim kale 34-17-20N
71-42-32E
Silt loam 56 Allahabad 34-08-18N
71-41-49E
Silt loam
17 Masal
korona
34-16-49N
71-42-15E
Silt loam 57 Shad abad
kalle
34-09-18N
71-43-05E
Silt loam
18 Aslam Khan
Kale
34-16-34N
71-42-12E
Silt loam 58 Ahmad abad 34-09-51N
71-42-58E
Silt loam
19 Sharpao
kalle
34-16-17N
71-41-54E
Silt loam 59 Ghidhare kalle 34-09-44N
71-42-44E
Silt loam
20 Maih kale 34-15-55N
71-41-46E
Silt loam 60 Sarki kalle 34-10-35N
71-42-03E
Silt loam
21 Maih jan
kale
34-15-37N
71-42-37E
Silt loam 61 Ummar abad 34-08-37N
71-45-31E
Silt loam
22 Umar zai 34-13-42N Silt loam 62 Nisatta 34-06-48N Silt loam

6
71-44-12E (tauhidabad) 71-47-53E
23 Torang zai 34-12-22N
71-45-21E
Silt loam 63 Nisatta (dagai) 34-06-23N
71-48-18E
Silt loam
24 Uttaman zai 34-10-54N
71-45-43E
Silt loam 64 Shah pasand
kalle
34-05-53N
71-48-53E
Silt loam
25 Rajarh kalle 34-10-22N
71-44-02E
Silt loam 65 Tarlandi
(bahram kale)
34-05-27N
71-49-30E
Silt loam
26 Muffti abad 34-11-04N
71-47-24E
Silt loam 66 Nawa kalle 34-04-34N
71-50-39E
Silt loam
27 Khan mai 34-11-57N
71-48-55E
Silt loam 67 Hishgi (hisar
kale)
34-03-55N
71-51-24E
Silt loam
28 Azam khan
korona
34-13-02N
71-50-36E
Silt loam 68 Guggar abad 34-02-55N
71-52-29E
Sandy
loam
29 Sadullah
khan kale
34-13-38N
71-50-29E
Silt loam 69 Nisatta (school
korona)
34-05-47N
71-48-43E
Silt loam
30 Behlola 34-14-34N
71-50-46E
Silt 70 Nisatta (madni
mahalla)
34-06-15N
71-48-00E
Silt loam
31 Hafiz abad
colony
34-09-20N
71-45-52E
Silt loam 71 Ummar zai
(qaiam abad)
34-14-35N
71-43-54E
Silt loam
32 Pola dhair 34-09-27N
71-46-33E
Silt loam 72 Khan ghari 34-15-29N
71-44-44E
Silt loam
33 Malka dhair 34-09-49N
71-38-35E
Silt loam 73 Qamar abad 34-16-24N
71-45-44E
Silt loam
34 Sar dairy 34-10-06N
71-50-08E
Silt loam 74 Dakki 34-17-25N
71-46-36E
Silt loam
35 Shah jahan
abad
34-10-29N
71-51-36E
Silt 75 Jahangir abad
(mandarhi)
34-19-09N
71-46-51E
Silt
36 Dargai 34-10-47N
71-52-50E
Silt 76 Uzbako 33-20-09N
71-47-03E
Silt loam
37 Manga kalle 34-11-18N
71-54-34E
Silt 77 Harichan 34-21-44N
71-47-54E
Silt loam
38 mandaro
kalle
34-11-38N
71-54-30E
Silt loam 78 Dahra kalle 34-17-48N
71-46-17E
Silt loam
39 Dargai hafiz
abad
34-10-52N
71-52-36E
Silt 79 Rajarh-
sharsadda
bypass
34-09-20N
71-44-36E
Silt loam
40 Dargai
railway
patak
34-10-16N
71-52-26E
Silt loam
The readings taken by GPS in degrees and minutes were changed to meters 143
and kilometers using Arc view GIS3.2 version. The far most western edge of 144
Charsadda was taken as zero point on X-axis, and the extreme southern end of the 145
district map as zero on Y-axis. Graphic lines were drawn at regular intervals on the 146
maps. Points were made on the map sheets from where the samples were collected 147
and then x and y coordinates were noted from the map of the district for further 148

7
analysis. Geostatistical technique of semivariogram analysis (Journal and 149
Huijbregts, 1978; Trangmar etal., 1987; Bhatti, etal., 1991) was used to determine 150
spatial structure of various sol properties. Soil test values at unsampled locations 151
were interpolated using geostatistical technique of punctual kriging (Marx and 152
Thompson, 1978; Trangmar etal., 1985) and detailed isarithmic maps were 153
prepared at smaller gird spacing using Surfer 6.04. 154
Geostatistical analysis of semivariogram and kriging of the collected data 155
on various soil properties was done using the Geo-Eas (US EPA). In case of 156
punctual kriging the search neighborhood was 10 km radius. In this study, the 157
linear and spherical models were the best fit using r2-values as a criterion to the 158
data on different soil physical and chemical properties. Arbitrarily a model with 159
r2< 0.20 was classified as poor, r
2 of 0.20 to 0.50 as moderate and r
2 >0.50 as 160
strong spatial structure. 161
RESULT AND DISCUSSION 162
Variability in soil properties 163
Considerable soil variation in various physical and chemical properties was 164
observed. In case of soil physical properties, variation in sand content was higher in both 165
the depths (41.4 and 44.1 %, respectively) than the other variables, while the lowest was 166
observed for saturation percentage (Table 2). In case of soil chemical properties, pH had 167
the lowest coefficient of variation (CV) in both the depths (4.80 and 6.30 %, respectively) 168
while SAR was found with the highest CV in both the depths (Table 3). As regards plant 169
nutrients, available P had the highest CV in both the depths (83.8 and 95.6 %, 170
respectively) as against the lowest CV (46.9 %) for available K (Table 4) in the surface 171
and available Zn (50.5 %) in the subsoil. It seems that there was a considerable 172
magnitude of variation in various soil physical and chemical properties and it needs to 173
identify the spatial patterns in the distribution of these properties. 174
175
176
177
178

8
Table 2 Descriptive statistics of soil physical properties (N = 79) 179
Property Mean Minimum Maximum CV (%)
(0-15 cm depth)
Sand (g kg-1
) 229 120 600 41.4
Silt (g kg-1
) 673 360 810 15.3
Clay (g kg-1
) 97.4 70 210 33.4
Saturation(g kg-1
) 227 220 340 14.3
(15-45 cm depth)
Sand (g kg-1
) 237 120 600 44.1
Silt (g kg-1
) 687 350 820 16.4
Clay (g kg-1
) 78.9 50 200 33.1
Saturation(g kg-1
) 208 180 330 12.5
180
Table 3 Descriptive statistics of soil chemical properties (N = 79) 181
Property Mean Minimum Maximum CV (%)
(0-15 cm depth)
pH 8.09 7.11 9.05 4.80
ECe (dS m-1
) 9.42 3.10 22.7 63.6
Lime (g kg-1
) 75 6.3 214 53.3
Organic matter
(g kg-1
)
13.7 0.4 42.3 55.2
SAR (m mol L-1
) ½
0.71 0.09 6.58 149
(15-45 cm depth)
pH 8.41 7.25 10.1 6.30
ECe (dS m-1
) 6.82 1.80 25.5 56.8
Lime (g kg-1
) 79.3 10 218 56.5
Organic matter
(g kg-1
)
10.5 1.5 25.8 58.8
SAR (m mol L-1
) ½
0.93 0.04 18.5 273
182
9
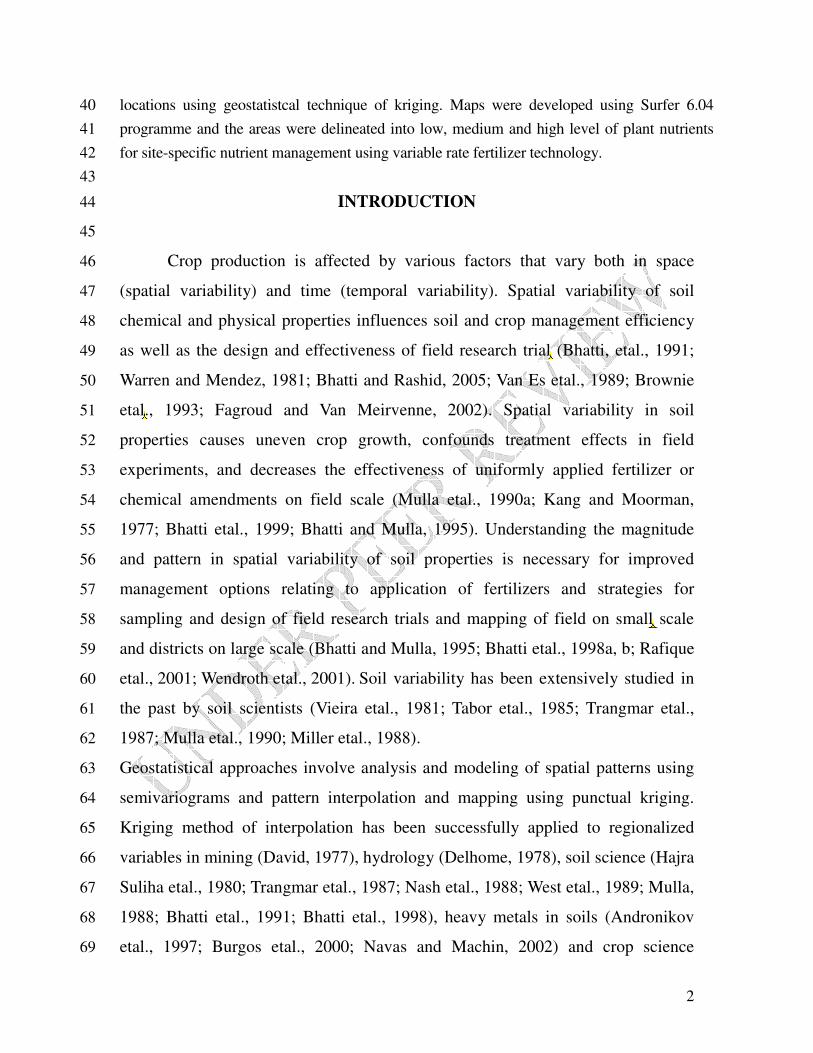
Table 4 Descriptive statistics of plant nutrients (N = 79) 183
Property Mean
Minimum Maximum CV (%) % Samples
Deficient Marginal Adequate
mg kg-1
(0-15 cm depth)
Mineral N 32.9 6.69 91.0 52.4 100 - -
AB-DTPA ext. P 5.90 0.07 24.5 83.8 44 25 31
AB-DTPA ext. K 212 84.0 510 46.9 - 17 83
AB-DTPAext. Zn 12.7 4.65 44.0 53.4 - - 100
AB-DTPA ext. Fe 0.47 0.05 1.77 66.2 92 - 8
AB-DTPA ext. Cu 3.60 0.01 7.48 50.5 5 4 91
AB-DTPA ext.Mn 4.45 0.24 10.5 47.4 8 - 92
Dil. HCl ext. B 0.65 0.03 3.34 83.6 41 39 20
(15-45 cm depth)
Mineral N 28.3 2.87 60.3 54.0 47 33 20
AB-DTPA ext. P 3.79 0.48 18.8 95.6 72 14 14
AB-DTPA ext. K 189 56.0 640 61.3 2 26 72
AB-DTPA ext. Zn 10.7 3.84 35.3 50.5 - 3 97
AB-DTPA ext. Fe 0.35 0.06 1.28 70.6 96 4 -
AB-DTPA ext. Cu 2.73 0.02 6.72 60.1 6 4 0
AB-DTPAext.Mn 4.28 0.50 12.7 51.1 9 - 91
Dil. HCl ext. B 0.61 0.03 2.56 76.4 46 39 15
184
Spatial Variability of Soil Properties 185
Soil physical properties .Semivariogram analysis of some of the soil physical properties 186
(Table 5) showed that the physical parameters viz. sand, silt, clay content and saturation 187
percentage showed some spatial patterns in the surface as well as in subsoil and were 188
described by linear models for all these soil parameters (Fig. 1-3) except sand content in 189
both the depths and silt in subsoil. The r2-value for these models ranged from 0.44 to 0.71 190
being highest for surface soil clay content. It shows that spatial structure exists for these 191
soil properties except sand in both the depths and silt in subsoil which may be due to the 192
parent material spatial distribution. 193

10
194
Table 5 Parameters of semivariogram models for soil physical properties in 195
Charsadda District. 196
Property Nugget Slope r2 Model
(0-15 cm depth)
Sand (%) 91.1 -0.106 0.001 Linear
Silt (%) 63.9 2.587 0.48 Linear
Clay (%) 5.51 0.450 0.71 Linear
Saturation % 5.50 0.451 0.70 Linear
(15-45 cm depth)
Sand (%) 91.0 -0.106 0.001 Linear
Silt (%) 98.1 0.871 0.06 Linear
Clay (%) 3.71 0.234 0.44 Linear
Saturation % 3.71 0.234 0.44 Linear
197
198
Soil chemical properties 199
Semivariogram analysis of the data on some soil chemical properties 200
(Table 6) showed that soil pH had random variation in surface soil, while in subsoil it was 201
described by a linear model with r2-value of 0.49 showing the moderate spatial structure. 202
Electrical conductivity (ECe) in the surface and subsurface soil were described by a 203
linear model with strong spatial structure in the surface soil (Table 6, Fig.4). 204
205
206
207
208
209
210
211
212
213
11
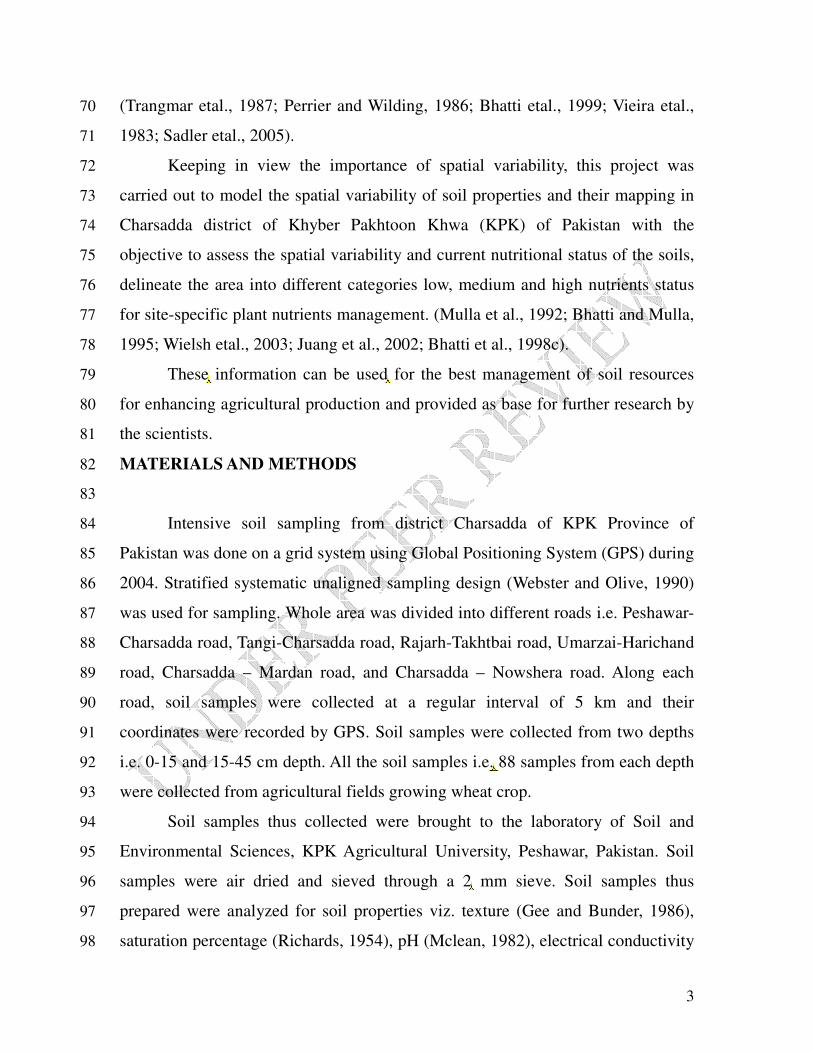
Table 6 Parameters of semivariogram models for soil chemical properties. 214
Property Nugget Slope Sill Range
(km)
r2 Model
(0-15 cm depth)
pH 0.164 -0.002 - - 0.17 Linear
ECe (dS m-1
) 21.10 1.655 0.81 Linear
Lime (%) 12.06 0.399 - - 0.59 Linear
Organic matter (%) 0.433 - 0.601 6.65 0.27 Spherical
SAR (meq L-1
)1/2
1.482 -0.04 - - 0.30 Linear
(15-45 cm depth)
pH 0.207 0.0091 - - 0.49 Linear
ECe (dS m-1
) 15.49 0.097 - - 0.03 Linear
Lime (%) 18.64 -0.035 - - 0.06 Linear
Organic matter (%) 0.318 0.0073 - - 0.41 Linear
SAR (meq L-1
)1/2
1.954 0.8419 - - 0.69 Linear
215
Lime content (CaCO3) of the surface soil was described by a linear model with an 216
r2-value of 0.59 showing strong spatial structure of lime in the surface soil (Table 6, Fig. 217
5). Organic matter content in the surface soil was described by a spherical model with an 218
r2-value of 0.27 and a range of about 7 km showing moderate spatial distribution of 219
organic matter in surface soil (Table 6, Fig. 6). Sodium absorption ratio (SAR) in the 220
surface soil had random variation but subsoil SAR had strong spatial structure and was 221
described by a linear model. 222
223
224
225
226

12
0
20
40
60
80
100
120
140
0 5 10 15 20
227
Distance (km) 228
Fig. 1 Semivariance and the best fitting model for surface soil silt, 229
Charsadda district. 230
231
232
233
4
6
8
10
12
14
16
0 5 10 15 20
234
Distance (km) 235
Fig. 2 Semivariance and the best fitting model for surface soil clay, 236
Charsadda district. 237
238
239
Sem
iva
ria
nce
(g
/10
0g
)2
Sem
iva
ria
nce
(g
/10
0g
)2

13
5
7
9
11
13
15
17
0 5 10 15 20
240
Distance (km) 241
242
Fig. 3 Semivariance and the best fitting model for surface soil saturation 243
percentage, Charsadda district. 244
245
246
247
15
20
25
30
35
40
45
0 5 10 15 20
248
Distance (km) 249
Fig. 4 Semivariance and the best fitting model for surface soil ECe, 250
Charsadda district. 251
252
253
254
Sem
iva
ria
nce
(g
/10
0g
)2
Sem
iva
ria
nce
(d
S m
-1)2

14
5
7
9
11
13
15
17
19
21
0 5 10 15 20
255
Distance (km) 256
Fig. 5 Semivariance and the best fitting model for surface soil lime (CaCO3), 257
Charsadda district. 258
259
260
261
0
0.1
0.2
0.3
0.4
0.5
0.6
0.7
0.8
0 5 10 15 20
262
Distance (km) 263
Fig. 6 Semivariance and the best fitting model for surface soil organic matter, 264
Charsadda district. 265
266
Soil fertility status 267
Semivariogram analysis of the data on plant nutrients in the soils of Charsadda 268
district (Table 7) showed that mineral nitrogen content of surface soil was described by a 269
Sem
iva
ria
nce
(g
/10
0g
)2
S
emiv
ari
an
ce (
mg
kg
-1)2

15
linear model with an r2-value of 0.36 (Table 7, Fig. 7) showing moderate spatial structure. 270
The data on phosphorus content of the surface as will as subsoil were described by a 271
linear model with a high r2-value showing a strong spatial distribution of P (Table 7, 272
Fig. 8). 273
Table 7 Parameters of semivariogram models for plant nutrients. 274
Property
Mg kg-1
Nugget Slope Sill Range
(km)
r2 Model
(0-15cm depth)
N 245.8 4.795 - - 0.36 Linear
P 18.13 0.382 - - 0.77 Linear
K 8323 208.3 - - 0.24 Linear
Zn 48.66 -0.1792 - - 0.009 Linear
Fe 0.1088 -0.0005 - - 0.02 Linear
Cu 3.071 0.0215 - - 0.13 Linear
Mn 4.685 -0.0288 - - 0.08 Linear
B 0.145 0.014 - - 0.61 Linear
(15-45cm depth)
N 226.5 0.553 - - 0.009 Linear
P 7.834 0.642 - - 0.73 Linear
K 6999 - 14925 9.084 0.64 Spherical
Zn 19.49 0.927 - - 0.63 Linear
Fe 0.047 - 0.062 5.011 0.16 Spherical
Cu 1.967 0.067 - - 0.54 Linear
Mn 1.997 - 4.876 3.966 0. 34 Spherical
B 0.154 0.0058 - - 0.30 Linear
275
Available potash content of surface soil was described by a linear model having 276
moderate spatial distribution of K (Table 7). In case of subsoil, available K was 277
described by a spherical model with a high r2-value and range of influence of about 9.0 278
km showing strong spatial variability. Zinc content had random variation in surface soil, 279
while subsoil have strong linear spatial distribution. Copper content of both the depths 280

16
were described by linear models (Table 7) with poor structure in the surface soil and 281
strong spatial structure in subsoil. The manganese content in subsoil was described by a 282
spherical model (Table 7) with the range of influence of about 4 km though the spatial 283
structure was moderate. The data on boron content was described by linear models in 284
both the depths (Table 7). In surface soil, B has high r2- value of 0.63, indicating a strong 285
spatial distribution (Fig. 9). In subsoil, B has moderate spatial structure with an r2
value 286
of 0.30.
287
288
150
200
250
300
350
400
0 5 10 15 20
289
Distance (km) 290
Fig. 7 Semivariance and the best fitting model for surface soil 291
mineral-N, Charsadda district. 292
293
294
295
296
Sem
iva
ria
nce
(m
g k
g-1
)2

17
15
17
19
21
23
25
27
0 2 4 6 8 10 12
297
Distance (km) 298
Fig. 8 Semivariance and the best fitting model for surface soil phosphorus, 299
Charsadda district. 300
301
0.1
0.2
0.3
0.4
0.5
0 5 10 15 20
302
Distance (km) 303
304
Fig. 9 Semivariance and the best fitting model for surface soil B, Charsadda 305
district. 306
307
308
309
310
Sem
iva
ria
nce
(m
g k
g-1
)2
S
emiv
ari
an
ce (
mg
kg
-1)2

18
Interpolation and Mapping of Soil Properties 311
312
Physical soil properties 313
Map of sand content of the surface soils of Charsadda district (Fig. 10) shows 314
some spatial patterns. The soils in the east are higher in sand content (≥ 40 %), rest 315
of the area is medium in sand content (20-40 %). Silt content of the surface soils 316
(Fig. 11) of the district was higher in the whole of the area (> 40 %). Clay content 317
of the surface soils (Fig. 12) is low (≤ 30 %) in the whole area. No variation is 318
observed in clay content in the surface soil of the district. 319
Soil chemical properties 320
Map of pH of the surface soils (Fig. 13) showed that there was not 321
considerable variation in the pH value of different parts of Charsadda district. 322
However, the pH was alkaline (≥ 7.5). Map of lime content of surface soils of 323
Charsadda district (Fig. 14) shows that the soils are moderately calcareous (3-13 324
%) in the whole area. Map of organic matter content of the surface soils (Fig. 15) 325
shows that it is low in the north-west (< 1 %) and medium in rest of the district (1-326
2 %). 327
328
Soil Fertility 329
Available nitrogen content of the surface soil (Fig. 16) shows that the whole 330
district is low (< 140 mg kg-1
) in available N. Available phosphorus content of the surface 331
soils (Fig. 17) shows that there are strong spatial patterns. Available phosphorus is 332
deficient (< 4.0 mg kg-1
) in the west and marginal (4.0-7.0 mg kg-1
) in southern and 333
central part, while rest of area is adequate (> 7.0 mg kg-1
) in available P. Available boron 334
content of the surface soils (Fig. 18) shows some spatial patters. It is adequate (> 1.0 mg 335
kg-1
) in some parts of east- south, while rest of the area is marginal (0.45-1.0 mg kg-1
) in 336
available boron. 337
338
339

19
340 341
342
Fig. 10 Map of surface sand (%) by kriging, Charsadda district. 343
CHARSADDA
Turangzai
Rajjar
Dosehra
Nisatta
Shabqadar
Tangi
Sherpao
Gandera
Distance (km)
Dis
tan
ce (
km
)

20
344
345
346
347
Fig. 11 Map of surface silt (%) by kriging, Charsadda district. 348
349
CHARSADDA
Turangzai
Rajjar
Dosehra
Nisatta
Shabqadar
Tangi
Sherpao
Gandera
Distance (km)
Dis
tan
ce (
km
)

21
350
351
352
353
Fig. 12 Map of surface soil clay (%) by kriging, Charsadda district. 354
355
356
CHARSADDA
Turangzai
Rajjar
Dosehra
Nisatta
Shabqadar
Tangi
Sherpao
Gandera
Distance (km)
Dis
tan
ce (
km
)

22
357 358
359
Fig. 13 Map of surface soil pH by kriging, Charsadda district. 360
CHARSADDA
Turangzai
Rajjar
Dosehra
Nisatta
Shabqadar
Tangi
Sherpao
Gandera
Distance (km)
Dis
tan
ce (
km
)

23
361
362
Fig. 14 Map of surface soil lime (%) by kriging, Charsadda district. 363
364
CHARSADDA
Turangzai
Rajjar
Dosehra
Nisatta
Shabqadar
Tangi
Sherpao
Gandera
Distance (km)
Dis
tan
ce (
km
)

24
365 366
367
368
Fig. 15 Map of surface soil organic matter (%) by kriging, Charsadda 369
district. 370
mg kg-1
Low <1.0
Medium 1.0-2.0
Adequate >2.0
CHARSADDA
Turangzai
Rajjar
Dosehra
Nisatta
Shabqadar
Tangi
Sherpao
Gandera
Distance (km)
Dis
tan
ce (
km
)

25
371 372
373
Fig. 16 Map of surface soil mineral N (mg kg-1
) by kriging, Charsadda 374
district. 375 376
mg kg-1
Low <140
Medium 140-280
Adequate >280
CHARSADDA
Turangzai
Rajjar
Dosehra
Nisatta
Shabqadar
Tangi
Sherpao
Gandera
Distance (km)

26
377 378
379
Fig. 17 Map of surface soil P (mg kg-1
) by kriging, Charsadda district. 380
381
382
383
mg kg-1
Low <4.0
Medium 4.0-7.0
Adequate >7.0
CHARSADDA
Turangzai
Rajjar
Dosehra
Nisatta
Shabqadar
Tangi
Sherpao
Gandera
Distance (km)
Dis
tan
ce (
km
)

27
384 385
386
Fig. 18 Map of surface soil B (mg kg-1
) by kriging, Charsadda district. 387
388
389
390
391
mg kg-1
Low <0.45
Medium .45-1.0
Adequate >1.0
CHARSADDA
Turangzai
Rajjar
Dosehra
Nisatta
Shabqadar
Tangi
Sherpao
Gandera
Distance (km)
Dis
tan
ce (
km
)

28
Spatial variability of various soil properties in the study area was evident as 392
indicated by the semivariogram models. Spatial dependence of soil properties can be 393
attributed to extrinsic as well as inherent factors (Cambardella etal., 1994; Navas and 394
Machin, 2002; Spiker etal., 2005; Breseler etal., 1982; Tabor etal., 1984; Van Es etal., 395
1989; Bhatti etal., 1999; Vieira etal., 1981). 396
Maps of various soil properties especially soil fertility showed spatial patterns in 397
their distribution. These maps will be useful in delineating the area into low, medium and 398
high nutrients contents and can be managed accordingly. Such regional variability is 399
determined using geostatistical technique of semivariogram analysis and kriging, which 400
has been successfully used by different workers at field level (Bhatti, etal., 1998c; Bhatti 401
etal., 1999; Wallenhanpt etal., 1994) or at larger unit such as district level (Rafique etal., 402
2006; Mulla etal., 1992) for the site-specific management of soil fertility. These 403
techniques have also been used to prepare contour maps of soil properties (Liu etal., 404
2006; Burgos etal., 2006; Lark etal., 2005; Facchinelli etal., 2001). Burgoss etal. (2006) 405
reported that use of geostatistics and elaboration of contour maps of heavy metals proved 406
to be a concise control in order to identify hotspots of contamination for remediation 407
purposes. 408
409
CONCLUSIONS 410
411
Texture of Charsadda district ranged from silt to sandy loam. All the soils were 412
alkaline in reaction and calcareous in nature of different degree. Salinity problem was 413
found in most of the soils surveyed. SAR of soils of both the depths was normal and 414
no sodium hazard was found in the soils studied. Organic matter content of both the 415
depths was low. Total mineral N of surface soils was deficient in all soils of district 416
Charsadda, while in subsoil it was deficient to moderate level in different soils. 417
Deficiencies of P, Zn and B were observed to a greater extent, while those of K, Cu 418
and Mn are also appearing. Silt, clay content, saturation percentage, soil pH, ECe, 419
organic matter and SAR, lime, N, P, K, Fe, Mn, Cu and B either in the surface soil, 420
subsoil or both have spatial patterns. Maps of various soil properties showed variation 421
in different areas and can be managed accordingly. Currently, a blanket 422

29
recommendation is made for the whole district. Whole area can be divided into 423
different categories on the basis of each plant nutrient as shown in the maps. Variable 424
rate fertilizer management strategy can be developed for different zones which will 425
increase the efficiency of fertilizers, avoid over or under-fertilization, will be 426
economical, and environmentally safe. 427
428
429
ACKNOWLEDGEMENT 430
The authors are thankful to Higher Education Commission, Islamabad, Pakistan 431
for financial support to carry out the research project. 432
433
REFERENCES 434
Bhatti, A. U., Ali, R. Khan, F. and khan, M. J. 1998a. Comparison of wheat yield 435
under uniform and variable rates of fertilizer on spatially eroded land. Commun. 436
Soil Sci. Plant Anal. 29: 2855-2864. 437
Bhatti, A. U. and Bakhsh, A.995. Management strategy of using gypsum for 438
reclamation of salt affected soils. J. Ind. Soc. Soil Sci. 43(4): 657-659. 439
Bhatti, A. U., Bakhsh, A . Afzal, M. and Gurmani, A. H. 1999. Mapping of major 440
plant nutrients and crop productivity using geostatistical techniques for fertilizer 441
management. Pak. J. Soil Sci. 16: 129-136. 442
Bhatti, A. U., Khan, M. Khurshid, K. S. and Farmanullah. 1998b. Site-specific 443
determination of N rates for irrigated wheat based on soil properties. In: 444
Proceedings of Symposium on Nutrient Management for Sustainable Agricultural 445
Growth at NFDC Islamabad, Dec. 8-9, 1997: 131-137. 446
Bhatti, A. U. and Mulla, D. J. 1995. Spatial variability of soil properties and wheat 447
yields on complex hills and their fertility management. J. Ind. Soc. Soil Sci. 43(1): 448
53-58. 449
Bhatti, A. U., Mulla, D. J and Frazier, B. E. 1991. Estimation of soil properties and 450
wheat yields on complex eroded hills using geostatistics and thematic mapper 451
images. Remote Sens. Environ. 37: 181-191. 452

30
Gee, G. W. and Bauder, J. W.. 1986. Particle size analysis. In: A. Klute, A. (ed.) 453
Methods of Soil Analysis. Part 1. Physical and Minerological Methods. 2nd 454
Edition. Agron. Monogram. 9.ASA and SSSA, Madison, WI. pp. 383-411. 455
Journal, A. G. and Huijbregts, C. H. 1978. Mining Geostatistics. Acadmics Prss, 456
New York. 457
Keeney, D. R. and Nelson, D. W. 1982. Nirogen-Inorganic forms. pp.643-693. In: 458
A.L. Page, R.H. Miller, and D.R. Keeney (eds.), Methods of Soil Analysis. Part 2. 459
Agron. 9. ASA. Madison, WI. P. 643-698. 460
Mclean, E. O. 1982. Soil pH and lime requirement. In: A.L. Page, R.H. Miller, and 461
D.R. Keeney (eds.), Methods of Soil Analysis. Part 2. Agron. 9. ASA. Madison, 462
WI. pp. 209-223. 463
Mulla, D. J., Bhatti, A. U.and Kunkel, R. 1990. Methods for removing spatial 464
variability from field research trials. Adv. in Soil Sci. 13: 201-213. 465
Nelson, R. E. 1982. Carbonate and gypsum. In: A.L. Page, R. H. Miller, and D. R. 466
Keeney (eds.). Methods of Soil Analysis. Part 2. Agron.9. ASA, Madison, WI. pp. 467
181-198. 468
Nelson, D. W. and Sommers, L. E. 1982. Total carbon, organic carbon and organic 469
matter. In: A.L. Page, R.H. Miller, and D.R. Keeney (eds.). Methods of Soil 470
Analysis. Part 2. Agronomy 9. Amer. Soc. of Agron, Madison, WI. pp. 539-577. 471
Richards, L. A. 1954. Diagnosis and Improvement of Saline and Alkali Soils. Agri. 472
Handbook No.60. U.S.A. Washington, D.C. pp.102-129. 473
Soltanpour, P. N. 1985. Use of AB-DTPA soil test to evaluate elemental availability 474
and toxicity. Commun. Soil Sci. Plant Anal. 16: 323-338. 475
476
477