research on the performance improvement of a two-shaft gas …
TRANSCRIPT
Li, S., et al.: Research on the Performance Improvement of a Two-Shaft Gas Turbine ... THERMAL SCIENCE: Year 2020, Vol. 24, No. 6A, pp. 3721-3733 3721
RESEARCH ON THE PERFORMANCE IMPROVEMENT OF A TWO-SHAFT GAS TURBINE WITH
A VARIABLE AREA NOZZLE POWER TURBINE
by
Shiyao LI *, Zhenlin LI, and Hongbin ZHAOCollege of Mechanical and Transportation Engineering, China University of Petroleum,
Beijing, China
Original scientific paper https://doi.org/10.2298/TSCI180714099L
Both an increase in atmospheric temperature and a decrease in atmospheric pres-sure can lead to the degradation of the maximum allowable power output (MAPO) or the thermal efficiency of a gas turbine. In order to reduce these adverse effects, this paper provides a simulated study on the improvement of the MAPO and the variations of the thermal efficiency due to the fuel flow and variable area nozzle control under different atmospheric conditions. Simulation results indicate that the MAPO increases with the power turbine nozzle area, while the thermal efficien-cy shows a parabola trend. With the same increment of the power turbine nozzle area, the improvement of the MAPO goes up as the atmospheric temperature rises and the decrease of thermal efficiency is alleviated. Analyses show that the slow degradation of the compressor isentropic efficiency is a key factor that enables the MAPO to increase significantly and the thermal efficiency to remain almost constant.Key words: two-shaft gas turbine, power output improvement, variable area
nozzle, performance simulation
Introduction
The gas turbine, an engine with high efficiency, high power density, and a long ser-vice life, has been widely applied in many fields, such as aviation, shipping, power generation, mechanical drives, etc. In natural gas pipelines, the use of gas turbine-driven compressor sets can help to reduce the load of local power grid significantly, which makes it the first choice for power equipment in underdeveloped areas with a lack of electric supply.
However, the MAPO and the thermal efficiency of the gas turbine are sensitive to change in atmospheric conditions. Power output decreases by 0.5-1.2% with every 1 K rise in atmospheric temperature at ISO conditions (288.15 K and 101.3 kPa) [1-4]. Meanwhile, the thermal efficiency drops significantly. Taking a SGT94.3 gas turbine as an example, the ratio of the atmospheric temperature change to the thermal efficiency is approximately –0.1% per K [5]. The decline in the gas turbine performance directly affects the transportation capacity of pipelines. Once the power output of single unit is unable to meet the gas transportation demand, carriers have to adopt an operating mode of dual units working in parallel to make up for the
* Corresponding author, e-mail: [email protected]

Li, S., et al.: Research on the Performance Improvement of a Two-Shaft Gas Turbine ... 3722 THERMAL SCIENCE: Year 2020, Vol. 24, No. 6A, pp. 3721-3733
power shortage. This may result in both gas turbines operating in part load conditions as well as the further reduction of the thermal efficiency of the two units.
In order to overcome the performance degradation due to high temperature, methods involving inlet air-cooling [6], intermediate cooling [7], wet compression [8] and other tech-nologies have been successfully applied. However, these technologies entail additional equip-ment installation, which not only makes the entire cycle system more complex, but also in-creases operating costs. In addition to above methods, operating optimization based on fuel flow (FF) and variable area nozzle (VAN) control has been carried out for many years [9-14]. Compared with pure FF control, this method can improve the operating flexibility by adjusting the power distribution of each turbine [10]. Many studies have put an emphasis on improving the part load thermal efficiency by closing the VAN of power turbine (PT). Gu et al. [11] have investigated on a three-shaft gas turbine, the thermal efficiency is improved by approximately 1.0-1.5% under part load conditions with initial temperature remaining at the designed level. Haglind [12] has conducted simulation studies on single-shaft and two-shaft gas turbines. The results show that closing the VAN of the PT has an adverse effect on the thermal efficiency of that two gas turbines. As gas turbines seldom operating in a full load condition, the research on power improvement by increasing the PT nozzle area has not attracted enough attention. Bringhenti and Barbosa [13, 14] have studied the variations of main operating parameters of two gas turbines, such as the initial temperature, thermal efficiency, surge margin, etc., under the given power output conditions with a change of the PT inlet stagger angle. The results show that the power output at ISO conditions can increase by 2.5% and 4.3% by increasing the fuel supply and opening the VAN of the PT. However, among the existing research, the power improvement and the variations of thermal efficiency through FF and VAN control under different atmospheric conditions have not been quantitatively analyzed as well as the influence mechanism.
In this paper, the research on MAPO improvement based on FF and VAN control has been carried out with reference to the degradation caused by an elevated atmospheric tempera-ture in summer or a reduced atmospheric pressure at high altitudes. A gas path thermodynamic performance simulation model is established based on a two-shaft gas turbine. The accuracy of the model is verified by comparing the experiment data. On this basis, the MAPO improvement by FF and VAN control has been quantitatively studied under different atmospheric conditions, as well as the variations of thermal efficiency. In addition, the reasons for these differences are analyzed in detail from the perspective of changes in the components’ performance, especially for the compressor.
Performance simulation model
In this section, the thermodynamic model of three major components in gas turbine are presented. According to the gas path structure of a two-shaft gas turbine, the matching method for the components’ operating points based on multi-dimensional Newton-Raphson iteration is developed.
Component modeling
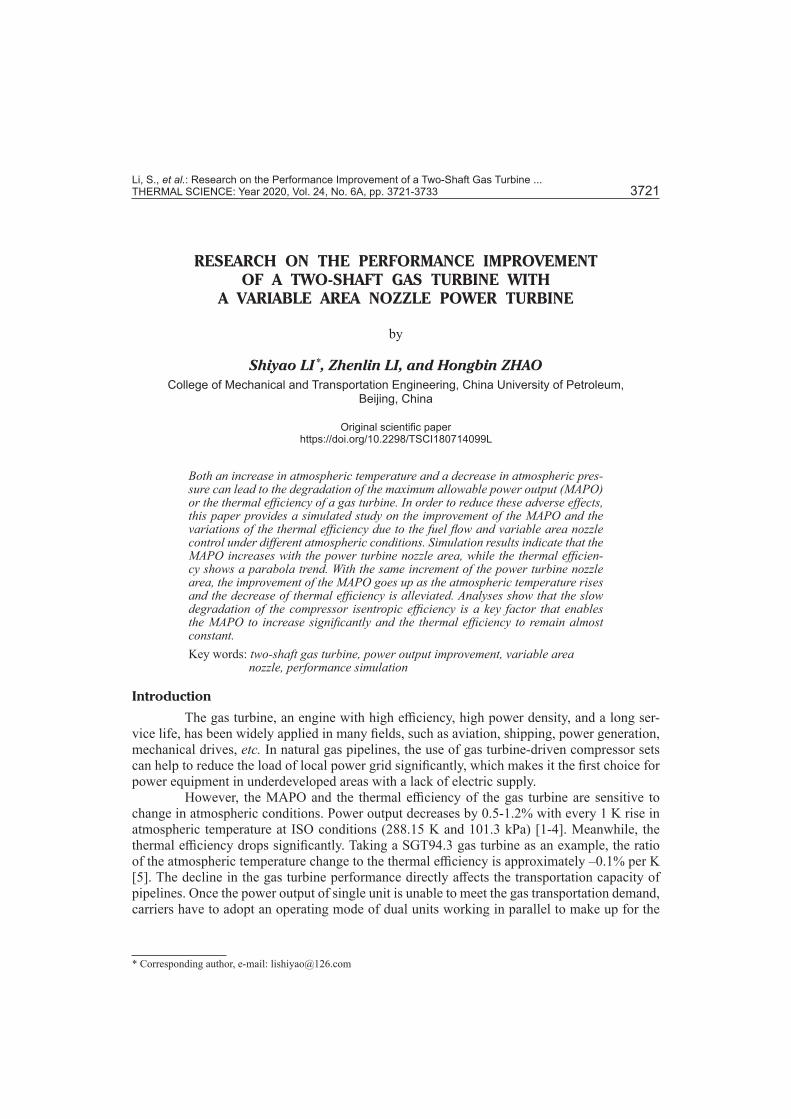
The gas path structure of GE LM2500+SAC, a typical two-shaft gas turbine is shown in fig. 1. It features a single shaft gas generator and a PT. The gas generator – GG, consists of a high pressure compressor – HPC, a combustor – CB, and a high pressure turbine – HPT, and the HPC is driven by the HPT. The GG is mechanically uncoupled from the PT. While providing high pressure air for the cycle, the HPC also provides cooling air for the blades of HPT and the PT.
Li, S., et al.: Research on the Performance Improvement of a Two-Shaft Gas Turbine ... THERMAL SCIENCE: Year 2020, Vol. 24, No. 6A, pp. 3721-3733 3723
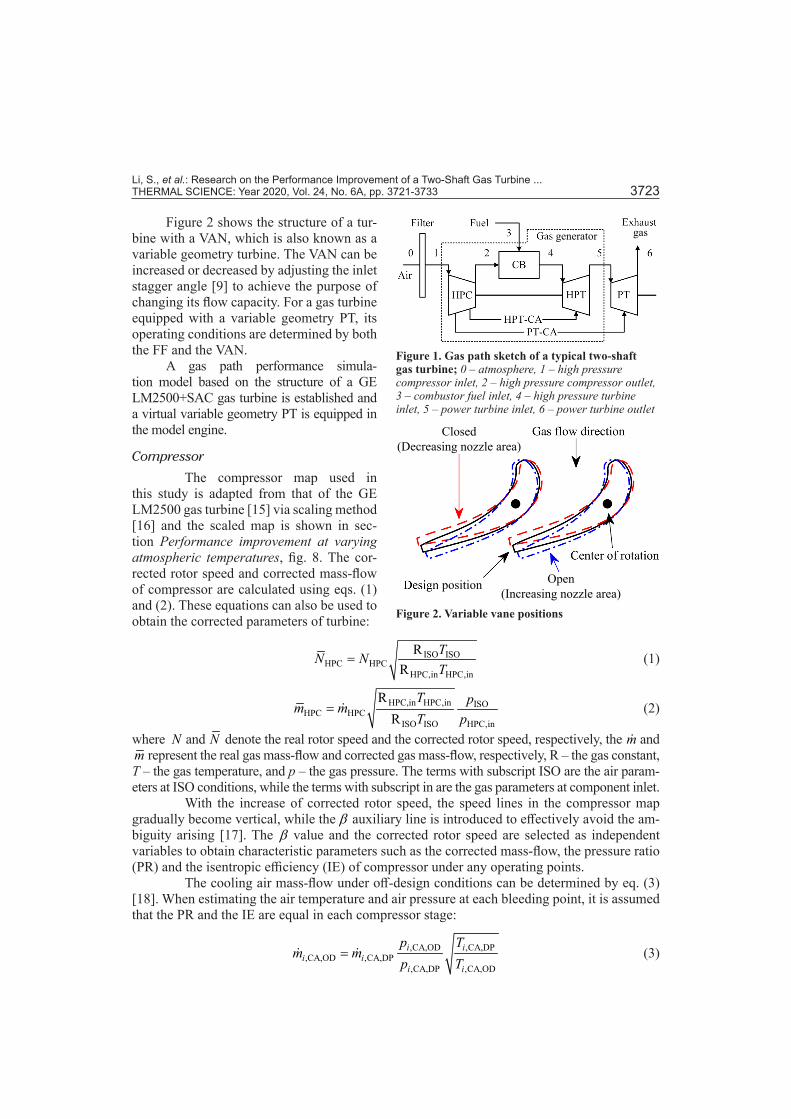
Figure 2 shows the structure of a tur-bine with a VAN, which is also known as a variable geometry turbine. The VAN can be increased or decreased by adjusting the inlet stagger angle [9] to achieve the purpose of changing its flow capacity. For a gas turbine equipped with a variable geometry PT, its operating conditions are determined by both the FF and the VAN.
A gas path performance simula-tion model based on the structure of a GE LM2500+SAC gas turbine is established and a virtual variable geometry PT is equipped in the model engine.
Compressor
The compressor map used in this study is adapted from that of the GE LM2500 gas turbine [15] via scaling method [16] and the scaled map is shown in sec-tion Performance improvement at varying atmospheric temperatures, fig. 8. The cor-rected rotor speed and corrected mass-flow of compressor are calculated using eqs. (1) and (2). These equations can also be used to obtain the corrected parameters of turbine:
ISO ISOHPC HPC
HPC,in HPC,in
RR
TN NT
= (1)
HPC,in HPC,in ISOHPC HPC
ISO ISO HPC,in
RR
T pm mT p
= (2)
where N and N denote the real rotor speed and the corrected rotor speed, respectively, the m and m represent the real gas mass-flow and corrected gas mass-flow, respectively, R – the gas constant, T – the gas temperature, and p – the gas pressure. The terms with subscript ISO are the air param-eters at ISO conditions, while the terms with subscript in are the gas parameters at component inlet.
With the increase of corrected rotor speed, the speed lines in the compressor map gradually become vertical, while the β auxiliary line is introduced to effectively avoid the am-biguity arising [17]. The β value and the corrected rotor speed are selected as independent variables to obtain characteristic parameters such as the corrected mass-flow, the pressure ratio (PR) and the isentropic efficiency (IE) of compressor under any operating points.
The cooling air mass-flow under off-design conditions can be determined by eq. (3) [18]. When estimating the air temperature and air pressure at each bleeding point, it is assumed that the PR and the IE are equal in each compressor stage:
,CA,OD ,CA,DP,CA,OD ,CA,DP
,CA,DP ,CA,OD
i ii i
i i
p Tm m
p T= (3)
generator gas
Figure 1. Gas path sketch of a typical two-shaft gas turbine; 0 – atmosphere, 1 – high pressure compressor inlet, 2 – high pressure compressor outlet, 3 – combustor fuel inlet, 4 – high pressure turbine inlet, 5 – power turbine inlet, 6 – power turbine outlet
position
Closed(Decreasing nozzle area)
Open(Increasing nozzle area)
Figure 2. Variable vane positions

Li, S., et al.: Research on the Performance Improvement of a Two-Shaft Gas Turbine ... 3724 THERMAL SCIENCE: Year 2020, Vol. 24, No. 6A, pp. 3721-3733
where the subscript CA represents cooling air, the DP and OD denote the design point and off-design point, respectively, the i represents the position of bleeding point, the ,CA,DPim is ob-tained by introducing the bleeding coefficient ,CA,DPiϕ , and is described by ,CA,DPim =
,CA,DP HPC,ini mϕ= ⋅ .The methods for calculating outlet mass-flow and power consumption of the HPC
with air bleeding are shown in eqs. (4) and (5), respectively:
HPC,out HPC,in ,CAim m m= −∑ (4)
HPC HPC,out HPC,out ,CA ,CA HPC,in HPC,ini iPW m h m h m h= ⋅ + ⋅ − ⋅ (5)
where h is gas specific enthalpy and the terms with subscript out are the gas path parameters of HPC outlet.
Combustor
Considering the heat dissipation, it is assumed that the combustion efficiency CBη is a constant. The pressure loss in combustor consists of two parts. The first part is the fundamental loss due to the rise of gas temperature, and the second part is the friction loss arising from the friction between the gas and combustion chamber wall. Among these, the fundamental loss can be neglected [19]. Therefore, the pressure loss coefficient under off-design points can be evalu-ated using eq. (6) [20]:
2
CB,OD,in CB,OD,inCB,OD CB,DP
CB,DP,in CB,DP,in
RR
mm
δ δ
=
(6)
where CB,DPδ is the pressure loss coefficient at the design point, and it is an empirical constant.
Turbine
Compared with a compressor, the operating characteristics of a turbine are easier to be expressed. Zhang and Cai [21] established an analytic solution for estimating the turbine corrected mass-flow and IE at off-design points, as shown in eqs. (7) and (8):
2
TB,OD TB,DP,in TB,ODTB,OD TB,DP 2
TB,DP TB,OD,in TB,DP
11.4 0.4
1N T
m mN T
εε
−= −
− (7)
( )2 ,TB ,TBTB,OD TB,DP ,TB
,TB ,TB1 1 2
ϕ ϕη η ϕ
ϕ ϕ = − − −
N NN
m mt (8)
where ε is gas expansion ratio and the terms with subscript TB represent the parameters of turbine (HPT or PT), the t is an empirical constant, TB,OD TB,DP,TB /ϕ =N N N , ,TBϕ =m
TB,OD TB,DP/m m= .The method for calculating the turbine power output with a coolant injection is shown
in eq. (9):
TB TB,in TB,in ,CA ,CA TB,out TB,outi iPW m h m h m h= + − (9)
Li, S., et al.: Research on the Performance Improvement of a Two-Shaft Gas Turbine ... THERMAL SCIENCE: Year 2020, Vol. 24, No. 6A, pp. 3721-3733 3725
Gas turbine
Taking the PT as research object, the power output of a gas turbine can also be calcu-lated by eq. (9), while the thermal efficiency is obtained by eq. (10):
PTGT
FL
PWm LHV
η =⋅
(10)
where LHV represents the lower heating value of fuel and the FLm denotes fuel mass-flow.
Matching method
Combined with the gas path structure of the LM2500+SAC gas turbine studied in this paper, the constraints for determining the operating point of each component are composed as follows: the power equilibrium equation of GG shaft, eq. (11), the cycle PR equilibrium equa-tion of gas turbine, eq. (12), the mass-flow equilibrium equation of HPT and PT, eqs. (13) and (14). Besides, the target parameter, such as rotor speed, initial temperature, and power output, etc., used to describe the operating condition of the gas turbine should also be determined, eq. (15):
HPC mec HPTSP
HPC
PW PWEPWη−
= (11)
HPT PTHPC
CBCPR
HPC
1E
ε επδ
π
−−
= (12)
CB,out HPT,in,HPT
CB,out
−=
mm m
Em
(13)
HPT,out PT,in,PT
HPT,out
−=
mm m
Em
(14)
OC,pred OC,targOC
OC,targ
x xE
x−
= (15)
where mecη is mechanical efficiency, HPCπ – the PR of HPC, OC,predx , OC,targx – the predicted parameter and the target parameter, respectively.
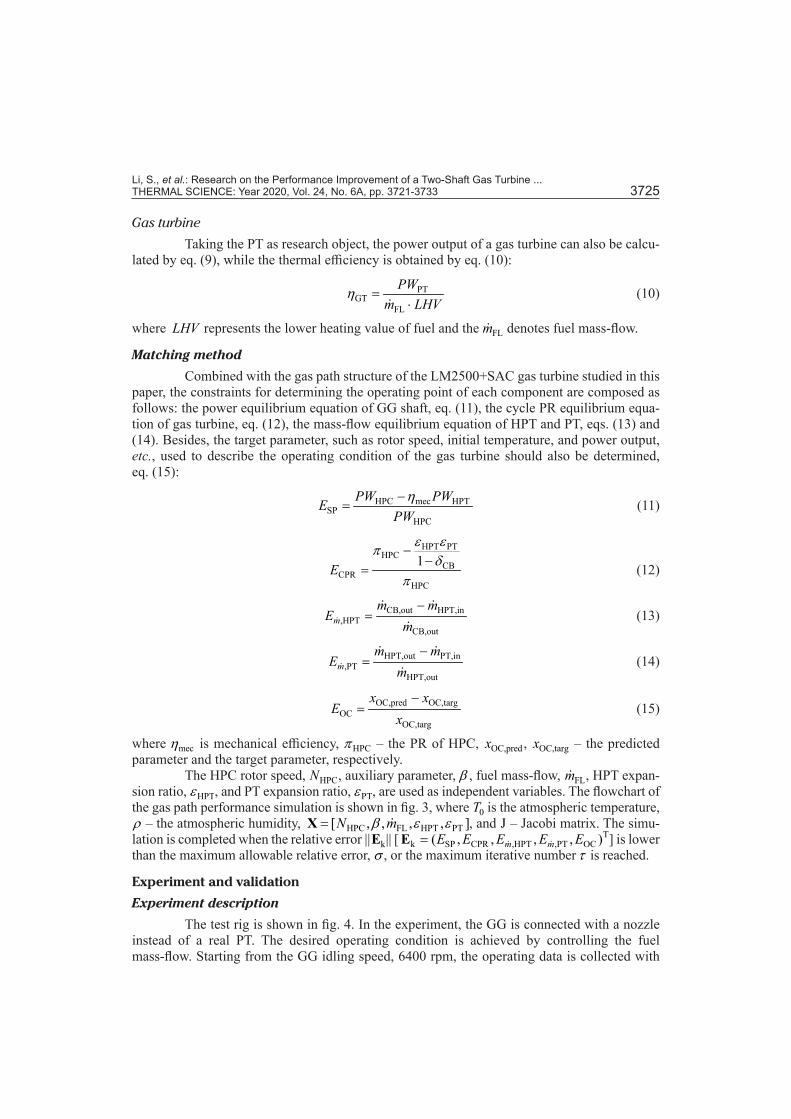
The HPC rotor speed, HPCN , auxiliary parameter, β , fuel mass-flow, FLm , HPT expan-sion ratio, HPTε , and PT expansion ratio, PTε , are used as independent variables. The flowchart of the gas path performance simulation is shown in fig. 3, where 0T is the atmospheric temperature, ρ – the atmospheric humidity, HPC FL HPT PT[ , , , , ]N mβ ε ε=X , and J – Jacobi matrix. The simu-lation is completed when the relative error k|| ||E [ T
k SP CPR ,HPT ,PT OC( , , , , )= m mE E E E EE ] is lower
than the maximum allowable relative error, σ , or the maximum iterative number τ is reached.
Experiment and validation
Experiment description
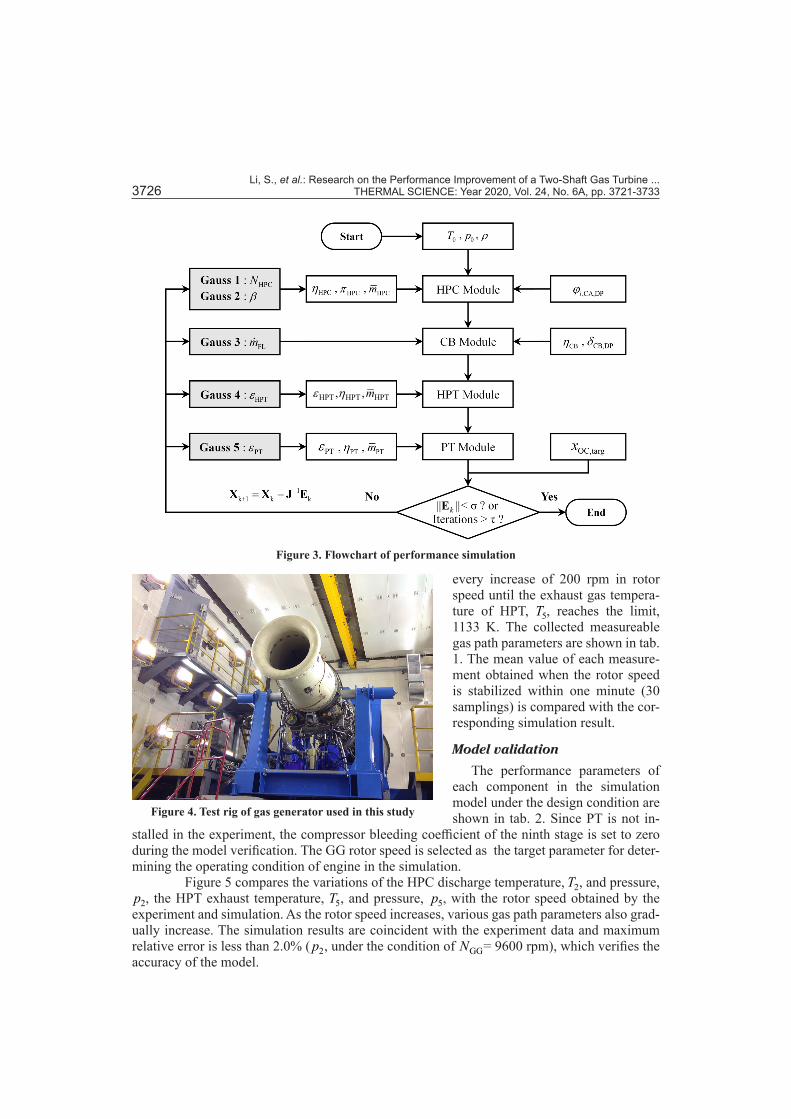
The test rig is shown in fig. 4. In the experiment, the GG is connected with a nozzle instead of a real PT. The desired operating condition is achieved by controlling the fuel mass-flow. Starting from the GG idling speed, 6400 rpm, the operating data is collected with
Li, S., et al.: Research on the Performance Improvement of a Two-Shaft Gas Turbine ... 3726 THERMAL SCIENCE: Year 2020, Vol. 24, No. 6A, pp. 3721-3733
every increase of 200 rpm in rotor speed until the exhaust gas tempera-ture of HPT, 5T , reaches the limit, 1133 K. The collected measureable gas path parameters are shown in tab. 1. The mean value of each measure-ment obtained when the rotor speed is stabilized within one minute (30 samplings) is compared with the cor-responding simulation result.
Model validation
The performance parameters of each component in the simulation model under the design condition are shown in tab. 2. Since PT is not in-
stalled in the experiment, the compressor bleeding coefficient of the ninth stage is set to zero during the model verification. The GG rotor speed is selected as the target parameter for deter-mining the operating condition of engine in the simulation.
Figure 5 compares the variations of the HPC discharge temperature, 2T , and pressure, 2p , the HPT exhaust temperature, 5T , and pressure, 5p , with the rotor speed obtained by the
experiment and simulation. As the rotor speed increases, various gas path parameters also grad-ually increase. The simulation results are coincident with the experiment data and maximum relative error is less than 2.0% ( 2p , under the condition of GGN = 9600 rpm), which verifies the accuracy of the model.
HPT HPT HPT, ,mε η
|| ||kE
Figure 3. Flowchart of performance simulation
Figure 4. Test rig of gas generator used in this study

Li, S., et al.: Research on the Performance Improvement of a Two-Shaft Gas Turbine ... THERMAL SCIENCE: Year 2020, Vol. 24, No. 6A, pp. 3721-3733 3727
Table 1. The measurable gas path parametersMeasurable parameter Unit Symbol Quantity Measurable parameter Unit Symbol Quantity
Atmospheric temperature K 0T 1 HPC discharge pressure kPa 2p 4
Atmospheric pressure kPa 0p 1 Fuel mass-flow kg/s FLm 2
Atmospheric humidity g/m3 ρ 1 Fuel temperature K FLT 2
HPC inlet temperature K 1T 2 HPT exhaust temperature K 5T 8
HPC inlet pressure kPa 1p 2 HPT exhaust pressure kPA 5p 2
HPC discharge temperature K 2T 4 GG rotor speed r/min GGN 2
Table 2. Component performance parameters under the design conditionParameter Unit Symbol Value Parameter Unit Symbol Value
GG rotor speed r/min GGN 9586 CB pressure loss coefficient – CBδ 0.03
HPC bleeding coefficient of 9th stage – 9 ,CAthϕ 0.015 (0) CB combustion efficiency – CBη 0.99
HPC bleeding coefficient of 13th stage – 13 ,CAthϕ 0.033 HPT corrected mass-flow kg/s HPTm 8.842
HPC PR – HPCπ 22.81 HPT IE – HPTη 0.853
HPC corrected mass-flow kg/s HPCm 83.41 Nozzle corrected mass-flow kg/s NOZm 35.6
HPC IE – HPCη 0.847 Mechanical efficiency – mecη 0.98
Results and discussion
In this section, the simulation model is used to investigate the MAPO improvement achieved by FF and VAN control under different atmospheres as well as the variations of thermal efficiency. The selected atmospheric temperatures are between 288.15 K and 308.15 K with 5 K intervals, and the atmospheric pressures are between 0.8 atm and 1.0 atm with 0.05 atm intervals. Correspondingly, tab. 3 shows the main performance parameters of the gas turbine under MAPO conditions when the nozzle area of the PT is in the design state, which serve as a reference for the fol-lowing studies.
When a turbine is in a crit-ical state, the variation of corrected mass-flow coincides with the change of its nozzle area [11]. Therefore, the
Gas
tem
pera
ture
, T [K
]
Gas
pre
assu
re, p
·10–3
[MPa
]
Gas generator rotor speed, NGG [rpm]
Figure 5. Comparison of the experimental data and the simulation results

Li, S., et al.: Research on the Performance Improvement of a Two-Shaft Gas Turbine ... 3728 THERMAL SCIENCE: Year 2020, Vol. 24, No. 6A, pp. 3721-3733
influence of the PT nozzle area on the gas turbine performance can be simulated by adjusting its corrected mass-flow in the model [22]. The attenuation of IE resulting from the nozzle area changes is neglected [23].
Control strategy
In the method of power improvement based on FF and VAN control, it is necessary to keep the gas path temperature of the hot end components within a safety limit. As shown
in fig. 6, with the high pressure tur-bine inlet temperature (HPTIT) limited under the design condition, 1540 K, the required FF increases slowly as the PT nozzle area grows. Meanwhile, the gas expansion ratio in the HPT and the enthalpy difference between its inlet and outlet are also increase, resulting in a decrease in the power turbine inlet temperature (PTIT). Instead, when the PTIT is limited under its design condi-tion, 1129 K, the required FF increases rapidly as the PT nozzle area grows, and for the same reason, the HPTIT will exceed the limitation.
Therefore, in order to improve the MAPO of the gas turbine by the FF and
VAN control, the maximum acceptable HPTIT should be served as the basis of fuel supply. An alternative method to determine FF is to take the PTIT as the limiting condition due to directly immeasurable parameter for the HPTIT. However, the maximum acceptable PTIT is not a constant, and it needs to be determined according to the increment of PT nozzle area. Combined with the simulation results shown in fig. 6, the maximum acceptable PTIT de-creases by 1% with every 5% increase of PT nozzle area.
Performance improvement at varying atmospheric temperatures
Figure 7 shows the MAPO improvement of the gas turbine by the FF and VAN control under different atmospheric temperatures. For each curve, the MAPO increases with the PT
Table 3. Gas turbine reference performance parameters at varying atmospheric conditionsCase T0 [K] p0∙1.013–3 [atm] πHPC ηHPC FLm [kgs–1] εHPT εPT PWGT∙10–6 [MW] ηGT
1 288.15 1 22.63 0.847 1.650 4.621 4.759 31.10 0.3792 293.15 1 22.05 0.850 1.599 4.625 4.632 29.86 0.3753 298.15 1 21.45 0.852 1.550 4.629 4.503 28.62 0.3714 303.15 1 20.86 0.854 1.502 4.633 4.374 27.40 0.3665 308.15 1 20.26 0.854 1.456 4.636 4.246 26.21 0.3626 288.15 0.80 22.63 0.847 1.322 4.621 4.762 24.92 0.3797 288.15 0.85 22.63 0.847 1.404 4.621 4.761 26.46 0.3798 288.15 0.90 22.63 0.847 1.486 4.621 4.760 28.01 0.3799 288.15 0.95 22.63 0.847 1.568 4.621 4.760 29.55 0.379
[%]–20 –10
Figure 6. Variations of the hot end gas temperature and FF under the MAPO conditions with the PT nozzle area
Li, S., et al.: Research on the Performance Improvement of a Two-Shaft Gas Turbine ... THERMAL SCIENCE: Year 2020, Vol. 24, No. 6A, pp. 3721-3733 3729
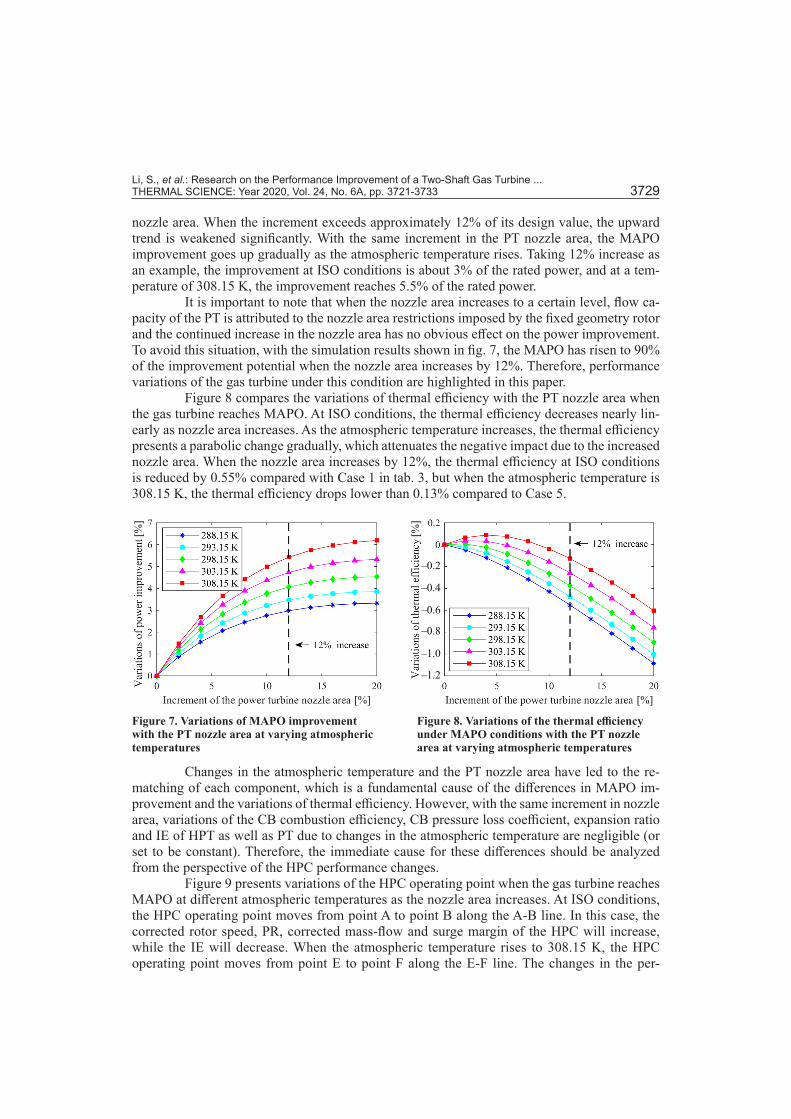
nozzle area. When the increment exceeds approximately 12% of its design value, the upward trend is weakened significantly. With the same increment in the PT nozzle area, the MAPO improvement goes up gradually as the atmospheric temperature rises. Taking 12% increase as an example, the improvement at ISO conditions is about 3% of the rated power, and at a tem-perature of 308.15 K, the improvement reaches 5.5% of the rated power.
It is important to note that when the nozzle area increases to a certain level, flow ca-pacity of the PT is attributed to the nozzle area restrictions imposed by the fixed geometry rotor and the continued increase in the nozzle area has no obvious effect on the power improvement. To avoid this situation, with the simulation results shown in fig. 7, the MAPO has risen to 90% of the improvement potential when the nozzle area increases by 12%. Therefore, performance variations of the gas turbine under this condition are highlighted in this paper.
Figure 8 compares the variations of thermal efficiency with the PT nozzle area when the gas turbine reaches MAPO. At ISO conditions, the thermal efficiency decreases nearly lin-early as nozzle area increases. As the atmospheric temperature increases, the thermal efficiency presents a parabolic change gradually, which attenuates the negative impact due to the increased nozzle area. When the nozzle area increases by 12%, the thermal efficiency at ISO conditions is reduced by 0.55% compared with Case 1 in tab. 3, but when the atmospheric temperature is 308.15 K, the thermal efficiency drops lower than 0.13% compared to Case 5.
Figure 7. Variations of MAPO improvement with the PT nozzle area at varying atmospheric temperatures
Figure 8. Variations of the thermal efficiency under MAPO conditions with the PT nozzle area at varying atmospheric temperatures
[%] [%]
[%]
[%]
–0.2
–0.4
–0.6
–0.8
–1.0
–1.2
Changes in the atmospheric temperature and the PT nozzle area have led to the re-matching of each component, which is a fundamental cause of the differences in MAPO im-provement and the variations of thermal efficiency. However, with the same increment in nozzle area, variations of the CB combustion efficiency, CB pressure loss coefficient, expansion ratio and IE of HPT as well as PT due to changes in the atmospheric temperature are negligible (or set to be constant). Therefore, the immediate cause for these differences should be analyzed from the perspective of the HPC performance changes.
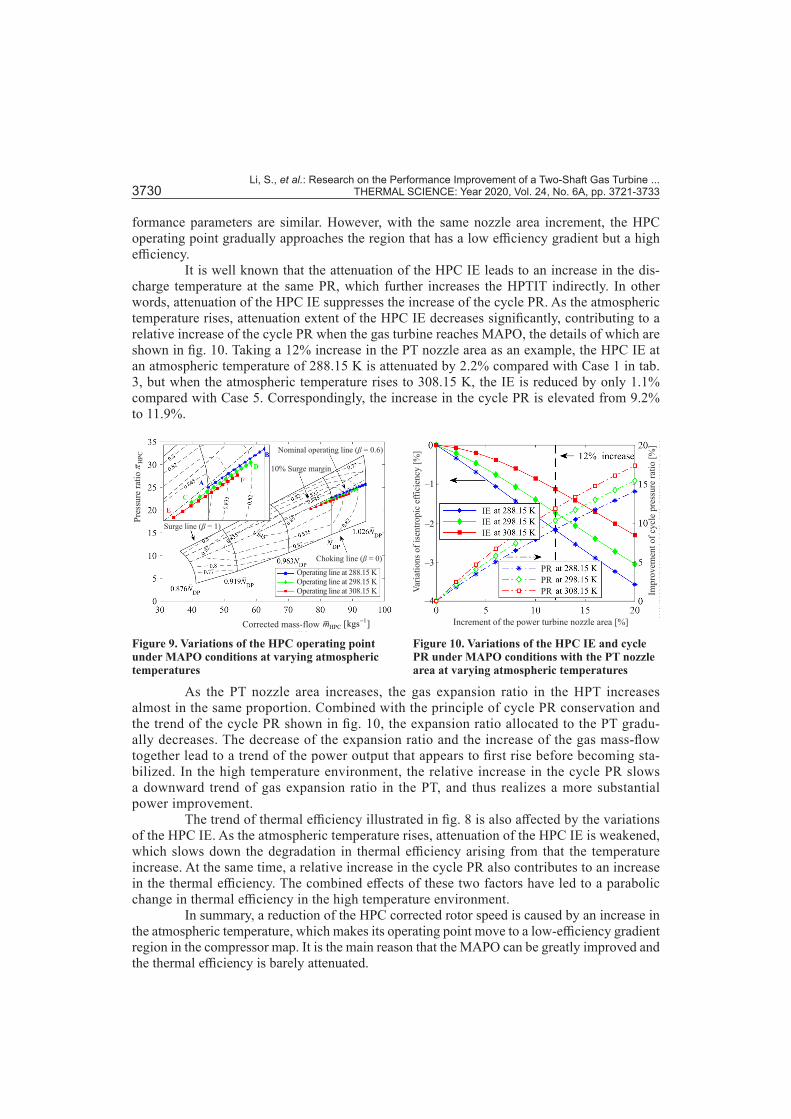
Figure 9 presents variations of the HPC operating point when the gas turbine reaches MAPO at different atmospheric temperatures as the nozzle area increases. At ISO conditions, the HPC operating point moves from point A to point B along the A-B line. In this case, the corrected rotor speed, PR, corrected mass-flow and surge margin of the HPC will increase, while the IE will decrease. When the atmospheric temperature rises to 308.15 K, the HPC operating point moves from point E to point F along the E-F line. The changes in the per-
Li, S., et al.: Research on the Performance Improvement of a Two-Shaft Gas Turbine ... 3730 THERMAL SCIENCE: Year 2020, Vol. 24, No. 6A, pp. 3721-3733
formance parameters are similar. However, with the same nozzle area increment, the HPC operating point gradually approaches the region that has a low efficiency gradient but a high efficiency.
It is well known that the attenuation of the HPC IE leads to an increase in the dis-charge temperature at the same PR, which further increases the HPTIT indirectly. In other words, attenuation of the HPC IE suppresses the increase of the cycle PR. As the atmospheric temperature rises, attenuation extent of the HPC IE decreases significantly, contributing to a relative increase of the cycle PR when the gas turbine reaches MAPO, the details of which are shown in fig. 10. Taking a 12% increase in the PT nozzle area as an example, the HPC IE at an atmospheric temperature of 288.15 K is attenuated by 2.2% compared with Case 1 in tab. 3, but when the atmospheric temperature rises to 308.15 K, the IE is reduced by only 1.1% compared with Case 5. Correspondingly, the increase in the cycle PR is elevated from 9.2% to 11.9%.
Figure 10. Variations of the HPC IE and cycle PR under MAPO conditions with the PT nozzle area at varying atmospheric temperatures
Figure 9. Variations of the HPC operating point under MAPO conditions at varying atmospheric temperatures
Corrected mass-flow 1HPC [kgs ]m −
Pres
sure
ratio
HPC
π
Choking line (β = 0)
Operating line at 288.15 KOperating line at 298.15 KOperating line at 308.15 K
Nominal operating line (β = 0.6)
10% Surge margin
Surge line (β = 1)
Increment of the power turbine nozzle area [%]
Varia
tions
of i
sent
ropi
c ef
ficie
ncy
[%]
Impr
ovem
ent o
f cyc
le p
ress
ure
ratio
[%]
–1
–2
–3
–4
IEIEIE
PRPRPR
As the PT nozzle area increases, the gas expansion ratio in the HPT increases almost in the same proportion. Combined with the principle of cycle PR conservation and the trend of the cycle PR shown in fig. 10, the expansion ratio allocated to the PT gradu-ally decreases. The decrease of the expansion ratio and the increase of the gas mass-flow together lead to a trend of the power output that appears to first rise before becoming sta-bilized. In the high temperature environment, the relative increase in the cycle PR slows a downward trend of gas expansion ratio in the PT, and thus realizes a more substantial power improvement.
The trend of thermal efficiency illustrated in fig. 8 is also affected by the variations of the HPC IE. As the atmospheric temperature rises, attenuation of the HPC IE is weakened, which slows down the degradation in thermal efficiency arising from that the temperature increase. At the same time, a relative increase in the cycle PR also contributes to an increase in the thermal efficiency. The combined effects of these two factors have led to a parabolic change in thermal efficiency in the high temperature environment.
In summary, a reduction of the HPC corrected rotor speed is caused by an increase in the atmospheric temperature, which makes its operating point move to a low-efficiency gradient region in the compressor map. It is the main reason that the MAPO can be greatly improved and the thermal efficiency is barely attenuated.

Li, S., et al.: Research on the Performance Improvement of a Two-Shaft Gas Turbine ... THERMAL SCIENCE: Year 2020, Vol. 24, No. 6A, pp. 3721-3733 3731
Performance improvement at varying atmospheric pressures
As shown in fig. 11, under different atmospheric pressures, the improvement curve of the MAPO shows a gradual upward trend similar to the curve at different atmospheric tempera-tures. However, as the atmospheric pressure drops, MAPO improvement also decreases. When the PT nozzle area increases by 12%, the power output increases by approximately 3% at ISO conditions, while under 0.8 atm, the improvement falls to around 2.4%.
Correspondingly, fig. 12 shows the variations of thermal efficiency with the PT nozzle area when the gas turbine reaches the MAPO and the thermal efficiency curves under different atmospheric pressures are completely overlapped. When the nozzle area increases by 12%, the thermal efficiency drops by about 0.55% compared to Cases 6-9 in tab. 3.
Figure 11. Variations of MAPO improvement with the PT nozzle area at varying atmospheric pressures
Figure 12. Variations of the thermal efficiency under MAPO conditions with the PT nozzle area at varying atmospheric pressures
Increment of the power turbine nozzle area [%]
Varia
tions
of p
ower
impr
ovem
ent [
%]
Varia
tions
of t
herm
al e
ffici
ency
[%]
Increment of the power turbine nozzle area [%]
–0.2
–0.4
–0.6
–0.8
–1.0
–1.2
Variations of the atmospheric pressure exert no influence on the HPC corrected rotor speed. Therefore, under different atmospheric pressures (assume that the atmospheric tempera-ture is 288.15 K and keep constant), when the gas turbine reaches the MAPO, the HPC oper-ating points all shift from point A to point B along the A-B line in fig. 9, as the PT nozzle area increases. The changes in the IE, the PR, and the corrected mass-flow of the HPC are the same, which leads to consistency of the thermal efficiency curves, as shown in fig. 12. However, under low atmospheric pressure conditions, the increment of the HPC real mass-flow is lower than that of the corrected mass-flow, eq. (2), causing a descending improvement of the real gas mass-flow in the PT. As a result, the MAPO improvement decreases with the atmospheric pressure as shown in fig. 11.
Conclusions
In this paper, a thermodynamic performance simulation model for a two-shaft gas turbine has been established. In addition, the model’s accuracy has been verified by comparing the experiment data and simulation results. Assuming that the PT IE is not affected by its oper-ating point or nozzle area, a quantitative study has been conducted on MAPO improvement and variations of the thermal efficiency under different atmospheric conditions through FF and VAN control. The conclusions are drawn as follows.
y In order to ensure the gas path temperature of all hot end components does not exceed the safety limits as the PT nozzle area increases, FF can be adjusted according to the maximum acceptable PTIT under the corresponding increment of PT nozzle area.
Li, S., et al.: Research on the Performance Improvement of a Two-Shaft Gas Turbine ... 3732 THERMAL SCIENCE: Year 2020, Vol. 24, No. 6A, pp. 3721-3733
y The MAPO increases firstly and becomes stabilized gradually as the PT nozzle area in-creases. In the high temperature environment, the MAPO improvement is more noticeable and the attenuation of the thermal efficiency is quite small. For the two-shaft gas turbine studied in this paper, under the conditions of 308.15 K and 1 atm, the MAPO improvement can be 5.5% of the rated power and the thermal efficiency drops only 0.13% with the PT nozzle area increases by 12%.
y At high altitude area, the MAPO improvement is decreased but the variation of the thermal efficiency is not affected by atmospheric pressure.
y The improvement of MAPO based on FF and VAN control is essentially a result of the re-matching of each component. However, the variation of the HPC IE is the main factor affecting this improvement. In the regulation process, the slower decrease of the HPC IE is, the greater increase in the power output is and the smaller attenuation of the thermal efficiency is.
Acknowledgment
The authors would like to thank the Pipeline Compressor-Set Maintenance Repair & Overhaul Center, PetroChina Company Limited, PRC, for providing the acceptance test data of the gas generator (GE PGT25+) used in GE LM2500+SAC gas turbine.
NomenclatureE – relative error, [–]h – specific enthalpy, [Jkg–1]LHV – fuel lower heating value, [Jkg–1]m – actual mass-flow, [kgs–1]m – corrected mass-flow, [kgs–1]N – actual rotor speed, [rmin–1]N – corrected rotor speed, [rmin–1]p – pressure, [kPa]R – mole gas constant, 8.31451 [J–1molK]T – temperature, [K]PW – power, [W]
Greek Letters
β – auxiliary parameter, [–]δ – pressure loss coefficient, [–]ε – expansion ratio, [–]η – isentropic efficiency, [–]π – pressure ratio, [–]ρ – atmospheric humidity, [gm–3]
σ – maximum allowable relative error, [–]τ – maximum iterative number, [–]φ – bleeding coefficient, [–]
Subscripts
CA – cooling airCPR – cycle PRDP – design pointOC – operating conditionOD – off-design pointFL – fuelGG – gas generatorGT – gas turbineISO – standard conditionin – component inletmec – mechanicalout – component outletpred – predicted operating parametertarg – target operating parameter
References[1] EI-Hadik, A. A., The Impact of Atmospheric Conditions on Gas Turbine Performance, Journal of Engi-
neering for Gas Turbines and Power, 112 (1990), 4, pp. 590-596[2] Kakaras, E., et al., Inlet Air Cooling Methods for Gas Turbine Based Power Plants, Journal of Engineer-
ing for Gas Turbines and Power, 128 (2005), 2, pp. 312-317[3] Chaker, M., Meher-Homji, C. B., Inlet Fogging of Gas Turbine Engines: Climatic Analysis of Gas Turbine
Evaporative Cooling Potential of International Locations, Journal of Engineering for Gas Turbines and Power, 128 (2006), 4, pp. 815-825
[4] Caresana, F., et al., Microturbogas Cogeneration Systems for Distributed Generation: Effects of Ambient Temperature on Global Performance and Components’ Behavior, Applied Energy, 124 (2014), July, pp. 17-27
Li, S., et al.: Research on the Performance Improvement of a Two-Shaft Gas Turbine ... THERMAL SCIENCE: Year 2020, Vol. 24, No. 6A, pp. 3721-3733 3733
[5] Sa, A. D., Zubaidy, S. A., Gas Turbine Performance at Varying Ambient Temperature, Applied Thermal Engineering, 31 (2011), 14-15, pp. 2735-2739
[6] Noroozian, A., Bidi, M., An Applicable Method for Gas Turbine Efficiency Improvement. Case study: Mon-tazar Ghaem Power Plant, Iran, Journal of Natural Gas Science and Engineering, 28 (2016), 1, pp. 95-105
[7] Wen, X. Y., Xiao, D. M., Feasibility Study of an Intercooled-Cycle Marine Gas Turbine, Journal of Engi-neering for Gas Turbines and Power, 130 (2008), 2, pp. 022201-022201-6
[8] Alibrahim, A. M., Varnham, A., A Review of Inlet Air-Cooling Technologies for Enhancing the Per-formance of Combustion Turbines in Saudi Arabia, Applied Thermal Engineering, 30 (2010), 14, pp. 1879-1888
[9] Karstensen, K. W.,Wiggins, J. O., A Variable-Geometry Power Turbine for Marine Gas Turbines, Journal of Turbomachinery, 112 (1990), 2, pp. 165-174
[10] Colantoni, S., et al., Twin Shaft Gas Turbine Variable Area Turbine Nozzle: Analytical Modeling and Op-timization of Kinematic Chain, Proceedings, ASME Turbo Expo 2016, Seoul, South Korea, 2016; ASME Paper No. GT2016-57702, pp. V07AT27A008
[11] Gu, C. W., et al., Development and Application of a Thermodynamic-Cycle Performance Analysis Meth-od of a Three-Shaft Gas Turbine, Energy, 112 (2016), Oct., pp. 307-321
[12] Haglind, F., Variable Geometry Gas Turbines for Improving the Part-Load Performance of Marine Com-bined Cycles – Gas Turbine Performance, Energy, 35 (2010), 2, pp. 562-570
[13] Bringhenti, C., Barbosa, J. R., Study of An Industrial Gas Turbine with Turbine Stators Variable Geom-etry, Proceedings, 9th Brazilian Congress of Thermal Engineering and Sciences, Caxambu, Brazil, 2002, paper CIT02–0885
[14] Bringhenti, C., Barbosa, J. R., Methodology for Gas Turbine Performance Improvement Using Vari-able-Geometry Compressors and Turbines, Proceedings of the Institution of Mechanical Engineers Part A Journal of Power and Energy, 218 (2004), 7, pp. 541-549
[15] Klapproth, J., et al., Aerodynamic Development and Performance of the CF6-6/LM2500 Compressor, Proceedings, 4th International Symposium on Air Breathing Engines, Orlando, Fla., USA, 1979, paper 79-7030
[16] Li, Y. G., et al., Improved Multiple Point Nonlinear Genetic Algorithm Based Performance Adaptation Using Least Square Method, Journal of Engineering for Gas Turbines and Power, 134 (2011), 3, pp. 031701-031701-10
[17] Kurzke, J., How to Get Component Maps for Aircraft Gas Turbine Performance Calculations, Proceed-ings, International Gas Turbine and Aeroengine Congress and Exhibition, Birmingham, UK, 1996, ASME Paper No. 96-GT-164
[18] Consonni, S., et al., Turbomachinery and Off-Design Aspects in Steam-Injected Gas Cycles, Proceedings, 23rd Intersociety Energy Conversion Engineering Conference, Denver, Cal., USA, 1988
[19] Saravanamuttoo, H. I. H., et al., Gas Turbine Theory, 6th ed., Pearson Education Limited, Harlow, UK, 2009[20] Walsh, P. P., et al., Gas Turbine Performance, 2nd ed., Blackwell Science Ltd, Oxford, UK, 2004[21] Zhang, N., Cai, R., Analytical Solutions and Typical Characteristics of Part-Load Performances of Sin-
gle Shaft Gas Turbine and its Cogeneration, Energy Conversion and Management, 43 (2002), 9-12, pp. 1323-1337
[22] Mohammadi, E., Montazeri-Gh, M., Simulation of Full and Part-Load Performance Deterioration of In-dustrial Two-Shaft Gas Turbine, Journal of Engineering for Gas Turbines and Power, 136 (2014), 9, pp. 092602-092602-9
[23] Qiu, C., et al., Performance Estimation of Variable Geometry Turbines, Proceedings of the Institution of Mechanical Engineers Part A: Journal of Power and Energy, 223 (2009), 4, pp. 441-449
Paper submitted: April 7, 2018Paper revised: March 7, 2019Paper accepted: April 7, 2019
© 2020 Society of Thermal Engineers of SerbiaPublished by the Vinča Institute of Nuclear Sciences, Belgrade, Serbia.
This is an open access article distributed under the CC BY-NC-ND 4.0 terms and conditions