research on a typology of traditional farming in burundi
TRANSCRIPT

Agricultural Systems 28 (1988) 103-117
Research on a Typology of Traditional Farming in Burundi
Manyong ' A. Manyong," Jos6 Degand*" Luc D'Haese, b P.-F. Ndimira b & Pierre Duti i leuP
" Facult6 des Sciences Agronomiques, Universit6 Catholique de Louvain, B-1348 Louvain-la-Neuve, Belgium
b Facult6 des Sciences Agronomiques, Universit6 du Burundi, BP 2940, Bujumbura, Republic of Burundi
(Received 29 September 1986; revised version received and accepted 22 December 1987)
ABSTRA CT
This paper attempts to demonstrate the persistenee of a relatively important heterogeneity in traditional farming whenever the typology solely reflects geographical criteria.
Within the discriminant analysis approach, a stepwise method is paving the way for selecting variables responsible for this heterogeneity.
Finally, the outcome of the research leads to the necessity of defining new criteria for the demarcation of more homogeneous development areas.
1 INTRODUCTION
Among the problems encountered by planning authorities in the definition of strategies of agricultural development, the variability and disparity between production units is a major factor which must be recognized in the very first phase of each planning process. Indeed, it is obvious that farmers will never follow the guidelines proposed by a plan if the latter fails to be consistent with their objectives and the constraints they have to deal with.
Consequently, it is necessary to proceed by typology, regrouping similar individuals into homogeneous categories to which application of the same specific strategy is possible. However, since it is extremely unusual in
* To whom all correspondence should be addressed.
103 Agricultural Systems 0308-521X/88/$03"50 © 1988 Elsevier Applied Science Publishers Ltd, England. Printed in Great Britain

104 Mato'ong" A. Manyong et al.
agriculture to find two absolutely identical production units, the best typology is finally that which would distinguish between all individuals; thus leading to as many development plans as there are farming units. Obviously, this approach is unaffordable because of its prohibitive economic cost.
When individuals among whom few differences prevail are regrouped in the same category, some loss of information is accepted. Therefore, the purpose of typology is to arbitrate between the loss of information due to amalgamation and the development policy in the absence of typology.
Strategies of agricultural development in Burundi rely on the subdivision of the territory into 11 natural regions (R6pub!ique du Burundi, 1982) whose definition depends on relief, geology, climate, flora and fauna (Van der Velpen, 1973). This typology is irrelevant when agricultural production is involved because of its inability to reduce the disparity existing among the various farming units.
The purpose of this paper is to demonstrate the persistence of a serious heterogeneity when technico-economic criteria are integrated in the typology of farming units of the same natural region: the Mugamba region. Given a prior i differences between Nor th and South Mugamba, a stepwise method has been used in order to dispose of a set of variables sufficient for discriminating between the two sub-regions. Finally, the writers are proposing new criteria to be used in a selective classification, relevant to the perspectives of the development services.
2 M E T H O D O L O G Y
Discriminant analysis aims at classifying an item given its characteristics. This analysis assumes the existence of well-defined groups. Therefore, discriminant analysis sensu str icto is not at all concerned with group determination since a certain number (g) of groups already exists.
Formally speaking, each item is well defined by a vector x in R p, the elements of which are continuous or discrete according to the nature of the variables, selected for the discriminant function.
In multivariate analysis, groups are generally defined by a probability distribution, fk(x]0), with 0 as a parameter vector, standing for the probability density function related to the distribution ofp variables within the group k (k = 1 , . . . , g).
A discrimination rule divides the space R p into g sub-spaces in such a manner that if the vector associated with a new item belongs to sub-space k, this item will be classified in the group k. This decision rule is differently considered according to the viewpoint adopted, either the classical one or the bayesian one (Mouchart, 1980).
Research on a typology ~)/ traditional farming in Burundi 105
We are eventually faced with the crucial problem of choosing the discriminating variables. In many cases the dimension of the x vector coming along with each item is quite large. Everything has to be done to decrease the number of variables to be taken into account in order to reduce the cost of experimentation and to simplify the discriminating process.
Moreover , different authors (Romeder, 1973; Lachenbruch, 1975; Lachenbruch & Goldstein, 1979; Rolin, 1980) assume that the selection of a smaller set o f variables improves the reliability of the process by eliminating the less important variables. In our case the selection process has been the stepwise method.
This method can be described as follows. At the step q + 1, one is adding, among the p - q variables left, the one which provides the highest discriminating power jointly with the first q variables already selected. It is therefore important to find a criterion allowing for the selection of the new variable.
Let us remind ourselves as to what is meant by sufficiency in discriminant analysis. Let y = Ax where the matrix A stands for a set o f q elements of the vector x; it means that the elements of A are 0 or 1 with no more than one non-zero element by row or by column. The vector y will be regarded as sufficient for the discrimination if the distribution of x, given y, is the same for each group, that is to say:
fk(X lAx) =fl(X]Ax) V 1 < k < g
wherefk(x) represents the probabil i ty density of the vector x coming from the kth group.
When y is sufficient, one may only consider y for building up a rule of discrimination since:
A(x) =A(Y)fk(x I Y) =fk(Y) f l ( x lY) V 1 < k < g
Let us assume that variables y = Ax have been selected at the step q. The adding of a new variable yq + ~ will be described by a vector a with p elements, p - 1 of which are 0 and one equal to 1.
It goes without saying that the vector a is linearly independent o f the row of the matrix A and that yq+ 1 - ~ - atX where ' denotes the transpose. The new observations vector will be: z = Bx where B' = (A'a). In the stepwise method, it is necessary to estimate the contribution of yq+ 1 to the discriminating process. F rom a theoretical viewpoint, this contribution will be worthless if)' is discriminating as well as z.
SinceJ~(z) =fk(Y)fk(a'xlY) the contr ibution of z will be worthless iffk(a'xly) does not depend on k.
That means that:
fk(a'x l ax ) =f~(a 'x I Ax) V 1 < k < g

106 Manyong' A. Manyong et al.
The step-by-step selection of discriminating variables will be made easier if one uses a statistical test of the above-mentioned hypothesis.
Let us assume that the observations vector x from the group k distributed according to the normal distribution with the mean #k and with the variance-covariance matrix Z independent of k.
It means that fk(x) --~ Np(#k, Y).
The hypothesis
H. a :/k(a'x ]Ax) = f l ( a ' x l A x ) V 1 <_ k <_ g
can then be rewritten taking into account the parameters of the normal distribution as follows:
HA. ,~ tHA • ~'~k =a'Pal V l < k < _ g
with #~--- { I - Z A'(AZ, A ' ) - 1 A ) # k where I stands for the identity matrix. The statistic of the generalized likelihood ratio of the H A hypothesis is
written:
a' T A a X = n l n - -
a' Sa a g
X a n = ) ' nk with
k = l
T a = T - T A ' ( A T A ' ) - I A T ;
S a = S - S A ' ( A S A ' ) - aAS;
a 'Saa a, TA----- ~ stands for the statistic of Wilks;
where nk represents the number of items in group k; T the matrix of total dispersion; S the matrix of the residual dispersion.
In this case, the statistic
n - g - q a 'Taa - a'SAa Fa= g - 1 a'SAa
is distributed according to the Fisher-Snedecor law with g - 1 and n - g - q degrees of freedom.
The method consists in selecting among the variables left the one which is maximizing F,; this means the one which maximizes (a'TAa)/(a'SAa). The stepwise process will stop when this maximum is non-significant.
Besides the classical criteria related to percentage of the well-classified individuals, the Wilks coefficient can be used in order to measure the quality of the discriminant process. For more information, see G6rard (1980, 1986).
Research on a typology o f traditional farming in Burundi 107
In short, the larger the difference between the total dispersion matrix T and the residual one S, the greater the difference between the group means.
The Wilks coefficient A = ISI/IT[ allows this difference to be measured where ISJ and IT[ denote, respectively, the determinants Of the matrices S and T.
3 PROVENANCE OF DATA
The data were collected during the agricultural year 1982-83 (Universit6 du Burundi, 1983) by the College of Agricultural Science of the University of Burundi as part of an agro-economic survey of the Mugamba region.
The survey considered a sample of 120 farming units located in 10 municipalities of the region. North and South Mugamba differ from each other in the density of their population, the soils and the different management techniques involved. 72 farms were situated in the northern sub-region and 48 in the South.
The typology included a geographical quality variable; namely, the location of the farm in one of the two sub-regions; the line separating North from South Mugamba being chosen to pass through the tiny centre of Bugarama.
A total of 42 variables were quantified. These were related to the resources, structures, production techniques and economic results of the farming units involved.
4 APPLICATION A ND I N T E R P R E T A T I O N
4.1 Selection of the discriminating variables
Since the sample consists of 120 units, the separability test allows a maximum of 49 variables for a significance level of 5 %, and of 46 variables if the significance level is reduced to 1%.
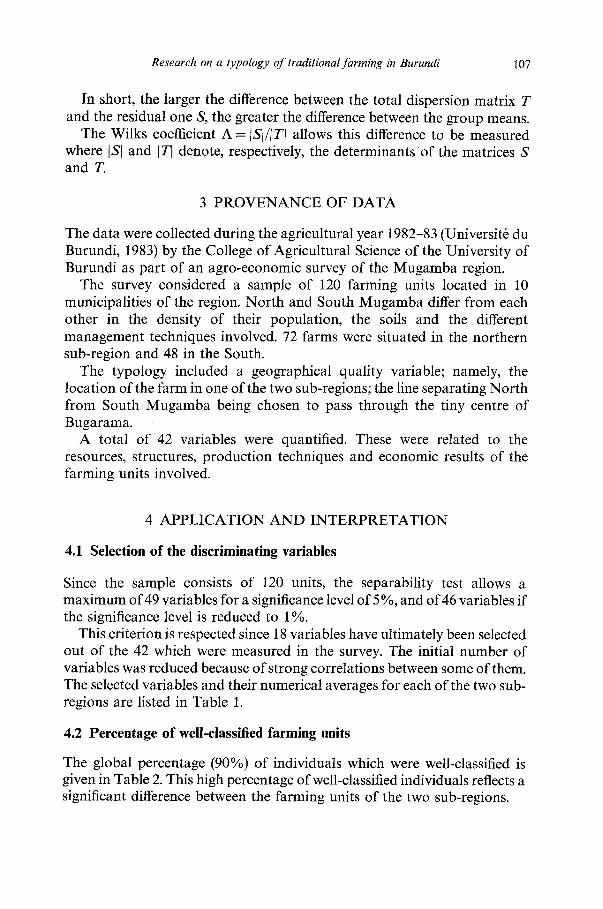
This criterion is respected since 18 variables have ultimately been selected out of the 42 which were measured in the survey. The initial number of variables was reduced because of strong correlations between some of them. The selected variables and their numerical averages for each of the two sub- regions are listed in Table 1.
4.2 Percentage of well-classified farming units
The global percentage (90%) of individuals which were well-classified is given in Table 2. This high percentage of well-classified individuals reflects a significant difference between the farming units of the two sub-regions.
108 Manyong' A. Manyong et al.
TABLE 1 Value Taken by the Variables for the Sub-Regions
Code Denomination North South Region
No. Number 72 48 120 X1 Developed area (m e) 4 692 8 836 6 350 X2 Population of farm (number) 5.15 6'10 5.53 X3 Maize (kg) 403 509 446 X4 Potato (kg) 300 221 268 X5 Sweet potato (kg) 1 022 339 749 X6 Banana-beer (bottles) 300 186 255 X7 Banana-crop (kg) 150 38 105 X8 Fresh manioc (kg) 55 3 34 X9 Bean (kg) 265 139 214 X10 Wheat (kg) 98 131 111 X l i Sorghum (kg) 27 46 35 X12 Garden peas (kg) 67 127 91 X13 Tea (kg of green leaves) 31 40 35 X14 Receipts (Fbu) 7 875 2 557 5 748 X15 Number of impeshi plots per farm 3 4.8 3.7 X16 Number of swamp plots per farm 1'7 1 1.4 X17 Production cost (Fbu) 3 869 2 365 3 268 X18 Age of farm head (years) 47"8 43"6 46
Source: Manyong (1986)
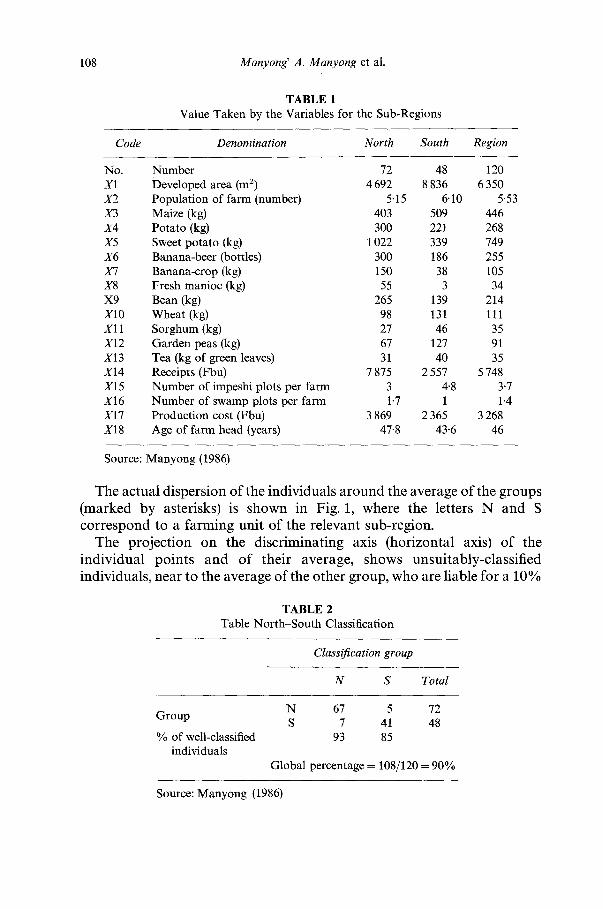
The actual dispersion of the individuals around the average of the groups (marked by asterisks) is shown in Fig. 1, where the letters N and S correspond to a farming unit of the relevant sub-region.
The projection on the discriminating axis (horizontal axis) of the individual points and of their average, shows unsuitably-classified individuals, near to the average of the other group, who are liable for a 10%
TABLE 2 Table North-South Classification
Classification group
N S Total
N 67 5 72 Group S 7 41 48
% of well-classified 93 85 individuals
Global percentage = 108/120 = 90%
Source: Manyong (1986)
4 . o
Research on a typology of traditional /ktrming in Burundi 109
4 . 0
3 . 0
3 . 0
2 . 5
2 . 0
1 . 5
1 .0
0 . 5
0 . 0
- - 0 . 5
- -1 .0
- - 1 . 5
- -2 .0
--2. •
- -3 .0
- -3 .5
N N
N
H S N N N
N N N N N SS
N N SN N
N S N
bin N N N
N N N I ~ N N N N ~llg N SS
N N NNNN'-N N N N S
N N N NN S
N N N N N
N
$
NS SSs S SS
S S ~ S S S S
SS S S
S S
SS S
S "S
3 . 5
3 . 0
2 . 5
2 . 0
1 . 5
1 , 0
0 , 5
0 , 0
- 0 . 5
--q .0
- -1 .5
- - 2 . 0
, - -2 .5
, - 3 . 0
- - . . s - 3 . o - 2 . 5 - 2 . o - 1 . a - l . o - o . 5 o . o 0 . 5 1 . o 1 . 5 2 . 0 2 . 5 - , . o 3 . 5 . . o
Fig. 1. Classification of individuals. First typology level. (Source: Manyong, 1986.)
significance level. These are farming units o f either Nor th or South M u g a m b a which do not agree with the characteristics o f those regions.
Depart ing from the above-mentioned results and from the a posteriori probabil i ty of each individual it is possible to improve the typology. Indeed, we can thus isolate sub-groups of individuals which are typical o f those to the South or the Nor th of the crest.
4.3 Improving the typology
An individual x i will be allocated to a group k whenever his a posteriori probabil i ty Pi to be classified within that group is more than the ratio of 100 to the total number of groups (g). The higher this probabil i ty the more the individual is characteristic o f the group.
If we subdivide each sub-region into two parts, we generate four new groups; namely:
A = Nor th with Pi --- 0.90 B = Nor th with 0.50 < P, < 0.90 C -= South with 0-50 < Pi < 0-90 D = South with IP~ >_ 0-90
The farms which form the groups A and D are supposed to be typical o f their sub-region.

110 Manyong' A. Manyong et al.
TABLE 3 Tabl~ of the A-B-C-D Classification
Classification group
A B C D Total
A 27 4 0 0 31 B 0 41 2 0 43
Group C 0 1 21 0 22
D 0 0 3 21 24 %ofwell-classified 87.1 95.3 95.5 87.5
individuals
Global percentage = 110/120 = 91"67%
Source: Manyong (1986).
The global percentage of individuals which are suitably classified when we have recourse to this new typology is improved (Table 3). All individuals pertaining to group A are effectively situated in the North, while those of group D are all located in the South.
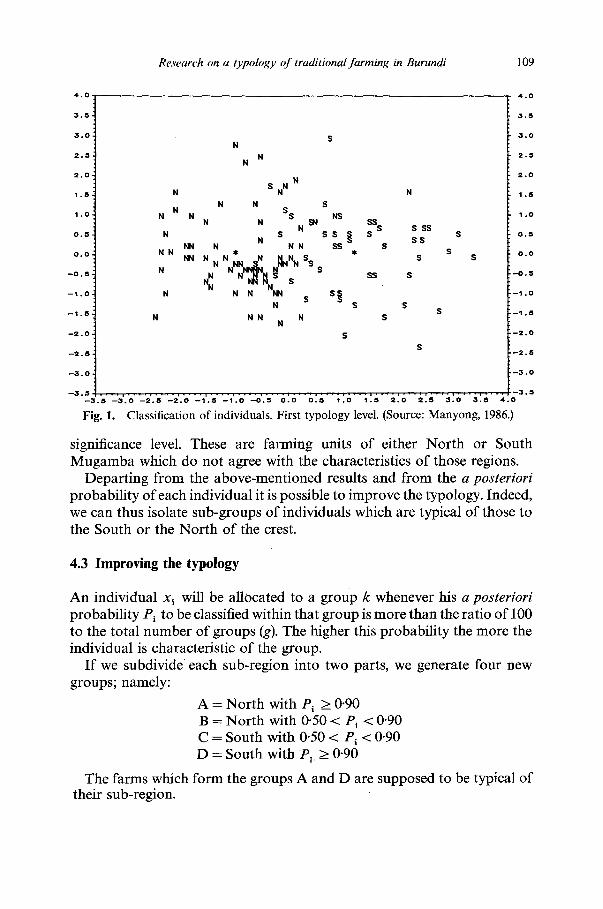
The actual dispersion of the individuals around the average of the groups (marked by asterisks) is shown in Fig. 2 where the letters A, B, C and D correspond to the relevant groups.
6 ,
4
3
2
1
0
--1
- -2
~ 3
--4,
~ 6
--7 --7
Fig. 2.
C C
B B~ C C C
A A A D AAAA A B B C CC D DDDD D D~ D
D D ^ ~ % e o
A A D D B
A A B
~ D D
o % D
1
o
-1
--4
--5
--8
- -6 - - 5 - -4 - -3 - -2 -- 1 0 1 2 3 4 5 6 7 8
Classification of individuals. Second typology level. (Source: Manyong, 1986).
Research on a typology o f traditional farming in Burundi 111
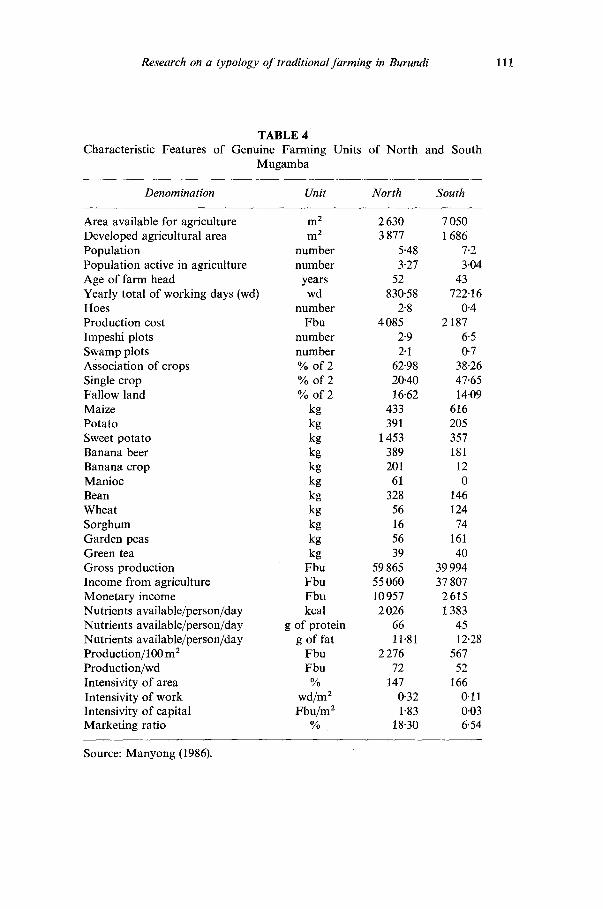
TABLE 4 Characteristic Features of Genuine Farming Units of North and
Mugamba South
Denomination Unit North South
Area available for agriculture m 2 2 630 7 050 Developed agricultural area m 2 3 877 1 686 Population number 5-48 7.2 Population active in agriculture number 3-27 3.04 Age of farm head years 52 43 Yearly total of working days (wd) wd 830"58 722-16 Hoes number 2'8 0.4 Production cost Fbu 4 085 2 187 Impeshi plots number 2"9 6-5 Swamp plots number 2.1 0'7 Association of crops % of 2 62'98 38"26 Single crop % of 2 20"40 47-65 Fallow land % of 2 16.62 14-09 Maize kg 433 616 Potato kg 391 205 Sweet potato kg 1453 357 Banana beer kg 389 181 Banana crop kg 201 12 Manioc kg 61 0 Bean kg 328 146 Wheat kg 56 124 Sorghum kg 16 74 Garden peas kg 56 161 Green tea kg 39 40 Gross production Fbu 59 865 39 994 Income from agriculture Fbu 55 060 37 807 Monetary income Fbu 10 957 2 615 Nutrients available/person/day kcal 2 026 1 383 Nutrients available/person/day g of protein 66 45 Nutrients available/person/day g of fat 11.81 12.28 Production/100 m 2 Fbu 2 276 567 Production/wd Fbu 72 52 Intensivity of area % 147 166 Intensivity of work wd/m 2 0-32 0' 11 Intensivity of capital Fbu/m 2 1-83 0.03 Marketing ratio % 18'30 6.54
Source: Manyong (1986).

112 Manyong' A. Manyong et al.
One can determine the factors responsible for the differences between the average farming unit of the groups A and D from a comparative analysis (Table 4). These differences are actually due to the resources, the agricultural practices involved, some of the agricultural products, and, finally, the economic results.
More land is available for agricultural purposes in the South than in the North, thus allowing a more extensive agriculture. Accordingly, the North tends to intensify its production.
The North, with the higher density of population, takes greater advantage of the association of crops. It also benefits from the cultivation of swamps during the dry season.
As far as production is concerned, the North specializes in the production of starchy vegetables (sweet potato, manioc, banana), while the South finds itself involved in cattle husbandry and in the cultivation of cereals and leguminous plants.
Although the marketing of production plays a greater role in the North than in the South, agriculture in Mugamba mainly remains a subsistence agriculture.
Combined with a higher marketing ratio, the intensifying of production in the North gives better results than those encountered in the South: incomes are higher and more nutrients are available (protein and energy) though the supply of fat remains deficient over the entire region. Moreover, the productivity of both land and work is higher in the small farms of the North.
In short, the results clearly show that efficiency is higher for the farming units situated in the North.
On the basis of all these observations, one can reasonably assume that the small dimension of the production units is not a major constraint to production increase.
4.4 Discriminating power of variables and outcomes of the stepwise method
The variable introduced in the discrimination at each step, the corres- ponding Wilks coefficient, the observed F value with the corresponding degrees of freedom and relevant critical values are listed in Table 5.
It is easily seen that the sub-set of discriminating variables improves discrimination at each step. Indeed the values of A steadily decrease. Thus, the more variables that are included in the discriminating function, the better the results. However, the increase in discriminating power due, at each step, to the inclusion of an additional variable steadily decreases. The test of maximization of differences is applied in order to determine which step is such that the subsequent addition of more variables does not significantly increase the accuracy of the discrimination.

Research on a typology of traditional farming in Burundi 113
TABLE 5 Stepwise Discriminant Analysis: Results Summary
Step Variable Aob ~ Fob ~ df Critical value
1 X1 0"6932 17"11 3, 116 3'26 × 10 -9 2 2"5 0-4909 15'79 3, 115 1"14 x 10 -8 3 X18 0'3865 10-26 3, 114 4-94 × 10 -6 4 X l l 0-3010 10-70 3, 113 3"03 × 10 -6 5 X7 0.2534 7"02 3, 112 2-28 × 10 -4 6 X15 0-2069 8"32 3, 111 4-86 × 10 -5 7 2"2 0"1714 7"59 3, 110 1"66 × 10 -4 8 X8 0-1485 5'60 3, 109 1"31 x 10 -3 9 X12 0-1300 5-14 3, 108 1"68 x 10 .3
10 X14 0"1104 6-33 3, 107 5"42 × 10 - 4
11 X16 0-0927 6"76 3, 106 3-24 x 10 -4 12 X17 0-0795 5-80 3, 105 1.04 x 10 -3 13 2"9 0"0705 4"43 3, 104 5"68 x 10 -3 14 X13 0"065 1 2"85 3, 103 4"11 x 10 -2 15 X4 0"0622 1"58 3, 102 0"199 16 2"3 0-0609 0"69 3, 101 0-560 17 X6 0-0600 0"49 3, 100 0-690 18 XIO 0"058 9 0-66 3, 99 0"579
Note: Fob s is called Fto enter t . . . . . .
1979). Source: Manyong (1986).
in B M D 07 procedure (Dixon,
As the comparison between critical values and significance level shows, discrimination does not significantly improve after the 13th step from the addition of the 5 remaining variables, and this for a significance level of 1%. The fact that the combination of several variables is necessary to achieve a sufficient discrimination between the groups reflects a great variability among the different farms. In other words, a good typology of the agriculture of Burundi should not only involve technico-economic criteria, but some of these criteria are actually indispensable to reflect clearly the actual nature of the farming units. The geographical criteria used to divide the country into natural regions are not sufficient to explain the behaviour of the farmers. Probably motivated by the challenge of demographic expansion, more intensive production seems to differentiate more and more the agricultural practices. Moreover, this recourse to intensity explains the better efficiency of the farms of Nor th Mugamba.
The sub-set of 13 variables will be regarded as sufficient. It means that farming units in the Nor th differentiate themselves from the farming units in the South thanks to these 13 variables but their behaviour remains the same for each of the 5 variables left once the first 13 have been selected. Tea,

114 Manyong' A. Manyong et al.
92 .8 ,
90 .0
87 .5
85 .0
82 .8
80 .0 'tJ .~--.a 7 7 . 5
. r . ' l
72.5. O [ 7 0 . 0 -
e7.5-
6 1 5 . 0 -
8 2 . 5 -
60 .0 -
87 .5 -
55 .0 0
Fig. 3.
T ~ ~ ~ 1'o 1'2 1'4 ,'e 1'8
N u m b e r of v a r i a b l e s Percentage of well-classified individuals for q variables. (Source: Manyong, 1986).
potato, maize, traditional beer, and wheat can thus be introduced in a development program effecting the entire region, while it is necessary, on the other hand, to specify two different sub-regional plans for the other enterprises. As already mentioned above, sweet potato, manioc, banana and beans are mainly encountered in the North; South Mugamba being the sub- region where the cattle husbandry and the cultivation of peas have been most emphasized.
From Fig. 3, it is clear that the sufficient sub-set is the only one to ensure the best discrimination (a maximum percentage of well-classified individuals obtained from the smallest number of variables). Indeed, this percentage, which first increases with the number of variables, reaches a maximum, remains steady, and, finally, decreases, at the 18th step.
T O W A R D THE D E F I N I T I O N OF NEW TYPOLOGY CRITERIA
The preceding clearly shows that the agricultural behaviour (Petit & Brossier, 1979) of family farms is inconsistent with the common definition of natural regions of Burundi.
It is obvious that, since the natural environment continues to influence

Research on a typology of traditional farming in Burundi 115
agricultural practices considerably, factors such as rainfall, quality of soil and altitude, will remain in the typology of farming. Three other factors, however, similarly greatly influence agricultural performance. These are:
(i) the people and the way society evolves (ii) the area available for agricultural purposes (iii) the marketing of production.
Three criteria, which reflect the activity exerted by these factors on agricultural productivity, can be utilized simultaneously with geographical criteria in order to define the boundaries of homogeneous development areas. Namely:
the intensification ratio of labour: i.e. the ratio of active population (or better, the working days) to the cultivated area. This ratio reflects the influence exerted on productivity by agricultural techniques; the intensification ratio of land, or, by definition, the ratio of the developed area (total area of all the plots cultivated throughout the year) to the cultivable area. It is an image of the influence of the scarcity of land due to demographic expansion. This scarcity is called an absolute scarcity when it emanates from a total lack of available land; it is relative if its reason is a deficiency of land of better quality; the marketing rate of agricultural Production, which is the ratio of the monetary income of a farm to its total income. Families whose marketing rate is high have a more convenient way of life than those whose situation is critical, i.e. without surplus.
To render effective and operational a typology relying on those new criteria, it is necessary to overcome two difficulties:
(1) an inadequate knowledge of the farming systems. Although the data related to the natural component of the environment are usually available, the preceding ratios cannot be calculated unless more information is available, which is generally not the case as far as the agriculture of Burundi is concerned. Moreover, these criteria are likely to be time dependent because population is an essentially dynamic variable and due to activities related to the development policy (infrastructure, environmental engineering projects such as irrigation and drainage). Generalized and repeated surveys are thus indispensable because of the need to collect quantitative information about the resources and the organization of local agriculture.
(2) The difficulty of determining the size of a homogeneous group correctly. The above-mentioned lack of information about the agricultural systems involved and associated practices makes it
116 Manyong' A. Manyong et al.
difficult to specify the optimal dimension of a development area. As a principle, such an area should be just large enough to prevent an excessive breaking up of the national agricultural planning policy, and remain sufficiently small to avoid the difficulties which would arise from a significant variability among the various production units of a development :zone.
CONCLUSIONS
This paper demonstrates the existence of a serious heterogeneity among the family farming units of a single region which is assumed and considered as homogeneous by the different agricultural authorities of Burundi (Republique du Burundi, 1982).
The non-operational character of the geographical criteria on which the typology of the national regions of the state is based was shown to be responsible for this heterogeneity.
It is therefore estimated that it is necessary for new criteria to be defined which reflect the economic behaviour of the farming units. For this purpose, the six following criteria have been selected, since they allow us to demarcate more homogeneous development areas: 1st, rainfall; 2rid, the soils; 3rd, altitude; 4th, the intensification ratio of labour; 5th, the intensification ratio of land; and 6th, the marketing rate of agricultural production.
Although these criteria result from a static survey, their advantage is to render the typology dynamic in so far as they involve dynamic variables such as population. On the other hand, however, a similar typology makes it difficult to predict the consequences of future development on the evolution of farming.
REFERENCES
Dixon, W. J., Ed. (1979). BMD Biomedical Computer Programs, P Series, Berkley, University of California Press.
Fisher, R. A. (1936). The use of multiple measurements in taxiconomic problems, Annals of Eugenics, 7, 179-88.
G6rard, G. (1980). Discrimination entre plusieures groupes. In Analyse dis- criminante, Recyclage en statistique, 4, ed. Bragard, L., Richard, J-F. and Simar, L., Comit6 de Statistique-UCL, Seminaire de Math6matiques Appliqu6es aux Sciences Humaines-Facult6s Universitaires St-Louis, 125~3.
G6rard, G. (1986). Analyse de la Variance Multivari6e (MANOVA). In Analyse de la Variance, Reeyclage en Statistique, 6, ed. Paris, J. and Delince, J., Comit6 de Statistique-UCL, S6minaire de Math6matiques Appliqu6es aux Sciences Humaines-Facult6s Universitaires St-Louis, 197-226.

Research on a typology of traditional farming in Burundi 117
Lachenbruch, P. A. (1975). Discriminant Analysis, New York, Hafner Press. Lachenbruch, P. A. & Goldstein, M. (1979). Discriminant analysis, Biometrics,
35(1), 69-85. Manyong' A Manyong, W. (1986). Analyse des Syst~mes d'Exploitation Agricole de
la Cr~te Zai're-Nil au Burundi. Le cas d'Ijenda, Th~se de Doctorat, Louvain-la- Neuve, Tome I.
Mouchart, M. (1980). M6thodes bay6siennes'en analyse discriminante. In Analyse discriminante, Recyclage en Statistique, 4, ed. Bragard, L., Richard, J-F. and Simar, L., Comit6 de Statistique-UCL, S6minaire de Math6matiques Appliqu6es aux Sciences Humaines-Facult6s Universitaires St-Louis, 27-48.
Petit, M. & Brossier, J. (1977). Pour une typologie des exploitations agricoles fond6e sur les projets et les situations des agriculteurs. In Economic Rurale, 122, 31-40.
Raiffa, H. & Schlaifer, R. (1961). Applied Statistical Decision Theory, Boston, Harvard University Press.
R6publique du Burundi, Ministate de l'Agriculture et de l'Elevage (1982). Note du secteur agricole sur le plan quinquennal de d4veloppement kconomique et social 1983-1987. Document de travail, Bujumbura.
Rolin, J-M. (1980). S61ection de variables et m6thode pas fi pas. In Analyse discriminante, Recyclage en Statistique, 4, ed. Bragard, L., Richard, J-F. and Simar, L., Comit6 de Statistique UCL, S6minaire de Math6matiques Appliqu6es aux Sciences Humaines, Facult6s Universitaires St-Louis.
Romeder, J. M. (1973). M4thodes et programmes d'analyse discriminant¢, Paris- Bruxelles-Montr6al, Dunod.
Universit6 du Burundi, Facult6 des Sciences Agronomiques (1983). Enqu~te sur la production et la consommation de la pomme de terre au Burundi, Bujumbura.
Van der Velpen, C1. (1973). Gkographie du Burundi, (3rd edn), Bruxelles, A. de Boeck.