research note maintenance performance systems user's ... · 1 (research note 82-12 maintenance...
TRANSCRIPT
1 (
Research Note 82-12
MAINTENANCE PERFORMANCE SYSTEMSUSER'S REFERENCE MANUAL
VOLUME I:SYSTEM DESCRIPTION
Walter R. HarperF ANACAPA SCIENCES, INC.
TRAINING TECHNICAL AREA
DT OELECI1-
APRI18 W
U. S. Army--- Research Institute for the Behavioral and Social Sciences
April 1981
Approved for public reeu ; distribution unlimi**e.
83 04 15 070" Ln

13T AQT'T-iSECURITY CLASSIFICATION OF THIS PAGE (When Data Entere. .
, REPORT DOCUMENTATION PAGE RE CMPCTINoNSI. REPORT NUMBER " 2. GOVT ACCESSION NO. 3. RECIPIENT'S CATALOG NUMBER
Research Note 82-12 APAIL -71v4. TITLE (nd Subtitle) S. TYPE OF REPORTA PERIOD COV RED
MAINTENANCE PERFORMANCE SYSTEM, USER' REFERENCE Final Report (3rd Year)
MANUAL VOLUME I: SYSTEM DESCRIPTION 1 May 1978 - 30 April 1981
6. PERFORMING ORG. REPORT NUMBER
7. AUTHOR(e) G. CONTRACT OR GRANT NUMBER(&)
Walter R. Harper MDA 903-78-C-2007
9. PERFORMING ORGANIZATION NAME AND ADDRESS 10. PROGRAM ELEMENT, PROJECT, TASK
ANACAPA SCIENCES, INC. AREA S WORK UNIT NUMBERS
901 Olive Street - PO Box Drawer Q 2QI62722A791Santa Barbara, California 93102
It. CONTROLLING OFFICE NAME AND ADDRESS 12. REPORT DATE
US Army Research Institute for the Behavioral April 1981and Social Sciences (PERI-II), 5001 Eisenhower IS. NUMBER OF PAGES
Avenue, Alexandria, VA 2233314. MONITORING AGENCY NAME & ADORESS(iI different from Controlling Office) IS. SECURITY CLASS. (of this report)
UNCLASSIFIED
ISa. DECLASSI FIC ATION/ DOWNGRADING
SCHEDULE
IS. DISTRIBUTION STATEMENT (of this Report)
Approved for public release; distribution unlimited
17. DISTRIBUTION STATEMENT (of the abatract entered in Block 20, It different fron Report)
Is. SUPPLEMENTARY NOTES
19. KEY WORDS (Continue on reverae side if necessary end Identify by block number)
Maintenance Performance Measurement Maintenance TrainingMaintenance Problem Diagnosis Maintenance TasksMaintenance Performance System Maintenance Training Manuals
AThACr fCWaeu M re @M If neweemi MW~et* by bioke)A 5Thls report describes the final year of a three-year project to de-
velop, implement, and evaluate an Army Maintenance Performance System(MPS). From specific maintenance-related performance measures provided bythe MPS, managers and supervisors can assess maintenance effectiveness andrelate it to repairmen skills and maintenance training needs. The MPSestablishes training priorities, and specifies training resources andmethods for overcoming specific deficiencies.
D W13 EDITON OF I M@V 6ov S sOLETE UNCLASSIFIED
i SECUITY CLASIFICATION OF THIS PA E (Whmn Date Entered)
,-- _ _ _ _ _ '' - . .%

UNCLASSIFIEDSECURITY CLASSIFICATION OF THIS PAS(lWhe- Data ENat&C
Item 20 (Continued)
In work completed prior to the final year, a prototype MPS was de-veloped and operated by the contractor staff. Maintenance managers re-ported that the MPS provided useful, unique, and valid information to aidmaintenance operations. During the 46-week period in which the prototypesystem was operated at Fort Carson, Colorado, the relationships amongmaintenance workload, efficiency, and skill were studies. As workloadincreased, efficiency decreased. However, changes in skill levels, through
personnel turbulence and/or training, mediated between workload and effi-ciency. For example, efficiency might actually increase with increasedworkload, if skill levels increased as well. This finding supported theunderlying premise of the MPS, that effort expended on increasing main-tenance skills would pay off in increased maintenance effectiveness.
The final year produced a streamlined and expanded MPS that couldbe handed over to and operated by Army personnel. The system encompassed10 technical Military Occupational Specialties (MOS's) and the equipment ofa mechanized infantry division. The system was proven during a 10-weekimplementation period at Fort Carson, Colorado. Also, a study of MPS
potential in geographically dispersed operations, such as in USAREUR,concluded that the MPS would operate satisfactorily if data collection fromoutlying units were coordinated with maintenance control system procedures.
A total of 34 reports, manuals, system descriptions, and performanceaids were prepared and submitted during the three-year project. These
publications provide details on the project and the resulting MPS.
J
i0.
i .. . . .. -1_
UNCLASSIFIED
SECURITY CLASSIFICATION OF THIS PAGE(tWIn Daft Rntms
Research Note 82-12
MAINTENANCE PERFORMANCE SYSTEM,USER'S REFERENCE MANUAL
VOLUME I:SYSTEM DESCRIPTION
Walter R. HarperANACAPA SCIENCES, INC.
Submitted by:John F. Hayes, Acting Chief
TRAINING TECHNICAL AREA
4Approved by:Milton S. Katz, Acting DirectorTRAINING RESEARCH LABORATORY
U.S. ARMY RESEARCH INSTITUTE FOR THE BEHAVIORAL AND SOCIAL SCIENCES5001 Eisenhower Avenue, Alexandria, Virginia 22333
Off ice, Deputy Chief of Staff for PersonnelDepartment of the Army
April 1981
Army Project Number Manpower, Personnel and Training2QI62722A791
Apprawd for pUMit ridms dlsubutlon unlmted.

TABLE OF CONTBU78
FOREWORD . ................ . . . . . . . . ix
Organization of the Manual ...... . . . . . . . . . . . . . x-*Background, Objectives, and MPS Users . . . . . . . . . . . . . . xi
What is the MPS? .* . . . . . . . . . . . . Xi
'IMPS Objectives . . . . . . . . . . . . . . . . . . . . . xiiMPS Users . . . . . . .. .. .. * . . . . . . . . . . .xii
chapter
1 MAINTENANCE PERFORMANCE SYSTEM DESCRIPTION .. 1-1
Components of theSystem . .. .. .. .. . . ... 1-5
2 MPS OPERA'rON . . . . . . . . . . . . . . . . . . . . 2-1
MPS Performance Data Collection Procedures . . . . . . 2-1Data Computation .. .. ... . . . . .. ... 2-5
*The MPS operator ... . .. . . . . . . . . . . 2-7
3 MPS OUTrPUTr. . .. .. . .. . .. . . . .* . . . 3-1IOutput Format . . . . . .. .. .. .. .. . . . . 3-1Report Content .. .. ..... . .... ... . . . 3-2Distribution . . . . . . . . . . . .. .. .. .. . .4-4
44 INTERPRETATION OF MPS, REPORTS .. .. ..... . . . 4-1
Rationale Governing Management Reports . . . . . . . . 4-1Report Interpretation ... . .. .. . . . . . . . . 4-3
Man-hour Availability and Use-Table 1, Ref. 4 . . . 4-3Average Direct Man-hours Per Job-Table 2, Ref. 12 . 4-7Average Direct Man-hours Per Job by Equipmentand Ta- TaeRef.1. . . .. o. .. . 4-9
Average Job Completion Time in Days-Table 4, Refs. 26, 27, 29 . . . . . . . . . . . . . 4-11
Average Days Spent in Each Job Status-Table5, Ref. 31 .. . .. .. .. .. . .. . .-15
7Training Management Reports . . . . . . . . . . . . . 4-19Skill and Growth Indexes-Table 6, Ref. 38 . . . . . 4-19Skill Development Summary-Table 7, Ref. 40 . . . . 4-22kndvidual Skill Hstory-Table 8, Ref. 48 . . . . . . 4-23* £ Special Note on MOB 63111W Integration Related to MPS . 4-26
*Training Requirements Summary-Table 9, Ref. 57.. 4-27
gon*4a
IL. _ _ - - _
Page
APPENDIX A: NOTES ON DATA COMPUTATION AND REPORTGENERATION . . . . . . .. .. .. .. .. .. . .A-1
Estimated Data Requirements . . . . . . . . . . . . . . . A-i
Interpretation Comments .. . . .. .. A-2Tablei1(Man-hour Availablity and Use). A-3Table 2(Average Direct Man-hours Per Job) .. . . . . . A-4Table 3 (Average Direct Man-hours Per Job by
Equipment and Task) . . . .. .. .. .. .. .. .A-4Table 4 (Average Job Completion Time in Days) . . . . . A-5Table 5 (Average Days Spent in Each Job Status for
Communication and Electronic Welding Jobs). ... . . A-6Table 6(Skiland Growth ndexes) . . . . . . . . . . . A-6Table 7 (Skcll Development Summary) . . . . . . . . . . A-8Table 8(Individual Skillistory). .. ... ....... A-STable 9 (Training Requirements Summry). .. .. .... A-9
SUPPLEMEN!'1 . . . . . . . . .. .. .. .. . .. . . . . . A-ilGeneral Notes . . . . . . . . . . . .. .. .. .. . . . A-i1Specific Interval Calculations .. .. .... .... .. .. A-li
SUPPLJEMENT! 2... .. .. .. .. . . . . . . . . . . . . . . A-13Definitions of Terms . . . . . . . .* . . . . . . . . . .Ai13Priority Concept. .. .. ....... . . . . . . . . . . A-13
Rounding PValues for Dislay .. .. .. .. .. . ..... A1
a. Vi
-- -A-A.

TeL OF TABLU AND IGURW1 1Table Page
T A MPS user information needs by duty position ......... xiii
1-1 Breakdown of equipment listed in MPS by modelsand MOG's . .. .. .. .. .. .. .. .. .. .. . .. 1-2
1-2 Data files used In MPS ... ............... 1-10
1-3 Listing of utility and operating programs usedILin MPS ......................... 1-11
2-1 Contributions of maintenance personnel to MPSS"forms ......................... 2-5
3-1 MOS's in MPS grouped by technical category. . . . . . ... 3-2
3-2 MPS table number by generic groups and numbers
of variants . . . . . . ................ 3-3
3-3 User's code numbers . . . . . . ............. 3-4
j 3-4 Distribution interval and number of reports receivedby MPS users . ............... . . . . .. 3-5
* A-1 Initial data sources (forms) for each report andnumber of forms estimated per week...... . . . . . . A-I
I Figure
1-1 Information flow in the Maintenance Performance
1-2 Components of the IBM 5120 computing system . . . . . . . 1-8
1-3 Data diskette for IBM 5120 computing system . . . . . . . . 1-9
r4,-1 (410:, Ma-hour availabilty an use . .. .. ..... .,,.-4
4-2 (41C/45B/45K/L): Average direct man-hospe jobpe .. .. .. .. .. .. .. .. .. .. .. . .. 4-8
4-3 (31E): Average direct man-bows per Job by equipmentand task ........... 4-10
4-4 (S1E/44B): Average Job completion time in days . . . . . . . 4-12
I! Evii

Figure Paj
4-5 (41C/45B/45K/L): Average job completion timein days .. .. .. .. .. .. .. .. .. .. .. ... 4-134-6 (63H/W-TRACK): Average job completion time
in days .. .. .. .. .. .. .. .. .. .. .. . .. 4-14
4-7 (31E/44B): Average days spent in each job statusfor communication and electronics and welding jobs ... .. 4-16
4-8 (63H/W): Skill and growth indexes . . . . . . . . . . ... 4-20
4-9 Skill development summary ............. . . . ... 4-22
4-10 (63H/W): Individual *ill history . . . . . . . . . . . ... 4-24
4-11 (63H/W): Training requirements summary . . . . . . . ... 4-28
ViiiR
=._ _ _ _-'

S POREWORD
This is Vab..e I of a two-volume Reference Manual for users of the Mainte-
nance Performance System (MPS). The purpose of the manual is to provide a ready
source of reference information and list appropriate baekground data to help the
user understand the development and operation of the MPS. The Reference Manual• is one of four documents that have been prepared to support NIPS operation s The
remaiin documents are:
(}etorlms Manual - describes methods and procedures MPS operators needto operate and maintain the MPS, including data collection, data entry,
quality control, and report generation.
Guide for individml Teehnieal Training In Direct Suppart Units - presents the
Unit Training Method, a logical approach for accomplishing individual
technical training in direct support (DS) units. The guide also identifies
training methods and tralning resources.
Interpretatiou Boolst - summarizes report interpretation information-" contained in the Reference Manual in an easy to use "hip-poeket" format.
The contents of these documents have not been repeated in the Reference
Manual unless necessary to clarify a description or discussion. Each document
stands alone.
The reader who requires only an overview of the total MPS should study only
the System Reference Manual. More detailed information on specific facets of the
system will be found in the other documents.
*A mst tandsba
,, I. In dsrbing activities md requisites of holders of technical MOS% the Army hasused the term "repairman" in a gender-free context. In the diseusslons in thismanual, use of "repairman," and of "he," or "his," follows Army practice.
'ax ix

The MPS is designed for use at company and battalion HQ levels in direct
support units. The system provides unique training and maintenance management
information. Primary users of this information are unit leaders. e.g., battalion
commander, the battalion materiel officer (MATO), forward support company
eommanders, maintenance technicians, and non-commissioned officers who super-
vise maintenance sections.
ORGANIZATION OF THE MAMUAL
This manual is divided into two volumes: Volume 1 describes the major
components of the MPS; Volume 2 contains samples of MPS data collection forms
and examples of each MPS report.
Volume 1: System Description
Volume 1 -is divided into four chapters and an appendix, as described below.
Foreword - This describes the purpose of the Reference Manual, the
organization and audience, and relates the Reference Manual to other MPS
documents. Also included is a summary description of the MPS and a description of
the rationale behind its development.
$>CI.$ter MPS~ Demwtion - This chapter describes the scope of the
system and its operating environment. Some limitations in the development of the
prototype system are also described. MPS system components are described under
headings ofh data input required for system operation, processing hardware, and
required personnel
clinter (~Opeation This chapter describes data collection and
computational procedures, and cites the algorithms used to produce reports.
Dissemination procedures for the output reports to appropriate users are also
described.' IC ampter -Zqa% - This chapter provides examples and disoussion of
representative MPS reports, and identifies recipients of each report.
a.
x
Chapter MP eot tvttc This chapter describes M?5 reports
I
in terms of management and training information and gives examples of possible
- actions to take based on report content.
Appesidix A. otes an Data Comutt md Report Gmmatin - -"W I"
appendix describes the algorithms used to compute the outputs shown on MPS
reports.
Valume 2: Input/output Exampe
Volume 2 is divided into two appendices, as described below.
Appendix A. bIput amples - Samples of MPS data collection forms are
provided in Appendix A.
Appendix B. Output Examples - A complete set of examples of all 58reports is provided as Appendix B.
BACKGROUND, OBJECT1VES, AND MPS USERS
What is the UPS?
The MPS is primarily a training needs information system that helps identify
problems related to lack of technical skills, poor utilization of training resources,
and poor shop management. The system also helps to pinpoint other unit problems
not related to training but which still may affect performance.
The MPS was developed as part of a research program being undertaken for
the Army Research Institute (ARI) in an Army-wide thrust to improve mainte-
nance. Maintenance depends to a great degree on the skills of those repairmen who
perform maintenance tasks. A key component of any maintenance improvement
system is the abity to recognize repairmen's skill deficiencies. A counter to such
deficiencies is to provide remedial training at the unit level. The MPS diagnoses
training deficiencies in a direct quantitative sense, and enables unit trainers to
t recommend actions and resources for eventual approval by unit training managers.
'Xl3rx
.- 4

MPS Obecive
The overall objective governing the MPS is to improve the conduct and
quality of on-the-job training of repairmen on technical tasks in direct support
battalions. A specific objective is to provide training managers with a unit-levelsystem for identifying unit and individual training needs. The MPS thus provides
* specific guidance on what, how, when, and whom to train.
Another important objective is to provide trainers with a system wherebythe accomplishment of training is tracked, noted, and "credited" to each soldier's
* training record.
The current MPS (i.e., the system installed at Ft. Carson in January 1981)evolved from a research approach that included development and installation of aprototype MPS in a Forces Command mechanized infantry division maintenancebattalion. A detailed analysis and review of prototype system operation resulted inrefinement of its diagnostic capabilities.
M UsrSystem users range from the most senior officer in the direct support
battalion, i.e., the battalion commander, to the first-line supervisors in the shop.
Table A lists the primary information needs of each user. Additional informationon personnel involved in the MPS operation and use is contained in the next
chapter.
xii

TABLE A
MPS USER INFORMATION NEEDS BY DUTY POSITION
DUTY POSITION USER INFORMATION NEED
Battalion Commander o Overall shop productivity-battalion-wideo Manpower availability and usageo Skill levels-all MOS'So Status of technical training
Materiel Officer (MATO) o Shop productivity (listed by companies)o Job completion time; time in each repair
statuse Average time per equipment job
Company Commander o Effectiveness of company shopo Manpower availability and usageo Job completion time; time in each repair
statuso Average time per equipment jobo Status of technical training
Shop Officer/Maintenance o Manpower availability and usagePlatoon Leader o Job completion time; time in each repair
statuso Average time per equipment jobo Status of technical training (primarily
Maintenance Platoon Leader)
Automotive Technician -(Specific to auto section)Armament Technician . Manpower availability and usageNCO1C C&E o Job completion time; time in each repair
statusNCO1C Service & Recovery o Average time per equipment job
o Status of technical trainingo Listing of individual's (by MOB) skill levels_ _Training requirements summaries
Individual Repairman o Own skill summary by technical task
-I<I
I--t-- - - -- . - - - -

CHAPTER 1
M7iNTNANCE PERFORMANCE SYSTEM -UCIPTON
This chapter describes the Maintenance Performance System. The MPS is
* described in terms of its computing system component, underlying data sources,
Th P asdsge for use in a diiinlmitnne battalion. Aprootpe ysem asdeveloped adtested ath70hDisonMaintenance
Battalion of the 4th Infantry Division (Mechanized) at Ft. Carson, Colorado.' The
decision was made at the outset to concentrate on the three forward supportcompanies of the unit to simplify control of the developing MPS. Also, since theprototype was primarily an experimental vehicle for testing the concept ofproviding special maintenance management and training data, other companies inthe battalion, such as "B" Company (Heavy Maintenance) and the HQ and LightCompany, were not included. They may be included at some future date prior to
DA implementation of the system on a DS battalion-wide level.
The system was designed to cover members of selected technical MOS's who
perform maintenance on equipment serviced by the forward support companies of
the battalion. An equipment list for each forward support company was developedbased on analysis of the inventory for each customer battalion shown in theBattalion Organizational Property Book "roil-up held by the Divisional MaterielManagement Center (DMMC). The list, which directly identifies equipment models
and indirectly identifies MOS's that perform maintenance, is shown in Table 1-1.
A task list was developed for each item of equipment maintained by eachMOB. The purpose of developing these lHats was to describe precisely what
technical siDls each repairman was expected to possess. The tasks included werethose typically performed by frward support companies in mechanized infantrydivisions. If a task was wot included, it was because the workc wa not done byrepairmen at the forward support level, or the equipment was not in the 4th
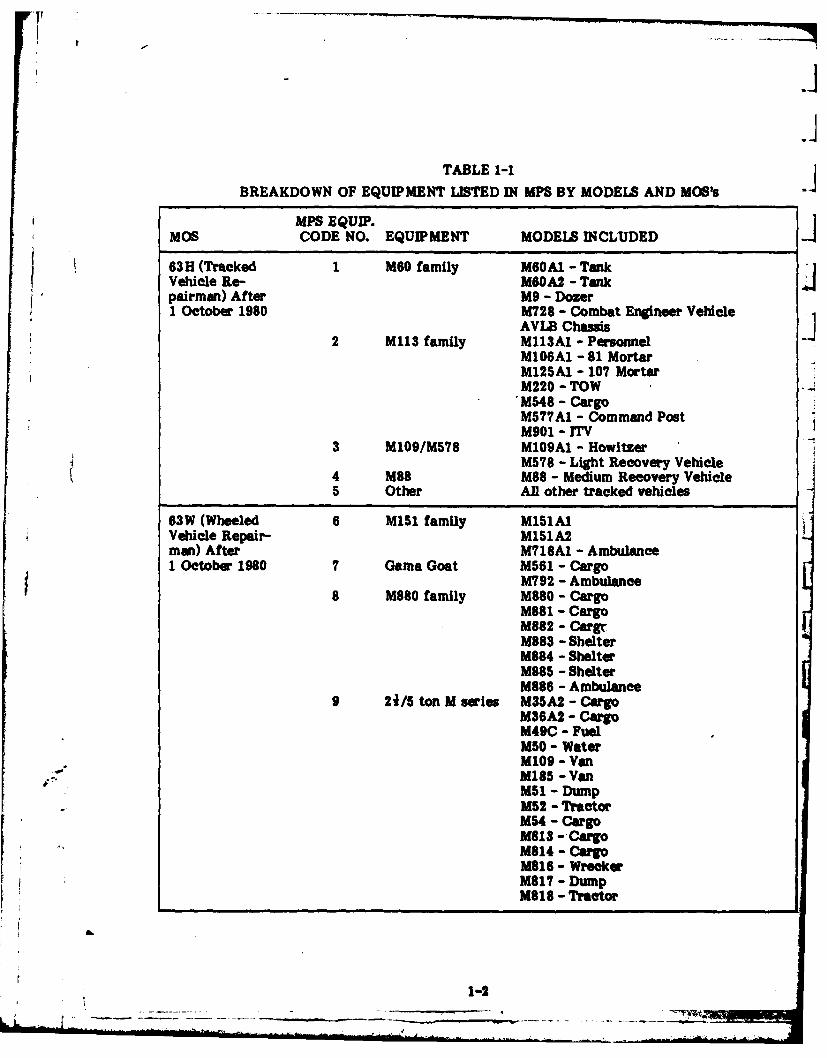
TABLE 1-1
BREAKDOWN OF EQUIPMENT LISTED IN MPS BY MODELS AND MOSs
MPS EQUIP.MOS CODE NO. EQUIPMENT MODELS INCLUDED
63H (Tracked 1 MO family M60A1 - TankVehicle Re- M60A2 - Tankpairman) After M9 - Dozer1 October 1980 M728 - Combat Engineer Vehicle
AVLB Chassis2 M113 family M113A1 - Personnel
M106A1 - 81 MortarM125A1 - 107 MortarM220 - TOW
'M548 - CargoM577A1 - Command PostM901 - iTV
3 M109/M578 M109A1 - HowitzerM578 - Light Recovery Vehicle
4 M88 M88 - Medium Recovery Vehicle5 Other All other tracked vehicles
63W (Wheeled 6 MIS1 family MlSlAlVehicle Repair- M151A2man) After M718A1 - Ambulance1 October 1980 7 Gama Goat M561 - Cargo
M792 - Ambulance8 M880 family M880 - Cargo
M881 - CargoM882 - CargrM883 - ShelterM884 - ShelterM885 - ShelterM886 - Ambulance
9 2/5 ton M series M35A2 - CargoM36A2 - CargoM49C - FuelM50 - WaterM109 - VanM185 -VanM51 - DumpM52 - TractorM54 - CargoM813 -- CargoM814 - CargoM816 - WreckerM817 - DumpM818 - Tractor
LL,.
1-2
I
TABLE 1-1 (Continued)
MPS EQUIP.MOS CODE NO. EQUIPMENT MODELS INCLUDED
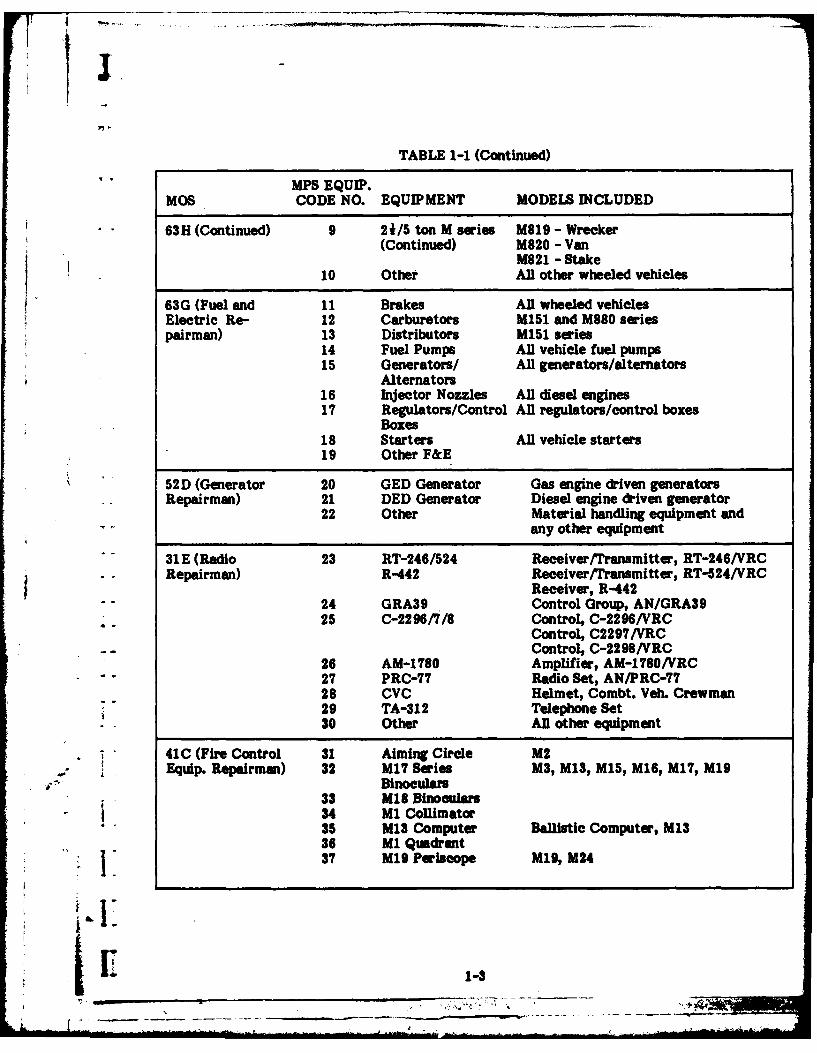
63H (Continued) 9 21/5 ton M series M819 - Wrecker(Continued) M820 - Van
M821 -Stake10 Other All other wheeled vehicles
63G (Fuel and 11 Brakes All wheeled vehiclesElectric Re- 12 Carburetors M151 and M880 seriespairman) 13 Distributors M151 series
14 Fuel Pumps All vehicle fuel pumps15 Generators/ All generators/alternators
Alternators16 Injector Nozzles All diesel engines17 Regulators/Control All regulators/control boxes
Boxes18 Starters All vehicle starters19 Other F&E
52D (Generator 20 GED Generator Gas engine driven generatorsRepairman) 21 DED Generator Diesel engine driven generator
22 Other Material handling equipment andany other equipment
31E (Radio 23 RT-246/524 Receiver/Transmitter, RT-246/VRC* Repairman) R-442 Receiver/Transmitter, RT-524/VRC
Receiver, R-44224 GRA39 Control Group, AN/GRA3925 C-2296/7/8 Control, C-2296/VRC
Control, C2297/VRCControl, C-2298/VRC
26 AM-1780 Amplifier, AM-1780/VRC27 PRC-77 Radio Set, AN/PRC-7728 CVC Helmet, Combt. Veh. Crewman
7 29 TA-312 Telephone Set30 Other All other equipment
41C (Fire Control 31 Aiming Circle M2Equip. Repairman) 32 M17 Series M3, M13, M15, M16, M17, M19
Binoculars33 M18 Binoculars34 M1 Collimator35 M13 Computer Ballistic Computer, M1336 M1 Quadrant37 M19 Periscope M19, M24
Ii: 1-3

TABLE 1-1 (Continued)
MPS EQUIP.MOS CODE NO. EQUIPMENT MODELS INCLUDED
41C (Continued) 38 M32/36 Periscope39 M15 Quadrant M13, M1540 M145 Telescope M145, M146
Mount41 M17 Rangefinder M17, M17A1, M17A242 M53 Sight43 MI05 Telescope44 M118 Telescope45 M117 Telescope46 M10 Ballistic Drive47 Infinity Sight 863546648 Compass M2 and Lensmatic49 Other
45K/45L (Tank 50 M60 Tank family M60A1 - TankTurret Repairman/ M9 - DozerArtillery Re- M728 - Combat Engineer Vehiclepairman) 51 M109A1 Howitzer
52 Other All other armament work
45B (Small Arms 53 M16 RifleRepairman) 54 Cal.45 Pistol, MI911
55 M203 GL Grenade Launcher, M20356 81mm Mortar, 81mm57 107mm Mortar, 107mm58 M60 MG Machinegun, 7.62mm, MO059 M2 MG Machlnegun, cal .50, M260 M85 MG Machinegim, cal .50, M8561 M240 MG Machinegun, 7.62mm, M240, M73, M262 Other All other small arms
44B (Metalworker) Various Oxyacetylene WeldingAre WeldingGlms RepairFuel Tank RepairRadiator Repair
* . Body RepairOther
1-4
- -. 7-- - 4-.

I
Division inventory. The detailed task lists will not be reproduced here since they
are available for reference in Volume 2 of the Guide for individal ta mltrainIng li direct suppoet is, a companion volume to this one.1
The MIPS was designed to operate in the 4th Infantry Division (Mechanized)
as previously noted in this manual. In similarly equipped mechanized infantry
divisions and armored divisions, the system will work generally as described, but
local deviations in equipment inventory will require some modifications to equip-
ment and task lists. These modifications will involve minor programming changesso that algorithms and computations fit the equipments and tasks being tracked.
For example, if the MPS is installed in a division that has M60A3 tanks instead of
M6OA1 tanks (which are currently covered by the MPS), tasks In turret mainte-nance will differ, thus task lists would require modification to conform to M60A3
requirements.
But if the "new" division has a radically different equipment suit, repairmen
MOS's, maintenance mission and resources, such as in the 101st Airborne Division,
then a detailed analysis would have to be conducted and existing MPS programs
modified.
COMPONE S OF THE BYST M
- -The system comprises three major components: information on maintenance
- performance, a computing system to handle the information, and personnel asoperators and users of the system. Each of these is covered separately In the
paragraphs that follow.
- Bling Maintaum Informatio. An Important concept behind MPS
" * structure is that it is based on use of information already available from various
DA forms used in the shopq as prescribed by TAMMS (The Army Maintenance
Management System, TM 38-750).
1 lmpson, IL K., & Fuller, L G. Guide for flivdndml tedmll trning In drect
s-u- ortu =11. Volume 2. Tr'alog refierence, fmuatiam Santa Barbara,. California: Anacapa Sciences, Inc., December 1960.
' 1-6

V
MPS structure and information flow are illustrated in Figure 1-1. Note the
continuous and repetitive cycles of events shown in the figure. Simple
maintenance management information originates from the "maintenance job" box.
These jobs create maintenance records and assessments which form the "raw" data
for MPS processing. Data processing generates performance data which is
summarized in easily understood formats for maintenance management.But note also that the performance data may be further refined to result in
diagnoses of maintenance problem areas. One key area is "training problems." The
algorithms for "fine-tuning the training problem area will produce recommended
remedial measures and resource listings for training solutions. These are presented
to maintenance management for consideration and action.
MPS Comiputiug ubsystem. The MPS generates many millions of data points
in a short period of time. Since it was time-consuming, impractical, and not cost-effective to compute these manually, MPS research and development centered
around the IBM 5120 computing system on an experimental basis. This system was
chosen because this computer (or one with similar characteristis) is scheduled to
be part of the Training Management and Control System (TMACS) implementation.
TMACS will also, be used for local scoring of Skin Qualification Tests (SQrs). The
notion here is that the MPS will eventually operate on TMACS hardware at brigade
or division level on a mutually arranged time-sharing basis.
The IBM 5120 computing system used in the MPS includes the 5110 Model 3
Computer and an IBM Model 5103 Printer (see Figure 1-2). Although not easily
portable, these units are small enough to fit on a six-foot by three-foot table,
which represents virtually all the operating space required for the system. (Other
requirements are, of course, an operator's chair and filing cabinet.)
The IBM 5120 system characteristics include a 64K internal memory and anexternal diskette capacity of 2.4 megabytes. The computer has a 9-inch diagonal
screen and uses a typewriter-like keyboard which Includes a 10-key numeric pad.
The printer will operate at 120 characters per second.
1-6

L5
IC IU
7 20 ~ ~ X
I. zj V £W~MW/ 03
40C!1-?_

5110 Model 3 computer
5103 prhnteI.I
Figure 1-2. Compnents of the BM 5120 computing system.
a.
1-4
9 ~~~~~~~~ ~ ~ ... -... .. .- ........~ ....-. --.- - .--- .-- .

a'
The MPS program required for concept testing and output is written in the
BASIC programming anguagv. The program and data for each company re stored
on IBM 2D diskettes (see Figure 1-3). The diskettes used in the prototype UdPS
Shave a record length of 5l2 bytes per setor.
The system does not require special wiring and will operate from 115 volt,
15 amp. power supply. The IBM Corporation provides specific and detailed
instructions on site preparation and system set-up, as described in references 2
and 3.
(Diwtte with
Protective
IBM
- Figure 1-3. Data diskette for IBM 5120 computing system.
.
23 5123 pexti o system gemsal Waferma tlm site pmieratim emmiGA34-0130, Boca Raton, Florida: IBM Corporation, 1970.
3 3 129 wqpfflW system ut-Wp eo M SA34-0131-1, Boca Raton, Florida:JIBM Corporation, 1980.
'Ii -
0 o i1-0l
,,-. -.....- --. . . .. . .... ... . . .... ... .. ..

The MPS contains 22 data files uing approximately 0.5 megabytes of disk
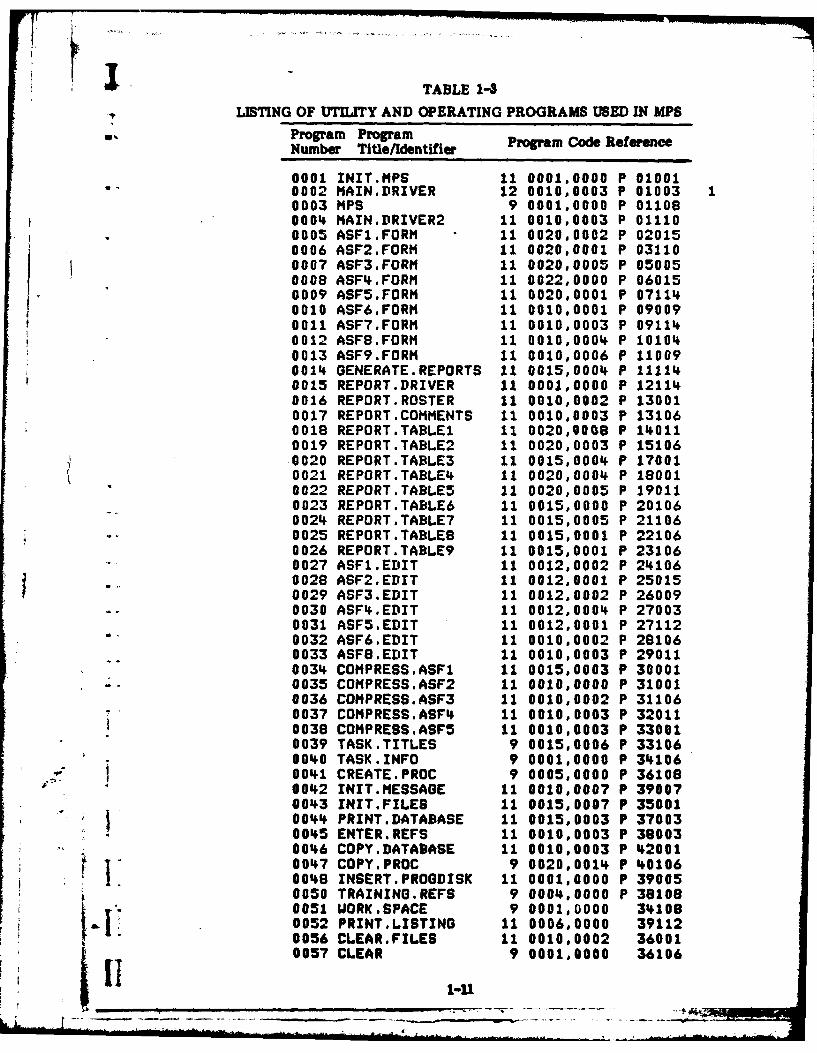
storage. These are listed in Table 1-2. There are 54 programs, with the programm-ze varying from about 7K of disk storage for the smallest to approximately 22K
for the largest. These programs include operating programs and a few program -.
development utilities, as listed in Table 1-3.
I.!
TABLE 1-2
DATA FILES USED IN MPS
Fil File Title/dentifier Program Code ReferenceNo.
0001 ASFI.ACTIVE 9 0061,0063 P 010010002 ASF2.ACTIVE 9 0090,0088 P 050090003 ASF3.ACTIVE 9 0040,0039 P 110090004 ROSTER 9 0015,0013 P 13114-0005 ASFS.ACTIVE 9 0016,0015 P 14114-0006 ASF7.ACTIVE 9 0001,0000 P 160010007 ASFM.ACTIVE 9 0015,0000 P 160030008 ASF9.ACTIVE 9 0001,0000 P 170030009 ASF1.PROCESS 9 0050,0003 P 170050010 ASF2.PROCESS 9 0010,0000 P 200150011 ASF3.PROCESS 9 0003,0000 P 210050012 ASF1.CUMULAT 9 0004,0001 P 210110013 ASF2.CUUMOS 9 0001,0000 P -:11040014 ASF2.CUMTASK 9 0010,0007 P 211060015 ASF3.CUMULAT 9 0001,0000 P 220110016 GENERAL.INFO 9 0002,0000 P 220130017 ASF4.PROCESS 9 0001,0000 P 221020018 ASFB.FILEINFO 9 0001,0000 P 221040019 SCRATCH.FILE 0 0050, 221060020 COPY.PROC 9 0012,0006 260010021 COPY.PROC1 9 0012,0006 261100022 INSERT.PROGDISK 11 0001,0000 27104
I
- TABLE 14LISTING OF UTILITY AND OPERATING PROGRAMS USED IN UPS
Program ProgramNumber Title/Identifiero d Reeec
0001 INIT.MPS 11 0001,0000 P 010010002 MAIN.DRIVER 12 0010,0003 P 010030003 MPS 9 0001,0000 P 011080004 MAIN.DRIVER2 11 0010,0003 P 01110
* 0005 ASF1.FORM 11 0020,0002 P 020150006 ASF2.FORM 11 0020,0001 P 031100007 ASF3.FORM 11 0020,0005 P 050050008 ASF4.FORM 11 0022,0000 P 060150009 ASFS.FORM 11 0020.0001 P 071140010 ASF6,FORM 11 0010.0001 P 090090011 ASF7.FORM 11 0010,0003 P 091140012 ASF8.FORH 11 0010,0004 P 101040013 ASF9.FORM 11 0010,0006 P 110090014 GENERATE.REPORTS 11 0015,0004 P 111140015 REPORT.DRIVER 11 0001,0000 P 121140016 REPORT.RDSTER 11 0010,0002 P 130010017 REPORT.COMMENTS 11 0010,0003 P 131060018 REPORT.TABLE1 11 0020,9048 P 140110019 REPORT.TABLE2 11 0020,0003 P 15106-0020 REPORT.TABLE3 11 0015,0004 P 170010021 REPORT.TABLE4 11 0020,0004 P 180010022 REPORT.TABLE5 11 0020,0005 P 190110023 REPORT.TABLE6 11 0015,0000 P 201060024 REPORT.TABLE7 11 0015,0005 P 21106
-+ 0025 REPORT.TABLE9 11 0015,0001 P 221060026 REPORT.TABLE9 11 0015,0001 P 231060027 ASF1.EDIT 11 0012,0002 P 241060028 ASF2.EDIT 11 0012,0001 P 25015
f 0029 ASF3.EDIT 11 0012,0002 P 260090030 ASF4,EDIT 11 0012,0004 P 270030031 ASF5.EDIT 11 0012,0001 P 271120032 ASF6.EDIT 11 0010,0002 P 281060033 ASFB.EDIT 11 0010,0003 P 29011003 COMPRESS.ASF1 11 0015,0003 P 300010035 COMPRESS.ASF2 11 0010,0000 P 310010036 COMPRESS.ASF3 11 0010,0002 P 31106
* 0037 COMPRESS.ASF4 11 0010,0003 P 320110038 COMPRESS.ASF5 11 0010,0003 P 330010039 TASK.TITLES 9 0015,0006 P 33106
* 0040 TASK.INFO 9 0001,0000 P 341060041 CREATE.PROC 9 0005,0000 P 36108100 2 INIT.MESSAGE 11 0010,0007 P 39007
0043 INIT.FILES 11 0015,0007 P 35001004 PRINT.DATABASE 11 0015,0003 P 370030045 ENTER.REFS 11 0010,0003 P 380030046 COPY.DATABASE 11 0010,0003 P 42001
" 0047 COPY.PROC 9 0020,001 P 401060048 INSERT.PROGDISK 11 0001,0000 P 390050050 TRAINING.REFS 9 0004,0000 P 381080051 ORK.SPACE 9 0001,0000 34108
! 0052 PRINTLISTING 11 0006,0000 391120056 CLEAR.FILES 11 0010,0002 360010057 CLEAR 9 0001,0000 36106
+L . . j ii .. .. . .... . -- ... . . - +-

A unique feature incorporated in the design of the IBM 5120 system is that
the master program diskette and the data diskettes for each company must be
inserted into the computer each time it is used-and removed when work is -
finished. This has several benefits: security of the programs and data are
guaranteed-tampering, sabotage, and damage to the programs and data are almost
impossible; the same diskette is used month after month as the MPS data baseexpands and a historical file is built. New data are added to the disk in each new
time period.
This data "portability" feature is especially important since the ultimate
MPS will be operated on a time-sharing basis on the divisional or brigade mini-
computer with other unrelated users.
Personnel. The other major component of the MPS is, of course, the
personnel who will wse and rum the system. These personnel range in duty position
from battalion commander to individual repairman.
The Battalion Commander has general responsibility for efficient
management of maintenance in all shops and for the continued training of
repairmen to conduct repairs, and to pass SQT's and contribute to passing ARTEP's.
Appropriate summary data from the MPS will be provided to aid him in his
decision-making in these two areas.
The Materiel Officer (MATO) has an overall interest in shop management
and skill level of repairmen, but does not generally take direct personal action to
effect changes in shop procedures.
The Company Commander has a direct responsibility for shop operations and
staff training and will be able to make wse of MPS data to highlight specific
deficiencies in his operation.
The SMOP OfficrMlamue Platoon Leader, Mmntnane Tghdmens,
and NCO%. I charge of sections have responsibilities for shop operations designated
by the senior officers in the company. It is unlikely they will initiate training
changes without specific authorization or direction from senior personnel. MPS
information will, however, be provided to msist them in day-to-day management
and supervision.
1-12

The individin1 rpiran, under present conditions, is not provided feedbackon his performance in any systematic fashion. The MPS will provide data that willbe useful to the repairman in indicating whether his deficiencies lie in lack ofexperience or in needed training. It will also provide quantitative data showingwhen he has reached a required level of performance.
1-13

CHAPTEKR 2
MPS OPERATION
The MPS follows a well-defined cycle involving collection of selected
maintenance performance information from shop records, entry of the informationinto the computer, integration and computation of the "new" data via the operatingprograms described in Chapter 1, production of reports in various categories, and
dissemination of the reports to selected users. Each component of the cycle is
described in detail below.
MPS PERFORMANCE DATA COLLECTION PROCEDURES
The MPS operator is assumed to have overall responsibility for collecting
data and processing it through the MPS. (The MP Operator's Mmml contains
comprehensive instructions and explanations of data collection procedures.4)
Consequently, the present discussion of MPS data collection procedures will
provide general background information on key points of data collection ratherthan specific direction.
* - The complexity and amount of data in MPS sueest that, # eiaist should
be trained in all aspects of running the system. 'tis task cannot be efficientlyperformed by unskilled personnel. Unique skills need to be developed for collecting
and editing MPS data. The data will be recorded on a series of specially designedforms which were designed to ease the task of transferring maintenance perfor-
mance data from existing DA forms into a computer-compatible data entry format.
Computer entry may thus be made directly from the MPS collection forms without
additional work.
The data collection forms and their purpose are described in summary form
in the paragraphs which follow. Actual examples of the forms are contained InAppendix A of Volume 2 of this manual.
4Fuller, R. G. Devedp~mt of a -malutmeeW pefo aee temftr a tm .Joa MPS opmator'm naL Santa Barbara, California: Anacapa Sciences, Inc.,December 1980.
i"2 :1
2-
- .----
'I
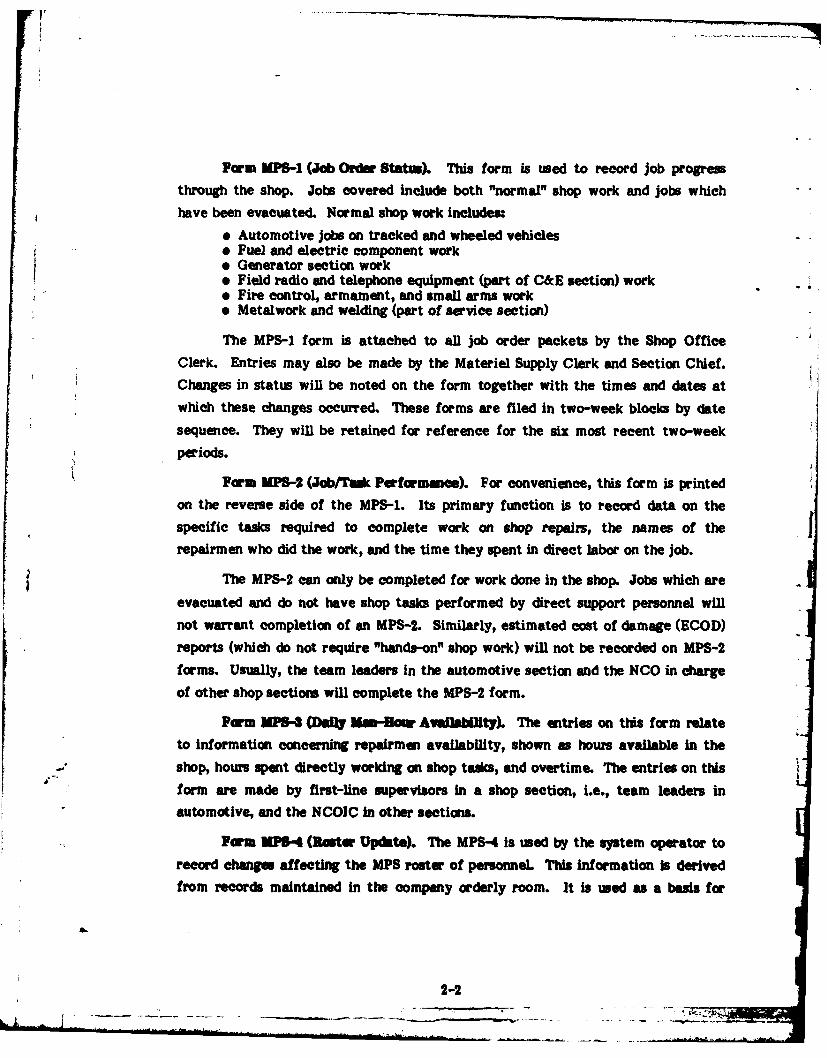
Form MSM-i (Job Order Statm). This form is used to record job progressthrough the shop. Jobs covered include both "normal" shop work and jobs which
have been evacuated. Normal shop work includes:
* Automotive jobs on tracked and wheeled vehiclese Fuel and electric component work• Generator section work9 Field radio and telephone equipment (part of C&E section) work* Fire control, armament, and small arms work9 Metalwork and welding (part of service section)
The MPS-1 form is attached to all job order packets by the Shop Office
Clerk. Entries may also be made by the Materiel Supply Clerk and Section Chief.Changes in status will be noted on the form together with the times and dates atwhich these changes occurred. These forms are filed in two-week blocks by date
sequence. They will be retained for reference for the six most recent two-week
periods.
Form MPS-2 (Job/Tak Performance). For convenience, this form is printed
on the reverse side of the MPS-1. Its primary function is to record data on the
specific tasks required to complete work on shop repairs, the names of therepairmen who did the work, and the time they spent in direct labor on the job.
! The MPS-2 can only be completed for work done in the shop. Jobs which are
evacuated and do not have shop tasks performed by direct support personnel will
not warrant completion of an MPS-2. Similarly, estimated cost of damage (ECOD)reports (which do not require "hands-on" shop work) will not be recorded on MPS-2
forms. Usually, the team leaders in the automotive section and the NCO in charge
of other shop sections will complete the MPS-2 form.
Form MPS-3 (Dil Ma-Bow Awlmiity). The entries on this form relate
to information concerning repairmen availability, shown as hours available in theshop, hours spent directly working on shop tasks, and overtime. The entries on this
form are made by first-line supervisors in a shop section, i.e., team leaders in
automotive, and the NCOIC in other sections.
Farm MPS-4 (Rast. Update). The MPS-4 is used by the system operator to
record changes affecting the MPS roster of personnel. This information is derivedfrom records maintained in the company orderly room. It is used as a basis for
2-2
- - -- . .....---.- ,- .--
I,
determining which persons have been newly assigned to (or detached from) those
duty positions covered by the MPS. This form provides the basis for those records
maintained in the computer to compute man-hours for later inclusion in manage-
ment reports. Once these data are entered in the computer, the form is discarded.
Form MP- (Traininu/Pfrnm e Dem utrtlom) The MPS-5 is used to
record technical training provided to repairmen to help them master technical
tasks. The MPS-5 is also used to record the demonstration of competence on a
technical task. The concept of this form is similar to that of a soldier's Job Book.
The form is completed each time a repairman receives technical training or
demonstrates performance. The form is primarily used by those designated as
trainers. It is discussed in detail in the Guide for individeal teeael training indirect ipLort unis (see Reference 1). The data are recorded by the person
providing the training (i.e., the instructor), or the person with authority and
expertise to accept a performance demonstration as satisfactory (e4g., a W.O.
Technician).
These forms are filed by Julian date sequence in six-week blocks.
Form MPS-6 (Tik Exprience History) This form is wed to record the
experience a repairman has had performing tasks listed in the MPS. It spans the
period from when he graduated from AlT to the time his name is entered in the
MPS.
When the MPS is implemented in a unit, all personnel assigned will fill out
an MPS-6 form for their particular MOS. After the initial implementation,
* personnel who are subsequently assigned to the unit must complete an MPS-6 for
later entry into the system. MPS-6 entries can only be made by individual
repairmen since the Army does not typically maintain records of repairmen's work
or training experience.
Form MP84' (fteel Priority Flog). This form is used to record specialtraining priorities that must be added to, or deleted from, the computer-generated
training requirements list. Training managers and trainers in the unit are
responsible for designating these special priorities. A detailed explanation of these
priorities and the rationale behind their application is contained in the Gidde for
-l
2-31
"
iadividml teIlmie training in dbvet port mal t (see Reference 1). The MPS-7
will be completed by the operator from instructions provided by the company
commander, in his role as training manager. Use of this form provides flexibility
not usually obtainable in a computer-driven system. Its effect is to provide a
manual override on computer-generated training requirement priorities.
Form MPS-4(IterQ atatm Cbmments). This form is used to record
narrative information for display on the MPS Interpretation Comments report.
This information may be referred to by system users for aid in report interpreta-
tion. It is important that managers should be aware of special conditions that may
influence interpretation of the reports. Examples of such conditions are unit field
training, adverse weather conditions, special tests, and FOPSCOM-designated
priorities such as IG inspections.
The information is provided by senior battalion and company personnel and
recorded by the MPS system operator.
Form UPS-S (Training Requirement Priority Thresaaad. The priority of
each training requirement is computed as a function of generating MPS Table 9 for
each MOS (Training Requirements Summary). Priorities range from 1 to 7, where 1
is highest priority and 7 is lowest. Priorities are calculated through an equation
which considers number of people needing training, and the group average skill
level on the technical task that underlies the training requirement. The MPS-9
form can be used to control the number of training requirements listed on MPS
Table 9. The computer algorithm will only permit tasks with priorities equal to or
higher than a set threshold to be listed on Table 9. Thus, the higher the threshold
is set, the fewer training requirements will be listed. Reference 1 describes the
concept of the threshold in greater detail.
Training managers and trainers make threshold assignments by informing the
MPS operator where they should be set. The MPS Operator in turn enters the
threshold level into the computer.
Summery of MPS Form Data Entry -anxdbllite, Table 2-1 summarizes
the contribution of maintenance personnel to each MPS form discussed above.
Note that although the MPS operator is involved with all nine forms, he is solely
responsible for entries on the MPS-4 and MPS-8.
a.
2-4
..

fT
TABLE 2-1CONTRIBUTIONS OF MAINTENANCE PERSONNEL TO MPS FORMS
Shop MaterielNIPS Office Supply Section Team Training Repair- lIPSForm Clerk Clerk Chief Leader Manager Trainer man Operator
2 X X
3 X X
4 X
5 X X
6 X
7 X X
8 X
9 X X
I ~ Data Computation
The computation of the data reflecting maintenance job performance and itstransformation into usable reports is a function of the specially developed programdescribed previously in Chapter 1 under components of the system. The printedlisting of this program represents a total of some 450 pages of program instruc-tions. Each program and subroutine listed in Tables 1-2 and 1-3 include not onlythe algorithms used to transform the data from the "raw" form in which it wascollected into usable reports, but also provide: the instructions for data entry;
- "prompts" for the system operator; formatting of the reports; a series of errorwarnings to alert the operators for incorrect entries of data;, and signals ofmalfunctions of the 5120.
- The programs also include a facility for editing, i.e., correction, of the data-. base, and a facility for compression of the data base as accumulated information*grows. If this data base compression routine were not invoked, the stored
40 2-5

information would proliferate beyond the capacity of the system. The compression
routines developed include a "roll-over" routine whereby data beyond a certain
period will be summarized and the total display "rolled-over" by one period. Thus,the oldest line on the report will disappear and a new line will appear at the bottom
of the display. The totals from the data summary on the report will be used for
-i averaging and trend development. The need to store individual entries from MPSforms in their original format for an indefinite period is thus eliminated.
The finished program will be documented in detail to permit its maintenance
or modification by other programmers. The documentation elements will includecomment/remark lines, file descriptions, and function definitions. The documenta-
tion will take the form of a printout of the program listing and an accompanying
program manual containing explanatory comments.
The MPS design is based on use of two separate diskettes. All programs are
modular. The operating program will use drive 1 of the IBM 5120 Computing
System. Field data will be kept on a separate diskette used on drive 2 of the IBM
5120. This procedure will be followed throughout system operation. The system is
designed to handle data for up to four different companies within a battalion. The
same operating program will be used for all companies by substituting different
field data base diskettes in drive 2. Each company-specific data diskette will be
clearly identified to reduce the possibility of inputs being entered into the wrong
data base. An additional safeguard in the program design is that an error message
will appear on the screen if the company-specific reference in the operating
program and data disk do not match.
The MPS is designed so that computation can be made for entries keyed to
the Julian calendar whereby each date is represented by a four-digit number. The
system has a capability of accepting data for the 10 years commencing in 1980 and
ending in 1989. After 1989 the data generation subroutines will require minor
modification to handle the next decade. (A subroutine translates Julian dates to
Gregorian dates when generating report headers.)
2-6

The data input programs may be selected from a main "menu." The
subsequent entry of data using these programs is error-checked for range, type(numeral vs alpha character), and completeness. For example, if a date time group
(DTG) entry requires eight digits and the operator enters nine or seven digits, an
error message will appear and permit entry correction. The operator will also be
able to edit earlier form entries before proceeding to the next form in the series.
The algorithms used to generate summary reports are included and discussed
in detail in Appendix A. These algorithms are included as a reference source to aid
interested MPS users in understanding how the MPS computes times, quantities,
and training requirements from the raw data.
The MPS Operator
The MPS is capable of being operated by a specialist who has received
unique training in running the system. Operator characteristics include somedegree of skill in typing and understanding of maintenance procedures. Back-
ground in computer operation is not necessary.
A one-week training course was conducted for the system operator prior to
assignment for on-site operation of the system. The training course consisted of:j background review of the MPS, "hands-on" practice in operating the IBM 5120
computing system, a detailed description of data collection requirements, practice
in collecting data from maintenance reporting documents generated in forward
support shop offices, and diagnosis and correction of data entry errors.
The operator's duties and details of specific components of MPS operation
are described in the Operator's Manual (see Reference 4).
The system operator does bear strong responsibility for collecting data from
up to three forward support companies. He will be responsible for correcting such
-* I deficiencies or inaccuracies as may occur in data supplied by shop personnel-evg.,information connected with direct man-hours expended on job tasks. Also, because
of work pressures, team leaders and section chiefs may occasionally postpone
relevant entries on MPS forms, thus increasing the possibility of error. The MPS
operator will be responsible for reducing the amount of error caused by improper or
2-7
untimely data recording. Operating procedures will require that he set up a
schedule for coUeeting information from the various technical sections within the
forward support companies on a routine and structured basis. He will also bereq uired to develop a schedule that wiln permit hi1m to enter data into the IBM 5120or equivalent computer. This will become particularly important when the MPS is
transferred to the TMACS mini-computer at division or brigade HQ and computer
time will only be available on a shared basis.
A formal schedule for recording senior officers' comments, and require-
ments for priority training listings, will be required. However, although the MPS
operator has a key responsibility for successful system operation, the primary
responsibility and oversight of the MPS must devolve on those senior officers
concerned with maintenance training and management. It may be appropriate to
allot responsibility for training components of the MPS to the battalion S3, and for
management components of the MPS to the MATO.
2-6
L_ 1 -
CHAPTER 3
MPS OUTPUT
The rationale underlying the MPS is that it will improve the performance ofmaintenance by providing training at the unit level for maintenance personnel, and
that shop management will improve by having acces to management information
not previously available. The MPS reports serve as the vehicle to provide
information necessary to accomplish these objectives. This chapter reviews MPS
reports, formats, and report distribution . A complete set of examples of all 58
reports is contained as Appendix B of Volume 2 of this manual. The reader will
benefit by having the examples on hand while reading this chapter.
OUTPUT FORMAT
The reports are printed on 9.5 inch width tractor feed printer paper suitable
for use in the IBM Printer 5103 or equivalent machine. The actual display width is
* 8.5 inche. The display area is limited to a maximum width of 7.5 inches and a
length of 9 inches on the sheet All reports have a similar format. Since there
generally will be only one copy of each report produced on the printer, xerox-type
reproduction is simplified by standardizing the format.
To msist report identification, all header, content, and distribution informa-
tion begin at the left margin.
The header contains the following information:
- -. Company and battalion. Table #, title, and date (Julian and Gregorian)
The information display (content) always begins 2-3/4 inches below the top of the
first page of each report. If the report continues to a second page, the header isnot repeated although identifier information is printed at the top of the second
page. Left and right margins are nominally 1 inch in width to provide binding and
notation space.
3-

REPORT CONTENT
For ease of interpretation, the MOS's covered by the MPS were grouped into
the five categories shown below. These five technical categories correspond to the
technical sections in forward support company shops. They are summarized in
Table 3-1.
TABLE 3-1
MOS's IN MPS GROUPED BY TECHNICAL CATEGORY
Technical Category MOB'S Included
Automotive 63G, 63H, 63W
Generator 52D
Armament 41C, 45B, 45K, 45L
Communications & Electronics (C&E) 31E
Service & Recovery (S&R) 44B
To make full use of each sheet, some MPS reports show information for
more than one MOS on the same sheet. When this was necessary, the reporting
combinations were selected from the same technical category wherever possible.
The designators for the MOB, i.e., 31E, 45K, etc., form a logical ascending
numerical sequence. In general, the report columns were formatted so that this
sequence was followed from left column to right.
The MPS reports include nine different generic categories of tables. Eight
of these nine table groups have formats that are repeated in slightly differing
versions for each MOS, to display MOS-specific data. To emphasize the similari-
ties within generic table groups, all table variants in a table group are assigned the
same number, but are identified as being unique by including the relevant MOS
code listed parenthetically after the table number in the header. The nine generic
groups of tables (reports) are further broken down into 58 separate reports, which
include a set of Interpretation Comments and a Repairmen Roster, in addition to
the tables themselves. The titles of the reports included in the MPS are listed inTable 3-2, with the number of variants given for each.
3-2

TABLE 3-2MPS TABLE NUMBER BY GENERIC GROUPS AND NUMBER OF VARIANT"
MPS TABLE TITLE VARIANTSNUMBER
-Roster 1
-Interpretation Comments 1Table 1 Man-hour availability and use 9Table 2 Average direct man-hours per job 5Table 3 Average direct mnan-hours per job byr 9
equipment and taskcTable 4 Average job throughput time in dlays 5Table 5 Average clays spent in each job status 5Table 6 Skill and growth indexes 4Table 7 Skill development summary 1Table 8 Individual skill history 9Table 9 Training requirements summary 9
TOTAL 58
Although the information in the MPS is interlocked and integrated to a highdegree, the reports may still be categorized under headings of maintenance
management, and training information. Thus, Tables one through five containmaintenance management information reflecting various aspects of maintenance
efficiency, effectiveness, and personnel availability. Tables six through nine* contain information reflecting various aspects of skill, training, and training
7 management.
The roster is not distributed but is maintained by MPS operators as a "house -
keeping" component of the MPS. The roster i provided only to the company office
for use in tracking newly assigned personnel and recent departures.The interpretation comments are given in a separate report. They are
provided so that recipients are aware of loal conditions or requirements thatshould be considered during report interpretation.
1' 3-3

.1
DWFRIUTION
Each report has been allotted a umique reference number from 1 through 58
(always located at the bottom left of each sheet). This number is primarily for the
system operator's use in collating tables into sets for distribution to users. Each
user has been given a unique code numier. Table 3-3 below shows the code number
of the 11 "users" of MPS information. -;
TABLE 3-3
USERS' CODE NUMBERS
DISTRIBUTION CODENUMBER USERS
1 Battalion Commander
2 MATO
3 Company Commander
4 Shop Officer
5 Maintenance Platoon Leader
6 Automotive Maintenance Technician
7 Armament Technician
8 Communications and Electronics NCOIC
9 Service and Recovery NCOIC
10 Company Office
11 Individual Repairmen (listed by name)
The frequency of production of the reports varies according to content and
user. For example, the 9intm e e re t (Tables one through five)
are generated every two weeks and distributed to commanders, maintenance
managers, and senior supervisors. The dfl/d aimg re l (Tables six throughnine) are generated every six weekB and distributed to training managers and
trainers. The reason for the longer inteNwal between distributions of dill training
reports is because the effect of training on individuals is not so apparent in short
time periods of one or two weeks duration.
3-4-m - -- - - - _
I1
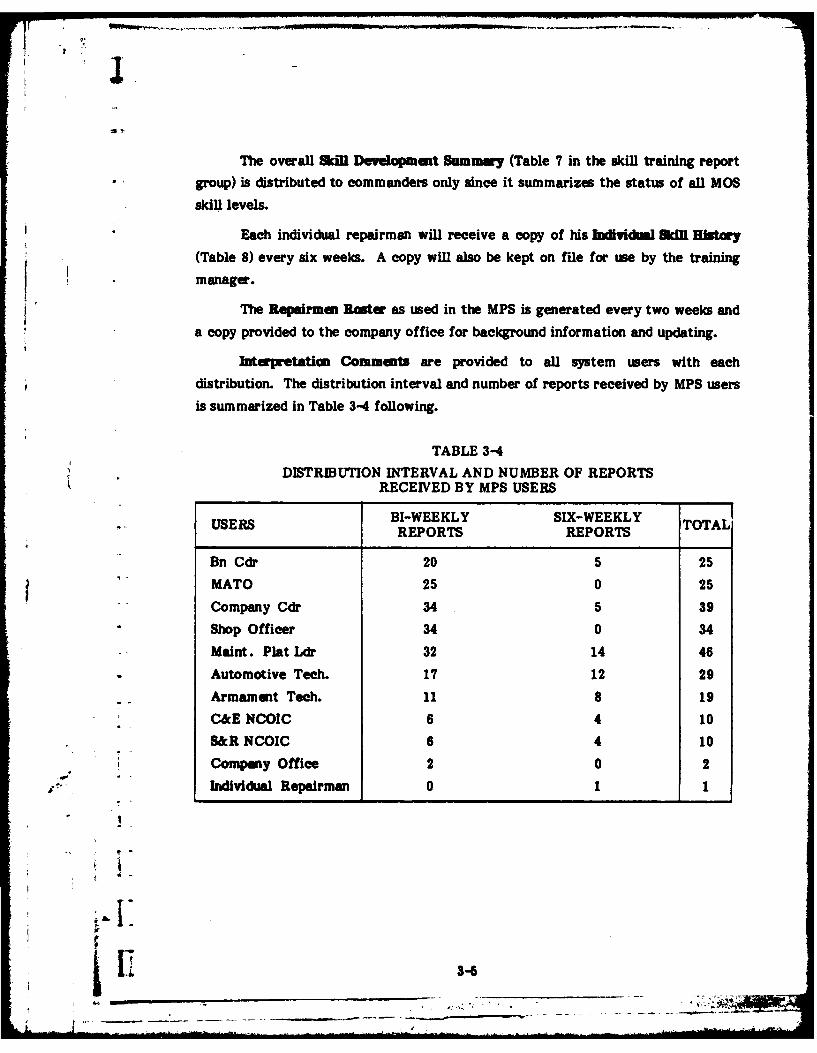
The overall acM Development Summary (Table 7 in the skill training report
group) is distributed to commanders only since it summarizes the status of all MOS
skill levels.
Each individual repairman will receive a copy of his Individaml dl History
(Table 8) every six weeks. A copy will also be kept on file for use by the training
manager.
The Repairman Raster as used in the MPS is generated every two weeks and
a copy provided to the company office for background information and updating.
Interpretation Comments are provided to all system users with each
distribution. The distribution interval and number of reports received by MPS users
is summarized in Table 3-4 following.
TABLE 3-4
DISTRIBUTION INTERVAL AND NUMBER OF REPORTSRECEIVED BY MPS USERS
BI-WEEKLY SIX-WEEKLYUSERS TOTALREPORTS REPORTS
Bn Cdr 20 5 25
MATO 25 0 25
Company Cdr 34 5 39
Shop Officer 34 0 34
Maint. Plat Ldr 32 14 46
Automotive Tech. 17 12 29
Armament Tech. 11 8 19
C&E NCOIC 6 4 10
S&R NCOIC 6 4 10
Company Office 2 0 2
Individual Repairman 0 1 1
3-6
-o 1 2

Note that the three user groups who receive the most reports are Company
Commanders, Shop Officers, and Maintenance Platoon Leaders. This is to beexpected since the MPS has throughout its development been focused on pr~ovidingunit-level training and management information to unit supervisors as the basis foractions which will improve maintenance effectiveness.
3-6t

CHAPTER 4
INTERPRETATION OF UPS REPORTS
The focus of this chapter is on interpretation of those MPS reports designedto reflect maintenance conditions and training needs in a DS unit forward supportcompany. Even though summarized and unique information will. be provided in
these reports, it is recognized that the complexity of DS shop maintenance in achanging environment makes it difficult to always isolate specific causes forchanges in routine measures of productivity.
This chapter will therefore discuss options in interpreting MPS outputreports and provide explanatory examples where appropriate. Since constantreference will be made throughout the discussion to report tables identified bydistribution code numbers, the reader will benefit by having Appendix B of Volume2 of this manual readily available.
The reader is reminded that the purpose of this chapter is primarily to helpthe user's understanding of MPS outputs. The examples and procedures provided
are illustrative only and should not be considered as operational doctrine orrepresentative of real-life maintenance conditions.
A separate description of interpretation options will be contained in the
Interpretation Bookdet5 produced bs the fourth document in the MaintenancePerformance System publication series. The Interpretation Guide will be a "hippocket" summary of interpretation information.
RATIONALE GOVERNING MANAGEMENT REPOR78
Maintenance managers are primarily concerned with the effectiveness of- maintenance performance. Maintenance effeetivuem overall is a function of
three variables-efficiency, quality, and productivity.
5 Harper, W. R. Development of a maintaiuaoe performsao system formaintuennee jobs: itertto booklet. Santa Barbara, California: AnacapaSciences, Inc., January 1981.
4-1

Maintenance efflaien-y is reflected by use and application of remources such
as personnel, tools, facilities, and repair parts. Efficiency also relates to the rateat which work can be performed. If resources are used well, maintenance
efficiency will increase. If resources are misused or wasted, efficiency will drop.
Maintenance quality relates to how well work is done and the results of the
work. Maintenance work in the Army (or any large organization) requires followingproper maintenance procedures, using correct materials and tools, and working toappropriate standards for the task. Acceptable results of maintenance tasks
depend on accuracy and completeness of work. If an equipment fault is notcorrected or only partially corrected, work quality is deficient. In a direct support
maintenance operation, quality level is closely related to inspection level, i.e., poor
quality of finished work suggests inadequate inspection procedures.
Produtivity is a measure of the amount of maintenance work done, eg., thenumber of jobs completed during a particular time interval. Productivity does notmeasure efficiency or quality. One can have a high level of productivity and a
correspondingly high level of rejects because of faulty performance. The ideal
target for maintenance managers is to aim for a high level of productivity and a
low level of rejects or rework.
All of these together reflect maintenance effeetiveuem. An effective
maintenance operation, then, is one that is productive, efficient, and that produces
work to an accepted criterion of quality.
The management reports discussed below are included in MPS Tables 1-5.
They are:
" Table 1 - Man-hour Availability and Use
" Table 2 - Average Direct Man-hours per Job
" Table 3 - Average Direct Man-hours per Job by Equipment and Task
* Table 4 -Average Job Completion Time in Days
" Table 5- Average Days Spent in Each Job Status (for specific technicalarea jobs)
4-1
1]4-2

rI
To avoid redundancy, only one example of each table is described in detail in this
chapter to clarify interpretation options. Each table cited is identified by both its
MPS table number and by its unique reference number in the 1-58 number series
contained in Appendix B of Volume 2.
REPOrt NTrE REKATION
Discussion of each report will include:
• Brief description of purposes and components (column headings)
* Source(s) of information from which the output report win be derived
s Computation, integration, and formatting of the report
o Interpretation options and actions
Man-Hour Availhbility and Use-Table 1, ReL 4
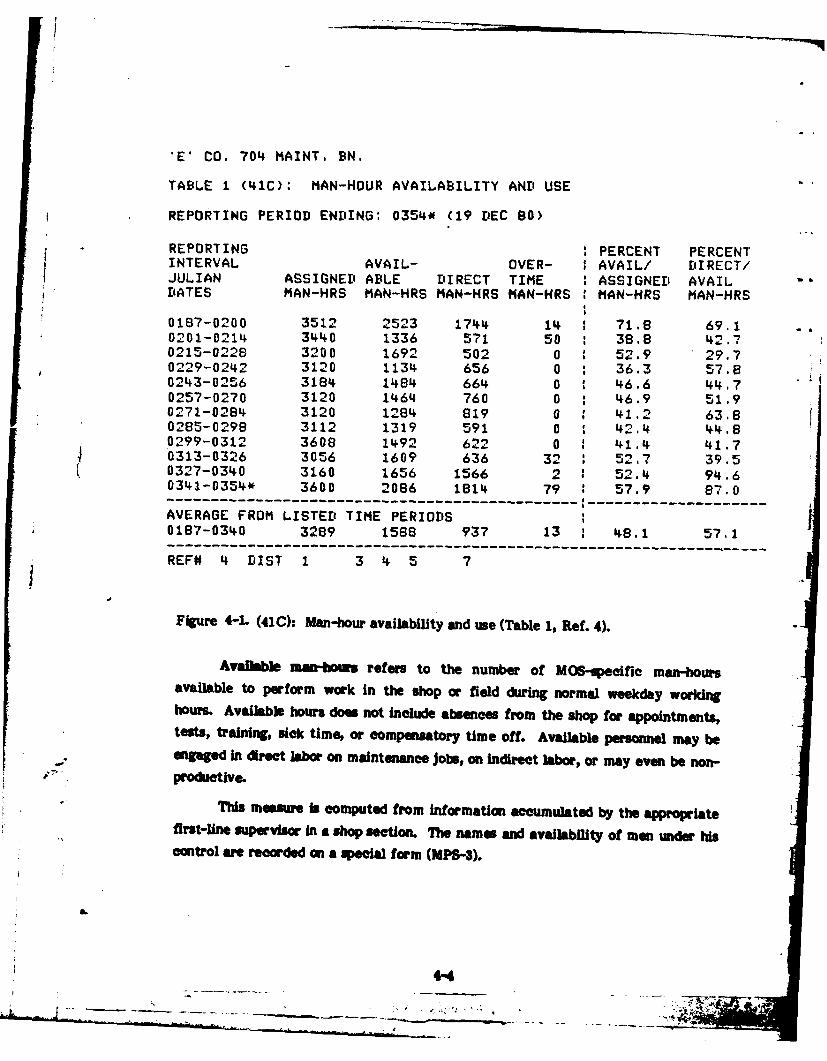
(See Figure 4-1 for example of Table 1.) There are six manpower utilization
measures. They show assigned man-hours, number of manpower hours available,
number of man-hours spent on direct labor, number of man-hours overtime, ratios
of available-to-assigned, and direct-to-avaflable man-bours. These are defined
below.
Amigned man-hours refers to the number of men in the company assigned to
a particular MOS. Not only does it include men who are assigned to the MOS but
also those who may have another MOS but are working on a semi-permanent basis
in the MOS reported on in the table. Data on Paygrades El through E5 only are
shown. (Paygrades E6 and above are considered supervisory and typically do not
perform repair tasks in the shop.)
The computer program will access the roster file maintained in the
computer by the system operator. The computer program has been designed so the
number of man-hour. shown as assigned in an MOB will be computed automatically
• "from the roster of men present during the ten working days of each reporting
interval.
r"* !ah.-
L . ..- ,
'E' CO. 704 MAINT. BN.
TABLE 1 (41C): MAN-HOUR AVAILABILITY AND USE
REPORTING PERIOD ENDING: 0354* (19 DEC 80)
REPORTING PERCENT PERCENTINTERVAL AVAIL- OVER- AVAIL/ DIRECT/JULIAN ASSIGNED ABLE DIRECT TIME ASSIGNED AVAILDATES MAN-HRS MAN-HRS MAN-HRS MAN-HRS MAN-HRS MAN-HRS
0187-0200 3512 2523 1744 14 1 71.8 69.10201-0214 3440 1336 571 50 38.8 42.70215-0228 3200 1692 502 0 52,9 29.702,9-0242 3120 1134 656 0 36.3 57.80243-0256 3184 1484 664 0 46.6 44.70257-0270 3120 1464. 760 0 46.9 51.90271-0284 3120 1284 819 0 41.2 63.80285-0298 3112 1319 591 0 42.4 44.80299-0312 3608 1492 622 0 41.4 41.70313-0326 3056 1609 636 32 52,7 39.50327--0340 3160 1656 1566 2 52.4 94.60341-0354* 3600 2086 1814 79 : 57.9 8)"7.0
AVERAGE FROM LISTED TIME PERIODS0187-0340 3289 1588 937 13 , 48.1 57.1---------------------------------------------------------------------REF# 4 [IST 1 3 4 5 7
Figure 4-L (410: Man-hour availability and ue (Table 1, Ref. 4).
Available man-twius refers to the number of MOS-ecific man-hoursavailable to perform work in the shop or field during normal weekday workinghour. Available hours does not include absences from the shop for appointments,tets, training, sick time, or compensatory time off. Available persome may beengaged in direct labor on maintenance jobs, on Indirect labor, or may even be non-productive.
This meaMure is computed from information accumulated by the appropriate
first-line supervisor in a shop section. The names and availability of man under hiscontrol are recorded on a qecial form (MPS-3).
.
4-4

Y
Computation of the available man-hour totals reported in Table 1 will be
done automatically by the computer. The hours available for each man will be
summed and presented as a total for all men in that MOS.
Direct man-houzu represents the number of man-hours whereby personnel
were actually involved in direct labor on maintenance jobs. Direct labor is defined
as hours a repairman performs maintenance on any vehicle or other equipment
during normal duty hours. It includes "hands-on" time and any job-related action
such as getting parts or tools, making inspections, completing job-related DA
forms, and looking for information in a technical manual. (Time spent on shop
overhead activities is not chargeable to a particular job and are not included in
direct labor totals. Examples would include shop cleaning, painting, and the like.)
wOvertime man-hours represents the number of man-hours spent on
overtime work by a repairman in the shop either before or after normal duty hours.
This time is recorded whether or not it was spent working on a specific job (direct
labor). Time spent in the field waiting for repair work in off -- uty periods may be
counted as overtime. However, unit tactical training and administrative activities
in the field, such as time spent eating or sleeping, are not counted as overtime.
Overtime data are derived from the same sources as available and direct hours.
These hours are also summarized in the reports automatically by the
- - computer from data recorded by the first-line supervisor.
• " Perewmt available to =esigned ,,,n-hom represents a ratio (expressed as a
-- percentage) of the degree of availability of personnel to perform maintenance
Swork. The ratio expresses the proportion of man-hours available to perform
maintenance work against man-hours assigned according to TO&E.
PGrmt iete mm-hous is represented by a similarlycomputed ratio showing the degree to which personnel available for work during
,. ."regular hours were productively engaged in direct labor on maintenance jobs.
Figure 4-1 showed an example of man-hour availability and use for MOB 41C.The data in MPS Table I are represeintative of those obtained under field
conditions. The reporting period is shown in Julian formnat (0354) and also by the
Gregorian calendar (10 DEC 80). The current r,.porting period is always shown on
4-6-I#,

the second to last line of the table, marked with an asterisk. The averages shownat the bottom of the table arnd so titled, represent those computed from data in thelisted time periods on the table. (Tables were so designed that six months of data
can be shown at one time.) As a six-month period is exceeded, the oldest
information will be removed and the newest information printed at the bottom of
the table.
This table may be interpreted in several ways. For a quick overview the
user should scan the two right-hand ratio columns. Note the differences betweenthe available-to-auigned man-hours and between the direct-to-available man-
hours. These ratios are 57.9 percent and 87 percent, respectively, in the examplein Figure 4-1. As the data base increases so does the opportunity to compare
current data with those previously listed.
But examining the ratio columns alone is not adequate for a detailedanalysis. The numerical data in the four columns to the left of the ratio should
also be examined. Note for example the information in Julian period 0313-0326.The assigned man-hours for this period were 3056, a difference of 552 man-hours
from those listed in the previous period. The user's action might include
investigation of whether personnel had left the unit and no replacements had been
obtained, whether there were reassignments to other companies, to otherbattalions within the division, or whether there was an error in man-hours
accounting and bookkeeping.
During the same period note the comparison between available man-hours
(1609) and direct man-hours (636). Although the ratio between assigned andavailable is 52.7 percent, the ratio between direct man-hours and available man-
hours has dropped (39.5 percent). In addition, 32 hours overtime were required toget the work out. The long-term average ratio between direct and available man-
hours for the six-months listed is 57.1 percent. A wide disparity such as this
suggests that shop personnel are spending too much time on indirect labor. Acertain amount of indirect labor is inevitable but an excess suggests poormanpower utilization by shop supervisors.
Increase in overtime man-hours indicates inability to cope with workload
using current resources. The reasons may stem from inefficient use of personnel,
4-6
lack of personnel, poor scheduling, higher-than-normal workload, lack of coopera-
tion from customers bringing work on time, the need for training of repairmen, and
improper management of resources. If investigation reveals there are no unusual
maintenance demands during the reporting period, and overtime man-hours are
higher than normal, the problem may lie with shop management or lack of
coordination between technical sections in the shop.
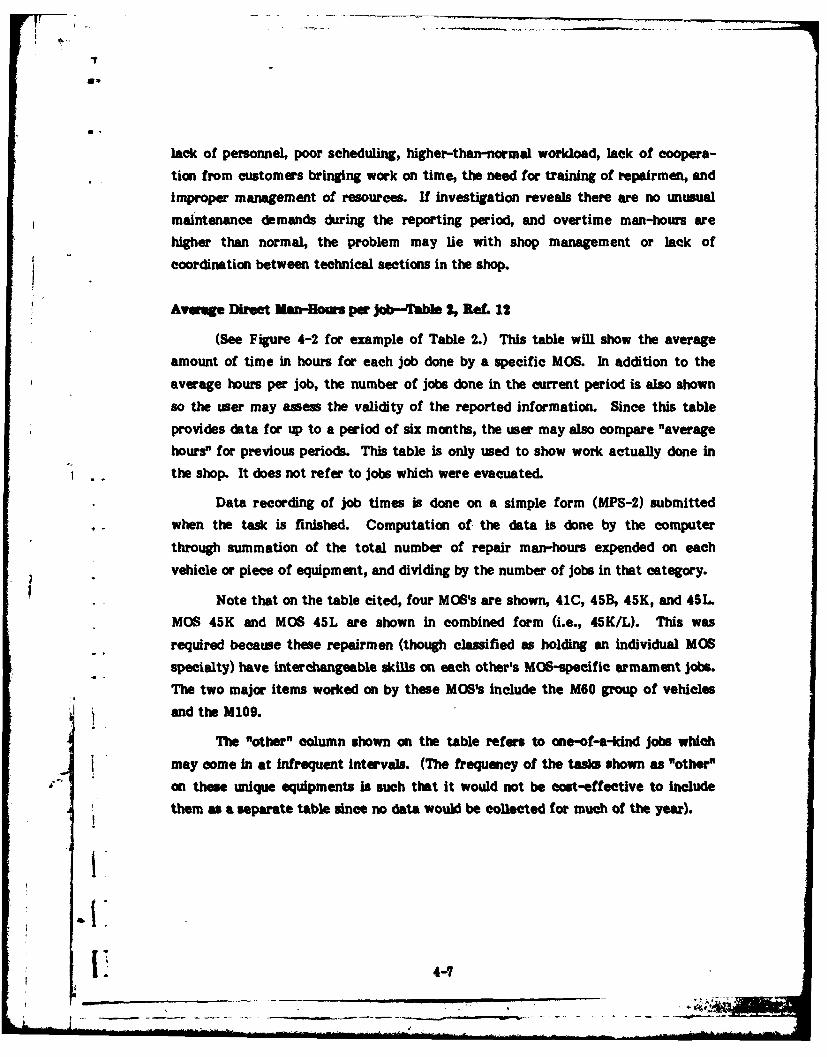
Averge Direct Man-Hours per job--Table 2, ReL 12
(See Figure 4-2 for example of Table 2.) This table will show the average
amount of time in hours for each job done by a specific MOS. In addition to the
average hours per job, the number of jobs done in the current period is also shown
so the user may assess the validity of the reported information. Since this table
provides data for up to a period of six months, the user may also compare "average
hours" for previous periods. This table is only used to show work actually done in
the shop. It does not refer to jobs which were evacuated.
Data recording of job times is done on a simple form (MPS-2) submitted
when the task is finished. Computation of. the data is done by the computer
through summation of the total number of repair man-hours expended on each
vehicle or piece of equipment, and dividing by the number of jobs in that category.
Note that on the table cited, four MOS's are shown, 41C, 45B, 45K, and 45L
MOS 45K and MOS 45L are shown in combined form (i.e., 45K/L). This was
required because these repairmen (though classified as holding an individual MOSspecialty) have interchangeable skills on each other's MOS-specific armament jobs.
The two major items worked on by these MOB'S include the M60 group of vehicles
and the M109.
The "other" column shown on the table refers to one-of-a-kind jobs which
may come in at infrequent Intervals. (The frequency of the tasks shown as "other"
on these unique equipments is such that it would not be cost-effective to include
them as a separate table since no data would be collected for much of the year).
I4-7L - .,_ _-__ _,_ _

'E' CO. 704 MAINT. BN.
TABLE 2 (L1C/45B/4SK/L): AVERAGE DIRECT MAN-HOURS PER JOB
REPORTING PERIOD ENDING: 0354* (19 DEC 80)
MOS 41C MOS 45B MOS 45K/LREPORTING R UF RI . O AvG,INTERVAL HRS.JULIAN AVG. NO. AVG. NO. AVG. NO. AVG. NO. AVG. NO. 45K/'-DATES HRS. JOBS HRS. JOBS HRS. JOBS HRS. JOBS HRS. JOBS JOBS
0187-0200 23.3 12 28.0 3 24.20201-0214 22.7 3 22.7 3 23.4 7 25.3 3 25.6 4 24.40215-0228 31.0 2 31.0 2 21.6 14 21.7 3 21.6
0229-0242 16.4 9 15.2 5 16.00243-0256 22.0 2 22.0 2 14.1 16 11.5 2 33.0 3 16.60257-0270 10.2 13 24.0 4 13.4.0271-0284 10.1 17 17.6 5 11.80285-D298 18,0 1 18.0 1 14.6 5 15.5 6 15.10299-0312 29.0 1 29.0 1 9.8 15 17.2 9 29.5 2 13.90313-0326 38.0 2 38.0 2 13.1 7 17.5 6 38.0 1 16.80327-0340 1.7 3 40.7 3 21.20341-0354* 20.0 1 20.0 1 14.4 7 27.3 3 - 18.3
AVERAGES FROM ALL PREVIOUS TIME PERIODS .0000-0340 24.2 12 19.9 12 21.6 125 20.8 52 31.5 10 23-L,
---------------------------------------------------------------------------REF# 12 DIST 2 3 4 5 7
Figure 4-2. (41C/45B/45K/L): Average direct man-hours per job (Table 2, Ref. 12).
At the bottom of Figure 4-2, note that averages are computed from all
previous time periods. This mems that although six months of data are listed on
the table, data from all previous time periods is stored so that the "number of Jobs"
will accumulate and thus increase the validity of the overall averages.
This measure provides an index of the efficiency of maintenance personnel
performing maintenance jobs. As efficiency increases, the rate (time taken) at
which they can perform these jobs should decreme. The measure asumnes thatwork quality remains constant but that skill and other variable factors may change.
Note on the example that the tasks done by MOS 41C during the current period
a4.
4-6
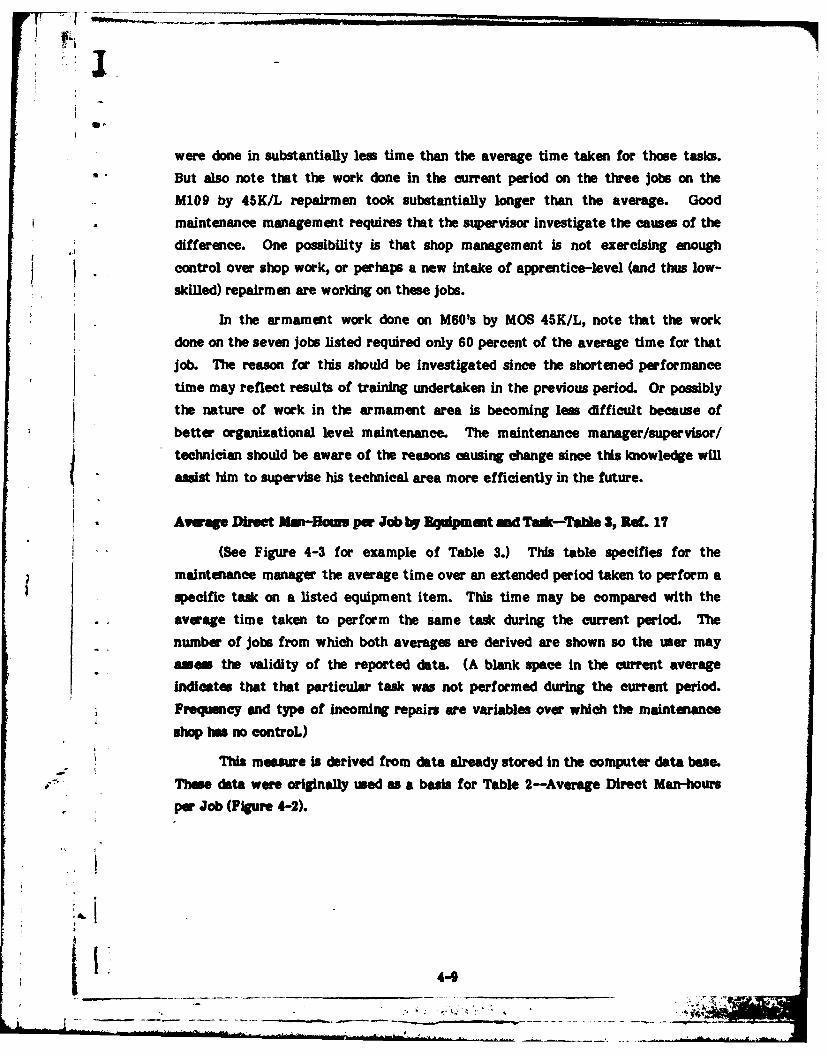
were done in substantially 1.ss time than the average time taken for those tasks.Butalso note that the work done in the current period on the three jobs on theM109 by 45K/L repairmen took substantially longer than the average. Good
* maintenance management requires that the supervisor investigate the causes of thedifference. One possibility is that shop management is not exercising enoughcontrol over shop work, or perhaps a new intake of apprentice-level (and thus low-
skilled) repairmen are working on these jobs.
In the armament work done on M60's by MOB 45K/L, note that the workdone on the seven jobs listed required only 60 percent of the average time for thatjob. The reason for this should be investigated since the shortened performance
time may reflect results of training undertaken in the previous period. Or possiblythe nature of work in the armament area is becoming less difficult because of
better organizational level maintenance. The maintenance manager/supervisor/technician should be aware of the reasons causing change since this knowledge willassist him to supervise his technical area more efficiently in the future.
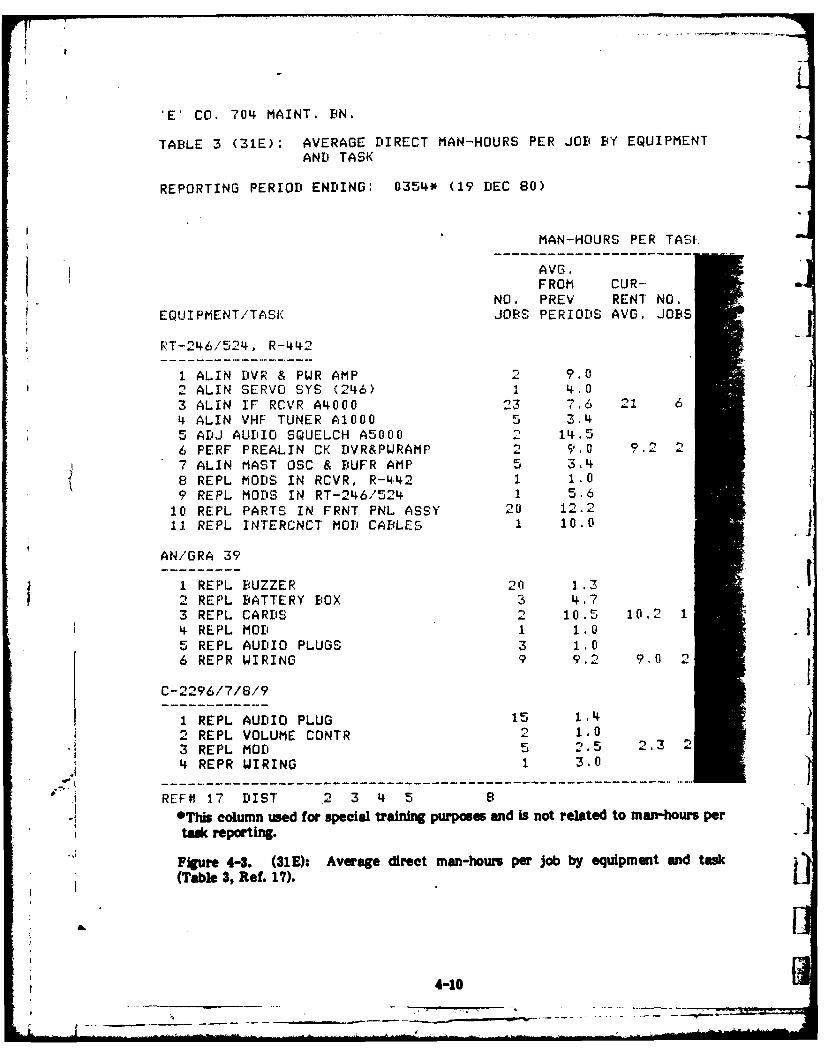
. Avenage Diret Man-Hours per Job by Equipment and Task-Table 3,, Ref. 17
- (See Figure 4-3 for example of Table 3.) This table specifies for themaintenance manager the average time over an extended period taken to perform aspecific task on a listed equipment item. This time may be compared with the
* average time taken to perform the same task during the current period. Thenumber of jobs from which both averages are derived are shown so the user maymaw the validity of the reported data. (A blank space in the current averageindicate that that particular task was not performed during the current period.
* Frequency and type of incoming repairs are variables over which the maintenance
shop has no control.)
-, This measure is derived from data already stored in the computer data base.Teedata were originally used as a basis for Table 2-Average Direct Man-hours
per Job (Figure 4-2).
'40
'E' CO. 704 MAINT. BN,
TABLE 3 (31E): AVERAGE DIRECT MAN-HOURS PER JOB BY EQUIPMENTAND TASK
REPORTING PERIOD ENDING: 0354* (19 DEC 80)
MAN-HOURS PER TADI
AVG.FROM CUR--
NO. PREV RENT NO.
EQUIPMENT/TASK JOBS PERIODS AVG. JOBS
RT-246/524, R-442
1 ALIN ['VR & PWR AMP 2 9.02 ALIN SERVO SYS (246) 1 4.03 ALIN IF RCVR A4000 23 7.6 21 64 ALIN VHF TUNER A1O00 5 3.45 ADJ AUDIO SQUELCH A5000 2 14.56 PERF PREALIN CK DVR&PWRAMP 2 9.0 9.2 27 ALIN MAST OSC & BUFR AMP 5 3.4
8 REPL MODS IN RCVR, R-442 1 1.09 REPL MODS IN RT-246/524 1 5 .6
10 REPL PARTS IN FRNT PNL ASSY 20 12.211 REPL INTERCNCT MOD CABLES 1 10.0
AN/GRA 39
1 REPL BUZZER 20 1.32 REPL BATTERY BOX 3 4.73 REPL CARE'S 2 10.5 10.2 14 REPL MOD 1 1.0 I5 REPL AUDIO PLUGS 3 1.06 REPR WIRING 9 9.2 .0 2
C-2296/7/8/9
1 REPL AUDIO PLUG 15 1.4
2 REPL VOLUME CONTR 2 1.0 .3 REPL MOD 5 z2.5 2.3 2
4 REPR WIRING 1 3.0
REF# 17 DIST 2 3 4 5 8
*This column used for special training purposes and is not related to man-hours per }talk reporting.
Figure 4-3. (31E): Average direct man-hows per job by equipment and task(Table 3, Ref. 17).
4-10

The "number of Jobe listed in the first column on the left shows the numberof jobs completed during all previous reporting periods. The 'Number of Jobe listedon the righ aide of the table refers only to those jobs completed within the currentreporting period.
Maintenance managers often find it difficult to assess shop effectivenessand manpower allocation. Comparative measures to evaluate these areas are rare.This table will provide averages for comparative purposes. Since these averagesare compiled from real shop data under the special environmental conditions and
resources available to the direct support company, they will have a high degree ofvalidity. The exemplary data reported here in the current average column (i.e., 21,9.2, 10.2, 9.0, and 2.3 man-hours, respectively) suggest the man-hours expended pertask fits the trend of time taken for the work reported. It suggests no immediatemanagement action is necessary. But if the task time for a specific job wasgreatly in excess, or below that reported for the historical trend average,
* -management action is warranted to investigate the cause of the discrepancy.
For example, excessively high man-hours could be caused by unusuallydifficult working conditions, parts breaking off in position during removal, or bylack of tools and resources needed to complete the job.
* Excessively short completion times could be due to highly skilled repairmen
*beng assigned tothe job for the first time or even for some vital part of the taskbeing omitted. If a comparison of data from previous tables in the series showed
that the current average mank-hours were gradually being reduced it would suggestthat skill of the repairmen is increasing, thus decreasing the time taken to do thetask.
Awnrage Job Coemplstlma Tie. in Daym-4abb 4, Be&s 2k, 27, 29
(See Figure 4-4, 4-5, and 4-6 for exmples of Table 4.) The information inthese tables represents the total elapsed time from receipt of a job at the DScompany to the time of the job being picked up by the customer. The times shownare average days computed from the number of jots completed in a listed Juliantime period. "Job start" time commences when work is accepted by the DBU shopand ends when all paperwork is returned to the shop clerk and the customer picksup the vehicle.
4-11
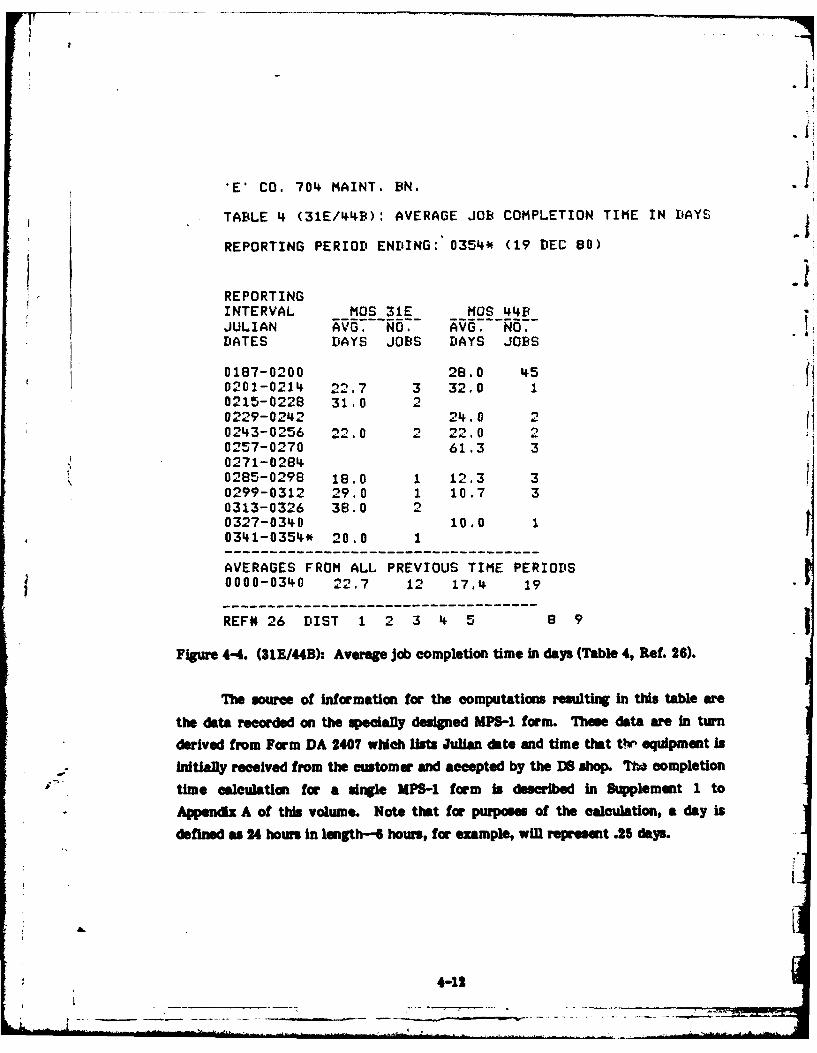
*E' CO. 704 MAINT. BN.
TABLE 4 (31E/44B): AVERAGE JOB COMPLETION TIME IN DAYS
REPORTING PERIOD ENDING: 0354* (19 DEC 80)
REPORTINGINTERVAL MOS 31E MOS 44BJULIAN AVG. NO. AVG. NO.DATES DAYS JOBS DAYS JOBS
0187-0200 28.0 450201-0214 22,7 3 32.0 10215-0228 31.0 20229-0242 24.0 20243-0256 )20 2 22.0 20257-0270 61.3 30271-02840285-0298 18.0 1 12.3 30299-0312 29.0 1 10.7 30313-0326 38.0 20327-0340 10.0 10341-0354* 20.0 1
AVERAGES FROM ALL PREVIOUS TIME PERIODS0000-0340 2. 7 12 17.4 19
REF# 26 DIST 1 2 3 4 5 8 9
Figure 4-4. (31E/44B): Average job completion time in days (Table 4, Ref. 26).
The source of information for the computations resulting in this table are
the data recorded on the specally designed MPS-1 form. These data are in turn
derived from Form DA 2407 which lists Julian date and time that the equipment is
initially received from the customer and accepted by the DB shop. T* completion
time calculation for a single MPS-1 form is described in Supplement 1 to
Appendix A of this volume. Note that for purposes of the calculation, a day is
defined as 24 hours in length-4 hours, for example, will represent .25 days.
4-12

I'
'E' CO. 704 MAINT. BN.
TABLE 4 (41C/45B/45K/L): AVERAGE JOB COMPLETION TIME IN DAYS
REPORTING PERIOD ENDING: 0354* (19 DEC 80)
MOS 41C MOS 4ZB MOS 45K/LREPORTING --- R -RYEO .... OTRER ---- AVGINTERVAL DAYSJULIAN AVG. NO. AVG. NO, AVG. NO. AVG. NO, AVG. NO. 45K/LDATES DAYS JOBS DAYS JOBS DAYS JOBS DAYS JOBS DAYS JOBS JOBS
0187-0200 23.3 12 28.0 3 24.20201-0214 22.7 3 22.7 3 23.4 7 25.3 3 24,00215-0228 31.0 2 31.0 2 21.6 14 21.7 3 21.60229-0242 16.4 9 15.2 5 12.3 2 15.50243-0256 22.0 2 22.0 2 14.1 16 11.5 2 13.80257-0270 10.2 13 24.0 4 13.40271-0284 10.1 17 17.6 5 14.5 3 12.10285-0298 18.0 1 18.0 1 14.6 5 15.5 6 11.6 2 14.80299-0312 29.0 1 29.0 1 9,8 15 17.2 9 12.60313-0326 38.0 2 38.0 2 13.1 7 17..5 6 15.10327-0340 1.7 3 40.7 21.20341-0354* 20.0 1 20.0 1 14.4 7 27.3 3 18.3
AVERAGES FROM ALL PREVIOUS TIME PERIODS0000-0340 25.6 2 31.0 3 15.8 11 26.8 6 16 2 12 17.6
---------------------------------------------------------------------------------REF# 27 DIST 1 2 3 4 5 7
o Figure 4-5, (41C/45B/45K/L): Average Job completion time in days(Table 4, Ref. 27).
The time from start to finish of a job, i.e., completion time, is an overall
meam of " efficiency. The faster a job can be done, the mope efficiently the
shop is oPerating--roviding qulity is held COnstant. Th average job completion
times recorded do not account for the exact nature of Jobs being performed. Job
completion time includes that taken by all.jobs of a given category. For example,
all CE Jos, or ag welding, and sheet metal jobs performed In the time period
reported On ae combined. The aumption here is that differences in job
complexity will average out acrow time.
*4-13
M L,---,- ,

'E' CO. 704 MAINT. BN. JTABLE 4 (63H/W-TIACK): AVERAGE JOB COMPLETION TIME IN DAYS
REPORTING PERIOD E4DING: 0354* (19 DEC 80)
REPORTING AVG..INTERVAL M60 FAM. M113 FAM. M109/578 M88 OTHER DAYSJULIAN AVG. NO. AVG. NO. AVG. NO, AVG. NO. AVG. NO. ALLDATES DAYS JOBS DAYS JOBS DAYS JOBS DAYS JOBS DAYS JOBS: JOBS
0187-0200 28.0 4 23,3 12 28.0 3 23.3 12 24.40201-0214 22.7 3 32.0 1 23.4 7 25,3 3 23.4 7 24.00215-0228 31.0 2 21.6 14 21.7 3 21.6 14 22 20229-0242 24.0 2 16.4 9 15.2 5 16.4 9 16,80243-0256 22.0 2 22.0 2 14.1 16 11.5 2 14.1 16 14.80257-0270 61.3 3 10.2 13 24.0 4 10.2 13 16.50271-0284 10.1 17 17.6 5 10.1 17: 11.10285-0298 18.0 1 12.3 3 14.6 5 15.5 6 14.6 5 14.70299-0312 29,0 1 10,7 3 9.8 15 17.2 9 918 15 11 9,0313-0326 38.0 2 13.1 7 17.5 6 13.1 7 16.60327-0340 10.0 1 1.7 3 40.7 3 1.7 3 14.20341-0354* 20.0 1 14.4 7 27.3 3 14.4 7 16 9
AVERAGES FROM ALL PREVIOUS TIME PERIODS0000-0340 22.7 2 25.6 2 18.5 10 23.4 7 13.4 3 19,7
REF# 29 DIST 1 2 3 4 5 6
Figure 4-6. (63H/W-TRACK); Average job completim time in days(Table 4, Ref 29).
Three examples of Table 4 are provided. Figure 4-4 shows two Most, 1E
and 44B. Figure 4-5 shows three MO's-41C/45B, and 45K/L, together with a
C "-"breakdown by equipment type for armament jobs. Figure 4-6 shows MOB'S 63H/W
together with a breakdown of major tracked equipment "famflies."
41
4-14

1Note in the MOS 31E section of Figure 4-4 that the current time period
shows a period of 20 days to complete one job. But the historical average (based on12 jobs) shows 22.7 days as the average time for completion. The supervisorexamining these data would assume no action is required since the current period is
approximately the same as the historical average. However, on the previous timeperiod (iLe., 0313-0326) note the average time taken was 38 days derived from atotal of two jobs. In this instance, the supervisor should investigate the reason for
the difference between the average period and that reported. Possible causes are:excessively long waiting times for parts; customers tardiness in bringing inspectedwork to the shop; or delay in customer pickup after work is completed.
Note also in the MOS 44B section in Figure 4-4 that the average completion
time is 17.4 days per job derived from a total of 19 jobs. Yet in Julian date period0257-0270 the average derived from a three-job total is 61.3 days. Here again thesupervisor of the welding and sheet metal repairmen must investigate the reasonfor such an inordinately long completion time. Possible causes could include lackof parts, lack of resources, late pickup by customer, late drop-off by customer
af ter initial inspection, continued rejection by customer or turnbeck by shopinspection, and lack of skill by repairmen. Examination of Figures 4-5 and 4-6 willshow similar discrepancies which should serve as "flags" to the motivated
supervisor.
Average Day. Spent in Each Job Stattu-Table 5, flit. 31
(See Figure 4-7 for example of Table 5.) The data in this table aresomewhat similar to those in Table 4 (Job Completion Time) but are further broken
* down into these five job statuses:JOB STATUS CODE STATUS
A Initial InspectionC Awaiting Shop
*B In ShopCK Awaiting Parts
R Awaiting Pickup
The statuses are almost identical to those described in the TAM MS manual(TM 38-750) but are defined in more detail below for convenience of the reader.
a4-1

'E' CO. 704 MAINT. BN.
TABLE 5 (31E/44B): AVERAGE DAYS SPENT IN EACH JOB STATUS FORCOMMUNICATION & ELECTRONICS AND WELDING JOBS
REPORTING PERIOD ENDING: 0354*' (19 DEC 80)
DAYS IN EACH STATUS BY JOB TYPE
REPORTINGINTERVAL COMM. ELEC. JOBS (31E) WELDING JOBS (44B)JULIANDATES A K C B R A K C B R
0187-0200 1.0 1.3 3.4 2.9 2.2 2.3 47.1 19.2 0.5 0. -0201-0214 0.4 2.3 1.5 3.7 4.4 4.3 26.8 5.0 1.5 1.50215-0228 0 0 0.6 5.2 3,6 2.0 4.1 30.7 8.1 0.6 3.0229-0242 6.6 2.7 3.4 1.5 2.4 3.8 25.6 11.8 0.3 ..0243-0256 0.4 2.5 2.9 8.6 1.2 2.1 25.8 21.4 0.2 1.20257-0270 0.2 2.6 4.8 4.4 3.1 3.5 29.3 19.5 1.9 i.,0271-0284 0.4 3.2 6.9 3.8 4.4 2.1 20.2 1.1 1.9 1.0285-0298 0.4 4.7 5.4 4.4 4.4 2.8 16.8 17.5 1.4 0150299-0312 0.4 2.7 3.7 4.0 4.1 5.2 15.5 7.4 0.7 1.70313-0326 6.0 1.8 12.7 2.6 3.4 16.9 7.0 14.6 0.1 1 |0327-0340 12.5 2.4 9.3 1.6 5.1 0.7 16.4 4.2 2.2 3.30341-0354* 1.0 2.2 6.6 39.4 9.7 2.5 7.7 3.0 0.4 1.8- - - - - - ----------------------------------AVERAGES FROM ALL PREVIOUS TIME PERIODS M,0000-0340 2.5 2.4 5.7 4.4 3.5 4.0 24.6 12.9 1.1 1.7
REF# 31 DIST 1 2 3 4 5 8 9
Figure 4-7. (31E/44B): Average days spent in each job status for communicationand electronics and welding Jobs (Table 5, Ref. 31).
lkitdla ipeetim (A) represents the time elapsin between customer I'submision of DA Form 2407 and the time noted by the DS shop lInpector when he
returns the 2407 to the shop clerk. This elapsed time will include delays that mayreult from shop clerk aetions or while waiting inspection. The measure Is
F calculated from data recorded on the NPS-1 form to show the difference from the
time a job Is roeived to the time it moves to the next Job stauL This elapsed
time Interval Is averaed for afl jobs in each equipment category.
4-16

Awaiting Parts (K) refers to the interval between the time a job enters the
awaiting parts status to the time it enters the next status. This interval can
indicate how work flow is being affected by supply. It is similar to NORS, but
NORS is much more broadly defined. "K" status as used in the MPS is an overall
indicator of the effect of parts supply on maintenance job completion. The
computation of this element of the table is similar to that for "A" status.
Awaiting Shop (C) refers to the interval between the time a job is ready to
be worked on but cannot enter the shop because of lack of bays, work space, etc.,to the time it enters the next status.
In-Iftp (C) refers to the interval between the time equipment enters the
shop to the time it leaves the shop, i.e., enters "R" status. (Note that this intervalincludes time required for final inspection. This liberal interpretation of "in shop"is used since final inspection time is often not available as a separate status.)
Awaiting Pickc-up (R) is defined as the time elapsed from when the shop
office clerks notify the customer to pick up repaired equipment, to the time thecustomer actually accepts and removes the vehicle.
The data in this table follow the same format as in other tables, L~e., data
for the most recent two-week (i.e., current) reporting period is shown at the second
bottom line marked with an asterisk, and the averages from all previous timeperiods for each status is shown on the. bottom line. The Figure 4-7 example shows
data for jobs done by MOS 31E (Field Radio Repairman) and 44B (Sheet Metal
Worker).
Maintenance managers can monitor the MOS-specific totals shown in eachstatus column to find out how long work takes to move through each status.
Backlog and bottlenecks in maintenance work flow are easily noted if they deviate
radically from the averaged figures.
-. A bottleneck in *Am status means there is a problem getting work processed
* into the shop. Paperwork may be delayed in the shop office, inspectors may be tooslow, the inspection section may be understaffed, scheduling of inspections may be
iF 4-17
inefficient, or there may be poor organizational level maintenance whereby jobs
are returned because of noncompletion of such preparatory maintenance which is
properly the customer's responsibility.
A bottleneck in K status means there is a problem with supply. Parts may
not be ordered properly, inaccuracies on the requisition will result in deliveries of
the wrong parts, there may be true non-availability of the supply items ordered p
causing extensive delay, or parts may even be received centrally but not picked up
in timely fashion by the DS unit.
A bottleneck in 3 C" status means the shop has more work than it can handle.
The workload may be higher than normal, there may be too few repairmen in the
shop to handle the work, skill level of the repairmen may require improvement,
work bays may not be available, or poor scheduling problems of those bays which
are available may all contribute to delay.
A bottleneck in OBO status means that once work is in the shop it is notmoving through the shop rapidly enough. Again, the reasons are interlocked with
other statuses that may stem from heavy workload, insufficient resources, lack of
TM S or reference material, poor shop management, or even delays in conducting
final inspections on completed work.
tA bottleneck in OR" status means that customers are not pickhog up their
finished work quickly. The delay from the DS point of view is that parking space
and shop floor space may be taken up by finished jobs and cause delays in "C"
status.
These bottlenecks should be considered as indicators that signal the
existence of a problem. Possible solutions may depend on courses of action beyond
the capability of the maintenance manager. If the D8 shop for example, is short
staffed, the maintenance manager may request additional repairmen but must still
r depend on the availability of staff in the personnel supply pipeline. If the skill of
his repairmen is below his needs or expectations, he may have to seek specializedhelp to have Is8 men trained. Training and Its relationship to maintenance via the
MPS is discussed in the remainder of this chapter.
4-18
- -

TRAINING MANAGEMBNT REPORT8
MPS Tables six through nine are primarily oriented to training. Though theinformation they provide may also be useful for logistics and resource manage-ment, the prime emphasis behind the design of these tables and the thrust of their
content is on providing training information.
The training information in MPS reports will
o provide indicators of specific training requirements for each individual inthe MOS's being tracked
* specify the tasks and equipments for which training is required
* maintain a skill proficiency profile for each man which is updated as hisexperience and training increase
9 provide comparative figures on relative skill levels among various MOS's
* specify the training resources and reference sources needed to conducttraining.
Each table is described in detail below.
A more detailed description of the application of these tables for thetraining manager and trainer in the direct support company is contained in the
Oide for indvidual teelileal training in diret support untL6
Sk. and Growth ndexes-Table 6, Re. 3
(See Figure 4-8 for example of Table 6.) Although only seven names areshown as an example of the data to be provided on this table, the table represents
; .data for a high density MOB. The table shows skill and growth indexes numericallyand graphically for not only each individual repairman, but for all repairmencontained within a specific paygrade eategory as a group. The dashed vertical line
on the graph represent the average dlumdex for all holders of the MOS.
6Simpson, H. K., & Fuller, L G. Cid. for indvidl taedaeal &a f in dretawaot ulL Vulume 1: Wkig mnUmhoAM. Santa Barbara, California:Aneapa Sciences, Inc., Deembe 1980.
4-19

The basic constituent of the summarized data shown in Pigure 4-6 is derived
from the task experience history (MPS 6) completed by each repairman. Added to
this history are credits accrued from training, performance of work in the field, or
by on-the-job exposure (OJE). The cumulative total represents each man' skill
index. In other words, it is an up-to-date record of his standing on the compositeskill level for all technical tasks in his MO.
The growth index is another important component of this table. The growth
index represents the amount of Increase in skill as measured on subjective indices
of exposure, training, and performance combined to represent his technical growth
*B' CO. 704 MAINT, BN.
TABLE 6 (63H/W): SKILL AND GROUTH INDEXES
REPORTING PERIOD ENDING: 0284 (10 OCT 80)
SKILL GROWTH SKILL INDEXNAME MOS-PAYGRADE INDEX INDEX 0 ------------- 50 ------------- 100.
ALL E1/2 42 5.2---------------ALL E3 50 12.9- ----------------ALL E4 55 1.8 - -ALL ES 61 0.0ALL El-E5 49 .6 -----------------
MOOSIE(63H-E5) 61 0.0 ------------------SPIEGELMAN(63H-E4) 57 0.0 --FULLER(63W-E4) 52 3.6 -----------------ZIMMERMANN(63H-E3) 50 12.9 -+SIMPSON(63H-E1) 50 12.9 --------------- F+HARPER(63W-E2) 4+8 2.9 --------------- INORRIS(63W-E2) 27 0.0 -
+ SKILL GROWTH DURING LAST 6 WEEKS
-------- ----------------------------------------------------REF# 38 DIST 1 3 5 6
Figure 44. (63H/W) kill. and growth inxes (Table 6, ReL S).
4-20

during the period under review (a base of 100 is used for presentation). This table* is updated every six weeks instead of the two-week interval used for Tables 1
through 5 because of the slow rate of change on individuals' records that one canexpect when training and skill acquisition are infrequent.
j The skill index is calculated by summing the number of times a repairmanhsperformed task 1, task 2, and so on as listed for equipment maintained by his
MOB, and then dividing this total by the number of jobs multiplied byT seven. Senior
personnel consider that after a man has done a job seven times, no markedimprovement will show in his skill level. The number of credits for each job hastherefore been subjectively set at seven.
In general, low skill indexes indicate lack of skill. Low growth indexesindicate lack of experience and training to develop skills during a current reporting
period. Skill indexes are calculated so that a score of about 70 (on a base of 100)represents an average and adequate skill level for a typical group of soldiers.
Experienced personnel will have higher scores. Newly assigned repairmen, who* typically need the most training, will have lower scores. From records kept over
the past 18 months, we estimate the growth index for repairmen in a typical
technical MOB should average three percent. Since inexperienced soldiers have
more to learn, their growth index should obviously be higher. Soldiers with low
$ skill indexes should have growth indexes nearer five percent. Conversely, soldiers
with skill indexes above 50 percent should have growth indexes near two percent.Table 6 (Figure 4-8) is useful to those concerned with training to help determinehow serious the training problem Is for members of a Weclfic MOB within the unit.The growth index columns will also provide a yardstick to evaluate the effective-
new of any training solutions. By observing whether or not the skill indexes and
growth indexes change during several time periods, one can anew whether training* is actually taking place, and whether it is being credited to individuals.
In summary, low growth indexes indicate training Is not happening or is not
effective. Low skill Indexes Indicate serious training deficiencies. Skill indexesshould rise in parallel with the amount of training conducted. If they do not,
* training is not effective.
11 4-21

kd D lhpmt kamiTW-Tatk T, Rot.
(See Figure 4-9 for an example of Table 7.) The information contained in
this table is an important tool for training managers and senior officers concerned
with the skill levels of battalion personnel The table contains six major
components in columnar form. MOB groups are listed with the average sicill index
shown for each MOB group related to a base of 100. In addition, the growth index
subcomponents are shown by exposure, training, and demonstrated performance. A
summed column of these three components is shown as a total growth index. Thistable represents an overview at the battalion level of skill and growth, similar to
the data shown in Table 6 (Figure 4-8) for repairmen in individual MOB's.
'E' CO. 704 MAINT. BN.
TABLE 7 SKILL DEVELOPMENT SUMMARY
REPORTING PERIOD ENDING: 0354 (17 DEC 80)
GROWTH INDEX COMPONENTSAVERAGE ----------------------------------- TOTALSKILL EXPOSURE TRAINING PERFORMANCE GROWTH
MOS INDEX INDEX INDEX INDEX INDEX
31E 40 1.4 3.5 4.0 8.941C 35 4.8 4.4 2.1 11.344B 62 1.0 2.0 1.4 4.445B 70 1.5 2.0 1.4 4.445K/L 56 2.6 1.7 1.6 5.952D 36 4.8 4.0 3.0 11.8
63G 68 2.3 1.3 1.4 5.063H/W 1.2 1.0 2.1 4.3
-------------------------------------------------------------------REFN 4O DIST 1 3 5 68 9
Figu 44. Ikill development summary (Table 7, Ref. 40).
4-22

~J
Examination of Figure 4-9 will show the disparity among "average skillindex" column figures for each MOS group. Note for example that MOS 63H/W has
an average skill index of 75. The lowest group is MOS 41C with an average skill
index of 35. This would suggest to the commander that emphasis needs to beplaced on training for MOS 41C members. The figure of 11.3 in the Total GrowthIndex column for MOS 41C indicates that action has already been taken in the last
reporting period to improve the skill levels of 41C members. Note the relatively
high exposure index figure of 4.8 for the 41C, matched only by a figure of 4.8 forMOS 52D (an MOS whose members also show a disturbingly low skill index). Thetraining index figures for the 41C are the highest which indicates that emphasis has
been placed on training as a means of upgrading skills and that it has taken place
during the preceding six-week period.
These relative indexes are important management tools. If exposure indexis low the supervisors are not exposing the repairmen to new jobs. If the training
index is low then repairmen are receiving no training. If performance index is lowthen supervisors are not providing opportunities for repairmen to demonstrate theirability. The value of this table as a management tool is high since it bridges thegap between shop performance, exposure to tasks and training. Those seniorofficers with responsibilities in both areas will probably be the prime users of this
table.
kin fdD Hbaty-Tale 8, Ref. 48
(See Figure 4-10 for example of Table 8.) Each repairman in the direct
support company whose MOB is being tracked by the MPS will receive a copy ofthis table. It shows his skill credit standing listed by specific tasks on equipmentitems. The table will be provided to the training managers and repairman every six
weeks.
The information is computed from data recorded on the MPS-6-Repairman's Task Experience history, the MPS-5-Training/Performanee Demon-stration form, and the MPS-2-Job/Task Ferformanee form.
i42
I" 4-23

I i.
'B' CO. 704 MAINT. BN,
TABLE 8 (63H/W): INDIVIDUAL SKILL HISTORY
NAME: SIMPSON(63H-E1)
REPORTING PERIOD ENDING: 0284 (10 OCT 80) .1
NUMBER OF CREDITS "
EQUIPMENT/TASK 1 2 3 4 5 6 7
M60 FAMILY
1 REPL ENG/TRANS * * +2 REPL FUEL INJ NOZZLE * * * +
3 REPL FUEL INJ PUMP * * * +4REPL FUEL TANK * * * +5 REPL TURBOCHARGER * *
H113 FAMILY
1 REPL ENG/TRANS/TRANSF2 REPL CYL HEAD3 REPL FUEL INJ NOZZLE *4 ADJ FUEL INJ RACK CONTR *5 ADJ GOVERNOR *6 REPL ENG AIR BLOWER *
M109/M578
1 REPL ENG/TRANS/TRANSF * * * . +2 REPL CYL HEAD * * * * * * .3 REPL FUEL INJ NOZZLE * * * * * *4ADJ FUEL INJ RACK CONTR * * * . * +5 REPL TURBOCHARGER *6 REPL GOVERNOR ,
M8SA1
I REPL ENG/TRANS * + + + . +
2 REPL TURBOSUPERCHARGER * + + + . +3 REPL TRANS OIL COOLER *
-----------------------------------------------------------------------------------------------
REFO 48 DIST 6 11
Figure 4-10. (63HW Individual dci history (Table 8, Re 48).
4.-4
Table 8 (Figure 4-10) identifies each man by name, primary MOS, and* - paygrade. It also notes the reporting period end date. Tasks specific to each
equipment (or family of equipment) are shown on the left column. On the right* side, the number of credits is shown on a scale ranging from 1 to 7. A cross symbol
W+ indicates that the repairman has gained credit from either job exposure,training, or has demonstrated acceptable performance of the task.
The primary value of this type of report is as a skill record and graphicindicator of a repairman's standing on all his required technical tasks. It is notdesigned to be a predictor of training needs or an indicator of training resources.These latter two requirements are met by other MPS tables (e.g., Tables 6, 7 and9).
In the example, repairman Simpson, an El holding MOB 63H, is shown ashav-ag adequate experience on Tasks 1 through 4 on the M109/M578 equipment.But he has still much to learn on Tasks 5and 6(shown with only one skillcredit foreach task). He has somewhat more experience on the M60 tank group and hasreached about 50 percent of his required credit total. On the M113 family ofequipment, he has minimal experience.
Note the crosses (+) on the M88A1 entry. These could signify that Simpsonhas had intensive training during the last six weeks or has had much job exposure,
* or has demonstrated he is completely capable of performing the task unsupervised.
The impact of the table for the trainer shows Simpson as a prime candidatefor training on the M113 as a first priority and on the MOO as a second priority.
* Training or exposure to repair tasks on the M109 and M(881 may be deferred to* - some convenient later time period. From the repairman's point of view, Table 8
indicates his standing on the tasks he is expected to know to fulfill his soldiersmanual requirements for SQTs. Table 8 also help identify the unit's expectation of
* - what repairmen must be able to do to be efficient members of the shop workcforce.If the man is motivated enough by realization of the career effect of the data inTable 8, he can request additional training via self-training, or formally structuredtraining methods, to improve his standing on low credit tasks.
1. 4-25

Note the unorthodox MOB designator (63H/W) in the header of Table 8. The
special explanatory note which follows is included at this point for clarification.
SPECL46L NOTE ON MOB 63H/W IWTKGRATMN R2laTED TO MPS
Prior to 1 October 1980, MOS 63H included repairmen with skills in
automotive repairs of both tracked and wheeled vehicles at the DS/GS level. The
basic skins to conduct these repairs was learned during AlT at USAOC&S. The
man's skill was subsequently enhanced by being able to work on a selection of
wheeled and tracked vehicles in direct support units.
As part of the career management field reorganization that took effect 1
October 1980, CMF 63 included two new specialties-63H, dealing with tracked
vehicle repairs; and 63W, dealing with wheeled vehicle repairs. The MPS was
designed around the formal job responsibilities of these two MOSS. Equipment and
task lists in the MPS were compiled to conform to the new work assignments of
these MOS's.
Unfortunately, the effects of the career field split will not be apparent on
the shop floor for many months. An even longer time may pass before new MOS
graduates from AIT are available and fully integrated into operational units. From
interviews in CONUS and USAREUR, we found that although all existing MOB 63H
repairmen were required to be reclassified into a 63H or 63W category, work
arrangements on the shop floor have not changed. That is, the first automotive
repairman available works on the next automotive job in the sequence, regardless
of whether it is tracked or wheeled. Senior officers controlling DS maintenance
feel they must use all available skills in the existing technical manpower pool to
cope with the workload. They feel they cannot indulge the luxury of having 63W
specialists wait for wheeled work while a tracked vehicle is deadlined for lack of
* repair staff.
We have modified the MPS on a temporary basis to conform to these current
operational conditions. Tables, headings, and in some cases, algorithms, have been
modified to show combined totals for 63H/W MOBs. The effect on MPS tables is
listed below.
4-26
-. . . ' , ' ., '
.-

IT
e Table 1 (Man-Hour Availability and Use) will show these data as acombined 63H/W total.
* Table 2 (Average Direct Man-Hours Per Job) will not change since trackeddata and wheeled data have always been reported separately.
e Table 3 (Average Direct Man-Hours Per Job by Equipment and Task) hasbeen combined to show MOS 63H/W computed data. The net effect ofthis change is that repairmen will be credited with man-hours they spenddoing either wheeled tasks or tracked tasks, regardles of their reclassi-fied MOS.
* Table 4 (Average Job Completion Time in Days) will require no changesince tracked and wheeled data have always been reported separately.
* Table 5 (Average Days Spent in Each Status for Wheel and Truck Jobs) hasalways been shown as a combined 63H/W total
* Table 6 (Skill and Growth Indexes) will show a combined index for 63H/WMOS.
* Table 7 (Skill Development Summary) will show MOS'S 63H and 83Wcombined.
* Table 8 (Individual Skill History) will be shown as a combined taskinventory for both 63H/W tasks.
e Table 9 (Training Requirements Summary) will combine training tasks forboth MOS's into a combined 63H/W.
If and when the career split into 63H and 63W becomes operationally
effective enough to warrant separate tables for each speciality, the MPS is already
* pre-programmed to provide such tables with a minimum of modification.
Trainbg Requirements Summary-Table 9, ReL 57
(See Figure 4-11 for example of Table 9.) Table 9 has been specially
developed to indicate to uni, training managers and trainers what job exposure is
needed, what training needs to be developed, and what personnel require the
*training. Figure 4-11 shows an example of this table.
This table contains a wealth of information cross-indexed on various topics.
It is MOB-specific and is developed each six weeks for each MOS being tracked by
the MPS. Under the table title a tiredwid figure is listed. This threshold figure is
* selected from a range of 1-7 on a subjective basis by the training manager/trainer
so that a manageable number of training requirements will appear on the table. If
the threshold is set very low (number 1 on the scale is highest), say at 6 or 7, most
4-27
• L .. .. . .. .. ..
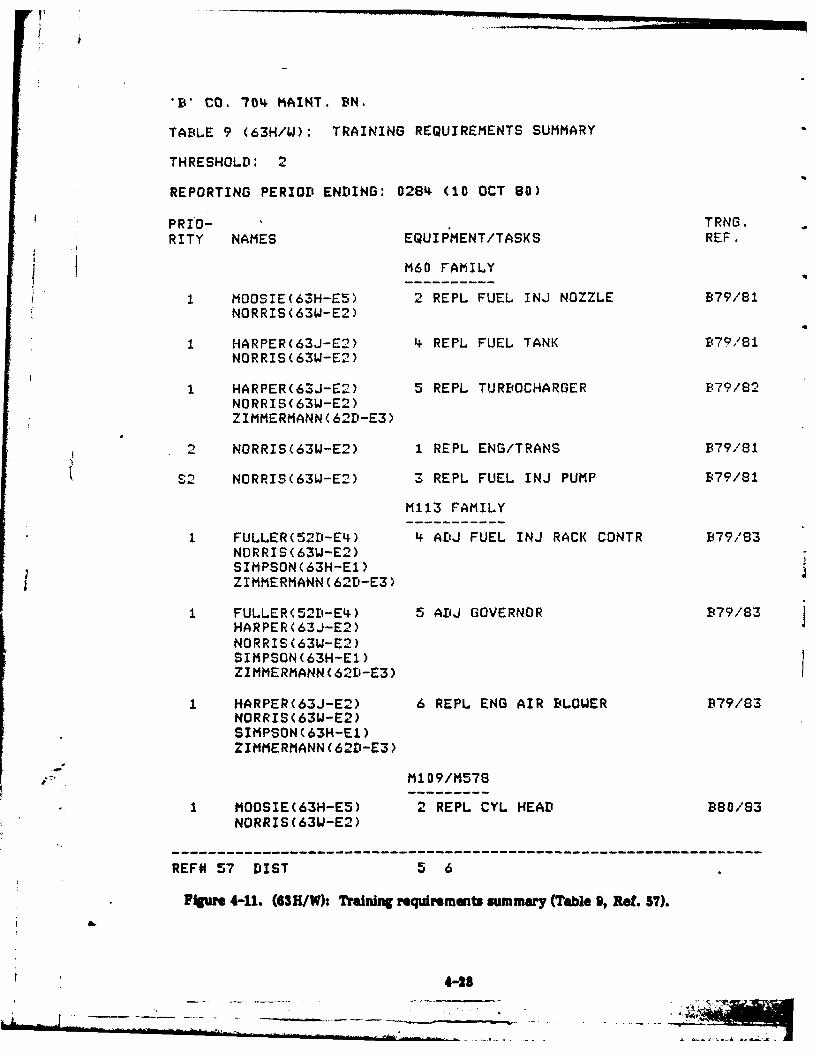
'B' CO. 704~ IAINT. BN.
TABLE 9 (63H/W): TRAINING REQUIREMENTS SUMMARY
THRESHOLD: 2
REPORTING PERIOD ENDING: 028'4 (10 OCT 80)
PRiD- ITRNG.RITY NAMES EQUIP MENT/TASKS REF.
M160 FAMILY
1 MOOSIE(63H-E5) 2 REPL FUEL INJ NOZZLE B'79/81NORRIS(63tJ-E2)
1 HARPER(63J-E2) 14 REPL FUEL TANK B79/81NORRIS(63W-E2)
1 HARPER(63J-E2) 5 REPL TURBOCHARGER B79/82NORRIS( 63LJ-E2)ZIMMERMANN (62t1-E3)
2 NORRIS(63LJ-E2) 1 REPL ENG/TRANS B79/81
52 NORRIS(63W-E2) 3 REPL FUEL INJ PUMP B79/81
M113 FAMILY
1 FULLER(521-E4I) 4 At'J FUEL INJ RACK CONTR B79/83NORRIS( 63LJ-E2)SIMPSON(63H-El)ZIMMERMANN ( 62E-E3)
1 FULLER(52D-E4) 5 AIIJ GOVERNOR B79/83 jHARPER (63J-E2)NORRIS (63U-E2)SIMPSON(63H-El)
ZIMMERMANN (62D-E3)
I HARPER(63J-E2) 6 REPL ENG AIR B4LOWER B79/83NORRIS(63L3-E2)SIMPSON(63H-El)ZIMMERMANN C62D-E3)
11109/11578
1 MOOSIE(63H-E5) 2 REPL CYL HEAD B80/83NORRIS (63 W-E2)
REFN 57 DIST 5 6
F~ue4-11. (63H/W): Training requiremuits lumiary (Table 9, Ref. 57).
4-28

or all tasks will appear on Table 9 as training requirements. These would include
requirements for training on tasks that are performed say, only once per year on asingle piece of equipment. Conversely, higher thresholds will direct the computerto list training requirements in a more parsimonious fashion. For practical use, the
threshold should normally be set between numbers 1 and 3.
The first column on the left of Vie table is titled priority. This represents
an estimate of importance shown on a scale ranging from 1 to 7 (t being high)
indicating the relative importance of a particular training requirement. It is
computed by an algorithm that considers both the average skill index and the
number of personnel needing training on each task. Note in the example that the
priority 1 designator has been assigned to Tasks 2, 4, and 5 for the M60 equipment.
But priority 2 is assigned to Task 1 for the M60.
The table also lists under name, those personnel who require training to
meet requirements of their primary MOS designator and paygrade, and to meet the
maintenance managers' needs for skilled personnel.
For the equipment/taic column, the table is organized vertically so the
closer an equipment is placed to the top of the listing, the higher the priority that
is required for training on this equipment and related repair tasks.
The general rule for listing tasks is that only tasks with priorities at, orabove, threshold are shown on the printout. This rule is waived if a anscal priority
flog marks the task. All special priority tasks are listed, since they override
-. computed priorities. A special priority listing (shown by an 1W symbol) indicates
- that a commander or training manager has designated the task as especially
* important. In effect, it means that the commander or training manager has
overridden the computer's assessment of priority to attach his own higher priority
rating.
~~ The extreme right-hand column of Table 9 includes the training referem.
The reference number in this column keys the user to a page number in the MPS
guide to individual training (see Reference 1) which contains detailed training
-* resource information. Not only will the training reference resource page number
4-29

identify the location of a description of the key steps used in performing a task,
but it will also provide information on training resources specifically arranged bytask and equipment.
This table is the single most important record in the DS unit training
manager/trainer's inventory of training information related to repairmen. It is an
objective record of training requirements listed by task, equipment, and priority,for each man according to his performance in the previous six weeks. Thecomputer will maintain this history and update it as each task is performed,training is received, or performance is demonstrated.
Interpretation of the table must still take place. It cannot be left to the
computer-based assessment alone. The training manager, for example, may knowof local conditions which affect the conduct of training which the computer cannot
consider. Inspections, accounting, inventory checks, special weather conditions,and lack of equipment on which the training is needed are examples of informationthat will affect interpretation of Table 9.
Conversely, the training manager may have additional information that willrequire him to override the recommendation for low priority of training set by thecomputer. For example, the DS unit may have to support special exercise
requirements whereby customer battalions want all of their vehicles or equipmentin a certain category overhauled in three days or a similar short period. The mostcommon example of such an influx of work is when a customer unit requests allMOS 45K turret jobs completed immediately prior to moving M60 tanks down range
for gunnery exercises.
4-30

APPENDIX A
NOTES ON DATA COMPUTATION AND REPORT GENERATION
ETIMATED DATA REQUIREMENTS (shown as MPS form entries per week)
Table A-1 summarizes the relationships among reports and MPS data input
forms and shows the number of forms that are estimated to need entering each
week for a single company. Note that reports will be generated from a complex
file structure only generally described here. The files will be developed initially
from data entered from the listed MPS forms. Reports will be generated from the
files, not directly from the ASF forms.
TABLE A-1
INITIAL DATA SOURCES (FORMS) FOR EACH REPORT ANDNUMBER OF FORMS ESTIMATED PER WEEK
REPORT MPS FORM NUMBERREFERENCE
* NUMBER 1 2 3 4 5 6 7 8 9
1 X x2 X
3-11 X X
- - 12-16 X
- 17-25 X X
. 26-30 X
- 31-35 X
36-39 X X X X
V 40 X X X X41-49 X X X X
- 50-58 X X X X X X
NUMBER OF 100 100 50 1 25 5 1 1FORMS/WEEK
I.*Up to 75 during MPS start-up.
IA-
6A--
- - "

ROSTER
The roster will be generated from MPS-4 and MPS-6 file data.
The roster will have nine sections-one for each MOS. (Note that MOS's 45Kand 45L are combined into the 45K/L category. MOB's 63H and 63W are also
combined as 63H/W on a temporary basis.) Within each MOS section, personnel will
be listed alphabetically in the ASSIGNED or DELETED portion.
A CODE number is listed beside each name.
An "N" will appear opposite the name in the HIST column if no MPS-6 has
been entered for the repairman; otherwise, there will be a blank.
The roster will show when a repairman "legally" worked in the MOS. He will
become part of the work force on his START DATE and will stop working in the
MOS on his STOP DATE.
Names of personnel who are shown "deleted" on an MPS-4 will move from
the ASSIGNED to DELETED category and show a STOP DATE. These names will
continue to be listed (until file compression occurs) with their stop date, more than
six weeks earlier than the closing date on the file compression. The roster record
will then be purged of the "deleted" names. Other related individual operatorJrecords (e.g., MPS-6-based individual task experience history) will also be purged at
that time.
If a repairman is deleted in error, he can be RE-ADDed (changed from
DELETED to ASSIGNED status) with an MPS-4 entry up to the date when hisrecords would be purged from the roster.
INTERPRTATION COMMENTO
Interpretation Comments will be generated based on MPS-8 file data.
Up to three sets of comments can be displayed for each 14-day reportinginterval. Each comment line may be up to 128 characters in length.
A-2

i1
Table 1 (Man-Hoew Availability and Use)
Table 1 will be generated from MPS-3 and MPS-4 file data.
ASSIGNED MAN-HOURS will be calculated from MPS-4-based roster data.
For a given MOS, the program must access the roster file to determine the number
of repairmen working in a specific MOS (both ASSIGNED and DELETED) on each of
the five working days (Monday-Friday)1 of each week covered. ASSIGNED MAN-
HOURS for this interval will be calculated by multiplying the number of repairmen
per day by eight hours per repairman per day and summing this over the 10 working
days of the intervaL In algorithmic form:
time =10 working daysNumber of 8 hours
ASSIGNED MAN-HOURS = men assigned X per manper day per day
time = 0
AVAILABLE, DIRECT, AND OVERTIME man-hours will be calculated from
MPS-3 file data. The quantities shown will be the sums of those hours appearing on
all MPS-3's for the MOS during each reporting interval. This is represented
symbolically by:
time 10 working days man n
AVAILABLE MAN-HOURS = >Number of man-hoursA M per man per day
time = 0 man I
-" The two right-hand columns (PERCENT AVAIL/ASSIGNED MAN-HS and
PERCENT DIRECT/AVAIL MAN-HRS) will contain ratios based on the ASSIGNED,
- - AVAILABLE, and DIRECT man-hours shown in the columns on the same row in the
table.
1Every weekday is counted; holidays are not recognized in the computation. However,a "comment" may be added for interpretation if holidays were worked and classifiedas overtime.
A-3

Toble 2 (Avemge Direct Man-fours per Job)
Table 2 will be based an MPS-2 file data.
The various Tables 2 differ somewhat in format and appearance. Differences
are based on equipment sub-category and MOS.
Each MPS-2 will represent one job performance by a particular MOS. The
number of hours required to perform the job will be the sum of the man-hours listed in
the MPS-2. The AVG HOURS total shown on Table 2 is the average of the number of
hours for all of the MPS-2's submitted in that period for the particular MOS and
equipment sub-categoryllast MPS-2
Number of directman-hours per
MPS-2 jobfirst MPS-2
AVERAGE HOURS = total number of MPS-2's
The NO. OF JOBS entry is equivalent to the number of MPS-2's used in
making the caleulation.
Table 3 (Average Direct Mm-fows per Job by Equipment and Task)
Table 3 is based on MPS-2 and MPS-7 file data.
Table 3 may be considered an extension of Table 2, with average man-hours
shown by individual task. However, MAN-HOURS PER TASK can only becalculated from single-task MPS-21s. That Is, if an MPS-2 is entered representing
more then one task, that MPS-2 may be used to generate Table 2, but not Table 3.The MPS cannot apportion hours to tasks within an aggregate unless each task is
specified by time taken.
The CURRENT AVG. is the average number of man-hours for performing
-" "i. the indicated task on those MPS-2% representing that task. The NO. OF JOBS isequivalent to the number of MPS-2'u used in making the above calculation.
A-4

The AVG FROM PREV. PERIODS is the average number of hours for per-forming the indicated task listed on MPS-2's (representing that task) more than twoweeks old. The NO OF JOBS shown with the previous period average is the same asthe number of MPS-2's used in making the above calculation.
Table 3 is also used as a convenient vehicle to display a SPECIAL PRIORITY"FLAG" in a separate column. An "S" will appear opposite any task that was givena SPECIAL PRIORITY FLAG based on information from an MPS-7. An "N" willappear if a task was given a NULL flag. Otherwise, the column will be blank.
Table 4 (Average Job Completion Time in Days)
Table 4 is based upon MPS-1 file data.
The various Table 4's will differ somewhat in format and appearance.Differences are based on job sub-category and MOS.
( The COMPLETION time calculation for a single MPS-1 is described inSupplement 1 to this Appendix. Note that for purposes of these calculations a dayis defined as 24 hours in length; 6 hours, for example, represents .25 days. Toarrive at the AVG. DAYS shown in Table 4, the completion time must be summedfor all of the MPS-1's for a particular MOS and equipment sub-category. This issymbolized as follows:
last MPS-1Z Completion-timedays per
MPS-1 jobJ . AVERAGE DAYS = first MPS-1(Completion time) total number of MPS-1's
The NO. OF JOBS entry will be equivalent to the number of MPS-1 used in
making the calculation.
.IA.
4,
Table 5 (Average Day 8pent In Each &ob Status for Communicms nd Ekectnic
WdIg Jobs)
Table 5 will be based upon MPS-1 file data.
The various Table 5's will differ somewhat in format and appearance.
Differences are based on job sub-category and MOS.
Calculation of the "A," "K," "C," "B," AND "R" time intervals for a singleMPS-1 is described in Supplement 1. These intervals will be summed for all of theMPS-ls for a particular MOS and equipment sub-category (see Table 4 discussion
of AVG DAYS Completion time).
Table 6 (dtf and Gowth idexes)
Table 6 is based upon file data generated from MPS-2, MPS-4, MPS-5, and
MPS-6.
Once a repairman is added to the roster from data on an MPS-4 and assigneda code number, the MPS will generate a file for him.
Given a code number, an MPS-6 Job History can be entered into the
computer for the repairman. The MPS-6 essentially lists the number of times he
claims to have performed each of the tasks specific to his MOS.
Each time the repairman performs a task, it will be recorded on an MPS-2.
Thus, the number of times a repairman has performed each task can be determined
subsequently by adding the number of task performances shown on the MPS-6 to
the additional tasc performances shown on MPS-2 .
The MPS-5 data (similar in concept to data on experience from the MPS-2)
shows the number of "credits" a repairman may gain for additional performance ofa task. By use of an MPS-5, a repairman will be recorded as receiving additionalcredits for training on a task, or for paising a performance test on it. The units of
task experience (from MPS-2 and MPS-6) are different from those of training or
performance (from MPS-5), but they are summed along a common scale.
A-S

!-
A man's task experience profile will appear on Table 6 (shown as Skill Index)
if he was listed on the roster as ASSIGNED on the closing date of the reporting
interval.
" SKILL INDEX will reflect the total experience, training, and performancetest credits a man has accumulated for all tasks in his MOS. If a man performs atask twice (noted on MPS-6 and MPS-2) and receives training credit of 2 (fromMPS-5), then his total skill credit for the task will be 4. The maximum credit he
can receive for any task is 7. He is credited with this number if he receivesperformance test credit for the task (from MPS-5). The rationale here is that after
a man has received a credit of 7 he will have adequate mastery of the task and will
have reached an acceptable level of performance.
Total skill credit is the sum of all skil credits on all tasks for a specific
MOS. SKILL INDEX is calculated by dividing total skill credit by the total number
of MOS tasks multiplied by 7 (multiplied by 100 for scaling). This can be expressed
mathematically by the expression:
last MOS task
SSkill creditsper task
" SKILL INDEX (1=) first MOB task X 100(Isnumber of tasks X 7
GROWTH INDEX is the difference between the current Skill Index for the
man and the Skill Index computed six weeks earlier:
Growth Index = I (current) - Io (old)
The line extending to the right on the scale of Table 6 shows Skill Indexgraphically. A 1+" is shown at the end of this line if the Growth Index is greater
1'thn LNote that Table 6 for low density MOS's (e.g., 31E) does not provide such
- detailed information as does Table 6 for high density MOS's (e.g., 63H/W). Thesehigher-density MOS's provide enough data to generate valid averes. Individual
Skill and Growth Indexes are shown on both high and low density MOS tables.
I' A-7
77-77-7,

However, high density MOS tables show additional breakdowns of Skill and Growth
Indexes for five paygrade sub-categories. These Skill and Growth Indexes are the
averages for all personnel within the indicated paygrades. The average Skill Indexfor all paygrades (ALL E1-E5) is also shown graphically as a vertical dashed line.
Table T (tl Development Summary)
Table 7 will be developed from the same information as Table 6. AVERAGE
SKILL INDEX and TOTAL GROWTH INDEX will be calculated as described above.(These values are repeated from Table 6 and need not be re-calculated.)
As noted, Growth Index will be calculated based on credits given for job
experience (from MPS-2 and MPS-6) and from training and testing (MPS-5).
EXPOSURE INDEX will be calculated in the same manner as Growth Index,but will use only experience credits from MPS-2.
TRAINING INDEX will be calculated in the same manner as Growth Index,
but will use only training credits from MPS-5.
PERFORMANCE INDEX is similarly calculated, but will use performance
testing credits from MPS-5.
Table 8 (Imiviadual d History)
Table 8 will be based on the same information as Table 6.
This table will be generated for each repairman who was listed as
ASSIGNED on the roster on the closing date of the reporting interval. A sequence .-
of tables will be generated alphabetically (by name) within each MOS category.
Table 8 will show the total number of credits (experience, training,
performance testing) each repairman holds for each task in his duty MOS on the... report closing date. The NUMBER OF CREDITS scale ranges from 1 through 7; 7 is
the maximum number of credits a man can hold for any task (see discussion in
Chapter 6). A symbol (+)on a tak lne indicates a credlit gained during the last
reporting period.
- A-8
-- -

Tkble 9 (Training Requirements Summary)
Table 9 will be generated from the same information used to generate Table6, and will also use data from MPS-7 and MPS-9.
* The Table 9 generation program will therefore:
1. Tally the skill credits on each MOS task in a given MOS for repairmenwho have skill credits equal to or less than the skill credit THRESHOLD(entered from MPS-9).
2. Transform the tallies to a PRIORITY ranking (see Supplement 2).
3. List all tasks whose priority is equal to, or higher than, threshold -level,and also those tasks to which a SPECIAL PRIORITY FLAG wasattached. Tasks with a NULL Special Priority Flag will not be listed,regardless of the priority computed for them (see Supplement 2). Taskswill be ranked in order of priority within each equipment/job category.
4. Display PRIORITY in the PRIORITY column; and will display anadjacent symbol (S) if a Special Priority Flag is attached to the task.
5. List in the NAMES column all personnel whose task skill credit is equalto or less than threshold.
6. Retrieve the appropriate TRAINING REFERENCE NUMBER code froma pre-programmed matrix and list it in the TRAINING REFERENCENUMBER column.
4 A-9
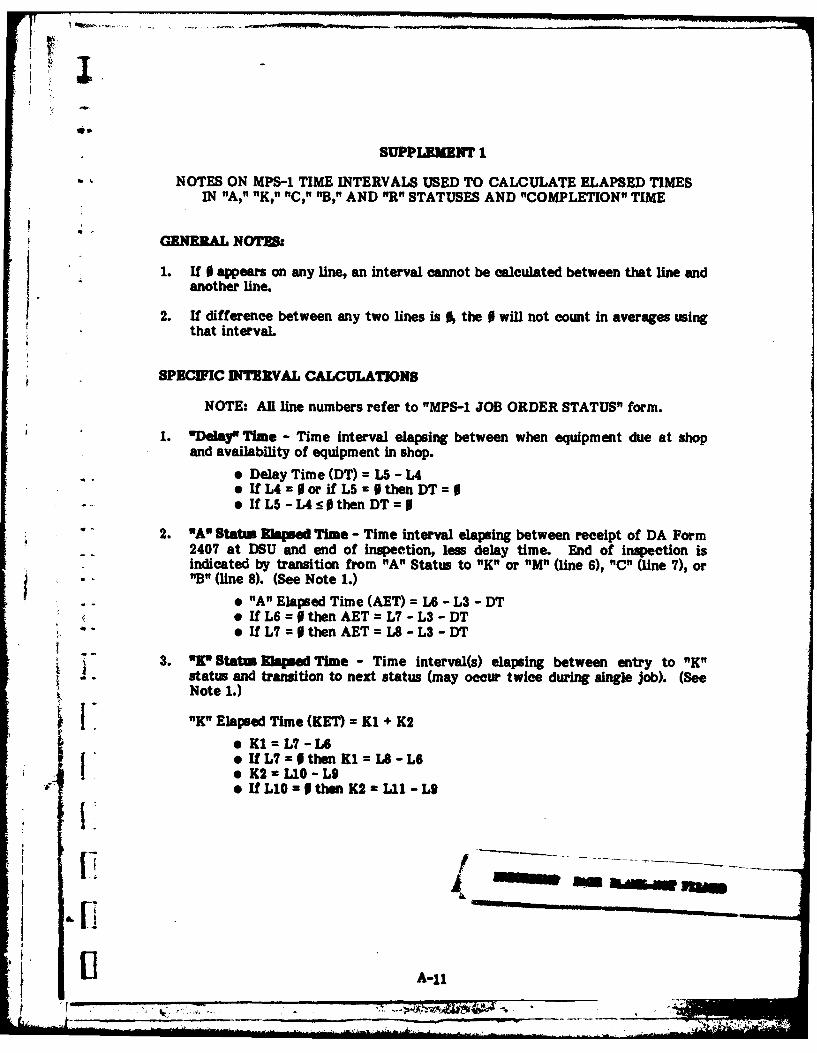
SUPPLEMENT 1
NOTES ON MPS-1 TIME INTERVALS USED TO CALCULATE ELAPSED TIMESIN "A," "K," "C," "B," AND "R" STATUSES AND "COMPLETION" TIME
GENERAL NOTES:
1. Uf 0 appears on any line, an interval cannot be calculated between that line andanother line.
*2. If difference between any two lines is 0, the 0 will not count in averages usingthat interval.
SPECIFIC INTRVAL CALCULATIONS
NOTE: All line numbers refer to "IMPS-l JOB ORDER STATUS" form.
1. "Delay" Time - Time interval elapsing between when equipment due at shopand availability of equipment in shop.
9 Delay Time (DT) =L5 -L4* If L4=Oorif L5=OthenDT=0
- *If L5 -L4:s0 then DT= 0
2. *A" Status Ebsed Time - Time interval elapsing between receipt of DA Form2407 at DSU and end of inspection, less delay time. End of inspection isindicated by transition from "A" Status to "K" or WM (line 6), "C" (line 7), or$ "B" (line 8). (See Note 1.)
* "A" Elapsed Time (AET) =L6 -L3 -DT*lf L6 =0then AET =L7 -L3 -DT9 If L7 =0 then AETLB- L3 -D
- 3. '9" Status Ehaped Time - Time interval(s) elapsing between entry to "K"status and transition to next status (may occur twice during single Job). (SeeNote 1.)
"K" Elapsed Time (KET) = Kl + K2
* K1lz W- L6* If L7 z0 then K1 = IA - L6e K2 aL10- L9e If L10 0then K2 Lll- L9
A-11
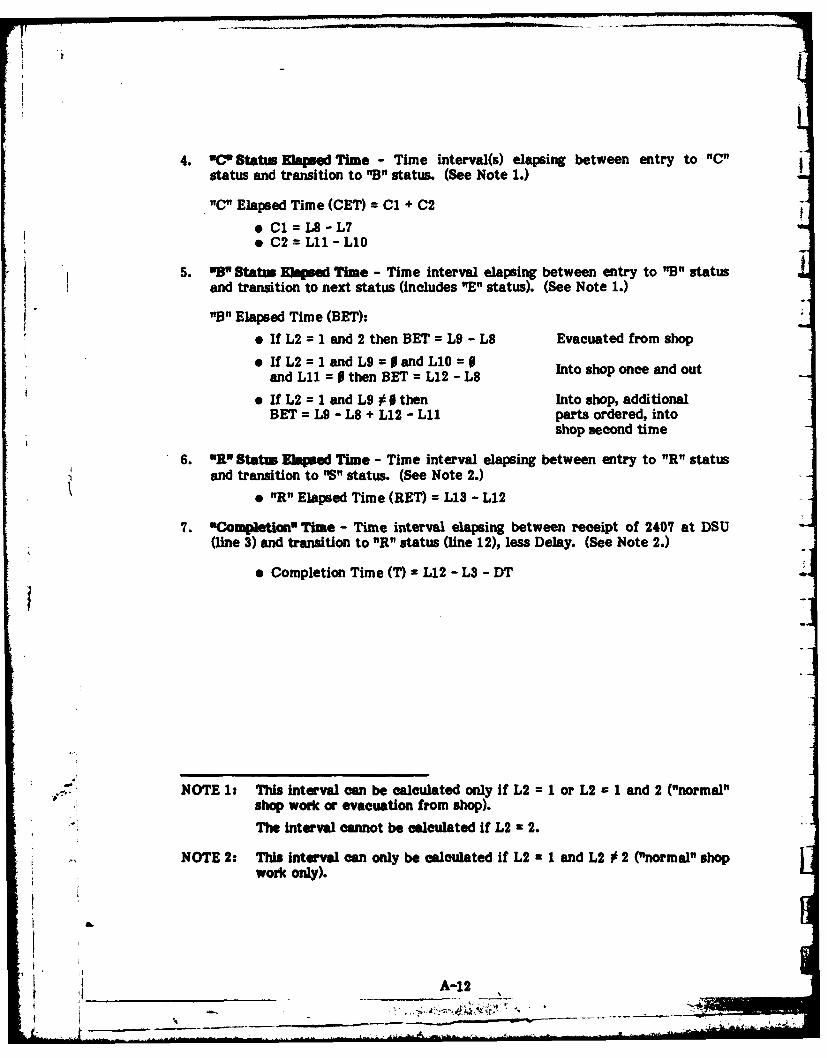
4. O'C Status Ehipsed Time - Time interval(s) elapsing between entry to "C"status and transition to "B" status. (See Note 1.)
"C" Elapsed Time (CET) = C1 + C2
o C1=L8-L7* C2 = L11 - Li
5. w"3 Stats EMlapsed Time - Time interval elapsing between entry to "B" statusand transition to next status (includes "E" status). (See Note 1.)
"B" Elapsed Time (BET):
* If L2 = 1 and 2 then BET = L9 - L8 Evacuated from shop
9 If L2 = 1 and L9 = 0 and L10 =0 Into shop once and outand Lll = 0 then BET = L12 -L8
* If L2 = land L9 0 0 then Into shop, additionalBET = L9 - L8 + L12 - Lll parts ordered, into
shop second time
6. OR" Status EMipsed Time - Time interval elapsing between entry to "R" statusand transition to "S" status. (See Note 2.)
* "R" Elapsed Time (RET) = L13 - L12
7. "Completion" Time - Time interval elapsing between receipt of 2407 at DSU(line 3) and transition to "R" status (line 12), less Delay. (See Note 2.)
* Completion Time (T) = L12 - L3 - DT
NOTE 1: This interval can be calculated only if L2 I or L2 1 and 2 ("normal"shop work or evacuation from shop).
The interval cannot be calculated if L2 = 2.
NOTE 2: This interval can only be calculated if L2 =I and L2 0 2 ("normal" shopwork only).
A-12 , r'
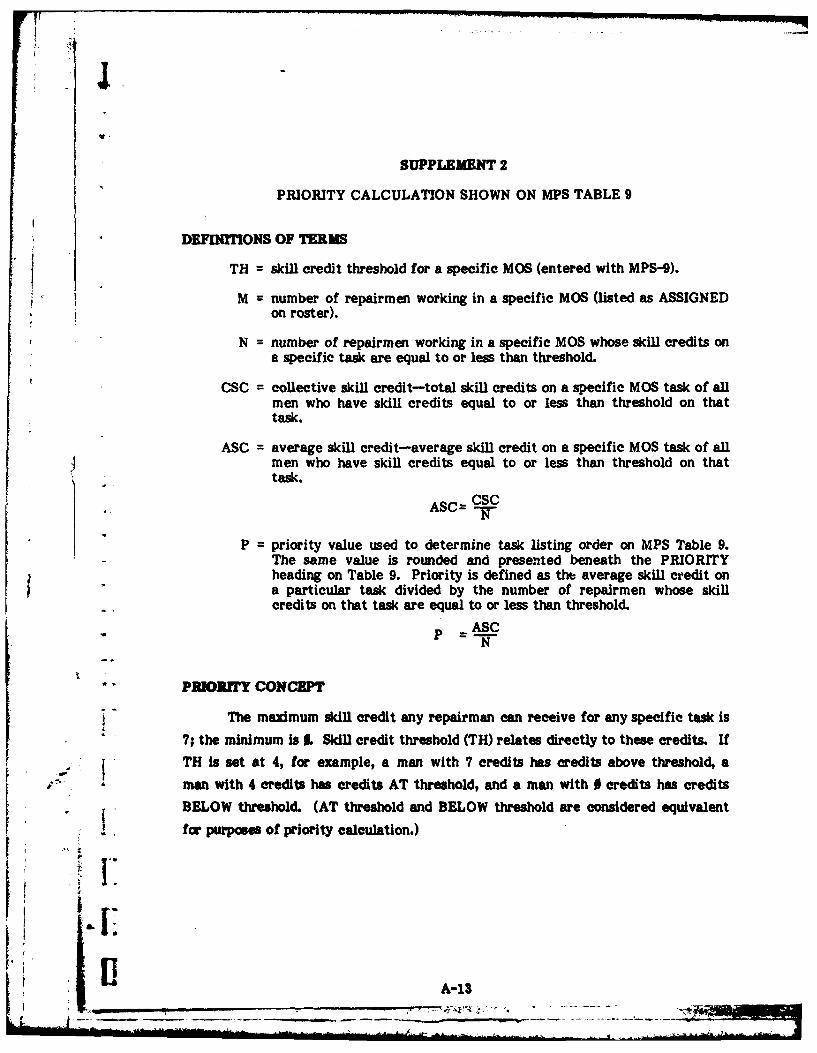
4
SUPPLEMENT 2
PRIORITY CALCULATION SHOWN ON MPS TABLE 9
DEFINrONS OF TERMS
TH = skill credit threshold for a specific MOS (entered with MPS-9).
M = number of repairmen working in a specific MOS (listed as ASSIGNEDon roster).
N = number of repairmen working in a specific MOS whose skill credits ona specific task are equal to or less than threshold.
CSC = collective skill credit-total skill credits on a specific MOS task of allmen who have skill credits equal to or less than threshold on thattask.
ASC = average skill credit-average skill credit on a specific MOS task of allgmen who have skill credits equal to or less than threshold on that
task.
ASC= CSCN
P = priority value used to determine task listing order on MPS Table 9.- The same value is rounded and presented beneath the PRIORITYheading on Table 9. Priority is defined as tht average skill credit ona particular task divided by the number of repairmen whose skillcredits on that task are equal to or less than threshold.
ASCN
PRIORiY CONCEPT
The maximum skill credit any repairman can receive for any specific task is
7; the minimum is L Skill credit threshold (TH) relates directly to these credits. IfTH is set at 4, for example, a man with 7 credits has credits above threshold, a
man with 4 credits has credits AT threshold, and a man with 0 credits has credits
BELOW threshold. (AT threshold and BELOW threshold are considered equivalent
for purposes of priority calculation.)
_A-13

Given a specific unit, MOS, and task, some repairmen will be generally
above threshold; the remainder will be at or below threshold. Training should focuson those repairmen who have skill credit equal to or less than threshold. They havethe strongest requirement for training.
The formula used to calculate the priority (P) value must yield a lower
numeric value as priority "rises" to be consistent with prevailing U.S. Army
convention. A priority of "1"1 is considered higher than a priority of "3," forexample, even though the actual numeric value of "1" is lower.
The formnula used to calculate P must generate numeric values that decreaseas the average skill credit on a specific task decreases and the number of persons
who share the skill deficiency increases.
The following formula yields P values that meet the above requirements:
Note that since ASC = V-,' the earlier formula reduces to the following:
CSC will be 0 if no one has ever done the specific task. In this case, thepriority is automatically set to 1.
N will be 0 if all repairmen are above threshold on the specific task. This
will yield a P that is undefined mathematically. This anomaly will be handled bychecking the value of N before calculating P and setting P to 7 when N 0 .
EXAMPLE
Assume thatTH =4, that the MOShas 3tasks, and that we have task datafor 3 repairmen who work in this MOS. Individual skill credit breakdown is shownbelow.
A-14
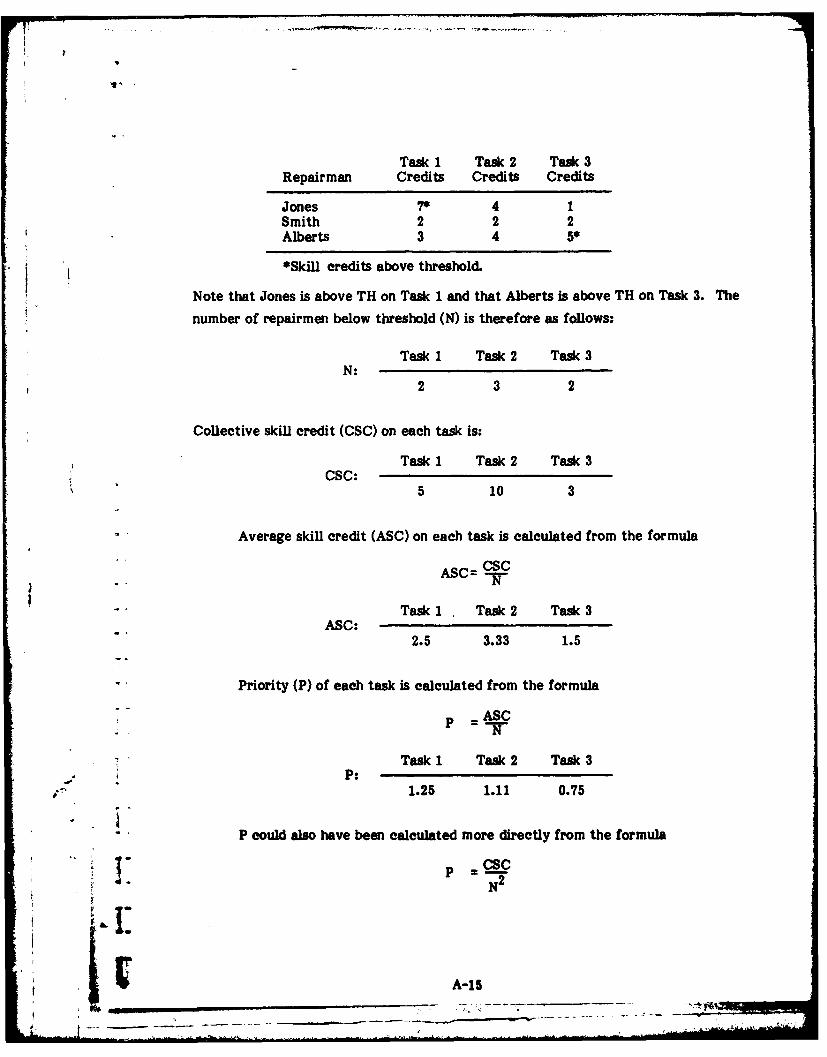
Task 1 Task 2 Task 3Repairman Credits Credits Credits
Jones 7* 4 1Smith 2 2 2Alberts 3 4 5*
*Skill credits above threshold.
Note that Jones is above TH on Task 1 and that Alberts is above TH on Task 3. The
number of repairmen below threshold (N) is therefore as follows:
Task 1 Task 2 Task 3N:
2 3 2
Collective skill credit (CSC) on each task is:
Task I Task 2 Task 3I CSC:
5 10 3
Average skill credit (ASC) on each task is calculated from the formula
ASC= CSC-. N
Task 1 Task 2 Task 3ABC:• 2.5 3.33 1.5
Priority (P) of each task is calculated from the formula
.P = ASC
Task 1 Task 2 Task 3P:
. 1.25 1.11 0.75
P could also have been calculated more directly from the formula
NC
A-15

ROUNDING P VALUE FOR DISPLAY
MPS Table 9 will display only rounded, integer values of P between 1 and 7.The P calculation formula will yield values between 0 and 7. It is necessary,
therefore, to compress the lower end of the scale so that any value of 0 sP c 1.5 isdefined (for display only) as P = 1. The P value that will be displayed for variouscalculated P values is shown below.
Calculated P DisplayedValues (range) P Value
0 2tp <1.5 1
1.5 :5 p < 2.5 22.5 :s p < 3.5 33.5 s p < 4.5 44.5 :5 p < 5.5 5
*5.5 :5 p -c6.5 6
6.5 sp s7 7
A-16