research article sizing and simulation of pv-wind...
TRANSCRIPT

Hindawi Publishing CorporationInternational Journal of PhotoenergyVolume 2013, Article ID 217526, 10 pageshttp://dx.doi.org/10.1155/2013/217526
Research ArticleSizing and Simulation of PV-Wind Hybrid Power System
Mustafa Engin
Ege Higher Vocational School, Department of Electronics Technology, Ege University, 35100 Izmir, Turkey
Correspondence should be addressed to Mustafa Engin; [email protected]
Received 9 October 2012; Revised 29 December 2012; Accepted 10 February 2013
Academic Editor: Mohammad A. Behnajady
Copyright © 2013 Mustafa Engin.This is an open access article distributed under theCreativeCommonsAttribution License, whichpermits unrestricted use, distribution, and reproduction in any medium, provided the original work is properly cited.
A sizing procedure is developed for hybrid system with the aid of mathematical models for photovoltaic cell, wind turbine, andbattery that are readily present in the literature. This sizing procedure can simulate the annual performance of different kinds ofphotovoltaic-wind hybrid power system structures for an identified set of renewable resources, which fulfills technical limitationswith the lowest energy cost. The output of the program will display the performance of the system during the year, the total cost ofthe system, and the best size for the PV-generator, wind generator, and battery capacity. Security lightning application is selected,whereas system performance data and environmental operating conditions are measured and stored. This hybrid system, whichincludes a PV, wind turbine, inverter, and a battery, was installed to supply energy to 24W lamps, considering that the renewableenergy resources of this site where the system was installed were 1700Wh/m2/day solar radiation and 3.43m/s yearly average windspeed. Using the measured variables, the inverter and charge regulator efficiencies were calculated as 90% and 98%, respectively,and the overall system’s electrical efficiency is calculated as 72%. Life cycle costs per kWh are found to be $0.89 and LLP = 0.0428.
1. Introduction
Renewable energy resources like solar and wind offer cleanand economically competitive alternatives to conventionalpower generation where high wind speed and high solarradiation are available. For meeting the energy demand, PV-wind hybrid power generating systems can be beneficial inenhancing the economic and environmental sustainabilityof renewable energy systems. Growing public concerns overglobal warming as an impending outcome of greenhouse gasemissions initiated by energy resources based on fossil fuelshave encouraged to study cleaner energy options, like PV,biomass, wind, and micro hydro systems for several appli-cations. The record of worldwide photovoltaic (PV) marketinstallations extended up to 27.4GW in 2011 [1]. On the otherhand, the commercial wind turbine installations around theworld have expanded to 240GW by the end of 2011 [2].
Renewable resources such as solar andwind energywhichchange randomly are individually less reliable. However, inmany regions, when solar and wind resources are combinedfor power generation, they complement each other by meansof daily and seasonal variations. Combining these two renew-able energy sources could make the system more reliable,
and the system costs might slightly decrease depending onthe regional conditions. However, the energy system sizingprocedure and operation control strategies are getting morecomplex due to the nonlinear components’ physical charac-teristics.
Photovoltaic-wind hybrid power systems are categorizedas extraordinary complex in sizing and optimization process,where renewable energy resources and storage componentsmust be sized to match the given load profile and theestimated ease of use of solar radiation andwind speed.ManyPV-wind hybrid systems are unique in design, whereas thecomplete dynamic testing of hybrid system takes very longtime and also its cost is very high. In some way, whether nec-essary time and budget are provided for the dynamic tests, itis very hard to test all the situations that will bemet during thelife cycle of the hybrid system. It is clear that if the individualperformance does not match with the expected simulationoutcomes, it leads the user to uncertainty. Without exacthigh-level comparisons between real objective performanceand projected computer simulations, it is very hard to focuson enlightening the performance of PV-wind hybrid system.A reliable technique for assessing the performance of a hybridpower system at a specific location is an essential prerequisite

2 International Journal of Photoenergy
for boosting investment in hybrid power systems. Such atechnique is also suitable for comparing the performance oftwo hybrid power systems, specific conditions at a certainlocation [3]. For this reason, software design and simulationtools are important aids.
Several economic viability and technical availability stud-ies are carried out to assess choice of PV-wind hybrid powersystems configurations that serve power to the load with thecertain reliability criteria [4–11]. The number of PV panels,wind turbines, battery cells, load profiles and available renew-able resources plays a significant role in sizing of PV-windhybrid power system. Researchers and scientists mostly usedeterministic and probabilistic methods to size and simulatethe PV-wind hybrid power system. In deterministic method,time-series data such as wind speed, solar radiation, ambienttemperature, load profile, and site geographic position likelatitude, longitude, and altitude are assumed to be known.Resource data like wind speed, solar radiation, ambienttemperature, and load profile are needed, at least hourly basisfor whole year [12–15]. Also on the chronological order of theresource data is really important. Frequency of time-seriesresource data is defined according to the chosen simulationstep time period. In probabilistic method, resource data andload profile are assumed as random variables, and thesevariables may not be in the chronological order. Probabilisticmethod tries to develop appropriate stochastic model forpower generation and power consumption and then com-bines these two models to determine a hybrid system riskmodel. A group of researchers reported two sizing methodsfor autonomous PV-wind hybrid power systems. The firstone assesses hybrid system performance using energy to loadratio which is based on the yearly average of monthly hybridsystem energy outputs [16–19]. The second one realizesbattery to load ratio using the worst monthly scenario [20–22]. The other probabilistic method is proposed by Yang etal. [23]. The authors proposed to use a typical meteorologicalyear (TMY) to find out a precise assessment of energy outputof a PV-wind hybrid power system. Tina and Gagliano [24]sized a PV-wind hybrid power system with probabilisticmethod that is based on convolution technique by probabilitydensity function. Deterministic and probabilistic sizing andsimulation methods have their own advantages and disad-vantages. Sizing procedure utilizing deterministic approachhas severe computational efforts and it gives suboptimumsolutions depending on the type of the used resource data,whereas stochastic procedures are simple and also they mayuse daily or monthly average resource data instead of time-series resource data.
In this paper, a hybrid system model that covers costingand systemperformance variables is identified.Decision vari-ables, objective function, and constraints are determined forthis model. Using simple iterative technique, sizing variableand performance variables are optimized according to theobjective function under constraints.
2. Material and Method
2.1. Solar Evaluation Instruments and Measurements. Thesolar-wind meteorological station is located on the roof of
Table 1: Main characteristics of the Solar-Wind MeteorologicalStation at the Solar Energy Institute.
Module Parts Specification/descriptionWind speed Accuracy 0.5m/s
Wind direction Precision 0.8m/sSensor Pyronometer 4.7 𝜇V/W
Ambient temperature −40 to 56∘C, accuracy < 0.5∘CRelative humidity 12–100%, accuracy < 3%
Signal input 12 channelsData logger Memory 2 Mbytes
Computer connector RS-232Power PV module 15.1 V, 10WPeak
Tripod Stainless steel For right setting the sensors
the Solar Energy Institute Building in Ege University fordetermining the local potentials of both solar and windenergy [25]. This station consists of four modules, namely,sensors, data logger, electric power, and a tripod kit. Table 1gives the specification of the equipment used for the solarradiation, wind speed and direction, ambient temperature,and relative humidity measurements. The station is fullyoperated with solar energy using 10W PV module [26] with12V 12Ah battery backup [27] and hereby the additionalenergy is not needed.Thedata gathering ismade at an intervalof tenminutes and themonthly average values are also logged.The meteorological station was installed in January 2005 andthe measurements have been carried out since then.
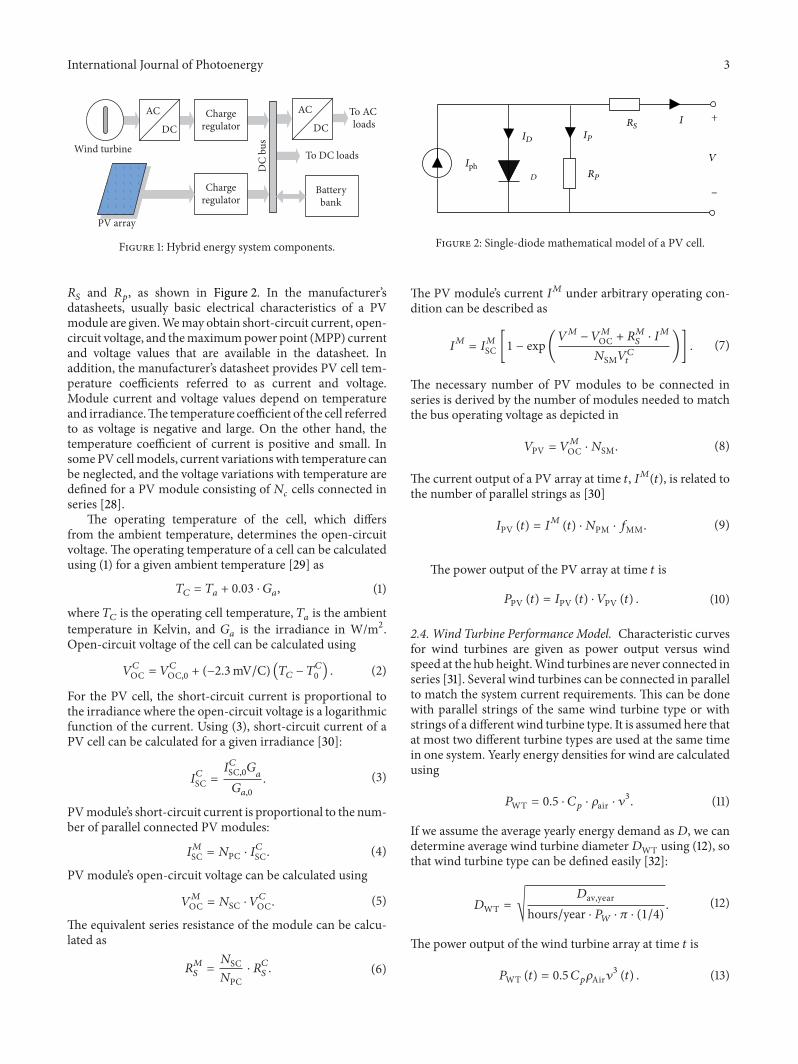
2.2. PV-Wind Hybrid System. PV-wind hybrid energy sys-tem’s main components are shown in Figure 1. PV array andwind turbine generate energy for the load. Battery storesexcess energy and supplies the load when the generatedenergy is not enough for the load. Battery charge controllerskeep battery voltage within specific voltage window and thus,they prevent overdischarge or overcharge regimes. To protectthe battery against overcharging, PV array and wind genera-tor is disconnected from the system when the DC bus voltageincreases above 𝑉max-off and when the current required bythe load is less than the current generated by the PV arrayand wind generator. They are connected again when DCbus voltage decreases below 𝑉max-on. To protect the batteryagainst excessive discharging, the load is disconnected whenthe DC bus voltage falls below 𝑉min-off and when the currentrequired by the load is greater than the current generated bythe PV array and wind generator. The load is switched onwhen DC bus voltage increases above 𝑉min-on. The inverterconverts generated energy from DC to AC for an AC load.
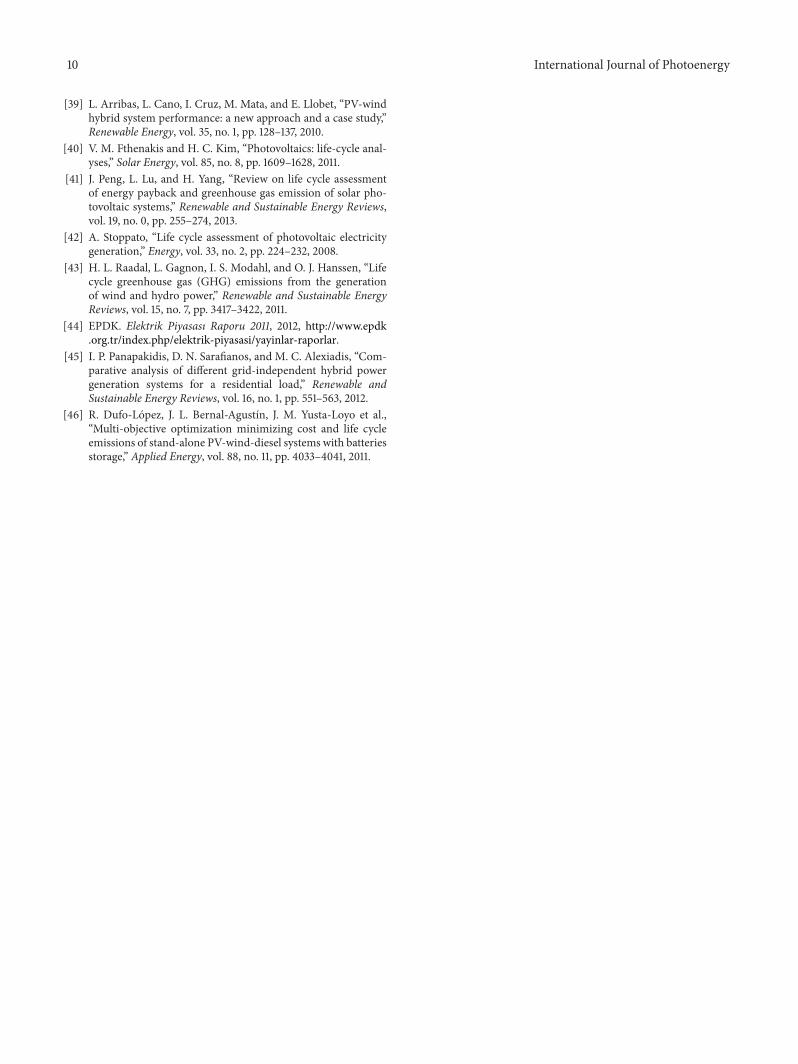
2.3. PV Module Performance Model. A PV module consistsof a number of solar cells connected in series and parallelto obtain the desired voltage and current output levels. Eachsolar cell is basically a p-n diode. As sunlight strikes a solarcell, the incident energy is converted directly into electricalenergy. Single-diode mathematic model is applicable to sim-ulate silicon photovoltaic cells, which consists of a photocur-rent source 𝐼ph, a nonlinear diode, and internal resistances
International Journal of Photoenergy 3
Chargeregulator
Chargeregulator
Batterybank
AC
DC
AC
DCTo AC loads
To DC loads
PV array
Wind turbine
DC
bus
Figure 1: Hybrid energy system components.
𝑅𝑆and 𝑅
𝑝, as shown in Figure 2. In the manufacturer’s
datasheets, usually basic electrical characteristics of a PVmodule are given.Wemay obtain short-circuit current, open-circuit voltage, and themaximumpower point (MPP) currentand voltage values that are available in the datasheet. Inaddition, the manufacturer’s datasheet provides PV cell tem-perature coefficients referred to as current and voltage.Module current and voltage values depend on temperatureand irradiance.The temperature coefficient of the cell referredto as voltage is negative and large. On the other hand, thetemperature coefficient of current is positive and small. InsomePV cellmodels, current variationswith temperature canbe neglected, and the voltage variations with temperature aredefined for a PV module consisting of 𝑁
𝑐cells connected in
series [28].The operating temperature of the cell, which differs
from the ambient temperature, determines the open-circuitvoltage. The operating temperature of a cell can be calculatedusing (1) for a given ambient temperature [29] as
𝑇𝐶= 𝑇𝑎+ 0.03 ⋅ 𝐺
𝑎, (1)
where 𝑇𝐶is the operating cell temperature, 𝑇
𝑎is the ambient
temperature in Kelvin, and 𝐺𝑎is the irradiance in W/m2.
Open-circuit voltage of the cell can be calculated using
𝑉𝐶
OC = 𝑉𝐶
OC,0 + (−2.3mV/C) (𝑇𝐶 − 𝑇𝐶
0) . (2)
For the PV cell, the short-circuit current is proportional tothe irradiance where the open-circuit voltage is a logarithmicfunction of the current. Using (3), short-circuit current of aPV cell can be calculated for a given irradiance [30]:
𝐼𝐶
SC =𝐼𝐶
SC,0𝐺𝑎𝐺𝑎,0
. (3)
PVmodule’s short-circuit current is proportional to the num-ber of parallel connected PV modules:
𝐼𝑀
SC = 𝑁PC ⋅ 𝐼𝐶
SC. (4)
PV module’s open-circuit voltage can be calculated using
𝑉𝑀
OC = 𝑁SC ⋅ 𝑉𝐶
OC. (5)
The equivalent series resistance of the module can be calcu-lated as
𝑅𝑀
𝑆=𝑁SC𝑁PC
⋅ 𝑅𝐶
𝑆. (6)
𝑅𝑃
𝑅𝑆
𝐼ph
𝐷
𝐼𝑃
𝐼 +
−
𝐼𝐷
𝑉
Figure 2: Single-diode mathematical model of a PV cell.
The PV module’s current 𝐼𝑀 under arbitrary operating con-dition can be described as
𝐼𝑀= 𝐼𝑀
SC [1 − exp(𝑉𝑀− 𝑉𝑀
OC + 𝑅𝑀
𝑆⋅ 𝐼𝑀
𝑁SM𝑉𝐶
𝑡
)] . (7)
The necessary number of PV modules to be connected inseries is derived by the number of modules needed to matchthe bus operating voltage as depicted in
𝑉PV = 𝑉𝑀
OC ⋅ 𝑁SM. (8)
The current output of a PV array at time 𝑡, 𝐼𝑀(𝑡), is related tothe number of parallel strings as [30]
𝐼PV (𝑡) = 𝐼𝑀(𝑡) ⋅ 𝑁PM ⋅ 𝑓MM. (9)
The power output of the PV array at time 𝑡 is
𝑃PV (𝑡) = 𝐼PV (𝑡) ⋅ 𝑉PV (𝑡) . (10)
2.4. Wind Turbine Performance Model. Characteristic curvesfor wind turbines are given as power output versus windspeed at the hub height.Wind turbines are never connected inseries [31]. Several wind turbines can be connected in parallelto match the system current requirements. This can be donewith parallel strings of the same wind turbine type or withstrings of a different wind turbine type. It is assumed here thatat most two different turbine types are used at the same timein one system. Yearly energy densities for wind are calculatedusing
𝑃WT = 0.5 ⋅ 𝐶𝑝 ⋅ 𝜌air ⋅ 𝜈3. (11)
If we assume the average yearly energy demand as𝐷, we candetermine average wind turbine diameter𝐷WT using (12), sothat wind turbine type can be defined easily [32]:
𝐷WT = √𝐷av,year
hours/year ⋅ 𝑃𝑊⋅ 𝜋 ⋅ (1/4)
. (12)
The power output of the wind turbine array at time 𝑡 is
𝑃WT (𝑡) = 0.5 𝐶𝑝𝜌Air𝜈3(𝑡) . (13)

4 International Journal of Photoenergy
0
0.5
1
1.5
2
2.5
3
3.5
4
Jan
Feb
Mar
ch
April
May
June July
Aug
Sept Oct
Nov Dec
Mon
thly
mea
ns o
f dai
ly lo
ad (
kWh)
Figure 3: Monthly means of daily load profile of PV-wind hybridsystem.
2.5. Battery Performance Model. Batteries in a hybrid systemare connected in series to obtain the appropriate nominalbus voltage. Therefore, the number of batteries connected inseries for the same type of battery in a battery bank is calculat-ed as follows
𝑁SBat =𝑉PV𝑉Bat
. (14)
The hybrid system can have several different types of batterybanks. The battery state of charge of a battery bank at time𝑡 is calculated based on adding the charge current (positivesign) or discharge current (negative sign) to the battery bankstate of charge at the previous time instant. When adding thebattery current to the battery state of charge, self-dischargelosses and battery charging losses should be taken intoaccount [33]:
SOC (𝑡 + 1)
=
BatBan∑
𝑖=0
[SOC𝑖(𝑡) ⋅ 𝜎𝑖+ 𝐼Bat (𝑡) ⋅ Δ𝑡 ⋅ 𝜂𝑖(𝐼kolbat(𝑡))] ⋅ 𝑁PBat.
(15)
2.6. Inverter, Charger, and Loads Performance Model. Theinverter characteristics can be described by the inverterinput-output relationship. Some of the power supplied to theinverter will be lost due to transformation losses that arenamed inverter efficiency losses, 𝜂inv:
𝑃inv-ip ⋅ 𝜂inv = 𝑃inv-op , 𝜂inv = 𝑓 (𝑃inv-op) . (16)
In fact, charge regulators can be modeled as a switch, whichconnects and disconnects generator to battery or load accord-ing to battery state of charge, temperature, or load demand[34].The output power, 𝑃BC-op, of the battery charger is equalto the input power, 𝑃BC-ip, multiplied by the efficiency lossesduring the energy conversion. Efficiency losses depend non-linearly on the DC output power and therefore nonlinearlyon the DC output current of the battery charger:
𝑃iBC-ip ⋅ 𝜂BC = 𝑃BC-op , 𝜂BC = 𝑓 (𝑃BC-op) . (17)
0100200300400500600700800900
1000
1 3 5 7 9 11 13 15 17 19 21 23 25Hour
Jan
FebMarch
April
MayJuneJuly
August
SeptOct
Nov
Dec
Sola
r rad
iatio
n (W
/m2)
Figure 4: Hourly average of solar radiation data for 12months of theyear.
Efficiency losses can be calculated from efficiency losses ver-sus output power curves that are given by the manufacturers.Inmost cases, two types of loads are present, DC appliances of12 V, 24V, and 48V or AC appliances of 220V.The estimatedpower consumption should be given in intervals of hours,days, or years. If both aDCand anACgenerator exist, some ofthe DC generators energy can be routed through the inverterto the AC loads:
𝐼Gdc ≥ 𝐼dcL, or 𝐼Gdc = 𝐼dcL + 𝐼inv-ip. (18)
2.7. Costing Model of Hybrid System. It is stated by Seeling-Hochmuth in 1998 that in life cycle costing equipmentand operation costs are compiled and discounted over theassumedproject life.Thehybrid system life cycle costs (LCCs)are defined as the initial investment and future discountedoperation costs:
LCC = [𝐶𝐶+
Number of Components
∑
𝑖=1
Discounted 𝐶OP,𝑖] .
(19)
The hybrid system operation costs are in general nonlin-ear and depend largely on the component size and type, andthe way the system is operated. As they depend on futureoperations, they can only be estimated roughly [35].
The sizing variables are sizes of component types andtheir number is to be installed. From the PV module, windturbine, battery, battery charger, and inverter performancemodels sizing variables are defined as follows:
𝑁SBat, 𝑁PBat, 𝑁SM, 𝑁PM, 𝑁PWT, 𝑁Pin,
PVtype,WTtype, INtype,BCtype,BATtype.(20)
Hybrid system must include operation strategies thatdescribe the energy flow between the generator and the load.The operation decision variables to be optimized representrouting and operation decisions that are based on the power

International Journal of Photoenergy 5
0 6 12 18 241
1.52
2.53
3.54
4.5 Jan Feb Mar
Apr May Jun
Jul Aug Sep
Oct Nov Dec
HoursHours Hours
Win
d sp
eed
(m/s
)
0 6 12 18 241
1.52
2.53
3.54
4.5
0 6 12 18 241
1.52
2.53
3.54
4.5
0 6 12 18 241
1.52
2.53
3.54
4.5
Win
d sp
eed
(m/s
)
0 6 12 18 241
1.52
2.53
3.54
4.5
0 6 12 18 241
1.52
2.53
3.54
4.5
0 6 12 18 241
1.52
2.53
3.54
4.5
Win
d sp
eed
(m/s
)
0 6 12 18 241
1.52
2.53
3.54
4.5
0 6 12 18 241
1.52
2.53
3.54
4.5
0 6 12 18 241
1.52
2.53
3.54
4.5
Win
d sp
eed
(m/s
)
0 6 12 18 241
1.52
2.53
3.54
4.5
0 6 12 18 241
1.52
2.53
3.54
4.5
Figure 5: Hourly average of wind speed data for the 12 months of the year.
flow modeled for the hybrid system. The main operationdecision variables of the hybrid system model are minimumbattery stage of charge, SOCmin, maximum battery stage ofcharge SOCmax, PV battery charger control switch, CSCPV,wind turbine battery charger control switch CSCWT, invertercontrol switch CSIN, and load control switch CSL. Some ofthese decision variables may be set before optimization ofhybrid system. The hybrid system model has many con-straints concerning technological, socioeconomic, legal, orphysical aspects. The constraints in the presented approachare given by technical characteristics of battery operation andby matching demand and generated energy. Constraints canbe formulated as follows:
SOC (𝑡) ≥ SOCmin,
SOCmin = 1 − DODmax,(21)
where DODmax is the maximum depth of discharge of thebattery. Consider
𝐼PV (𝑡) + 𝐼𝑊 (𝑡) + 𝐼BD (𝑡) ≥ 𝐼load (𝑡) + 𝐼BC (𝑡) . (22)
Equation (22) cannot always be proved. According to variousapplications, load may not be served with desired amount ofenergy. This situation is described as loss of load probability(LLP). LLP of the energy system can be calculated using (23).Also, LLP is the size of system reliability:
LLP =Energy DemandEnergy Served
. (23)
The objective of optimization procedure is to achieve hybridsystem that generates energy with the lowest cost.The hybrid

6 International Journal of Photoenergy
05
1015
05
1015
200
0.5
1
1.5
2
2.5×10
4
LLP = 0.01,𝑁bat = 2
LLC($)
𝑁WT
𝑁PV
Figure 6: LCC versus𝑁WT,𝑁PV for LLP = 0.01 and𝑁(bat, string) = 2.
30
40
50
60
70
80
90
100
1 1001 2001 3001 4001 5001 6001 7001 8001
Batte
ry S
OC
(%)
Hours
Figure 7: Simulation result of battery SOC.
systemmodel needs to be optimized with respect to the deci-sion variables and operation strategies such that a minimumof the life cycle costs is achieved [36].
3. Results and Discussion
3.1. Case Study. This section demonstrates the effectivenessof the proposed methodology by means of an implicationof PV-wind hybrid system. The developed methodology isused to project a PV-wind hybrid power system for securitylighting in the Solar Energy Institute Building. Inputs of theproject are load profile, and hourly average of solar radiation,ambient temperature, andwind speed resource data forwholeof the year.The load on the system is an experimental lightingof Solar Energy Institute. Load demand changes according tothe period of the night. For the purposes of validating themodel performance, the proposed algorithm is coded andsimulatedwithMATLABV7.7 [37] that will also be employedas a software tool during optimization. The monthly meansof daily average loads are shown in Figure 3. Daily resourcedata were calculated using monthly mean solar radiation andwind speed, and the results are shown in Figures 4 and 5,respectively.
Table 2: Hybrid system component’s initial values of sizing vari-ables, and type of system components.
Variables Symbol Initial value or typeNumber of series connectedmodules 𝑁SM 2
DC bus voltage 𝑉DC 24 voltsBattery cell voltage 𝑉Bat-Cell 2 voltsNumber of series connectedbatteries 𝑁SBatt 12
PV module type PVtype SM50Wind turbine type WTtype 3 blades, PMSGInverter type INtype True sine waveBattery cell capacity 𝑄cell 110 AhWind turbine power 𝑃WT 400W at 10m/sPV module power 𝑃PVM 50Wpeak
Table 3: The optimized hybrid system configuration.
PV system Windturbine Inverter Battery capacity Load
500W 400W 300W 2.64 kWh 24 × 12 = 288W
Using MATLAB code, the initial values of sizing vari-ables referred to as hybrid system components and typeof system components were defined and shown in Table 2.Equation (15) was optimized with respect to𝑁Bat,𝑁PV,𝑁WT,BCtype, and operation strategies to minimize the life cyclecosts. Using simple iteration technique, sizing variables weredefined and the results are shown in Figure 6. Because ofthe economical constraint and availability of wind turbine,𝑁WT is set to 1 instead of 2, and then the system wasreoptimized according to one wind turbine. And then theLLP value was revised to be 0.0738. Using defined sizingvariables and operation strategies, the hybrid system modelwas simulated according to hourly weather data, and SOC isshown in Figure 7. Life cycle costs per kWh are calculated as$1.0076.The optimized hybrid system configuration is shownin Table 3.
Configured PV-wind hybrid power system with batterybackup was installed with the monitoring system in January2009; wind turbine and PV array are shown in Figure 8.The monitoring system and battery bank, inverter, and DC-DC converters for PV and wind turbine were placed in thelaboratory for ease of uploading the logged values which arepresented in Figure 9.
For the assessment, the system was monitored for one-year period logged from January 2009 to January 2010. Bat-tery voltage, load voltage, load current, battery current, PVoutput, and wind generator output currents have been mea-suredwith a sampling rate of 1 sec and recorded as 10 sec aver-age values. Recorded data was uploaded to a computer, andthereafter daily, monthly, and yearly performance parametershave been calculated using these values of components andthe hybrid system.

International Journal of Photoenergy 7
Table 4: Results measured and calculated according to IEC 61724for January 2009 to January 2010.
Parameter Symbol Measured UnitsMeteorological
Global direct irradiation 𝐻𝐼
4.88 kWhm−2d−1
Global available windenergy 𝐸GAW 0.36 kWhm−2d−1
Electrical energy quantitiesNet energy from the PVarray 𝐸PV 811 kWh
Net energy from the WT 𝐸WT 311 kWhEnergy fraction from thePV 𝐹PV 0.71 Dimensionless
Energy fraction from theWT 𝐹WT 0.29 Dimensionless
Total energy in the system 𝐸in 1142 kWhTotal energy used 𝐸use 822 kWhNet energy to the load 𝐸
𝐿822 kWh
BOS component performanceBOS efficiency 𝜂BOS 72 %
System performance indicesPV array yield 𝑌PV 4.4 hd−1
Final PV system yield 𝑌fPV 3.2 hd−1
Wind turbine yield 𝑌WT 0.57 hd−1
Final wind turbine yield 𝑌fWT 0.41 hd−1
Normalized lossesPV array capture losses 𝐿 cPV 34.2 %PV BOS losses 𝐿BOSPV 28 %Performance ratio for thePV 𝑅pPV 41.4 %
Wind turbine capture losses 𝐿 cWT 27.7 %Wind BOS losses 𝐿BOSWT 37 %Performance ratio for theWT 𝑅pWT 46 %
System efficienciesAverage PV efficiency 𝜂PVmean 9.3 %Global PV efficiency 𝜂PVtot 6.72 %Average WT efficiency 𝜂WTmean 9.46 %Global WT efficiency 𝜂WTtot 6.86 %
The data were analyzed following the International Elec-trotechnical Commission Standard (IEC) 61724 [38]. ForPV, the methodology of the standard was followed and forthe wind part, a similar approach is applied, mainly fol-lowing the procedure proposed by Arribas et al. [39]. Theresults are given in Table 4. To test the effectiveness of thedeveloped methodology, the studied PV-wind hybrid systemperformance parameters were also comparedwith simulationresults.
Inverter and charge regulator efficiencies were calculated,93% and 98%, respectively. The battery bank efficiency wasderived from measured parameters and calculated as 82%,
Figure 8: PV-wind hybrid system installed on the roof of SolarEnergy Institute.
Figure 9: Datalogger, battery bank, DC-DC converters, and invert-ers in the laboratory.
which is 3 points less than the expected value. The overallsystem efficiency was calculated as 72%. Life cycle costs perkWh was calculated as $0.89 and LLP = 0.0428. Using themeasured variables, hourly changes of SOC were calculatedand the result is presented in Figure 10.
PV-wind hybrid power system directly converts solar andwind resources to electricity. This energy conversion processis void of gas emission. Consequently, one can say that it isentirely clean. But throughout the PV cell and wind turbinemanufacturing processes and the transportation phase, theyessentially consume a huge amount of energy; as a result,they emit considerable volume of greenhouse gases. PVsystems emit 61 g CO
2-equiv./kWh [40–42] and wind turbine
emits 21 g CO2-equiv./kWh [43]. Accordingly, feeding load
with the grid energy contributes to the greenhouse gassesemission. Table 5 compares the emissions caused by PV-windhybrid system and grid-fed system. In Turkey, the energyfrom the grid is 76.1%, produced with fossil fuel such asnatural gas, coal, and oil which are sources of greenhousegasses emission where the other part of energy is suppliedby mainly hydropower, wind, and geothermal resources. Thegrid-tied systems in Turkey have greenhouse gasses emis-sion of 493 g CO
2-equiv./kWh for 2011, and the electricity
cost for the domestic user is 0.23 $/kWh [44]. When we

8 International Journal of Photoenergy
Table 5: The emissions caused by PV-wind hybrid system and grid-fed system.
System Electricity prices$/kWH
Emissionsg CO2-equiv./kWh
Daily loadkWh/day
Total loadkWh/year
Total emissionsg CO2-equiv./kWh
PV-wind hybrid 0.89 82 3.0275 1142 92502Turkey grid 0.23 493 3.0275 1142 563006
30
40
50
60
70
80
90
100
1 1001 2001 3001 4001 5001 6001 7001 8001
Batte
ry S
OC
(%)
Hours
Figure 10: Measured results of SOC.
compare the grid-tied system with the hybrid system, grid-tied consumers have greater emissions than autonomous PV-wind hybrid systems, while their cost is lower. The PV-windhybrid system observes an important decrease of emissionto 563.006 kg/year; on the other hand, hybrid system energycost is very high compared to grid electricity cost. The otherhybrid systems have the same environmental conditions as 1.7kWh/m2-day; Panapakidis et al. calculated 0.975 $/kWhwith69% renewable fraction [45] andDufo-Lopez et al. calculated0.647 $/kWh with 211 g CO
2-equiv./kWh [46], whereas the
studied system produces energy with a cost of 0.89 $/kWhand an emission of 82 g CO
2-equiv./kWh.
4. Conclusion
A sizing procedure of a hybrid PV-wind energy system waspresented. The outlined technique defines optimum hybridenergy system configuration and control criteria. It needshourly changingmeteorological data as input and contributescost-effective hybrid system configuration with highest relia-bility. The procedure was applied for the sizing of PV-windhybrid energy system that is considered to lighting of theSolar Energy Institute Building. Configured hybrid systemwas installed in January 2009 and the system variations weremeasured every 1minute during one year. From themeasuredvalues, life cycle costs per kWh were calculated as $0.89,LLP = 0.0428, and also hourly changes of SOC are shownin Figure 10. The validation of the procedure was performedthrough the comparison between simulation results andderived results obtained from measurements.
Nomenclature
𝐶𝑝: Power coefficient
𝐶𝐶: Capital cost of hybrid system
𝐶OP: Operation costCSCPV: PV battery charger control switchCSCWT: WT battery charger control switchCSIN: Inverter control switchCS𝐿: Load control switch
𝑓MM: Mismatch factor for different types of modules𝐺𝑎,0: Reference irradiation
𝐺𝑎: Ambient irradiation
𝐼𝐶
SC,0: Reference short-circuit current𝐼𝐶
SC,0: Short-circuit current of cell𝐼𝑀
SC,0: Short-circuit current of module𝐼𝑀: Module current𝐼PV: PV array current𝐼𝑊: Wind turbine current
𝐼BD: Battery discharge current𝐼Load: Load current𝐼BC: Battery charge current𝑅𝑀
𝑆: Equivalent serial resistance of module
𝑅𝐶
𝑆: Equivalent serial resistance of cell
𝜂BC: Efficiency for the battery charger𝜂inv: Inverter efficiency𝑁SBat: Number of series connected batteries𝑁SC: Number of series connected cells𝑁PC: Number of parallel connected cells𝑁SM: Number of series connected modules𝑁PM: Number of parallel connected modules𝑁PBAT: Number of parallel connected batteries𝑃BC-op: The output power of the battery charger𝜎𝑖: Self-discharge losses of the battery
SOC: Battery stage of chargeSOCmin: Minimum SOCSOCmax: Maximum SOC𝑉Ba: Voltage of a battery𝑉𝑐
𝑡: Thermal voltage, mkTC/e
𝜈: Wind speed (m/s)𝜌air: Air density.
References
[1] Solarbuzz. Retail Price Summary, 2012, http://www.solarbuzz.com/facts-and-figures/retail-price-environment/module-prices.
[2] GWEC. Global Wind Energy Outlook, 2012, http://www.gwec.net/wp-content/uploads/2012/11/GWEO 2012 lowRes.pdf.
[3] T. Cronin, H. Bindner, P. Lundsager, and O. Gehrke, “Hybridsystemperformance evaluation,” inProceedings of the 27th Euro-pean Wind Energy Conference, Athens, Grece, 2006.
[4] A. Batman, F. G. Bagriyanik, Z. E. Aygen, O. Gul, and M.Bagriyanik, “A feasibility study of grid-connected photovoltaic

International Journal of Photoenergy 9
systems in Istanbul, Turkey,” Renewable and Sustainable EnergyReviews, vol. 16, no. 8, pp. 5678–5686, 2012.
[5] G. Bekele and B. Palm, “Feasibility study for a standalone solar-wind-based hybrid energy system for application in Ethiopia,”Applied Energy, vol. 87, no. 2, pp. 487–495, 2010.
[6] G. J. Dalton, D. A. Lockington, and T. E. Baldock, “Feasibilityanalysis of stand-alone renewable energy supply options for alarge hotel,” Renewable Energy, vol. 33, no. 7, pp. 1475–1490,2008.
[7] M. J. Khan and M. T. Iqbal, “Pre-feasibility study of stand-alone hybrid energy systems for applications inNewfoundland,”Renewable Energy, vol. 30, no. 6, pp. 835–854, 2005.
[8] M. Lalwani, D. P. Kothari, and M. Singh, “Viability analysis bytechno-economic aspects of grid interactive solar photovoltaicproject in indiaon,” in Proceedings of the International Con-ference on Advances in Engineering, Science and Management(ICAESM ’12), 2012.
[9] R. Luna-Rubio, M. Trejo-Perea, D. Vargas-Vazquez, and G.J. Rıos-Moreno, “Optimal sizing of renewable hybrids energysystems: a review of methodologies,” Solar Energy, vol. 86, no.4, pp. 1077–1088, 2012.
[10] S. M. Shaahid and M. A. Elhadidy, “Technical and economicassessment of grid-independent hybrid photovoltaic-diesel-battery power systems for commercial loads in desert environ-ments,” Renewable and Sustainable Energy Reviews, vol. 11, no.8, pp. 1794–1810, 2007.
[11] E. I. Zoulias and N. Lymberopoulos, “Techno-economic anal-ysis of the integration of hydrogen energy technologies inrenewable energy-based stand-alone power systems,” Renew-able Energy, vol. 32, no. 4, pp. 680–696, 2007.
[12] J. L. Bernal-Agustın and R. Dufo-Lopez, “Simulation and opti-mization of stand-alone hybrid renewable energy systems,”Renewable and Sustainable Energy Reviews, vol. 13, no. 8, pp.2111–2118, 2009.
[13] A. N. Celik, “Optimisation and techno-economic analysis ofautonomous photovoltaic-wind hybrid energy systems in com-parison to single photovoltaic and wind systems,” Energy Con-version and Management, vol. 43, no. 18, pp. 2453–2468, 2002.
[14] M. K. Deshmukh and S. S. Deshmukh, “Modeling of hybridrenewable energy systems,” Renewable and Sustainable EnergyReviews, vol. 12, no. 1, pp. 235–249, 2008.
[15] S. Diaf, G. Notton, M. Belhamel, M. Haddadi, and A. Louche,“Design and techno-economical optimization for hybrid PV/wind system under various meteorological conditions,” AppliedEnergy, vol. 85, no. 10, pp. 968–987, 2008.
[16] F. Giraud and Z. M. Salameh, “Steady-state performance of agrid-connected rooftop hybrid wind—photovoltaic power sys-tem with battery storage,” IEEE Transactions on Energy Conver-sion, vol. 16, no. 1, pp. 1–7, 2001.
[17] A. Gupta, R. P. Saini, andM. P. Sharma, “Steady-state modellingof hybrid energy system for off grid electrification of cluster ofvillages,” Renewable Energy, vol. 35, no. 2, pp. 520–535, 2010.
[18] E. Koutroulis, D. Kolokotsa, A. Potirakis, and K. Kalaitzakis,“Methodology for optimal sizing of stand-alone photovoltaic/wind-generator systems using genetic algorithms,” Solar Energy,vol. 80, no. 9, pp. 1072–1088, 2006.
[19] M. P. McHenry, “Are small-scale grid-connected photovoltaicsystems a cost-effective policy for lowering electricity bills andreducing carbon emissions A technical, economic, and carbonemission analysis,” Energy Policy, vol. 45, pp. 64–72, 2012.
[20] A. N. Celik, “Techno-economic analysis of autonomous PV-wind hybrid energy systems using different sizing methods,”Energy Conversion and Management, vol. 44, no. 12, pp. 1951–1968, 2003.
[21] K. H. Park, C. U. Kang, G. M. Lee, and J. H. Lim, “Design ofoptimal combination for new and renewable hybrid generationsystem,”Communications in Computer and Information Science,vol. 266, pp. 189–198, 2011.
[22] S. Sayeef, N. Mendis, and K. Muttaqi, “Optimisation of com-ponent sizes for a hybrid remote area power supply system,”in Proceedings of the 19th Australasian Universities Power Engi-neeringConference: Sustainable Energy Technologies and Systems(AUPEC ’09), IEEE, September 2009.
[23] H. Yang, Z.Wei, and L. Chengzhi, “Optimal design and techno-economic analysis of a hybrid solar-wind power generationsystem,” Applied Energy, vol. 86, no. 2, pp. 163–169, 2009.
[24] G. M. Tina and S. Gagliano, “Probabilistic modelling of hybridsolar/wind power system with solar tracking system,” Renew-able Energy, vol. 36, no. 6, pp. 1719–1727, 2011.
[25] K. Ulgen and A. Hepbasli, “A study on evaluating the powergeneration of solar-wind hybrid systems in Izmir, Turkey,”Energy Sources, vol. 25, no. 3, pp. 241–252, 2003.
[26] Siemens. SM 10 solar module, 2012, http://www.siemen.co.uk/sm10.html.
[27] Exide. Sonnenschein Batterien, 12V, 10AH, 2012, http://www.farnell.com/datasheets/332192.pdf.
[28] A. McEvoy, T. Markvart, and L. Castaner, Practical Handbook ofPhotovoltaics : Fundamentals and Applications, Academic Press,Amsterdam, The Netherlands, 2012.
[29] C. Luis and S. Silvester, Modeling Photovoltaic Systems UsingPspice, John Wiley & Sons, 2002.
[30] A. D. Hansen, P. Sorensen, L. H. Hansen, and H. Binder,“Models for a stand-alone PV system,” Tech. Rep., RisøNationalLaboratory, Roskilde, Denmark, 2001.
[31] N. A. Orlando, M. Liserre, V. G. Monopoli, R. A. Mastromauro,and A. Del’Aquila, “Comparison of power converter topolo-gies for permanent magnet small wind turbine system,” inProceedings of the IEEE International Symposium on IndustrialElectronics (ISIE ’08), pp. 2359–2364, July 2008.
[32] A. B. Cultura and Z. M. Salameh, “Modeling and simulation ofa wind turbine-generator system,” in Power and Energy SocietyGeneral Meeting, IEEE, 2011.
[33] O. Tremblay, L. A. Dessaint, and A. I. Dekkiche, “A genericbattery model for the dynamic simulation of hybrid electricvehicles,” in Vehicle Power and Propulsion Conference (VPPC’07), pp. 284–289, IEEE, September 2007.
[34] M. Engin, Gunes-Ruzgar Hibrid Enerji ile su Pompalama.[35] G. C. Seeling-Hochmuth, Optimization of Hybrid Energy Sys-
tems Sizing and Operation Control, University of Kassel, 1998.[36] T. Senjyu, D. Hayashi, N. Urasaki, and T. Funabashi, “Optimum
configuration for renewable generating systems in residenceusing genetic algorithm,” IEEE Transactions on Energy Conver-sion, vol. 21, no. 2, pp. 459–466, 2006.
[37] MATLAB. MATLAB/SIMULINK, 2012, R2012b:[MATLAB is ahigh-level language and interactive environment for numericalcomputation, visualization, and programming], http://www.mathworks.com/.
[38] I. E. Commission, International Standard IEC 61724: Photo-voltaic System Performance Monitoring—Guidelines for Mea-surements, Data Exchange and Analysis, IEC, 1998.
10 International Journal of Photoenergy
[39] L. Arribas, L. Cano, I. Cruz, M. Mata, and E. Llobet, “PV-windhybrid system performance: a new approach and a case study,”Renewable Energy, vol. 35, no. 1, pp. 128–137, 2010.
[40] V. M. Fthenakis and H. C. Kim, “Photovoltaics: life-cycle anal-yses,” Solar Energy, vol. 85, no. 8, pp. 1609–1628, 2011.
[41] J. Peng, L. Lu, and H. Yang, “Review on life cycle assessmentof energy payback and greenhouse gas emission of solar pho-tovoltaic systems,” Renewable and Sustainable Energy Reviews,vol. 19, no. 0, pp. 255–274, 2013.
[42] A. Stoppato, “Life cycle assessment of photovoltaic electricitygeneration,” Energy, vol. 33, no. 2, pp. 224–232, 2008.
[43] H. L. Raadal, L. Gagnon, I. S. Modahl, and O. J. Hanssen, “Lifecycle greenhouse gas (GHG) emissions from the generationof wind and hydro power,” Renewable and Sustainable EnergyReviews, vol. 15, no. 7, pp. 3417–3422, 2011.
[44] EPDK. Elektrik Piyasası Raporu 2011, 2012, http://www.epdk.org.tr/index.php/elektrik-piyasasi/yayinlar-raporlar.
[45] I. P. Panapakidis, D. N. Sarafianos, and M. C. Alexiadis, “Com-parative analysis of different grid-independent hybrid powergeneration systems for a residential load,” Renewable andSustainable Energy Reviews, vol. 16, no. 1, pp. 551–563, 2012.
[46] R. Dufo-Lopez, J. L. Bernal-Agustın, J. M. Yusta-Loyo et al.,“Multi-objective optimization minimizing cost and life cycleemissions of stand-alone PV-wind-diesel systems with batteriesstorage,” Applied Energy, vol. 88, no. 11, pp. 4033–4041, 2011.

Submit your manuscripts athttp://www.hindawi.com
Hindawi Publishing Corporationhttp://www.hindawi.com Volume 2014
Inorganic ChemistryInternational Journal of
Hindawi Publishing Corporation http://www.hindawi.com Volume 2014
International Journal ofPhotoenergy
Hindawi Publishing Corporationhttp://www.hindawi.com Volume 2014
Carbohydrate Chemistry
International Journal of
Hindawi Publishing Corporationhttp://www.hindawi.com Volume 2014
Journal of
Chemistry
Hindawi Publishing Corporationhttp://www.hindawi.com Volume 2014
Advances in
Physical Chemistry
Hindawi Publishing Corporationhttp://www.hindawi.com
Analytical Methods in Chemistry
Journal of
Volume 2014
Bioinorganic Chemistry and ApplicationsHindawi Publishing Corporationhttp://www.hindawi.com Volume 2014
SpectroscopyInternational Journal of
Hindawi Publishing Corporationhttp://www.hindawi.com Volume 2014
The Scientific World JournalHindawi Publishing Corporation http://www.hindawi.com Volume 2014
Medicinal ChemistryInternational Journal of
Hindawi Publishing Corporationhttp://www.hindawi.com Volume 2014
Chromatography Research International
Hindawi Publishing Corporationhttp://www.hindawi.com Volume 2014
Applied ChemistryJournal of
Hindawi Publishing Corporationhttp://www.hindawi.com Volume 2014
Hindawi Publishing Corporationhttp://www.hindawi.com Volume 2014
Theoretical ChemistryJournal of
Hindawi Publishing Corporationhttp://www.hindawi.com Volume 2014
Journal of
Spectroscopy
Analytical ChemistryInternational Journal of
Hindawi Publishing Corporationhttp://www.hindawi.com Volume 2014
Journal of
Hindawi Publishing Corporationhttp://www.hindawi.com Volume 2014
Quantum Chemistry
Hindawi Publishing Corporationhttp://www.hindawi.com Volume 2014
Organic Chemistry International
ElectrochemistryInternational Journal of
Hindawi Publishing Corporation http://www.hindawi.com Volume 2014
Hindawi Publishing Corporationhttp://www.hindawi.com Volume 2014
CatalystsJournal of