optimal sizing of grid connected hybrid wind pv systems with battery bank storage
DESCRIPTION
OPTIMAL SIZING OF GRID CONNECTED HYBRID WIND PV SYSTEMS WITH BATTERY BANK STORAGETRANSCRIPT
Azadeh Kamjoo
Alireza Maheri
Ghanim Putrus
Arash Dizqah
School of Computing Engineering and Information Sciences
Northumbria University
Newcastle upon Tyne, UK
Email: [email protected]
OPTIMAL SIZING OF GRID-CONNECTED HYBRID WIND-PV
SYSTEMS WITH BATTERY BANK STORAGE
Outline:
Introduction
Hybrid Renewable Energy Systems (HRES) Components
Design of HRES
Energy Flow in Grid-connected HRES with a Battery
HRES Components & Design Data
Model Development
Optimisation Problem & Design Scenarios
Case Study- Kent, UK
Results
Conclusions

Drivers
Climate changes and greenhouse effect
Global increase in electricity demand
Limitations in Fossil fuel resources
Remote places with no Grid
connection
Renewable energy resources
available, green and free
Find other energy resources Climate dependent & unpredictable
Wind Solar
Use more than one renewable energy resource
With a proper backup system such as DG or battery bank
Hybrid Renewable
Energy Systems
(HRES)
Introduction

Hybrid Renewable Energy Systems (HRES) Components:
HRES
Power production sources
Renewable- based
Non renewable- based
Wind
Solar Thermal
PV
Backup Auxiliary
Grid connected
Stand-alone
Battery bank Hydrogen
Diesel generator
Hydro
Storage
Ground Source

Design Inputs
Load profile
Meteorological data (Solar irradiance and wind speed)
Wind turbine, PV system and battery bank technical specifications
Grid electricity prices (peak and off-peak hours)
Feed-in tariffs (if applicable)
Design of HRES
Design Candidates Analysis
Components modelling
Cost Analysis
Optimisation process and choosing the best (optimum) solution

Energy Flow in Grid-Connected HRES with a Battery
Load
Scenario1:
a) From PV and WT towards the load
b) Sell the surplus to the grid
c) Buy the shortage from grid
(off-peak and peak)
Scenario2:
a) From PV and WT towards the load
b) Charge the battery with excess
power
c) Sell the excess to the grid if the
battery is charged
d) Use grid for power shortage in off-
peak hours and battery for
shortages in peak hours
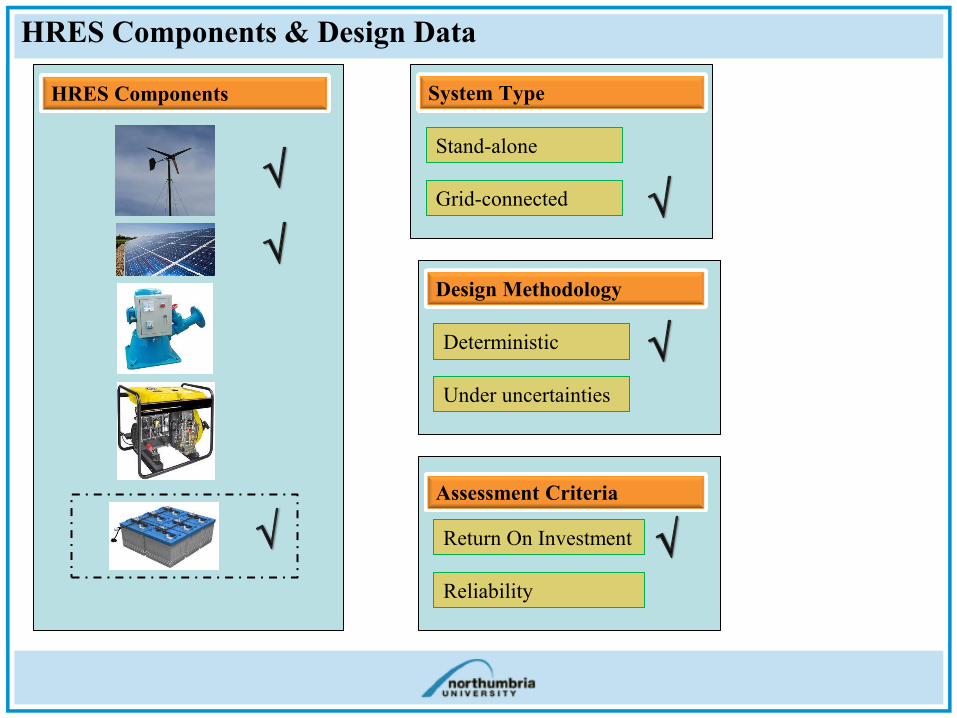
HRES Components & Design Data
HRES Components
Deterministic
Design Methodology
Under uncertainties
Stand-alone
System Type
Grid-connected
Return On Investment
Assessment Criteria
Reliability

Model Development
To Analyse the overall HRES performance the individual components need to be modelled:
Wind Turbine
PV Panel
Battery Bank
HRES Components Modelling:
Economic Analysis:
Income Modelling
Cost Modelling
Return On Investment

wtwpwtAVCρP 3
2
1
Wind Turbine Model
3 4 5 6 7 8 9 10 11 12 13 14 15 16 17 18 19 20 210
0.05
0.1
0.15
0.2
0.25
0.3
0.35
0.4
0.45
Wind Speed (m/s)
Po
wer
Co
eff
icie
nt
(Cp
)
HRES Components Modelling: Wind Turbine System
: Wind’s available power
: Air density
: Power coefficient
: Hourly average wind speed
: Rotor disk area
pC
wtP
wV
wtA
0
ref
0
hub
refw
z
zln
zz
ln
VV

PV Panel Model
PVPVPVηAIP
HRES Components Modelling: PV Panel System
I : Horizontal irradiance
: PV panel’s area
: efficiency of the PV arrays
PVA
PV

Battery Bank Model
bat
Cbat
C
ttItSOCtSOC
)((t))1)(()1(
bat
bat
C
ttItSOCtSOC
)((t))1)(()1(
V
tPtPtPtI loadwtPV
bat
)()()()(
V
tPtPtPtI wtPVload
bat
)()()()(
t
cSOCtSOCtSOCSOCcCItI batbat
)1)()(())(((,min,0max)( min
maxmaxmax,
HRES Components Modelling: Battery Bank
While discharging
While charging
where
where
with constraint of:

Economic Analysis:
Cost Modelling
Initial Capital Cost
Replacement Cost
O & M Cost
Cost of Buying Elec. from Grid
Income Modelling
Feed-in Tariff
Selling Elec. to Grid
Return On Invest.
grid,SellFIT IITI
gridbuyMOrepIC CCCCTC ,&

Optimisation Problem and Design Scenarios
Design scenario1: The power shortage will be maintained from grid in off-peak
and peak hours
Design Scenario2: The power shortage will be maintained from grid in off-peak
hours and from battery bank during peak hours
,PPP
,PPP
gridPVwt
PVwt
HRES_Total
Bat
grid
PVWT
PVWT
HRESTotal
P
PPP
PP
P
,
_
100TC
TCTIROImax
The optimisation problem can be formulated as:
If power generated by wind turbine and PV is sufficient to
cover the load demand.
If power generated by wind turbine and PV is insufficient to
cover the load demand.
If power generated by wind turbine and PV is sufficient to
cover the load demand.
If power generated by wind turbine and PV is insufficient to
cover the load demand during off-peak hours
If power generated by wind turbine and PV is insufficient to
cover the load demand during peak hours

Case Study( Kent, UK)- Design Inputs
COMPONENTS DESIGN PARAMETERS
Efficiency
(%)
Lifetime
(year) Initial Cost O&M Cost
Interest
Rate(%)
Inflation rate
(%)
Feed-in Tariff
(c/kWh)
PV panel 12.3 25 600 ($/m2) 1% of price 8 4 27
WT 20 700 ($/m2) 3% of price 8 4 44
Battery Bank 90 8 1.5 ($/Ah) 1% of price 8 4 -
BATTERY BANK’S SPECIFICATION
Nomial Capacity
(Ah)
Nominal Voltage
(V)
DOD
(%)
Number of
Cycles
Battery
Bank40 24 90 535
Components technical and economical data
Average solar radiation data
1 2 3 4 5 6 7 8 9 10 11 12 13 14 15 16 17 18 19 20 21 22 23 240
100
200
300
400
500
600
700
800
900
1000
1100
1200
1300
1400
Hour
So
lar
Irra
dia
nce
(W
/m2
)
Apr
May
Jun
Jul
Aug
Sep
1 2 3 4 5 6 7 8 9 10 11 12 13 14 15 16 17 18 19 20 21 22 23 240
100
200
300
400
500
600
700
800
900
1000
1100
1200
1300
1400
Hour
So
lar
Irra
dia
nce (
W/m
2)
Jan
Feb
Mar
Oct
Nov
Dec
Average wind speed data
1 2 3 4 5 6 7 8 9 10 11 12 13 14 15 16 17 18 19 20 21 22 23 240
1
2
3
4
5
6
7
8
9
10
11
12
13
14
Hour
Win
d S
pee
d (
m/s
)
Apr
May
Jun
Jul
Aug
Sep
1 2 3 4 5 6 7 8 9 10 11 12 13 14 15 16 17 18 19 20 21 22 23 240
1
2
3
4
5
6
7
8
9
10
11
12
13
14
Hour
Win
d S
peed
(m
/s)
Jan
Feb
Mar
Oct
Nov
Dec
Load profile
0 1 2 3 4 5 6 7 8 9 1011121314151617181920212223240
400
800
1200
1600
2000
2400
2800
3200
3600
4000
Hour
Dem
and
(W)
Summer
Winter
Grid electricity prices
GRID ELECTRICITY PRICES IN UK
GridStandard Tariff
(c/kWh)
First 900kWh 29
Consumptions after
first 900kWh17
Selling electricity to
grid (c/kWh)5

OPTIMUM CONFIGURATION OF EACH PRICE RATE
Peak price/Off-peak
price
WT Rotor Disk
Area (m2)
PV Panel
Area(m2)
Number of
Batteries
Grid Supply
for Peak hour
1.1 28.27 0 0 Yes
1.3 28.27 0 0 Yes
1.5 40.72 0 0 Yes
1.7 40.72 0 0 Yes
1.9 40.72 0 0 Yes
2.1 40.72 0 0 Yes
2.3 40.72 0 32 No
2.5 40.72 0 32 No
2.7 40.72 0 32 No
2.9 40.72 0 32 No
Standard electricity tariff in off-peak and peak hours in UK.
The HRES is designed under different assumptions for the peak hours price.
Below table shows the optimum solution for each of peak price assumption.
Results- Optimum Config. Under 10 different Peak hour Tariffs

PV Area vs. HRES Performance and Cost
0
100
200
300
400
40
50
60
701
2
3
4
x 105
PV Area (m2)WT & PV total sharein load satisfaction
Co
st
No PV in optimum configuration of any peak hour price assumptions.
The wind power is dominant in the desired site.
The figure shows the effect of adding PV panel on a sample for wind turbine with overall share of
45% in load satisfaction. It can be seen that by increasing the area of PV arrays from zero to 400 m2
the HRES share increases by 25% in the load demand satisfaction while the total cost of system
increases significantly
Results – Economical & Technical Aspects of Adding PV Panel
Adding 400 m2
of PV panel is capable of
adding 25% to produced
power of HRES which is
not cost effective comparing
to other configurations
without PV panel.
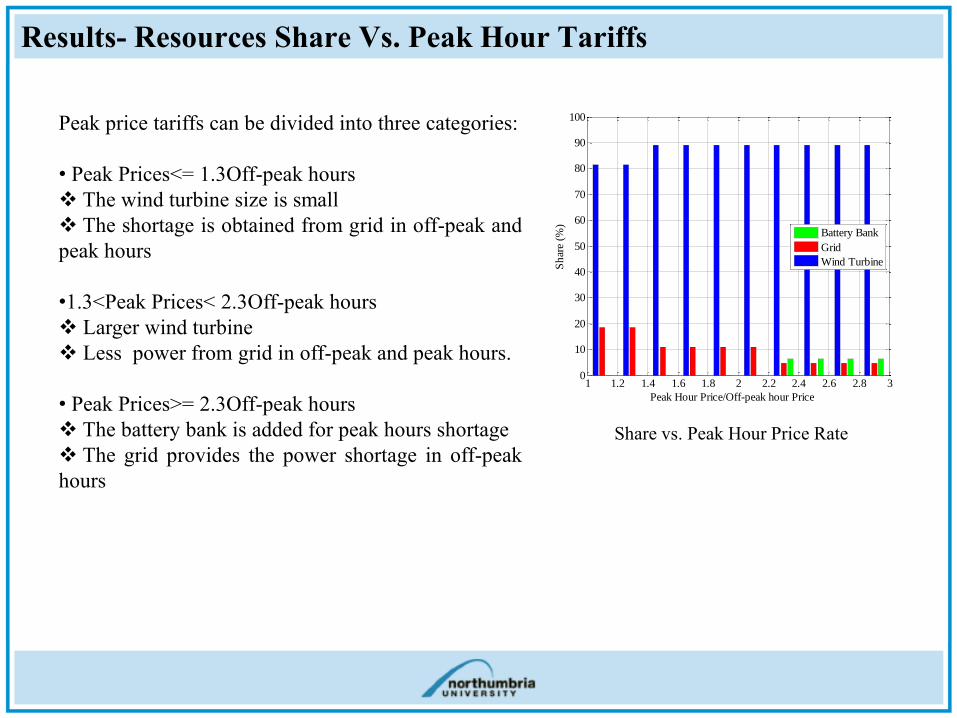
Peak price tariffs can be divided into three categories:
• Peak Prices<= 1.3Off-peak hours
The wind turbine size is small
The shortage is obtained from grid in off-peak and
peak hours
•1.3<Peak Prices< 2.3Off-peak hours
Larger wind turbine
Less power from grid in off-peak and peak hours.
• Peak Prices>= 2.3Off-peak hours
The battery bank is added for peak hours shortage
The grid provides the power shortage in off-peak
hours
Results- Resources Share Vs. Peak Hour Tariffs
Share vs. Peak Hour Price Rate
1 1.2 1.4 1.6 1.8 2 2.2 2.4 2.6 2.8 30
10
20
30
40
50
60
70
80
90
100
Peak Hour Price/Off-peak hour Price
Sh
are
(%)
Battery Bank
Grid
Wind Turbine

(1) Peak price=1.1 Off-peak (2) Peak price=1.9 Off-peak (3) Peak price= 2.3 Off-peak
5 5.25 5.5 5.75 6 6.25 6.5 6.75 7 7.25 7.5
x 104
0
10
20
30
40
50
60
70
80
90
100
Share
(%
)
Total Cost ($)
5 5.25 5.5 5.75 6 6.25 6.5 6.75 7 7.25 7.5
x 104
0
10
20
30
40
50
60
70
80
90
100
Retu
rn o
n I
nvestm
ent
(%)
Battery Share
Grid Share
Renewable Share
ROI
6.85 6.9 6.95 7 7.05 7.1 7.15 7.2 7.25
x 104
0
10
20
30
40
50
60
70
80
90
100
Sh
are
(%
)
Total Cost ($)
6.85 6.9 6.95 7 7.05 7.1 7.15 7.2 7.25
x 104
0
10
20
30
40
50
60
70
80
90
100
Retu
rn o
n I
nv
estm
en
t (%
)
Battery Share
Grid Share
Renewable Share
ROI
6.9 6.95 7 7.05 7.1 7.15 7.2 7.25 7.3 7.35 7.4 7.45 7.5
x 104
0
10
20
30
40
50
60
70
80
90
100
Sh
are
(%
)
Total Cost ($)
6.9 6.95 7 7.05 7.1 7.15 7.2 7.25 7.3 7.35 7.4 7.45 7.5
x 104
0
10
20
30
40
50
60
70
80
90
100
Retu
rn o
n I
nv
estm
en
t (%
)
Battery Share
Grid Share
Renewable Share
ROI
Comparison between two best solutions of three different Peak prices
The figure shows that at peak tariffs less than 1.5 there is no justification to add the battery
bank.
As the peak hour price increases to 1.5 times the off-peak hour the configuration with batteries
appear as the second best options yet not the best one.
The configuration with the battery bank becomes the optimum configuration when the peak
hour price reaches to 2.3 times more than the off-peak hour price.
Results- Comparison Between 2 Best Config. Of 3 Peak Hour Tariff

The produced power of each source for typical months
Hour (February)
Pow
er (W
)
0 1 2 3 4 5 6 7 8 9 10 11 1213 14 15 16 17 18 19 20 21 22 23 240
500
1000
1500
2000
2500
3000
3500
4000
Demand
WT Power
Battery Power
Grid Power
Hour (October)
Pow
er (W
)
0 1 2 3 4 5 6 7 8 9 1011 12 13 1415 16 1718 19 20 2122 23 240
500
1000
1500
2000
2500
3000
3500
4000
Demand
WT Power
Battery Power
Grid Power
Hour (November)
Pow
er (
W)
0 1 2 3 4 5 6 7 8 9 1011 12 13 14 1516 17 18 19 2021 22 23 240
500
1000
1500
2000
2500
3000
3500
4000
Demand
WT Power
Battery Power
Grid Power
Hour (December)
Pow
er (
W)
0 1 2 3 4 5 6 7 8 9 10 11 1213 14 15 16 17 1819 20 21 22 23 240
500
1000
1500
2000
2500
3000
3500
4000
Demand
WT Power
Battery Power
Grid Power
• The battery bank is used in four months of the year in which the wind speed is low.
• In other months either the wind turbine produces sufficient power or the shortage occurs in off-
peak hours and the shortage is maintained from the grid.
Results- Demand & Power Of Each Resource

• Based on desired site meteorological characteristic adding a renewable
resource may not be economically viable. (Ex. PV panels in current case study)
• Different prices at different hours requires development of new design methods
in grid-connected HRES, where the grid is required to provide electricity
during the shortage hours.
• At some grid electricity prices adding the battery may have no justification
• Adding a small storage system to cover the electricity shortage during peak
hours can be a good solution at peak hour tariffs.
• The outcome of the design would be economically more profitable
• The HRES owner would be less dependent on the grid.
Conclusions
Thank You.