optimal sizing of isolated microgrid containing
TRANSCRIPT

Research ArticleOptimal Sizing of Isolated MicrogridContaining Photovoltaic/Photothermal/Wind/Diesel/Battery
Guo Zhao ,1,2 Tianhua Cao,1,2 Yudan Wang,3 Huirui Zhou,1,2 Chi Zhang,1,2
and Chenxi Wan1,2
1School of Electrical and Electronic Engineering, Hubei University of Technology, Wuhan 430068, China2Hubei Key Laboratory for High-Efficiency Utilization of Solar Energy and Operation Control of Energy Storage System,Hubei University of Technology, Wuhan 430068, China3Department of Mechanical and Electrical Engineering, Wenhua College, Wuhan 430074, China
Correspondence should be addressed to Guo Zhao; [email protected]
Received 27 January 2021; Revised 24 May 2021; Accepted 6 August 2021; Published 18 August 2021
Academic Editor: Yuanzuo Li
Copyright © 2021 Guo Zhao et al. This is an open access article distributed under the Creative Commons Attribution License,which permits unrestricted use, distribution, and reproduction in any medium, provided the original work is properly cited.
The establishment of isolated microgrid is of great significance in solving power supply problems in offshore islands or remotemountainous areas. Aiming at the isolated microgrid containing photovoltaic, photothermal, wind, diesel, and energy storage, athree-objective sizing optimization model of the microgrid is proposed considering comprehensive economy cost, deficiency ofpower supply probability (DPSP), and renewable energy discard rate (REDR). The three-objective sizing optimization modelwas solved by the improved multiobjective grey wolf optimization algorithm. An island was taken as an example to optimize thesizing of the microgrid, and the rationality of the proposed three-objective model was verified. The feasibility of the improvedmultiobjective grey wolf optimization (IMOGWO) was verified by comparing with the multiobjective grey wolf optimization(MOGWO). Three representative solution sets and a set of compromise solution sets are obtained by simulation, and the resultssatisfied the load demand. And the DPSP and the REDR are reduced by 7.55% and 6.29% by using the IMOGWO. The designedand analyzed hybrid renewable energy system model might be applicable to around the world having similar climate conditions.
1. Introduction
With the rapid development of the current society, thedemand for electrical energy is increasing. Due to the nonre-newability of fossil fuels and the increasing attention of peo-ple on the environmental protection [1], clean energy such assolar and wind energy has begun to be applied in the powergeneration system on a large scale. Microgrid has attractedpeople’s attention because of its green and convenient fea-tures. Microgrid is usually a small generation and distribu-tion system composed of distributed power sources, energystorage devices, energy conversion devices, and loads, and ithas broad development prospects because it can improvethe flexibility of the grid and reliability of power supply [2,3]. It is worth studying that how to configure the size of the
distributed power supply to meet the load demand and min-imize the comprehensive economic cost, deficiency of powersupply probability, and renewable energy discard rate.
The optimization of microgrid capacity has been widelystudied. Ref. [4] established a microgrid containing wind, pho-tovoltaic, energy storage, and fuel cells. A multi-objective opti-mization model of annual investment cost, CO2 emissions,and converter loss of microgrid was established consideringelectrothermal coupling. Multiobjective particle swarm opti-mization was used to solve the problem. Ref. [5] establisheda microgrid containing wind, photovoltaic, and energy stor-age. The environmental impact was converted into economicindex and added into the comprehensive economic cost toform a single objective function. The improved bacterialforaging algorithm was used to solve the problem. Ref. [6]
HindawiInternational Journal of PhotoenergyVolume 2021, Article ID 5566597, 19 pageshttps://doi.org/10.1155/2021/5566597

established a microgrid containing wind, photovoltaic, andenergy storage. The objective function is modified by theself-adaptive penalty method. The hybrid quantum geneticalgorithm was used to solve the problem. Ref. [7] establisheda microgrid containing wind, photovoltaic, and energy stor-age. A two-layer optimization model of energy storagesystem capacity investment costs and microgrid operatingcosts was established considering the coupling effects ofmultitime-scale uncertainties. The compound differentialevolution algorithm was used to solve the problem. Ref. [8]established a microgrid containing wind, photovoltaic,energy storage, and diesel generator. An optimization alloca-tion idea of microgrid capacity was proposed based on sensi-tivity analysis. Taking economy as the objective function, thenondominated sorting genetic algorithm was used to obtainthe optimal result. Ref. [9] established a microgrid containingwind, photovoltaic, and energy storage. The firefly-inspiredalgorithm was used to solve the problem considering thestandard of load dissatisfaction rate, power reliability, andsystem cost indicators. The effectiveness of the algorithm isverified by a practical example. Ref. [10] established a micro-grid containing wind, photovoltaic, energy storage, and dieselgenerator. The comprehensive economic cost, renewableenergy power generation rate, and pollutant emissions wereconverted into a single objective function through the linearweighting method. The genetic algorithm was used to solvethe problem. Ref. [11] established a microgrid containingwind, photovoltaic, energy storage, and diesel generator.Taking comprehensive economic cost and power supply reli-ability as the dual optimization goals, the grasshopper opti-mization algorithm was used to solve the problem. Thesuperiority of the algorithm was verified by comparing withthe cuckoo search algorithm and the particle swarm optimi-zation. Ref. [12] established a multienergy microgrid withwind, photovoltaic, energy storage, and diesel generator andbiomass. Taking comprehensive economic costs and envi-ronmental protection factors as the dual optimization goals,ant colony optimization was used to solve the problem. Thefeasibility of the proposed algorithm is verified by comparingwith genetic algorithm and particle swarm optimization. Ref.[13] takes a rural medical center in Nigeria as an example toestablish a microgrid containing wind, photovoltaic, energystorage, and diesel generator. Taking economic cost as theoptimization objective, HOMER is used for optimizationsimulation to get the optimal results. Ref. [14] used the linearweighting method to convert the economic cost, voltage devi-ation, and voltage stability index into a single optimizationobjective. Considering the random variation of solar radia-tion and load demand, a Modified Ant Lion Optimization(MALO) was used to get the optimal sizing of PV-DG andDSTATCOM systems.
The above researches on the optimal sizing and solutionmethods of the microgrid renewable energy power genera-tion system have gotten certain results, but there are stillsome limitations. For distributed power sources of microgrid,most researches focus on wind, photovoltaic, energy storage,and diesel generator, but there are few researches on photo-thermal power generation. Although solar photovoltaic andwind energy resources are complementary, they both have
intermittent availability. The solar thermal power generationsystem is equipped with a thermal storage system, which canstore the superheated steam output by the thermal absorberin the thermal storage system; then, it can effectively avoidexcessive energy discarding. The stored heat can be usedwhen the power generation is insufficient, which can alsoimprove the power supply reliability of system. For optimiza-tion goals, there are many researches on single optimizationobjective and dual optimization objective, but there are fewresearches on three-objective optimization problems. Thetraditional dual-objective optimization model cannot meetthe actual needs with the increasing requirements of the stateand power enterprises for renewable energy generation; so, itis necessary to add renewable energy generation rate into theoptimization objective. For optimization algorithms, mostresearches use genetic algorithm and its improved algorithmor particle swarm optimization and its improved algorithm.And the above algorithms generally have problems such asslow convergence speed, many iterations, easy to fall intolocal optimum, poor stability, and low solution accuracy.The grey wolf optimizer (GWO) has the characteristics ofsimple structure, less need to adjust the parameters, and easyimplementation. Among them, there are convergence factorsthat can be adjusted adaptively and an information feedbackmechanism, which can achieve a balance between local opti-mization and global search. It has good performance in termsof solution accuracy and convergence speed.
Therefore, this paper establishes an isolated microgridcontaining photovoltaic, photothermal, wind, diesel genera-tor, and energy storage according to the situation of windand solar resources in a certain place. And a three-objectiveoptimization model of comprehensive economic cost, defi-ciency of power supply probability, and renewable energydiscard rate is established. An improved multiobjective greywolf optimization algorithm is proposed to solve the model,and an island is taken as an example to verify the feasibilityof the proposed algorithm. The main contributions of thepaper are as follows:
(i) Establishing a microgrid system containing photo-voltaic, photothermal, wind turbine, diesel genera-tor, energy storage, and load
(ii) Proposing an optimal sizing method based onIMOGWO
(iii) The mathematical model of the optimal planningproblem is formulated as a multiobjective optimiza-tion problem that includes the comprehensive econ-omy cost, deficiency of power supply probability,and renewable energy discard rate
The rest of paper is organized as follows: Section 2 pre-sents the output model of distributed power supply. Section3 introduces the energy allocation strategy of this paper.Section 4 defines the problem formulation and the systemconstraints. Section 5 presents the mathematical formulationof GWO, MOGWO, and IMOGWO techniques. Section 6presents the numerical results. Finally, the conclusions pre-sented in Section 7.
2 International Journal of Photoenergy

2. Modeling of Microgrid Components
The microgrid topology is shown in Figure 1, which mainlyincludes photovoltaic, photothermal, wind, diesel generator,battery, and AC load [15].
2.1. PV Power Model. The actual output power of the photo-voltaic cells is related to the solar irradiation and ambienttemperature [16, 17]. The actual output power of PV can beestimated as below:
PPV tð Þ = ηVPT 1 + ρV Tr + 30ηV − TTð Þ½ �, ð1Þ
where PPV (kW) is the output power of a single PV panel. PT(W) denote the rated power of the PV module at standardtest condition, and this paper takes 100W. ηV is the ratio ofreal-time solar irradiation to solar irradiation under standardcondition, and the standard solar irradiation is generally1 kW/m2. ρV is the temperature coefficient, defined by(-0.0047/°C). TT (°C) is the referenced ambient temperature,defined by 25°C, and Tr (°C) denotes the ambienttemperature.
2.2. Wind Turbine Model. The output power of wind turbineis closely related to the wind speed, if the wind speed is toohigh or too low, it will affect the normal operation of the windturbine [18, 19]. The output power of wind turbine can beexpressed as
PWI tð Þ =0, v < vci, v > vco
av3 − bPr , vci < v < vco
Pr , vr < v < vco
8>><>>: , ð2Þ
where a = Pr/ðv3r − v3ciÞ, b = v3ci/ðv3r − v3ciÞ. PWI (kW) is the out-put power of single wind turbine. v (m/s) is the wind speed. Pr(kW) is the rated power, defined by 10kW. vci (m/s) and vr
(m/s) are the cut-in wind speed and rated wind speed, respec-tively, defined by 2.5m/s and 12m/s, respectively, and vco(m/s) is the cut-off wind speed, defined by 18m/s.
2.3. PT Power Model. The effective power output by the heatabsorber of the photothermal system is positively correlatedwith the area of the heliostats and solar irradiation [20–23].The actual output power of the photothermal system can beexpressed as follows:
PPT tð Þ = PAP tð Þ − ΔPX : ð3Þ
Among
PAP tð Þ = DNISρf ρc 1 − ξð Þ, ð4Þ
where PPT (kW) is the output power of the single photother-mal power system. S (m2) is the area of the heliostat, definedby 20m2. DNI is the real-time solar irradiation. ρf and ρc arethe plant efficiency and conversion efficiency of the helio-stats, defined by 0.66 and 0.89, respectively. ξ is the reflectiv-ity of the heat absorber surface, defined by 0.12. PAP (kW) isthe power reflected by the heliostat to the heat absorber sur-face, and ΔPX (kW) is the power loss of the heat absorber.
The power loss of the heat absorber is mainly reflectedheat loss Pref , specifically [24]
ΔPX = Pref = 1 − að ÞPAP tð Þ, ð5Þ
where α is the absorptivity on the surface of absorber tube inthe heat absorber, defined by 0.88.
2.4. Diesel Generator Model. The actual output power of die-sel generator set is related to the output power of a single die-sel generator [25, 26], which is
PDG‐total tð Þ =NDGPDG tð Þ: ð6Þ
AC bus
PV Modules
Wind turbine
Diesel generator
Photothermal generator
Battery bank
DCAC
DCAC
ACDC
ACDC
DCAC
ACDC
Load
Figure 1: Microgrid topology.
3International Journal of Photoenergy
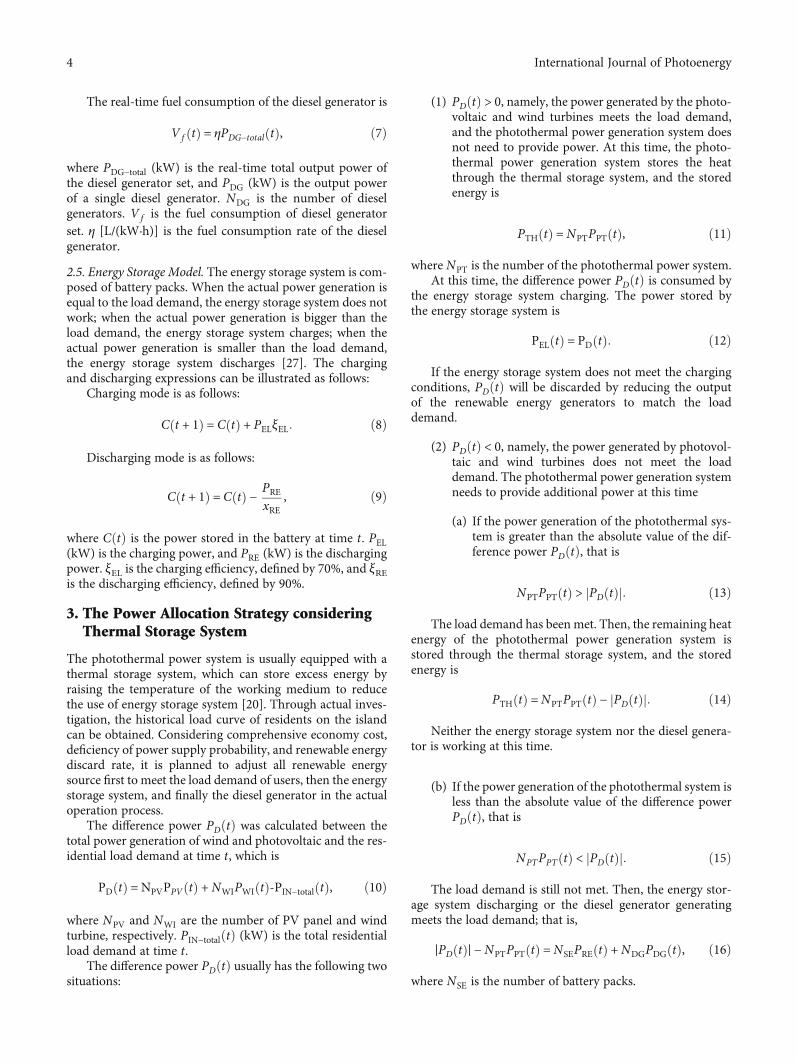
The real-time fuel consumption of the diesel generator is
V f tð Þ = ηPDG−total tð Þ, ð7Þ
where PDG−total (kW) is the real-time total output power ofthe diesel generator set, and PDG (kW) is the output powerof a single diesel generator. NDG is the number of dieselgenerators. V f is the fuel consumption of diesel generatorset. η [L/(kW·h)] is the fuel consumption rate of the dieselgenerator.
2.5. Energy Storage Model. The energy storage system is com-posed of battery packs. When the actual power generation isequal to the load demand, the energy storage system does notwork; when the actual power generation is bigger than theload demand, the energy storage system charges; when theactual power generation is smaller than the load demand,the energy storage system discharges [27]. The chargingand discharging expressions can be illustrated as follows:
Charging mode is as follows:
C t + 1ð Þ = C tð Þ + PELξEL: ð8Þ
Discharging mode is as follows:
C t + 1ð Þ = C tð Þ − PRExRE
, ð9Þ
where CðtÞ is the power stored in the battery at time t. PEL(kW) is the charging power, and PRE (kW) is the dischargingpower. ξEL is the charging efficiency, defined by 70%, and ξREis the discharging efficiency, defined by 90%.
3. The Power Allocation Strategy consideringThermal Storage System
The photothermal power system is usually equipped with athermal storage system, which can store excess energy byraising the temperature of the working medium to reducethe use of energy storage system [20]. Through actual inves-tigation, the historical load curve of residents on the islandcan be obtained. Considering comprehensive economy cost,deficiency of power supply probability, and renewable energydiscard rate, it is planned to adjust all renewable energysource first to meet the load demand of users, then the energystorage system, and finally the diesel generator in the actualoperation process.
The difference power PDðtÞ was calculated between thetotal power generation of wind and photovoltaic and the res-idential load demand at time t, which is
PD tð Þ = NPVPPV tð Þ +NWIPWI tð Þ‐PIN−total tð Þ, ð10Þ
where NPV and NWI are the number of PV panel and windturbine, respectively. PIN−totalðtÞ (kW) is the total residentialload demand at time t.
The difference power PDðtÞ usually has the following twosituations:
(1) PDðtÞ > 0, namely, the power generated by the photo-voltaic and wind turbines meets the load demand,and the photothermal power generation system doesnot need to provide power. At this time, the photo-thermal power generation system stores the heatthrough the thermal storage system, and the storedenergy is
PTH tð Þ =NPTPPT tð Þ, ð11Þ
where NPT is the number of the photothermal power system.At this time, the difference power PDðtÞ is consumed by
the energy storage system charging. The power stored bythe energy storage system is
PEL tð Þ = PD tð Þ: ð12Þ
If the energy storage system does not meet the chargingconditions, PDðtÞ will be discarded by reducing the outputof the renewable energy generators to match the loaddemand.
(2) PDðtÞ < 0, namely, the power generated by photovol-taic and wind turbines does not meet the loaddemand. The photothermal power generation systemneeds to provide additional power at this time
(a) If the power generation of the photothermal sys-tem is greater than the absolute value of the dif-ference power PDðtÞ, that is
NPTPPT tð Þ > PD tð Þj j: ð13Þ
The load demand has been met. Then, the remaining heatenergy of the photothermal power generation system isstored through the thermal storage system, and the storedenergy is
PTH tð Þ =NPTPPT tð Þ − PD tð Þj j: ð14Þ
Neither the energy storage system nor the diesel genera-tor is working at this time.
(b) If the power generation of the photothermal system isless than the absolute value of the difference powerPDðtÞ, that is
NPTPPT tð Þ < PD tð Þj j: ð15Þ
The load demand is still not met. Then, the energy stor-age system discharging or the diesel generator generatingmeets the load demand; that is,
∣PD tð Þ∣ −NPTPPT tð Þ =NSEPRE tð Þ +NDGPDG tð Þ, ð16Þ
where NSE is the number of battery packs.
4 International Journal of Photoenergy

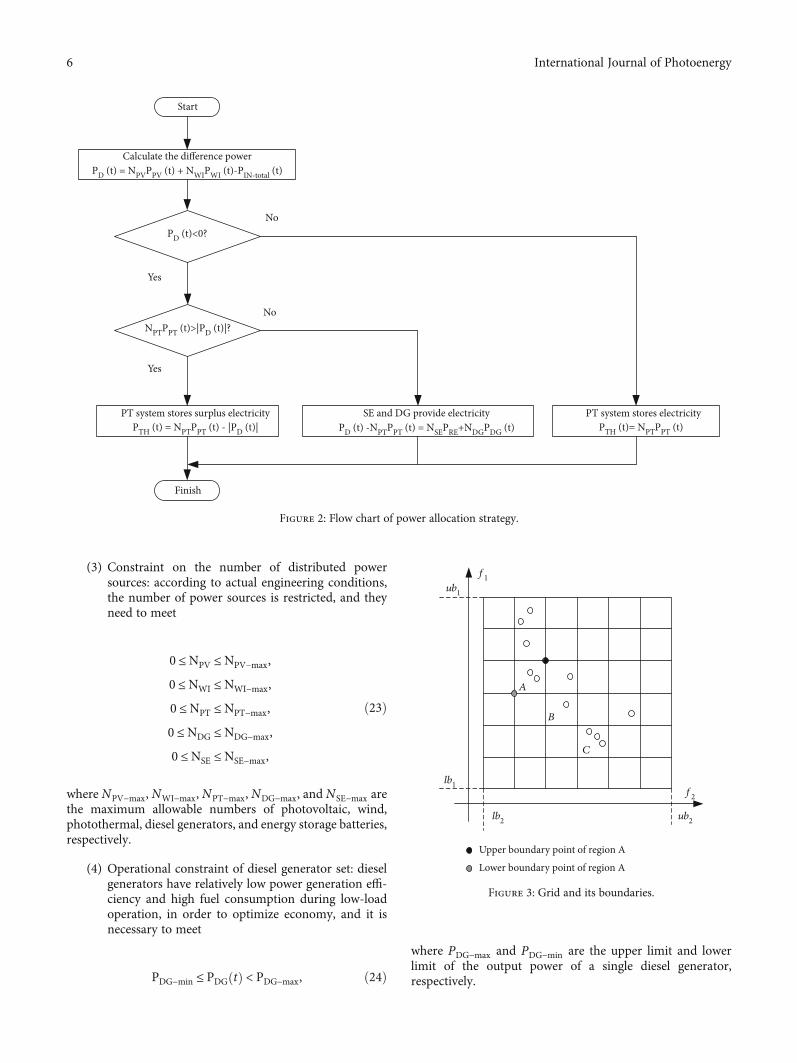
Specific to the power allocation of the energy storagesystem and the diesel generator, according to the converterrated capacity, SOC state, and discharging depth of batte-ries, the maximum power that can be discharged is deter-mined first; then, the insufficient part will be supplementedby the diesel generator. The flow chart of power allocationstrategy considering the thermal storage system is shown inFigure 2.
4. Formulation of Optimization Problem
4.1. Objective Function
(1) Comprehensive economic cost (CEC): it consists ofthe initial purchase costs, displacement costs, oper-ational and maintenance costs, and fuel costs of allkinds of distributed power sources. The life span ofphotovoltaic, wind turbine, and photothermal islong; so, they only need to consider the initial pur-chase costs and operational and maintenance costs.This paper establishes the optimization goal withthe lowest comprehensive economic cost, that is,
min Ctotal =η 1 + ηð Þy1 + ηð Þy − 1
Cp + Cr
� �+ Cm + Cf ð17Þ
where η denotes depreciation rate, defined by 5%. ydenotes the system life span, defined by 20 years, typicallyequal to the life span of the PV panels, wind turbine, andphotothermal. Cp (¥), Cr (¥), Cm (¥), and Cf (¥) are thetotal initial purchase cost, displacement cost, operational,and maintenance cost and fuel cost of the equipment inthe microgrid, respectively.
The specific costs are shown in Equation (18):
Cp = NPVCp‐PV + NWICp‐WI + NPTCp‐PT + NDGCp‐DG
+ NSECp‐SE,
Cr = NDGCr‐DG + NSECr‐SE,
Cm = NPVCm‐PV + NWICm‐WI + NPTCm‐PT + NDGCm‐DG+ NSECm‐SE,
Cf =ðt0NDGCf‐fuelV f tð Þdt,
ð18Þ
where Cp−PV, Cp−WI, Cp−PT, Cp−DG, and Cp−SE are, respec-tively, the initial purchase costs of photovoltaic, wind tur-bines, photothermal, diesel generators, and energy storagebatteries. Cr−DG and Cr−SE are the displacement costs of dieselgenerators, and energy storage batteries, respectively. Cm−PV,Cm−WI, Cm−PT, Cm−DG, and Cm−SE are the operational andmaintenance costs of photovoltaic, wind turbines, photother-
mal, diesel generators, and energy storage batteries, respec-tively. Cf−fuel (¥/L) is the fuel unit price of a diesel generator.
(2) Deficiency of power supply probability (DPSP): it isan indicator to measure the power supply reliability.Namely the smaller the deficiency of power supplyprobability is, the higher the power supply reliabilityis. This paper establishes the optimization goal withthe smallest of deficiency of power supply probabil-ity, that is,
min DPSP =∑t
0Pdef tð ÞPload
, ð19Þ
where Pdef ðtÞ (kW) is the power shortage of the system attime t. Pload (kW) is the total load power of the system.
(3) Renewable energy discard rate (REDR): the energydiscard rate ρREDR is used to measure the renewableenergy utilization rate. Namely, the smaller theenergy discard rate is, the higher the renewableenergy utilization rate is. This paper establishes theoptimization goal with the smallest of renewableenergy discard rate, that is,
min ρREDR =∑t
0Pdisc tð ÞPre
, ð20Þ
where PdiscðtÞ (kW) is the renewable energy generation dis-carded at time t. Pre (kW) is the total renewable energygeneration.
4.2. Constraints
(1) System power balance constraint: in order to meetthe load demand, ensure stable operation of the sys-tem, and maintain the balance of input and outputpower of the microgrid, it is needed to meet
NPVPPV tð Þ +NWIPWI tð Þ +NPTPPT tð Þ +NDGPDG tð Þ +NSEPRE tð Þ= PIN−total tð Þ +NSEPEL tð Þ:
ð21Þ
(2) Operational constraint of the energy storage system:in order to improve the utilization rate of the batterypack and extend its life span, it needs to meet
Cmin t + 1ð Þ ≤ C t + 1ð Þ ≤ Cmax t + 1ð Þ, ð22Þ
where Cmaxðt + 1Þ and Cminðt + 1Þ being the maximum andminimum storage energies allowed, defined by 100% and20%, respectively.
5International Journal of Photoenergy
(3) Constraint on the number of distributed powersources: according to actual engineering conditions,the number of power sources is restricted, and theyneed to meet
0 ≤NPV ≤NPV−max,
0 ≤NWI ≤NWI−max,
0 ≤NPT ≤NPT−max,
0 ≤NDG ≤NDG−max,
0 ≤NSE ≤NSE−max,
ð23Þ
where NPV−max, NWI−max, NPT−max, NDG−max, and NSE−max arethe maximum allowable numbers of photovoltaic, wind,photothermal, diesel generators, and energy storage batteries,respectively.
(4) Operational constraint of diesel generator set: dieselgenerators have relatively low power generation effi-ciency and high fuel consumption during low-loadoperation, in order to optimize economy, and it isnecessary to meet
PDG−min ≤ PDG tð Þ < PDG−max, ð24Þwhere PDG−max and PDG−min are the upper limit and lowerlimit of the output power of a single diesel generator,respectively.
Start
Calculate the difference powerPD (t) = NPVPPV (t) + NWIPWI (t)-PIN-total (t)
PD (t)<0?
SE and DG provide electricityPD (t) -NPTPPT (t) = NSEPRE+NDGPDG (t)
NPTPPT (t)>|PD (t)|?
Yes
PT system stores surplus electricityPTH (t) = NPTPPT (t) - |PD (t)|
Yes
Finish
No
PT system stores electricityPTH (t)= NPTPPT (t)
No
Figure 2: Flow chart of power allocation strategy.
f1
f2
ub2
lb1
lb2
Upper boundary point of region A
Lower boundary point of region A
A
B
C
ub1
Figure 3: Grid and its boundaries.
6 International Journal of Photoenergy

5. Improved Grey Wolf Optimizer
5.1. Grey Wolf Optimizer. The Grey Wolf Optimizer (GWO)simulates the predation process of wolves with strict socialdominant hierarchy in nature. The optimization search isachieved through processes such as “tracking,” “encircling,”“hunting,” and “attacking” the prey [28]. It has beenresearched and applied in many fields because of its simplesearch principle, fast convergence speed, and good perfor-mance. However, the solution obtained by the GWO is grad-ually approaching the current optimal solution; so, thediversity of paretooptimal solution obtained is low. In theGWO, the current optimal three solutions are recorded as αwolf, β wolf, and δ wolf, and other individual wolves huntprey with the guidance of the three leader wolves. The mainphases of grey wolf hunting are as follows:
Dα,β,δ = CXp tð Þ − Xj tð Þ�� ��, p = α, β, δ, ð25Þ
Xj t + 1ð Þ = Xα tð Þ‐ADαð Þ + Xβ tð Þ‐ADβ
� �+ 1/3 Xδ tð Þ‐ADδð Þ� �
,
ð26ÞC = 2r1, ð27ÞA = 2ar2 − a, ð28Þ
a = 2 −2t
Max iter, ð29Þ
where t indicates the current iteration. XjðtÞ is the position oftth generation grey wolf individual, and XpðtÞ is the currentposition of prey. r1 and r2 are random numbers in [0 1].Max_iter is the maximum number of iterations, and A andC are swing factors.
5.2. Multiobjective Grey Wolf Optimization. In order to applythe GWO to the multiobjective optimization problems and
make it a better performance, relevant researchers intro-duced the Archive (external population) into the GWO tostore the nondominated optimal solution [29]. The leadersα wolves, β wolves, and δ wolves in the predation processfrom the Archive are selected by adopting the leader wolvesselection strategy. The algorithm can carry out jump searchin space to increase the diversity of population by integratingdifferential evolution mechanism. The algorithm can alsoadapt to the multiobjective function in various situations toincrease the flexibility of the algorithm by integrating greedymechanism [30]. Thus, a multiobjective grey wolf optimiza-tion (MOGWO) is formed.
5.2.1. External Population and Leader Wolves SelectionStrategy. Each iteration of the algorithm will generate newindividuals. When individuals want to join the Archive, theseindividuals will be compared with the individuals in theArchive one by one, and then they can be added accordingto certain rules.
Stored all the nondominated optimal solutions in theArchive, the leader wolves are selected from the Archive byroulette [30]. In order to enhance the search performanceof the GWO, the probability of any individual being selectedcan be calculated by equation (30):
Pj =CNj
, ð30Þ
where C indicates a constant, whose value is greater than1. Nj is the total number of individuals in this individual’sgroup.
5.2.2. Differential Evolution Mechanism. The differential evo-lution algorithm is improved from the genetic algorithm. Thealgorithm can carry out jump search in space to increase thediversity of population by using the individual difference
400 600 800 1000
2
1.8
1.6
1.4
1.2
1
0.8
0.6
0.4
0.2
00
Improved a
Unimproved a
200
Figure 4: Convergence factor change curve.
7International Journal of Photoenergy

between the leader wolves. Because α, β, and δ wolves aredifferent wolves selected from the Archive, each leader wolfcan be updated to obtain 3 positions that can be selected byindividual wolves through the differential strategy plus theoriginal solution generated by each 1/3 weight, and the leaderwolf can provide 4 candidate solutions, specific as follows:
Xj1 t + 1ð Þ = u Xα tð Þ‐ADαð Þ + k Xβ tð Þ‐ADβ
� �‐ Xδ tð Þ‐ADδð Þ� �
,ð31Þ
Xj2 t + 1ð Þ = u Xβ tð Þ‐ADβ
� �+ k Xα tð Þ‐ADαð Þ‐ Xδ tð Þ‐ADδð Þð Þ,
ð32Þ
Xj3 t + 1ð Þ = u Xδ tð Þ‐ADδð Þ + k Xα tð Þ‐ADαð Þ‐ Xβ tð Þ‐ADβ
� �� �,
ð33Þ
Xj4 t + 1ð Þ = 13
Xδ tð Þ‐ADδð Þ + Xα tð Þ‐ADαð Þ + Xβ tð Þ‐ADβ
� �� �,
ð34Þ
where u and k are differential parameters.The differential parameter u reflects the dominance of
different leader wolves, and its value is around 1. k is the dif-ferential disturbance product factor, and the value range is [01], which is generally smaller than the parameter u. In orderto balance global performance and local exploration ability,the differential parameter k is dynamically adjusted accord-ing to individual wolf information, and the adjustment equa-tion is as follows:
k = k0 + q1‐q2ð Þ Sj1‐ Sj2 + Sj3/2� �
Sj4 ∗ Sj2 + Sj3/2� � , ð35Þ
Start
Input the load situation and the environmental data
Initialize the wolf pack
Solve the non-dominated solution and update the archive
Select 3 leader wolves through the grid method
According to Eq.(25) to (28) and (31) to (34) solve the 4 candidate solutions
According to Eq.(36) update position and archive
Reached the max iteration?
Output the non-dominated solution of the archive
Finish
According to Eq.(35) and Eq.(38) solve the values of parameters k and a
No
Yes
Figure 5: Algorithm optimization flow chart.
8 International Journal of Photoenergy
where Sjm is the weighted sum of the objective function valuesof new position generated by the current individual, and aftersorting, Sj1 < Sj2 < Sj3 < Sj4. Parameter k0 is the base value of k,and parameters q1 and q2 are the impact factors of k0.
Equation (35) dynamically adjusts the parameter k of dif-ferential evolution, if the current 4 individual differences aresmall, the larger the k is; then, next time, the differential dis-turbance is increased, and the globality is strengthened toexplore more solutions. Otherwise, if the differences arelarge, then the local precision development is carried out byreducing the differential disturbance.
5.2.3. Greedy Mechanism. Through equations (31) to (34),the individual wolves produce 4 candidate solutions, whichare selected by the weighted summation of the nondomi-nated solution and the objective function to ensure the excel-lent rate of the population. In addition, the original algorithmcan adapt to multiple objective functions in different situa-tions to increase the flexibility of the algorithm by introduc-ing weight summation. Details are as follows:
(1) Find out the nondominant solution among the 4solutions of individual wolf
00.2
0.40.6
00.2
0.40.6
0
0.1
0.2
0.3
0.4
0.5
0.6
f1 (x)f2 (x)
f 3 (x
)
(a) DTLZ1 using NSGA-II
00.2
0.40.6
00.2
0.40.6
0
0.1
0.2
0.3
0.4
0.5
0.6
f1 (x)f2 (x)f 3
(x)
(b) DTLZ1 using MOGWO
00.2
0.40.6
00.2
0.40.6
0
0.1
0.2
0.3
0.4
0.5
0.6
f1 (x)f2 (x)
f 3 (x
)
(c) DTLZ1 using IMOGWO
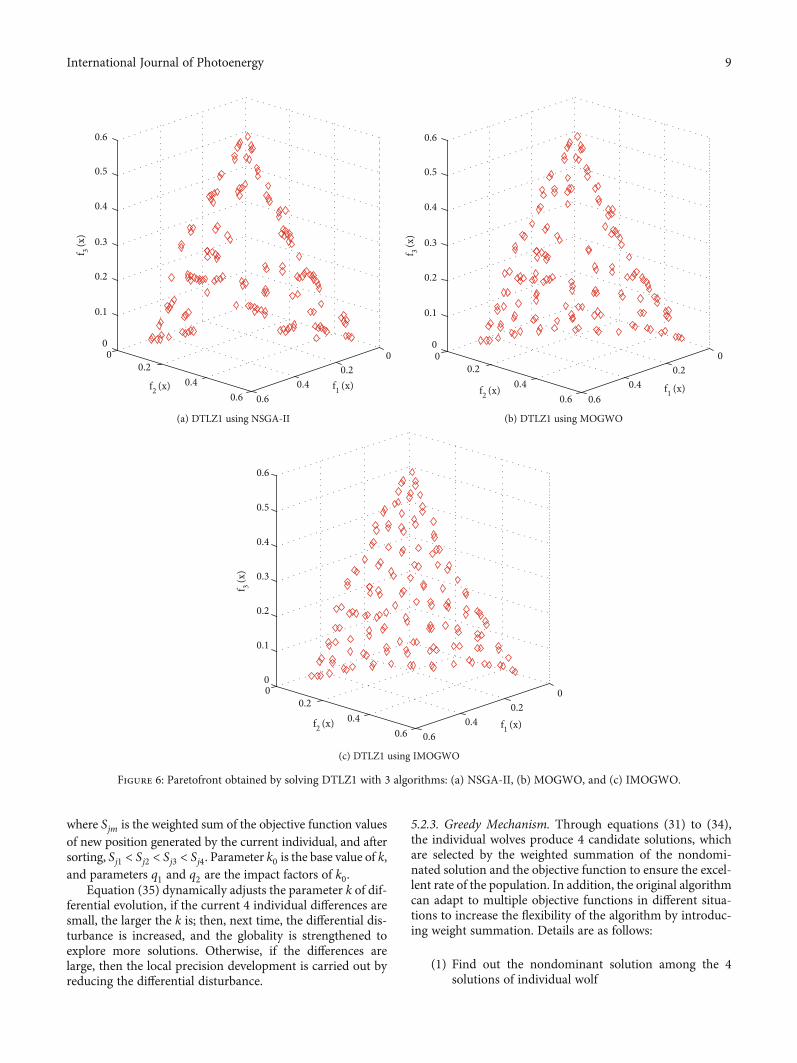
Figure 6: Paretofront obtained by solving DTLZ1 with 3 algorithms: (a) NSGA-II, (b) MOGWO, and (c) IMOGWO.
9International Journal of Photoenergy

0
0.51
1.5
00.5
11.5
0
0.2
0.4
0.6
0.8
1
1.2
f1 (x)
f 3 (x
)
f2 (x)
(a) DTZL2 using NSGA-II
f1 (x)
f 3 (x
)
f2 (x)
0
0.51
1.5
00.5
11.5
0
0.2
0.4
0.6
0.8
1
1.2
(b) DTZL2 using MOGWO
f1 (x)
f 3 (x
)
f2 (x)
0
0.51
1.5
00.5
11.5
0
0.2
0.4
0.6
0.8
1
1.2
(c) DTZL2 using IMOGWO
Figure 7: Paretofront obtained by solving DTLZ2 with 3 algorithms: (a) NSGA-II, (b) MOGWO, and (c) IMOGWO.
Table 1: Comparison of performance indicators of 3 algorithms.
Algorithm (problem)GD HV Δ
Mean Variance Mean Variance Mean Variance
NSGA-II(DTLZ1) 0.1947 0.1593 0.6873 0.0503 0.8596 0.0238
MOGWO(DTLZ1) 0.0539 0.0398 0.7211 0.0551 0.7012 0.0162
IMOGWO(DTLZ1) 0.0254 0.0512 0.7583 0.0422 0.5125 0.0089
NSGA-II(DTLZ2) 0.2197 0.4364 0.6242 0.0754 0.9649 0.1332
MOGWO(DTLZ2) 0.0215 0.0237 0.6754 0.0609 0.8797 0.2505
IMOGWO(DTLZ2) 0.0182 0.0218 0.7005 0.0794 0.5014 0.0218
10 International Journal of Photoenergy

Table 2: The relevant parameters of distributed power sources.
SourcesRated
capacity/kWInitial purchasecost/(¥/kW)
Installedcost/(¥/kW)
Operational andmaintenance cost/(¥/kW)
Fuel cost/(¥/(kW·h)) Lifespan/years
PV 0.1 5200 1500 14 0 20
WT 80 2800 3200 6 0 20
PT 100 5000 4000 5 0 20
DG 60 300 570 27 1.45 10
BAT 50(KW·h) 1100 200 7 0 10
1.20
1.00
0.80
0.60
Sola
r rad
iatio
n (k
W/m
2 )
0.40
0.20
0.001 51 101 151 201
Time251 301 351
(a)
12
10
Win
d sp
eed
(m/s
)
8
6
4
2
01 51 101 151 201
Time251 301 351
(b)
1400
1200
1000
800
600
Load
(kW
)
400
200
01 51 101 151 201
Time251 301 351
(c)
Figure 8: Environmental data and residential load curve. (a) Solar radiation curve. (b) Wind speed curve. (c) Residential load curve.
11International Journal of Photoenergy

(2) If there are multiple nondominated solutions, theweighted summation of multiobjective functionvalues is sorted:
Sjg = 〠m
j=0wjf j xjg� �
, g = 1, 2, 3, 4ð Þ, ð36Þ
where w and j are weighted parameters, ∑mj=0wj = 0.
(3) The solution xjg with the smallest S value is selected asthe final update position of the current individual wolf
5.3. Improved Multiobjective Grey Wolf Optimization. In theMOGWO, there is a certain randomness to select the leaderwolves by roulette, and it makes the algorithm easy to fall intolocal optimum. The convergence factor has the same rate ofchange in the whole iteration process, which will cause insuf-ficient population diversity. Aiming at these weaknesses, this
paper improves the leader wolves selection strategy and con-vergence factor to form an improved multiobjective grey wolfoptimization (IMOGWO).
5.3.1. Improved Leader Wolves Selection Strategy. Stored allthe nondominated optimal solutions in the Archive, there isa certain randomness to select the leader wolves by roulette.If the 3 leader wolves chosen are close to each other, thesearching ability of the algorithm will be weakened and easilyfall into the local optimum. In order to improve the explora-tion ability of the algorithm and make the population distri-bution more uniform, this paper use grid method to selectleader wolves from the Archive (including α wolves, βwolves, and δ wolves).
For an optimization problem with r objectives, a gridwith 2r boundaries is set: lower bound (lbk) and upper bound(ubk) (k = 1, 2,..., r). A grid can be divided into several smallregions (called HC: hypercube), and the number of divisionsis determined by the population size and the number of opti-mization objectives. Denote each HC as ri, where i = ði1, i2,
800.5 60.4
0.1
×106
0.3 40.2
0.2
20.1
0.3
00
(a)
8
60 ×106
40.5
0.1
0.4 0.3 2
0.2
0.2 0.1
0.3
00
0.4
(b)
800.5 6
0.1
0.4 ×10⁶
40.3
0.2
0.2 2
0.3
0.1
0.4
00
(c)
Figure 9: Paretooptimal fronts obtained by 3 algorithms. (a) NSGA-II optimization results. (b)MOGWO optimization results. (c) IMOGWOoptimization results.
12 International Journal of Photoenergy
⋯, irÞ, and ik∈1..d, d is a constant, representing the numberof divisions in each dimension, which is generally a naturalnumber greater than 2. In Figure 3, d = 6. Then, the boundaryof each ri can be expressed as
∀k ∈ 1::r; ;
rubk, i = lbk + ik/dð Þ ubk − lbkð Þ½ � ⋅ ωk,rlbk, i = lbk + ik − 1ð Þ/dð Þ ubk − lbkð Þ½ � ⋅ ωk,
ð37Þ
where ωk is the width of each small region in the kth dimen-sion, ωk = rangek/d, and rangek is the field width in the kthdimension.
With the grid and the identification of each small regionin the grid, it can be judged whether an individual falls in acertain area. Suppose there is an individual Z = ðz1, z2,⋯,zrÞ, for the area ri, if ∀k ∈ 1⋯ r, zk ≥ rlbk, i, and zk < rubk, i, then individual Z is considered to be in region ri.
The grey wolves in the Archive are ranked from high tolow in terms of excellence, and the top 3 individual wolvesare selected to judge whether there are individual wolves inthe same grid. If there are, one or two of them will beremoved, and then the fourth excellent individual is selectedin the Archive to judge until the 3 individual wolves are indifferent grids; next, the 3 individual wolves are α wolf, βwolf, and δ wolf, respectively.
In Figure 2, there are 2 individuals in region A, 1 individ-ual in region B, and 3 individuals in region C. In order tomaintain the uniform distribution of the evolutionary popu-lation, the individuals with high aggregation density in thegrid should be deleted, such as deleting 1 individual in regionA and 2 individuals in region C.
5.3.2. Improved Convergence Factor. By equations (28) and(29), the value of ∣A ∣ is determined by the convergence fac-tor a, and a linearly decreases from 2 to 0 during the entireiteration. The convergence factor has the same rate of changein the whole iteration process, too fast convergence speed inthe early stage of the iteration will lead to a smaller searchrange and insufficient population diversity, and too slow con-vergence speed in the later stage of the iteration will result inlower algorithm solving efficiency [29]. So, the convergencefactor needs to be improved, that is,
a = 2ln 3
∗ ln 3 − 2t
Max iter
� �3 !
: ð38Þ
Figure 4 shows the change curves of the 2 convergencefactors. Through comparison, the use of nonlinear conver-gence factor in the early stage of the iteration has a slowerdecay rate, which can expand the global search range and
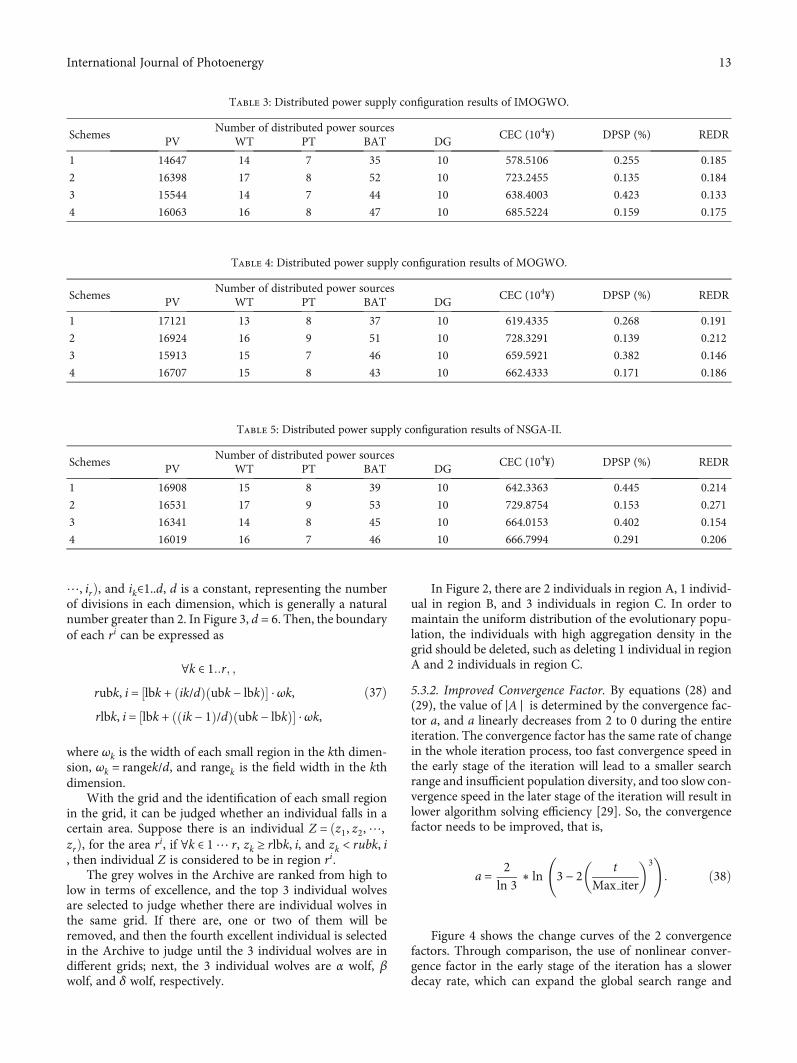
Table 3: Distributed power supply configuration results of IMOGWO.
SchemesNumber of distributed power sources
CEC (104¥) DPSP (%) REDRPV WT PT BAT DG
1 14647 14 7 35 10 578.5106 0.255 0.185
2 16398 17 8 52 10 723.2455 0.135 0.184
3 15544 14 7 44 10 638.4003 0.423 0.133
4 16063 16 8 47 10 685.5224 0.159 0.175
Table 4: Distributed power supply configuration results of MOGWO.
SchemesNumber of distributed power sources
CEC (104¥) DPSP (%) REDRPV WT PT BAT DG
1 17121 13 8 37 10 619.4335 0.268 0.191
2 16924 16 9 51 10 728.3291 0.139 0.212
3 15913 15 7 46 10 659.5921 0.382 0.146
4 16707 15 8 43 10 662.4333 0.171 0.186
Table 5: Distributed power supply configuration results of NSGA-II.
SchemesNumber of distributed power sources
CEC (104¥) DPSP (%) REDRPV WT PT BAT DG
1 16908 15 8 39 10 642.3363 0.445 0.214
2 16531 17 9 53 10 729.8754 0.153 0.271
3 16341 14 8 45 10 664.0153 0.402 0.154
4 16019 16 7 46 10 666.7994 0.291 0.206
13International Journal of Photoenergy

ensure population diversity, and the faster decay rate in thelater stage of the iteration can improve the solution efficiencyto adapt to local development.
5.3.3. Algorithm Flow. The flowchart of solving the problemusing the IMOGWO is shown in Figure 5, and the detailedoptimization process is as follows:
(1) Input the load situation and the environmental datasuch as irradiation intensity, wind speed, tempera-ture of the research site, and input the economicand technical parameters of each component of theresearch object
(2) Initialize the wolf pack, set the Archive, configure thealgorithm parameters and differential parameters,and determine the maximum number of iterationsMax_iter
(3) Solve the nondominated optimal solution of contem-porary wolves and update the Archive
(4) According to equations (35) and (38), solve thevalues of the contemporary initialization parametersk and a and select 3 individual leader wolves fromthe Archive through the grid method
(5) According to equations (25)–(28) and (31)–(34),solve the 4 candidate solutions of the current individ-ual leader wolves
(6) Solve the nondominant solutions among the candi-date solutions, adopt the greedy mechanism and sortthem according to equation (36), and select the bestupdate position of each wolf
(7) According to the rules, add the nondominated solu-tion to the Archive. If the population is full, removepart of the solutions in the Archive
2000
1500
1000
500
Pow
er (k
W)
0
–500
–1000
–15001 51 101 151 201
Time251 301 351
LoadPVPT
WIBATDG
Figure 10: Annual distributed power output and load of microgrid.
1200
900
600
Pow
er (k
W)
300
0
–300
–600
–9000 5 10
Time (h)15 20 24
LoadPVPT
WIBATDG
Figure 11: Typical daily distributed power supply output and load of microgrid.
14 International Journal of Photoenergy
(8) Judge whether the maximum number of iterations hasbeen reached, if so, the algorithm will end and outputthe nondominated solution of the Archive. Otherwise,return to step 4 and continue to execute the algorithm
5.3.4. Algorithm Performance Test. Standard multiobjectivetest functions DTLZ1 and DTLZ2 are used to test the perfor-mance of the IMOGWO and compared with the NSGA-IIand the MOGWO. The generation distance (GD), hypervo-lume (HV), and diversity (Δ) are selected as the performanceindicators of the algorithm, and the convergence indicatorand diversity indicator are used to evaluate the results ofthe algorithm.
Test functions are as follows:
(1) DTLZ1:
min f1 xð Þ = 0:5x1x2 1 + g xð Þð Þ,min f2 xð Þ = 0:5x1 1 − x2ð Þ 1 + g xð Þð Þ,min f3 xð Þ = 0:5 1 − x1ð Þ 1 + g xð Þð Þ,
g xð Þ = 〠12
i=3xi − 0:5ð Þ2 − cos 20p xi − 0:5ð Þð Þ,
S:T: 0£xi£1 i = 1, 2,⋯, 12ð Þ:
8>>>>>>>>>><>>>>>>>>>>:
ð39Þ
1.20
1.00
0.80
Sola
r rad
iatio
n (k
W/m
2 )
0.60
0.40
0.20
0.001 51 101 151 201
Time251 301 351
(a)
201816141210
8
Win
d sp
eed
(m/s
)
6420
1 51 101 151 201Time
251 301 351
(b)
1600
1400
Pow
er (k
W)
1200
1000
800
600
400
200
01 51 101 151 201
Time251 301 351
(c)
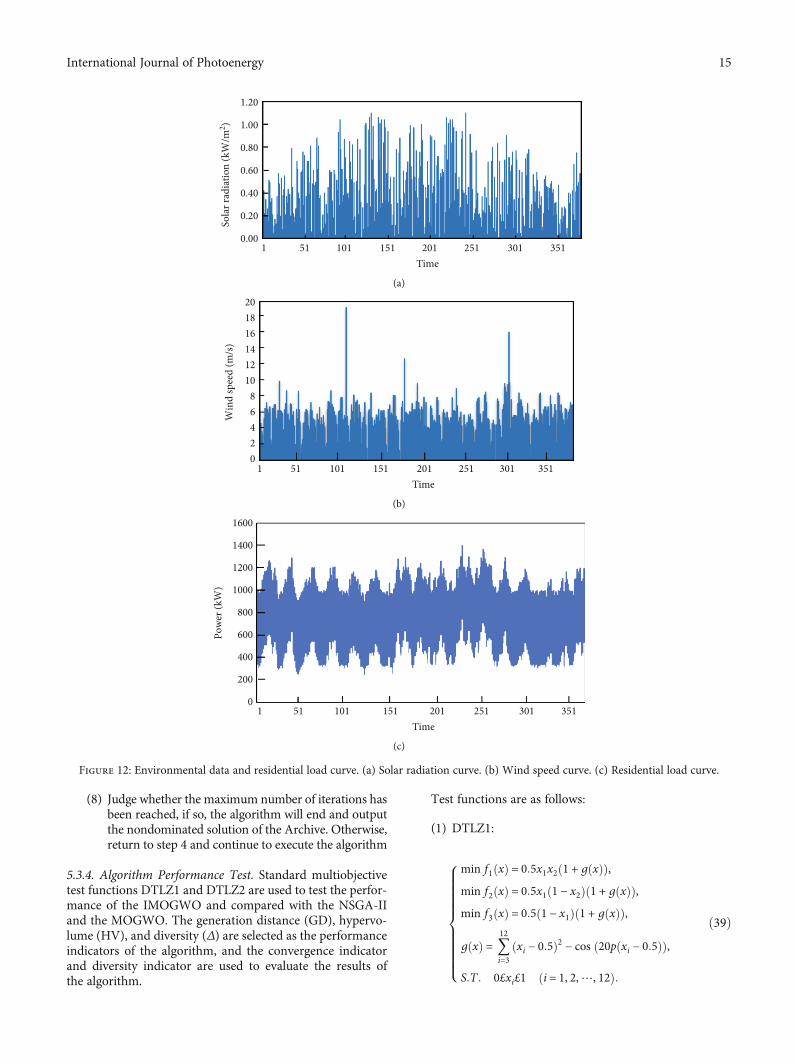
Figure 12: Environmental data and residential load curve. (a) Solar radiation curve. (b) Wind speed curve. (c) Residential load curve.
15International Journal of Photoenergy

Paretooptimal boundary corresponds to X that is xi = 0,xi ∈ XM .
(2) DTLZ2:
min f1 xð Þ = 1 + g xð Þð Þ cos x1π/2ð Þ cos x2π/2ð Þ,min f2 xð Þ = 1 + g xð Þð Þ cos x1π/2ð Þ sin x2π/2ð Þ, min f3 xð Þ = 1 + g xð Þð Þ sin x1π/2ð Þ,
g xð Þ = 〠12
i=3xi − 0:5ð Þ2,
S:T: 0 ≤ xi ≤ 1 i = 1, 2,⋯, 12ð Þ:
8>>>>>>>>>><>>>>>>>>>>:
ð40Þ
Paretooptimal boundary corresponds to X is:xi = 0, xi∈ XM .
Algorithm parameters are coded by real number systemand polynomial variation. The NSGA-II uses analog binarycrossover operator. Population size is 200, maximum num-ber of iterations is 500, crossover probability is 0.9, mutationprobability is 1/len, len is variable dimension, and the size ofthe Archive is 150. The paretofront of the obtained nondomi-nated solution is shown in Figures 6 and 7.
It can be seen from Figures 6 and 7 that all three algo-rithms can find nondominated solutions and obtain the par-etofront. Compared with the other 2 algorithms, the optimalsolution obtained by IMOGWO is distributed more uni-formly on paretofront, and local convergence of the algo-rithm can be avoided.
The quantitative analysis results of the performance ofthe three algorithms are shown in Table 1.
It can be seen from Table 1 that the IMOGWO is superiorto the MOGWO and NSGA-II in both the generation dis-tance and the hypervolume indicator, which verifies thesuperiority of the IMOGWO in solving the three-objectiveoptimization problem.
The IMOGWO can expand the search scope in the earlyiteration to enhance the diversity of the grey wolf population,while in the late iteration, it can realize rapid convergence toenhance the solving efficiency of the algorithm. In addition,the IMOGWO also has a good improvement in the conver-gence and coverage [30].
6. Case Study
6.1. Case Situation. An isolated microgrid project in a certainplace in China (The geographical coordinates are 18°10′Nand 108°57′E) is selected as the research object. The simula-tion analysis of optimal sizing is carried out according to theannual forecast of environmental conditions and loaddemand in the area. Table 2 shows the relevant parametersof distributed power sources. And Figure 8 shows theweather data and common loads of the place in a certain year.The weather data comes from the China Greenhouse DataSharing Platform [31].
6.2. Case Analysis 1. According to the known conditions in5.1, a three-objective optimization model based on compre-hensive economic cost, deficiency of power supply probabil-ity, and renewable energy discard rate is established. In thispaper, the diesel generator does not participate in the optimalconfiguration of system capacity, and its capacity is set at60% of the average annual load as the backup power sourceof the system. Set the population size to 200, the maximumnumber of iterations to 500, and the Archive size to 150.The three-objective optimization model proposed is solvedby using the NSGA-II, the MOGWO, and the IMOGWO,respectively. The paretooptimal fronts obtained are shownin Figure 9.
It can be seen from Figure 8 that all 3 algorithms can findthe nondominated solutions and obtain paretofronts. How-ever, the distribution and convergence of the NSGA-II arethe worst, which is not suitable to solve the three-objectiveoptimization problem established in this paper. TheMOGWO and the IMOGWO can obtain more ideal optimi-zation results, and the IMOGWO has a significant improve-ment in the uniformity of the paretofront distributioncompared with the MOGWO.
Among the nondominated solutions that meet all goals,four representative solutions are selected with the lowestcomprehensive economic cost, the smallest DPSP, the smal-lest REDR, and the compromise between the 3 goals. Theoptimal configuration schemes corresponding to IMOGWO,MOGWO, and NSGA-II are shown in Tables 3–5,respectively.
It can be seen from Table 3 that the minimum compre-hensive economic cost of the system is RMB 5.785106million, the corresponding deficiency of power supply prob-ability is 0.255%, and the renewable energy discard rate is0.185. The maximum comprehensive economic cost of thesystem is RMB 7.232455 million, the corresponding defi-ciency of power supply probability is 0.135%, and the renew-able energy discard rate is 0.184. The comprehensiveeconomic cost of the system is RMB 6.384403 million, thecorresponding deficiency of power supply probability is0.423%, and the renewable energy discard rate is 0.133. Itcan be seen from Table 4 that the minimum comprehensive
01
0.1
10
0.2
8
0.3
6 ×1060.5
0.4
42
0 00.25
0.75
Figure 13: Paretooptimal fronts obtained by IMOGWO.
16 International Journal of Photoenergy

economic cost of the system is RMB 6.194335 million, thecorresponding deficiency of power supply probability is0.268%, and the renewable energy discard rate is 0.191. Themaximum comprehensive economic cost of the system isRMB 7.283291 million, the corresponding deficiency ofpower supply probability is 0.144%, and the renewableenergy discard rate is 0.212. The comprehensive economiccost of the system is RMB 6.595921 million, the correspond-ing deficiency of power supply probability is 0.382%, and therenewable energy discard rate is 0.146. It can be seen fromTable 5 that the minimum comprehensive economic cost ofthe system is RMB 6.423363 million, the correspondingdeficiency of power supply probability is 0.445%, and therenewable energy discard rate is 0.214. The maximum com-prehensive economic cost of the system is RMB 7.298754million, the corresponding deficiency of power supply prob-ability is 0.153%, and the renewable energy discard rate is0.271. The comprehensive economic cost of the system isRMB 6.640153 million, the corresponding deficiency ofpower supply probability is 0.402%, and the renewableenergy discard rate is 0.154. From the above, when therenewable energy discard rate is similar, the higher the com-prehensive economic cost of system is, the lower the defi-ciency of power supply probability is, namely, the higherthe power supply reliability is, which means that under gen-eral circumstances, high power supply reliability will come atthe high comprehensive economy cost. When the compre-hensive economic cost is similar, the smaller the deficiencyof power supply probability is, the higher the correspondingrenewable energy discard rate is. Therefore, in the overall
planning of the microgrid, it is necessary to appropriatelyevaluate and balance the relationship between comprehen-sive economic cost, deficiency of power supply probability,and renewable energy discard rate according to the actualrequirements of the planning object, and appropriate valuesfor the three are determined to avoid excessive costs.
According to Tables 3–5, compared with NSGA-II, theoptimal sizing obtained by IMOGWO andMOGWO is moreexcellent. Taking scheme 4 as an example, compared withMOGWO, although the comprehensive economy cost ofIMOGWO is higher than that of MOGWO, the DPSP andthe REDR are lower than that of MOGWO. Therefore, thefinal choice depends on the requirements of local residentsand power enterprises.
This paper selects a set of solutions in scheme 4 in Table 3for further analysis. The components that constitute thehybrid energy microgrid in this solution include 16,063 pho-tovoltaic cell panels, 16 wind generators, 8 photothermalgenerators, 47 battery packs, and 10 diesel generators.
Figure 10 shows the annual operational condition of eachdistributed power source, battery packs and load in themicrogrid, and Figure 11 shows the typical daily power out-put and load operational condition of the microgrid. It canbe seen from the figure that the power output of photovoltaicgenerator, photothermal generators, and wind generators isrelatively random, but they can also form a relatively goodcomplementarity. Through the blessing of energy storagebatteries and diesel generators, they can provide energy whenrenewable energy generating capacity is insufficient, whichcan effectively improve the stability of the microgrid system.
2000
1500
1000
500
Pow
er (k
W)
0
–500
–1000
–15001 51 101 151 201 251 301 351
Time
LoadPVPT
WIBATDG
Figure 14: Annual distributed power output and load of microgrid.
Table 6: Distributed power supply configuration results of IMOGWO.
SchemesNumber of distributed power sources
CEC (104¥) DPSP (%) REDRPV WT PT BAT DG
1 14267 18 8 39 10 636.0827 0.186 0.248
17International Journal of Photoenergy
Through the analysis of the operating conditions, it is verifiedthat the IMOGWO is feasible to solve the sizing optimizationproblem of microgrid.
6.3. Case Analysis 2. An isolated microgrid project in a cer-tain place in China (The geographical coordinates are36°10′N and 120°10′E) is selected as the research object.The simulation analysis of optimal sizing is carried outaccording to the annual forecast of environmental conditionsand load demand in the area. Figure 12 shows the weatherdata and common loads of the place in a certain year. Theweather data comes from the China Greenhouse Data Shar-ing Platform [31].
With the same conditions as in 6.2, the three-objectiveoptimization model proposed is solved by using theIMOGWO, and the paretooptimal fronts obtained are shownin Figure 13. A set of solution is obtained as shown in Table 6,and this set of solution is used for further analysis.
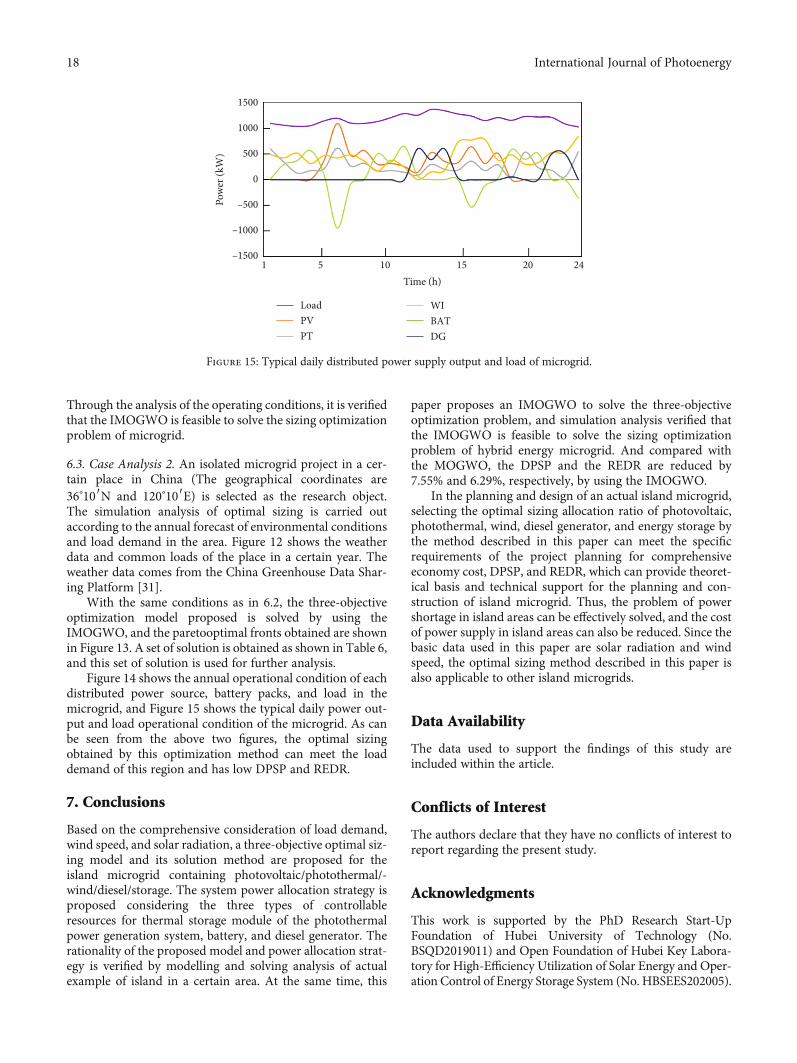
Figure 14 shows the annual operational condition of eachdistributed power source, battery packs, and load in themicrogrid, and Figure 15 shows the typical daily power out-put and load operational condition of the microgrid. As canbe seen from the above two figures, the optimal sizingobtained by this optimization method can meet the loaddemand of this region and has low DPSP and REDR.
7. Conclusions
Based on the comprehensive consideration of load demand,wind speed, and solar radiation, a three-objective optimal siz-ing model and its solution method are proposed for theisland microgrid containing photovoltaic/photothermal/-wind/diesel/storage. The system power allocation strategy isproposed considering the three types of controllableresources for thermal storage module of the photothermalpower generation system, battery, and diesel generator. Therationality of the proposed model and power allocation strat-egy is verified by modelling and solving analysis of actualexample of island in a certain area. At the same time, this
paper proposes an IMOGWO to solve the three-objectiveoptimization problem, and simulation analysis verified thatthe IMOGWO is feasible to solve the sizing optimizationproblem of hybrid energy microgrid. And compared withthe MOGWO, the DPSP and the REDR are reduced by7.55% and 6.29%, respectively, by using the IMOGWO.
In the planning and design of an actual island microgrid,selecting the optimal sizing allocation ratio of photovoltaic,photothermal, wind, diesel generator, and energy storage bythe method described in this paper can meet the specificrequirements of the project planning for comprehensiveeconomy cost, DPSP, and REDR, which can provide theoret-ical basis and technical support for the planning and con-struction of island microgrid. Thus, the problem of powershortage in island areas can be effectively solved, and the costof power supply in island areas can also be reduced. Since thebasic data used in this paper are solar radiation and windspeed, the optimal sizing method described in this paper isalso applicable to other island microgrids.
Data Availability
The data used to support the findings of this study areincluded within the article.
Conflicts of Interest
The authors declare that they have no conflicts of interest toreport regarding the present study.
Acknowledgments
This work is supported by the PhD Research Start-UpFoundation of Hubei University of Technology (No.BSQD2019011) and Open Foundation of Hubei Key Labora-tory for High-Efficiency Utilization of Solar Energy and Oper-ation Control of Energy Storage System (No. HBSEES202005).
1500
1000
500
Pow
er (k
W)
0
–500
–1000
–15001 5 10 15 20 24
Time (h)
LoadPVPT
WIBATDG
Figure 15: Typical daily distributed power supply output and load of microgrid.
18 International Journal of Photoenergy

References
[1] M. Farrokhabadi, C. A. Canizares, J. W. Simpson-Porco et al.,“Microgrid stability definitions, analysis, and examples,” IEEETransactions on Power Systems, vol. 35, no. 1, pp. 13–29, 2020.
[2] B. Sang, T. Zhang, Y. Liu, Y. Chen, L. Liu, and R. Wang,“Energy management system research of multi-microgrid: areview,” Proceedings of the CSEE, vol. 40, no. 10, pp. 3077–3093, 2020.
[3] I. Gonzalez, A. J. Calderon, and J. M. Andujar, “Novel remotemonitoring platform for RES-hydrogen based smart micro-grid,” Energy Conversion and Management, vol. 148,pp. 489–505, 2017.
[4] D. F. Yang, C. Jiang, and G. W. Cai, “Multi-objective optimalconfiguration of AC/DCmicrogrid considering electricity/heatcoupling,” Automation of Electric Power Systems, vol. 44, no. 8,pp. 124–136, 2020.
[5] X. Y. Ma, Y.W.Wu, H. L. Fang et al., “Optimal sizing of hybridsolar-wind distributed generation in an islanded microgridusing improved bacterial foraging algorithm,” Proceedings ofthe CSEE, vol. 31, no. 25, pp. 17–25, 2011.
[6] Y. Fu, Y. L. Jiang, and Z. K. Li, “Optimal allocation of distrib-uted generation for microgrid based on hybrid quantumgenetic algorithm,” Power System Protection and Control,vol. 41, no. 24, pp. 50–57, 2013.
[7] P. Xie, Z. X. Cai, P. Liu et al., “Cooperative optimization ofenergy storage capacity for renewable and storage involvedmicrogrids considering multi time scale uncertainty couplinginfluence,” Proceedings of the CSEE, vol. 39, no. 24, 2019.
[8] X. Li, J. Fang, S. Guo et al., “Capacity sizing optimal for grid-connected micro-grid based on sensitivity analysis,” PowerSystem Protection and Control, vol. 46, no. 23, pp. 8–17, 2018.
[9] A. Kaabeche, S. Diaf, and R. Ibtiouen, “Firefly-inspired algo-rithm for optimal sizing of renewable hybrid system consider-ing reliability criteria,” Solar Energy, vol. 155, pp. 727–738,2017.
[10] B. Zhao, X. Zhang, P. Li, K. Wang, M. Xue, and C. Wang,“Optimal sizing, operating strategy and operational experienceof a stand-alone microgrid on Dongfushan Island,” AppliedEnergy, vol. 113, pp. 1656–1666, 2013.
[11] L. Bukar, C. W. Tan, and K. Y. Lau, “Optimal sizing of anautonomous photovoltaic/wind/battery/diesel generatormicrogrid using grasshopper optimization algorithm,” SolarEnergy, vol. 188, pp. 685–696, 2019.
[12] F. K. Abo-Elyousr and A. Elnozahy, “Bi-objective economicfeasibility of hybrid micro-grid systems with multiple fueloptions for islanded areas in Egypt,” Renewable Energy,vol. 128, pp. 37–56, 2018.
[13] L. Olatomiwa, R. Blanchard, S. Mekhilef, and D. Akinyele,“Hybrid renewable energy supply for rural healthcare facilities:an approach to quality healthcare delivery,” SustainableEnergy Technologies and Assessments, vol. 30, pp. 121–138,2018.
[14] E. S. Oda, A. M. A. E. Hamed, A. Ali, A. A. Elbaset, M. A. E.Sattar, andM. Ebeed, “Stochastic optimal planning of distribu-tion system considering integrated photovoltaic-based DG andDSTATCOM under uncertainties of loads and solar irradi-ance,” IEEE Access, vol. 9, pp. 26541–26555, 2021.
[15] J. H. Zhang, L. Yu, and N. Liu, “Capacity configuration optimi-zation for island microgrid with wind/ photovoltaic/ diesel/storage and seawater desalination load,” Transactions of ChinaElectrotechnical Society, vol. 29, no. 2, pp. 102–112, 2014.
[16] Y. Z. Li, X. J. Guo, and H. Y. Dong, “Optimal capacity config-uration of wind/PV/storage hybrid energy storage system inmicrogrid,” Proceedings of the CSU-EPSA, vol. 32, pp. 123–128, 2020.
[17] M. G. Abidi, M. Ben Smida, M. Khalgui, Z. Li, and T. Qu,“Source resizing and improved power distribution for highavailable island microgrid: A case study on a Tunisian petro-leum Platform,” IEEE Access, vol. 7, pp. 22856–22871, 2019.
[18] T. Tsai, T. M. Beza, W. B. Wu, and C. C. Kuo, “Optimal con-figuration with capacity analysis of a hybrid renewable energyand storage system for an island application,” Energies, vol. 13,no. 1, p. 8, 2020.
[19] W. K. Liu, D. Wang, and X. D. Yu, “Multi-objective planningof micro energy network considering P2G-based storage sys-tem and renewable energy integration,” Automation of ElectricPower Systems, vol. 42, no. 16, 2018.
[20] L. Zhao, J. F. Dai, and J. Y. Meng, “Analysis on output charac-teristics of concentrating solar power system in various operat-ing modes,” Computer Simulation, vol. 34, no. 8, 2017.
[21] G. Ampuno, J. Lata-Garcia, and F. Jurado, “Evaluation ofenergy efficiency and the reduction of atmospheric emissionsby generating electricity from a solar thermal power genera-tion plant,” Energies, vol. 13, no. 3, p. 645, 2020.
[22] J. Chen, J. Z. Liu, W. J. Shen, Z. Junhu, and C. Kefa, “Status quoin research of solar energy thermal power generation system,”Thermal Power Generation, vol. 41, no. 4, pp. 17–22, 2012.
[23] J. F. Dai, Y. Tang, and L. N. Qu, “Research on coordinatedoptimization control of solar thermal and wind power genera-tion,” Computer Simulation, vol. 34, no. 10, pp. 73–77, 2017.
[24] L. Zhao, T. Shi, and B. Q. Shan, “Optimal allocation of helio-stat field capacity for solar tower power plant,” RenewableEnergy Resources, vol. 36, no. 6, pp. 850–857, 2018.
[25] G. Dhiman, “MOSHEPO: a hybrid multi-objective approachto solve economic load dispatch and micro grid problems,”Applied Intelligence, vol. 50, no. 1, pp. 119–137, 2020.
[26] S. Y. Liu, B. Zhao, and X. J. Wang, “Capacity configurationmodel for robust optimization of stand-alone microgrid basedon benders decomposition,” Automation of Electric Power Sys-tems, vol. 41, no. 21, 2017.
[27] Z. L. Lv, Y. Tan, and J. Li, “Multi-objective optimal sizing fordistributed generation of isolated hybrid microgrid usingMarkov-based electromagnetism-like mechanism,” Proceed-ings of the CSEE, vol. 37, no. 7, pp. 1927–1937, 2017.
[28] S. Mirjalili, S. M. Mirjalili, and A. Lewis, “Grey wolf opti-mizer,” Advances in Engineering Software, vol. 69, pp. 46–61,2014.
[29] Y. T. Zhao, J. C. Chen, andW. G. Li, “Multi-objective grey wolfoptimization hybrid adaptive differential evolution mecha-nism,” Computer Science, vol. 46, no. 11, pp. 83–88, 2019.
[30] S. Mirjalili, S. Saremi, S. M. Mirjalili, and L. D. Coelho, “Multi-objective grey wolf optimizer: a novel algorithm for multi-criterion optimization,” Expert Systems with Applications,vol. 47, pp. 106–119, 2015.
[31] “National Greenhouse data System,” http://data.sheshiyuanyi.com/.
19International Journal of Photoenergy