research article open access characterization of...
TRANSCRIPT
Research Journal of Biology, 2: 84 - 98 (2014) www.researchjournalofbiology.weebly.com
84 Copyright © 2014 RJB
RESEARCH ARTICLE Open Access
Characterization of Aspergillus Isolates from Saudi Arabia Based on Molecular Genetic Fingerprints Ehab A. Kamel
Biology Department, University College, Umm Al-Qura University, P. O. Box: 2064, Makkah, Saudi Arabia.
Introduction Aspergillus (Micheli, 1729) are a common group of filamentous fungi that have universal dissemination and are readily recovered from soil, decaying vegetation, air and many other environments. Their conidia become aerosolized are widely distributed in the environment and are inhaled by humans and animals. Some members of this genus (Aspergillus fumigatus, A. flavus and A. niger) can operate as opportunistic aggressors and cause a group of diseases known as Aspergillosis, especially in individuals with weakened immune systems.
Fungal identification and taxonomy is a dynamic progressive discipline. Due to its dynamic nature, it may require certain changes in the nomenclature, classification, or both. Such changes are extremely frustrating and distracting for non-taxonomists and may lead to some interruption in the accumulation of knowledge of living organisms such as fungi among nontaxonomists. Thus, one major goal should be to elucidate more reliable methods in the classification of fungi to produce more stable classification systems that require fewer changes in fungal nomenclature or classification.
Molecular markers have been developed to solve this problem. Molecular markers are independent of environmental conditions and show high levels of polymorphism. Corresponding author: [email protected]
Several methods such as SDS-PAGE, isozymes and RAPD-PCR banding pattern variations have been used in the fingerprinting and analysis of the genetic relationships of many different species. The study of closely related taxonomical units for a range of characteristics not only sheds light on the genetic fingerprints of the genotypes under study but also illuminates the relationships between these units (Suh et al., 1997).
The morphological characteristics of microbes may be influenced by environmental factors, and genomic mutations cannot be investigated by morphological markers. One additional step (molecular markers reveal characterization) has been taken to overcome this problem characterizing Aspergillus species. Polymorphisms were studied at the molecular level through random amplified polymorphic DNA (RAPD) marker technique (Taylor and Natvig 1987).
DNA (RAPD) markers, which utilize polymerase chain reaction (PCR) and amplification from single primers of arbitrary nucleotide sequence, have emerged as powerful tools for genome fingerprinting and analysis (Williams et al., 1990; Welsh and Mc-Clelland 1990). The PCR-based molecular marker method is straightforward, does not require prior knowledge of the DNA sequence
and can be performed using as little as 1 ng/l of template DNA isolated from tissue, according to simplified procedures (Caetano-Anolles, 1994; Thomson and Henry, 1995).
Abstract
In the present study, 20 Aspergillus isolates (from eight Aspergillus species) collected from different habitats in Jeddah, Saudi Arabia were cultivated on two different media (Czapek Dox and Waksman), and molecular genetic fingerprints was conducted to elucidate the relationships between these isolates. Extracted DNA from these isolates was used to identify the molecular fingerprints of Aspergillus genotypes. Only five primers (each consisted of 10 base pairs) successfully generated reproducible polymorphic products to discriminate among the genotypes. The fingerprints generated by these primers revealed characteristic profiles for each Aspergillus genotype, in terms of the number and position of RAPD bands. The results revealed that both the number and size of the amplified products varied considerably with the different primers. A sum of 47 polymorphic bands was generated by these primers in the Aspergillus genotypes growing on Czapek Dox's medium in this study. Additionally, 58 polymorphic bands were generated by these primers in the Aspergillus genotypes growing on Waksman's medium. In this study, two unique bands were identified out of the polymorphic bands in the Aspergillus genotypes growing on Czapek Dox's medium, whereas, 11 unique bands were detected out of the polymorphic bands in the Aspergillus genotypes growing on Waksman's medium. Fifteen monomorphic bands were detected in the Aspergillus genotypes growing on either Czapek Dox's and Waksman's media. These unique bands were used to discriminate among the studied Aspergillus isolates. The data were analyzed through the clustering method and similarity coefficients using NTSYSpc version 2.02i. Three different phenograms were produced for the studied Aspergillus species and the relationships between the species were discussed. Key Words: Aspergillus spp., DNA, RAPD-PCR technique, genotypic relationship and numerical taxonomy. (Received: 28/06/2014; Accepted: 22/07/2014; Published: 26/07/2014)

Research Journal of Biology, 2: 84 - 98 (2014) www.researchjournalofbiology.weebly.com
85 Copyright © 2014 RJB
RAPD markers are useful in genetic fingerprinting and in elucidating genetic relationships in different genera and species of fungi. Several studies have been conducted with the genus Aspergillus: Abdel-Fattah and Hammad (2002); Aiat (2006); Khan and Anwer (2007); Abed (2008); Batista et al., (2008); Midorikawa et al., (2008); Narasimhan and Asokan (2010).
The aim of the present study is to establish genetic fingerprints to differentiate among isolates (gathered from different sources) belonging to eight species of the genus Aspergillus by using RAPD markers and to estimate the genetic relationships between species of the genus. This study also addresses the impact of location and source on genotypic variation. Additionally, data analysis was performed on the different isolates of Aspergillus species using NTSYSpc version 2.02i (Rohlf, 1998). The data were analyzed by the clustering method and similarity coefficients. Next, three different phenograms were produced for the studied Aspergillus species, and the relationships between the species were discussed.
Materials and methods In the present study, eight species of Aspergillus comprising 20 isolates were studied. These isolates of Aspergillus species are Aspergillus japonicas (two isolates), A. versicolor (two isolates), A. parasiticus (three isolates), A. niger (three isolates), A. terreus (two isolates); A. flavus (three isolates); A. carneus (two isolates) and A. tamari (three isolates). Some of the isolates were collected from four localities of Jeddah of Saudi Arabia and have been previously identified by Al-Hazmi (2010) using the references; Raper and Fennell (1965), von Arx (1974), Domsch et al. (1988), Klich (2002); Kirk et al. (2008). The studied isolates and their habitat are presented in Table 1.
The experimental fungi were cultivated on two types of media for the determination of DNA patterns: Czapek Dox
’s medium, in which NaNO3 is the source of inorganic
nitrogen, and Waksman’s medium, in which peptone is the
source of organic nitrogen. For each fungus, a triplicate set of 250 ml Erlenmeyer conical flasks, each containing 50 ml of medium, was prepared, sterilized at 121°C for 15 minutes under 1.5 atmospheric pressure, cooled and inoculated with the experimental fungus. The cultures were then incubated at 25°C for seven days.
Next, approximately 0.5 g of fungal mat was used for DNA extraction following the Dellaporta method (Dellaporta et al., 1983). Fifteen 10-mer random DNA oligonucleotide primers (UBC) were independently used in the PCR reactions according to Williams et al. (1990). The primers were synthesized by the University of British Colombia. Only five primers generated reproducible polymorphisms in the DNA profiles. Each experiment was repeated two times and only stable products were scored. The code and sequences of these primers are listed in Table 2.
The data obtained from each isolate from RAPD-PCR were pooled and coded to create the data matrix of computation. They were scored for the absence of a band (0) and the presence of a band (1) in each species. The relationships between the studied species, expressed by the similarity coefficient, were presented as a phenogram,
based on the analysis of the recorded characters using NTSYSpc version 2.02i (Rohlf, 1998).
Table 1. Names and sources of the studied isolates of Aspergillus.
Sample number
Sources and habitat
Identification
1 Agricultural soil
Aspergillus japonicus Saito
2 Agricultural soil
Aspergillus versicolor (Vuill.) Tirab. str. I
3 Marine fauna Aspergillus japonicus Saito 4
Marine fauna Aspergillus parasiticus Spear var. parasiticus
5 Marine fauna Aspergillus niger Tiegh. 6 Marine fauna Aspergillus versicolor (Vuill.) Tirab. str. II 7
Sewage dump Aspergillus parasiticus Speare var. parasiticus
8 Sewage dump Aspergillus terreus Thom 9 Sewage dump Aspergillus niger Tiegh.
10 Sewage dump Aspergillus flavus Link 11 Soil around car
oil dump Aspergillus tamarii Kita
12 Soil around car oil dump
Aspergillus tamarii Kita
13 Soil around car oil dump
Aspergillus terreus Thom
14 Agricultural soil
Aspergillus parasiticus Speare var. parasiticus
15 Wheat grain Aspergillus carneus Blochwitz 16 Wheat grain Aspergillus flavus Link 17 Wheat grain Aspergillus niger Tiegh 18 Wheat grain Aspergillus tamarii Kita 19 Wheat grain Aspergillus flavus Link 20 Wheat grain Aspergillus carneus Blochwitz
Table 2. List of operon primers (A and O) and their nucleotide sequence.
No; Description Sequence
1 OP-A10 5-GTGATCGCAG-3 2 OP-A15 5-TTCCGAACCC-3 3 OP-A1 5-CAGGCCCTTC-3 4 OP-O12 5-CAGTGCTGTG-3 5 OP-O19 5-GTGAGGCGTC-3
One kilobase DNA Ladder 1μg/μl (Invitrogen) was used.
Results and discussion In the present study, randomly amplified polymorphic DNA (RAPD) based polymerase chain reaction (PCR) analysis was conducted to fingerprint and elucidate similarity indices among 20 isolates representing eight Aspergillus species.
Randomly amplified polymorphic DNA (RAPD) markers are based on the amplification of random locations in the plant genome by polymerase chain reaction (PCR). Using this technique, a single oligonucleotide is used to prime the amplification of the genomic DNA. Because these primers are 10-mer long, they have the possibility of annealing at a number of locations in the genome. To generate amplification products, the primers must bind to inverted annealing sites that are generally 150-4000 base apart. The number of amplification products is directly related to the number and orientation of the annealing sites in the genome.
Ten random primers were initially tested, but five-revealed distinct inter- and intra-specific polymorphism

Kamel, 2014
86
among the 20 Aspergillus isolates that were studied. These primers are named OP-A10, OP-A15, OP-A1, OP-O12 and OP-O19. Figure 1 and 2 illustrate the RAPD profiles generated by these primers. The occurrence of bands was expressed as (1) and the absence as (0) in Table 3 and 4.
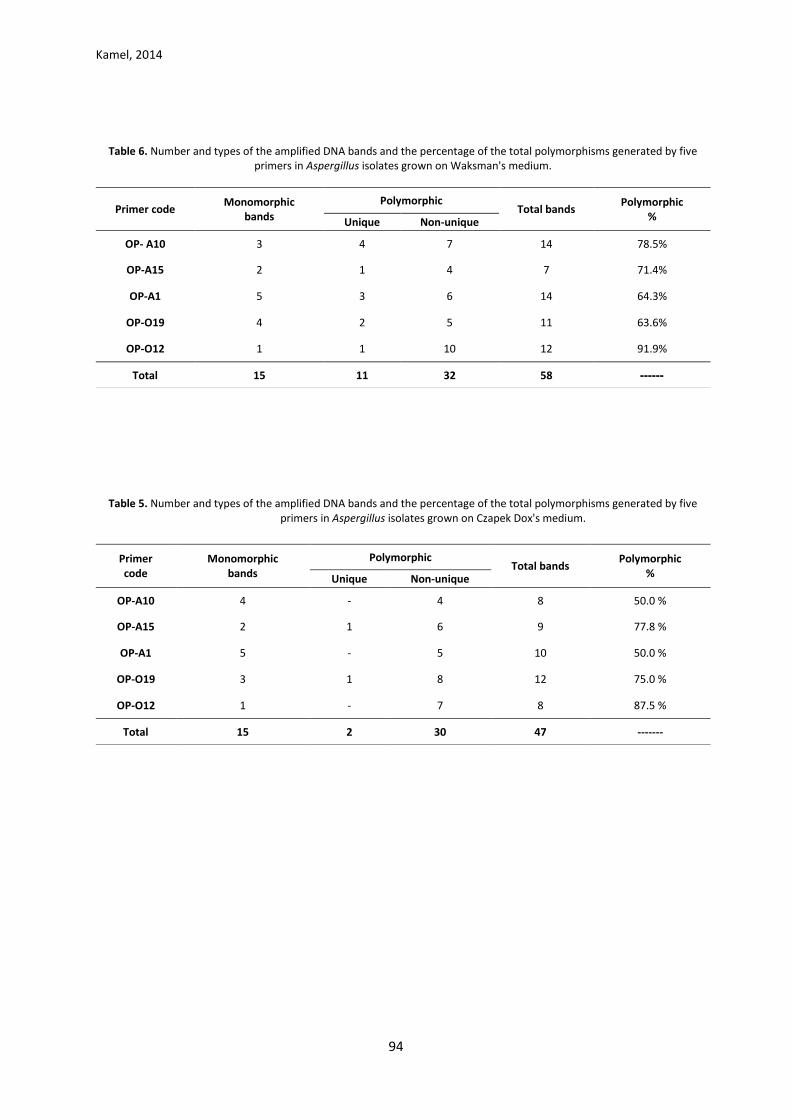
RAPD-PCR Analysis of Fungal Isolates Grown on Czapek Dox's Medium In isolates grown on Czapek Dox's medium, 47 DNA bands were detected. These bands were sorted as 15 monomorphic and 32 polymorphic bands. Of the polymorphic bands, two unique bands were scored (Table 5). The five primers revealed considerable variation between the studied species and within genotypes of the same species from the different sources. The range of polymorphism for these primers varied from 50.0 % (primers OP-A10 and OP-A1) to 87.5 % (primer OP-O12). All of the primers used generated monomorphic bands. The sizes of the DNA bands ranged from 200 bp (OP-A1 and OP-O19) to 1350 bp (OP-A1). The profiles of the DNA bands varied with the primer used (Figure 1).
The primer OP-A10 generated eight polymorphic bands in the studied isolate genotypes (Table 5). No unique bands were identified from these polymorphic bands. Four monomorphic bands were detected (at approximately 1130, 840, 730 and 400 bp) (Table 3). These bands provided further capability to discriminate among the studied Aspergillus isolates. Aspergillus terreus and A. parasiticus isolates, lane 13 & 14 were identified by the presence of one polymorphic band (940 bp), whereas the isolates (Aspergillus versicolor str. I and A. japonicas) in lane 2 & 3 were identified by the presence of different polymorphic band (200 bp).
The primer OP-A15 generated seven polymorphic bands. Two monomorphic DNA bands were observed in the studied isolates genotypes (Table 5). One unique band was identified out of the polymorphic bands at approximately 245 bp in the isolate of Aspergillus carneus (lane 20). This band clearly discriminates between Aspergillus carneus and the other studied isolate genotypes (Table 3). The six non-unique polymorphic bands detected at approximately 1300, 830, 665, 570, 500 and 400 bp represent the most observed bands generated by primer OP-A15 (Table 3). Similarly, these bands provide additional ability to discriminate among the studied genotypes.
Primer OP-A1 generated five monomorphic and five polymorphic bands. No unique bands were identified from the polymorphic bands (Table 5). The five monomorphic bands detected at approximately 1100, 900, 800, 605 and 330 bp represent the bands most often observed that were generated by primer OP-A1. The clearest non-unique polymorphic bands generated by primer OP-A1 are those scored at the approximate molecular sizes of 1350, 680, 645, 500 and 445 bp (Table 3).
In the RAPD profile generated by primer OP-O19 (Figure 1), nine polymorphic DNA bands were scored out of the total twelve bands (Table 5). One polymorphic band was identified as a unique band (Table 5). This unique band was observed in Aspergillus parasiticus at the apparent molecular size of 800 bp (lane 14). The eight non-unique polymorphic bands detected at approximately 1090, 1000, 710, 625, 445, 325, 290 and 200 bp represent
the bands most often observed that were generated by primer OP-O19 (Table 3).
A total of one monomorphic and seven polymorphic bands were generated by primer OP-O12 (Table 5). No unique bands were identified from the polymorphic bands. The clearest non-unique polymorphic bands generated by primer OP-O12 are those scored at the approximate molecular sizes of 1030, 950, 860, 640, 490, 320 and 210 bp (Table 3).
RAPD-PCR Analysis of Fungal Isolates Grown on Waksman's Medium Of the 58 DNA bands detected, 15 were monomorphic bands and 43 were polymorphic bands. Out of the polymorphic bands, eleven unique bands were scored (Table 6). The five primers revealed considerable variation between the species and within genotypes of the same species from different sources. The range of polymorphism for these primers varied from 63.6 % (primer OP-O19) to 91.9 % (primer OP-O12). All the primers used generated monomorphic bands. The sizes of DNA bands ranged from 210 bp (OP-O19) to 1350 bp (OP-A10). The profiles of DNA bands varied with the primer used (Figure 2).
Eleven polymorphic DNA bands were generated by primer OP-A10. Four unique bands were detected in these bands (Table 6). The first unique band was identified at the molecular size of approximately 980 bp in the isolate of Aspergillus terreus (lane 13). The second and third unique polymorphic bands were recognized at the molecular sizes of approximately 680 and 600 bp in Aspergillus versicolor str. II (lane 6). The fourth band was identified at the molecular size of approximately 285 bp in the isolate of Aspergillus tamari (lane 12). The most observable non unique polymorphic bands generated by primer OP-A10 were those detected at molecular sizes of approximately 1350, 1170, 950, 570, 500, 410 and 370 bp (Table 4).
Primer OP-A15 generated five polymorphic bands in the studied isolate genotypes (Table 6). One unique band was identified out of the polymorphic bands at approximately 550 bp in the isolate of Aspergillus tamaris (lane 18). The clearest non-unique polymorphic bands generated were those scored at the approximate molecular sizes of 850, 600, 330 and 230 bp (Table 4). Two monomorphic bands were detected (at approximately 680 and 420 bp) (Table 4). These bands provide further capability to discriminate among the studied Aspergillus isolates.
Primer OP-A1 generated nine polymorphic bands. Five monomorphic DNA bands were observed in the studied isolates genotypes (Table 6). Three unique bands were identified at approximately 750 bp in the isolate of Aspergillus niger (lane 9), at approximately 530 bp in the isolate of Aspergillus terreus (lane 8) and 230 bp in the isolate of Aspergillus tamari (lane 12). These bands clearly discriminate Aspergillus niger, A. terreus and A. tamari from the other studied isolate genotypes (Table 4). The six non-unique polymorphic bands detected at approximately 1300, 1250, 1180, 1115, 500 and 380 bp represent the bands most often observed that were generated by primer OP-A1 (Table 4). Similarly, these bands provide additional capability to discriminate among the studied genotypes.
Primer OP-O19 generated a total of four monomorphic and seven polymorphic bands. Two unique

Res. J. Biol., 2014 [2:84-98] E-ISSN: 2322-0066
87
bands with molecular weight of 700 and 360 bp were identified in the isolate of Aspergillus japonicas (lane 3) and Aspergillus tamaris (lane 12), respectively (Table 6). The four monomorphic bands detected at approximately 1050, 990, 830 and 580 bp represent the bands most often observed that were generated by primer OP-A1. The clearest non-unique polymorphic bands (five bands) generated by primer OP-O19 are those scored at the approximate molecular sizes of 740, 680, 525, 415 and 210 bp (Table 4).
In the RAPD profile generated by primer OP-O12 (Figure 2), eleven polymorphic DNA bands were scored out of the total twelve bands (Table 6). Only one polymorphic band was identified as a unique band detected; it was located in an isolate of Aspergillus terreus at the apparent molecular size of 1050 bp (lane 8) (Table 6). The ten non unique polymorphic bands detected at approximately 1300, 1150, 1110, 970, 900, 790, 650, 620, 500 and 240 bp represent the most observed bands generated by primer OP-O12 (Table 6).
Although, RAPD analysis was effective in providing sufficient polymorphism to discriminate among the studied species, no single primer could differentiate between all of the studied isolates of Aspergillus genotypes. Therefore, when the data from the five primers and from both cultural media were combined complete identification and discrimination was achieved for all studied isolate genotypes. Each of the studied isolates was discriminated by one or more unique bands or a group of combined class patterns.
In this light, the following isolates of Aspergillus ssp. cultivated on Czapek Dox
’s medium were identified by a
unique band from the polymorphic bands generated by the five primers. A. parasiticus was identified by one band (by OP-O19) at the apparent molecular size of 800 bp (lane 14), and A. carneus was identified by one band (by OP-A15) at the apparent molecular size of 245 bp (lane 20) (Table 5).
Additionally, some isolates of Aspergillus ssp. were identified by a unique band from the polymorphic bands generated by the five primers when cultivated on Waksman
’s medium. A. japonicas was identified by one
band (by OP-O19) at apparent molecular size of 700 bp (lane 3). A. versicolor str. II was identified by two bands (by OP-A10) at the apparent molecular sizes of 680 and 600 bp (lane 6). A. terreus was identified by two bands (by OP-A1 and OP-O12) at the apparent molecular sizes of 530 and 1050 bp, respectively (lane 8). A. niger was identified by one band (by OP-A1) at the apparent molecular size of 750 bp (lane 9). A. tamari was identified by three bands (by OP-A10, OP-A1 and OP-O19) at the apparent molecular sizes of 285, 230 and 360 bp, (lane 12); the same species (lane 18) was identified by another band (by OP-A15) at the apparent molecular size of 550 bp. Finally, A. terreus was identified by one band (by OP-A10) at the apparent molecular size of 980 bp (lane 13) (Table 6).
More recently, techniques that utilize polymerase chain reaction have allowed a more representative assessment of genetic variation in fungi by screening multiple loci distributed throughout the genome. The analyses reveal sufficient polymorphism for the examination of fine-scale genetic differences among individuals.
In this study, only five of the ten primers were able to generate polymorphic and reproducible amplification products. Many authors reported the use of a large number of primers to identify and characterize many fungal genotypes, but a limited number of primers succeeded in generating distinct and reproducible profiles with sufficient polymorphism.
Similarly, Abdel-Fattah and Hammad (2002) used only five primers to study the genetic variations between two species of Aspergillus, A. nigra and A. terreus. Aiat (2006) used ten random primers to study genetic diversity among three species of Aspergillus, A. niger, A. flavus and A. parasiticus, by RAPD analysis, but only four primers produced clear amplification products. Additionally, Batista et al. (2008) used five primers out of 29 to analyze genetic diversity in Aspergillus flavus. In contrast, Midorikawa et al. (2008) used 11 primers to establish the genetic variations within the same species. In 2010, Narasimhan and Asoka used only two primers when they studied the genetic variation within Aspergillus terreus.
Numerical Analysis of RAPD-PCR Data The data obtained from RAPD-PCR of each isolate were pooled together and coded to create a data matrix of computation; the data were scored for the absence of a band (0) and for the presence of a band (1) in each species. The relationships between the studied species, expressed by a similarity coefficient, were presented as a phenogram based on the analysis of the recorded attributes using NTSYSpc version 2.02i, as described by Rohlf (1998).
For data analysis, the total number of recorded attributes (105) in each isolate were scored, combined into three sets of data and coded to create the data matrix of computation: (1) the first set of data was for the RAPD-PCR analysis of isolates growing on Czapek Dox’s medium (47 attributes) (Table 7); (2) the second set of data was for the RAPD-PCR analysis of isolates growing on Waksman’s medium (58 attributes) (Table 8); and (3) the third set of data was for all of the characters combined.
The constructed phenogram based on estimated RAPD-PCR of 20 isolates of fungi belonging to the genus Aspergillus grown on Czapek Dox's medium is shown in Figure 3. A simplified phenogram was made (Figure 6) to construct reasonable species groups; it is of little value to discuss the results at the OTU level. This phenogram shows that the examined OTU at a similarity coefficient level of approximately 1.62 are divided into three GROUPs: I (comprises six isolates), II (comprises eight isolates) & III (comprises six isolates). GROUP I included two isolates of Aspergillus parasiticus (2/3) (7 & 14). While GROUP II (at the level of 1.24 similarity coefficient) included the three isolates each of Aspergillus tamari (3/3) (11, 12 & 18) and Aspergillus flavus (3/3) (10, 16 & 19); this group revealed a very close relationship between isolates of both A. tamari and A. flavus. GROUP III (at the level of 1.21 similarity coefficient) included two isolates of Aspergillus niger (2/3) (5 & 9).
Regarding the same isolates of Aspergillii grown on Waksman's medium, the constructed phenogram based on estimated RAPD-PCR is shown in Figure 4. The simplified phenogram (Figure 7) shows that the examined OTU at a similarity coefficient level of approximately 1.96 are also

Kamel, 2014
88
divided into three GROUPs: I (comprises five isolates), II (comprises seven isolates) & III (comprises eight isolates). GROUP I included the two isolates of Aspergillus terreus (2/2) (8 & 13). While GROUP II (at the level of 1.19 similarity coefficient) included three species (Aspergillus tamari, Aspergillus flavus and Aspergillus carneus): two isolates of Aspergillus tamari (2/3) (11 & 18), two isolates of Aspergillus flavus (2/3) (16 & 19) and two isolates of Aspergillus carneus (2/2) (15 & 20). This group revealed a very close relationship between isolates of those species. GROUP III (at the level of 1.23 similarity coefficient) included the two species (Aspergillus japonicas and Aspergillus parasiticus): two isolates of Aspergillus japonicas (2/2) (1 & 3) and three isolates of Aspergillus parasiticus (3/3) (4, 7 & 14). This also revealed a very close relationship between isolates of those species.
Finally, the phenogram based on estimated RAPD-PCR for the analysis of the total number of recorded attributes (105) of each isolate grown on Czapek Dox's and Waksman's media is shown in Figure 5. The simplified phenogram (Figure 8) shows that the examined OTU at a similarity coefficient level of approximately 1.73 are also divided into three GROUPs: I (comprises six isolates), II (comprises seven isolates) & III (comprises seven isolates). GROUP I included two isolates of Aspergillus terreus (2/2) (8 & 13). GROUP II (at the level of 1.23 similarity coefficient) included three species (Aspergillus tamari, Aspergillus carneus and Aspergillus flavus), two isolates of Aspergillus tamari (2/3) (11 & 18), two isolates of Aspergillus carneus (2/2) (15 & 20) and two isolates of Aspergillus flavus (2/3) (16 & 19). These data revealed a close relationship between isolates of those three species. GROUP III (at the level of 1.26 similarity coefficient) included two species (Aspergillus parasiticus and Aspergillus niger): two isolates of Aspergillus parasiticus (2/3) (4 & 7) and two isolates of Aspergillus niger (2/3) (5 & 9). These data, also revealed a close relationship between isolates of those species.
In their review, Hadrich et al., (2011) reported different genotyping methods developed and employed to better understand the genetic and epidemiological relationships between environmental and clinical isolates of Aspergillus flavus. In the same species, Rudramurthy et al. (2011) reported that there is a large genotypic diversity in clinical A. flavus isolates in India and that microsatellites are excellent typing targets for discriminating between A. flavus isolates from various origins.
Hong et al. (2010) reported that the species concept of Aspergillus fumigatus sensu stricto has recently been defined by polyphasic taxonomy and species delimitations; that study reviewed 146 worldwide strains of Aspergillus fumigatus sensu lato that were re-identified by the use of random amplification of polymorphic DNA polymerase chain reaction (RAPD-PCR) with primers PELF and URP1F techniques.
El Khoury et al. (2011) investigated the differentiation between Aspergillus flavus and Aspergillus parasiticus from pure cultures and Aflatoxin contaminated grapes using PCR-RFLP analysis of the aflR-aflJ intergenic spacer. Their results showed that both species displayed different PCR-based RFLP (PCR-RFLP) profiles. PCR products from A. flavus were cleaved into three fragments of 362, 210 and 102 bp. However, there is only one restriction site for this
enzyme in the sequence of A. parasiticus that produced two fragments of 363 and 311 bp. The method was successfully applied to contaminated grape samples. This approach to differentiate these two species would be simpler, less costly and quicker than conventional sequencing of PCR products and/or morphological identification. Our results confirmed the validity of this approach, as shown in the simplified phenogram (Figure 8) of combined data from both media in which both species (isolate no; 4 and 10) were grouped together in group III. León et al. (2011) reported on the epidemiology of the fungus by analyzing the phenotypic variability of the Aspergillus section Fumigati isolates from different Latin American countries. They also showed the relationship between this variability, geographical origin and genotypic characteristics, isolates of Peru showed specific phenotypic characteristics; that clearly differentiate them from the rest of the isolates, which matches the genotypic data. The correlation between the phenotypic and genotypic characteristics showed a statistically significant correlation.
A previous study by Al-Hazmi and Kamel (2012) on the same fungal isolates used the SDS-PAGE technique to elucidate the protein profiles and the impact of the different environmental sources on protein banding patterns. They confirmed that fungal growing habitats played a role in fungal isolates of the genus Aspergillus; therefore, the present study aims to use the RAPD-PCR technique and DNA fingerprinting to distinguish between these isolates.
In conclusion, the RAPD technique is useful in establishing genetic fingerprints of Aspergillus genotypes. In addition, RAPD technique could detect enough polymorphism in the studied genotypes to distinguish each genotype from the others by at least one unique band or a group of combined class patterns. The polymorphism information obtained through RAPD analysis may also help to identify polymorphic primers for further studies in other Aspergillus genotypes. Additionally, by comparing the two phenograms of each group, the basic relation between the studied isolates revealed that there is a remarkable correlation and variation between the geographical origin (sources) and the DNA profiles of the studied isolates.
References Abed, K. F. (2008). Differentiation of Aspergillus niger
by random amplification of polymorphic DNA. Journal of Industrial Microbiology and Biotechnology. 35(9): 1027-1032.
Abdel-Fattah, G. M. and Hammad, I. (2002). Production of Lipase by Certain Soil Fungi. I: Optimization of Cultural Conditions and Genetic Characterization of Lipolytic Strains of Aspergilli Using Protein Patterns and Random Amplified Polymorphic DNA (RAPD). OnLine Journal of Biological Sciences. 2(10): 639-644.
Aiat, N. (2006). Genetic Variability among Three Species of Aspergillus 2. Random Amplified Polymorphic Dna (RAPD) Markers for Genetic Analysis. Journal of Applied Sciences Research. 2(10): 709-713.
Res. J. Biol., 2014 [2:84-98] E-ISSN: 2322-0066
89
Al-Hazmi, N. A. (2010). Fungal isolates and their toxicity from different ecosystems in Jeddah, Saudi Arabia. African Journal of Biotechnology. 9(34): 5590-5598.
Al-Hazmi, N. A. and Kamel, E. A. (2012). Ecosystem impact on fungal identification using SDS-PAGE technique. African Journal of Microbiology Research. 6(14): 3492-3500.
Batista, P. P., Santos, J. F., Oliveira, N. T., Pires, A. P. D., Motta, C. M. S. and Luna-Alves Lima, E. A. (2008). Genetic characterization of Brazilian strains of Aspergillus flavus using DNA markers. Genetics and Molecular Research. 7(3): 706-717.
Caetano-Anolles, G. (1994). MAAP: a versatile and universal tool for genome analysis. Plant Mol. Biol. 25: 1011-1026.
Dellaporta, S.L., Wood, J. & Hicks, J.B. (1983). A plant DNA mini preparation. Version III. Plant Mol. Biol., Rep.1: 19-21.
Domsch, K. H., Gams, W. and Anderson, T. H. (1988). Compendium of Soil Fungi. Vol. 1-2. London: Academic Press.
El Khoury, A., Atoui, A., Rizk, T., Lteif, R., Kallassy, M. and Lebrihi A. (2011). Differentiation between Aspergillus flavus and Aspergillus parasiticus from Pure Culture and Aflatoxin-Contaminated Grapes Using PCR-RFLP Analysis of aflR-aflJ Intergenic Spacer. Journal of Food Science. 76(4): M247-M253.
Hong, S., Kim, D., Park, I., Choi, Y., Shin, H. and Samson, R. (2010). Re-identification of Aspergillus fumigatus sensu lato based on a new concept of species delimitation. The Journal of Microbiology. 48(5): 607-615.
Hadrich, I, Makni, F., Neji,S., Cheikhrouhou, F., Sellami, H. and Ayadi, A. (2011). A Review Molecular Typing Methods for Aspergillus flavus Isolates. Mycopathologia. 172: 83-93.
Khan, M. R. and Anwer, M. A. (2007). Molecular and biochemical characterization of soil isolates of Aspergillus niger aggregate and an assessment of their antagonism against Rhizoctonia solani. Phytopathol. Mediterr. 46: 304-315.
Kirk, P., Cannon, P. F., Minter, D. W. and Stalpers, J. A. (2008). Ainsworth and Bisby’s Dictionary of the Fungi. 10
th
ed. CAB International, Wallingford, UK. (pps. 63-62). Klich, M. A. (2002). Identification of Common
Aspergillus Species. Centreal Bureau Voor Schimmel Culture, AD Utrecht, Netherland, pp: 116.
León, M. G. F., Zavala-Ramírez, M., Susana Córdoba, S., Gerardo Zúñiga, E., Duarte-Escalante, E., Pérez-Torres, A., Armando Zepeda-Rodríguez, A., López-Martínez, I., Buitrago, M. J. and María del Rocío Reyes-Montes, M. R. (2011). Phenotypic characteristics of isolates of Aspergillus section Fumigati from different geographic origins and their relationships with genotypic characteristics. BMC Infectious Diseases. 11: 1-9.
Micheli, P. A. (1729). Nova plantarum genera iuxta Tournefortii methodum disposita. Typis Bernardi Paperinii, Florentiae.
Midorikawa, G. E.O., Pinheiro, M. R. R., Vidigal, B. S., Arruda, M. C., Costa, F. F., Pappas Jr, G. J., Ribeiro, S. G., Freire, F. and Miller, R. N. G. (2008). Characterization of
Aspergillus flavus strains from Brazilian Brazil nuts and cashew by RAPD and ribosomal DNA analysis. Letters in Applied Microbiology. 47(1): 12–18.
Narasimhan, B. and Asokan, M. (2010). Genetic variability of Aspergillus terreus from dried grapes using RAPD-PCR. Advances in Bioscience and Biotechnology. 1: 345-353.
Raper, K. B. and Fennell, D. I. (1965). The Genus Aspergillus. Baltimore, M. D.; Williams and Wilkins (pp. 686).
Rohlf, F. J. (1998). NTSYSpc numerical taxonomy and multivariate analysis system user guide. Exeter Software, New York, USA.
Rudramurthy, S. M., de Valk, H. A., Chakrabarti, A., Meis, J. F. G. M. and Klaassen, C. H. W. (2011). High Resolution Genotyping of Clinical Aspergillus flavus Isolates from India Using Microsatellites. PLoS ONE. 6(1): e16086.
Suh, H. S., Sato, Y. I. and Morishima, H. (1997). Genetic characterization of weedy rice (Oryza sativa L.) based on morpho-physiology, isozymes and RAPD markers. Theor. Appl. Genet. 94: 316-321.
St-Germain G. and Summerbell, R. C. (1996). Identifying filamentous fungi: A clinical laboratory handbook. Star Publishers, Belmont, California.
Taylor, J. W. and Natvig D. Isolation of fungal DNA. In: Fuller, M. S. and Jaworski, A. (eds) (1987). Zoosporic Fungi in Teaching and Research. South-eastern Publishing Corporation, Athens, Georgia. pp. 252-258.
Thomson, D. and Henry, R. (1995). Single-step protocol for preparation of plant tissue for analysis by PCR. BioTechniques. 19: 394-400.
von Arx, J. A. (1974). The genera of fungi sporulating in pure culture. In: Cramer, J. (Ed.), The genera of fungi sporulating in pure culture. A.R. Gantner Verlag Kommanditgesellschaft, Vaduz, Liechtenstein (pp. 424).
Welsh, J. & Mc-Clelland, M. (1990). Fingerprinting genomes using PCR with arbitrary primers. Nucleic Acid Research. 18: 7213-7218.
Williams, J. G. K., Kubelik, A. R., Livak, K. J., Rafalski, J. A. and Tingey, S. V. (1990). DNA polymorphism amplified by arbitrary primers are useful as genetic markers. Nucl. Acid Res. 18: 6531-6535.

Kamel, 2014
90
Table 3. The presence (1) and absence (0) of DNA in the generated RAPD profiles of the 20 Aspergillus isolates grown on Czapek Dox's medium.
Primer Molecular
Weight in bp. Aspergillus isolates.
1 2 3 4 5 6 7 8 9 10 11 12 13 14 15 16 17 18 19 20
OPA10
1180 0 1 1 0 0 0 0 0 0 0 1 1 1 1 1 1 1 1 1 1
1130 1 1 1 1 1 1 1 1 1 1 1 1 1 1 1 1 1 1 1 1
940 0 0 0 0 0 0 0 0 0 0 0 0 1 1 0 0 0 0 0 0
840 1 1 1 1 1 1 1 1 1 1 1 1 1 1 1 1 1 1 1 1
730 1 1 1 1 1 1 1 1 1 1 1 1 1 1 1 1 1 1 1 1
640 1 0 0 1 1 1 1 1 1 1 1 1 1 1 1 0 1 1 1 0
400 1 1 1 1 1 1 1 1 1 1 1 1 1 1 1 1 1 1 1 1
200 0 1 1 0 0 0 0 0 0 0 0 0 0 0 0 0 0 0 0 0
OPA15
1300 0 1 0 0 0 0 1 0 0 0 0 1 1 0 0 0 0 0 0 0
830 1 1 1 0 0 0 1 1 1 0 0 0 0 0 1 0 1 1 1 1
815 1 1 1 1 1 1 1 1 1 1 1 1 1 1 1 1 1 1 1 1
665 1 0 0 1 1 1 0 1 1 1 1 0 0 0 0 0 0 0 0 0
570 0 0 0 0 0 0 1 0 0 0 0 0 1 1 0 0 0 0 0 0
500 1 1 1 0 0 0 0 0 0 0 0 0 0 0 0 0 0 0 0 0
450 1 1 1 1 1 1 1 1 1 1 1 1 1 1 1 1 1 1 1 1
400 1 1 1 0 0 0 1 1 0 1 1 0 0 0 0 0 1 0 0 1
245 0 0 0 0 0 0 0 0 0 0 0 0 0 0 0 0 0 0 0 1
OPA1
1350 1 1 0 1 1 1 1 0 1 1 1 1 1 0 1 1 0 1 1 0
1100 1 1 1 1 1 1 1 1 1 1 1 1 1 1 1 1 1 1 1 1
900 1 1 1 1 1 1 1 1 1 1 1 1 1 1 1 1 1 1 1 1
800 1 1 1 1 1 1 1 1 1 1 1 1 1 1 1 1 1 1 1 1
680 0 0 0 0 0 1 0 0 0 0 0 0 0 0 0 0 1 0 0 0
645 0 0 0 0 0 0 0 0 0 0 0 0 0 0 0 1 0 0 1 0
605 1 1 1 1 1 1 1 1 1 1 1 1 1 1 1 1 1 1 1 1
500 0 0 0 0 0 0 0 0 0 0 1 0 0 1 0 1 0 0 0 0
445 1 1 1 1 1 1 1 1 0 0 0 0 0 0 0 0 0 0 0 0
330 1 1 1 1 1 1 1 1 1 1 1 1 1 1 1 1 1 1 1 1
OPO19
1090 1 1 0 1 1 1 1 1 1 1 1 1 1 1 1 1 1 1 1 1
1000 0 0 0 0 0 0 0 0 0 0 0 0 0 0 1 0 0 1 0 0
920 1 1 1 1 1 1 1 1 1 1 1 1 1 1 1 1 1 1 1 1
850 1 1 1 1 1 1 1 1 1 1 1 1 1 1 1 1 1 1 1 1
800 0 0 0 0 0 0 0 0 0 0 0 0 0 1 0 0 0 0 0 0
710 0 0 0 0 0 0 0 0 0 0 1 0 0 0 1 1 1 1 1 0
650 1 1 1 1 1 1 1 1 1 1 1 1 1 1 1 1 1 1 1 1
625 1 1 1 0 0 0 0 0 1 0 0 0 0 0 0 0 0 0 0 0
445 0 0 0 1 1 1 1 1 1 0 1 0 1 0 0 0 0 0 0 0
325 0 0 0 0 0 0 0 1 0 0 0 0 1 1 0 0 0 0 0 0
290 1 1 0 1 1 1 1 1 1 0 1 0 0 0 1 0 0 0 0 0
200 0 0 0 0 0 1 1 1 1 0 0 0 0 0 0 0 0 0 0 0
OPO12
1030 1 0 0 0 0 0 0 0 1 1 1 1 1 1 1 0 0 1 1 0
950 1 0 0 0 0 0 1 0 1 1 0 0 1 1 0 0 0 0 0 0
860 0 0 0 0 0 0 0 0 1 0 1 1 1 1 1 0 0 1 1 0
640 0 0 0 0 0 0 1 0 0 0 0 0 0 0 0 0 0 1 1 0
490 1 1 1 0 0 1 0 1 1 1 1 1 1 1 0 1 1 1 0 0
425 1 1 1 1 1 1 1 1 1 1 1 1 1 1 1 1 1 1 1 1
320 0 1 1 1 1 1 0 1 1 1 1 1 1 1 1 1 1 1 0 1
210 0 1 1 1 1 1 0 0 0 1 1 1 0 1 1 1 0 1 0 1

Res. J. Biol., 2014 [2:84-98] E-ISSN: 2322-0066
91
Figure 1. RAPD fingerprints of the 20 Aspergillus isolates grown on Czapek Dox's medium by the primers OPA10, OPA15, OPA1, OPO19 and OPO12.

Kamel, 2014
92
Table 4. The presence (1) and absence (0) of DNA in the generated RAPD profiles of the 20 Aspergillus isolates grown on Waksman's medium.
Primer Molecular
Weight in bp. Aspergillus isolates.
1 2 3 4 5 6 7 8 9 10 11 12 13 14 15 16 17 18 19 20
OPA10
1350 0 1 0 0 0 0 0 0 0 1 0 0 0 1 1 0 0 0 0 0 1170 0 0 1 0 0 0 1 1 0 0 0 0 0 0 0 0 0 0 0 0 160 1 1 1 1 1 1 1 1 1 1 1 1 1 1 1 1 1 1 1 1 980 0 0 0 0 0 0 0 0 0 0 0 0 1 0 0 0 0 0 0 0 950 0 0 1 0 0 0 1 0 0 0 0 1 0 1 0 0 0 0 0 0 830 1 1 1 1 1 1 1 1 1 1 1 1 1 1 1 1 1 1 1 1 700 1 1 1 1 1 1 1 1 1 1 1 1 1 1 1 1 1 1 1 1 680 0 0 0 0 0 1 0 0 0 0 0 0 0 0 0 0 0 0 0 0 600 0 0 0 0 0 1 0 0 0 0 0 0 0 0 0 0 0 0 0 0 570 0 1 1 1 0 0 1 0 1 1 1 1 0 1 1 1 1 1 1 1 500 0 1 1 1 1 1 1 0 1 1 0 0 1 1 1 1 1 1 1 0 410 1 1 1 1 1 1 1 0 0 0 1 1 0 1 0 0 0 0 1 0 370 1 1 1 1 1 1 1 1 1 1 0 1 1 1 1 1 1 0 0 0 285 0 0 0 0 0 0 0 0 0 0 0 1 0 0 0 0 0 0 0 0
OPA15
850 0 1 1 0 0 1 1 1 1 1 0 0 1 1 1 1 1 0 0 1
680 1 1 1 1 1 1 1 1 1 1 1 1 1 1 1 1 1 1 1 1
600 0 0 0 0 0 0 1 0 1 0 1 0 1 0 0 0 0 0 0 1
550 0 0 0 0 0 0 0 0 0 0 0 0 0 0 0 0 0 1 0 0
420 1 1 1 1 1 1 1 1 1 1 1 1 1 1 1 1 1 1 1 1
330 1 0 0 0 0 1 1 1 1 1 1 1 0 0 1 1 1 1 1 1
230 0 0 0 0 0 1 1 0 0 1 1 1 0 0 1 1 0 1 1 1
OPA1
1300 0 0 0 0 0 0 0 0 0 0 0 0 1 0 1 1 0 0 0 0
1250 0 0 0 0 1 0 0 0 1 1 0 0 1 0 1 1 0 0 0 0
1180 0 0 0 0 0 0 0 1 0 0 0 0 0 0 0 0 1 0 0 0
1115 0 0 0 1 0 0 0 1 1 0 0 0 1 0 1 1 1 0 0 0
980 1 1 1 1 1 1 1 1 1 1 1 1 1 1 1 1 1 1 1 1
950 1 1 1 1 1 1 1 1 1 1 1 1 1 1 1 1 1 1 1 1
830 1 1 1 1 1 1 1 1 1 1 1 1 1 1 1 1 1 1 1 1
750 0 0 0 0 0 0 0 0 1 0 0 0 0 0 0 0 0 0 0 0
600 1 1 1 1 1 1 1 1 1 1 1 1 1 1 1 1 1 1 1 1
530 0 0 0 0 0 0 0 1 0 0 0 0 0 0 0 0 0 0 0 0
500 0 1 1 1 1 0 0 0 1 1 1 1 1 1 1 1 1 1 1 1
420 1 1 1 1 1 1 1 1 1 1 1 1 1 1 1 1 1 1 1 1
380 1 1 0 0 0 0 0 0 0 0 1 0 1 1 1 1 1 0 0 0
230 0 0 0 0 0 0 0 0 0 0 0 1 0 0 0 0 0 0 0 0
OPO19
1050 1 1 1 1 1 1 1 1 1 1 1 1 1 1 1 1 1 1 1 1
990 1 1 1 1 1 1 1 1 1 1 1 1 1 1 1 1 1 1 1 1
830 1 1 1 1 1 1 1 1 1 1 1 1 1 1 1 1 1 1 1 1
740 0 0 0 0 0 0 0 0 1 0 0 0 1 0 1 0 0 0 1 0
700 0 0 1 0 0 0 0 0 0 0 0 0 0 0 0 0 0 0 0 0
680 1 1 0 1 0 0 0 1 0 0 1 1 1 1 1 1 1 1 1 1
580 1 1 1 1 1 1 1 1 1 1 1 1 1 1 1 1 1 1 1 1
525 1 1 0 0 0 0 0 0 0 0 0 1 0 0 0 0 0 1 0 0
415 1 1 1 0 0 0 0 0 0 0 0 1 0 0 0 0 0 0 0 0
360 0 0 0 0 0 0 0 0 0 0 0 1 0 0 0 0 0 0 0 0
210 1 1 1 0 1 0 0 0 0 0 1 1 1 1 1 1 1 1 1 1
OPO12
1300 1 1 1 1 1 1 1 0 1 1 1 1 1 1 1 1 1 1 1 1
1150 1 1 1 1 1 1 1 0 1 1 1 1 1 1 1 1 1 1 1 1
1110 0 0 0 0 0 0 1 0 0 0 1 1 0 0 1 1 1 1 1 1
1050 0 0 0 0 0 0 0 1 0 0 0 0 0 0 0 0 0 0 0 0
970 0 0 0 0 0 0 0 0 0 0 0 0 0 0 1 1 1 1 1 0
900 1 1 1 1 1 1 1 0 1 1 0 0 1 0 0 0 0 0 0 1
790 1 1 1 1 1 1 1 0 1 1 0 0 1 1 1 1 1 1 1 1
650 0 0 0 0 0 0 0 0 0 0 0 0 0 1 1 0 0 0 0 0
620 1 0 0 0 0 0 0 0 1 1 1 1 0 0 0 0 0 0 0 0
500 0 1 1 0 0 1 1 0 1 1 0 0 0 1 0 1 1 0 1 1
410 1 1 1 1 1 1 1 1 1 1 1 1 1 1 1 1 1 1 1 1
240 0 0 0 0 0 0 0 0 0 0 1 1 0 1 0 1 1 1 0 0

Res. J. Biol., 2014 [2:84-98] E-ISSN: 2322-0066
93
Figure 2: RAPD fingerprints of the 20 Aspergillus isolates grown on Waksman's medium by the primers OPA10, OPA15, OPA1, OPO19 and OPO12.
Kamel, 2014
94
Table 5. Number and types of the amplified DNA bands and the percentage of the total polymorphisms generated by five primers in Aspergillus isolates grown on Czapek Dox's medium.
Polymorphic
% Total bands
Polymorphic Monomorphic bands
Primer code Non-unique Unique
50.0 % 8 4 - 4 OP-A10
77.8 % 9 6 1 2 OP-A15
50.0 % 10 5 - 5 OP-A1
75.0 % 12 8 1 3 OP-O19
87.5 % 8 7 - 1 OP-O12
------- 47 30 2 15 Total
Table 6. Number and types of the amplified DNA bands and the percentage of the total polymorphisms generated by five
primers in Aspergillus isolates grown on Waksman's medium.
Polymorphic
% Total bands
Polymorphic Monomorphic bands
Primer code Non-unique Unique
78.5% 14 7 4 3 OP- A10
71.4% 7 4 1 2 OP-A15
64.3% 14 6 3 5 OP-A1
63.6% 11 5 2 4 OP-O19
91.9% 12 10 1 1 OP-O12
------ 58 32 11 15 Total

Res. J. Biol., 2014 [2:84-98] E-ISSN: 2322-0066
95
Table 7. Amplified fragments obtained from Aspergillus isolates grown on Czapek Dox's medium from all primers.
No; Aspergillus isolates (OTU
,s)
1 2 3 4 5 6 7 8 9 10 11 12 13 14 15 16 17 18 19 20
1 0 1 1 0 0 0 0 0 0 0 1 1 1 1 1 1 1 1 1 1 2 1 1 1 1 1 1 1 1 1 1 1 1 1 1 1 1 1 1 1 1 3 0 0 0 0 0 0 0 0 0 0 0 0 1 1 0 0 0 0 0 0 4 1 1 1 1 1 1 1 1 1 1 1 1 1 1 1 1 1 1 1 1 5 1 1 1 1 1 1 1 1 1 1 1 1 1 1 1 1 1 1 1 1 6 1 0 0 1 1 1 1 1 1 1 1 1 1 1 1 0 1 1 1 0 7 1 1 1 1 1 1 1 1 1 1 1 1 1 1 1 1 1 1 1 1 8 0 1 1 0 0 0 0 0 0 0 0 0 0 0 0 0 0 0 0 0
9 0 1 0 0 0 0 1 0 0 0 0 1 1 0 0 0 0 0 0 0 10 1 1 1 0 0 0 1 1 1 0 0 0 0 0 1 0 1 1 1 1 11 1 1 1 1 1 1 1 1 1 1 1 1 1 1 1 1 1 1 1 1 12 1 0 0 1 1 1 0 1 1 1 1 0 0 0 0 0 0 0 0 0 13 0 0 0 0 0 0 1 0 0 0 0 0 1 1 0 0 0 0 0 0 14 1 1 1 0 0 0 0 0 0 0 0 0 0 0 0 0 0 0 0 0 15 1 1 1 1 1 1 1 1 1 1 1 1 1 1 1 1 1 1 1 1 16 1 1 1 0 0 0 1 1 0 1 1 0 0 0 0 0 1 0 0 1 17 0 0 0 0 0 0 0 0 0 0 0 0 0 0 0 0 0 0 0 1 18 1 1 0 1 1 1 1 0 1 1 1 1 1 0 1 1 0 1 1 0 19 1 1 1 1 1 1 1 1 1 1 1 1 1 1 1 1 1 1 1 1 20 1 1 1 1 1 1 1 1 1 1 1 1 1 1 1 1 1 1 1 1 21 1 1 1 1 1 1 1 1 1 1 1 1 1 1 1 1 1 1 1 1 22 0 0 0 0 0 1 0 0 0 0 0 0 0 0 0 0 1 0 0 0 23 0 0 0 0 0 0 0 0 0 0 0 0 0 0 0 1 0 0 1 0 24 1 1 1 1 1 1 1 1 1 1 1 1 1 1 1 1 1 1 1 1 25 0 0 0 0 0 0 0 0 0 0 1 0 0 1 0 1 0 0 0 0 26 1 1 1 1 1 1 1 1 0 0 0 0 0 0 0 0 0 0 0 0 27 1 1 1 1 1 1 1 1 1 1 1 1 1 1 1 1 1 1 1 1 28 1 1 0 1 1 1 1 1 1 1 1 1 1 1 1 1 1 1 1 1 29 0 0 0 0 0 0 0 0 0 0 0 0 0 0 1 0 0 1 0 0 30 1 1 1 1 1 1 1 1 1 1 1 1 1 1 1 1 1 1 1 1 31 1 1 1 1 1 1 1 1 1 1 1 1 1 1 1 1 1 1 1 1 32 0 0 0 0 0 0 0 0 0 0 0 0 0 1 0 0 0 0 0 0 33 0 0 0 0 0 0 0 0 0 0 1 0 0 0 1 1 1 1 1 0 34 1 1 1 1 1 1 1 1 1 1 1 1 1 1 1 1 1 1 1 1 35 1 1 1 0 0 0 0 0 1 0 0 0 0 0 0 0 0 0 0 0 36 0 0 0 1 1 1 1 1 1 0 1 0 1 0 0 0 0 0 0 0 37 0 0 0 0 0 0 0 1 0 0 0 0 1 1 0 0 0 0 0 0 38 1 1 0 1 1 1 1 1 1 0 1 0 0 0 1 0 0 0 0 0 39 0 0 0 0 0 1 1 1 1 0 0 0 0 0 0 0 0 0 0 0 40 1 0 0 0 0 0 0 0 1 1 1 1 1 1 1 0 0 1 1 0 41 1 0 0 0 0 0 1 0 1 1 0 0 1 1 0 0 0 0 0 0 42 0 0 0 0 0 0 0 0 1 0 1 1 1 1 1 0 0 1 1 0 43 0 0 0 0 0 0 1 0 0 0 0 0 0 0 0 0 0 1 1 0 44 1 1 1 0 0 1 0 1 1 1 1 1 1 1 0 1 1 1 0 0 45 1 1 1 1 1 1 1 1 1 1 1 1 1 1 1 1 1 1 1 1 46 0 1 1 1 1 1 0 1 1 1 1 1 1 1 1 1 1 1 0 1 47 0 1 1 1 1 1 0 0 0 1 1 1 0 1 1 1 0 1 0 1

Kamel, 2014
96
Table 8. Amplified fragments obtained from Aspergillus isolates grown on Waksman's medium from all primers.
No; Aspergillus isolates (OTU
,s)
1 2 3 4 5 6 7 8 9 10 11 12 13 14 15 16 17 18 19 20
1 0 1 0 0 0 0 0 0 0 1 0 0 0 1 1 0 0 0 0 0 2 0 0 1 0 0 0 1 1 0 0 0 0 0 0 0 0 0 0 0 0 3 1 1 1 1 1 1 1 1 1 1 1 1 1 1 1 1 1 1 1 1 4 0 0 0 0 0 0 0 0 0 0 0 0 1 0 0 0 0 0 0 0 5 0 0 1 0 0 0 1 0 0 0 0 1 0 1 0 0 0 0 0 0 6 1 1 1 1 1 1 1 1 1 1 1 1 1 1 1 1 1 1 1 1 7 1 1 1 1 1 1 1 1 1 1 1 1 1 1 1 1 1 1 1 1 8 0 0 0 0 0 1 0 0 0 0 0 0 0 0 0 0 0 0 0 0 9 0 0 0 0 0 1 0 0 0 0 0 0 0 0 0 0 0 0 0 0
10 0 1 1 1 0 0 1 0 1 1 1 1 0 1 1 1 1 1 1 1 11 0 1 1 1 1 1 1 0 1 1 0 0 1 1 1 1 1 1 1 0 12 1 1 1 1 1 1 1 0 0 0 1 1 0 1 0 0 0 0 1 0 13 1 1 1 1 1 1 1 1 1 1 0 1 1 1 1 1 1 0 0 0 14 0 0 0 0 0 0 0 0 0 0 0 1 0 0 0 0 0 0 0 0 15 0 1 1 0 0 1 1 1 1 1 0 0 1 1 1 1 1 0 0 1 16 1 1 1 1 1 1 1 1 1 1 1 1 1 1 1 1 1 1 1 1 17 0 0 0 0 0 0 1 0 1 0 1 0 1 0 0 0 0 0 0 1 18 0 0 0 0 0 0 0 0 0 0 0 0 0 0 0 0 0 1 0 0 19 1 1 1 1 1 1 1 1 1 1 1 1 1 1 1 1 1 1 1 1 20 1 0 0 0 0 1 1 1 1 1 1 1 0 0 1 1 1 1 1 1 21 0 0 0 0 0 1 1 0 0 1 1 1 0 0 1 1 0 1 1 1 22 0 0 0 0 0 0 0 0 0 0 0 0 1 0 1 1 0 0 0 0 23 0 0 0 0 1 0 0 0 1 1 0 0 1 0 1 1 0 0 0 0 24 0 0 0 0 0 0 0 1 0 0 0 0 0 0 0 0 1 0 0 0 25 0 0 0 1 0 0 0 1 1 0 0 0 1 0 1 1 1 0 0 0 26 1 1 1 1 1 1 1 1 1 1 1 1 1 1 1 1 1 1 1 1 27 1 1 1 1 1 1 1 1 1 1 1 1 1 1 1 1 1 1 1 1 28 1 1 1 1 1 1 1 1 1 1 1 1 1 1 1 1 1 1 1 1 29 0 0 0 0 0 0 0 0 1 0 0 0 0 0 0 0 0 0 0 0 30 1 1 1 1 1 1 1 1 1 1 1 1 1 1 1 1 1 1 1 1 31 0 0 0 0 0 0 0 1 0 0 0 0 0 0 0 0 0 0 0 0 32 0 1 1 1 1 0 0 0 1 1 1 1 1 1 1 1 1 1 1 1 33 1 1 1 1 1 1 1 1 1 1 1 1 1 1 1 1 1 1 1 1 34 1 1 0 0 0 0 0 0 0 0 1 0 1 1 1 1 1 0 0 0 35 0 0 0 0 0 0 0 0 0 0 0 1 0 0 0 0 0 0 0 0 36 1 1 1 1 1 1 1 1 1 1 1 1 1 1 1 1 1 1 1 1 37 1 1 1 1 1 1 1 1 1 1 1 1 1 1 1 1 1 1 1 1 38 1 1 1 1 1 1 1 1 1 1 1 1 1 1 1 1 1 1 1 1 39 0 0 0 0 0 0 0 0 1 0 0 0 1 0 1 0 0 0 1 0 40 0 0 1 0 0 0 0 0 0 0 0 0 0 0 0 0 0 0 0 0 41 1 1 0 1 0 0 0 1 0 0 1 1 1 1 1 1 1 1 1 1 42 1 1 1 1 1 1 1 1 1 1 1 1 1 1 1 1 1 1 1 1 43 1 1 0 0 0 0 0 0 0 0 0 1 0 0 0 0 0 1 0 0 44 1 1 1 0 0 0 0 0 0 0 0 1 0 0 0 0 0 0 0 0 45 0 0 0 0 0 0 0 0 0 0 0 1 0 0 0 0 0 0 0 0 46 1 1 1 0 1 0 0 0 0 0 1 1 1 1 1 1 1 1 1 1 47 1 1 1 1 1 1 1 0 1 1 1 1 1 1 1 1 1 1 1 1 48 1 1 1 1 1 1 1 0 1 1 1 1 1 1 1 1 1 1 1 1 49 0 0 0 0 0 0 1 0 0 0 1 1 0 0 1 1 1 1 1 1 50 0 0 0 0 0 0 0 1 0 0 0 0 0 0 0 0 0 0 0 0 51 0 0 0 0 0 0 0 0 0 0 0 0 0 0 1 1 1 1 1 0 52 1 1 1 1 1 1 1 0 1 1 0 0 1 0 0 0 0 0 0 1 53 1 1 1 1 1 1 1 0 1 1 0 0 1 1 1 1 1 1 1 1 54 0 0 0 0 0 0 0 0 0 0 0 0 0 1 1 0 0 0 0 0 55 1 0 0 0 0 0 0 0 1 1 1 1 0 0 0 0 0 0 0 0 56 0 1 1 0 0 1 1 0 1 1 0 0 0 1 0 1 1 0 1 1 57 1 1 1 1 1 1 1 1 1 1 1 1 1 1 1 1 1 1 1 1 58 0 0 0 0 0 0 0 0 0 0 1 1 0 1 0 1 1 1 0 0

Res. J. Biol., 2014 [2:84-98] E-ISSN: 2322-0066
97

Kamel, 2014
98