research article improved rifamycin b production by
TRANSCRIPT

Research ArticleImproved Rifamycin B Production byNocardia mediterranei MTCC 14 under Solid-StateFermentation through Process Optimization
Basavaraj M. Vastrad,1 Shivayogeshwar E. Neelagund,2
Sudhir R. Iiger,3 Ajeet M. Godbole,3 and Venkatrao Kulkarni4
1 Department of Pharmaceutical Biotechnology, S.E.T’s College of Pharmacy, Dharwad, Karnataka 580002, India2Department of PG Studies in Biochemistry, Kuvempu University, Jnana Sahyadri campus, Shankaraghatta, Shimoga 577 451, India3 Department of Pharmaceutics, S.E.T’s College of Pharmacy, Dharwad, Karnataka 580002, India4Department of Pharmacology, S.E.T’s College of Pharmacy, Dharwad, Karnataka 580002, India
Correspondence should be addressed to Basavaraj M. Vastrad; [email protected]
Received 4 July 2014; Accepted 10 September 2014; Published 9 October 2014
Academic Editor: Ziad Fajloun
Copyright © 2014 Basavaraj M. Vastrad et al. This is an open access article distributed under the Creative Commons AttributionLicense, which permits unrestricted use, distribution, and reproduction in any medium, provided the original work is properlycited.
Optimization of various production parameters using response surface methodology (RSM) was performed to assess maximumyield of rifamycin B from Nocardia mediterranei MTCC 14. Plackett-Burman design test was applied to determine the significanteffects of various production parameters such as glucose, maltose, ribose, galactose, beef extract, peanutmeal, ammonium chloride,ammonium sulphate, barbital, pH, andmoisture content on production of rifamycin B.Among the eleven variables tested, galactose,ribose, glucose, and pHwere found to have significant effect on rifamycin B production. Optimum levels of the significant variableswere decided by using a central composite design. The most appropriate condition for production of rifamycin B was found to bea single step production at galactose (8% w/w), ribose (3% w/w), glucose (9% w/w), and pH (7.0). At these optimum productionparameters, the maximum yield of rifamycin B obtained experimentally (9.87 g/kgds dry sunflower oil cake) was found to be veryclose to its predicted value of 10.35 g/kgds dry sunflower oil cake. The mathematical model developed was found to fit greatly withthe experimental data of rifamycin B production.
1. Introduction
Rifamycin B is powerful, less toxic, and easily biodegrad-able antibacterial ansamycin antibiotic [1] and is producedby strain of Nocardia mediterranei. It bear distinct criti-cal antibacterial activities [2], including tuberculosis, lep-rosy, and AIDS-related mycobacterial infections [3]. Sorifamycin Bhas become one of themost effective antibacterialansamycin antibiotics.
Processes that can be used for rifamycin B productioninclude submerged fermentation (SmF) and solid-state fer-mentation (SSF). The solid-state fermentation is particularlybeneficial for antibiotics production by filamentous actino-myces, since it simulates the natural habitat of these produc-tion strains [4, 5]. Another benefit of SSF is that agroindustrial
residues (sesame oil cake, soybean cake, coconut oil cake,mustard oil cake, palm kernel cake, groundnut oil cake,cottonseed cake, canola oil cake, olive oil cake, rapeseed cake,etc.) can be used as the solid substrate, acting as sourcesof both carbon and energy. However, certain operationalconditions of SSF, such as barrier in controlling.Themoisturecontent of the substrate and avoiding heat buildup havebounded its industrial application.The influence of variety ofnutrients, pH, and substrate moisture content on the kineticsof growth and rifamycinB formation is crucial for SSF processscale-up [6]. The strains that have been considered for theproduction of rifamycin B under SSF include Amycolatopsissp. RSP 3 [6].
Oil cakes have chief nutritional value and are possiblyvaluable substrates for use in biotechnological SSF processes
Hindawi Publishing CorporationBiochemistry Research InternationalVolume 2014, Article ID 621309, 13 pageshttp://dx.doi.org/10.1155/2014/621309

2 Biochemistry Research International
for themanufacture of chief value products such as antibiotics[7, 8] and enzymes [9, 10].The development of new sunflowervarieties has enabled edible oils to be obtained from rapeseed,which is now the world’s second largest source of edibleoil. The by-product of oil extraction, sunflower oil cake,not only is a rich source of nitrogen, carbon, and mineralsbut also is ample and economical [11]. However, despite theability of Nocardia strains and their certified applicationsin antibiotics production, to the best of our apprehensionthere have been no studies concerning the characterizationof these actinomyces for the production of rifamycin B usingsunflower oil cake as solid substrate in SSF.
Plackett-Burman design and response surface methodol-ogy (RSM) are competent statistical techniques for optimiz-ing complex processes because it allows additional, capable,and easier adaptation and explication of experiments com-pared to conventional methods [12, 13]. In addition, it isless arduous and time consuming than other conventionalmethods to optimize a process. It is extensively used foroptimization of the process conditions of the fermentationmedium [14–16].
In this paper, we describe the optimization of appropriatefermentationmedium conditions for rifamycin B production,with the help of both conventional and statistical optimiza-tion techniques.
2. Materials and Methods
2.1. Microorganism, Preparation of Inoculum. NocardiamediterraneiMTCC 14was obtained from theMicrobial TypeCulture Collection and Gene Bank (MTCC), Chandigarh,India, and was used in this study for rifamycin B production.The strain was maintained on agar-slant medium (pH 8.0)consisting of (g/L) dextrose 20, glycerol 20, yeast extract5, beef extract 3, casein hydrolysate 3, peptone 2.5, maltextract 1, and agar 20 and stored at 48C. These slants weresubcultured on regular intervals. The spores were harvestedand suspended in sterile distilled water containing 0.01%(v/v) Tween 80 to obtain approximately 2.0 × 10⁶ spores/mL.
2.2. Raw Materials. Sunflower oil cake was collected from-Raja Fat and Feeds Private Limited, Rajpura, Punjab, India.The collected sunflower oil cake was first dried and mechan-ically milled with a lab mill (Ultra Centrifugal Mill) andsieved through standard mesh sieves (200–500𝜇m) using anelectronic sieve shaker to obtain the powder of 200–500𝜇mparticle sizes.
2.3. Optimization for Rifamycin BProduction byOne-Variable-at-a-Time Approach. SSF was carried out in a 250mL Erlen-meyer conical flask containing 4 g solid substrate (sunfloweroil cake). In the present paper, the requirement of mediumcomponents including various carbon (5% [w/w], glucose,maltose, galactose, ribose, and xylose) and nitrogen sources(7% [w/w], peanut meal, beef extract, soybean meal, ammo-nium sulphate, and ammonium chloride), barbital (1%, 2%,3%, 4%, and 5%), pH (7.0, 7.5, 8.0, 8.5, and 9.0), and moisturecontent (40%, 45%, 50%, 55%, and 60%) were optimized.
The sunflower oil cake was supplemented with (in mg) soy-bean meal 250, calcium carbonate 75, potassium nitrate 100,barbital 20, and magnesium sulphate 1 with predeterminedquantity of water. The contents of the flasks were mixedthoroughly and autoclaved at 121∘C for 15min at 1 kgf/cm2.After cooling the flasks to room temperature, the flasks wereinoculated with 2.0 × 10⁶ spores/mL under sterile conditions[6]. The pH adjustment of solid medium was achieved byadjusting the pH ofmoisturizingmedium before being addedto the solid material. The contents of the flasks were fullymixed and incubated at 28 ± 0.5∘C for predetermined timeperiod and used for extraction and estimation of rifamycinB.
2.4. Extraction of Antibiotics. Enzyme extraction was carriedout by mixing fermented mass with distilled water for 1 hon an orbital shaker at 200 rpm. Contents of the flasks werefiltered through muslin cloth and the filtrate was centrifugedat 2070 ×g for 10min.The supernatant obtained was used forrifamycin B estimation.
2.5. Estimation of Rifamycin B. Rifamycin B was estimatedaccording to the method of Pasqualucci et al. [17]. Reactionmixture contained 0.1mL of suitably diluted antibiotics +5mL of 0.2M acetate buffer (pH 4.63) and the absorbancewas read at 425 nm using UV-Visible spectrophotometer(SHIMADZUUV-1800), against 0.1mL of antibiotic solutiondiluted to 5mL with acetate buffer, pH 4.63, containing 0.1%NaNO
2. Rifamycin B production under SSF was expressed
as g/kgds dry fermented mass. Each sample was tested induplicate.
2.6. Experimental Design. Single factor experiment was usedto select the best carbon and nitrogen sources, barbital, pH,and moisture levels.
2.7. Response Surface Methodology. Response surfacemethodology was applied in two stages, first to identify thesignificant processes parameters for production of rifamycinB using Plackett-Burman design test and later the significantprocesses parameters which resulted from Plackett-Burmandesign were optimized by using a central composite design.The experimental design and statistical analysis of thedata were accomplished by using Stat-Ease Design Expertstatistical software package (trial version7).
2.8. Plackett-Burman Design. Plackett-Burman design testwas applied to describe the significant variables responsiblefor production of rifamycin B from Nocardia mediterraneiMTCC 14. This design test assumes that there are no inter-actions between the different production parameters and isbased on the first-order model:
𝑌 = 𝛽0+∑𝛽
𝑖𝑥𝑖, (1)
where 𝑌 is the estimated direct function, 𝛽0is the scaling
constant, 𝛽𝑖is the regression coefficients, and 𝑥
𝑖is the
variables. The effect of eleven variables with coded notation
Biochemistry Research International 3
(glucose (𝑋1), maltose (𝑋2), ribose (𝑋3), galactose (𝑋4),beef extract (𝑋5), peanut meal (𝑋6), ammonium chloride(𝑋7), ammonium sulphate (𝑋8), barbital (𝑋9), pH (𝑋10),and moisture content (𝑋11)) on the production of rifamycinB was tested at two experimental levels, high level denotedby (+) and a low level denoted by (−), as listed in Table 1.Eleven variables were screened by conducting 12 experimentsand the experimental design is given in Table 2. All experi-ments were conducted in duplicate and the average value ofextracted rifamycin B was used for statistical analysis.
The variableswhichwere significant at 5% level (𝑃 < 0.05)from the regression analysis as given in Table 3 were reasonedto have major effect on production of rifamycin B and werefurther optimized by central composite design.
2.9. Central Composite Design. A central composite designwas applied to determine the optimum level of four signifi-cant production parameters screened from Placket-Burmandesign test. As shown in Table 4 the effect of four processesparameters (galactose (𝑋4), ribose (𝑋3), glucose (𝑋1), andpH (𝑋10)) on the production of rifamycin Bwas calculated atfive experimental levels,−𝛼,−1, 0,+1, and+𝛼, where𝛼 = 2𝑛/4;here 𝑛 is the number of variables and 0 corresponds to thecentral point.The experimental levels for these variables werepreferred fromour preliminarywork, which indicated that anoptimum could be built within the level of processes param-eters calculated. The levels of factors used for experimentaldesign are given in Table 4.The actual level of each factor wascalculated by the following equation [18]:
Coded value =actual level − (high level + low level) /2(high level − low level) /2
.
(2)
The experimental design scheme is given in Table 5.Rifamycin B yield was analyzed by using a second-orderpolynomial equation and the data were fitted into theequation by multiple regression procedure. The modelequation for analysis is given below:
𝑌 = 𝛽0+ 𝛽1𝑋1+ 𝛽2𝑋2+ 𝛽3𝑋3+ 𝛽4𝑋4+ 𝛽11𝑋2
1
+ 𝛽22𝑋2
2+ 𝛽33𝑋2
3+ 𝛽44𝑋2
4+ 𝛽12𝑋1𝑋2
+ 𝛽24𝑋2𝑋4+ 𝛽13𝑋1𝑋3+ 𝛽14𝑋1𝑋4
+ 𝛽23𝑋2𝑋3+ 𝛽24𝑋2𝑋4+ 𝛽34𝑋3𝑋4,
(3)
where 𝑌 is the predicted response, 𝑋1, . . . , 𝑋
4are the levels
of the factors, 𝛽1, . . . , 𝛽
4are linear coefficients, 𝛽
11, . . . , 𝛽
44
are quadratic coefficients, and 𝛽12, . . . , 𝛽
34are the interactive
coefficients with 𝛽0is a scaling constant. Analysis of variance
(ANOVA), regression analysis was done. The surface andcontour plots were drawn by using Stat-Ease Design Expertstatistical software package (trial version7).
2.10. Data Analysis. The quality of the fit of the polynomialmodel equation was uttered by the coefficient of determina-tion 𝑅2, and its statistical significance was checkered by 𝐹-test. The significance level was given as values of Prob > 𝐹
CL GL ML GA RI XY0.00.51.01.52.02.53.03.54.04.55.05.56.06.57.0
Rifa
myc
in B
(g/k
gds)
Carbon sources 5% (w/w)
Day 4Day 6
Day 8Day 10
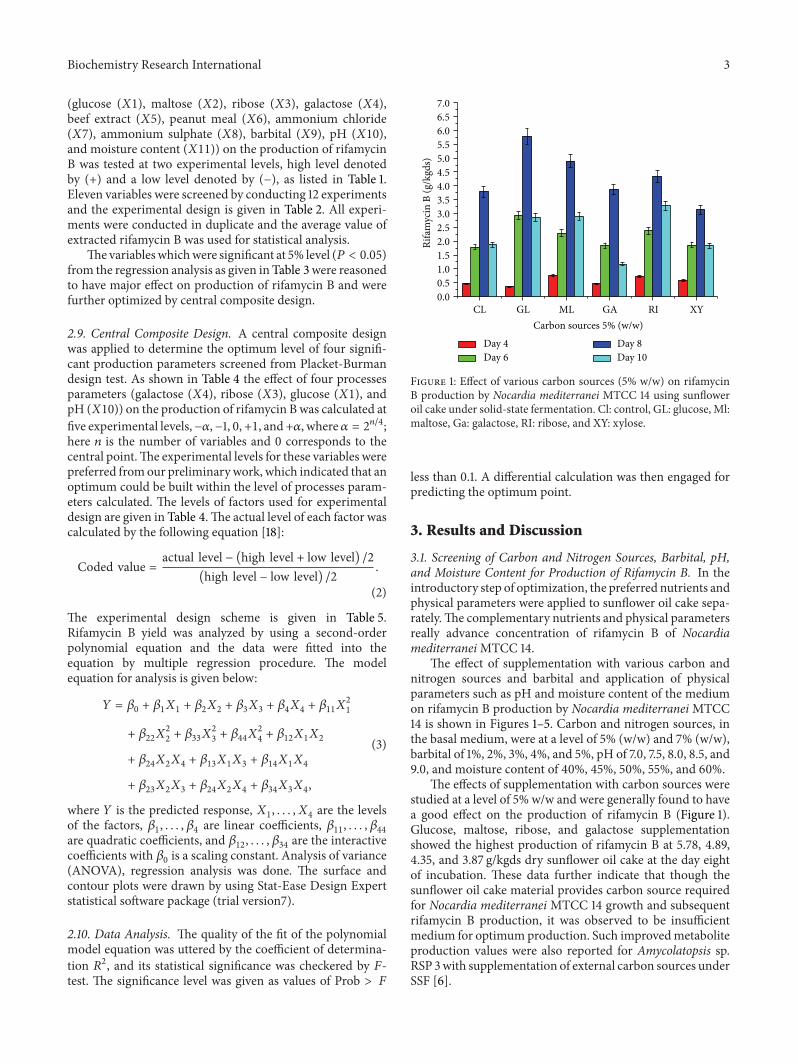
Figure 1: Effect of various carbon sources (5% w/w) on rifamycinB production by Nocardia mediterranei MTCC 14 using sunfloweroil cake under solid-state fermentation. Cl: control, GL: glucose, Ml:maltose, Ga: galactose, RI: ribose, and XY: xylose.
less than 0.1. A differential calculation was then engaged forpredicting the optimum point.
3. Results and Discussion
3.1. Screening of Carbon and Nitrogen Sources, Barbital, pH,and Moisture Content for Production of Rifamycin B. In theintroductory step of optimization, the preferred nutrients andphysical parameters were applied to sunflower oil cake sepa-rately.The complementary nutrients and physical parametersreally advance concentration of rifamycin B of NocardiamediterraneiMTCC 14.
The effect of supplementation with various carbon andnitrogen sources and barbital and application of physicalparameters such as pH and moisture content of the mediumon rifamycin B production by Nocardia mediterraneiMTCC14 is shown in Figures 1–5. Carbon and nitrogen sources, inthe basal medium, were at a level of 5% (w/w) and 7% (w/w),barbital of 1%, 2%, 3%, 4%, and 5%, pH of 7.0, 7.5, 8.0, 8.5, and9.0, and moisture content of 40%, 45%, 50%, 55%, and 60%.
The effects of supplementation with carbon sources werestudied at a level of 5% w/w and were generally found to havea good effect on the production of rifamycin B (Figure 1).Glucose, maltose, ribose, and galactose supplementationshowed the highest production of rifamycin B at 5.78, 4.89,4.35, and 3.87 g/kgds dry sunflower oil cake at the day eightof incubation. These data further indicate that though thesunflower oil cake material provides carbon source requiredfor Nocardia mediterranei MTCC 14 growth and subsequentrifamycin B production, it was observed to be insufficientmedium for optimumproduction. Such improvedmetaboliteproduction values were also reported for Amycolatopsis sp.RSP 3with supplementation of external carbon sources underSSF [6].

4 Biochemistry Research International
Table 1: Level of the production parameters for production of rifamycin B from Nocardia mediterraneiMTCC 14 by using Plackett-Burmandesign test.
Processes parameters code Medium composition and conditions High level (+) Low level (−)𝑋1 Glucose % (w/w) 7 5𝑋2 Maltose % (w/w) 7 5𝑋3 Ribose % (w/w) 7 5𝑋4 Galactose % (w/w) 7 5𝑋5 Beef extract % (w/w) 9 7𝑋6 Peanut meal % (w/w) 9 7𝑋7 Ammonium chloride % (w/w) 9 7𝑋8 Ammonium sulphate % (w/w) 9 7𝑋9 Barbital % (w/w) 3 2𝑋10 pH 9 7𝑋11 Moisture content % 60 50
Table 2: Yield of rifamycin B from Nocardia mediterranei MTCC 14 using the different levels of production variables of Plackett-Burmandesign test.
Std. run order 𝑋1 𝑋2 𝑋3 𝑋4 𝑋5 𝑋6 𝑋7 𝑋8 𝑋9 𝑋10 𝑋11Yieldg/kgds
2 −1 1 1 −1 1 1 1 −1 −1 −1 1 5.219 1 1 1 −1 −1 −1 1 −1 1 1 −1 6.381 1 1 −1 1 1 1 −1 −1 −1 1 −1 7.845 −1 −1 1 −1 1 1 −1 1 1 1 −1 2.8910 −1 1 1 1 −1 −1 −1 1 −1 1 1 6.3211 1 −1 1 1 1 −1 −1 −1 1 −1 1 8.356 −1 −1 −1 1 −1 1 1 −1 1 1 1 7.3212 −1 −1 −1 −1 −1 −1 −1 −1 −1 −1 −1 6.978 1 1 −1 −1 −1 1 −1 1 1 −1 1 8.317 1 −1 −1 −1 1 −1 1 1 −1 1 1 7.474 −1 1 −1 1 1 −1 1 1 1 −1 −1 9.433 1 −1 1 1 −1 1 1 1 −1 −1 −1 8.48Eleven variables,𝑋1, glucose,𝑋2, maltose,𝑋3, ribose,𝑋4, galactose,𝑋5, beef extract,𝑋6, peanut meal,𝑋7, ammonium chloride,𝑋8, ammonium sulphate,𝑋9, barbital,𝑋10, pH, and𝑋11, moisture content, were screened by conducting 12 experiments.
Table 3: ANOVA of Plackett-Burman design test data for the significant production parameters.
Source SS df MS 𝐹 value 𝑃 valueModel 33.52 11 3.35 264.42 0.0478Glucose 6.29 1 6.29 496.49 0.0286Maltose 0.34 1 0.34 26.56 0.1220Ribose 7.86 1 7.86 619.88 0.0256Galactose 9.21 1 9.21 726.23 0.0236Beef extract 0.56 1 0.56 44.10 0.0951Peanut meal 1.98 1 1.98 155.93 0.0509Ammonium chloride 1.09 1 1.09 85.68 0.0685Ammonium sulphate 0.057 1 0.057 4.53 0.2796Barbital 0.013 1 0.013 3.78 0.9522pH 6.06 1 6.06 478.38 0.0291Moisture content 0.082 1 0.082 6.44 0.2389
𝑅2 = 0.9996
Galactose, ribose, glucose, and pH were significant (𝑃 < 0.05). SS: sum of square, MS: mean of square, df: degree of freedom, 𝐹 value: Fisher’s value, and 𝑃:probability.
Biochemistry Research International 5
Table 4: Production variables and their coded and actual values used for optimization of rifamycin B production frommediterraneiMTCC14 by using central composite design.
Production variable Coded levelSymbol −2 −1 0 1 2
Galactose % (w/w) 𝑋4 7.50 8.0 8.50 9.0 9.50Ribose % (w/w) 𝑋3 2.50 3.0 3.50 4.0 4.50Glucose % (w/w) 𝑋1 7.50 8.0 8.50 9.0 9.50pH % (w/w) 𝑋10 6.75 7.0 7.25 7.5 7.75
CL PM BE SM AS AC0
1
2
3
4
5
6
Rifa
myc
in B
(g/k
gds)
Nitrogen sources 7% (w/w)
Day 4Day 6
Day 8Day 10
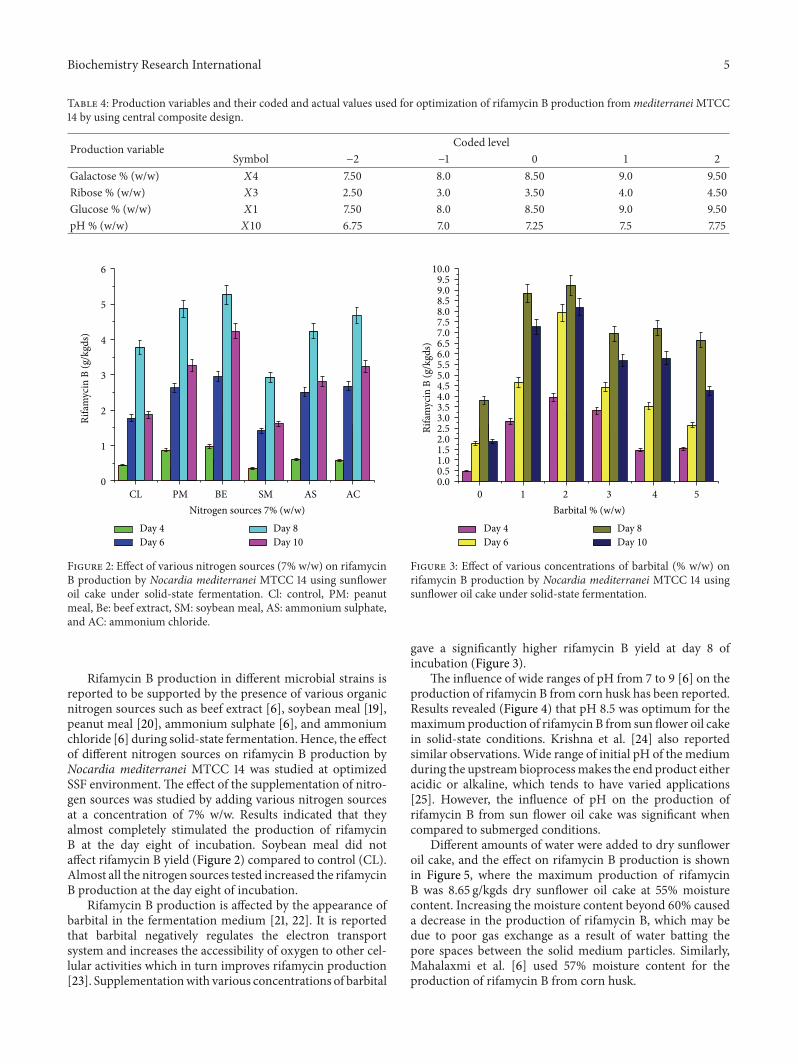
Figure 2: Effect of various nitrogen sources (7% w/w) on rifamycinB production by Nocardia mediterranei MTCC 14 using sunfloweroil cake under solid-state fermentation. Cl: control, PM: peanutmeal, Be: beef extract, SM: soybean meal, AS: ammonium sulphate,and AC: ammonium chloride.
Rifamycin B production in different microbial strains isreported to be supported by the presence of various organicnitrogen sources such as beef extract [6], soybean meal [19],peanut meal [20], ammonium sulphate [6], and ammoniumchloride [6] during solid-state fermentation.Hence, the effectof different nitrogen sources on rifamycin B production byNocardia mediterranei MTCC 14 was studied at optimizedSSF environment. The effect of the supplementation of nitro-gen sources was studied by adding various nitrogen sourcesat a concentration of 7% w/w. Results indicated that theyalmost completely stimulated the production of rifamycinB at the day eight of incubation. Soybean meal did notaffect rifamycin B yield (Figure 2) compared to control (CL).Almost all the nitrogen sources tested increased the rifamycinB production at the day eight of incubation.
Rifamycin B production is affected by the appearance ofbarbital in the fermentation medium [21, 22]. It is reportedthat barbital negatively regulates the electron transportsystem and increases the accessibility of oxygen to other cel-lular activities which in turn improves rifamycin production[23]. Supplementationwith various concentrations of barbital
0 1 2 3 4 50.00.51.01.52.02.53.03.54.04.55.05.56.06.57.07.58.08.59.0
10.09.5
Rifa
myc
in B
(g/k
gds)
Barbital % (w/w)
Day 4Day 6
Day 8Day 10
Figure 3: Effect of various concentrations of barbital (% w/w) onrifamycin B production by Nocardia mediterranei MTCC 14 usingsunflower oil cake under solid-state fermentation.
gave a significantly higher rifamycin B yield at day 8 ofincubation (Figure 3).
The influence of wide ranges of pH from 7 to 9 [6] on theproduction of rifamycin B from corn husk has been reported.Results revealed (Figure 4) that pH 8.5 was optimum for themaximumproduction of rifamycin B from sun flower oil cakein solid-state conditions. Krishna et al. [24] also reportedsimilar observations.Wide range of initial pH of the mediumduring the upstream bioprocessmakes the end product eitheracidic or alkaline, which tends to have varied applications[25]. However, the influence of pH on the production ofrifamycin B from sun flower oil cake was significant whencompared to submerged conditions.
Different amounts of water were added to dry sunfloweroil cake, and the effect on rifamycin B production is shownin Figure 5, where the maximum production of rifamycinB was 8.65 g/kgds dry sunflower oil cake at 55% moisturecontent. Increasing the moisture content beyond 60% causeda decrease in the production of rifamycin B, which may bedue to poor gas exchange as a result of water batting thepore spaces between the solid medium particles. Similarly,Mahalaxmi et al. [6] used 57% moisture content for theproduction of rifamycin B from corn husk.

6 Biochemistry Research International
7.0 7.5 8.0 8.5 9.00
1
2
3
4
5
Rifa
myc
in B
(g/k
gds)
pH
Day 4Day 6
Day 8Day 10
Figure 4: Effect of various levels of pH on rifamycin B productionby Nocardia mediterraneiMTCC 14 using sunflower oil cake undersolid-state fermentation.
40 45 50 55 600
1
2
3
5
7
9
8
10
4
6
Rifa
myc
in B
(g/k
gds)
Initial moisture (%)
Day 4Day 6
Day 8Day 10
Figure 5: Effect of various levels of moisture (%) on rifamycin Bproduction by Nocardia mediterraneiMTCC 14 using sunflower oilcake under solid-state fermentation.
Based on the above experiments, glucose, maltose, ribose,galactose, beef extract, peanut meal, ammonium chloride,ammonium sulphate, barbital, pH, andmoisture contentwereselected for statistical optimization.
3.2. Screening of Production Parameters Using Plackett-Burman Design Test. A total of eleven variables were ana-lyzed with regard to their effects on rifamycin B yieldusing a Plackett-Burman design (Table 1). The design matrixselected for screening of significant variables for rifamycin
Pareto chart
0.00
35.01
70.03
105.04
140.05Bonferroni limit: 140.054
t-value limit: 12.7062
1 2 3 4 5 6 7 8 9 10 11
D C A KF G E B L H
Figure 6:𝑋1: Rank of process variables;𝑋2: 𝑡-value of effect. Paretochart of independent variables (glucose (A; 𝑋1), maltose (B; 𝑋2),ribose (C;𝑋3), galactose (D;𝑋4), beef extract (E;𝑋5), peanut meal(F;𝑋6), ammonium chloride (G;𝑋7), ammonium sulphate (H;𝑋8),barbital (I; 𝑋9), pH (j; 𝑋10), and moisture content (K; 𝑋11)) forrifamycin B production by Nocardia mediterranei MTCC 14 usingsunflower oil cake under solid-state fermentation.
B production and the corresponding responses are shownin Table 2. The adequacy of the model was calculated, andthe variables evidencing statistically significant effects werescreened via regression analysis (Table 3). Among the elevenproduction parameters (glucose, maltose, ribose, galactose,beef extract, peanut meal, ammonium chloride, ammoniumsulphate, barbital, pH, and moisture content) studied, fourparameters (galactose, ribose, glucose, and pH) were foundto have significant influence on rifamycin B productionas evidenced by their 𝑃 values (<0.05, significant at 5%level) obtained from regression analysis. We used the Paretochart in order to calculate the amplitude and worth of anindependent variable and its interaction with the dependentvariable (Figure 6). The chart displays the actual value of theeffects and draws a reference line on the chart. The lengthof each bar in the chart indicates the standardized effect ofthat factor on the response. Any effect that extends past thisreference line is possibly significant for that certain process[26]. The fact that the bars for maltose, beef extract, peanutmeal, ammonium chloride, ammonium sulphate, barbital,and moisture content remained inward the reference lineas shown in Figure 6 denotes that these terms contributedto the least prediction of the rifamycin B production. Thecoefficient of determination (𝑅2) of the model was found tobe 0.9996 which indicates that the model can explain up to99.96% variation of the data. Rifamycin B yield obtained fromPlackett-Burman design experiments showed wide variation(0.2–1.9%), which indicated that further optimization isnecessary to get a maximum response.

Biochemistry Research International 7
3.3. Effects of Galactose, Ribose, Glucose, and pH on RifamycinB Production. Response surface methodology using centralcomposite design was practical to optimize the levels ofsignificant production parameters resulting from Plackett-Burman design experiments. Thirty experiments were car-ried out from the design and the experimental values aregiven in Table 5. All the experiments were carried out induplicate; the mean value of rifamycin B yield was taken forstatistical analysis. By applying multiple regression analysison the experimental data, the following second-order poly-nomial equation was developed:
Rifamycin B (g/kgds)
= +2306.89958 − 97.84583𝑋4 − 244.48417𝑋3
− 14.31583𝑋1 − 384.39167𝑋10 + 6.26500𝑋4𝑋3
+ 1.50000𝑋4𝑋1 − 1.21000𝑋4𝑋10 − 2.11000𝑋3𝑋1
+ 20.15000𝑋3𝑋10 − 0.98000𝑋1𝑋10 + 4.42750𝑋42
+ 9.07750𝑋32+ 0.89750𝑋1
2+ 22.55000𝑋10
2.
(4)
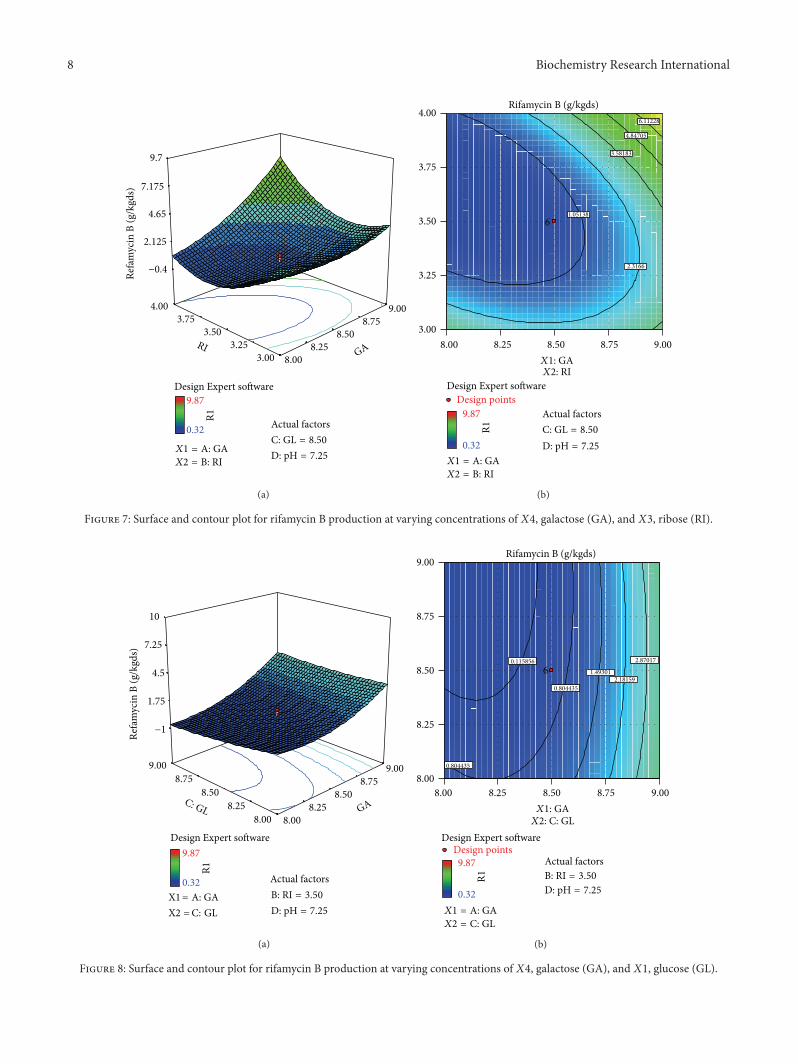
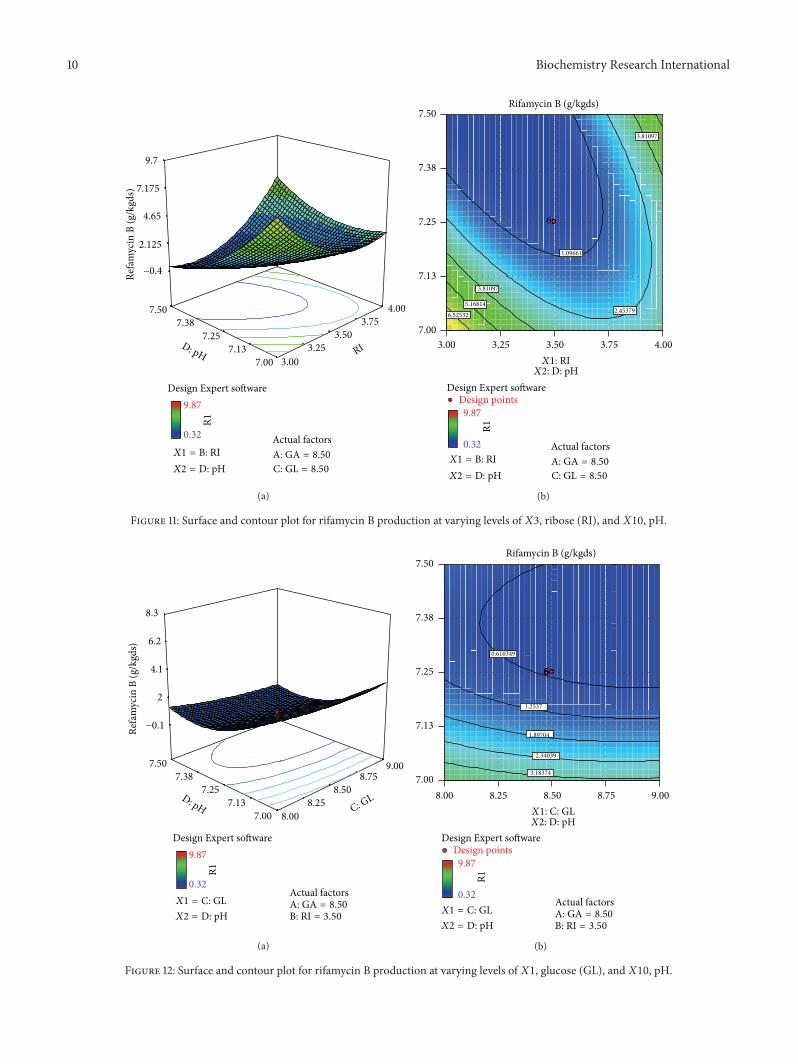
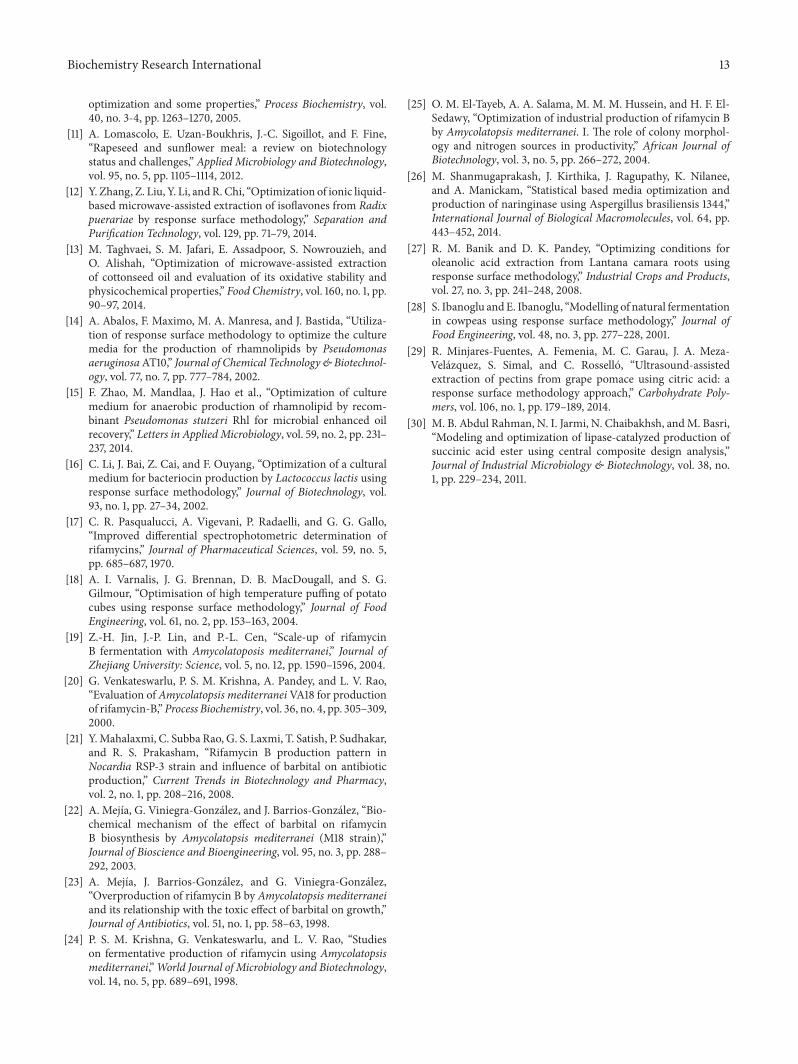
The effects of galactose (𝑋4), ribose (𝑋3), glucose (𝑋1),and pH (𝑋10) on rifamycin B production are reported inTable 7. Response surfaces for rifamycin B yield are shown inFigures 7–12, which give the surface and contour plots for theeffect of galactose, ribose, glucose, and pH on the rifamycin Byield. Regression analysis of the experimental data (Table 7)showed that galactose and ribose had significant positivelinear effects on rifamycin B yield, while glucose and pHhad negative linear effect on rifamycin B yield. This wasclear from the low 𝑃 value obtained from the regressionanalysis. Among the four processes parameters, galactosewas found to have the highest impact on rifamycin B yieldas given by the highest linear coefficient (1.66) followed byribose (0.23), while glucose (−0.40) and pH (−1.38) havenegative linear effect. These production parameters alsoshowed significant positive quadratic effects on rifamycin Byield indicating that rifamycin B production increased as thelevel of these factors increased and decreased as the level ofthese processes parameters decreased below certain values.Table also indicates that the interaction between ribose andpH and between galactose and ribose has significant effecton rifamycin B production and all other interactive variablesare insignificant. Hence, only the term indicating interactionbetween ribose and pH and between galactose and ribose wasincluded in the model regression equation (4).
Figures 7–12 show the surface and contour plots ofrifamycin B produced for each pair of production parametersby keeping the other two production parameters constantat its central level. The effect of galactose and ribose onthe production of rifamycin B is shown in Figure 7. Themaximum rifamycin B (8.34 g/kgds) was obtained at galac-tose 8.5% w/w and ribose 3.25% w/w. Further increase inconcentration of galactose and ribose leads to increase in pro-duction of rifamycin B. Figure 8 indicates that the maximumrifamycin B was produced (5.57 g/kgds) when galactose and
Table 5: Experimental design and results using central compositedesign.
Std. run order Production parameters levels Yieldg/kgds
𝑋4 𝑋3 𝑋1 𝑋10
7 8.00 4.00 9.00 7.00 0.8930 8.50 3.50 8.50 7.25 0.3211 8.00 4.00 8.00 7.50 7.2715 8.00 4.00 9.00 7.50 1.5318 9.50 3.50 8.50 7.25 9.342 9.00 3.00 8.00 7.00 9.4229 8.50 3.50 8.50 7.25 0.5328 8.50 3.50 8.50 7.25 0.8927 8.50 3.50 8.50 7.25 0.4326 8.50 3.50 8.50 7.25 0.7521 8.50 3.50 7.50 7.25 0.868 9.00 4.00 9.00 7.00 6.769 8.00 3.00 8.00 7.50 2.3720 8.50 4.50 8.50 7.25 9.5613 8.00 3.00 9.00 7.50 0.3414 9.00 3.00 9.00 7.50 1.544 9.00 4.00 8.00 7.00 9.786 9.00 3.00 9.00 7.00 8.651 8.00 3.00 8.00 7.00 9.3412 9.00 4.00 8.00 7.50 9.3416 9.00 4.00 9.00 7.50 9.6422 8.50 3.50 9.50 7.25 1.7625 8.50 3.50 8.50 7.25 0.3223 8.50 3.50 8.50 6.75 8.2424 8.50 3.50 8.50 7.75 3.863 8.00 4.00 8.00 7.00 2.3419 8.50 2.50 8.50 7.25 9.4210 9.00 3.00 8.00 7.50 0.745 8.00 3.00 9.00 7.00 9.8717 7.50 3.50 8.50 7.25 0.34𝑋4: galactose,𝑋3: ribose,𝑋1: glucose, and𝑋10: pH.
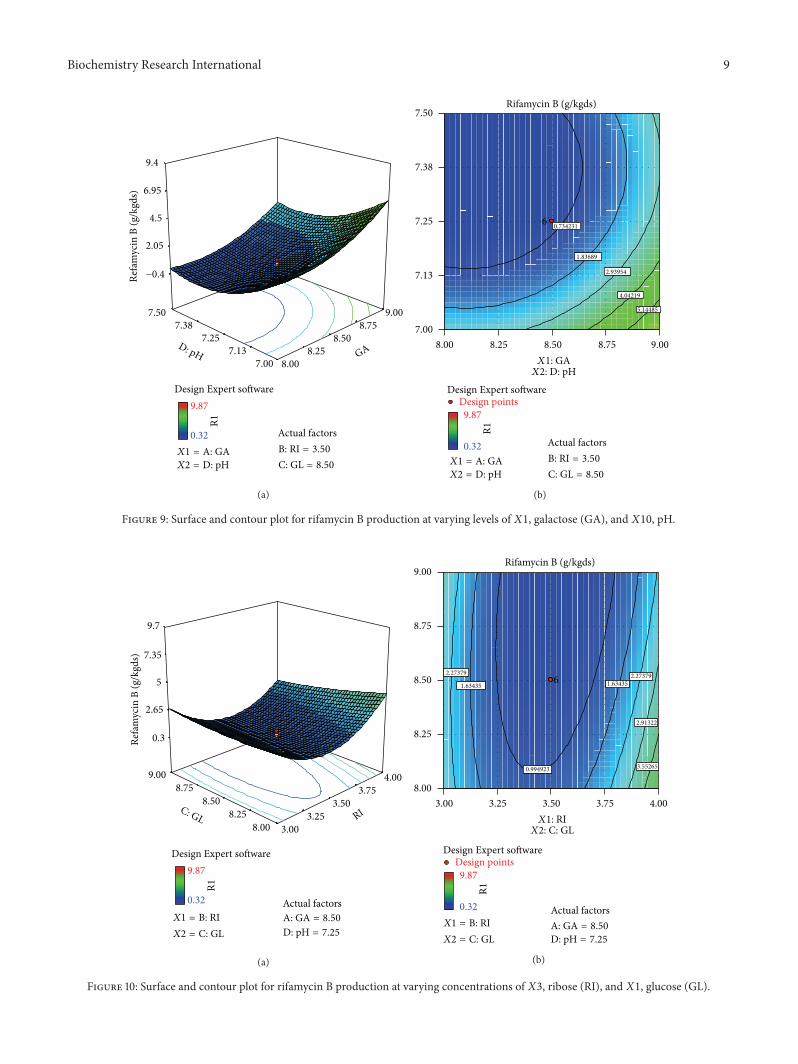
glucose were 8% w/w and 9% w/w; further increase in theconcentration of galactose leads to increase in productionof rifamycin B and further decrease in the concentrationof glucose leads to increase in production of rifamycin B.The surface and contour plot of Figure 9 indicates that themaximum rifamycin B (4.80 g/kgds) production occurredat the galactose of 9% w/w and pH of 7. The productionof rifamycin B increases with increase in concentration ofgalactose up to 9% w/w and decrease in pH up to 7 andfurther increase in the concentration of galactose and furtherdecrease in pH lead to increase in the production of rifamycinB. Figure 10 indicates that the maximum rifamycin B isproduced at the concentrations of ribose above 4% w/w andbelow 3%w/w and glucose above 9%w/w and below 8%w/w.Maximum rifamycin B was produced when concentration ofribose was above 4% w/w and below 3% w/w and pH was
8 Biochemistry Research International
Design Expert software
R1
9.87
0.32 Actual factors
8.008.25
8.508.75
9.00
3.003.25
3.503.75
4.00
−0.4
2.125
4.65
7.175
9.7
Refa
myc
in B
(g/k
gds)
GARI
C: GL = 8.50D: pH = 7.25X1 = A: GA
X2 = B: RI
(a)
Actual factors
Design Expert software
R1
Design points9.87
0.32
8.00 8.25 8.50 8.75 9.003.00
3.25
3.50
3.75
4.00Rifamycin B (g/kgds)
X1: GAX2: RI
1.05138
2.3166
3.58183
4.84705
6.11228
6
C: GL = 8.50D: pH = 7.25
X1 = A: GAX2 = B: RI
(b)
Figure 7: Surface and contour plot for rifamycin B production at varying concentrations of𝑋4, galactose (GA), and 𝑋3, ribose (RI).
8.008.25
8.508.75
9.00
8.008.25
8.508.75
9.00
−1
1.75
4.5
7.25
10
Refa
myc
in B
(g/k
gds)
GAC: GL
Design Expert software
R1
9.87
0.32 Actual factors
X1= A: GAX2 =C: GL
B: RI = 3.50
D: pH = 7.25
(a)
8.00 8.25 8.50 8.75 9.008.00
8.25
8.50
8.75
9.00Rifamycin B (g/kgds)
X1: GAX2: C: GL
0.115856
0.804435
0.804435
1.493012.18159
2.87017
6
Actual factors
Design Expert software
R1
Design points9.87
0.32
B: RI = 3.50D: pH = 7.25
X1 = A: GAX2 = C: GL
(b)
Figure 8: Surface and contour plot for rifamycin B production at varying concentrations of𝑋4, galactose (GA), and𝑋1, glucose (GL).
Biochemistry Research International 9
8.008.25
8.508.75
9.00
7.007.13
7.257.38
7.50
−0.4
2.05
4.5
6.95
9.4
Refa
myc
in B
(g/k
gds)
GAD: pH
R1
9.87
0.32 Actual factorsB: RI = 3.50
C: GL = 8.50
Design Expert software
X1 = A: GAX2 = D: pH
(a)
8.00 8.25 8.50 8.75 9.007.00
7.13
7.25
7.38
7.50Rifamycin B (g/kgds)
X1: GAX2: D: pH
0.734231
1.83689
2.93954
4.04219
5.14485
6
Actual factorsB: RI = 3.50
C: GL = 8.50
Design Expert software
R1
Design points9.87
0.32X1 = A: GAX2 = D: pH
(b)
Figure 9: Surface and contour plot for rifamycin B production at varying levels of𝑋1, galactose (GA), and 𝑋10, pH.
3.003.25
3.503.75
4.00
8.008.25
8.508.75
9.00
0.3
2.65
5
7.35
9.7
Refa
myc
in B
(g/k
gds)
RIC: GL
Actual factorsA: GA = 8.50D: pH = 7.25
X1 = B: RIX2 = C: GL
R1
9.87
0.32
Design Expert software
(a)
3.00 3.25 3.50 3.75 4.008.00
8.25
8.50
8.75
9.00Rifamycin B (g/kgds)
X1: RIX2: C: GL
0.994923
1.63435 1.634352.27379 2.27379
2.91322
3.55265
6
Actual factorsA: GA = 8.50D: pH = 7.25
Design Expert software
R1
Design points9.87
0.32X1 = B: RIX2 = C: GL
(b)
Figure 10: Surface and contour plot for rifamycin B production at varying concentrations of𝑋3, ribose (RI), and𝑋1, glucose (GL).
10 Biochemistry Research International
3.003.25
3.503.75
4.00
7.007.13
7.257.38
7.50
−0.4
2.125
4.65
7.175
9.7
Refa
myc
in B
(g/k
gds)
RID: pH
Actual factorsA: GA = 8.50C: GL = 8.50
X1 = B: RIX2 = D: pH
R1
9.87
0.32
Design Expert software
(a)
3.00 3.25 3.50 3.75 4.007.00
7.13
7.25
7.38
7.50Rifamycin B (g/kgds)
X1: RIX2: D: pH
6
Actual factorsA: GA = 8.50C: GL = 8.50
1.09661
2.45379
3.81097
3.81097
5.168146.52532
Design Expert software
R1
Design points9.87
0.32X1 = B: RIX2 = D: pH
(b)
Figure 11: Surface and contour plot for rifamycin B production at varying levels of 𝑋3, ribose (RI), and𝑋10, pH.
Actual factors
8.008.25
8.508.75
9.00
7.007.13
7.257.38
7.50
−0.1
2
4.1
6.2
8.3
Refa
myc
in B
(g/k
gds)
C: GLD: pH
A: GA = 8.50B: RI = 3.50
R1
9.87
0.32
Design Expert software
X1 = C: GLX2 = D: pH
(a)
Actual factors
8.00 8.25 8.50 8.75 9.007.00
7.13
7.25
7.38
7.50Rifamycin B (g/kgds)
X1: C: GLX2: D: pH
0.610349
1.2537
1.89704
2.54039
3.18374
666666
A: GA = 8.50B: RI = 3.50
Design Expert software
R1
Design points9.87
0.32X1 = C: GLX2 = D: pH
(b)
Figure 12: Surface and contour plot for rifamycin B production at varying levels of 𝑋1, glucose (GL), and𝑋10, pH.

Biochemistry Research International 11
Table 6:ANOVA for the fitted quadratic polynomialmodel of rifamycinBproduction frommediterraneiMTCC 14 by using central compositedesign.
Source SS DF MS 𝐹 value 𝑃 value SignificanceModel 453.92 14 32.42 22.59 <0.0001 Significant𝑋4 66.40 1 66.40 46.27 <0.0001 Significant𝑋3 1.29 1 1.29 0.90 0.3584 Not significant𝑋1 3.82 1 3.82 2.66 0.1234 Not significant𝑋10 45.49 1 45.49 31.70 <0.0001 Significant𝑋4𝑋3 39.25 1 39.25 27.35 0.0001 Significant𝑋4𝑋1 2.25 1 2.25 1.57 0.2297 Not significant𝑋4𝑋10 0.37 1 0.37 0.26 0.6209 Not significant𝑋3𝑋1 4.45 1 4.45 3.10 0.0985 Not significant𝑋3𝑋10 101.51 1 101.51 70.74 <0.0001 Significant𝑋1𝑋10 0.24 1 0.24 0.17 0.6833 Not significant𝑋42 33.60 1 33.60 23.42 0.0002 Significant𝑋32 141.26 1 141.26 98.44 <0.0001 Significant𝑋12 1.38 1 1.38 0.96 0.3422 Not significant𝑋102 54.48 1 54.48 37.97 <0.0001 Significant
Residual 21.52 15 1.43Lack of fit 21.25 10 2.12 38.55 0.0004 Not significantPure error 0.28 5 0.055Cor. total 475.45 29Std. dev.: 1.20, 𝑅2: 0.9547.Mean: 4.55, adjusted 𝑅2: 0.9125.Coefficient of variation (CV) %: 26.34, predicted 𝑅2: 0.7118.Predicted residual sum of squares (PRESS): 122.79, adequate precision: 12.510.SS: sum of square, MS: mean of square, and df: degree of freedom.
Table 7: Coefficients of the multivariate process models for therifamycin B production frommediterraneiMTCC.
Factor Coefficient of estimate Standard errorIntercept 0.54 0.49𝑋4 1.66 0.24𝑋3 0.23 0.24𝑋1 −0.40 0.24𝑋10 −1.38 0.24𝑋4𝑋3 1.57 0.30𝑋4𝑋1 0.37 0.30𝑋4𝑋10 −0.15 0.30𝑋3𝑋1 −0.53 0.30𝑋3𝑋10 2.52 0.30𝑋1𝑋10 −0.12 0.30𝑋42 1.11 0.23𝑋32 2.27 0.23𝑋12 0.22 0.23𝑋102 1.41 0.23
7 (Figure 11). Further decrease in pH leads to accelerationof rifamycin B production. Figure 12 surface and contourplot shows that maximum rifamycin B was produced atconcentration of glucose of 9% w/w and pH was 7.
3.4. Statistical Analysis. Analysis of variance for the rifamycinB produced from Nocardia mediterranei MTCC 14 obtainedfrom this design was given in Table 6. ANOVA gives thevalue of the model and can account for whether this modeladequately fits the variation observed in rifamycin B pro-duced with the designed production level. If the 𝐹-test forthe model is significant at the 5% level (𝑃 < 0.05), thenthe model is fit and can satisfactorily explain the variationascertained. If the 𝐹-test for lack of fit is significant (𝑃 <0.05), then a more complex model is essential to adapt thedata.The high 𝐹-value and nonsignificant lack of fit indicatedthat the quadratic model was highly significant, as reportedin [27, 28]. The 𝑃 value for lack of fit (0.0006) reveals thatthe experimental data obtained fit well with the model andexplains the effect of galactose, ribose, glucose, and pH onrifamycin B produced from theNocardiamediterraneiMTCC14.Thenearer the value of𝑅2 (coefficient of determination) to1, the more correct the correlation between the observed andpredicted values. Here the value of 𝑅2 (0.9547) indicates thatthe model can explain up to 95.47% variation of rifamycin Byield obtained. A coefficient of variance (CV) value of 26.34reveals the high precision and reliability of the experimentaldata. Adequate precision greater than 4.0 is desirable, and theratio was found to be 12.510 (>4.0), which indicates that thederived model is significant for the rifamycin B production.The predicted residual sum of squares (PRESS) value was

12 Biochemistry Research International
Color points by value of R1:
2
X: actualY: predicted
Predicted versus actual
0.00
2.75
5.50
8.25
11.00
0.08 2.73 5.38 8.03 10.68
Design Expert software
9.87
0.32
R1
Figure 13: Plot between actual and predicted yield of rifamycin B.
122.79, which showed how the derived model fits with eachpoint in the given design [29].
3.5. Adequacy of the Model. Model adequacy scrutiny wasused, in order to find whether the derived model wouldgive sufficient approximation values to the actual values [30].Raw residuals are elements of variation for the given data,which cannot be explained by the model, representing thedeviations between the experimental and predicted values.The predicted values from the model were quite close tothe experimental values, and the data of all predicted andexperimental response values lie in a straight line (Figure 13)indicating that the derived model was able to well predict thecorrelation between the process variables on the response.
3.6. Validation of the Model. The experimental data werefitted into the model (4) and the optimum values were foundto be as follows: galactose 8%w/w, ribose 3%w/w, glucose 9%w/w, and pH 7.0. Optimum levels of production parametersfor production of rifamycin B from Nocardia mediterraneiMTCC 14was 9.87 g/kgds, which is very close to the predictedvalue of 10.35 g/kgds.
4. Conclusion
Response surface methodology was well used to optimizethe production parameters for production of rifamycin Bfrom Nocardia mediterranei MTCC 14. To optimize variousprocesses parameters for production of rifamycin B fromNocardiamediterraneiMTCC 14 eleven processes parameters(glucose,maltose, ribose, galactose, beef extract, peanutmeal,ammonium chloride, ammonium sulphate, barbital, pH,and moisture content) were tried by using Plackett-Burmandesign test and the four processes parameters galactose,ribose, glucose, and pH showed significant effects on pro-duction of rifamycin B. The actuality of interactions between
the processes parameters was calculated and the interactionbetween ribose and pH and between galactose and riboseshowed significant effects on production of rifamycin B. Theproduction parameters were optimized by applying centralcomposite design and the parameters for the highest pro-duction of rifamycin B from Nocardia mediterranei MTCC14 were found to be galactose (8% w/w), ribose (3% w/w),glucose (9% w/w), and pH (7.0). The maximum rifamycin Byield from Nocardia mediterranei MTCC 14 was 9.87 g/kgdsdry sunflower oil cake. The second-order polynomial modeldeveloped was found to be acceptable in describing theexperimental data. This is the first report of the optimizationof production of rifamycin B from Nocardia mediterraneiMTCC 14 using response surface methodology.
Conflict of Interests
The authors declare that there is no conflict of interestsregarding the publication of this paper.
Acknowledgment
The authors gratefully acknowledge the technical supportprovided by the Department of Biochemistry, KuvempuUniversity, Shimoga.
References
[1] W.Oppolzer andV. Prelog, “The constitution and configurationof rifamycins B,O, S and SV,”Helvetica ChimicaActa, vol. 56, no.7, pp. 2287–2314, 1973.
[2] P. Sensi, A. M. Greco, and R. Ballotta, “Rifomycin. I. Isolationand properties of rifomycin B and rifomycin complex,” Antibi-otics Annual, vol. 7, pp. 262–270, 1959.
[3] H. G. Floss and T.-W. Yu, “Rifamycin—mode of action, resis-tance, and biosynthesis,” Chemical Reviews, vol. 105, no. 2, pp.621–632, 2005.
[4] U. H. Olker and J. Lenz, “Solid-state fermentationare there anybiotechnological advantages?”CurrentOpinion inMicrobiology,vol. 8, no. 3, pp. 301–306, 2005.
[5] J. Barrios-Gonzalez, “Solid-state fermentation: physiology ofsolid medium, its molecular basis and applications,” ProcessBiochemistry, vol. 47, no. 2, pp. 175–185, 2012.
[6] Y. Mahalaxmi, T. Sathish, C. Subba Rao, and R. S. Prakasham,“Corn husk as a novel substrate for the production of rifamycinB by isolated Amycolatopsis sp. RSP 3 under SSF,” ProcessBiochemistry, vol. 45, no. 1, pp. 47–53, 2010.
[7] K. P. Kota and P. Sridhar, “Solid state cultivation of Streptomycesclavuligerus for cephamycin C production,” Process Biochem-istry, vol. 34, no. 4, pp. 325–328, 1999.
[8] A. Sircar, P. Sridhar, and P. K. Das, “Optimization of solid statemedium for the production of clavulanic acid by Streptomycesclavuligerus,” Process Biochemistry, vol. 33, no. 3, pp. 283–289,1998.
[9] H.-S. Joo, C. G. Kumar, G.-C. Park, S. R. Paik, and C.-S.Chang, “Oxidant and SDS-stable alkaline protease fromBacillusclausii I-52: production and some properties,” Journal of AppliedMicrobiology, vol. 95, no. 2, pp. 267–272, 2003.
[10] H.-S. Joo and C.-S. Chang, “Production of protease from anew alkalophilic Bacillus sp. I-312 grown on soybean meal:
Biochemistry Research International 13
optimization and some properties,” Process Biochemistry, vol.40, no. 3-4, pp. 1263–1270, 2005.
[11] A. Lomascolo, E. Uzan-Boukhris, J.-C. Sigoillot, and F. Fine,“Rapeseed and sunflower meal: a review on biotechnologystatus and challenges,” Applied Microbiology and Biotechnology,vol. 95, no. 5, pp. 1105–1114, 2012.
[12] Y. Zhang, Z. Liu, Y. Li, andR. Chi, “Optimization of ionic liquid-based microwave-assisted extraction of isoflavones from Radixpuerariae by response surface methodology,” Separation andPurification Technology, vol. 129, pp. 71–79, 2014.
[13] M. Taghvaei, S. M. Jafari, E. Assadpoor, S. Nowrouzieh, andO. Alishah, “Optimization of microwave-assisted extractionof cottonseed oil and evaluation of its oxidative stability andphysicochemical properties,” Food Chemistry, vol. 160, no. 1, pp.90–97, 2014.
[14] A. Abalos, F. Maximo, M. A. Manresa, and J. Bastida, “Utiliza-tion of response surface methodology to optimize the culturemedia for the production of rhamnolipids by PseudomonasaeruginosaAT10,” Journal of Chemical Technology & Biotechnol-ogy, vol. 77, no. 7, pp. 777–784, 2002.
[15] F. Zhao, M. Mandlaa, J. Hao et al., “Optimization of culturemedium for anaerobic production of rhamnolipid by recom-binant Pseudomonas stutzeri Rhl for microbial enhanced oilrecovery,” Letters in AppliedMicrobiology, vol. 59, no. 2, pp. 231–237, 2014.
[16] C. Li, J. Bai, Z. Cai, and F. Ouyang, “Optimization of a culturalmedium for bacteriocin production by Lactococcus lactis usingresponse surface methodology,” Journal of Biotechnology, vol.93, no. 1, pp. 27–34, 2002.
[17] C. R. Pasqualucci, A. Vigevani, P. Radaelli, and G. G. Gallo,“Improved differential spectrophotometric determination ofrifamycins,” Journal of Pharmaceutical Sciences, vol. 59, no. 5,pp. 685–687, 1970.
[18] A. I. Varnalis, J. G. Brennan, D. B. MacDougall, and S. G.Gilmour, “Optimisation of high temperature puffing of potatocubes using response surface methodology,” Journal of FoodEngineering, vol. 61, no. 2, pp. 153–163, 2004.
[19] Z.-H. Jin, J.-P. Lin, and P.-L. Cen, “Scale-up of rifamycinB fermentation with Amycolatoposis mediterranei,” Journal ofZhejiang University: Science, vol. 5, no. 12, pp. 1590–1596, 2004.
[20] G. Venkateswarlu, P. S. M. Krishna, A. Pandey, and L. V. Rao,“Evaluation of Amycolatopsis mediterraneiVA18 for productionof rifamycin-B,”Process Biochemistry, vol. 36, no. 4, pp. 305–309,2000.
[21] Y.Mahalaxmi, C. Subba Rao, G. S. Laxmi, T. Satish, P. Sudhakar,and R. S. Prakasham, “Rifamycin B production pattern inNocardia RSP-3 strain and influence of barbital on antibioticproduction,” Current Trends in Biotechnology and Pharmacy,vol. 2, no. 1, pp. 208–216, 2008.
[22] A. Mejıa, G. Viniegra-Gonzalez, and J. Barrios-Gonzalez, “Bio-chemical mechanism of the effect of barbital on rifamycinB biosynthesis by Amycolatopsis mediterranei (M18 strain),”Journal of Bioscience and Bioengineering, vol. 95, no. 3, pp. 288–292, 2003.
[23] A. Mejıa, J. Barrios-Gonzalez, and G. Viniegra-Gonzalez,“Overproduction of rifamycin B by Amycolatopsis mediterraneiand its relationship with the toxic effect of barbital on growth,”Journal of Antibiotics, vol. 51, no. 1, pp. 58–63, 1998.
[24] P. S. M. Krishna, G. Venkateswarlu, and L. V. Rao, “Studieson fermentative production of rifamycin using Amycolatopsismediterranei,”World Journal of Microbiology and Biotechnology,vol. 14, no. 5, pp. 689–691, 1998.
[25] O. M. El-Tayeb, A. A. Salama, M. M. M. Hussein, and H. F. El-Sedawy, “Optimization of industrial production of rifamycin Bby Amycolatopsis mediterranei. I. The role of colony morphol-ogy and nitrogen sources in productivity,” African Journal ofBiotechnology, vol. 3, no. 5, pp. 266–272, 2004.
[26] M. Shanmugaprakash, J. Kirthika, J. Ragupathy, K. Nilanee,and A. Manickam, “Statistical based media optimization andproduction of naringinase using Aspergillus brasiliensis 1344,”International Journal of Biological Macromolecules, vol. 64, pp.443–452, 2014.
[27] R. M. Banik and D. K. Pandey, “Optimizing conditions foroleanolic acid extraction from Lantana camara roots usingresponse surface methodology,” Industrial Crops and Products,vol. 27, no. 3, pp. 241–248, 2008.
[28] S. Ibanoglu andE. Ibanoglu, “Modelling of natural fermentationin cowpeas using response surface methodology,” Journal ofFood Engineering, vol. 48, no. 3, pp. 277–228, 2001.
[29] R. Minjares-Fuentes, A. Femenia, M. C. Garau, J. A. Meza-Velazquez, S. Simal, and C. Rossello, “Ultrasound-assistedextraction of pectins from grape pomace using citric acid: aresponse surface methodology approach,” Carbohydrate Poly-mers, vol. 106, no. 1, pp. 179–189, 2014.
[30] M. B. Abdul Rahman, N. I. Jarmi, N. Chaibakhsh, andM. Basri,“Modeling and optimization of lipase-catalyzed production ofsuccinic acid ester using central composite design analysis,”Journal of Industrial Microbiology & Biotechnology, vol. 38, no.1, pp. 229–234, 2011.

Submit your manuscripts athttp://www.hindawi.com
Hindawi Publishing Corporationhttp://www.hindawi.com Volume 2014
Anatomy Research International
PeptidesInternational Journal of
Hindawi Publishing Corporationhttp://www.hindawi.com Volume 2014
Hindawi Publishing Corporation http://www.hindawi.com
International Journal of
Volume 2014
Zoology
Hindawi Publishing Corporationhttp://www.hindawi.com Volume 2014
Molecular Biology International
GenomicsInternational Journal of
Hindawi Publishing Corporationhttp://www.hindawi.com Volume 2014
The Scientific World JournalHindawi Publishing Corporation http://www.hindawi.com Volume 2014
Hindawi Publishing Corporationhttp://www.hindawi.com Volume 2014
BioinformaticsAdvances in
Marine BiologyJournal of
Hindawi Publishing Corporationhttp://www.hindawi.com Volume 2014
Hindawi Publishing Corporationhttp://www.hindawi.com Volume 2014
Signal TransductionJournal of
Hindawi Publishing Corporationhttp://www.hindawi.com Volume 2014
BioMed Research International
Evolutionary BiologyInternational Journal of
Hindawi Publishing Corporationhttp://www.hindawi.com Volume 2014
Hindawi Publishing Corporationhttp://www.hindawi.com Volume 2014
Biochemistry Research International
ArchaeaHindawi Publishing Corporationhttp://www.hindawi.com Volume 2014
Hindawi Publishing Corporationhttp://www.hindawi.com Volume 2014
Genetics Research International
Hindawi Publishing Corporationhttp://www.hindawi.com Volume 2014
Advances in
Virolog y
Hindawi Publishing Corporationhttp://www.hindawi.com
Nucleic AcidsJournal of
Volume 2014
Stem CellsInternational
Hindawi Publishing Corporationhttp://www.hindawi.com Volume 2014
Hindawi Publishing Corporationhttp://www.hindawi.com Volume 2014
Enzyme Research
Hindawi Publishing Corporationhttp://www.hindawi.com Volume 2014
International Journal of
Microbiology