research article characterization of pm...
TRANSCRIPT
Characterization of PM Produced by Mesh-Quenching of Benzene Pool Flame
Kobayashi Y1, Kawaharazuka F2, Tanaka S1 and Arai M1*
1Department of Mechanical Engineering, Graduate School of Engineering Tokyo Denki University, Japan2Isuzu Advanced Engineering Center, LTD, Fujisawa, Kanagawa, Japan
*Corresponding author: Arai M, Department of Mechanical Engineering, Graduate School of Engineering, Tokyo Denki University, 5 Senju-Asahi-sho, Adachi-ku Tokyo, 120-8551, Japan, Tel: 81.3.5284.5499, E-mail: [email protected]; [email protected]: Kobayashi Y, Kawaharazuka F, Tanaka S, Arai M (2018) Characterization of PM Produced by Mesh-Quenching of Benzene Pool Flame. J Nanosci Nanotechnol 2: 202
Abstract
Keywords: Particulate Matter; Soot; Quench; Benzene Diffusion Flame; PM Size Distribution; PM Density
RESEARCH ARTICLE
Open Access
Volume 2 | Issue 2 ScholArena | www.scholarena.com
Journal of Nanoscience and Nanotechnology Applications
PM (particulate matter including soot) is formed in fuel rich combustion field. Fuel rich field inside a diffusion flame and fuel rich local mixture in turbulent diffusion flame are typical fields of PM formation. Further, flame quenching by low temperature wall sometimes results PM that including soot and many hydrocarbons. However characterization of PM formed in a flame quenching zone is not clarified yet even though many engineering problems are caused by flame quenching PM. In this study, to make clear the influence of flame quenching on PM, PM mass and characteristics such as size distribution and density of PM formed in metal mesh quenching process of laminar diffusion flame with benzene were measured by an electric micro-balance, a Scanning Mobility Particle Sizer (SMPS) and an electric hydrometer. When a metal mesh was inserted into a flame, it was quenched and no flame appeared in a downstream space on the mesh. Some of PM formed in the quenched flame deposited on the mesh and the other PM flowed out through the mesh. From the experimental results, it was confirmed that total formation rate of PM by mesh quenching was 3 times higher than that of normal diffusion flame (free flame). PM peak diameter in number distribution was half times smaller than that of PM exhausted from the tip of the free flame. Density of through PM that was flowing out through the mesh was lower than that of PM deposited on the mesh. It suggested that soot graphitization process was suppressed by mesh quenching. Further, both densities of through PM and deposit PM were far lower than that of PM exhausted from the free flame.
PM (Particulate matter including soot) exhausted from internal combustion engines is one of the major air pollutants and its reduction is strongly required for future engine development. In order to reduce the PM emission, many studies have been carried out by engine researchers, and PM emission decreased obviously [1-6]. It has been known that nanometer size PM (nano-PM, less than 100 nm) is formed in diesel and direct injection (DI) type gasoline engines [7]. Though a mass ratio of nano-PM in engine emission is very low, it seems that considerable number of nano-PM is formed, and its health effect is feared. For further reduction of the nano-PM emission, detail information about chemical and physical processes of nano-PM formation and oxidation in combustion process is necessary [8-10].
Introduction
Polycyclic aromatic hydrocarbons (PAHs) are precursors of nano-PM and PAHs investigation in a flame is very important to understand the formation mechanism of nano-PM. Then, in-flame investigation of PAHs had been carried out using laser induced fluorescence (LIF) method [11-15]. Number of carbon atoms in a PAH molecule was estimated by LIF spectrum from PAH molecule. Moreover, quantitative measurement of PAH concentrations in a diffusion flame was carried out using a gas chromatography system [13]. As for the direct measurement of soot particles, a laser induced incandescence (LII) method had been developed, and soot growth behavior in a flame was discussed [16-18]. By these investigations, relationship between flame structure and transition region from PAHs to soot was clarified.
PM is formed in fuel rich combustion field. Fuel rich field inside a diffusion flame and fuel rich local mixture in turbulent diffusion flame are typical fields of PM formation. Further, flame quenching by low temperature wall sometimes results PM that including
Article history: Received: 20 April 2018, Accepted: 18 May 2018, Published: 21 May 2018
J Nanosci Nanotech Applic 2
Volume 2 | Issue 2 ScholArena | www.scholarena.com
soot and hydrocarbons. It might be the formation mechanism of nano-size PM from internal combustion engine. Nano-size PM emission, in-cylinder deposits contamination, and heat transfer reduction problem through cylinder wall have relevance to deposit PM by flame quenching. However characterization of PM formed in a flame quenching zone is not clarified yet even though many engineering problems are caused by quenching formation PM.
Experimental Setup
Wall quenching problem of unburned hydrocarbon emissions from gas engine was widely investigated by M. Bellenoue, et al. and M. A. Turcios, C. Jainski, et al., measured CO concentration near quenching wall [19-21]. Using wall impingement methane premixed flame, Y. Wang, et al. investigated visible soot emission [22]. When PM formation by wall quenching took place, formed PM deposited on the wall and it changed thermal characteristics of quenching wall surface. It meant that wall quenching phenomena of flame coupled with PM formation was transient phenomena and hard to be settled as scientific and engineering problem to be investigated. Then, there were many research works on PM formed in fuel rich flame, but was no fundamental flame research on PM formed through flame quenching process. We need a simple and fundamental experimental apparatus for PM investigation relevant to flame quenching.
In this study, to make clear the influence of flame quenching on PM formation and oxidation, characteristics such as size distribution and density of PM formed in laminar diffusion benzene flame that was quenched by metal mesh were measured and discussed.
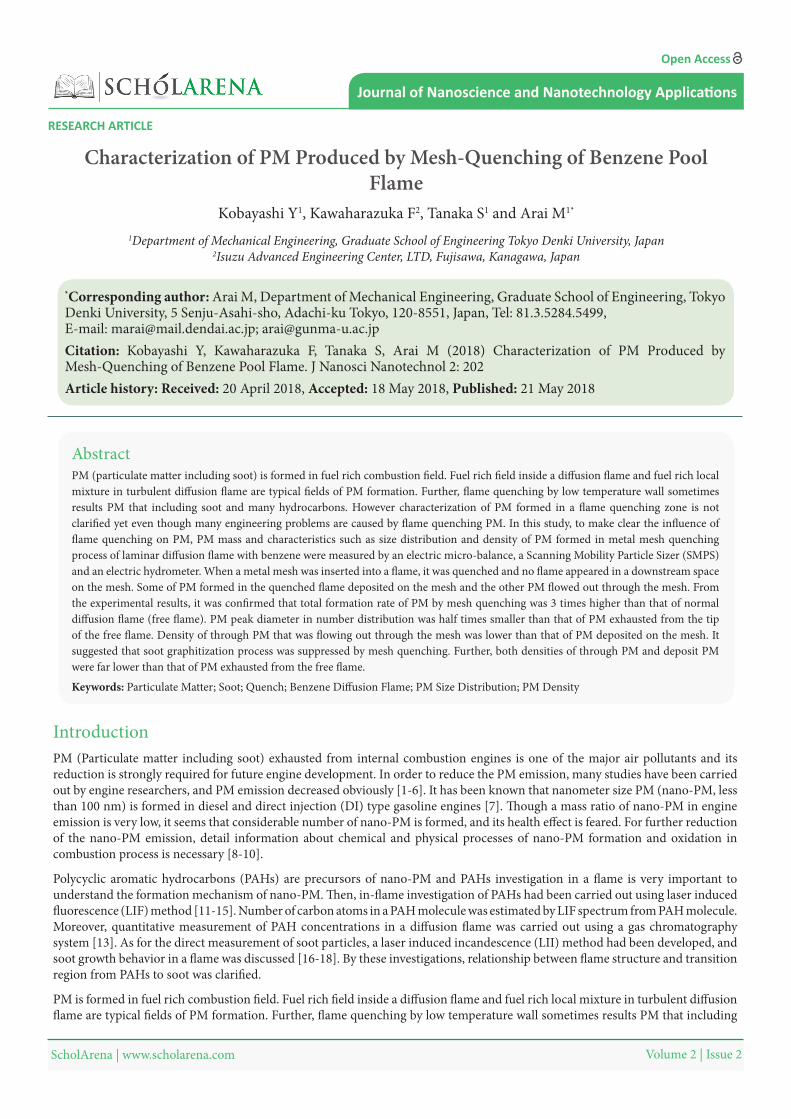
Pool combustion equipment was used to form a laminar diffusion flame of liquid fuel. Figure 1 shows the scheme of equipment, and a benzene (C6H6) diffusion flame was formed in this experiment. Fuel was supplied from the fuel tank through a float chamber. Inner diameter of the pool was 16mm, and its depth was 12mm. Float chamber could keep the fuel surface at a constant level to make a stable flame of constant fuel feeding rate. Fuel consumption rate Mf (flame length Lf) was controlled by adjustment of the fuel surface level. It was the same level of a float chamber fuel surface that was kept constant by a float and needle valve system. The weight of fuel supply equipment was measured by the electric microbalance and the Mf was derived from the weight loss of it. The detail of the equipment was explained in the literature [23].
Figure 1: Pool combustion equipment [23]
In order to quench the flame, a stainless steel mesh (wire dia. = 0.5 mm, 10 mesh/inch) with water cooling pipe was inserted into the benzene flame. The stainless steel mesh used for experiment was shown in Figure 2. Various mesh sizes and aperture ratios of mesh were tested and finally we chosen the stainless steel mesh shown here. This selection came from the adequate trade-off between quenching distance and obstruction of flow field. When a high mesh such as 15mesh/inch and wire dia. = 0.5 mm was used, it could quench the flame completely but burning gas passed slightly through the mesh. The mesh of high aperture ratio hardly disturbed the flow field but it quenched the flame. In this study, r-z coordinate originating pool rim center was adopted and mesh inserting height from pool rim was defined by zm. When a spray flame is impinged to a furnace/combustion wall, wall quenching process was maintained in turbulent combustion process of heterogeneous spray mixture.
Figure 2: Stainless steel mesh [23]
J Nanosci Nanotech Applic 3
Volume 2 | Issue 2 ScholArena | www.scholarena.com
Feature of flame quenched by mesh
Though there was difference of turbulent spray flame and laminar diffusion flame by the pool combustion equipment, they might have the same macroscopic structure of diffusion flame of vaporized liquid fuel. Then pool flame quenching by metal mesh can be considered that it simulates the fundamental behavior of wall quenching of spray combustion.
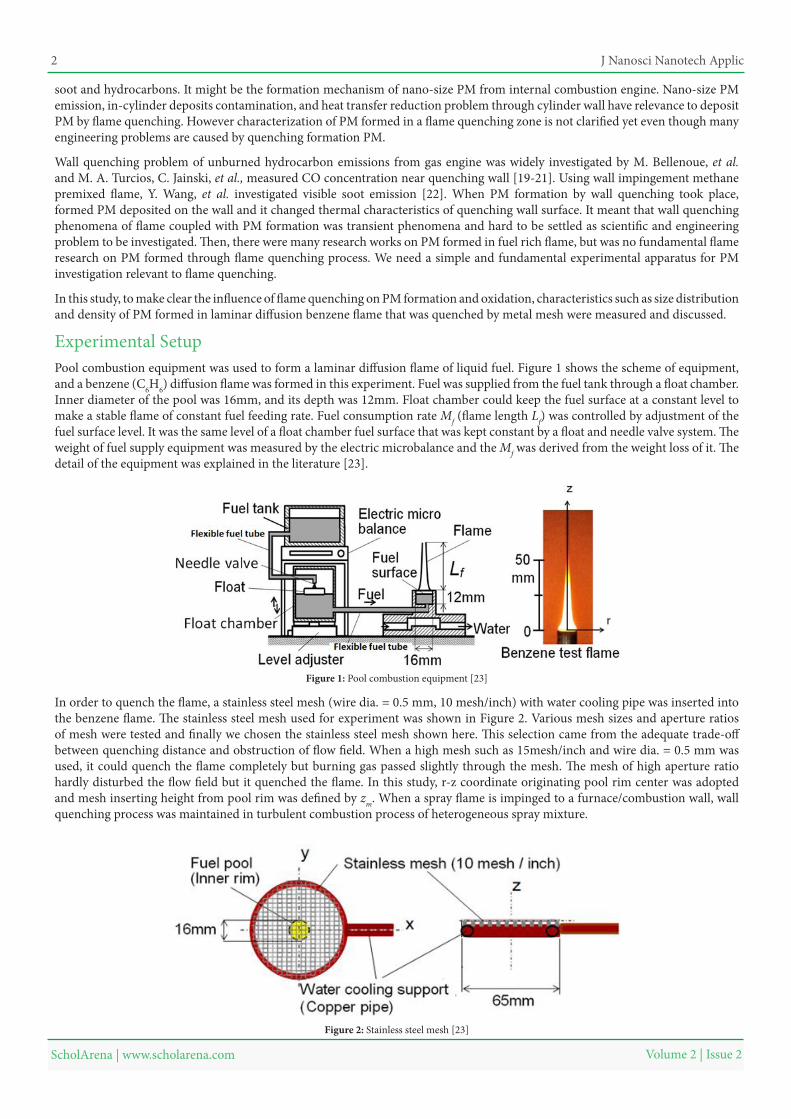
Figure 3 shows the PM sampling system used here. In order to measure mass and density of PM exhausted from the test flame, PM in a whole burned gas was captured on a quartz-fiber filter with a suction pump system shown in Figure 3(a). Mass (mPM) of PM captured on the filter was weighted by an electric microbalance, and PM density was measured using an electric hydrometer (EW-300SG, Alfa-Mirage) of immersion type. Here, some of PM formed in the flame deposited directly on the quenching mesh. So, deposit PM on the mesh was collected, and mass and density of it were measured with the same manner as PM captured by filter.
(a) Sampling method for PM mass measurement (b) Sampling method for PM size measurementFigure 3: PM sampling method [23]
Size distribution and number concentration of PM were measured by a scanning mobility particle sizer (SMPS3034, TSI) in Figure 3(b). In general, PM in combustion gas is sampled directly by the SMPS. However, this method has problems of particle loss to the sampling line wall and diameter change by agglomeration, because PM concentration emitted from benzene diffusion flame of this study was very high. So, in this study, PM was sampled by a syringe and was quickly diluted with N2 gas previously filled in the sampling bag. Particle concentration measured with the SMPS was expressed in number concentration per unit volume (#/cm3). Since PM distributed in wide size range from 10nm to 500 nm and both of small and large sizes of PM needed to be discussed, number distribution versus particle size was usually expressed by a lognormal style relationship of dN/dlog (Dp) vs. log (Dp) and unit of this expression was #/cm3 [24,25]. This expression was convenient for a combustion study of pre-mixed mixture and engine emission, because total amount of burned gas was known. As for a diffusion flame such as the test flame of this experiment, number concentration per unit fuel mass was convenient, because of no information of the amount of burned gas. The particle number per unit mass of fuel flow rate was defined by equation (1). dN*/dlog (Dp) was the fuel mass base number concentration with the unit of [#/mg-fuel].
1* (1)log( ) log( )f
QdN dNd Dp M d Dp
α=
α : Dilution ratio [cm3/cm3]Mf : Fuel consumption rate [mg/s]Q1 : Combustion gas volume flow rate [cm3/s]
Results and Discussion
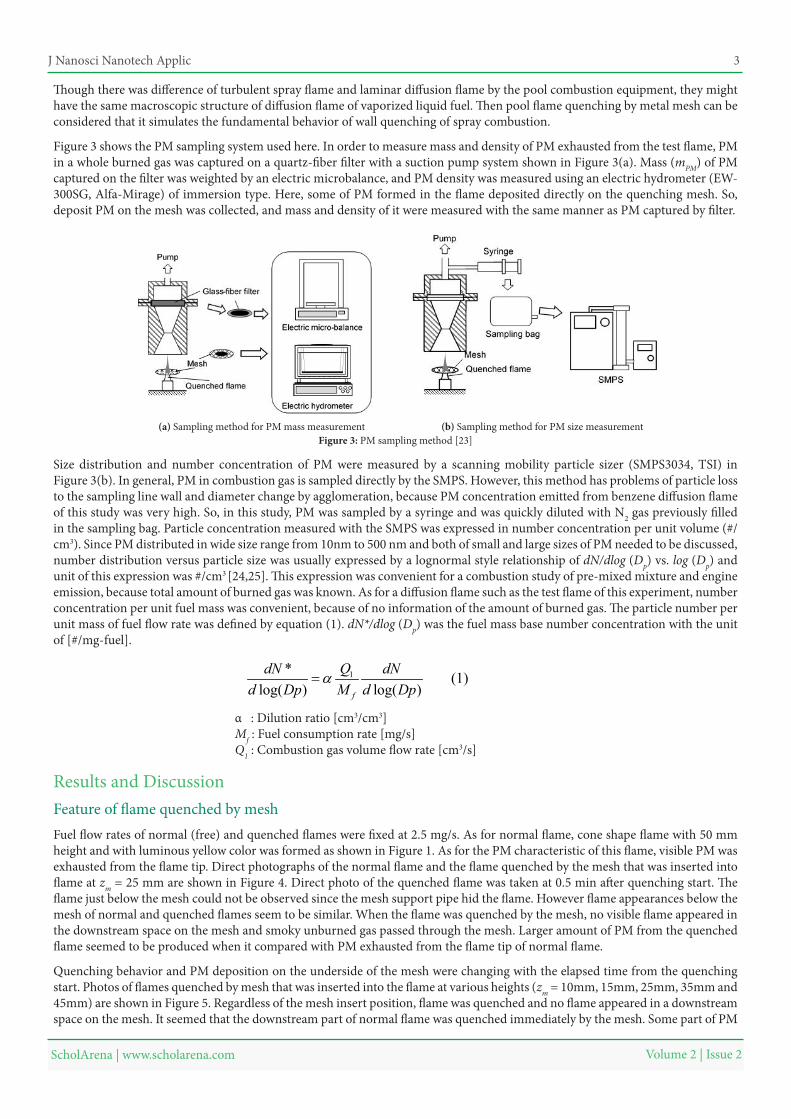
Fuel flow rates of normal (free) and quenched flames were fixed at 2.5 mg/s. As for normal flame, cone shape flame with 50 mm height and with luminous yellow color was formed as shown in Figure 1. As for the PM characteristic of this flame, visible PM was exhausted from the flame tip. Direct photographs of the normal flame and the flame quenched by the mesh that was inserted into flame at zm = 25 mm are shown in Figure 4. Direct photo of the quenched flame was taken at 0.5 min after quenching start. The flame just below the mesh could not be observed since the mesh support pipe hid the flame. However flame appearances below the mesh of normal and quenched flames seem to be similar. When the flame was quenched by the mesh, no visible flame appeared in the downstream space on the mesh and smoky unburned gas passed through the mesh. Larger amount of PM from the quenched flame seemed to be produced when it compared with PM exhausted from the flame tip of normal flame.
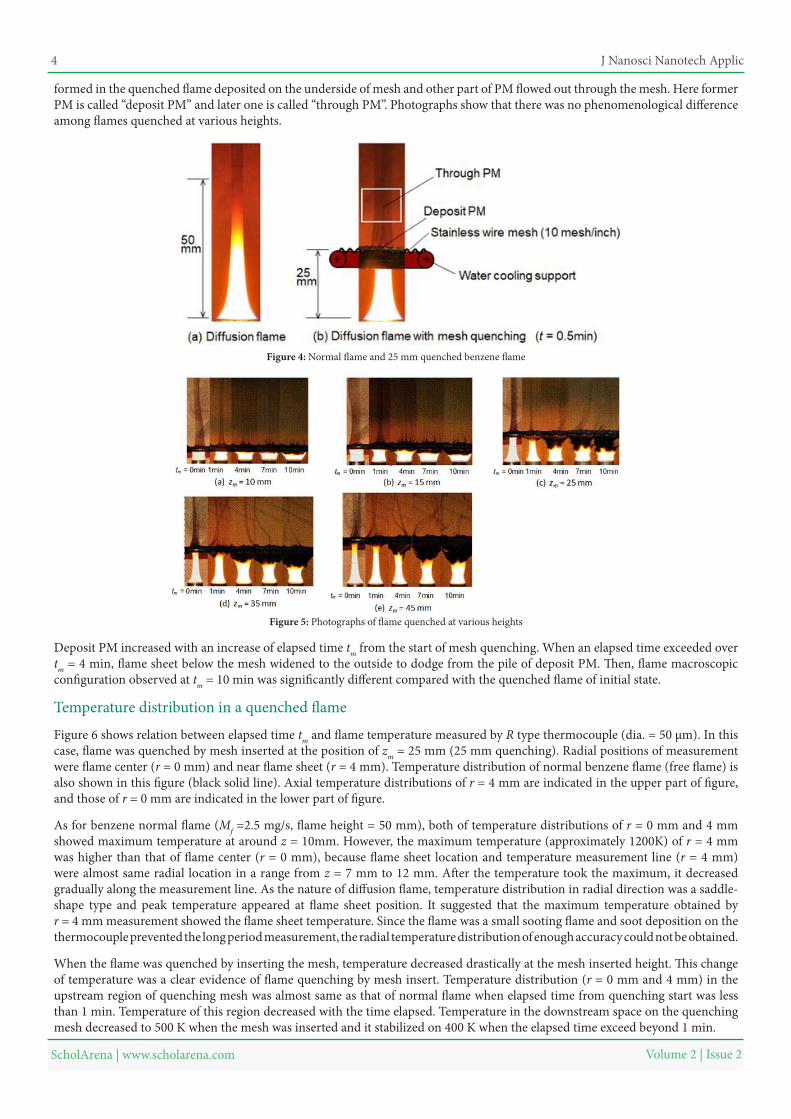
Quenching behavior and PM deposition on the underside of the mesh were changing with the elapsed time from the quenching start. Photos of flames quenched by mesh that was inserted into the flame at various heights (zm = 10mm, 15mm, 25mm, 35mm and 45mm) are shown in Figure 5. Regardless of the mesh insert position, flame was quenched and no flame appeared in a downstream space on the mesh. It seemed that the downstream part of normal flame was quenched immediately by the mesh. Some part of PM
J Nanosci Nanotech Applic 4
Volume 2 | Issue 2 ScholArena | www.scholarena.com
formed in the quenched flame deposited on the underside of mesh and other part of PM flowed out through the mesh. Here former PM is called “deposit PM” and later one is called “through PM”. Photographs show that there was no phenomenological difference among flames quenched at various heights.
Figure 4: Normal flame and 25 mm quenched benzene flame
Deposit PM increased with an increase of elapsed time tm from the start of mesh quenching. When an elapsed time exceeded over tm = 4 min, flame sheet below the mesh widened to the outside to dodge from the pile of deposit PM. Then, flame macroscopic configuration observed at tm = 10 min was significantly different compared with the quenched flame of initial state.
Figure 5: Photographs of flame quenched at various heights
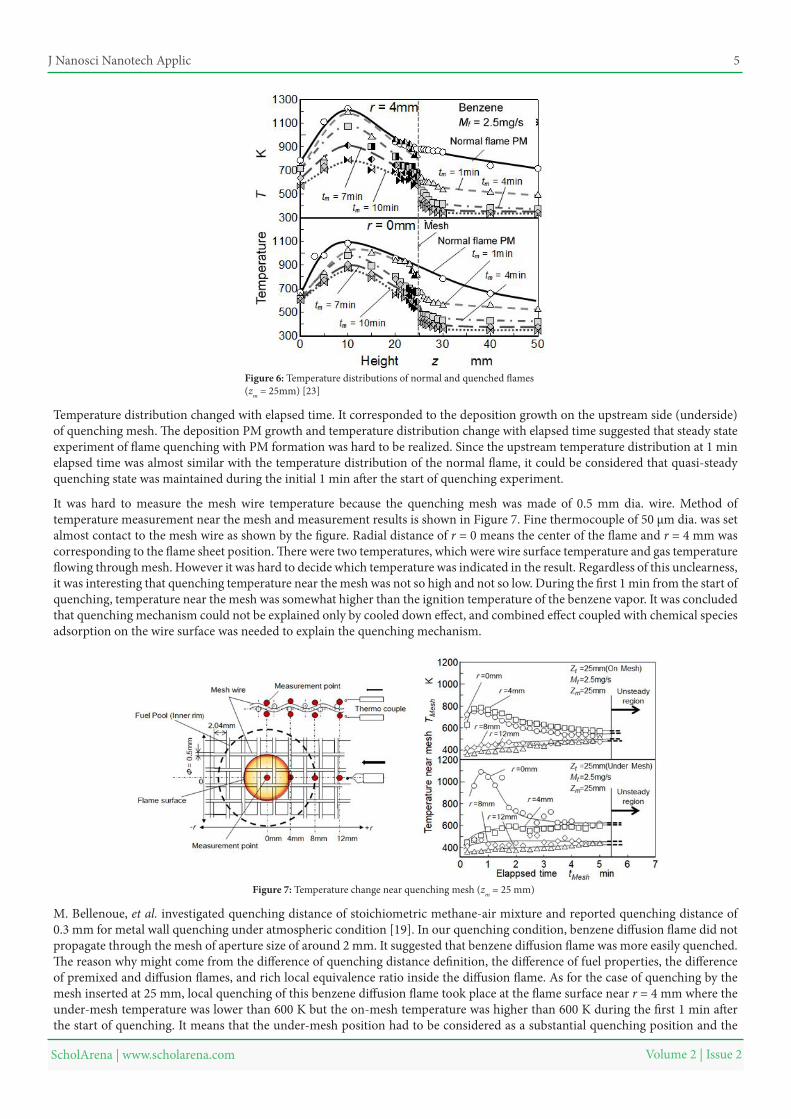
Figure 6 shows relation between elapsed time tm and flame temperature measured by R type thermocouple (dia. = 50 μm). In this case, flame was quenched by mesh inserted at the position of zm = 25 mm (25 mm quenching). Radial positions of measurement were flame center (r = 0 mm) and near flame sheet (r = 4 mm). Temperature distribution of normal benzene flame (free flame) is also shown in this figure (black solid line). Axial temperature distributions of r = 4 mm are indicated in the upper part of figure, and those of r = 0 mm are indicated in the lower part of figure.
Temperature distribution in a quenched flame
As for benzene normal flame (Mf =2.5 mg/s, flame height = 50 mm), both of temperature distributions of r = 0 mm and 4 mm showed maximum temperature at around z = 10mm. However, the maximum temperature (approximately 1200K) of r = 4 mm was higher than that of flame center (r = 0 mm), because flame sheet location and temperature measurement line (r = 4 mm) were almost same radial location in a range from z = 7 mm to 12 mm. After the temperature took the maximum, it decreased gradually along the measurement line. As the nature of diffusion flame, temperature distribution in radial direction was a saddle-shape type and peak temperature appeared at flame sheet position. It suggested that the maximum temperature obtained by r = 4 mm measurement showed the flame sheet temperature. Since the flame was a small sooting flame and soot deposition on the thermocouple prevented the long period measurement, the radial temperature distribution of enough accuracy could not be obtained.
When the flame was quenched by inserting the mesh, temperature decreased drastically at the mesh inserted height. This change of temperature was a clear evidence of flame quenching by mesh insert. Temperature distribution (r = 0 mm and 4 mm) in the upstream region of quenching mesh was almost same as that of normal flame when elapsed time from quenching start was less than 1 min. Temperature of this region decreased with the time elapsed. Temperature in the downstream space on the quenching mesh decreased to 500 K when the mesh was inserted and it stabilized on 400 K when the elapsed time exceed beyond 1 min.
J Nanosci Nanotech Applic 5
Volume 2 | Issue 2 ScholArena | www.scholarena.com
Temperature distribution changed with elapsed time. It corresponded to the deposition growth on the upstream side (underside) of quenching mesh. The deposition PM growth and temperature distribution change with elapsed time suggested that steady state experiment of flame quenching with PM formation was hard to be realized. Since the upstream temperature distribution at 1 min elapsed time was almost similar with the temperature distribution of the normal flame, it could be considered that quasi-steady quenching state was maintained during the initial 1 min after the start of quenching experiment.
Figure 6: Temperature distributions of normal and quenched flames (zm = 25mm) [23]
It was hard to measure the mesh wire temperature because the quenching mesh was made of 0.5 mm dia. wire. Method of temperature measurement near the mesh and measurement results is shown in Figure 7. Fine thermocouple of 50 μm dia. was set almost contact to the mesh wire as shown by the figure. Radial distance of r = 0 means the center of the flame and r = 4 mm was corresponding to the flame sheet position. There were two temperatures, which were wire surface temperature and gas temperature flowing through mesh. However it was hard to decide which temperature was indicated in the result. Regardless of this unclearness, it was interesting that quenching temperature near the mesh was not so high and not so low. During the first 1 min from the start of quenching, temperature near the mesh was somewhat higher than the ignition temperature of the benzene vapor. It was concluded that quenching mechanism could not be explained only by cooled down effect, and combined effect coupled with chemical species adsorption on the wire surface was needed to explain the quenching mechanism.
Figure 7: Temperature change near quenching mesh (zm = 25 mm)
M. Bellenoue, et al. investigated quenching distance of stoichiometric methane-air mixture and reported quenching distance of 0.3 mm for metal wall quenching under atmospheric condition [19]. In our quenching condition, benzene diffusion flame did not propagate through the mesh of aperture size of around 2 mm. It suggested that benzene diffusion flame was more easily quenched. The reason why might come from the difference of quenching distance definition, the difference of fuel properties, the difference of premixed and diffusion flames, and rich local equivalence ratio inside the diffusion flame. As for the case of quenching by the mesh inserted at 25 mm, local quenching of this benzene diffusion flame took place at the flame surface near r = 4 mm where the under-mesh temperature was lower than 600 K but the on-mesh temperature was higher than 600 K during the first 1 min after the start of quenching. It means that the under-mesh position had to be considered as a substantial quenching position and the
J Nanosci Nanotech Applic 6
Volume 2 | Issue 2 ScholArena | www.scholarena.com
substantial quenching distance might be lower than 1 mm.
Apparent quenching phenomena at various heights shown in Figure 5 seemed to be no difference. It meant that quenching of this diffusion flame was affected by the local diffusion combustion at flame sheet. Heat loss and termination of combustion reaction by wall was the fundamental mechanism of quenching. However mesh prevented local air entrainment from surroundings and it resulted another style of quenching. Then it was considered that mesh quenching distance of diffusion flame might be larger than that of a fundamental premixed flame. After local flame quenching started, local mixing of air supplied from upper side of quenching mesh and quenched unburned mixture was rapidly processed with the flow disturbance created by mesh, and apparent quenching propagated to whole the flame.
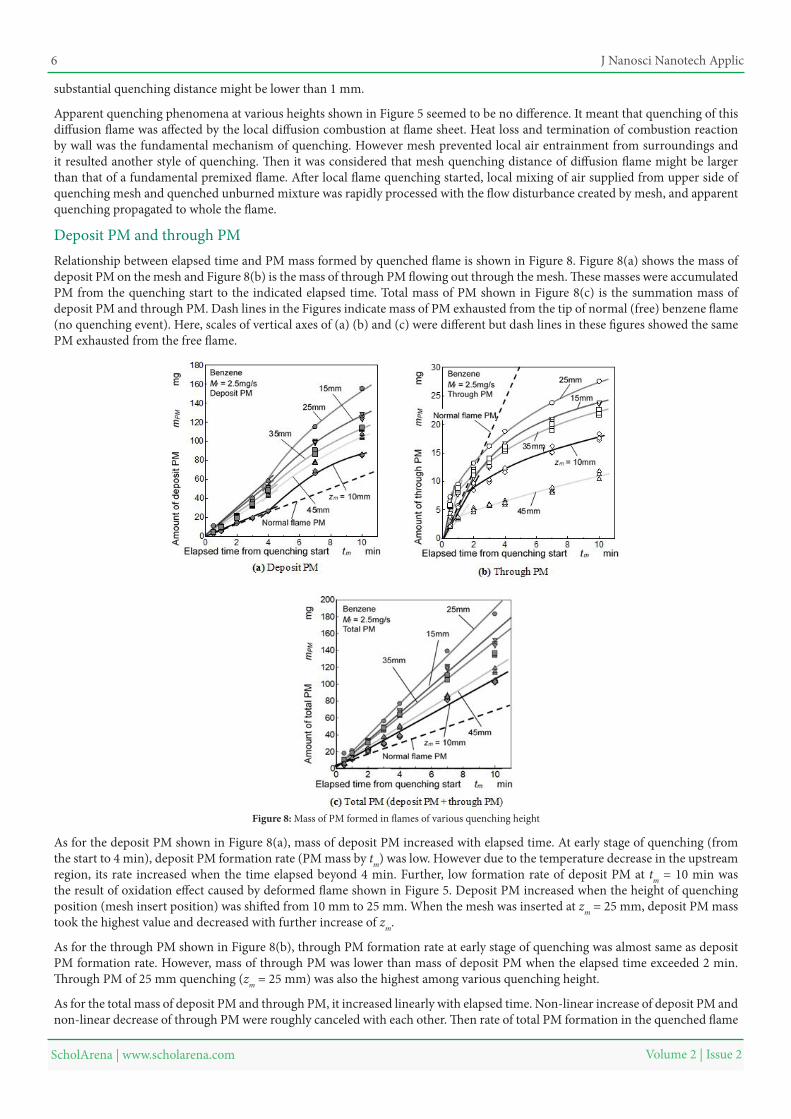
Relationship between elapsed time and PM mass formed by quenched flame is shown in Figure 8. Figure 8(a) shows the mass of deposit PM on the mesh and Figure 8(b) is the mass of through PM flowing out through the mesh. These masses were accumulated PM from the quenching start to the indicated elapsed time. Total mass of PM shown in Figure 8(c) is the summation mass of deposit PM and through PM. Dash lines in the Figures indicate mass of PM exhausted from the tip of normal (free) benzene flame (no quenching event). Here, scales of vertical axes of (a) (b) and (c) were different but dash lines in these figures showed the same PM exhausted from the free flame.
Deposit PM and through PM
Figure 8: Mass of PM formed in flames of various quenching height
As for the deposit PM shown in Figure 8(a), mass of deposit PM increased with elapsed time. At early stage of quenching (from the start to 4 min), deposit PM formation rate (PM mass by tm) was low. However due to the temperature decrease in the upstream region, its rate increased when the time elapsed beyond 4 min. Further, low formation rate of deposit PM at tm = 10 min was the result of oxidation effect caused by deformed flame shown in Figure 5. Deposit PM increased when the height of quenching position (mesh insert position) was shifted from 10 mm to 25 mm. When the mesh was inserted at zm = 25 mm, deposit PM mass took the highest value and decreased with further increase of zm.
As for the through PM shown in Figure 8(b), through PM formation rate at early stage of quenching was almost same as deposit PM formation rate. However, mass of through PM was lower than mass of deposit PM when the elapsed time exceeded 2 min. Through PM of 25 mm quenching (zm = 25 mm) was also the highest among various quenching height.
As for the total mass of deposit PM and through PM, it increased linearly with elapsed time. Non-linear increase of deposit PM and non-linear decrease of through PM were roughly canceled with each other. Then rate of total PM formation in the quenched flame
J Nanosci Nanotech Applic 7
Volume 2 | Issue 2 ScholArena | www.scholarena.com
was uniquely determined regardless of elapsed time. It meant that quantity of PM formed by flame quenching was not changed by the apparent deposition state which was changing with elapsed time. In an early time from the experiment start, PM formed by quenching escaped from deposition and much of it flowed out through the mesh. However later stage of the experiment, much of PM was captured on the mesh because of the low mesh aperture caused substantially by previously deposited PM. Rate of total PM formation was approximately 0.3 mg/s when the mesh was inserted at zm = 25 mm. Its value was 3 times higher than the PM exhaust rate of normal benzene flame. It meant that 12 % of fuel was converted to PM.
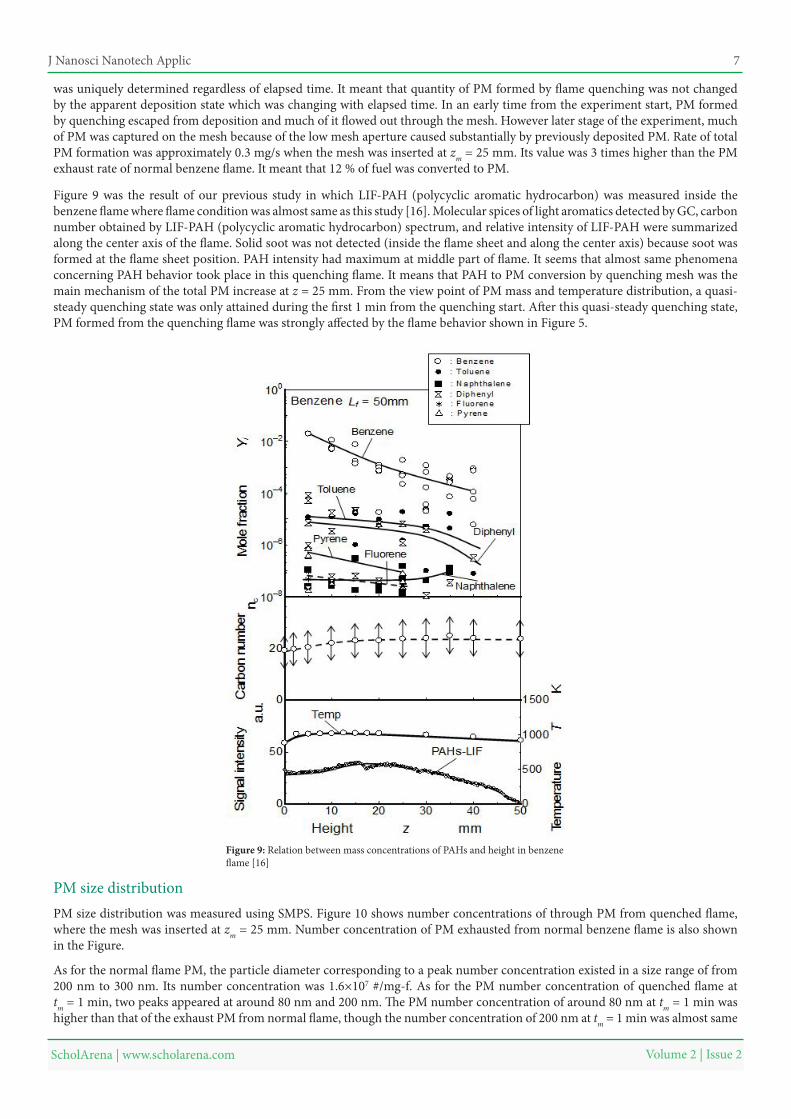
Figure 9 was the result of our previous study in which LIF-PAH (polycyclic aromatic hydrocarbon) was measured inside the benzene flame where flame condition was almost same as this study [16]. Molecular spices of light aromatics detected by GC, carbon number obtained by LIF-PAH (polycyclic aromatic hydrocarbon) spectrum, and relative intensity of LIF-PAH were summarized along the center axis of the flame. Solid soot was not detected (inside the flame sheet and along the center axis) because soot was formed at the flame sheet position. PAH intensity had maximum at middle part of flame. It seems that almost same phenomena concerning PAH behavior took place in this quenching flame. It means that PAH to PM conversion by quenching mesh was the main mechanism of the total PM increase at z = 25 mm. From the view point of PM mass and temperature distribution, a quasi-steady quenching state was only attained during the first 1 min from the quenching start. After this quasi-steady quenching state, PM formed from the quenching flame was strongly affected by the flame behavior shown in Figure 5.
Figure 9: Relation between mass concentrations of PAHs and height in benzene flame [16]
PM size distribution was measured using SMPS. Figure 10 shows number concentrations of through PM from quenched flame, where the mesh was inserted at zm = 25 mm. Number concentration of PM exhausted from normal benzene flame is also shown in the Figure.
PM size distribution
As for the normal flame PM, the particle diameter corresponding to a peak number concentration existed in a size range of from 200 nm to 300 nm. Its number concentration was 1.6×10⁷ #/mg-f. As for the PM number concentration of quenched flame at tm = 1 min, two peaks appeared at around 80 nm and 200 nm. The PM number concentration of around 80 nm at tm = 1 min was higher than that of the exhaust PM from normal flame, though the number concentration of 200 nm at tm = 1 min was almost same

J Nanosci Nanotech Applic 8
Volume 2 | Issue 2 ScholArena | www.scholarena.com
order of the exhaust PM. It means that quenched flame emitted more nucleation mode particles compared with the normal flame. PM number concentration of around 80 nm increased with an elapsed time increase, and that of around 200 nm decreased with the time elapsed.
Nano-size PM less than 100 nm were typical for all elapsed time conditions and it shows the clear difference from the normal flame PM. This change was drastically caused during the first 1 min quenching period. As mentioned before, since the temperature distribution below the mesh was almost same as the normal flame in the quasi-steady quenching state during the first 1 min from quenching start, formation of nano-size PM less than 100 nm was considered to be substantial effect of flame quenching by the mesh (Figure 6). Nano-size PM contained in through PM from quenched flame is considered as the extra PM that was formed from unburned fuel vapor inside the diffusion flame. As the result of nano-size PM formation, bimodal lognormal distribution appeared. the first peak (at around 80 nm) of through PM was half times smaller than that of PM exhausted from the tip of the free flame but its value was two or more times higher than the peak of the free (normal) flame PM. There are many literatures that suggested typical nano-size PM emission from gasoline and diesel engines [26-29]. However the formation zone of nano-size PM in a cylinder was not discussed well. Nano-size PM in the through PM suggests that nano-size PM exhausted from internal combustion engine might be formed in a quenching zone near cold wall.
Figure 10: Number concentration of PM [23]
Usually nano-size PM contained much of volatile compositions and its apparent density tended to be low. Then quenching effect on PM density was discussed in this section. Apparent density of PM was measured using the electric hydrometer. Figure 11 shows the relationship between elapsed time from quenching start and density change of PM formed by quenched flame. Densities of the normal flame PM, carbon black as amorphous carbon (SIGMA-ALDRICH) and graphite carbon (WAKO) are also indicated in the Figure 11.
Density of PM
Figure 11: PM density
J Nanosci Nanotech Applic 9
Volume 2 | Issue 2 ScholArena | www.scholarena.com
As for early stage of mesh quenching, densities of both deposit PM and through PM from quenched flame at various zm were lower than exhausted PM from the tip of normal flame. Moreover, these densities were obviously lower than that of carbon black. In previous analysis on graphitization degree (G/D ratio) of soot inside a flame using a laser Raman spectroscopy, relationship between flame temperature raising and graphitization degree was reported [30,31]. It reported that high density of carbon material corresponded to high graphitic degree structure of it. Further, carbon material of higher G/D ratio meant larger graphitization structure size [32]. So, it was concluded that graphitization degree of PM formed in quenched flame was lower than those of the normal flame PM and carbon black known as amorphous carbon material. Density of deposit PM significantly increased with an increase of elapsed time, although density of through PM increased slightly with elapsed time. Since PM deposited on the mesh was heated by hot flame, it was considered that graphitization of deposit PM was promoted. However this graphitization process hardly affected to through PM and it was kept in amorphous state.
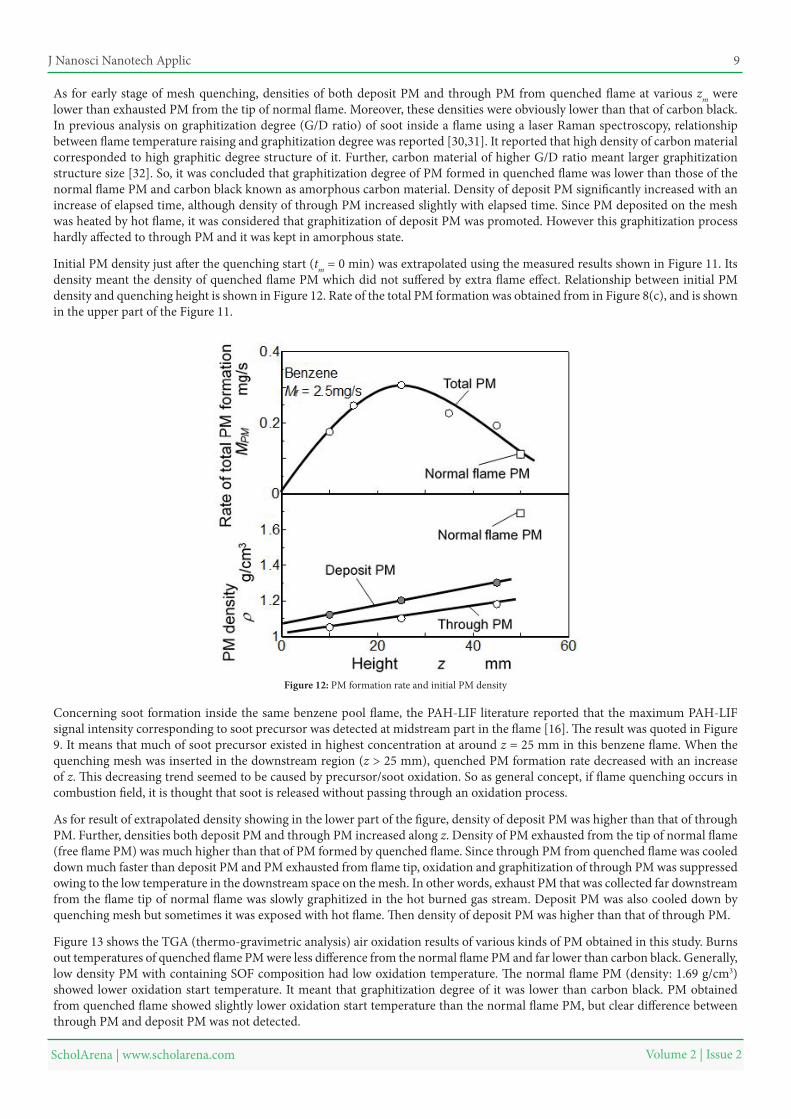
Initial PM density just after the quenching start (tm = 0 min) was extrapolated using the measured results shown in Figure 11. Its density meant the density of quenched flame PM which did not suffered by extra flame effect. Relationship between initial PM density and quenching height is shown in Figure 12. Rate of the total PM formation was obtained from in Figure 8(c), and is shown in the upper part of the Figure 11.
Figure 12: PM formation rate and initial PM density
Concerning soot formation inside the same benzene pool flame, the PAH-LIF literature reported that the maximum PAH-LIF signal intensity corresponding to soot precursor was detected at midstream part in the flame [16]. The result was quoted in Figure 9. It means that much of soot precursor existed in highest concentration at around z = 25 mm in this benzene flame. When the quenching mesh was inserted in the downstream region (z > 25 mm), quenched PM formation rate decreased with an increase of z. This decreasing trend seemed to be caused by precursor/soot oxidation. So as general concept, if flame quenching occurs in combustion field, it is thought that soot is released without passing through an oxidation process.
As for result of extrapolated density showing in the lower part of the figure, density of deposit PM was higher than that of through PM. Further, densities both deposit PM and through PM increased along z. Density of PM exhausted from the tip of normal flame (free flame PM) was much higher than that of PM formed by quenched flame. Since through PM from quenched flame was cooled down much faster than deposit PM and PM exhausted from flame tip, oxidation and graphitization of through PM was suppressed owing to the low temperature in the downstream space on the mesh. In other words, exhaust PM that was collected far downstream from the flame tip of normal flame was slowly graphitized in the hot burned gas stream. Deposit PM was also cooled down by quenching mesh but sometimes it was exposed with hot flame. Then density of deposit PM was higher than that of through PM.
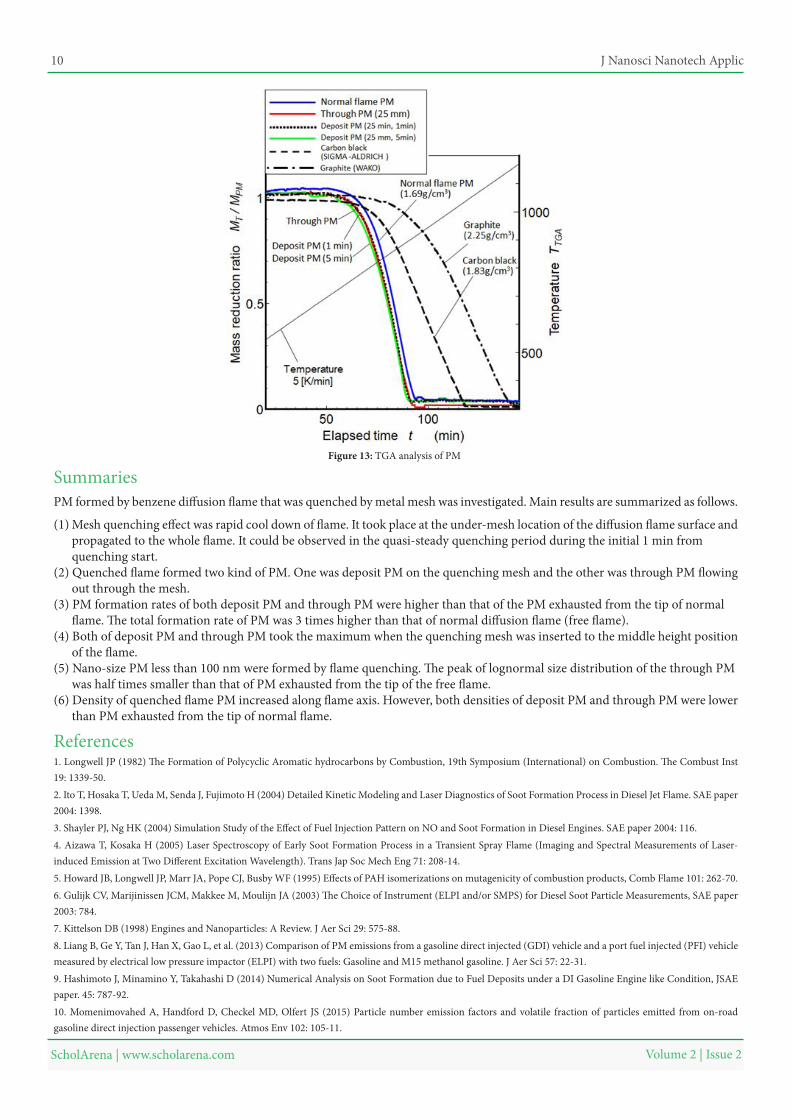
Figure 13 shows the TGA (thermo-gravimetric analysis) air oxidation results of various kinds of PM obtained in this study. Burns out temperatures of quenched flame PM were less difference from the normal flame PM and far lower than carbon black. Generally, low density PM with containing SOF composition had low oxidation temperature. The normal flame PM (density: 1.69 g/cm3) showed lower oxidation start temperature. It meant that graphitization degree of it was lower than carbon black. PM obtained from quenched flame showed slightly lower oxidation start temperature than the normal flame PM, but clear difference between through PM and deposit PM was not detected.
J Nanosci Nanotech Applic 10
Volume 2 | Issue 2 ScholArena | www.scholarena.com
SummariesPM formed by benzene diffusion flame that was quenched by metal mesh was investigated. Main results are summarized as follows.
1. Longwell JP (1982) The Formation of Polycyclic Aromatic hydrocarbons by Combustion, 19th Symposium (International) on Combustion. The Combust Inst 19: 1339-50.
3. Shayler PJ, Ng HK (2004) Simulation Study of the Effect of Fuel Injection Pattern on NO and Soot Formation in Diesel Engines. SAE paper 2004: 116.
2. Ito T, Hosaka T, Ueda M, Senda J, Fujimoto H (2004) Detailed Kinetic Modeling and Laser Diagnostics of Soot Formation Process in Diesel Jet Flame. SAE paper 2004: 1398.
4. Aizawa T, Kosaka H (2005) Laser Spectroscopy of Early Soot Formation Process in a Transient Spray Flame (Imaging and Spectral Measurements of Laser-induced Emission at Two Different Excitation Wavelength). Trans Jap Soc Mech Eng 71: 208-14.5. Howard JB, Longwell JP, Marr JA, Pope CJ, Busby WF (1995) Effects of PAH isomerizations on mutagenicity of combustion products, Comb Flame 101: 262-70.6. Gulijk CV, Marijinissen JCM, Makkee M, Moulijn JA (2003) The Choice of Instrument (ELPI and/or SMPS) for Diesel Soot Particle Measurements, SAE paper 2003: 784.7. Kittelson DB (1998) Engines and Nanoparticles: A Review. J Aer Sci 29: 575-88.8. Liang B, Ge Y, Tan J, Han X, Gao L, et al. (2013) Comparison of PM emissions from a gasoline direct injected (GDI) vehicle and a port fuel injected (PFI) vehicle measured by electrical low pressure impactor (ELPI) with two fuels: Gasoline and M15 methanol gasoline. J Aer Sci 57: 22-31.9. Hashimoto J, Minamino Y, Takahashi D (2014) Numerical Analysis on Soot Formation due to Fuel Deposits under a DI Gasoline Engine like Condition, JSAE paper. 45: 787-92.
References
10. Momenimovahed A, Handford D, Checkel MD, Olfert JS (2015) Particle number emission factors and volatile fraction of particles emitted from on-road gasoline direct injection passenger vehicles. Atmos Env 102: 105-11.
Figure 13: TGA analysis of PM
(1) Mesh quenching effect was rapid cool down of flame. It took place at the under-mesh location of the diffusion flame surface and propagated to the whole flame. It could be observed in the quasi-steady quenching period during the initial 1 min from quenching start.(2) Quenched flame formed two kind of PM. One was deposit PM on the quenching mesh and the other was through PM flowing out through the mesh.(3) PM formation rates of both deposit PM and through PM were higher than that of the PM exhausted from the tip of normal flame. The total formation rate of PM was 3 times higher than that of normal diffusion flame (free flame).(4) Both of deposit PM and through PM took the maximum when the quenching mesh was inserted to the middle height position of the flame.(5) Nano-size PM less than 100 nm were formed by flame quenching. The peak of lognormal size distribution of the through PM was half times smaller than that of PM exhausted from the tip of the free flame.(6) Density of quenched flame PM increased along flame axis. However, both densities of deposit PM and through PM were lower than PM exhausted from the tip of normal flame.

J Nanosci Nanotech Applic 11
Volume 2 | Issue 2 ScholArena | www.scholarena.com
11. Chi Z, Cullum BM, Stokes DL, Mobley J, Miller GH, et al. (2001) Laser-induced fluorescence studies of polycyclic aromatic hydrocarbons (PAH) vapors at high temperatures. Spectrochim Acta A Mol Biomol Spectrosc 57: 1377-84.12. Ossler F, Metz T, Alden M (2001) Picosecond Laser-Induced Fluorescence from Gas-Phase Polycyclic Aromatic Hydrocarbons at Elevated Temperature, II. Flame-Seeding Measurements. Appl Phys 72: 479-89.13. Ware WR and Cunningham PT (1965) Lifetime and Quenching of Anthracene Fluorescence in the Vapor Phase. J Chem Phys 43: 3826-31.14. Vander Wall RL, Dietrich DL (1995) Laser-Induced Incandescence Applied to Droplet Combustion. Appl Opt 34: 1103-7.15. Sato K, Hayashida K, Amagai K, Arai M (2004) Laser Measurement of Polycyclic Aromatic Hydrocarbons (PAHs) in a Flame (1st Report, Separation of Laser-Induced Fluorescence and Incandescence by Time-Resolved Measurement). Trans Japan Soc Mech Eng, Ser 70: 1051-7.16. Kobayashi Y, Amagai K, Furuhata T, Arai M (2007) GC-PAH and LIF-PAH measurements in a pool diffusion flame of liquid fuel. 6th Asian-Pacific Conference on Combustion 226: 318-21.17. Kobayashi Y, Furuhata T, Amagai K, Arai M (2008) Soot precursor measurements in benzene and hexane diffusion flames. Combust Flame 154: 346-55.18. Melton LA (1984) Soot Diagnostics Based on Laser Heating. Appl Opt 23: 2201-7.19. Bellenoue M, Kageyama T, Labuda SA, Sotton J (2003) Direct measurement of laminar flame quenching distance in a closed vessel. Exp Ther Fluid Sci 27: 323-31.20. Marco Antonio Turcios (2011) Effects of Cold Wall Quenching on Unburned Hydrocarbon Emissions from a Natural Gas HPDI Engine. Thesis of BASc. The University of British Columbia.21. Jainski C, Rißmann M, Böhm B, Janicka J, Dreizler A (2017) Sidewall quenching of atmospheric laminar premixed flames studied by laser-based diagnostics. Combust Flame 183: 271-82.22. Wang Y, Ma Z, Zhang Y (2017) Effects of Ignition Location on Soot and Species Formation through Tracking Flame Light Emission and Temperature, 26th ICDERS.23. Kobayashi Y, Kawaharazuka F, Tanaka S, Arai M (2017) Characteristics of PM Formed by Metal Mesh Quenching of Laminar Diffusion Flame with Benzene. J Combust Soc 59: 66-72.24. TSI, Application Note PR-001, Aerosol Statistics Lognormal Distributions and dN/dlogDp.25. Heintzenberg J (1994) Properties of the Log-Normal Particle Size Distribution. Aero Sci Tech 21: 46-8.26. Lucachick G, Avenido A, Kittelson D, Northrop W, Exploration of Semi-Volatile particulate Matter Emissions from Low Temperature Combustion in a Light-Duty Diesel Engine. SAE Int J Engines 7: 852-9.27. Maier A, Klaus U, Dreizler A, Rottengruber H (2015) Fuel-Independent Particulate Emissions in an SIDI Engine. SAE Int J Engines 8: 1334-41.28. Badshah H, Kittelson D, Northrop W (2016) Particle Emissions from Light-Duty Vehicles during Cold-Cold Start. SAE Int J Engines 9: 1775-85.29. Catapano F, Iorio SD, Luise L, Sementa P, Vaglieco BM (2017) In-Cylinder Soot Formation and Exhaust Particle Emissions in a Small Displacement Spark Ignition Engine Operating with Ethanol Mixed and Dual Fueled with Gasoline. SAE 2017: 653.30. Kobayashi Y, Arai M (2012) Analysis of in-flame soot and polycyclic aromatic hydrocarbons by laser Raman spectroscopy. Bunseki Kagaku 61: 15-20.31. Kobayashi Y, Tanaka S, Arai M (2018) PAHs Behavior and Graphitization Degree of Soot in a Hexane Diffusion Flame. J Nanosci Nanotechnol 2: 1-12. 32. Ammara MR, Galyb N, Rouzaudd JN, Toulhoatb N, Vaudeyb CE, et al. (2015) Characterizing various types of defects in nuclear graphite using Raman scattering: Heat treatment, ion irradiation and polishing. Carbon 95: 364-73.