development and characterization of boehmite … wtp-rpt-184, rev. 0 development and...
TRANSCRIPT

PNNL-18176 WTP-RPT-184, Rev. 0
Development and Characterization of Boehmite Component Simulant RL Russell DE Rinehart RA Peterson PM Aker HD Smith EC Buck March 2009

DISCLAIMER This report was prepared as an account of work sponsored by an agency of the United States Government. Neither the United States Government nor any agency thereof, nor Battelle Memorial Institute, nor any of their employees, makes any warranty, express or implied, or assumes any legal liability or responsibility for the accuracy, completeness, or usefulness of any information, apparatus, product, or process disclosed, or represents that its use would not infringe privately owned rights. Reference herein to any specific commercial product, process, or service by trade name, trademark, manufacturer, or otherwise does not necessarily constitute or imply its endorsement, recommendation, or favoring by the United States Government or any agency thereof, or Battelle Memorial Institute. The views and opinions of authors expressed herein do not necessarily state or reflect those of the United States Government or any agency thereof.
PACIFIC NORTHWEST NATIONAL LABORATORY operated by BATTELLE
for the UNITED STATES DEPARTMENT OF ENERGY under Contract DE-AC05-76RL01830.
Printed in the United States of America
Available to DOE and DOE contractors from the Office of Scientific and Technical Information,
P.O. Box 62, Oak Ridge, TN 37831-0062; ph: (865) 576-8401 fax: (865) 576 5728
email: [email protected]
Available to the public from the National Technical Information Service, U.S. Department of Commerce, 5285 Port Royal Rd., Springfield, VA 22161
ph: (800) 553-6847 fax: (703) 605-6900
email: [email protected] online ordering: http://www.ntis.gov/ordering.htm

PNNL-18176 WTP-RPT-184, Rev. 0
Development and Characterization of Boehmite Component Simulant RL Russell DE Rinehart HD Smith PM Aker RA Peterson EC Buck March 2009 Test specification: 24590-PTF-TSP-RT-06-006, Rev 0 and 24590-PTF-TSP-RT-07-004, Rev 0 Test plan: TP-RPP-WTP-469, Rev 0 and TP-RPP-WTP-509, Rev 0 Test exceptions: 24590-WTP-TEF-RT-07-00008, 24590-WTP-TEF-RT-07-00016, 24590-WTP-TEF-RT-08-00013, 24590-WTP-TEF-RT-08-00014, 24590-WTP-TEF-RT-08-00015 R&T focus area: Pretreatment Test Scoping Statement: None Pacific Northwest National Laboratory Richland, Washington 99352


WTP-RPT-184, Rev. 0
Contents
Abbreviations and Acronyms ...................................................................................................................... iii
Testing Summary .......................................................................................................................................... v
Objective.............................................................................................................................................. v
Success Criteria................................................................................................................................... ix
Test Exceptions................................................................................................................................... xi
Quality Requirements ........................................................................................................................xii
R&T Test Conditions........................................................................................................................xiii
Simulant Use...................................................................................................................................xviii
Discrepancies and Follow-on Tests ................................................................................................xviii
1.0 Background....................................................................................................................................... 1.1
2.0 Initial Boehmite Source Characterization......................................................................................... 2.1
2.1 X-Ray Diffraction (XRD)........................................................................................................ 2.1
2.2 Particle-Size Distribution (PSD).............................................................................................. 2.4
2.3 Scanning Electron Microscope (SEM) .................................................................................... 2.7
2.4 Surface Area .......................................................................................................................... 2.11
2.5 Screening Leach Test............................................................................................................. 2.12
3.0 Boehmite Simulant Testing Matrix Results ...................................................................................... 3.1
4.0 Aluminate and Anion Effects on Boehmite Dissolution Rate ......................................................... 4.1
4.1 Aluminate Effect on Boehmite Dissolution............................................................................. 4.3
4.2 Anion Effect on Boehmite Dissolution.................................................................................... 4.4
5.0 Testing of Boehmite in a Blended Simulant ..................................................................................... 5.1
6.0 Performance Testing of Blended Simulant ....................................................................................... 6.1
6.1 Comparison of Tests CBM-1 and CBM-2 with BSM-1 .......................................................... 6.3 6.1.1 Experimental Details .................................................................................................. 6.4 6.1.2 CBM-1 Results ........................................................................................................... 6.5 6.1.3 CBM-2 Results ........................................................................................................... 6.9 6.1.4 Conclusions .............................................................................................................. 6.13 6.1.5 Observations during initial Cold-CUF runs.............................................................. 6.14
6.2 Simulant Production Scale-Up Assessment Tests ................................................................. 6.18 6.2.1 Experimental Details ................................................................................................ 6.18 6.2.2 Results ...................................................................................................................... 6.19

WTP-RPT-184, Rev. 0
6.2.3 Summary................................................................................................................... 6.24
7.0 Boehmite Simulant Revision Testing ............................................................................................... 7.1
8.0 Summary and Conclusions ............................................................................................................... 8.1
8.1 Boehmite Selection .................................................................................................................... 8.1
8.2 Impact of Reaction Conditions .................................................................................................. 8.1
8.3 Integrated Testing ....................................................................................................................... 8.2
9.0 References......................................................................................................................................... 9.1
Appendix A: Actual Analytical Data ........................................................................................................ A.1
Appendix B: Testing Conditions................................................................................................................B.1
Appendix C: Data from Solutions (CBM-1 through CBM-5) ...................................................................C.1
Appendix D: Physical Property Data for Cold-CUF Runs ....................................................................... D.1
Appendix E: Description of Crossflow Ultrafiltration System..................................................................E.1
Appendix F: APYRAL Boehmite Product Description ............................................................................F.1
Appendix G: Operating Conditions for Crossflow Ultrafiltration Runs ................................................... G.1
Appendix H: Letters of Request for Approval for Test Plan Hold Points ................................................ H.1

WTP-RPT-184, Rev. 0
Figures
2.1. XRD Pattern of Boehmite Sample B1............................................................................................. 2.2
2.2. XRD Pattern of Boehmite Sample B2............................................................................................. 2.2
2.3. XRD Pattern of Boehmite Sample B3............................................................................................. 2.3
2.4. XRD Pattern of Boehmite Sample B4............................................................................................. 2.3
2.5. XRD Pattern of Boehmite Sample B5............................................................................................. 2.4
2.6. Boehmite Volume Distribution Particle-Size Plot........................................................................... 2.5
2.7. Boehmite Number Distribution Particle-Size Plot .......................................................................... 2.6
2.8. SEM Picture of Boehmite Sample B1 at 1,000, 5,000, and 10,000 .......................................... 2.7
2.9. SEM Picture of Boehmite Sample B2 at 1,000, 5,000, and 10,000 .......................................... 2.8
2.10. SEM Picture of Boehmite Sample B3 at 1,000, 5,000, and 10,000 .......................................... 2.9
2.11. SEM Picture of Boehmite Sample B4 at 1,000, 5,000, and 10,000 ........................................ 2.10
2.12. SEM Picture of Boehmite Sample B5 at 1,000, 5,000, and 10,000 ........................................ 2.11
2.13. Schematic Drawing of the Caustic Leaching Test Setup............................................................... 2.13
2.14. Screening Boehmite Leaching Test Results Compared to Actual Waste Results ......................... 2.14
3.1. Effect of Hydroxide Concentration on Boehmite Dissolution. ....................................................... 3.4
3.2. Effect of Temperature on Boehmite. ............................................................................................... 3.5
3.3. Effect of Mixing, Hydroxide Concentration, and Solubility Approach on Boehmite Dissolution in 1 M (MTB-7 and MTB-8) and 5 M NaOH (MTB-5 and MTB-6) at 60°C.............. 3.6
4.1. Aluminate Effect on Boehmite Dissolution (BSM-6, ATM-1 and ATM-2) in 5 M NaOH ............ 4.3
4.2. Anion Effect on Boehmite Dissolution (ATM-2 and ATM-6,11,12) in 5 M NaOH....................... 4.5
5.1. Impact of Stirring Speed on Boehmite Dissolution with Gibbsite Present...................................... 5.3
5.2. Impact of Stirring Speed on Boehmite Dissolution without Gibbsite Present ................................ 5.4
5.3. Effect of Supernate on the Boehmite Dissolution Equilibrium ....................................................... 5.5
5.4. Effect of Each Simulant Component on Boehmite Dissolution ...................................................... 5.5
5.5. Approach to Boehmite Equilibrium at 45°C ................................................................................... 5.6

WTP-RPT-184, Rev. 0
6.1. Concentration of Aluminum in Solution (mg/kg solution) in Test CBM-1 .................................... 6.6
6.2. Dissolution of Chromium and Manganese in mg/kg solution in Test CBM-1................................ 6.7
6.3. Dissolution of Aluminum in mg/kg Solution in Test CBM-2 ....................................................... 6.10
6.4. Chromium and Manganese Concentration in mg/kg solution in Test CBM-2 .............................. 6.11
6.5. Caustic Leach Tank Heat Up Samples from CBM-2 .................................................................... 6.15
6.6. Photograph of 22-mL Sample Vials from the Caustic Leaching of Test CBM-2 (0, 2,4,6,8, 10, and 12 hours from left to right) ............................................................................................... 6.15
6.7. Photograph of 22-mL Sample Vials from the Caustic Leach Cooling of Test CBM-2 (0, 2,4,6, 8,10, and 12 hours from left to right) ............................................................................................ 6.16
6.8. Samples After Cooling over 12 Hours of Test CBM-2 (R-0 is before heating, 0, 1, 2, 4, 6, 8, 10, 12 hours after cooling)............................................................................................................. 6.16
6.9. Photographs of the CBM-1 and CBM-2 Test Leach Filtrates at the End of Caustic Leaching..... 6.17
6.10. Oxidative Leach Samples .............................................................................................................. 6.17
6.11. Dissolution of Aluminum in mg/kg Solution in Tests CBM-3, CBM-4, and CBM-5 .................. 6.21
6.12. Chromium Concentration in mg/kg Solution During the Oxidative Leach Process...................... 6.23
7.1. Boehmite Sources Compared with Actual Waste Group 5 (REDOX Sludge) in 5 M NaOH......... 7.2
7.2. Boehmite Sources Compared with Actual Waste Group 5 (REDOX Sludge) in 3 M NaOH......... 7.3

WTP-RPT-184, Rev. 0
Tables
S.1. Test Objectives from TP-RPP-WTP-469, Rev. 0 ............................................................................... vi
S.2. Test Objectives from TP-RPP-WTP-509, Rev. 0 ..............................................................................vii
S.3. Results and Performance against Success Criteria of TP-RPP-WTP-469, Rev. 0.............................. ix
S.4. Results and Performance against Success Criteria of TP-RPP-WTP-509, Rev. 0.............................. xi
S.5. Test Exceptions to Test Plan TP-RPP-WTP-509...............................................................................xii
S.6. R&T Test Conditions from 24590-PTF-TSP-RT-06-006, Rev. 0 .................................................... xiv
S.7. R&T Test Conditions from 24590-WTP-TSP-RT-07-004, Rev. 0..................................................xvii 2.1. Boehmite Samples and Sources....................................................................................................... 2.1
2.2. Volume Distribution Particle-Size Results...................................................................................... 2.5
2.3. Number Distribution Particle-Size Results...................................................................................... 2.6
2.4. Surface Area of Boehmite Samples............................................................................................... 2.12
2.5. Screening Boehmite Leaching Tests Compared to Actual Waste Leaching Results..................... 2.13
3.1. Boehmite Testing Matrix................................................................................................................. 3.3
4.1. Test Matrix for Aluminate Ion Tests ............................................................................................... 4.2
4.2. Molar Concentration of Sodium Salts Used for Anion Tests .......................................................... 4.2
4.3. Aluminate and Anion Test Matrix Components Used .................................................................... 4.2
4.4. Aluminum Dissolution Rates with Aluminate Added ..................................................................... 4.4
4.5. Aluminum Dissolution Rates with Anions Added .......................................................................... 4.5
5.1. Supernate Composition at 3.2 M Na ............................................................................................... 5.1
5.2. Blended Component Test Matrix .................................................................................................... 5.2
6.1. Filtration Simulant UDS Composition in Grams per kg of UDS .................................................... 6.1
6.2. Process Steps for CBM-1 and CBM-2 ............................................................................................ 6.2
6.3. Process Steps for CBM-3, CBM-4, and CBM-5 ............................................................................. 6.2
6.4. Caustic Wash Concentrations for CBM-1 and CBM-2 ................................................................... 6.3
6.5. Analytical Slurry Analysis in CBM-1 (mg/kg solution).................................................................. 6.8

WTP-RPT-184, Rev. 0
6.6. Ratio of Various Species in Solids from Test CBM-1 .................................................................... 6.8
6.7. Slurry Analysis (CBM-2) (mg/kg slurry) ...................................................................................... 6.12
6.8. Ratio of Various Species in Solids from Test CBM-2 .................................................................. 6.13
6.9. Al Leaching Ratios for Test CBM-1 and CBM-2 ......................................................................... 6.13
6.10. Leaching Ratios of Various Species for Test CBM-1 and CBM-2 ............................................... 6.14
6.11. Leaching Ratios of Aluminum for Test CBM-3, CBM-4, and CBM-5......................................... 6.19
6.12. Total Aluminum Leach Factors for the Different Filtration Simulants ......................................... 6.20
7.1. Boehmite Revision Test Matrix for the First Set of Tests ............................................................... 7.1
7.2. Boehmite Revision Test Matrix for the Second Set of Tests........................................................... 7.1

WTP-RPT-184, Rev. 0
iii
Abbreviations and Acronyms
AFA anti-foaming agent
AV axial velocity
BET Brunauer, Emmet, and Teller surface area measurement method
BNI Bechtel National, Incorporated
DIW de-ionized water
DOE U.S. Department of Energy
DST double-shell tank
FIZ Fachinformationszentrum
HLW high-level waste
IC ion chromatography
ICDD International Centre for Diffraction Data
ICP-AES inductively coupled plasma-atomic emission spectroscopy
ICP-MS inductively coupled plasma-mass spectroscopy
ICSD Inorganic Crystal Structure Database
LANL Los Alamos National Laboratory
LAW low-activity waste
ORNL Oak Ridge National Laboratory
PEP Pretreatment Engineering Platform
PNNL Pacific Northwest National Laboratory
PSD particle-size distribution
PTF Pretreatment Facility
QAM Quality Assurance Manual
QAP quality assurance program
QARD Quality Assurance Requirements and Description (document)

WTP-RPT-184, Rev. 0
iv
RPM revolutions per minute
RPP River Protection Project
R&T research and technology
SARM Standard Analytical Reference Material
SBMS Standards-Based Management System
SEM scanning electron microscopy
SST single-shell tank
SWRI Southwest Research Institute
TMP transmembrane pressure
TRU transuranic elements
UDS undissolved solids
WTP Hanford Tank Waste Treatment and Immobilization Plant
XRD X-ray diffraction

WTP-RPT-184, Rev. 0
v
Testing Summary
According to Bechtel National Inc.’s (BNI’s) Test Specification 24590-PTF-TSP-RT-06-006, Rev 0, “Simulant Development to Support the Development and Demonstration of Leaching and Ultrafiltration Pretreatment Processes,” simulants for boehmite, gibbsite, and filtration are to be developed that can be used in subsequent bench and integrated testing of the leaching/filtration processes. These simulants will then be used to demonstrate the leaching process and to help refine processing conditions that may impact safety basis considerations (Smith 2006). This report documents the results of the boehmite simulant development and blended simulant crossflow ultrafiltration leaching completed in accordance with the test plan TP-RPP-WTP-469 Rev 0 (a) (WTP Doc. No. 24590- 101-TSA-W000-0004-182-00001 Rev 00A) prepared and approved in response to the cited test specification. This report also includes the results of the aluminate and anion effect on boehmite dissolution performed in accordance with the test plan TP-RPP-WTP-509, Rev 0(b) (WTP Doc. No. 24590-101-TSA-W000-0004-72-00019 Rev 00A) prepared and approved in response to the Test Specification 24590-WTP-TSP-RT-07-004, Rev 0 (Sundar 2007).
Objective The test objectives for the work addressed in TP-RPP-WTP-469, Rev 0(a) are summarized in Table S.1 along with a discussion of how the objectives were met. The overall objective of the work described in this report was to develop a boehmite (orthorhombic AlOOH) simulant that appropriately mimics the performance of the actual waste boehmite for use in subsequent testing and to provide a technical performance basis for the use of this simulant. The test objectives for the work addressed in TP-RPP-WTP-509, Rev 0(b) are summarized in Table S.2 along with a discussion of how the objectives were met. The overall objective of the work from the test plan described in this report was to determine the effect of aluminate and other substantial anions on the solubility of boehmite in caustic solution.
(a) RL Russell, and HD Smith. 2007. “Test Plan for the Development and Demonstration of Leaching and
Ultrafiltration Simulants.” TP-RPP-WTP-469, Rev. 0, Pacific Northwest National Laboratory, Richland, Washington.
(b) RC Daniel, and RW Shimskey. 2007. “Test Plan for Simulant Testing in Support of Phase I Demonstration of the Ultrafiltration and Leaching Processes in the Integrated Test Facility.” TP-RPP-WTP-509, Rev. 0. Pacific Northwest National Laboratory, Richland, Washington.

WTP-RPT-184, Rev. 0
vi
Table S.1. Test Objectives from TP-RPP-WTP-469, Rev. 0
Test Objective Objective
Met? (Y/N) Discussion 1) Develop and characterize a
gibbsite component simulant for testing of aluminum leaching and provide a basis for the selected simulant.
NA This objective was addressed in report WTP-RPT-176, Rev. 0.
2) Develop and characterize a boehmite component simulant for testing of aluminum leaching and provide a basis for the selected simulant.
Y
A boehmite was chosen (APYRAL AOH20) based primarily on its similarity in the caustic leaching behavior to the actual waste from Tanks S-110 and S-101. The boehmite simulant leaching results were compared to the actual waste boehmite leaching results and found to match acceptably.
3) Develop and characterize inert ultrafiltration component simulant(s) for testing of the ultrafiltration system and provide a basis for the selected simulant(s), which may include high and low viscosity simulants. Also, methods to adjust the filtration behavior will be tested in an attempt to develop simulants with various compositions to accurately show the variation in filter flux.
NA This objective was addressed in report WTP-RPT-183, Rev. 0.
4) Provide a blended simulant procedure for use in Phase 1 integrated demonstration unit testing and demonstrate that the behavior of the blended components is equivalent (or correlated) with the behavior of the individual components. The Phase 1 integrated demonstration waste simulant will possess characteristic chemical components and physical properties of a representative waste that would be processed in the WTP as identified from the EFRT issue M4 resolution team.
NA This objective was addressed in report WTP-RPT-183, Rev. 0.

WTP-RPT-184, Rev. 0
vii
Test Objective Objective
Met? (Y/N) Discussion 5) Evaluate available data to identify
other potential candidate simulants that may be necessary to be developed during Stage 2 of the simulant development work for full evaluation of the leaching/ultrafiltration performance. This would be due to the identification of an additional physical or chemical property that was found to be fundamental to the process.
N This activity has not yet been performed.
Table S.2. Test Objectives from TP-RPP-WTP-509, Rev. 0
Test Objective Objective
Met? (Y/N) Discussion 1) Determine the effect of initial
aluminate ion concentration on the rate of boehmite leaching in caustic solutions and in the presence of soluble anions in a waste. The anions to be considered are those that are typically present in the Hanford Tank Farm wastes in significant amounts. This includes carbonate, free-hydroxide, nitrate, nitrite, oxalate, phosphate, and sulfate.
Y
Boehmite was leached in the presence of aluminate and other principal anions present in the Hanford tank waste. These were found to slow the dissolution of boehmite with the aluminate having a greater effect than the other principal anions. These results are discussed in Section 5.0.
2) Determine the sensitivity of the rate of dissolution of boehmite to soluble anions through a limited number of laboratory tests. The anions to be considered are those that are typically present in the Hanford Tank Farm wastes in significant amounts. This includes carbonate, free hydroxide, nitrate, nitrite, oxalate, phosphate, and sulfate.
NA As of March 20, 2008, PNNL has been released from this objective by Test Exception, 24590-WTP-TEF-RT-07-00016.
3) Determine the effect of scaling the length of the ultrafilter element from 2ft to 8ft on the filtrate flux over the expected operating range of the ultrafilter using the Cell Unit Filter (CUF).
NA This objective was addressed in report WTP-RPT-168, Rev. 0.
Table S.1 (Contd)

WTP-RPT-184, Rev. 0
viii
Test Objective Objective
Met? (Y/N) Discussion 4) Use an 8-ft-long filter element in
the CUF unit to determine the effect of temperature on the filtration of a waste simulant over the range of temperature conditions for the leaching processes.
NA This objective was addressed in report WTP-RPT-168, Rev. 0.
5) Use a 2-ft-long filter element in the CUF unit to evaluate the effect of the fine particle fraction in the ultrafiltration simulant on fouling of the filter element over the range of concentrations of operating solids. The fine particle fraction is defined as those particles with diameters smaller than the 10th percentile (i.e., the dp10) of the particle-size number distribution.
NA This objective was addressed in report WTP-RPT-183, Rev. 0.
6) Perform various simulant aging tests to understand the changes that may occur to the simulant in storage and to ensure the adequacy of the simulant for use in the Pretreatment Engineering Platform (PEP).
NA These results will be presented in a letter report that is yet to be released.
7) Perform Cr-simulant leaching tests to establish that the Cr-simulant from the larger batch exhibits similar or better leaching behavior than the initial trial batch during caustic and oxidative leaching operations.
NA These results will be presented in a report that is yet to be released.
8) Perform leaching tests to determine the mass loss, and aluminum and chromium dissolution rates during caustic leaching under varying temperature processing conditions without aeration in both UFP-1A/B and UFP-2A/B vessels as well as to measure the effect of aeration on chromium leaching in UFP-2A/B.
NA These results will be presented in a report that is yet to be released.
9) Perform leaching tests to develop an accurate model for the dissolution of boehmite.
NA These results will be presented in a report that is yet to be released.
Table S.2 (Contd)

WTP-RPT-184, Rev. 0
ix
Test Objective Objective
Met? (Y/N) Discussion 10) Perform leaching tests to verify
the effect of aluminate ions on the performance of the boehmite component B3 during caustic leach at temperatures lower than 100°C and to determine the effect of temperature on the dissolution rate of boehmite component B7.
NA These results will be presented in a report that is yet to be released.
11) Perform leaching tests to determine the extent of boehmite conversion one would expect under leaching conditions during the planned testing in PEP.
NA These results will be presented in a report that is yet to be released.
Success Criteria This work meets the third of the Success Criteria described in TP-RPP-WTP-469, Rev 0 (Russell 2007). How this success criterion was met is listed in Table S.3. This work also meets the first two success criteria described in TP-RPP-WTP-509, Rev. 0 (Daniel 2007) which is listed in Table S.4.
Table S.3. Results and Performance against Success Criteria of TP-RPP-WTP-469, Rev. 0
List Success Criteria Explain How the Tests Did or Did Not Meet the Success Criteria
1. Development of proceduralized recipes that document each simulant (boehmite, gibbsite, and ultrafiltration) per “Guideline for R&T Simulant Development, Approval, Validation, and Documentation.”
A boehmite simulant was chosen based on 1) crystallography for crystal size, 2) XRD to identify boehmite specie, and 3) comparison to actual waste boehmite dissolution rate for leaching behavior. This information is presented in Section 2.0. APYRAL AOH20 from Nabaltec was chosen, based primarily on its similarity in dissolution rate for leaching behavior to the actual waste from Tanks S-110 and S-101. The crystallography and XRD identified that it was pure boehmite with uniform crystal size. The other simulants are addressed in reports WTP-RPT-176, Rev. 0 (gibbsite), WTP-RPT-183, Rev. 0 (filtration and blended simulants), and WTP-RPT-164, Rev. 0 (chromium).
2. Development of a gibbsite simulant that has physical properties—in particular crystal size and habit—similar to that observed in prior actual waste samples and the development of a correlation that predicts gibbsite simulant dissolution rate as a function of gibbsite properties such as crystal size
This criterion is addressed in report WTP-RPT-176, Rev. 0.
Table S.2 (Contd)

WTP-RPT-184, Rev. 0
x
List Success Criteria Explain How the Tests Did or Did Not Meet the Success Criteria
and habit, as well as other physical properties. 3. Development of a boehmite simulant that has a
dissolution rate—in particular at 100ºC—similar to that observed in prior actual waste samples and the development of a correlation that predicts simulant boehmite dissolution rate as a function of system properties of crystal size, crystal habit, operating temperature, hydroxide concentration, mixing conditions.
Several boehmite sources were characterized by particle size distribution (PSD), X-ray diffraction (XRD), scanning electron microscopy (SEM), surface-area analysis, and caustic leaching kinetics. These results were then compared against available data from caustic leaching of boehmite in actual waste. It was found that B3 and B5 matched the closest to the actual waste, but due to the commercial availability of B3 and its more uniform particle size, it was chosen over B5. More details of this are given in Sections 3.0 and 8.0. A boehmite dissolution rate model is being developed for hydroxide and temperature. This model will be reported in a later report. Insufficient data exist to address crystal size, habit, or mixing conditions on the boehmite rate model.
4. Provide a blended simulant procedure for use in Phase 1 integrated demonstration unit testing and demonstrate that the behavior of the blended components is equivalent (or correlated) with the behavior of the individual components. The Phase 1 integrated demonstration waste simulant will possess characteristic chemical components and physical properties of a representative waste that would be processed in the WTP as identified from the EFRT issue M4 resolution team.
This criterion is addressed in report WTP-RPT-183, Rev. 0.
5. Evaluate available data to identify other potential candidate simulants that may be necessary to be developed during Stage 2 of the simulant development work for full evaluation of the leaching/ultrafiltration performance. This would be due to the identification of an additional physical or chemical property that was found to be fundamental to the process.
This criterion is not addressed in this report.
Table S.3 (Contd)

WTP-RPT-184, Rev. 0
xi
Table S.4. Results and Performance against Success Criteria of TP-RPP-WTP-509, Rev. 0
List Success Criteria Explain How the Tests Did or Did Not Meet the Success Criteria
1. Development of empirical information that allows determination of the effect of initial aluminate ion concentration on the kinetics of boehmite leaching in a waste simulant.
It was determined that initial aluminate ion concentration slows the kinetics of the boehmite dissolution in the waste simulant. More details are discussed in Section 6.0.
2. Determination of the sensitivity of boehmite leaching to carbonate, free-hydroxide, nitrate, nitrite, oxalate, phosphate, and sulfate anions in a waste-simulant solution.
As of March 20, 2008, PNNL has been released from this objective by Test Exception, 24590-WTP-TEF-RT-07-00016.
3. Determination of the effect of scaling the length of the ultrafilter element from 2 ft to 8 ft on the performance of the filter over the expected process operating range in transmembrane pressure, axial velocity, and ultrafiltration temperature.
This criterion is addressed in report WTP-RPT-168, Rev. 0.
4. Determination of the effect of temperature on the filtration flux for the waste simulant over the range of solid concentrations and temperature conditions for the leaching processes.
This criterion is addressed in report WTP-RPT-168, Rev. 0.
5. Determination of the effect of fine-particle concentration on the propensity of the waste simulant to foul the ultrafilter element over the range of concentrations of operating solids in the waste simulant.
This criterion is addressed in report WTP-RPT-183, Rev. 0.
Test Exceptions
Test exception number 24590-WTP-TEF-RT-07-00008 was received from Bechtel National, Inc. (BNI) on November 12, 2007. The test plan (TP-RPP-WTP-469, Rev 0) only allowed for a single test to validate the performance of a blended simulant composition for use in the Pretreatment Engineering Platform (PEP) for process demonstration. This test was carried out at a filtration temperature of 45°C, as was the oxidative leaching operation. However, the filtration temperature in the PEP during process demonstration remained undecided between 45°C and 25°C. Filtration at 45°C could potentially lead to post-precipitation of phosphates and other soluble salts if the solution is cooled to 25°C before being transferred to the permeate collection vessels UFP-62A/B/C and the subsequent ion-exchange feed vessel CXP-01. Therefore, a second test to validate the blended simulant composition for the PEP process demonstration was performed at 25°C with the results of these tests discussed in report WTP-RPT-183.
Four test exceptions were issued for Test Plan TP-RPP-WTP-509. These test exceptions are summarized in Table S.5 along with a brief description of how each exception impacted existing objectives and test plan scope.

WTP-RPT-184, Rev. 0
xii
Table S.5. Test Exceptions to Test Plan TP-RPP-WTP-509
Test Exception Number Description of Test Exception 24590-WTP-TEF-RT-07-00016, Rev. 0 This test exception released PNNL from test objective 2
(see Table S.2). 24590-WTP-TEF-RT-08-00013, Rev. 0 This test exception did not affect any existing test plan
objectives. It added test objectives concerned with 1) aging of the PEP simulants during storage and 2) leaching of the chromium simulant. These are objectives 6 and 7 in Table S.2, and the results will be released at a later date.
24590-WTP-TEF-RT-08-00014, Rev. 0 This test exception both affected existing test objectives and added new test objectives. Tests associated with objective 4 were modified slightly in response to this test exception with the temperatures examined being changed slightly. The results of this testing is reported in WTP-RPT-168. In addition, a new objective concerned with the influence of temperature and aeration on caustic leaching processes was added. This is objective 8 in Table S.2, and the results will be released at a later date.
24590-WTP-TEF-RT-08-00015, Rev. 0 This test exception did not affect any existing objectives in the test plan. It added three new test objectives concerned with 1) in-depth assessment of the leaching kinetics with respect to dissolved aluminate concentration and 2) the extent of leaching under planned PEP operating conditions. The added objectives are 9, 10, and 11 in Table S.2, and the results will be released at a later date.
Quality Requirements Pacific Northwest National Laboratory (PNNL) is operated for the U.S. Department of Energy (DOE) by Battelle under Contract DE-AC05-76RL01830. PNNL implements a Quality Assurance Program that is based upon the requirements as defined in DOE Order 414.1C, “Quality Assurance,” and 10 CFR 830, “Energy/Nuclear Safety Management,” Subpart A—“Quality Assurance Requirements.” PNNL has chosen to implement the requirements of DOE Order 414.1C and 10 CFR 830, Subpart A by integrating them into the laboratory’s management systems and daily operating processes. The procedures necessary to implement the requirements are documented through the laboratory’s Standards-Based Management System (SBMS). PNNL implemented the RPP-WTP quality requirements by performing work in accordance with the River Protection Project – Waste Treatment Plant Support Program (RPP-WTP) Quality Assurance Plan (RPP-WTP-QA-001, QAP). Work was performed to the quality requirements of NQA-1-1989 Part I, Basic and Supplementary Requirements, NQA-2a-1990, Part 2.7, and DOE/RW-0333P, Rev 13, Quality Assurance Requirements and Descriptions (QARD). These quality requirements were implemented
WTP-RPT-184, Rev. 0
xiii
through the River Protection Project–Waste Treatment Plant Support Program (RPP-WTP) Quality Assurance Manual (RPP-WTP-QA-003, QAM). The analytical requirements are implemented through RPP-WTP’s Statement of Work (WTPSP-SOW-005 and RPP-WTP-QA-005, respectively) with Southwest Research Institute (SWRI). The requirements of DOE/RW-0333P, Rev 13, Quality Assurance Requirements and Descriptions (QARD), were not required for this work. A matrix that cross-references the NQA-1 and NQA-2a requirements with RPP-WTP’s procedures for this work is given in TP-RPP-WTP-469. It includes justification for those requirements not implemented. Experiments that were not method-specific were performed in accordance with RPP-WTP’s procedures QA-RPP-WTP-1101 “Scientific Investigations” and QA-RPP-WTP-1201 “Calibration and Control of Measuring and Testing Equipment” so that sufficient data were taken with properly calibrated measuring and test equipment to obtain quality results. RPP-WTP addressed internal verification and validation activities by conducting an Independent Technical Review of the final data report in accordance with PNNL’s procedure QA-RPP-WTP-604. This review verifies that the reported results were traceable, inferences and conclusions were soundly based, and the reported work satisfied the Test Plan objectives. This review procedure is part of PNNL’s RPP-WTP QAM.
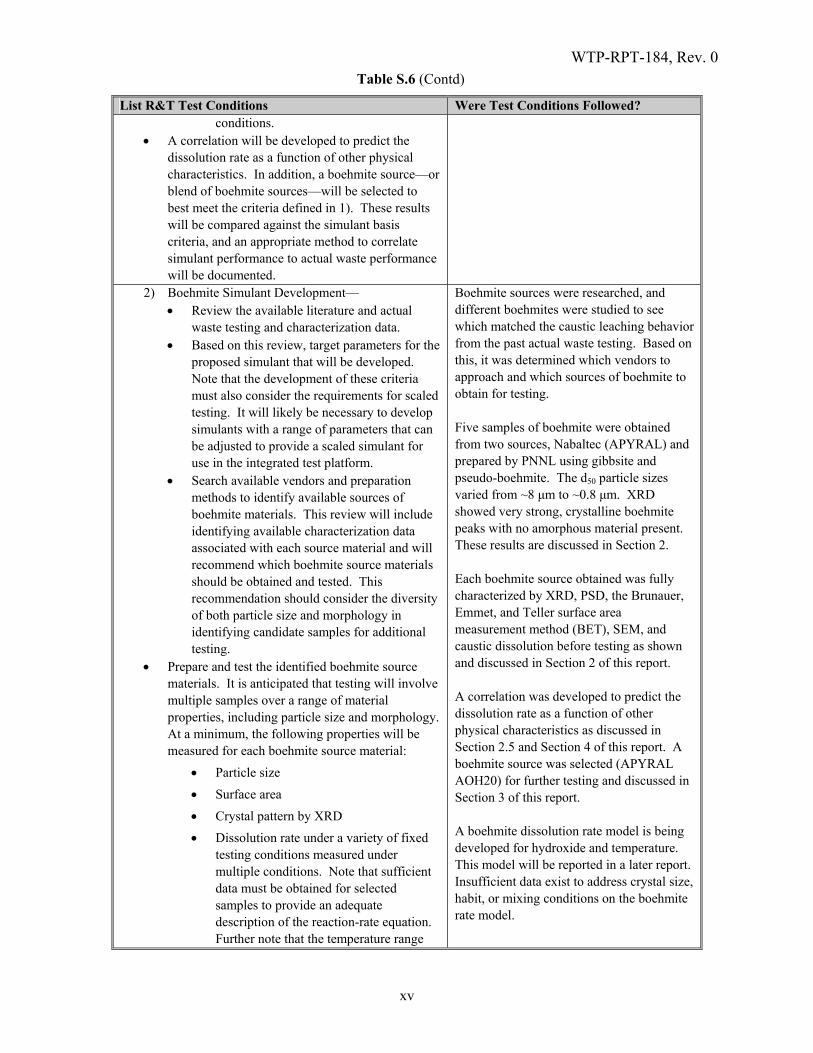
R&T Test Conditions The research and technology (R&T) test conditions, as defined in the Test Specifications 24590-PTF-TSP-RT-06-006, Rev. 0(a) and 24590-WTP-TSP-RT-07-004, Rev. 0(b) are summarized in Table S.6 and S.7, respectively.
(a) GL Smith. Nov. 2006. Simulant Development to Support the Development and Demonstration of Leaching and
Ultrafiltration Pretreatment Processes. 24590-PTF-TSP-RT-06-006, Rev. 0. (b) PS Sundar. April 2007. Simulant Testing in Support of Phase I Demonstration of the Ultrafiltration and
Leaching Processes in the Integrated Test Facility. 24590-WTP-TSP-RT-07-004, Rev. 0.

WTP-RPT-184, Rev. 0
xiv
Table S.6. R&T Test Conditions from 24590-PTF-TSP-RT-06-006, Rev. 0
List R&T Test Conditions Were Test Conditions Followed? 1) Gibbsite Simulant Development—
Review the available literature and actual waste testing and characterization data.
Based on this review, target parameters for the proposed simulant that will be developed. Note that the development of these criteria must also consider the requirements for scaled testing. It will likely be necessary to develop simulants with a range of parameters that can be adjusted to provide a scaled simulant for use in the integrated test platform.
Search available vendors and preparation methods to identify available sources of boehmite materials. This review will include identifying available characterization data associated with each source material and will recommend which boehmite source materials should be obtained and tested. This recommendation should consider the diversity of both particle size and morphology in identifying candidate samples for additional testing.
Prepare and test the identified boehmite source materials. It is anticipated that testing will involve multiple samples over a range of material properties, including particle size and morphology. At a minimum, the following properties will be measured for each gibbsite source material:
Particle size
Surface area
Crystal pattern by XRD
Dissolution rate under a variety of fixed testing conditions measured under multiple conditions. Note that sufficient data must be obtained for selected samples to provide an adequate description of the reaction-rate equation. Further note that the temperature range should be sufficient to provide a range of behaviors. In addition, sufficient information, including density and water content, should be obtained to provide meaningful correlation to actual waste samples.
Equilibrium solubility under various test
Not applicable to this report. Results discussed in WTP-RPT-176.
WTP-RPT-184, Rev. 0
xv
List R&T Test Conditions Were Test Conditions Followed? conditions.
A correlation will be developed to predict the dissolution rate as a function of other physical characteristics. In addition, a boehmite source—or blend of boehmite sources—will be selected to best meet the criteria defined in 1). These results will be compared against the simulant basis criteria, and an appropriate method to correlate simulant performance to actual waste performance will be documented.
2) Boehmite Simulant Development— Review the available literature and actual
waste testing and characterization data. Based on this review, target parameters for the
proposed simulant that will be developed. Note that the development of these criteria must also consider the requirements for scaled testing. It will likely be necessary to develop simulants with a range of parameters that can be adjusted to provide a scaled simulant for use in the integrated test platform.
Search available vendors and preparation methods to identify available sources of boehmite materials. This review will include identifying available characterization data associated with each source material and will recommend which boehmite source materials should be obtained and tested. This recommendation should consider the diversity of both particle size and morphology in identifying candidate samples for additional testing.
Prepare and test the identified boehmite source materials. It is anticipated that testing will involve multiple samples over a range of material properties, including particle size and morphology. At a minimum, the following properties will be measured for each boehmite source material:
Particle size
Surface area
Crystal pattern by XRD
Dissolution rate under a variety of fixed testing conditions measured under multiple conditions. Note that sufficient data must be obtained for selected samples to provide an adequate description of the reaction-rate equation. Further note that the temperature range
Boehmite sources were researched, and different boehmites were studied to see which matched the caustic leaching behavior from the past actual waste testing. Based on this, it was determined which vendors to approach and which sources of boehmite to obtain for testing. Five samples of boehmite were obtained from two sources, Nabaltec (APYRAL) and prepared by PNNL using gibbsite and pseudo-boehmite. The d50 particle sizes varied from ~8 μm to ~0.8 μm. XRD showed very strong, crystalline boehmite peaks with no amorphous material present. These results are discussed in Section 2. Each boehmite source obtained was fully characterized by XRD, PSD, the Brunauer, Emmet, and Teller surface area measurement method (BET), SEM, and caustic dissolution before testing as shown and discussed in Section 2 of this report. A correlation was developed to predict the dissolution rate as a function of other physical characteristics as discussed in Section 2.5 and Section 4 of this report. A boehmite source was selected (APYRAL AOH20) for further testing and discussed in Section 3 of this report. A boehmite dissolution rate model is being developed for hydroxide and temperature. This model will be reported in a later report. Insufficient data exist to address crystal size, habit, or mixing conditions on the boehmite rate model.
Table S.6 (Contd)

WTP-RPT-184, Rev. 0
xvi
List R&T Test Conditions Were Test Conditions Followed? should be sufficient to provide a range of behaviors. In addition, sufficient information, including density and water content, should be obtained to provide meaningful correlation to actual waste samples.
Equilibrium solubility under various test conditions.
A correlation will be developed to predict the dissolution rate as a function of other physical characteristics. In addition, a boehmite source—or blend of boehmite sources—will be selected to best meet the criteria defined in 1). These results will be compared against the simulant basis criteria, and an appropriate method to correlate simulant performance to actual waste performance will be documented.
3) Filtration Simulant Development— Review the available literature and actual
waste testing and characterization data. Based on this review, target parameters for the proposed simulant will be developed.
Search available preparation methods to identify available sources of filtration simulant materials. This review includes identification of available characterization data associated with each source material and will provide recommendations for which filtration source materials should be obtained and tested. This task also evaluates whether existing preparation methods should be modified to meet the target parameters and whether selected components from various vendors/preparation methods should be blended for evaluation.
Prepare and test the identified filtration simulant source materials. It is anticipated that testing will involve multiple samples over a range of material properties.
Not applicable to this report. Results discussed in WTP-RPT-183.
Table S.6 (Contd)
WTP-RPT-184, Rev. 0
xvii
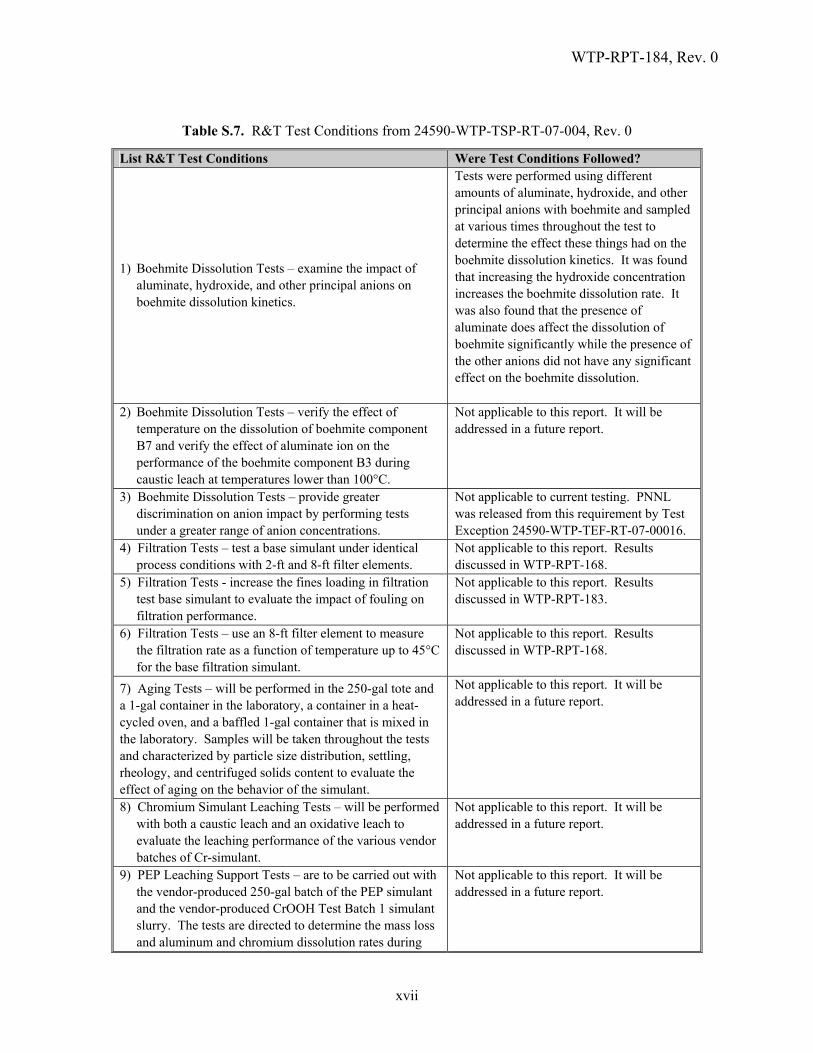
Table S.7. R&T Test Conditions from 24590-WTP-TSP-RT-07-004, Rev. 0
List R&T Test Conditions Were Test Conditions Followed?
1) Boehmite Dissolution Tests – examine the impact of aluminate, hydroxide, and other principal anions on boehmite dissolution kinetics.
Tests were performed using different amounts of aluminate, hydroxide, and other principal anions with boehmite and sampled at various times throughout the test to determine the effect these things had on the boehmite dissolution kinetics. It was found that increasing the hydroxide concentration increases the boehmite dissolution rate. It was also found that the presence of aluminate does affect the dissolution of boehmite significantly while the presence of the other anions did not have any significant effect on the boehmite dissolution.
2) Boehmite Dissolution Tests – verify the effect of temperature on the dissolution of boehmite component B7 and verify the effect of aluminate ion on the performance of the boehmite component B3 during caustic leach at temperatures lower than 100°C.
Not applicable to this report. It will be addressed in a future report.
3) Boehmite Dissolution Tests – provide greater discrimination on anion impact by performing tests under a greater range of anion concentrations.
Not applicable to current testing. PNNL was released from this requirement by Test Exception 24590-WTP-TEF-RT-07-00016.
4) Filtration Tests – test a base simulant under identical process conditions with 2-ft and 8-ft filter elements.
Not applicable to this report. Results discussed in WTP-RPT-168.
5) Filtration Tests - increase the fines loading in filtration test base simulant to evaluate the impact of fouling on filtration performance.
Not applicable to this report. Results discussed in WTP-RPT-183.
6) Filtration Tests – use an 8-ft filter element to measure the filtration rate as a function of temperature up to 45°C for the base filtration simulant.
Not applicable to this report. Results discussed in WTP-RPT-168.
7) Aging Tests – will be performed in the 250-gal tote and a 1-gal container in the laboratory, a container in a heat-cycled oven, and a baffled 1-gal container that is mixed in the laboratory. Samples will be taken throughout the tests and characterized by particle size distribution, settling, rheology, and centrifuged solids content to evaluate the effect of aging on the behavior of the simulant.
Not applicable to this report. It will be addressed in a future report.
8) Chromium Simulant Leaching Tests – will be performed with both a caustic leach and an oxidative leach to evaluate the leaching performance of the various vendor batches of Cr-simulant.
Not applicable to this report. It will be addressed in a future report.
9) PEP Leaching Support Tests – are to be carried out with the vendor-produced 250-gal batch of the PEP simulant and the vendor-produced CrOOH Test Batch 1 simulant slurry. The tests are directed to determine the mass loss and aluminum and chromium dissolution rates during
Not applicable to this report. It will be addressed in a future report.

WTP-RPT-184, Rev. 0
xviii
List R&T Test Conditions Were Test Conditions Followed? caustic leaching under varying temperature processing conditions without aeration in both UFP-1A/B and UFP-2A/B vessels as well as to measure the effect of aeration on chromium leaching in UFP-2A/B.
10) PEP Leaching Support Tests – will be performed using a vendor-produced 250-gal batch of the PEP simulant. The tests are directed to measure the extent of boehmite conversion expected under leaching conditions during the planned testing in the PEP.
Not applicable to this report. It will be addressed in a future report.
Simulant Use It is not possible to use actual Hanford tank waste in the Pretreatment Engineering Platform (PEP) because of safety, cost, and volume. To address the need for demonstrating separation and leaching processes at PEP, PNNL developed a waste simulant that mimics the chemical, leaching, and ultrafiltration behaviors of actual tank waste according to Test Plan TP-RPP-WTP-469. The development of the boehmite portion of this simulant is described in this report. The reasoning behind the simulant composition, a comparison of it to the actual tank waste, and a description of it are described in this report.
Discrepancies and Follow-on Tests None.
Table S.7 (Contd)

WTP-RPT-184, Rev. 0
1.1
1.0 Background
At the River Protection Project-Waste Treatment and Immobilization Plant (RPP-WTP), the high level waste (HLW) is separated from the low-activity waste (LAW) liquid stream by ultrafiltration in the Pretreatment Facility (PTF). The concentrated HLW will undergo caustic and oxidative leaching processes to dissolve and wash out materials (aluminum, chromium, phosphates, and sulfates) that would otherwise limit HLW loading in the immobilized waste glass. The current design calls for the leaching processes to be carried out in the ultrafiltration process vessels (UFP-1a, UPF-1b, UFP-2a and UFP-2b). The concentrated HLW solids are sequentially caustic leached, washed, and oxidatively leached and washed once more during pretreatment. While the caustic leaching dissolves the aluminum in the HLW solids, the oxidative leaching is carried out to oxidize the chromium using a sodium permanganate (NaMnO4) solution and dissolve it in a mild caustic solution. The HLW solids are concentrated after each leach and wash operation using the cross-flow ultrafiltration system to perform crossflow filtration. Caustic-leaching experiments were first performed on actual Hanford tank sludge samples in FY 1993. The original caustic-leaching experiments were performed as a prelude to acid dissolution of the sludge solids with the intent that the acid-dissolved fraction would be processed through solvent extraction to separate the very small mass fraction of the radioactive elements (the transuranics [TRUs], 90Sr, and 137Cs) from the bulk mass of non-radioactive components (Lumetta et al. 1996). In this respect, caustic leaching was meant to remove the large amount of aluminum from the waste, thus reducing the nitric acid demand and simplifying the solvent extraction feed. Subsequently, caustic leaching was chosen as the baseline method for Hanford tank sludge pretreatment; this process was sometimes referred to as “Enhanced Sludge Washing” (Lumetta et al. 1997). Following this decision, caustic-leaching tests were performed under a standard set of conditions at the Pacific Northwest National Laboratory (PNNL) and Los Alamos National Laboratory (LANL); these tests were conducted from FY 1995 through FY 1997. In subsequent years, a limited number of parametric caustic-leaching experiments were performed at PNNL and also at Oak Ridge National Laboratory (ORNL). After the WTP project was established, a limited number of laboratory-scale caustic-leaching experiments were performed using a standard testing protocol, but these were generally focused on processing double-shell tank (DST) wastes rather than the single-shell tanks (SST) where the bulk of the sludge is stored. Caustic-leaching data are needed on the various types of wastes to be processed through the WTP to support the plant design. The data needed include 1) removal of key HLW sludge components (e.g., Al, Cr, P, and S) as a function of caustic concentration, temperature, and time, 2) the behavior of radionuclides during the leaching process, 3) particle-size distribution, and 4) identification of the chemical and mineral forms of important sludge components (e.g., Al, Cr, and P) in the sludge solids. These new data will support the development of various waste simulants for scaled process demonstrations. Aluminum in the wastes is believed to be present in the two most common mineralogical phases: gibbsite (monoclinic Al(OH)3) and boehmite (orthorhombic AlOOH). Other phases present include bayorite, dawsonite, alumina silicates, and amorphous aluminum hydroxide. The dissolution rates of the two primary mineralogical phases are considerably different. Therefore, the leaching kinetics will depend on the relative amounts of these phases in the waste as well as particle size, crystal habit (i.e., particle size and shape), operating temperature, hydroxide activity, aluminum solubility limits, particle Reynolds

WTP-RPT-184, Rev. 0
1.2
number associated with the mixing system, etc. While there may be other phases of aluminum compounds in the waste solids, they are present in relatively smaller amounts and therefore are considered less significant to the caustic leaching for removing aluminum from the HLW. The simulant development strategy is based on a two-phased approach. The first phase includes simulant development and the validation of initial single-component chemical and physical simulants for boehmite, gibbsite, chromium, and filtration. The data obtained from the actual waste testing (Sundar 2006) are to serve as benchmarks for defining the simulant characteristics and behaviors to develop chemical, rheological, and physical simulants to more closely simulate actual waste and as a basis for revising the parameters used in evaluating WTP process performance using the appropriate process models. The second phase of the simulant development work involves refinement of the first four component simulants based on additional tank waste characterization data. In addition, the other component simulants (such as phosphate) will be developed during this stage. This report only addresses the first phase of the simulant development work relating to the boehmite simulant development. This report is broken into four tasks. The first task screened a set of available boehmite simulants and down-selected one of these simulants for additional testing, based on existing actual waste data. This task is described in Section 2 of this report. The second task was to use the chosen boehmite simulant to assess the impact of process variables on boehmite leaching performance. This task is described in Sections 3 and 4. The next task was to assess the performance of the boehmite simulant when blended with the remainder of the simulant components under prototypic processing conditions. This task is described in Sections 5 and 6. The final task was to use more recent actual waste boehmite leaching data and to re-evaluate the selection of the boehmite component. This task also evaluated some additional boehmite sources that had been identified. This task is described in Section 7.

WTP-RPT-184, Rev. 0
2.1
2.0 Initial Boehmite Source Characterization
As described in Section 1, the first task associated with the boehmite simulant development was to identify available boehmite sources and evaluate them against existing actual waste data. Three APRYAL samples of boehmite were obtained from Nabaltec (see Appendix F for manufacturer’s product information) and evaluated based on the particle sizes that most closely matched the actual waste boehmite particle sizes. An additional sample was obtained from BASF (BASF G250). However, upon receipt, this sample was determined to be pseudoboehmite based on the X-ray diffraction (XRD) evaluation. No other commercially available source of boehmite was identified. Therefore, two samples were converted from non-boehmite material into boehmite through autoclaving gibbsite (or pseudoboehmite) in water at 300°C for 4 hours stirred at 600 rpm (Panias 2001). These samples were the pseudoboehmite from BASF (G250) and a gibbsite material from Almatis (C31C). These samples were labeled as shown in Table 2.1. These boehmite samples were then characterized as described in the following subsections.
Table 2.1. Boehmite Samples and Sources
Sample ID Boehmite Sources B1 Nabaltec APYRAL AOH60 B2 Nabaltec APYRAL AOH20Y B3 Nabaltec APYRAL AOH20
B4 PNNL Autoclaved BASF G250
(pseudoboehmite) B5 PNNL Autoclaved Almatis C31C (gibbsite)
2.1 X-Ray Diffraction (XRD)
The XRD instrument used for this analysis was a Scintag PAD V X-ray Diffractometer. Data were taken from 2 to 65 degrees 2-theta with a step size of 0.02 degrees 2-theta and counting time between 2 and 19 seconds per step. Copper Kα X-rays were used. Tube conditions were 45 kV and 40 mA. Phase identification was done with the JADE search match routines (Version 8.0, Materials Data Inc.) with comparison to the International Centre for Diffraction Data (ICDD) database PDF-2 release 2006, Version 2.0602, which includes the Inorganic Crystal Structure Database (ICSD) maintained by Fachinformationszentrum (FIZ), Karlsruhe, Germany. The first identification pass was done with no chemistry restrictions and usually identified TiO2, the internal standard. The next pass was done with the identified chemistry restrictions of Al, O, and H with probable phases boehmite, gibbsite, and “pseudoboehmite” required. Consequently, the aluminum-containing phases were identified. All of the boehmite samples analyzed showed an excellent match to the boehmite standard XRD card. No amorphous material or contamination was detected in these samples except for the internal standard of rutile. These XRD patterns are shown in Figure 2.1 through Figure 2.5.

WTP-RPT-184, Rev. 0
2.2
Figure 2.1. XRD Pattern of Boehmite Sample B1
Figure 2.2. XRD Pattern of Boehmite Sample B2

WTP-RPT-184, Rev. 0
2.3
Figure 2.3. XRD Pattern of Boehmite Sample B3
Figure 2.4. XRD Pattern of Boehmite Sample B4

WTP-RPT-184, Rev. 0
2.4
Figure 2.5. XRD Pattern of Boehmite Sample B5
2.2 Particle-Size Distribution (PSD)
The boehmite samples were analyzed with a S3000 Microtrac Analyzer according to procedure TPR-RPP-WTP-222, Rev. 3. Nominally 0.2 grams of each sample (run in duplicate) was placed into approximately 10 grams of de-ionized water (DIW), and 2 to 3 drops of Darvan® 821A Dispersing Agent were added. The resultant slurry was de-agglomerated using an ultrasonic horn (MICROGON Ultrasonic Cell Disrupter) intermittently for 15 to 20 seconds. A transfer pipette was used to mix the slurry and transfer the required amount to the analyzer. The amount of the slurried sample aliquot required for analysis varied with the actual mass of the sample and the actual volume of DIW in the sonicated sample. Neither the amount of sample nor the amount of water was critical to the analytical process since the internal system software visually indicated to the analyst the amount needed for analysis. These results are shown in Table 2.2 and Table 2.3 and Figure 2.6 and Figure 2.7.

WTP-RPT-184, Rev. 0
2.5
Table 2.2. Volume Distribution Particle-Size Results
Percentile B1 (μm) B2 (μm) B3 (μm) B4 (μm) B5 (μm) 5 0.423 0.632 1.078 0.144 0.507
20 0.559 1.989 3.910 0.301 0.829 30 0.627 4.285 5.417 0.446 1.058 40 0.698 6.157 6.725 0.579 1.310 50 0.776 7.738 7.969 0.780 1.595 60 0.874 9.256 9.254 1.199 1.939 70 1.007 10.90 10.71 2.052 2.382 80 1.225 12.95 12.59 3.564 3.034 90 1.734 16.22 15.64 6.807 4.299 95 2.531 19.53 18.76 11.36 5.807
0
1
2
3
4
5
6
7
8
9
0.1 1 10 100
Size (microns)
Per
cen
t
Figure 2.6. Boehmite Volume Distribution Particle-Size Plot
B4
B1
B5
B2
B3

WTP-RPT-184, Rev. 0
2.6
Table 2.3. Number Distribution Particle-Size Results
Percentile B1 (μm) B2 (μm) B3 (μm) B4 (μm) B5 (μm) 5 0.286 0.366 0.430 0.125 0.365
20 0.378 0.416 0.477 0.134 0.412 30 0.424 0.451 0.512 0.139 0.447 40 0.465 0.489 0.554 0.146 0.487 50 0.506 0.531 0.603 0.154 0.533 60 0.549 0.579 0.664 0.166 0.590 70 0.601 0.639 0.748 0.183 0.665 80 0.669 0.725 0.880 0.212 0.782 90 0.785 0.886 1.166 0.285 1.016 95 0.908 1.078 1.612 0.395 1.290
0
5
10
15
20
25
0.1 1 10
Size (microns)
Per
cen
t
Figure 2.7. Boehmite Number Distribution Particle-Size Plot
B4
B3
B1
B2
B5

WTP-RPT-184, Rev. 0
2.7
2.3 Scanning Electron Microscope (SEM)
The SEM images were obtained with a JEOL JSM-5900 SEM with the sample on a glass slide and coated with carbon. The micrographs are secondary electron images. They all showed similar crystal structure with the exception of B4, which showed larger agglomerated particles as shown in Figure 2.8 through Figure 2.12.
Figure 2.8. SEM Picture of Boehmite Sample B1 at 1,000, 5,000, and 10,000

WTP-RPT-184, Rev. 0
2.8
Figure 2.9. SEM Picture of Boehmite Sample B2 at 1,000, 5,000, and 10,000

WTP-RPT-184, Rev. 0
2.9
Figure 2.10. SEM Picture of Boehmite Sample B3 at 1,000, 5,000, and 10,000

WTP-RPT-184, Rev. 0
2.10
Figure 2.11. SEM Picture of Boehmite Sample B4 at 1,000, 5,000, and 10,000

WTP-RPT-184, Rev. 0
2.11
Figure 2.12. SEM Picture of Boehmite Sample B5 at 1,000, 5,000, and 10,000
2.4 Surface Area
Surface-area measurements were acquired with a Quantachrome Instruments Monosorb Surface Area Analyzer. The Monosorb is a direct-reading dynamic-flow surface-area analyzer that uses a modified Brunauer, Emmett, and Teller (BET) equation for single-point determinations of surface area. Measurements were taken in accordance with PNL-RW-05-BET and OCRWM-BET-01. Standard surface-area reference material (SARM) was used to calibrate the instrument over the anticipated range of interest. Each sample was weighed and dried for no less than 30 minutes before analysis. The Monosorb measures the quantity of a gas adsorbed on a solid surface by sensing the change in thermal conductivity of a flowing mixture of an adsorbate and an inert carrier gas, nitrogen and helium, respectively. The specific surface area is calculated by dividing the average of the surface-area measurements obtained by the BET method by the weight of the sample. Based on the small sample used for B1 and the fact that the data are not consistent with the PSD and the leaching results, these data may not be accurate and should be used as information only. This measurement also did not agree with the manufacturer’s reported value, which matches the PSD and leaching results better. The source of this

WTP-RPT-184, Rev. 0
2.12
error is most likely due to the small sample size (for which the reason is unknown) and the small amount of signal that would have been received from it. Also, because the surface area was so far from 2.84 m2 (the single point of calibration), there may not have been a linear response. These results are shown in Table 2.4.
Table 2.4. Surface Area of Boehmite Samples
Sample ID Mass (g) Surface Area
(m2) Specific Surface
Area (m2/g) Std Dev
Manufacturer Surface Area
(m2/g) B1 0.0076 0.0832 10.95 1.98 2.4 B2 0.1871 0.5906 3.173 0.058 3.0 B3 0.1727 1.765 10.22 1.11 6.0 B4 0.1209 1.482 12.25 3.84 NA B5 0.2402 1.164 4.846 0.011 NA
2.5 Screening Leach Test
A screening-test approach to provide dissolution-rate data for available boehmite materials was used that could be compared to the data for actual waste boehmite dissolution rates. These caustic leaching tests were set up as shown in Figure 2.13 using 1-wt% boehmite solids in 800 grams of 3-M NaOH solution that was heated to a temperature of 100°C while stirring in a 1-liter PMP reaction vessel. The reaction vessel is a straight-side wide-mouth jar with an inside height of 116 mm and an inside diameter of 110 mm. It has three PMP baffles of which each are 92 mm long, 5 mm thick, and 19 mm wide evenly spaced around the vessel. A stainless steel stir shaft 8 mm in diameter and 305 mm long with a 95-mm-wide blade welded on the bottom is used to stir the vessel. The blade is 13 mm tall, and each blade is bent 45° from vertical. A heating jacket is wrapped around the vessel to maintain the test mixture at a constant temperature throughout the test. In contrast, Lumetta used ~ 100-mL samples in bottles on a shaker table. The temperature was measured with a calibrated thermocouple and controlled with a calibrated temperature controller. Boehmite was added as a powder to the reaction vessel through the sample port while stirring after the NaOH solution had reached 100°C, which started the clock for the test. The test solution was sampled while stirring at 1, 2, 4, 8, and 24 hours. Each sample consisted of 5-mL supernatant, which was filtered through a 0.45-μm syringe filter after being drawn from the reaction vessel and then analyzed for aluminum and sodium by inductively coupled plasma-atomic emission spectrometry (ICP-AES). The actual amounts of constituents used in each test are shown in Appendix B, and the analytical results are shown in Appendix A.

WTP-RPT-184, Rev. 0
2.13
Control TC
Measuring TC
Heating Mantle
Sampling Port
Baffle
Stir Shaft
Reaction Vessel
Liquid Level
Figure 2.13. Schematic Drawing of the Caustic Leaching Test Setup
The results from the boehmite leaching tests as well as results from actual waste leaching are given in Table 2.5. Lumetta et al. (2001) and Lumetta and Hallen (2007) reported boehmite dissolution in S-110 waste and S-101 waste under the same testing conditions of temperature and caustic concentration. Note that the tank waste tests used washed solids, and as such had minor concentrations of other anions present. However, these anion levels were very low and are not expected to impact the dissolution rates. When Lumetta’s data are plotted with the boehmite leaching data from these tests, as shown in Figure 2.14, B3 and B5 match the closest.
Table 2.5. Screening Boehmite Leaching Tests Compared to Actual Waste Leaching Results
Fraction of Boehmite Dissolved Time - h B1 B2 B3 B4 B5 S-110 (a) S-101 (b)
0 0 0 0 0 0 0 0 1 0.111 0.106 0.106 0.431 0.075 -- -- 2 0.188 0.176 0.175 0.625 0.126 -- -- 4 0.310 0.288 0.290 0.790 0.220 0.245 0.321 8 0.502 0.435 0.445 0.919 0.347 0.420 --
24 0.958 0.853 0.806 1.024 0.712 0.731 0.660 F (~28) 0.968 0.845 0.778 1.004 0.698 -- --
(a) Lumetta et al. (2001). (b) Lumetta and Hallen (2007).

WTP-RPT-184, Rev. 0
2.14
0
20
40
60
80
100
0 5 10 15 20 25
Time (hours)
wt%
Al D
isso
lved
B1 - AOH60
B2 - AOH20Y
B3 - AOH20
B4 - Autoclaved from Gibbsite
B5 - Autoclaved from psuedoboehmite
Tank S-101
Tank S-110
Figure 2.14. Screening Boehmite Leaching Test Results Compared to Actual Waste Results
When the boehmite simulant results are plotted with the data from Lumetta (as shown in Table 2.5 and Figure 2.14), B3 and B5 match the results from tank waste S-101 and S-110 (high boehmite containing tank waste) the best. Based on the SEM pictures (shown in Figure 2.10 and Figure 2.12, respectively) the B3 sample has more uniform crystals whereas the B5 sample appears to have a more dispersed range of crystal sizes. The primary driver in selecting B3 over B5 was the commercial availability of B3. Note that the tank waste tests used washed solids, and as such had minor concentrations of other anions present. However, these anion levels were very low and are not expected to impact the dissolution rates. Therefore, the B3 boehmite is recommended because of the crystalline structure and particle size as well as its availability in commercial quantities at $1.95 per lb while B5 is a laboratory-produced batch with little experience to say how easily reproducible the material is. Also, it would most likely be expensive to produce compared to the commercial material.

WTP-RPT-184, Rev. 0
3.1
3.0 Boehmite Simulant Testing Matrix Results
As indicated in Section 1, the second task as part of boehmite simulant development was to assess the impact of process conditions on the simulant leaching behavior. This section deals with assessing the impact on the dissolution rate for boehmite from temperature, hydroxide concentration, approach to solubility, and stirring rate. These variables were tested to determine the effect of each on the dissolution rate of the B3 (APYRAL AOH20) boehmite, as shown in Table 3.1. This test matrix is based on a statistical design with the temperature, sodium hydroxide concentration, and the expected boehmite percent solubility of the sample calculated with the equation of Panias et al. (2001) being the primary variables and the degree of mixing (stirring rate) being a secondary variable. The time to achieve a specific percent boehmite dissolution is the dependent variable, and the temperature, stirring rate, and hydroxide concentration are the independent variables in this experimental design. The actual amounts used in the tests are shown in Appendix B. Boehmite solubility is directly related to the strength of the hydroxide concentration. Therefore, to keep the amount of boehmite added at the correct percentage of its solubility limit, the amount of boehmite added had to be adjusted for each test based on the hydroxide concentration being used. If a constant amount of boehmite had been added, then the percent of the boehmite solubility limit would have changed as the concentration of hydroxide changed. Known quantities of boehmite (see Appendix B) were exposed with stirring in 800 grams of caustic-leach solution under the conditions listed in Table 4.1 in a reaction vessel. Note that tests 1 and 9 are duplicates and tests 8 and 10 are duplicates. In addition, tests 11 through 13 are triplicate experiments. These replicates were performed to provide an understanding of the reproducibility of the tests. Also, these tests were performed as a statistical design to obtain the maximum amount of information in a limited data set. These tests were performed in exactly the same manner as those described in Section 2.5. Samples of supernatant were taken at 1, 2, 4, 8, and 24 hours and analyzed to determine how much boehmite had dissolved by measuring aluminum and sodium concentration with ICP-AES. The temperature range for the test matrix was chosen to provide an upper and lower bound on the expected plant operating condition for boehmite leaching. A heating jacket around the vessel maintained the test mixture at a constant temperature throughout the test. The percent boehmite solubility primary variable is an indicator of the boehmite sample size relative to the leach solution for each test condition. It is defined as the ratio of the aluminum concentration in the liquid phase to the maximum possible concentration (solubility limit). Thus, when the target value is 50% solubility, the test contains sufficient boehmite to reach 50% of the solubility limit, assuming total dissolution of boehmite. The boehmite solubility was calculated with the equation of Panias et al. (2001), which is an empirical model based on historical solubility data. The percent solubility range was chosen to provide insight into the impact of the approach to solubility on the dissolution rate. CAl2O3 = A1 x10-6T3 + A2 x 10-3T2 + A3 x10-2T + A4 (3.1) where CAl2O3 is the solubility of boehmite in grams per liter of Al2O3; T is the temperature in degrees Celsius; and A1, A2, A3 and A4 are parameters dependent on the initial concentration of sodium hydroxide in the solution according to the following equations:

WTP-RPT-184, Rev. 0
3.2
A1 = -0.0618925CNa2O + 1.36953 (3.2) A2 = 0.02301 CNa2O + 0.1707 (3.3) A3 = 2.498x10⁻⁶ C3Na2O – 3.106x10⁻⁴ C2Na2O + 5.483x10⁻² CNa2O -1.332 (3.4) A4 = 3.236x10⁻⁶ C3Na2O -7.887x10⁻⁴ C2Na2O +1.584x10⁻¹ CNa2O – 2.518 (3.5) where CNa2O is the initial concentration of sodium hydroxide in grams per liter of Na2O.
The leach-solution hydroxide concentration was defined as the concentration before the start of testing, and the concentrations tested were chosen to bound the expected range of conditions in the WTP. The stirring rates were chosen to provide different levels of solids suspension in the supernatant, based on the degree of agitation of the surface of a water sample in the test vessel. The minimal speed was just slow enough to leave the water surface undisturbed when viewed with reflected light. The full stir speed resulted in a well-agitated surface, and the intermediate mixing rate resulted in minor agitation of the surface. The minimal stir rate (40 rpm) was intended to be just sufficient to keep the solids from completely settling on the bottom of the container to maintain contact with the bulk liquid. The full-speed stir rate was intended to give a completely homogeneous suspension of the solids, and the ½-speed stir rate was intended to result in an intermediate solids suspension. The digital rate controllers for the stirring motors were set to specific revolutions per minute (rpm), and the rates at different settings were verified by direct observation and manual timing. The variation in the stirring rates is expected to be less than 1%. Stirring rates of 40, 60, and 120 rpm were employed for these tests. In general, it was observed that at 40 rpm, most of the boehmite settled to the bottom of the reaction vessel, and the supernatant remained visibly clear. At 60 rpm, the settled layer was thinner, and some material appeared to be suspended in the supernatant. At 120 rpm, there was no settled layer, and the mixture appeared to be a uniform milky white. It can be surmised that the access of the hydroxide solution to the aluminum phase was much better at the highest rate of stirring than at the lowest.

WTP-RPT-184, Rev. 0
3.3
Table 3.1. Boehmite Testing Matrix
Test ID %
Solubility Temperature
(°C) Mixing (rpm)
Leach Soln Conc. at
Beginning MTB-1 100 100 Full (120) 5 M NaOH MTB-2 50 100 Minimal (40) 5 M NaOH MTB-3 100 100 Minimal (40) 1 M NaOH MTB-4 50 100 Full (120) 1 M NaOH MTB-5 100 60 Minimal (40) 5 M NaOH MTB-6 50 60 Full (120) 5 M NaOH MTB-7 100 60 Full (120) 1 M NaOH MTB-8 50 60 Minimal (40) 1 M NaOH MTB-9 100 100 Full (120) 5 M NaOH MTB-10 50 60 Minimal (40) 1 M NaOH MTB-11 75 80 ½ Speed (80) 3 M NaOH MTB-12 75 80 ½ Speed (80) 3 M NaOH MTB-13 75 80 ½ Speed (80) 3 M NaOH

WTP-RPT-184, Rev. 0
3.4
Figure 3.1 shows the effect of hydroxide concentration on boehmite dissolution with the 5-M NaOH solution dissolving more than the 1-M NaOH solution (MTB-6 and MTB-7) with the percent solubility difference taken into account. This indicates that hydroxide concentration has an effect on the boehmite dissolution, which becomes greater with time. Complete results of these tests are shown in Appendix A.
0.000
0.005
0.010
0.015
0.020
0.025
0.030
0.035
0.040
0.045
0.050
0 5 10 15 20 25
Time (hours)
Fra
ctio
n A
l Dis
solv
ed
60°C -5M NaOH- Full Stirring-50% Solubility(MTB-6)60°C - 1M NaOH- Full Stirring-100%Solubility (MTB-7)
Figure 3.1. Effect of Hydroxide Concentration on Boehmite Dissolution.

WTP-RPT-184, Rev. 0
3.5
Figure 3.2 compares the dissolution data for boehmite leached at 100°C and 60°C in 5 M NaOH at full stir speed (120 rpm) (MTB-1 and MTB-6). The temperature over the range tested has a significant effect on the dissolution rate for the boehmite tested (B3).
0
0.1
0.2
0.3
0.4
0.5
0.6
0 5 10 15 20 25
Time (hours)
Fra
ctio
n A
l Dis
solv
ed
100°C - 5M NaOH- Full Stirring-100%Solubility (MTB-1)
60°C - 5M NaOH - Full Stirring-50%Solubility (MTB-6)
Figure 3.2. Effect of Temperature on Boehmite.

WTP-RPT-184, Rev. 0
3.6
Figure 3.3 shows that the stir rate at 60°C for both 1 M and 5 M NaOH had a significant effect on the boehmite dissolution (MTB-5 through MTB-8). The data also indicate that the hydroxide concentration has a significant effect. In all cases, an increase in dissolution was observed with increased stirring rate (mixing).
0.000
0.005
0.010
0.015
0.020
0.025
0.030
0.035
0.040
0.045
0.050
0 5 10 15 20 25 30
Time (hours)
Fra
ctio
n A
l Dis
solv
ed
60 C - 5 M - Minimal Stirring - 100%Solubility (MTB-5)60 C - 5 M -Full Stirring - 50% Solubility(MTB-6)60 C - 1 M -Minimal Stirring - 50%Solubility (MTB-8)60 C - 1 M - Full Stirring - 100%Solubility (MTB-7)
Figure 3.3. Effect of Mixing, Hydroxide Concentration, and Solubility Approach on Boehmite
Dissolution in 1 M (MTB-7 and MTB-8) and 5 M NaOH (MTB-5 and MTB-6) at 60°C

WTP-RPT-184, Rev. 0
4.1
4.0 Aluminate and Anion Effects on Boehmite Dissolution Rate
This section continues the task of assessing the impact of process conditions on leaching performance. In particular, this section assesses the effect of anions on the kinetics of boehmite dissolution and addresses objective 1 in Table S.2. This work was carried out under a separate test plan (TP-RPP-WTP-509, Rev. 0). Two sets of tests were completed: 1) one that examined the effect of the aluminate anion on the rate of boehmite dissolution and 2) another that determined if the presence of secondary anions typical of Hanford tank wastes (carbonate, free-hydroxide, nitrate, nitrite, oxalate, phosphate and sulfate) affect boehmite dissolution rate. Both sets of tests provided insight into how composition variations in the suspending phase impact the effectiveness of dissolution processes. In addition, the aluminate anion studies provided information on the consequences of gibbsite in the waste due to the expected fast dissolution of gibbsite relative to boehmite. These boehmite dissolution tests were performed at 100°C in 800 grams of varying concentrations of NaOH solutions with 1-wt% boehmite solids (8 g boehmite per 800 g NaOH solution). These experiments were performed the same as the previous ones described in Section 2.5. They were fully mixed at 120 rpm, and samples were taken at 1, 2, 4, 8, and 24 hours and analyzed for Al, Na, free OH-, and anions using ICP-AES, potentiometric titration, and ion chromatography (IC). Table 4.1 outlines the test matrix used to determine the aluminate and anion concentration effect on the boehmite dissolution kinetics. These tests were performed in a full factorial design with triplicate points at each of the two corner points to provide an estimate of the experimental error. The variables in this matrix were the initial aluminate ion concentration (compared to boehmite solubility at 100°C), the caustic concentration, and the presence or absence of added anions. The added anions were added in bulk as sodium salts to the base solution in the ratios shown in Table 4.2 to examine the effects of the anion concentrations on the boehmite dissolution rate for Tests 5 to 8, 11, and 12 listed in Table 4.1. These salts were added to bring the total sodium concentration from the salts to 2 M. These anion ratios were selected to resemble supernate from a blend of REDOX sludge wastes. Table 4.3 shows the actual amounts of the components used in these tests.

WTP-RPT-184, Rev. 0
4.2
Table 4.1. Test Matrix for Aluminate Ion Tests
Aluminate Ion Concentration (% of boehmite solubility at 100°C –
defined by Panias [2001]) Test No. (% of solubility) (M)
Caustic Concentration
(M) Added Anions
1 75 0.784 5 No 2 50 0.522 5 No
3,9,10 75 0.149 1 No 4 50 0.100 1 No 5 75 0.784 5 Yes
6,11,12 50 0.522 5 Yes 7 75 0.149 1 Yes 8 50 0.100 1 Yes
Table 4.2. Molar Concentration of Sodium Salts Used for Anion Tests
Component Chemical Formula
Concentration (M)
Sodium Contribution (M)
Sodium phosphate Na3PO4-12H2O 0.008 0.024 Sodium sulfate Na2SO4 0.005 0.010
Sodium carbonate Na2CO3 0.36 0.72 Sodium oxalate Na2C2O4 0.01 0.02 Sodium nitrite NaNO2 0.33 0.33 Sodium nitrate NaNO3 0.90 0.90
Total ---- ---- 2.00
Table 4.3. Aluminate and Anion Test Matrix Components Used
Test ID Boehmite
(g) NaOH
(g) NaAlO2
(g) Na2C2O4
(g) Na3PO4
(g) Na2SO4
(g) Na2CO3
(g) NaNO3
(g) NaNO2
(g)
OH- Conc. Added
M ATM-1 9.62 919.25 48.20 0 0 0 0 0 0 5 ATM-2 9.46 919.25 32.09 0 0 0 0 0 0 5 ATM-3 7.91 787.25 9.16 0 0 0 0 0 0 1 ATM-4 7.88 787.25 6.15 0 0 0 0 0 0 1 ATM-5 10.69 919.25 48.20 1.01 2.28 0.53 28.62 57.37 17.08 5 ATM-6 10.53 919.25 32.09 1.01 2.28 0.53 28.62 57.37 17.08 5 ATM-7 8.98 787.25 9.16 1.01 2.28 0.53 28.62 57.37 17.08 1 ATM-8 8.95 787.25 6.15 1.01 2.28 0.53 28.62 57.37 17.08 1 ATM-9 7.91 787.25 9.16 0 0 0 0 0 0 1 ATM-10 7.91 787.25 9.16 0 0 0 0 0 0 1 ATM-11 10.53 919.25 32.09 1.01 2.28 0.53 28.62 57.37 17.08 5 ATM-12 10.53 919.25 32.09 1.01 2.28 0.53 28.62 57.37 17.08 5

WTP-RPT-184, Rev. 0
4.3
4.1 Aluminate Effect on Boehmite Dissolution
These aluminate anion studies provided information on the effect of gibbsite in the waste due to the expected fast dissolution of gibbsite relative to boehmite. The aluminate simulated dissolved gibbsite in the supernate. Aluminate was found to have a significant impact on the boehmite dissolution in 5 M NaOH and reduced the dissolution rate for boehmite by a factor of about 4.3 as shown in Figure 4.1. Test conditions for the baseline test (BSM-6) are given in Table 5.2 and only contained boehmite and sodium oxalate in 5 M NaOH with no initial aluminate. An increase of aluminate concentration from 50% to 75% boehmite solubility caused a decrease of 25 ± 7 mg/kg hr in the average rate of boehmite dissolution. Table 4.4 summarizes the aluminum dissolution rate with added aluminate ions during the different tests (ATM-1, 2, 3, 4, 9, 10). The actual concentrations versus time are given in Appendix A for each test. The boehmite dissolution rate is affected more by the hydroxide concentration than by the aluminate concentration as is shown by this table. However, a drop in the boehmite dissolution rate is also observed with increased aluminate in the 1 M NaOH.
0
5,000
10,000
15,000
20,000
0 5 10 15 20 25
Time (hrs)
Dis
solv
ed A
l (m
g/k
g so
luti
o n
Low Al (ATM-2)
High Al (ATM-1)
No Al (BSM-6)
Rate ~ 420 mg/kg·hr
Rate ~ 127 mg/kg·hr
Rate ~ 97 mg/kg·hr
Figure 4.1. Aluminate Effect on Boehmite Dissolution (BSM-6, ATM-1 and ATM-2) in 5 M NaOH

WTP-RPT-184, Rev. 0
4.4
Table 4.4. Aluminum Dissolution Rates with Aluminate Added
Test ID Aluminate
Level (a) OH-
ConcentrationRate
[mg/kg.hr] Error
[mg/kg.hr] ATM-4 50% 1 M 64 11
ATM-3,9,10 75% 1 M 39 6 ATM-2 50% 5 M 127 11 ATM-1 75% 5 M 97 11
(a) Percent boehmite solubility
4.2 Anion Effect on Boehmite Dissolution
These tests were used to determine if the presence of secondary anions typical of Hanford tank wastes (carbonate, free-hydroxide, nitrate, nitrite, oxalate, phosphate, and sulfate) effect boehmite dissolution. This set of tests provided insight into how composition variations in the suspending phase impact the effectiveness of the dissolution process. Figure 4.2 shows the effect of the anions on the boehmite dissolution rate in 5 M NaOH. Anion addition slowed the rate of boehmite dissolution with the effect being approximately twice as great in the 5 M NaOH as in the 1 M NaOH as shown in Table 4.5. The actual concentrations versus time are shown in Appendix A. The boehmite dissolution rate is affected more by the hydroxide and aluminate concentrations than by the anion concentration as is shown by this table. However, a drop in boehmite dissolution rate is also observed with anion addition in the 1 M NaOH. Note that no significant impact of anion addition was observed in testing with actual waste with only nitrate as the added anion.

WTP-RPT-184, Rev. 0
4.5
7,000
9,000
11,000
13,000
15,000
0 5 10 15 20 25
Time (hrs)
Dis
solv
ed A
l (m
g/k
g so
luti
o nNo Anions (ATM-2)
With Anions (ATM-6)
With Anions (ATM-11)
With Anions (ATM-12)
Rate ~ 90 ± 6 mg/kg·hr
Rate ~ 127 mg/kg·hr
Figure 4.2. Anion Effect on Boehmite Dissolution (ATM-2 and ATM-6,11,12) in 5 M NaOH
Table 4.5. Aluminum Dissolution Rates with Anions Added
Test ID Aluminate
Level (a) OH-
ConcentrationRate
[mg/kg.hr] Error
[mg/kg.hr] ATM-8 50% 1 M 48 11 ATM-7 75% 1 M 27 11
ATM-6,11,12 50% 5 M 90 6 ATM-5 75% 5 M 65 11
(a) Percent boehmite solubility


WTP-RPT-184, Rev. 0
5.1
5.0 Testing of Boehmite in a Blended Simulant
As indicated in Section 1, the third task for simulant development was to assess the impact of blending the boehmite simulant component with the balance of the simulant components. The B3 boehmite simulant that was chosen to be the “component” simulant was blended in a specified ratio with the other chosen “component” simulants for gibbsite and ultrafiltration. The blended simulant tests used a filtration simulant that contained a blend of solids that are characteristic of actual waste, including boehmite, gibbsite, oxalate, and iron-rich sludge. The blended simulant was then tested over a subset of the matrix of conditions in which the component simulants had been tested previously with different combinations of components present in each test. These results show how the other components interact with the boehmite and whether they hinder, help, or have no effect on its dissolution. Table 5.1 provides the composition of the supernate that was used in these tests. This supernate composition was chosen to provide continuity in boehmite leaching experiments. It is based on a 3.2-M Na concentration, which resembles supernate from a blend of REDOX sludge wastes.(a) Table 5.2 provides the sequence of tests performed in this test matrix. Tests 1 through 13 were performed at 100°C. Tests 1 through 6 along with tests 8 and 9 provide a statistical design to evaluate the effect of gibbsite and filtration components on the dissolution of boehmite. Tests 7, 10, 11, 12, and 13 examine the effect of mixing energy on the dissolution of alumina (both boehmite and gibbsite). Tests 14 through 19 were performed at 45°C and provide equilibrium measurements of boehmite solubility, which is important to evaluating boehmite dissolution kinetics. Tests 14 through 16 also examine the mixing energy effect, and Tests 17 through 19 examine the supernate effect on the dissolution of alumina. The tests examining only gibbsite dissolution (BSM-3 and BSM-4) are not discussed in this report as they are discussed in WTP-RPT-176.(b)
Table 5.1. Supernate Composition at 3.2 M Na
Component Chemical FormulaConcentration
(M) Sodium phosphate Na3PO4-12H2O 0.013 Sodium sulfate Na2SO4 0.008 Sodium carbonate Na2CO3 0.576 Sodium oxalate Na2C2O4 0.016 Sodium nitrite NaNO2 0.528 Sodium nitrate NaNO3 1.44
(a) SK Fiskum et al. Feb. 2008. Characterization and Leach Testing for REDOX Sludge and S-Saltcake Actual
Waste Sample Composites. WTP-RPT-157, Rev. A. (b) RL Russell et al. Dec. 2008. Development and Characterization of Gibbsite Component Simulant. WTP-RPT-
176, Rev. A.

5.2
WT
P-R
PT
-184, Rev. 0
Table 5.2. Blended Component Test Matrix
Test
Sodium Oxalate
(g) Gibbsite
(g) Boehmite
(g)
Sludge Simulant
(g)
19M NaOH
(g)
Condensate (DIW) (g)
Supernate
(g)
Mixing Speed
(rpm) [OH]
Molarity Na
Molarity Notes
BSM-1 6.50 22.73 22.73 12.99 200.27 274.96 259.82 140 5.8 7.1 Full factorial for Gibbsite/Boehmite/Sludge Solids—oxalate as secondary variable
BSM-8 6.50 22.73 22.73 12.99 200.27 274.96 259.82 140 5.8 7.1 Replicate of BSM-1
BSM-9 6.50 22.73 22.73 12.99 200.27 274.96 259.82 140 5.8 7.1 Replicate of BSM-1
BSM-2 0.00 22.73 22.73 0.00 200.27 274.96 259.82 140 5.8 7.1 Full factorial for Gibbsite/Boehmite/Sludge Solids—oxalate as secondary variable
BSM-3 0.00 22.73 0.00 12.99 200.27 274.96 259.82 140 5.8 7.1 Full factorial for Gibbsite/Boehmite/Sludge Solids—oxalate as secondary variable
BSM-4 6.50 22.73 0.00 0.00 200.27 274.96 259.82 140 5.8 7.1 Full factorial for Gibbsite/Boehmite/Sludge Solids—oxalate as secondary variable
BSM-5 0.00 0.00 22.73 12.99 200.27 274.96 259.82 140 5.8 7.1 Full factorial for Gibbsite/Boehmite/Sludge Solids—oxalate as secondary variable
BSM-6 6.50 0.00 22.73 0.00 200.27 274.96 259.82 140 5.8 7.1 Full factorial for Gibbsite/Boehmite/Sludge Solids—oxalate as secondary variable
BSM-7 6.50 22.73 22.73 12.99 200.27 274.96 259.82 280 5.8 7.1 Mixing Energy—Compare Tests 1, 10 and 11
BSM-10 6.50 22.73 22.73 12.99 200.27 274.96 259.82 90 5.8 7.1 Mixing Energy—Compare Tests 1 and 7
BSM-11 6.50 22.73 22.73 12.99 200.27 274.96 259.82 50 5.8 7.1 Mixing Energy—Compare Tests 6 and 12
BSM-12 6.50 0.00 22.73 0.00 200.27 274.96 259.82 90 5.8 7.1 Mixing Energy—Compare Tests 6 and 11
BSM-13 6.50 0.00 22.73 0.00 200.27 274.96 259.82 50 5.8 7.1 Test of 45C condition and mixing energy—Compare to Tests 1, 14, and 15
BSM-14 7.02 24.56 24.56 14.04 152.07 297.06 280.70 140 4.5 5.9 Test of 45C condition and mixing energy—Compare to Tests 1, 13, and 15
BSM-15 7.02 24.56 24.56 14.04 152.07 297.06 280.70 90 4.5 5.9 Test of 45C condition and mixing energy—Compare to Tests 1, 13, and 14
BSM-16 7.02 24.56 24.56 14.04 152.07 577.76 280.70 50 4.5 5.9 Test of 45C condition and supernate effect—compare with test 13
BSM-17 7.02 24.56 24.56 14.04 152.07 577.76 0.00 140 4.5 4.5 Test of 45C condition and supernate effect—compare with test 14
BSM-18 7.02 24.56 24.56 14.04 152.07 577.76 0.00 90 4.5 4.5 Test of 45C condition and supernate effect—compare with test 15
BSM-19 7.02 24.56 24.56 14.04 152.07 577.76 0.00 50 4.5 4.5 Test of 45C condition and supernate effect—compare with test 16

WTP-RPT-184, Rev. 0
5.3
The impact of stirring speed on the boehmite dissolution is shown in Figure 5.1 with gibbsite present and in Figure 5.2 without gibbsite present. This indicates that as long as there is reasonable stirring in the slurry, boehmite dissolution will occur, and the amount of stirring is not a controlling variable. Note that 90 rpm consistently gave higher dissolution than at faster stirring rates. At this time no rationale for this behavior has been found.
30
35
40
45
50
55
60
65
70
0 5 10 15 20 25 30
Time (hours)
% A
l Dis
solu
tion
280 RPM (BSM-7)
140 RPM (BSM-1)
140 RPM (BSM-8)
140 RPM (BSM-9)
90 RPM (BSM-10)
50 RPM (BSM-11)
Figure 5.1. Impact of Stirring Speed on Boehmite Dissolution with Gibbsite Present

WTP-RPT-184, Rev. 0
5.4
0
10
20
30
40
50
60
70
0 5 10 15 20 25 30
Time (hours)
% A
l Dis
solu
tion
140 RPM (BSM-6)
90 RPM (BSM-12)
50 RPM (BSM-13)
Figure 5.2. Impact of Stirring Speed on Boehmite Dissolution without Gibbsite Present
Figure 5.3 shows the effect of supernate on the boehmite dissolution equilibrium. Supernate appears to increase boehmite dissolution at any given time. The effect of each simulant component on the boehmite dissolution is shown in Figure 5.4. Note that for the tests with gibbsite present, the gibbsite dissolution was subtracted based on the results from tests BSM-3 and BSM-4 (gibbsite only Al source). This boehmite in caustic without anything else added yields approximately 80% dissolution. These results indicate that gibbsite has a significant effect on the dissolution of boehmite. Sludge has a slight effect, and oxalate did not appear to have any significant effect on the boehmite dissolution, however.

WTP-RPT-184, Rev. 0
5.5
10
15
20
25
30
35
40
45
50
55
60
65
70
75
0 20 40 60 80 100 120 140 160 180
Time (hours)
% A
l Dis
solu
tion
140 rpm-Supernate (BSM-14)
140 rpm-No Supernate (BSM-17)
90 rpm-Supernate (BSM-15)
90 rpm-No Supernate (BSM-18)
50 rpm-Supernate (BSM-13)
50 rpm-No Supernate (BSM-16)
Figure 5.3. Effect of Supernate on the Boehmite Dissolution Equilibrium
0
10
20
30
40
50
60
70
80
0 5 10 15 20 25 30
Time (hours)
% B
oeh
mit
e D
isso
lved
Sludge, Oxalate, Gibbsite (BSM-1)
Sludge, Oxalate, Gibbsite (BSM-8)
Sludge, Oxalate, Gibbsite (BSM-9)
Gibbsite Only (BSM-2)
Sludge Only (BSM-5)
Oxalate Only (BSM-6)
Figure 5.4. Effect of Each Simulant Component on Boehmite Dissolution

WTP-RPT-184, Rev. 0
5.6
Figure 5.5 shows the approach to boehmite dissolution equilibrium. Samples indicate that the boehmite solubility limit is greater than 20,000 mg/L Al under the tested conditions. Also note that there appears to be some dissolution up to 172 hours.
5.1 Summary The important points learned from these tests are summarized below.
As long as there is reasonable stirring in the slurry, boehmite dissolution will occur, and the amount of stirring is not a controlling variable.
Supernate presence appears to increase boehmite dissolution at any given time.
Gibbsite has a significant effect on the dissolution of boehmite.
Sludge has a slight effect, and oxalate did not appear to have any significant effect on the boehmite dissolution.
Samples indicate that the boehmite solubility limit is greater than 20,000 mg/L Al under the tested conditions and dissolution continues to occur up to 172 hours.
0
5000
10000
15000
20000
25000
0 20 40 60 80 100 120 140 160 180
Time (hours)
Al D
isso
lved
(m
g/L
)
45°C 4.5M Caustic - 140 rpm-supernate (BSM-14)
45°C 4.5M Caustic - 90 rpm-supernate (BSM-15)
45°C 4.5M Caustic - 50 rpm-supernate (BSM-13)
45°C 4.5M Caustic - 140 rpm- no supernate (BSM-17)
Figure 5.5. Approach to Boehmite Equilibrium at 45°C
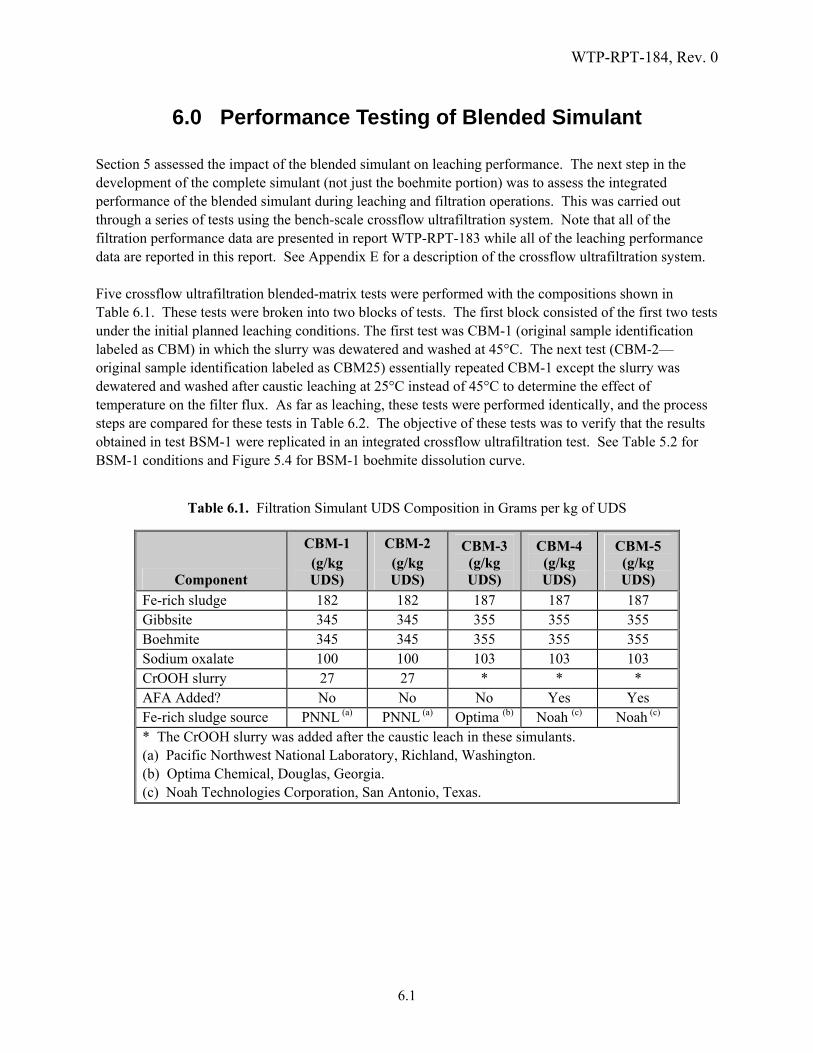
WTP-RPT-184, Rev. 0
6.1
6.0 Performance Testing of Blended Simulant
Section 5 assessed the impact of the blended simulant on leaching performance. The next step in the development of the complete simulant (not just the boehmite portion) was to assess the integrated performance of the blended simulant during leaching and filtration operations. This was carried out through a series of tests using the bench-scale crossflow ultrafiltration system. Note that all of the filtration performance data are presented in report WTP-RPT-183 while all of the leaching performance data are reported in this report. See Appendix E for a description of the crossflow ultrafiltration system. Five crossflow ultrafiltration blended-matrix tests were performed with the compositions shown in Table 6.1. These tests were broken into two blocks of tests. The first block consisted of the first two tests under the initial planned leaching conditions. The first test was CBM-1 (original sample identification labeled as CBM) in which the slurry was dewatered and washed at 45°C. The next test (CBM-2—original sample identification labeled as CBM25) essentially repeated CBM-1 except the slurry was dewatered and washed after caustic leaching at 25°C instead of 45°C to determine the effect of temperature on the filter flux. As far as leaching, these tests were performed identically, and the process steps are compared for these tests in Table 6.2. The objective of these tests was to verify that the results obtained in test BSM-1 were replicated in an integrated crossflow ultrafiltration test. See Table 5.2 for BSM-1 conditions and Figure 5.4 for BSM-1 boehmite dissolution curve.
Table 6.1. Filtration Simulant UDS Composition in Grams per kg of UDS
Component
CBM-1 (g/kg UDS)
CBM-2 (g/kg UDS)
CBM-3 (g/kg UDS)
CBM-4 (g/kg UDS)
CBM-5 (g/kg UDS)
Fe-rich sludge 182 182 187 187 187 Gibbsite 345 345 355 355 355 Boehmite 345 345 355 355 355 Sodium oxalate 100 100 103 103 103 CrOOH slurry 27 27 * * * AFA Added? No No No Yes Yes Fe-rich sludge source PNNL (a) PNNL (a) Optima (b) Noah (c) Noah (c)
* The CrOOH slurry was added after the caustic leach in these simulants. (a) Pacific Northwest National Laboratory, Richland, Washington. (b) Optima Chemical, Douglas, Georgia. (c) Noah Technologies Corporation, San Antonio, Texas.

WTP-RPT-184, Rev. 0
6.2
Table 6.2. Process Steps for CBM-1 and CBM-2
Process Step CBM-1 CBM-2 Initial Dewatering Temp. (°C) 45 25 Caustic Leaching Temp. (°C) 100 100 Caustic Leach Dewater Temp. (°C) 45 25 Incremental Caustic Leach Wash Steps 6 6 Caustic Washing Temperature (°C) 45 25 Oxidative Leaching Temp. (°C) 45 45 Incremental Oxidative Leach Wash Steps 4 4 Oxidative Washing Temperature (°C) 45 25
The next block of three tests (CBM-3, CBM-4, and CBM-5) were performed to determine the ability of the simulant-producing vendor to produce the simulant at various production quantities. CBM-3 was performed from a 25-L simulant batch, CBM-4 was performed from a 15-gallon simulant batch, and CBM-5 was performed from a 250-gallon simulant batch. The objective of these tests was to assess whether there were any significant differences in the leaching behavior from these three different scales of simulant production. These tests were performed similar to CBM-2 except a greater amount of caustic was used, and the chromium slurry was introduced after the caustic leach. Also, constant wash concentrations were used in these tests. Table 6.3 compares the conditions used for these three tests. This report will only present the chemical results from the leaching processes because the filtration results were presented in WTP-RPT-183.(a)
Table 6.3. Process Steps for CBM-3, CBM-4, and CBM-5
Process Step CBM-3 CBM-4 CBM-5 Initial Dewatering Temp. (°C) 25 25 25 Caustic Leaching Temp. (°C) 100 100 100 Caustic Leach Dewater Temp. (°C) 25 25 25 Caustic Leach Wash Steps 16 16 16 Caustic Leach Wash Conc. (M) 0.01 0.01 0.01 Caustic Washing Temperature (°C) 25 25 25 CrOOH Slurry Addition Amount (kg) 1.73 1.73 1.73 CrOOH Slurry Wash (0.01M NaOH) (L) 15 15 15 Oxidative Leaching Temp. (°C) 25 25 25 Oxidative Leach Wash Steps 13 13 13 Oxidative Leach Wash Conc. (M) 0.01 0.01 0.01 Oxidative Washing Temperature (°C) 25 25 25
A 5-wt% undissolved solids (UDS) simulant slurry consisting of 34.6 wt% gibbsite, 34.6 wt% boehmite, 18.1 wt% filtration simulant slurry, and 10-wt% sodium oxalate was used for these tests. The slurry (a) Russell et al. Dec. 2008. Development and Demonstration of Ultrafiltration Simulants. WTP-RPT-183,
Rev. A.
WTP-RPT-184, Rev. 0
6.3
simulant was dewatered to the crossflow ultrafiltration system’s minimum operating volume at a predicted concentration of ~20 wt% UDS. Next, the slurry simulant was removed from the crossflow ultrafiltration system to be caustic leached in the slurry reservoir tank. NaOH was blended with the slurry, and the volume of the addition was established to include the volume of water representing the leach solution volume increase that was predicted to occur from heating with steam injection in the UFP-2 vessel of the PEP. The leach solution was heated to 100°C over a 5.3-hour interval. Samples were taken at 0, 2, and 4 hours. The slurry was then held at 100°C for 12 hours. Samples were taken every 2 hours during this time. Afterwards, the slurry was allowed to cool to room temperature over a 12-hour interval with samples taken every 2 hours again. At this point, the leached slurry in the slurry reservoir tank was allowed to enter the piping of the crossflow ultrafiltration system, and it was again dewatered to the crossflow ultrafiltration system’s minimum operating volume. Then wash solutions (whose concentration and volume varied with test being performed) were added to the leached slurry and dewatered. Tests CBM-1 and CBM-2 used incremental wash solution concentrations as shown in Table 6.4. Tests CBM-3, CBM-4, and CBM-5 used constant concentration wash solutions of 0.01 M NaOH.
Table 6.4. Caustic Wash Concentrations for CBM-1 and CBM-2
Wash Volume (L)
NaOH Conc. of Wash (M)
Wash 1 4.8 1.57 Wash 2 4.8 0.68 Wash 3 4.8 0.26 Wash 4 4.8 0.08 Wash 5 4.8 0.03 Wash 6 4.8 0.01
The slurry wash volume was prescribed by material balance. Once the prescribed quantity of wash water had been added and removed from the crossflow ultrafiltration system, the slurry was prepared for oxidative leaching in the slurry reservoir tank. At this point, a solution of 1 M sodium permanganate was added to the simulant slurry. The volume of sodium permanganate added was calculated to achieve a 1:1 molar ratio of Mn to the predicted quantity of Cr in the simulant solids. After the solution was added to the simulant slurry, it was mixed for 6 hours at room temperature (~22°C). Samples were taken at 0.5, 1, 2, 4, and 6 hours. After 6 hours, the oxidative leached slurry was dewatered and then washed with 0.01 M NaOH and dewatered again to achieve 90% removal of the solubilized Cr. CBM-1 and CBM-2 used 4 washes of 4.5 L 0.01 M NaOH. CBM-3, CBM-4, and CBM-5 used 13 washes of 700 mL 0.01 M NaOH. Samples were collected throughout the tests to track the dissolution of the slurry components and were analyzed by ICP-AES, IC, and hydroxide titration.
6.1 Comparison of Tests CBM-1 and CBM-2 with BSM-1
With respect to leaching, the objectives of these two crossflow ultrafiltration tests (CBM-1 and CBM-2) were to

WTP-RPT-184, Rev. 0
6.4
assess the leaching process performance and reproducibility in the crossflow ultrafiltration system
verify that the results obtained in test BSM-1 were replicated in an integrated crossflow ultrafiltration test that involved leaching and filtering on a larger scale.
6.1.1 Experimental Details
Nine liters of the 5-wt% UDS initial simulant slurry were placed in the crossflow ultrafiltration system simulant slurry reservoir tank. In the CBM-1 test, the simulant slurry was dewatered at 45°C to ~20 wt% UDS by adding 750 mL of simulant slurry to the tank for every 750 mL of supernate removed. The transmembrane pressure (TMP) and axial velocity (AV) were held constant at 40 psid (pounds per square inch) and 13 ft/s throughout the dewatering process. The caustic leach was performed at 100°C in the simulant slurry reservoir tank. After leaching, the low-solids slurry was dewatered at 45°C to ~17 wt% UDS at 40 psid TMP and 13 ft/s AV conditions. The leached slurry was washed with 4.8 L of varying NaOH concentration solution (see Table 6.4) at 45°C six times to remove the dissolved aluminum. The simulant slurry was then oxidatively leached at 45°C for 6 hours with 1 M KMnO4. The oxidatively leached simulant slurry was then washed at 45°C with four 4.8-L washes of 0.01 M NaOH to remove the dissolved chromium and dewatered to ~18 wt% UDS between each wash. The slurry was then dewatered to the target wt% UDS of ~20 wt%. The simulant slurry was then drained from the crossflow ultrafiltration system. For CBM-2, the same test was performed except that the filtering operations and oxidative leaching were performed at 25°C instead of 45°C. Caustic leaching was performed at 100°C as in the previous test CBM-1. The oxidative leaching step in CBM-2 used NaMnO4 (the preferred permanganate source) instead of KMnO4 like CBM-1. No NaMnO4 was available when it was needed during CBM-1, and therefore, KMnO4 was used instead so that the test could proceed. The results indicated that there was no significant difference between them in the amount of chromium leached. Slurry samples were analyzed at the Southwest Research Institute (SWRI)(a) with inductively coupled plasma (ICP)-mass spectroscopy (MS) and atomic emissions spectroscopy (AES) for cations. Anions measured with IC include nitrite (NO2
-), nitrate (NO32-), phosphate (PO4
3-), sulfate (SO42-), and oxalate
(C2O42-). Hydroxide was measured by titration. Results of all analyses are listed in Appendix C. In
general, the mass balance between elemental composition of the untreated simulant sludge and the elemental composition derived from the wash solutions agreed well. The chemical leach factor was defined as the percentage difference in mass of a component in the waste after chemical leaching.
initiali
finali
im
mf 1 (6.1)
where if was the leach factor for component i, initialim was the initial mass ratio of component i relative
to Fe, and finalim was the final mass ratio of component i relative to Fe.
(a) Southwest Research Institute, 6220 Culebra Road, P.O. Drawer 28510. San Antonio, Texas 78228.

WTP-RPT-184, Rev. 0
6.5
The boehmite leach factor is obtained by taking the Al leach factor and subtracting the gibbsite fraction and then dividing by the initial boehmite fraction.
b
gAlb m
mff (6.2)
where bf = boehmite leach factor
Alf = Al leach factor
gm = gibbsite mole fraction bm = boehmite mole fraction.
6.1.2 CBM-1 Results
Table G.1 of Appendix G provides a timeline for the CBM-1 test. All of the analytical results for this test are shown in Appendix C. This section will discuss primarily the Al, Cr, and Mn behavior during this leaching test. The aluminum concentration for test CBM-1 is shown in Figure 6.1 where there is a sharp initial increase in soluble Al, principally from the dissolution of gibbsite, and then a gradual increase due to the dissolution of boehmite during the caustic leaching. A decrease in Al content is observed during the washing of the leached simulant as the dissolved Al is being removed. No significant quantities of Al were dissolved after oxidative leaching and further washing. In Figure 6.2, the chromium and manganese concentrations are shown. Following the permanganate addition (indicated by the increase in manganese concentration), there is a significant increase in the chromium concentration in the leachate due to its dissolution; however, some chromium was leached during the initial caustic leaching step also as shown by the increase of chromium concentration during the caustic leach.

6.6
WT
P-R
PT
-184, Rev. 0
0
2000
4000
6000
8000
10000
12000
14000
16000
0 10 20 30 40 50 60 70 80
Time (hrs)
[Al]
(m
g/k
g)
Heatup Cooling
Washing
Caustic Leaching
Oxidiative Leaching
Oxidative Washing
Figure 6.1. Concentration of Aluminum in Solution (mg/kg solution) in Test CBM-1

6.7
WT
P-R
PT
-184, Rev. 0
Figure 6.2. Dissolution of Chromium and Manganese in mg/kg solution in Test CBM-1

WTP-RPT-184, Rev. 0
6.8
The slurry composition results are shown in Table 6.5. The levels of insoluble components such as calcium, iron, lead, manganese, neodymium, nickel, and zirconium were enriched significantly throughout the test.
Table 6.5. Analytical Slurry Analysis in CBM-1 (mg/kg solution)
CBM-IN-SL CBM-DW-SL CBM-LC-SL CBM-WS-SL CBM-FSC-SL Aluminum 13,700 53,800 67,500 42,500 85,400 Calcium 124 489 1,150 859 1,740 Chromium 365 1,420 1,240 503 504 Iron 3,630 15,000 36,600 27,400 55,100 Lead 176 722 1,580 1,190 2,380 Magnesium 36.9 150 353 269 545 Manganese 809 3,350 8,020 6,120 14,700 Neodymium 96.66 397 979 697 1,460 Nickel 120 485 1,200 905 1,800 Potassium 1,800 1,550 588 <135 478 Sodium 85,600 79,900 96,500 4,280 2,930 Zirconium 47.7 99 475 327 569 Nitrate 20,800 18,200 6,770 104 <109 Nitrite 6,490 5,840 1,970 <84.1 <109 Oxalate 3,460 13,700 2,700 1,040 138 Phosphate 291 220 <81.0 <84.1 <109 Sulfate 820 708 254 <84.1 <109 Notes: Values reported as “less than” are not quantifiable above background. CBM-IN-SL = initial slurry composition CBM-DW-SL = slurry composition following dewatering CBM-LC-SL = slurry composition following the caustic leach CBM-WS-SL= slurry composition following oxidative treatment CBM-FSC-SL = final slurry composition.
The concentration ratios of various species in the solids are described in Table 6.6 for test CBM-1. The results indicate that chromium and aluminum are removed relative to iron and calcium.
Table 6.6. Ratio of Various Species in Solids from Test CBM-1
Ratio Initial
Conditions At Start of Caustic Leaching Heat-up
After Caustic Leaching Cool Down End of Test
Al/Fe 2.8 3.4 1.5 1.5 1.5 Cr/Fe 0.09 0.09 0.02 0.02 0.01 Al/Ca 82 103 48 49 49 Cr/Ca 2.7 2.8 0.57 0.57 0.23

WTP-RPT-184, Rev. 0
6.9
6.1.3 CBM-2 Results
Table G.2 of Appendix G provides a timeline for the process steps in test CBM-2. The concentration of aluminum in test CBM-2 is shown in Figure 6.3. See Appendix C for analytical data. There was a rapid increase in Al concentration during caustic leaching, principally from the dissolution of gibbsite, and then a gradual increase due to the dissolution of boehmite during the caustic leaching. Following washing, the Al content decreases, indicating that the dissolved Al was being removed, and then it essentially remains constant throughout the remaining steps of the test. As shown in Figure 6.4, adding NaMnO4 in the oxidative leaching step after 80 hours resulted in a peak in manganese concentration. Once the permanganate oxidant was added, chromium was solubilized through oxidation of Cr(III) to Cr(VI), and an immediate jump in the chromium concentration of the leachate was seen. The washing with progressively lower concentrations of caustic solution removed both aluminum and chromium from the leachate.

6.10
WT
P-R
PT
-184, Rev. 0
0
2000
4000
6000
8000
10000
12000
14000
16000
0 10 20 30 40 50 60 70 80 90 100Time (hrs)
Al C
once
ntr
atio
n (
mg/
kg
Hea
t-up
Coo
l-D
own
Was
hing
Cau
stic
Lea
chin
g
Oxi
diat
ive
Lea
chin
g
Oxi
dativ
e L
each
Was
hing
Cau
stic
Lea
ch D
ewat
er
Initi
al D
eaw
ater
Figure 6.3. Dissolution of Aluminum in mg/kg Solution in Test CBM-2

6.11
WT
P-R
PT
-184, Rev. 0
0
100
200
300
400
500
600
0 10 20 30 40 50 60 70 80 90 100Time (hrs)
Con
cen
trat
ion
(m
g/k
g
Chromium Manganese
Heatup
Cooling
Washing
Caustic Leaching
Oxidiative Leaching
Initial Dew
ater
Caustic Leach Dew
atering
Oxidative Washing
Figure 6.4. Chromium and Manganese Concentration in mg/kg solution in Test CBM-2

WTP-RPT-184, Rev. 0
6.12
The slurry composition results are shown in Table 6.7 for test CBM-2. The levels of insoluble components such as calcium, iron, lead, manganese, neodymium, nickel, and zirconium were enriched significantly throughout the test because the aluminum and other soluble compoonents dissolved.
Table 6.7. Slurry Analysis (CBM-2) (mg/kg slurry)
CBM25-IN-SL
CBM25-DW-SL
CBM25-LC-SL
CBM25-WS-SL
CBM25-FSC-SL
Aluminum 15,248 56,933 29,118 60,646 57,728
Calcium 119 472 486 1,103 1,088
Chromium 365 1,476 586 719 359
Iron 3,571 15,389 14,559 36,755 36,160
Lead 182 735 657 1,619 1,598
Magnesium 35.4 144 147 353 348
Manganese 757 3,266 3,098 7,744 9,033
Nickel 118 505 481 1,205 1,190
Potassium 1,585 1,284 225 <90 <98
Sodium 78,857 72,058 63,824 4,936 2,006
Zirconium 52 221 168 446 458
Nitrate 22,900 20,700 3,270 87 30.5
Nitrite 6,790 6,210 1,180 40.8 <22
Oxalate 3,600 15,200 12,800 <40 <44
Phosphate 356 272 <50 <40 <44
Sulfate 842 726 644 1,370 49.3 Notes: Values reported as “less than” are not quantifiable above background. CBM25-IN-SL = initial slurry composition CBM25-DW-SL = slurry composition following dewatering CBM25-LC-SL = slurry composition following the caustic leach CBM25-WS-SL= slurry composition following oxidative treatment CBM25-FSC-SL = final slurry composition.
The concentration ratios of various species in the solids are described in Table 6.8 for test CBM-2. The results indicate that chromium and aluminum are removed relative to iron and calcium.

WTP-RPT-184, Rev. 0
6.13
Table 6.8. Ratio of Various Species in Solids from Test CBM-2
Initial Conditions
At Start of CausticLeaching Heat-up
After Caustic Leaching Cool Down End of Test
Al/Fe 3.6 3.6 1.4 1.6 1.6 Cr/Fe 0.10 0.09 0.02 0.02 0.01 Al/Ca 108 116 43 55 53 Cr/Ca 2.9 3.1 0.55 0.64 0.19
6.1.4 Conclusions
The leach factors were calculated as defined in Equation 6.1 while the boehmite leach factors were calculated as defined in Equation 6.2. The overall leach factors for both the CBM-1 and CBM-2 tests are described in Table 6.9 and Table 6.10. The Al leach factors are essentially the same with errors of ±15% and overall, they are very low. When accounting for the distribution of gibbsite and boehmite in the initial simulant, the Al leach factor for boehmite is 0.12 and 0.23 for CBM-1 and CBM-2, respectively. The boehmite leach factor is estimated assuming 100% dissolution of gibbsite. These boehmite leach factors are consistent with those observed in tests BSM-1, 8, and 9 where approximately 10% of the boehmite leached in 8 hours under similar conditions. These results indicated that the results obtained from the integrated test are effectively the same as those observed in the bench-scale simulant tests.
Table 6.9. Al Leaching Ratios for Test CBM-1 and CBM-2
CBM-1 CBM-2
Al leach factor based on Fe 0.50 0.56
Al leach factor based on Pb 0.45 0.52
Al leach factor based on Ca 0.52 0.55
Boehmite leach factor 0.08 0.15
Results indicate that the majority (80%) of the Cr dissolved during caustic leaching in CBM-1. Therefore, only an additional 10% of the Cr dissolved during oxidative leaching.

WTP-RPT-184, Rev. 0
6.14
Table 6.10. Leaching Ratios of Various Species for Test CBM-1 and CBM-2
CBM-1 CBM-2
Cr/Fe after ox leach 0.007 0.006
Cr/Fe after caustic leach 0.018 0.019
Cr/Nd after ox leach 0.27 ---
Cr/Nd after caustic leach 0.70 ---
Cr/Pb after ox leach 0.17 0.13
Cr/Pb after caustic leach 0.41 0.43
Cr/Ca after ox leach 0.23 0.19
Cr/Ca after caustic leach 0.57 0.64
Total Cr Leach Factor 0.92 0.93
Caustic Leach Factor 0.79 0.77
A higher temperature filtration resulted in significant post-filtration precipitation in both tests as observed in the samples.
6.1.5 Observations during initial Cold-CUF runs
Images of the leachates (supernatant solution) show some changes in the clarity of the solutions, which indicates that changes occurred during the caustic leaching steps after cooling to the filtration temperature. This coloration has been associated with the precipitation of iron, manganese, and oxalate as indicated by analytical analysis. Images of the supernatant solution that were taken during the caustic leaching heat up at a rate of 0.236°C/min to 100°C in 5.3 hours are shown in Figure 6.5. These samples show an increase in coloration as the heating progresses at 0, 2, and 4 hours. This coloration appears to be indicative of post filtration precipitation. Close inspection indicates that a source of this coloration is very fine particulate material. Figure 6.6 shows the supernatant solution samples taken every 2 hours during the caustic-leaching period at 100°C, and Figure 6.7 shows the samples as they were cooled down to 25°C from 100°C over 12 hours. All of the photos shown are from CBM-2 but were common to CBM-1 also.

WTP-RPT-184, Rev. 0
6.15
Figure 6.5. Caustic Leach Tank Heat Up Samples from CBM-2
Figure 6.6. Photograph of 22-mL Sample Vials from the Caustic Leaching of Test CBM-2 (0, 2,4,6,8,10, and 12 hours from left to right)

WTP-RPT-184, Rev. 0
6.16
Figure 6.7. Photograph of 22-mL Sample Vials from the Caustic Leach Cooling of Test CBM-2 (0, 2,4,6,8,10, and 12 hours from left to right)
After the 12-hour leach sample, the tank was allowed to cool over 12 hours to ~ 40°C. Samples were taken every 2 hours during this process. These samples showed decreasing precipitation with time (see Figure 6.8). Finally, the tank was allowed to cool slowly from 40°C to ~25°C for another 12 hours. These samples show little evidence of continuing precipitation; however, close inspection of the bottom of the bottles does show the presence of a slight amount of precipitation in the samples.
Figure 6.8. Samples After Cooling over 12 Hours of Test CBM-2 (R-0 is before heating, 0, 1, 2, 4, 6, 8, 10, 12 hours after cooling)
Figure 6.9 shows the difference in color and suspended particle content between the leached filtrate from the CBM-1 and CBM-2 tests. The CBM-1 sample was collected at 45°C and then cooled to room temperature, and the CBM-2 sample was collected at 25°C and allowed to equilibrate with the room temperature. This indicates that the higher filtration temperature of CBM-1 (45°C) appears to cause more precipitation when the filtrate is cooled than the lower filtration temperature of CBM-2 (25°C).

WTP-RPT-184, Rev. 0
6.17
Figure 6.9. Photographs of the CBM-1 and CBM-2 Test Leach Filtrates at the End of Caustic Leaching
All the samples taken during the oxidative leaching process exhibited a strong purple color or dark color (see Figure 6.9). However, all of the wash samples were yellow, indicating the presence of chromium. The sample on the left in Figure 6.10 is the first wash solution. The bright yellow color is indicative of soluble Cr(VI). The sample on the right was one of the samples taken during oxidative leaching and shows the purple color indicative of permanganate (MnO4
-). This demonstrates that the reaction did not go to completion during the oxidative leaching timeframe or that there was excess permanganate present, but the reaction went to completion immediately after wash water was added.
Figure 6.10. Oxidative Leach Samples (Oxidative wash [OW] on the left and oxidative leach [OL] on the right)

WTP-RPT-184, Rev. 0
6.18
6.2 Simulant Production Scale-Up Assessment Tests
6.2.1 Experimental Details
The next three tests (CBM-3, CBM-4, and CBM-5) determined the ability of the simulant-producing vendor to scale-up the simulant production process. The filtration simulants used in the CBM-3, CBM-4, and CBM-5 tests contained equal concentrations (in grams per kg of UDS) of boehmite, gibbsite, oxalate, and iron-rich sludge. Test CBM-3 (a 25-liter batch) was done using a sludge simulant prepared by Optima with the boehmite, gibbsite, and sodium oxalate added by PNNL. Tests CBM-4 (a 15-gallon batch) and CBM-5 (a 250-gallon batch) were run with a crossflow ultrafiltration simulant generated by Noah, which included all of the components (boehmite, gibbsite, sodium oxalate, and sludge solids with supernate). The results of these tests were compared with the results of test CBM-2, which was run with a simulant prepared by PNNL, and used a temperature of 25oC for the initial dewatering and all of the procedures after the caustic leach. An anti-foaming agent (AFA) was added to the simulant at the start of tests CBM-4 and CBM-5. Test CBM-3 was run without any AFA added. Samples of slurries, supernates, and filtrates were regularly collected during the test to monitor the progression of metal and anion dissolution. These samples were analyzed with ICP-MS and ICP-AES. All slurry samples and a few filtrate samples collected for the CBM-3 test were analyzed at PNNL. Southwest Research Institute analyzed the remainder of the CBM-3 filtrate samples and all solution and slurry samples collected for the CBM-4 and CBM-5 runs. Anions measured with IC include nitrite (NO2
-), nitrate (NO32-), phosphate (PO4
3-), sulfate (SO42-), and oxalate (C2O4
2-). In general, the mass balance between the elemental composition of the untreated simulant sludge and the elemental composition derived from the wash solutions agreed, although there were some outliers—that mostly came from samples analyzed by PNNL. Results of all analyses are listed in Appendix C. All three tests started with a dewatering step of the initial slurry at 25oC to ~20 wt% UDS. After this step, a caustic leach was performed by adding 19 M NaOH of DIW to the slurries. The temperature was increased to 100oC over 5.3 hours and held for 12 hours, and then it was cooled to 25oC over 12 hours. Samples of the supernate were collected regularly every 2 hours during the leaching process every 2 hours for composition analysis and Al dissolution tracking. After the caustic leaching, the slurries were dewatered to 17 wt% UDS. All systems subsequently underwent 16 incremental wash treatments (at 25oC), which each involved adding 700 mL of 0.01 M NaOH, vigorous mixing for approximately 30 minutes, and then dewatering by ~ 700 mL. Samples of the 16 wash supernates were collected during this time for analysis by ICP-AES for cations. The next step involved performing an oxidative leach using NaMnO4. This process was designed to remove chromium from the waste since this constituent inhibits glass formation. Since earlier tests (CBM-1 and CBM-2) had indicated that as much as 90 wt% of the CrOOH is dissolved during caustic leaching operation, the CrOOH slurry was added to the tests following post-caustic leach dewatering and wash operations so that quantitative results on the efficacy of the oxidative leaching process could be determined. CrOOH slurry and 0.01 M NaOH were added to the post-caustic leached, washed, and dewatered slurries, and the resulting mix was dewatered to 17% UDS. Then 1-M NaMnO4 solution was

WTP-RPT-184, Rev. 0
6.19
added and allowed to leach for 6 hours at 25°C with continuous stirring during each test. Oxidative leach supernate samples were collected every 2 hours during these 6 hours to track Cr dissolution. After the oxidative leach process, the slurry underwent 13 incremental washings, where each involved adding 700 mL of 0.01 M NaOH and then removing ~700 mL of supernatant solution through filtration. The filtrate solutions were collected for ICP analysis of the cations. The slurry remaining at the end of the incremental washing was then dewatered to ~20 wt%. A sample of the final slurry concentrate was collected for composition analysis. Process time-lines for each of these tests are provided in Table G.3 through Table G.5 in Appendix G.
6.2.2 Results
The physical properties of each simulant have been measured (data can be found in WTP-RPT-183,(a) Table 6.1) and have been found to be consistent. Given this, and the fact that they contain equal concentrations of key chemicals, it was expected for them to behave similarly to both caustic and oxidative leaching.
6.2.2.1 Aluminum Leaching Behavior
As shown in Table 6.11, the aluminum leach factors, calculated using the ICP measured slurry concentrations, are within 10% of each other, with the average being 0.61 except when compared to Pb. The average boehmite leach factor was determined to be 0.31 as shown in Table 6.12. Note that the boehmite leach factor determined for CBM-3 is 20% higher than the average of CBM-4 and CBM-5. There are several potential sources of this difference. First, while all the test slurries were analyzed by ICP-AES, the CBM-3 slurry was analyzed by PNNL whereas the CBM-4 and CBM-5 slurries were analyzed by Southwest Research Institute. The PNNL metals concentrations reported for the initial CBM-3 feed slurry were high, i.e., the values reported for Al, Mn, and Na were at least a factor of 2 greater than those estimated based on the filtration simulant UDS compositions reported in WTP-RPT-183.(a) But it is also to be noted that test CBM-3 was performed without AFA present, whereas the other two tests were run with this component in the initial feed slurry. AFA was added to the last two tests at the request of WTP to assess the impact of AFA on filtration behavior. The average Al and boehmite leach factors (0.61 and 0.31) that were determined using the data from CBM-3, CBM-4, and CBM-5 are slightly higher than those determined in the CBM-2 test (0.54 and 0.15). If only the iron and calcium are compared, the leach factors are within experimental error of ±15%, indicating that there is no real difference between simulants.
Table 6.11. Leaching Ratios of Aluminum for Test CBM-3, CBM-4, and CBM-5
CBM-3 CBM-4 CBM-5
Al leach factor based on Fe 0.64 0.59 0.60
Al leach factor based on Pb 0.64 0.51 0.66
Al leach factor based on Ca --- 0.60 0.60
(a) Russell et al. Dec. 2008. Development and Demonstration of Ultrafiltration Simulants. WTP-RPT-183,
Rev. A.

WTP-RPT-184, Rev. 0
6.20
Table 6.12. Total Aluminum Leach Factors for the Different Filtration Simulants
Test Al Leach Factor Boehmite Leach Factor Vendor CBM-3 0.64 0.36 Optima/PNNL CBM-4 0.57 0.28 Noah CBM-5 0.62 0.29 Noah Average 0.61 0.31
Figure 6.11 plots the filtrate aluminum concentration (in mg/kg) as a function of time during the caustic-leach process. Post-leach dewatering was performed with 16 incremental washes. The filtrate analysis data show that the aluminum in the three feed simulants reacted essentially identically during the caustic-leaching process with each test following the same leaching trend.

6.21
WT
P-R
PT
-184, Rev. 0
Al Filtrate Behavior During Caustic Leach
0
2000
4000
6000
8000
10000
12000
14000
0 6 12 18 24 30 36 42 48 54 60Time from Heating (hr)
[Al]
mg/
kg
CBM3 Al
CBM4 Al
CBM5 Al
HeatLeach Wash
Figure 6.11. Dissolution of Aluminum in mg/kg Solution in Tests CBM-3, CBM-4, and CBM-5
Cool Dewater

WTP-RPT-184, Rev. 0
6.22
6.2.2.2 Chromium and Manganese Leaching Behavior
The oxidative-leach process is effective at removing chromium from the waste slurry. As mentioned before, 1.73 kg of CrOOH was added to the slurry just before the start of the oxidative-leach process. This explains why the chromium concentration spikes just before the oxidative-leach process in the overall treatment process. However, as Figure 6.12 shows, this is rapidly dissolved when permanganate is added. Figure 6.12 shows that right after permanganate was added, the chromium concentration in the filtrate was very similar for all three PEP simulant systems. However, it does appear that after the initial dissolution, some of the chromium precipitates in the CBM-3 solid since the supernatant concentration decreases from ~5000 mg/kg to ~4000 mg/kg. CBM-4 and CBM-5 appear to be more effective at keeping chromium in solution since the filtrate chromium concentrations remain stable at around 5700 mg/kg throughout the oxidative-leach process. The Cr(III) caustic-leach factors are 0.71, 0.58, and 0.69 for CBM-3, CBM-4, and CBM-5 tests, respectively. Analysis of the final slurry samples (see Appendix C) indicated that all three simulants react identically to the oxidative leach with effectively 100% of the chromium leached from the solids during this step.

6.23
WT
P-R
PT
-184, Rev. 0
Cr Filtrate Behavior During Oxidative Leach
0
1000
2000
3000
4000
5000
6000
7000
60 64 68 72 76 80
Time from Caustic Leach Heat Up (hr)
[Cr]
mg/
kg
CBM3 Cr
CBM4 Cr
CBM5 Cr
Figure 6.12. Chromium Concentration in mg/kg Solution During the Oxidative Leach Process
Leach
Wash

WTP-RPT-184, Rev. 0
6.24
6.2.3 Summary
The purpose of these tests was to determine if sludge simulants, prepared by different suppliers in different batch quantities, had similar reaction properties when subjected to high-temperature caustic leach and room-temperature oxidative leach. The three simulants, labeled CBM-3, CBM-4, and CBM-5, showed similar reactive behavior in their chemical leaching properties. The total aluminum leach factors determined for the three simulants were in agreement within 10%, with the average being 0.61. The CBM-3 simulant had a slightly higher (~20%) boehmite leach factor when compared with the other two tests, but this might be a result of the way the slurry samples collected throughout this test were treated for ICP-AES analysis. Chromium in the three simulants reacted similarly. However, since all three reacted effectively to complete dissolution, it is difficult to determine any significant differences between the oxidative leaching behaviors in these three tests.

WTP-RPT-184, Rev. 0
7.1
7.0 Boehmite Simulant Revision Testing
The initial selection of boehmite simulant was based on the crystallography and mineralogy. This boehmite simulant revision was required from Test Plan TP-RPP-WTP-469 to re-evaluate the selected boehmite simulant candidate and revise the selection, if required, to best simulate the boehmite dissolution behavior in the actual waste. Therefore, the objective of these tests was to test various boehmites under different leaching conditions and compare them to the actual waste testing results and then to determine the best boehmite simulant. Two sets of tests were performed as described in Section 2.5. In the first set, B1, B3, B4, and B5 boehmite sources were used based on their initial leaching results and how they compared to the actual waste leaching results (Group 5) (Fiskum 2008). The second set of tests used new boehmite sources obtained from APYRAL that had particle sizes in the preferred range. These were AOH30 (B6) and AOH180E (B7). Table 7.1 shows the test matrix that was performed using 1-wt% boehmite solids for the first set of tests. Table 7.2 shows the test matrix that was performed using 1-wt% boehmite solids for the second set of tests. They were fully mixed at 120 rpm, and samples were taken at 1, 2, 4, 8, and 24 hours and analyzed for Al and Na using ICP-AES.
Table 7.1. Boehmite Revision Test Matrix for the First Set of Tests
Test ID Boehmite Source Temperature (°C) Leach Soln. Conc.
(M NaOH) BCT2-1 B1 100 3 BCT2-2 B4 100 3 BCT2-3 B1 100 5 BCT2-4 B4 100 5 BCT2-5 B1 100 7 BCT2-6 B4 100 7 BCT2-7 B3 100 5 BCT2-8 B5 100 3 BCT2-9 B5 100 5
BCT2-10 B5 100 7
Table 7.2. Boehmite Revision Test Matrix for the Second Set of Tests
Test ID Boehmite Source Temperature (°C) Leach Soln. Conc.
(M NaOH) BCT3-1 B6 100 3 BCT3-2 B7 100 3 BCT3-3 B6 100 5 BCT3-4 B7 100 5 BCT3-5 B6 100 7 BCT3-6 B7 100 7

WTP-RPT-184, Rev. 0
7.2
The results of the boehmite simulant leaching in 5 M NaOH are shown in Figure 7.1, and the results of leaching in 3 M NaOH are shown in Figure 7.2. The data from Group 5 actual waste (REDOX sludge) are also shown for comparison to the boehmite simulants because it is a high-boehmite-containing tank waste (Fiskum 2008). B4 provides the same dissolution rate within the experimental uncertainty as B7, which was selected for additional testing, while B5 is measurably slower than the rest of the boehmite samples.
Figure 7.1. Boehmite Sources Compared with Actual Waste Group 5 (REDOX Sludge) in 5 M NaOH

WTP-RPT-184, Rev. 0
7.3
0.0
0.1
0.2
0.3
0.4
0.5
0.6
0.7
0.8
0.9
1.0
0 5 10 15 20 25 30
Time (h)
Mas
s F
ract
ion
Con
vers
ion
B1a in 3M NaOH
B1b in 3M NaOH
B3 in 3M NaOH
B4 in 3M NaOH
B5 in 3M NaOH
B6 in 3M NaOH
B7 in 3M NaOH
Group 5 in 3 M NaOH
Figure 7.2. Boehmite Sources Compared with Actual Waste Group 5 (REDOX Sludge) in 3 M NaOH


WTP-RPT-184, Rev. 0
8.1
8.0 Summary and Conclusions
8.1 Boehmite Selection
When the boehmite simulant results are plotted with the data from Lumetta, B3 and B5 match the results from tank waste S-101 and S-110 the best. B3 was a commercially available product and was therefore selected for further testing. Therefore, the B3 (APYRAL AOH20) boehmite is recommended because of the crystalline structure and particle size as well as its availability in commercial quantities.
8.2 Impact of Reaction Conditions
Temperature, hydroxide concentration, approach to solubility, and stirring rate were tested to determine the effect of each of these on the dissolution rate of the B3 (APYRAL AOH20) boehmite. Increasing the hydroxide concentration increases the boehmite dissolution rate. The temperature over the range tested has a significant effect on the dissolution rate. The stirring rate at 60°C for both 1 M and 5 M NaOH had a significant effect on the boehmite dissolution. The effect was greater, however, in the 5 M NaOH, indicating that hydroxide concentration has a greater effect than the mixing rate. In all cases, an increased stirring (mixing) rate was observed to increase the dissolution rate but not to the degree found for increasing the temperature or hydroxide concentration over the ranges tested. The B3 boehmite simulant that was chosen to be the “component” simulant was then blended in a specified ratio with the other chosen “component” simulants for gibbsite, sodium oxalate, supernatant, condensate (de-ionized water), and ultrafiltration slurry. This blended simulant was then retested over a subset of the matrix conditions in which the component simulants had been tested previously. Gibbsite has a significant effect on the dissolution of boehmite. Ultrafiltration slurry and sodium oxalate did not appear to have any significant effect on the boehmite dissolution, however. Samples indicate that the boehmite solubility limit is greater than 20,000 mg/L Al under the tested conditions. Also note that there appears to be some boehmite dissolution up to 172 hours. With regard to boehmite dissolution behavior, the effect of anions on the kinetics of boehmite dissolution was examined. Two sets of tests were completed: 1) one that examined the effect of the aluminate anion on the rate of boehmite dissolution and 2) another that determined if the presence of secondary anions typical of Hanford tank wastes (carbonate, free-hydroxide, nitrate, nitrite, oxalate, phosphate, and sulfate) affect boehmite dissolution. The aluminate anion studies provided information on the consequences of gibbsite in the waste due to the expected fast dissolution of gibbsite relative to boehmite. The aluminate anion simulated dissolved gibbsite in the supernate. Aluminate was found to have a significant impact on the boehmite dissolution in 5 M NaOH and reduced the dissolution rate for boehmite by 4.3 times. An increase of aluminate concentration from 50% to 75% boehmite solubility caused a decrease of 25 ± 7 mg/kg-hr in the average rate of boehmite dissolution.

WTP-RPT-184, Rev. 0
8.2
Anion addition slowed the rate of boehmite dissolution with the effect being approximately twice as great in 5 M NaOH than in 1 M NaOH. A drop in boehmite dissolution is also observed with anion addition in 1 M NaOH. Boehmite dissolution is affected more by the hydroxide and aluminate concentrations than by the anion concentration. The objective of the boehmite simulant revision tests was to determine the effect of hydroxide concentration on the dissolution kinetics of different boehmites and compare these results to the actual waste testing to verify that the boehmite chosen matched the behavior of the actual waste as close as possible under different leaching conditions. B4 appeared to be about the same as B7, which was selected for additional testing, while B5 appeared to be slower than the rest of the boehmite samples.
8.3 Integrated Testing
The objective of these tests was to assess the integrated performance of leaching and filtration simultaneously. These tests used the blended filtration simulant that was planned to be used in the PEP tests. These tests were broken into two blocks of tests. The first block consisted of two tests under the initial planned leaching conditions. In the first test (CBM-1), the slurry was dewatered and washed at 45°C. The next test (CBM-2) was performed essentially to repeat CBM-1 except the slurry was dewatered and washed after caustic leaching at 25°C instead of 45°C to determine the effect of temperature on the filter flux. The Al leach factors of these tests were essentially the same and overall, they were very low. When accounting for the distribution of gibbsite and boehmite in the initial simulant, the leach factor for boehmite is 0.08 and 0.15 for CBM-1 and CBM-2, respectively. The leaching factor of chromium in CBM-2 was higher than in CBM-1. In CBM-2, more chromium was leached during the oxidative step than in CBM-1where the Cr/Fe ratio is much higher in CBM-2 than CBM-1. Results indicate that the majority (80%) of the Cr dissolved during caustic leaching in CBM-1. Therefore, only an additional 10% of the Cr dissolved during oxidative leaching. The next block of tests (CBM-3, CBM-4, and CBM-5) determined the ability of the simulant-producing vendor to produce the simulant at various production quantities. They show similar reactive behavior with their measured chemical and physical properties being comparable. The total aluminum leach factors determined for the three simulants were in agreement within 10%, with the average being 0.61. The CBM-3 simulant had a slightly higher (~ 20%) boehmite leach factor when compared with the other two tests, but this might be a result of the way the slurry samples collected throughout this test were treated for ICP-AES analysis. Analysis of aluminum in the various supernates shows that, with respect to heating and caustic leaching, all three simulants react identically. The systems did not show any common reaction behavior to oxidative leach, but did respond in unison to the final wash process.

WTP-RPT-184, Rev. 0
9.1
9.0 References
Fiskum, SK, EC Buck, RC Daniel, K Draper, MK Edwards, TL Hubler, LK Jagoda, ED Jenson, AE Kozelisky, GJ Lumetta, PJ MacFarlan, BK McNamara, RA Peterson, SI Sinkov, LA Snow, and RG Swoboda. 2008. Characterization and Leach Testing for REDOX Sludge and S-Saltcake Actual Waste Sample Composites. PNNL-17368, Pacific Northwest National Laboratory, Richland, Washington.
Lumetta GJ, BM Rapko, MJ Wagner, J Liu, and YL Chen. 1996. Washing and Caustic Leaching of Hanford Tank Sludges: Results of FY 1996 Studies. PNNL-11278, Pacific Northwest National Laboratory, Richland, Washington.
Lumetta GJ, I Burgeson, MJ Wagner, J Liu, and YL Chen. 1997. Washing and Caustic Leaching of Hanford Tank Sludge: Results of FY1997 Studies. PNNL-11636 Rev 1, Pacific Northwest National Laboratory, Richland, Washington.
Lumetta GJ, KJ Carson, LP Darnell, LR Greenwood, FV Hoopes, RL Sell, SI Sinkov, CZ Soderquist, MW Urie, and JJ Wagner. 2001. Caustic Leaching of Hanford Tank S-110 Sludge. PNNL-13702, Pacific Northwest National Laboratory, Richland, Washington.
Lumetta GJ, and R.T. Hallen. 2007. Review of Caustic Leaching Testing With Hanford Tank Waste Sludges. WTP-RPT-151, Rev. 0, Pacific Northwest National Laboratory, Richland, Washington.
Panias D, P Asimidis, and I Paspaliaris. 2001. “Solubility of boehmite in concentrated sodium hydroxide solutions: model development and assessment.” Hydrometallurgy 59:15–29.
Smith GL. 2006. “Characterization and Small Scale Testing of Hanford Wastes to Support the Development and Demonstration of Leaching and Ultrafiltration Pretreatment Processes.” WTP Project Doc. No. 24590-PTF-TSP-RT-06-006, Rev. 0.
Sundar PS. 2006. “Characterization and Small Scale Testing of Hanford Wastes to Support the Development and Demonstration of Leaching and Ultrafiltration Pretreatment Processes.” WTP Project Doc. No. 24590-PTF-TSP-RT-06-003, Rev. 0.


WTP-RPT-184, Rev. 0
Appendix A
Actual Analytical Data


A.1
WT
P-R
PT
-184, Rev. 0
Appendix A: Actual Analytical Data
Table A.1. Boehmite Screening Test Leaching Results (PNNL ASR# 7902)
CT-B1 CT-B2 CT-B3 CT-B4 CT-B5 Time (hrs)
Al (μg/mL)
Na (μg/mL)
Al (μg/mL)
Na (μg/mL)
Al (μg/mL)
Na (μg/mL)
Al (μg/mL)
Na (μg/mL)
Al (μg/mL)
Na (μg/mL)
0 -- 68,000 -- 67,800 -- 66,300 -- 66,200 -- 67,100 1 561 68,500 535 68,200 532 67,200 2,170 67,500 379 68,100 2 950 67,900 887 67,500 881 68,300 3,150 68,400 634 67,000 4 1,560 68,800 1,450 69,100 1,460 68,200 3,980 67,100 1,110 69,000 8 2,530 70,100 2,190 68,300 2,210 68,400 4,630 68,400 1,750 69,700
24 4,830 74,000 4,300 74,500 4,060 74,200 5,160 73,400 3,590 75,000 Final 4,880 74,700 4,260 73,800 3,920 69,800 5,060 73,300 3,520 73,600
Table A.2. Al Boehmite Matrix Test Leaching Results (SWRI SSR# 30803)
Time (hrs)
MTB-1 (mg/L)
MTB-2 (mg/L)
MTB-3 (mg/L)
MTB-4 (mg/L)
MTB-5 (mg/L)
MTB-6 (mg/L)
MTB-7 (mg/L)
MTB-8 (mg/L)
MTB-9 (mg/L)
MTB-10 (mg/L)
MTB-11 (mg/L)
MTB-12 (mg/L)
MTB-13 (mg/L)
0 3.86 <3.00 1.11 1.20 <3.00 <3.00 1.26 <1.00 <3.00 <1.00 <2.00 <2.00 <2.00 1 2,300 468 103 163 11.2 21.9 7.06 2.07 2,370 2.07 128 133 118 2 3,960 909 211 285 21.3 37.8 12.8 4.02 4,050 3.62 228 245 221 4 6,690 1,780 452 490 48.0 69.9 18.7 6.37 6,620 6.34 404 423 404 8 10,300 3,540 905 830 102 123 30.8 10.7 9,470 11.6 714 740 724
24 16,700 9,870 2,260 1,750 318 314 71.7 31.6 17,600 31.6 1,710 1,720 1,710 Final 17,300 9,830 2,280 1,740 337 319 72.1 32.9 17,500 31.9 1,700 1,740 1,710

A.2
WT
P-R
PT
-184, Rev. 0
Table A.3. Na Boehmite Matrix Test Leaching Results (SWRI SSR# 30803)
Time (hrs)
MTB-1 (mg/L)
MTB-2 (mg/L)
MTB-3 (mg/L)
MTB-4 (mg/L)
MTB-5 (mg/L)
MTB-6 (mg/L)
MTB-7 (mg/L)
MTB-8 (mg/L)
MTB-9 (mg/L)
MTB-10 (mg/L)
MTB-11 (mg/L)
MTB-12 (mg/L)
MTB-13 (mg/L)
0 110,000 108,000 22,000 22,000 106,000 109,000 21,800 21,800 110,000 21,700 65,900 67,200 65,200 1 110,000 109,000 22,400 22,500 107,000 109,000 22,000 21,600 109,000 22,000 65,500 65,000 66,800 2 110,000 109,000 22,600 22,600 102,000 111,000 21,900 21.800 111,000 22,100 66,400 66,700 67,300 4 109,000 110,000 22,800 22,600 109,000 110,000 22,000 21,900 110,000 22,300 67,200 66,200 66,600 8 112,000 112,000 23,600 22,800 109,000 111,000 22,000 22,100 112,000 22,200 68,600 67,800 67,900
24 114,000 118,000 25,000 24,400 110,000 112,000 22,000 22,400 119,000 23,500 68,900 68,500 70,300 Final 117,000 119,000 25,200 24,100 110,000 112,000 22,100 22,200 118,000 23,300 69,200 69,100 67,600
Table A.4. Blended Matrix Al Boehmite Leaching Test Results (SWRI SSR# 31241, 31334, and 31084)
Time (hrs)
BSM-1 (mg/L)
BSM-2 (mg/L)
BSM-2a (mg/L)
BSM-5 (mg/L)
BSM-6 (mg/L)
BSM-6a (mg/L)
BSM-7 (mg/L)
BSM-8 (mg/L)
BSM-9 (mg/L)
BSM-10 (mg/L)
BSM-11 (mg/L)
BSM-12 (mg/L)
BSM-12a
(mg/L) BSM-13 (mg/L)
BSM-13a
(mg/L)0 7.81 5.89 N/A 8.51 8.64 <3.46 9.73 11,100 7.93 5.91 8.95 4.37 4.14 7.57 <3.45 1 13,300 13,200 10,800 716 992 1,080 13,200 12,900 13,100 13,500 10,500 1,270 1,070 506 437 2 13,400 13,400 10,600 1,350 1,740 1,930 13,200 13,100 13,200 14,000 11,600 2,220 1,940 1,150 921 4 13,600 13,800 10,800 2,350 2,990 3,230 13,700 13,400 13,600 14,200 12,200 3,730 3,220 2,470 1,890 8 14,200 14,800 11,500 4,240 5,230 5,150 14,400 14,000 14,100 15,100 13,600 5,930 5,170 5,000 3,930
24 16,400 18,700 13,000 9,390 11,600 9,520 16,600 16,000 16,500 18,300 16,300 11,900 9,680 11,400 9,420 Final 16,400 18,700 13,400 9,620 11,500 9,450 17,200 16,500 16,600 17,500 16,500 11,800 9,730 11,400 9,400

A.3
WT
P-R
PT
-184, Rev. 0
Table A.4.a. Blended Matrix Al Boehmite Leaching Test Results (SWRI SSR# 31241, 31334, and 31084)
Time (hrs)
BSM-14 (mg/L)
BSM-15a (mg/L)
BSM-16a (mg/L)
BSM-17a (mg/L)
BSM-18a (mg/L)
BSM-19a (mg/L)
0 5.99 7.58 4.89 4.48 <3.85 6.99 1 14,100 12,200 10,400 11,800 11,900 9,100 2 14,500 12,200 11,400 12,100 12,100 10,300 4 14,500 12,300 12,100 12,200 12,200 11,200 8 15,100 12,500 12,900 12,300 12,300 12,200
24 16,300 13,400 13,500 13,500 13,500 14,300 72 18,800 15,700 15,300 14,900 15,400 15,400
120 19,200 16,000 15,500 15,400 16,100 17,800 168 19,700 20,800 16,500 16,900 16,500 17,400
Final 20,000 17,200 17,800 17,900 16,900 18,100
Table A.5. Blended Matrix Na Boehmite Leaching Test Results (SWRI SSR# 31241, 31334, and 31084)
Time (hrs)
BSM-1 (mg/L)
BSM-2 (mg/L)
BSM-2a (mg/L)
BSM-5 (mg/L)
BSM-6 (mg/L)
BSM-6a
(mg/L)BSM-7 (mg/L)
BSM-8 (mg/L)
BSM-9 (mg/L)
BSM-10
(mg/L)
BSM-11
(mg/L)
BSM-12
(mg/L)
BSM-12a
(mg/L)
BSM-13
(mg/L)
BSM-13a
(mg/L) 0 120,000 122,000 N/A 120,000 118,000 96,500 119,000 119,000 121,000 118,000 119,000 119,000 104,000 120,000 97,500 1 119,000 117,000 93,300 122,000 120,000 98,300 118,000 117,000 118,000 116,000 115,000 120,000 98,300 119,000 103,0002 117,000 120,000 93,800 122,000 119,000 98,100 118,000 118,000 118,000 116,000 118,000 121,000 100,000 121,000 99,100 4 119,000 125,000 93,300 122,000 124,000 98,700 120,000 118,000 121,000 117,000 115,000 121,000 98,000 121,000 100,0008 120,000 123,000 94,600 124,000 126,000 98,900 120,000 118,000 120,000 118,000 115,000 123,000 98,400 123,000 106,000
24 118,000 130,000 93,900 125,000 138,000 101,000 128,000 119,000 118,000 120,000 117,000 129,000 99,500 129,000 108,000Final 121,000 126,000 N/A 126,000 138,000 99,700 126,000 119,000 120,000 116,000 116,000 129,000 99,900 127,000 107,000

A.4
WT
P-R
PT
-184, Rev. 0
Table A.5.a. Blended Matrix Na Boehmite Leaching Test Results (SWRI SSR# 31241, 31334, and 31084)
Time (hrs)
BSM-14 (mg/L)
BSM-15a (mg/L)
BSM-16a (mg/L)
BSM-17a (mg/L)
BSM-18a (mg/L)
BSM-19a (mg/L)
0 98,800 80,900 76,700 54,200 49,900 53,300 1 95,300 79,100 69,500 50,500 52,500 51,500 2 96,400 80,600 73,800 56,200 52,400 56,100 4 96,600 80,600 75,100 56,600 49,700 57,000 8 97,400 77,800 81,000 57,400 54,800 56,300
24 98,800 78,400 72,900 59,400 56,400 63,600 72 103,000 80,900 77,600 57,100 53,100 57,800
120 98,200 79,600 76,400 57,200 53,100 69,800 168 98,200 101,000 80,500 59,500 46,400 61,200 Final 96,600 81,600 83,300 62,800 59,700 62,100
Table A.6. Aluminate Ion Effect on Boehmite Leaching Test Results
(SWRI SSR# 31347, 31421, and 31382)
ATM-1 ATM-2 ATM-3 ATM-4 ATM-5 Time (hrs)
Al (mg/L)
Na (mg/L)
Al (mg/L)
Na (mg/L)
Al (mg/L)
Na (mg/L)
Al (mg/L)
Na (mg/L)
Al (mg/L)
Na (mg/L)
0 19,100 123,000 13,000 122,000 3,320 25,200 2,090 24,400 16,100 157,000 1 19,100 125,000 13,100 122,000 3,290 25,200 2,590 24,800 15,200 147,000 2 19,700 127,000 13,400 121,000 3,770 25,500 2,670 24,400 15,600 150,000 4 20,000 127,000 13,500 121,000 3,660 25,700 2,590 24,900 15,700 151,000 8 21,200 127,000 14,300 124,000 4,060 25,700 2,720 24,900 16,000 150,000
24 22,000 129,000 16,700 125,000 4,640 26,400 3,970 25,900 17,600 153,000 Final 22,400 128,000 15,300 126,000 4,610 26,600 3,820 25,900 20,200 175,000

A.5
WT
P-R
PT
-184, Rev. 0
Table A.6.a. Aluminate Ion Effect on Boehmite Leaching Test Results (SWRI SSR# 31347, 31421, and 31382)
ATM-6 ATM-7 ATM-8 ATM-9 ATM-10
Time (hrs)
Al (mg/L)
Na (mg/L)
Al (mg/L)
Na (mg/L)
Al (mg/L)
Na (mg/L)
Al (mg/L)
Na (mg/L)
Al (mg/L)
Na (mg/L)
0 10,500 145,000 3,180 63,900 2,110 61,100 3,790 25,100 3,370 24,900 1 10,500 143,000 3,200 63,400 2,180 63,000 3,390 25,500 3,430 25,200 2 10,700 146,000 3,260 68,400 2,260 63,600 3,470 25,700 3,480 25,500 4 10,700 142,000 3,330 57,100 2,310 62,600 3,510 25,700 3,530 25,300 8 11,500 147,000 3,430 65,200 2,530 63,700 3,630 25,800 3,640 25,400
24 13,100 145,000 3,920 65,800 3,440 65,500 4,330 27,200 4,240 26,700 Final 14,300 161,000 3,890 64,700 3,460 66,300 4,240 27,000 4,250 26,600
Table A.6.b. Aluminate Ion Effect on Boehmite Leaching Test Results
(SWRI SSR# 31347, 31421, and 31382)
ATM-11 ATM-12 Time (hrs)
Al (mg/L)
Na (mg/L)
Al (mg/L)
Na (mg/L)
0 9,840 130,000 9,880 133,000 1 9,940 132,000 9,950 133,000 2 9,970 132,000 10,100 135,000 4 10,200 132,000 10,400 134,000 8 10,900 134,000 10,700 134,000
24 12,900 140,000 12,400 135,000 Final 13,000 143,000 12,400 135,000

A.6
WT
P-R
PT
-184, Rev. 0
Table A.7. Al Boehmite Simulant Revision Testing Results (First Set) (SWRI SRR# 32072, 32104, and 31989)
Time (hrs)
BCT2-1
(mg/L)
BCT2-2
(mg/L)
BCT2-3
(mg/L)
BCT2-4
(mg/L)
BCT2-5
(mg/L)
BCT2-6
(mg/L)
BCT2-7
(mg/L)
BCT2-8
(mg/L)
BCT2-9
(mg/L)
BCT2-10
(mg/L)0 <2.50 3.60 <2.50 <2.50 <2.50 4.68 <2.50 5.93 9.32 3.47 1 482 2,170 636 2,500 903 3,950 729 311 380 551 2 844 3,390 1,190 3,680 1,560 5,150 1,300 566 748 1,070 4 1,420 4,270 1,980 4,550 2,650 5,590 2,120 1,030 1,370 1,920 8 2,450 4,920 3,220 4,980 4,480 5,840 3,430 1,840 2,360 3,240
24 4,750 5,370 5,350 5,590 6,130 6,560 5,580 3,830 4,510 6,090 Final 4,760 5,370 5,400 5,560 6,420 6,510 5,760 3,830 4,530 6,020
Table A.8. Na Boehmite Simulant Revision Testing Results (First Set)
(SWRI SRR# 32072, 32104, and 31989)
Time (hrs)
BCT2-1
(mg/L)
BCT2-2
(mg/L)
BCT2-3
(mg/L)
BCT2-4
(mg/L)
BCT2-5
(mg/L)
BCT2-6
(mg/L)
BCT2-7
(mg/L)
BCT2-8
(mg/L)
BCT2-9
(mg/L)
BCT2-10
(mg/L) 0 65,200 67,200 109,000 110,000 153,000 155,000 110,000 68,000 113,000 148,0001 64,400 66,200 109,000 110,000 157,000 154,000 110,000 67,800 112,000 155,0002 64,200 68,400 110,000 112,000 151,000 155,000 111,000 67,200 113,000 157,0004 64,200 67,100 106,000 111,000 150,000 156,000 109,000 68,900 113,000 158,0008 67,000 68,400 111,000 112,000 158,000 158,000 110,000 71,500 114,000 159,000
24 70,500 72,700 112,000 120,000 163,000 169,000 117,000 80,100 121,000 171,000Final 69,600 72,800 111,000 120,000 168,000 168,000 119,000 79,200 120,000 168,000

A.7
WT
P-R
PT
-184, Rev. 0
Table A.9. Al Boehmite Simulant Revision Testing Results (Second Set) (SWRI SRR# 32040, 32104)
Time (hrs)
BCT3-1
(mg/L)
BCT3-2
(mg/L)
BCT3-3
(mg/L)
BCT3-4
(mg/L)
BCT3-5
(mg/L)
BCT3-6
(mg/L) 0 <2.50 <2.50 <2.50 <2.50 <2.50 2.84 1 397 1,970 701 2,820 804 4,620 2 698 3,350 1,120 4,400 1,500 5,710 4 1,170 4,680 1,800 5,250 2,640 5,960 8 1,920 5,220 2,830 5,410 4,180 5,970
24 3,890 5,800 4,790 5,820 6,110 6,170 Final 3,880 5,920 4,830 5,810 6,030 6,120
Table A.10. Na Boehmite Simulant Revision Testing Results (Second Set)
(SWRI SRR# 32040, 32104)
Time (hrs)
BCT3-1
(mg/L)
BCT3-2
(mg/L)
BCT3-3
(mg/L)
BCT3-4
(mg/L)
BCT3-5
(mg/L)
BCT3-6
(mg/L) 0 64,800 64,900 108,000 109,000 152,000 155,0001 65,400 65,300 110,000 106,000 150,000 153,0002 65,400 65,800 109,000 108,000 154,000 153,0004 64,500 66,500 107,000 110,000 154,000 155,0008 66,000 68,000 109,000 112,000 156,000 156,000
24 71,600 74,700 110,000 120,000 168,000 160,000Final 69,900 75,100 111,000 120,000 164,000 159,000


WTP-RPT-184, Rev. 0
Appendix B
Leaching Testing Conditions


B.1
WT
P-R
PT
-184, Rev. 0
Appendix B: Testing Conditions
Table B.1. Boehmite Screening Test Leaching Conditions
CT-B1 CT-B2 CT-B3 CT-B4 CT-B5 OH- conc. (M) 3 3 3 3 3 Leach Temp (°C) 98.1 98.6 98.6 98.3 98.8 Density (g/mL) 1.12 1.12 1.12 1.12 1.12 Boehmite added (g) 8.00 8.00 8.00 8.00 8.01 Caustic soln added (g) 802.09 801.97 802.10 802.02 802.01
Table B.2.a. Boehmite Matrix Test Leaching Conditions
MTB-1 MTB-2 MTB-3 MTB-4 MTB-5 MTB-6 MTB-7 OH- conc. (M) 5 5 1 1 5 5 1 Leach Temp (°C) 99.3 98.8 98.4 98.7 60.0 59.3 60.3 Density (g/mL) 1.19 1.19 1.04 1.04 1.19 1.19 1.04 Boehmite added (g) 42.16 21.08 9.53 4.77 25.49 12.74 4.58 Caustic soln added (g) 806.01 806.00 806.01 806.01 806.01 806.02 806.02
Table B.2.b. Boehmite Matrix Test Leaching Conditions
MTB-8 MTB-9 MTB-10 MTB-11 MTB-12 MTB-13 OH- conc. (M) 1 5 1 3 3 3 Leach Temp (°C) 60.2 98.7 60.4 79.9 79.4 78.8 Density (g/mL) 1.04 1.19 1.04 1.12 1.12 1.12 Boehmite added (g) 2.29 42.16 2.29 14.50 14.50 14.50 Caustic soln added (g) 806.01 806.04 806.03 806.03 806.01 806.01
B.2
WT
P-R
PT
-184, Rev. 0
Table B.3. Blended Matrix Boehmite Leaching Test Conditions
BSM-1 BSM-2 BSM-2a BSM-5 BSM-6 OH- conc. (M) 19 19 19 19 19 Leach Temp (°C) 101.5 101.6 98.1 102.0 100.9 Boehmite added (g) 22.73 22.73 22.73 22.73 22.73 Gibbsite added (g) 22.73 22.73 22.74 --- --- Caustic soln added (19M) (g) 200.31 200.29 200.28 200.29 200.27 Condensate added (g) 198.28 274.97 274.97 198.28 274.98 Supernate added (g) 259.91 259.93 259.83 259.84 259.83 Sludge slurry added (g) 89.65 --- --- 89.63 --- Sodium oxalate added (g) 6.49 --- --- --- 6.50
Table B.3.a. Blended Matrix Boehmite Leaching Test Conditions
BSM-6a BSM-7 BSM-8 BSM-9 BSM-10 OH- conc. (M) 19 19 19 19 19 Leach Temp (°C) 100.7 101.8 103.9 101.3 100.4 Boehmite added (g) 22.73 22.73 22.73 22.73 22.75 Gibbsite added (g) --- 22.73 22.73 22.73 22.74 Caustic soln added (19M) (g) 200.27 200.29 200.28 200.27 200.28 Condensate added (g) 274.98 198.36 198.71 198.32 198.32 Supernate added (g) 259.82 259.84 259.84 259.96 259.83 Sludge slurry added (g) --- 89.66 89.66 89.81 89.67 Sodium oxalate added (g) 6.50 6.50 6.51 6.51 6.50
B.3
WT
P-R
PT
-184, Rev. 0
Table B.3.b. Blended Matrix Boehmite Leaching Test Conditions
BSM-11 BSM-12 BSM-12a BSM-13 BSM-13a OH- conc. (M) 19 19 19 19 19 Leach Temp (°C) 99.0 99.9 100.9 99.4 101.0 Boehmite added (g) 22.74 22.73 22.74 22.73 22.74 Gibbsite added (g) 22.74 --- --- --- --- Caustic soln added (19M) (g) 200.26 200.28 200.28 200.26 200.27 Condensate added (g) 198.42 274.98 274.93 275.21 274.96 Supernate added (g) 259.81 259.81 259.84 259.84 259.84 Sludge slurry added (g) 89.66 --- --- --- --- Sodium oxalate added (g) 6.50 6.50 6.50 6.50 6.49
Table B.3.c. Blended Matrix Boehmite Leaching Test Conditions
BSM-14 BSM-15 BSM-15a BSM-16 BSM-16a OH- conc. (M) 19 19 19 19 19 Leach Temp (°C) 96.8 104.5 98.8 100.6 98.6 Boehmite added (g) 24.55 24.57 24.56 24.55 24.56 Gibbsite added (g) 24.55 24.56 24.56 24.56 24.56 Caustic soln added (19M) (g) 152.04 152.06 152.06 152.07 152.07 Condensate added (g) 214.22 214.67 234.67 214.68 234.68 Supernate added (g) 280.85 281.57 280.70 282.39 280.71 Sludge slurry added (g) 96.90 96.43 76.43 96.44 76.45 Sodium oxalate added (g) 7.02 7.01 7.02 7.01 7.02

B.4
WT
P-R
PT
-184, Rev. 0
Table B.3.d. Blended Matrix Boehmite Leaching Test Conditions
BSM-17 BSM-17a BSM-18 BSM-18a BSM-19 BSM-19a
OH- conc. (M) 19 19 19 19 19 19 Leach Temp (°C) 100.5 99.6 103.2 100.2 102.3 100.0 Boehmite added (g) 24.56 24.56 24.55 24.56 24.55 24.56 Gibbsite added (g) 24.56 24.56 24.56 24.56 24.56 24.56 Caustic soln added (19M) (g) 152.05 152.07 152.05
152.08 152.05 152.07
Condensate added (g) 495.37 515.39 495.38 515.38 495.72 515.38 Supernate added (g) --- --- --- --- --- --- Sludge slurry added (g) 96.44 76.44 96.42 76.43 96.42 76.44 Sodium oxalate added (g) 7.02 7.02 7.02 7.02 7.02 7.02

B.5
WT
P-R
PT
-184, Rev. 0
Table B.4. Aluminate and Anion Effect on Boehmite Leaching Test Conditions
ATM-1 ATM-2 ATM-3 ATM-4 OH- conc. (M) 5 5 1 1 Leach Temp (°C) 101.0 100.8 100.8 100.7 Density (g/mL) 1.19 1.19 1.04 1.04 Boehmite added (g) 9.62 9.46 7.91 7.88 Sodium aluminate added (g) 48.20 --- 9.16 6.15 Caustic soln added (g) 919.26 919.24 787.26 787.25
ATM-5 ATM-6 ATM-7 ATM-8 OH- conc. (M) 5 5 1 1 Leach Temp (°C) 98.8 100.8 101.8 101.9 Density (g/mL) 1.19 1.19 1.04 1.04 Boehmite added (g) 10.69 10.53 8.98 8.95 Sodium aluminate added (g) 48.20 32.09 9.15 6.16 Caustic soln added (g) 919.27 919.27 787.26 787.25 Na2C2O4 added (g) 1.00 1.01 1.01 1.01 Na3PO4 added (g) 2.28 2.28 2.28 2.28 Na2SO4 added (g) 0.53 0.53 0.53 0.53 Na2CO3 added (g) 28.62 28.62 28.62 28.62 NaNO3 added (g) 57.37 57.37 57.37 57.37 NaNO2 (g) 17.08 17.08 17.08 17.08
ATM-9 ATM-10 ATM-11 ATM-12 OH- conc. (M) 1 1 5 5 Leach Temp (°C) 93.5 100.5 97.6 100.3 Density (g/mL) 1.04 1.04 1.19 1.19 Boehmite added (g) 7.91 7.91 10.53 10.53 Sodium aluminate added (g) 9.16 9.16 32.09 32.09 Caustic soln added (g) 787.24 787.25 919.25 919.27 Na2C2O4 added (g) --- --- 1.00 1.01 Na3PO4 added (g) --- --- 2.28 2.28 Na2SO4 added (g) --- --- 0.53 0.53 Na2CO3 added (g) --- --- 28.62 28.62 NaNO3 added (g) --- --- 57.37 57.37 NaNO2 (g) --- --- 17.08 17.08

B.6
WT
P-R
PT
-184, Rev. 0
Table B.5. Boehmite Simulant Revision Testing Conditions (Set 1)
BCT2-
1 BCT2-
2 BCT2-
3 BCT2-
4 BCT2-
5 BCT2-
6 BCT2-
7 BCT2-
8 BCT2-9 BCT2-
10 OH- conc. (M) 3 3 5 5 7 7 5 3 5 7 Leach Temp (°C) 98.3 98.7 98.8 98.7 99.8 101.4 98.4 98.1 97.4 98.3 Density (g/mL) 1.12 1.12 1.19 1.19 1.30 1.30 1.19 1.12 1.19 1.30 Type of Boehmite Used
AOH-60
PNNL G-250
AOH-60
PNNL G-250
AOH-60
PNNL G-250
AOH-20
PNNL C31C
PNNL C31C
PNNL C31C
Boehmite added (g) 8.01 8.00 8.00 8.00 8.01 8.00 8.01 8.00 8.00 8.00 Caustic soln added (g) 802.01 802.01 802.02 802.00 802.02 802.00 802.00 802.02 802.01 802.01
Table B.6. Boehmite Simulant Revision Testing Conditions (Set 2)
BCT3-
1 BCT3-
2 BCT3-
3 BCT3-
4 BCT3-
5 BCT3-
6 OH- conc. (M) 3 3 5 5 7 7 Leach Temp (°C) 98.2 99.1 99.1 99.1 97.8 99.8 Density (g/mL) 1.12 1.12 1.19 1.19 1.30 1.30 Type of Boehmite Used AOH-
30 AOH-180E
AOH-30
AOH-180E
AOH-30
AOH-180E
Boehmite added (g) 8.00 8.00 8.00 8.00 8.00 8.00 Caustic soln added (g) 802.02 802.01 802.00 802.00 802.01 802.03

WTP-RPT-184, Rev. 0
Appendix C
Data from Solutions (CBM-1 through CBM-5)


C.1
WT
P-R
PT
-184, Rev. 0
Appendix C: Data from Solutions (CBM-1 through CBM-5)
Table C.1. Data from Solutions (CBM-1)
Sample ID
CBM-DW-FIL (mg/kg soln)
CBM-DW-FIL (mg/kg soln)
CBM-LE-R-0 (mg/kg soln)
CBM-LE-R-2 (mg/kg soln)
CBM-LE-R-4 (mg/kg soln)
CBM-LE-S-0 (mg/kg soln)
CBM-LE-S-2 (mg/kg soln)
CBM-LE-S-4 (mg/kg soln)
CBM-LE-S-6 (mg/kg soln)
CBM-LE-S-8 (mg/kg soln)
CBM-LE-S-10 (mg/kg soln)
CBM-LE-S-12 (mg/kg soln)
Time 0.00 6.00 7.20 9.18 11.20 12.55 14.55 16.55 18.55 20.45 22.53 24.53
Aluminum 3,600 3,600 2,990 8,420 9,960 10,200 10,600 10,800 11,300 12,000 12,600 12,800
Calcium <1.65 <1.65 <2.73 <1.99 <2.02 <2.47 <2.59 <2.25 <2.06 <2.03 <2.05 <2.13
Chromium 35.1 35.1 33.4 107 248 316 342 343 352 369 375 381
Iron <3.30 <3.30 13.7 16 14.6 15.1 17 10.7 12.3 15.1 14.1 16.1
Lead 1.3 1.3 9.84 16.2 27.2 36.9 36.9 34.1 36.4 38.3 37.3 37.2
Magnesium <1.65 <1.65 <2.73 <1.99 <2.02 <2.47 <2.59 <2.25 <2.06 <2.03 <2.05 <2.13
Manganese <0.165 <0.165 0.295 4.64 10.6 15.8 12.6 9.14 11 12 12.4 12.9
Neodymium <0.165 <0.165 <0.273 <0.199 <0.202 <0.247 <0.259 <0.225 <0.206 <0.203 <0.205 <0.213
Nickel <0.165 <0.165 <0.273 <0.199 <0.202 <0.247 <0.259 <0.225 <0.206 <0.203 <0.205 <0.213
Potassium 1,690 1,690 739 738 741 745 730 722 744 772 740 743
Sodium 87,300 87,300 108,000 106,000 107,000 107,000 107,000 105,000 105,000 108,000 105,000 106,000
Zirconium 0.802 0.802 5.99 8.46 8.2 7.66 6.44 5.97 5.64 5.9 5.47 5.46
Nitrate 22,800 22,800 8,120 8,270 8,240 8,200 8,340 8,240 8,350 8,620 8,190 8,180
Nitrite 6,920 6,920 2,390 2,400 2,430 2,400 2,440 2,420 2,450 2,510 2,420 2,390
Oxalate 991 991 403 526 702 854 785 808 837 839 846 840
Phosphate 339 339 <110 84.5 92.3 <100 <105 <94.9 <86.5 <85.9 <82.9 <85.9
Sulfate 882 882 306 295 287 289 311 305 338 316 310 303
< is below quantifiable limits.

C.2
WT
P-R
PT
-184, Rev. 0
Table C.1 (Contd)
Sample ID CBM-LE-C-2 (mg/kg soln)
CBM-LE-C-4 (mg/kg soln)
CBM-LE-C-6 (mg/kg soln)
CBM-LE-C-8 (mg/kg soln)
CBM-LE-C-10 (mg/kg soln)
CBM-LE-C-12 (mg/kg soln)
CBM-LC-FIL (mg/kg soln)
Time (hrs) 26.53 28.53 30.53 32.53 34.53 36.63 44.67
Aluminum 10,600 13,200 13,100 13,200 13,400 13,300 13,300
Calcium <2.59 <2.10 <2.00 <1.89 <1.91 2.93 <1.39
Chromium 342 396 391 391 399 397 638
Iron 17 12.6 10.6 8.84 9.09 6.84 9.08
Lead 36.9 29.1 24.9 21.7 18.9 16 13.4
Magnesium <2.59 <2.10 <2.00 <1.89 <1.91 <2.12 <1.39
Manganese 12.6 10.6 8.78 7.21 5.81 4.16 0.796
Neodymium <0.259 <0.210 <0.200 <0.189 <0.191 <0.212 <0.139
Nickel <0.259 <0.210 <0.200 <0.189 <0.191 <0.212 <0.139
Potassium 730 736 733 739 747 732 791
Sodium 107,000 107,000 105,000 106,000 107,000 107,000 106,000
Zirconium 6.44 4.63 4.28 3.89 3.7 3.39 3.88
Nitrate 8,270 8,240 8,240 8,230 8,330 8,250 8,290
Nitrite 2,440 2,430 2,400 2,420 2,440 2,410 2,740
Oxalate 727 731 591 578 459 465 376
Phosphate <84 <85.2 83.8 <77.2 <76.9 <86.8 102
Sulfate 306 310 499 302 302 303 329
< is below quantifiable limits.

C.3
WT
P-R
PT
-184, Rev. 0
Table C.1 (Contd)
Sample ID
CBM-W1-FIL (mg/kg soln)
CBM-W2-FIL (mg/kg soln)
CBM-W3-FIL (mg/kg soln)
CBM-W4-FIL (mg/kg soln)
CBM-W5-FIL (mg/kg soln)
CBM-W6-FIL (mg/kg soln)
CBM-OL-05 (mg/kg soln)
CBM-OL-1
(mg/kg soln)
CBM-OL-2
(mg/kg soln)
CBM-OL-4
(mg/kg soln)
CBM-OL-6
(mg/kg soln)
Time (hrs) 46.22 50.58 55.55 57.45 59.33 60.13 65.25 65.75 66.75 68.75 70.75
Aluminum 6,760 1,690 779 423 225 117 187 190 197 204 214
Calcium <1.14 <1.21 <1.27 <1.39 <1.38 <1.35 <2.81 <2.40 <2.65 <2.96 <2.30
Chromium 352 99.8 46.7 27.2 16.7 10.7 250 255 268 277 281
Iron 4.04 <2.43 <2.54 <2.78 <2.75 <2.69 <5.62 <4.81 <5.29 <5.93 <4.61
Lead 3.33 0.541 0.138 <0.139 <0.138 <0.135 0.363 0.446 0.348 0.319 0.242
Magnesium <1.14 <1.21 <1.27 <1.39 <1.38 <1.35 <2.81 <2.40 <2.65 <2.96 <2.30
Manganese 0.158 <0.121 <0.127 <0.139 <0.138 <0.135 332 299 249 171 123
Neodymium <0.114 <0.121 <0.127 <0.139 <0.138 <0.135 <0.281 <0.240 <0.265 <0.296 <0.230
Nickel <0.114 <0.121 <0.127 <0.139 <0.138 <0.135 <0.281 <0.240 <0.265 <0.296 <0.230
Potassium 404 111 52.6 26.2 14.2 <8.08 715 706 711 706 704
Sodium 67,900 32,000 20,900 11,600 5,940 2,930 4,180 3,780 3,710 3,800 5,420
Zirconium 1.47 0.291 <0.127 <0.139 <0.138 <0.135 <0.281 <0.240 <0.265 <0.296 <0.230
Nitrate 4320 862 382 200 118 67.3 131 115 123 129 114
Nitrite 1250 274 134 81.2 56.9 <53.9 <114 <96.2 <106 <119 <92.2
Oxalate 1,140 4,100 8,000 4,750 2,360 1,020 1,150 1,100 1,110 1,160 1,150
Phosphate <48.3 <49.9 <51.7 <56.3 <55.3 <53.9 <114 <96.2 <106 <119 <92.2
Sulfate 159 <49.9 <51.7 <56.3 <55.3 <53.9 <114 <96.2 <106 <119 <92.2
< is below quantifiable limits.

C.4
WT
P-R
PT
-184, Rev. 0
Table C.2. Data from Solutions (CBM-2)
Sample ID
CBM25-DW-FIL (mg/kg soln)
CBM25-DW-FIL (mg/kg soln)
CBM25-LE-R-0 (mg/kg soln)
CBM25-LE-R-2 (mg/kg soln)
CBM25-LE-R-4 (mg/kg soln)
CBM25-LE-S-0 (mg/kg soln)
CBM25-LE-S-2 (mg/kg soln)
CBM25-LE-S-4 (mg/kg soln)
CBM25-LE-S-6 (mg/kg soln)
CBM25-LE-S-8 (mg/kg soln)
CBM25-LE-S-10 (mg/kg soln)
CBM25-LE-S-12 (mg/kg soln)
Time (hrs) 0.00 0.00 18.77 21.02 26.27 27.67 29.60 31.60 33.60 35.60 37.60 39.60
Aluminum 2,470 2,470 2,990 3,780 10,900 11,000 11,300 11,500 11,700 11,900 13,200 12,900
Calcium <1.26 <1.26 <1.77 <1.73 <1.96 2.17 2.5 2.15 2.19 1.97 2.13 1.8
Chromium 19 19 26.1 37.8 235 328 354 363 373 380 399 399
Iron <1.26 <1.26 13 11.7 14.6 18 16.9 14.7 13.8 14.1 13.9 11.4
Lead 0.38 0.38 7.74 7.66 26.1 41 46.2 41.7 36.4 36.3 38.8 32.1
Magnesium <1.26 <1.26 <1.77 <1.73 <1.96 <1.71 <1.76 <1.52 <1.38 <1.65 <1.71 <1.49
Manganese <0.126 <0.126 <0.177 0.214 12.5 18 15.3 12.8 12.1 11.7 11.5 9.96
Nickel <0.126 <0.126 <0.177 <0.173 <0.196 <0.171 <0.176 <0.152 <0.138 <0.165 <0.171 <0.149
Potassium 1,710 1,710 634 621 634 630 678 629 635 668 654 623
Sodium 82,300 82,300 103,000 103,000 103,000 106,000 102,000 104,000 102,000 103,000 105,000 104,000
Zirconium 0.477 0.477 6.33 6.4 10.2 9.63 8.44 7.41 6.83 6.47 6.55 5.93
Nitrate 25,700 25,700 7,750 7,790 7,750 7,710 7,700 7,840 7,790 7,750 7,790 7,900
Nitrite 7,580 7,580 2,460 2,470 2,460 2,440 2,460 2,440 2,410 2,400 2,450 2,460
Oxalate 718 718 292 291 633 836 928 814 697 688 777 627
Phosphate 412 412 134 129 129 127 126 128 128 116 114 118
Sulfate 932 932 297 305 303 299 299 320 303 301 314 313
< is below quantifiable limits.

C.5
WT
P-R
PT
-184, Rev. 0
Table C.2 (Contd)
Sample ID
CBM25-LE-C-0
(mg/kg soln)
CBM25-LE-C-2
(mg/kg soln)
CBM25-LE-C-4
(mg/kg soln)
CBM25-LE-C-6
(mg/kg soln)
CBM25-LE-C-8
(mg/kg soln)
CBM25-LE-C-10
(mg/kg soln)
CBM25-LE-C12
(mg/kg soln)
CBM25-LC-FIL
(mg/kg soln)
Time (hrs) 39.77 41.77 43.77 45.77 47.77 49.82 51.77 64.37
Aluminum 13,400 13,300 13,300 12,800 13,100 13,100 13,700 12,600
Calcium 1.7 1.66 <1.62 <1.69 <1.76 <1.79 <2.01 <1.28
Chromium 398 403 409 395 398 402 404 486
Iron 10.7 10.9 10.2 8.03 8.48 7.42 7.15 5.45
Lead 32.5 33.5 24.2 23.5 21 17.7 15.4 5.22
Magnesium <1.58 <1.61 <1.62 <1.69 <1.76 <1.79 <2.01 <1.28
Manganese 9.8 8.09 7.28 6.22 5.71 4.21 3.13 0.224
Nickel <0.158 <0.161 <0.162 <0.169 <0.176 <0.179 <0.201 <0.128
Potassium 631 648 631 597 593 612 608 585
Sodium 105,000 102,000 102,000 96,700 97,600 98,500 102,000 97,600
Zirconium 5.93 5.67 4.94 4.43 4.21 3.86 3.69 2.68
Nitrate 7,780 7,790 7,730 7,540 7,400 7,340 7,320 7,650
Nitrite 2,470 2,460 2,410 2,400 2,360 2,320 2,330 2,370
Oxalate 655 613 510 514 511 472 407 295
Phosphate 112 121 110 107 101 102 100 115
Sulfate 299 313 300 299 290 294 286 295
< is below quantifiable limits.

C.6
WT
P-R
PT
-184, Rev. 0
Table C.2 (Contd)
Sample ID
CBM25-W1-FIL (mg/kg soln)
CBM25-W2-FIL (mg/kg soln)
CBM25-W3-FIL (mg/kg soln)
CBM-W4-FIL
(mg/kg soln)
CBM-W5-FIL(mg/kg soln)
CBM-W6-FIL(mg/kg soln)
CBM-OL-05 (mg/kg soln)
CBM-OL-1
(mg/kg soln)
CBM-OL-2
(mg/kg soln)
CBM-OL-4
(mg/kg soln)
CBM-OL-6
(mg/kg soln)
CBM25-W3-OL
(CBM25-WS-SUP)
(mg/kg soln)
CBM-FSC-FIL
(mg/kg soln)
Time (hrs) 68.58 71.60 72.85 74.35 76.57 77.08 80.27 80.77 81.77 83.77 85.77 92.68 95.57
Aluminum 6,430 3,060 1,810 746 329 150 172 171 176 176 180 191 29.5
Calcium <1.21 <1.19 <1.30 <1.56 <1.58 <1.53 <2.11 <2.09 <2.15 <2.15 <1.88 <1.39 <1.32
Chromium 287 154 91.5 42.9 23.9 12 387 397 415 419 425 142 47.1
Iron 2.88 1.2 <1.30 <1.56 <1.58 <1.53 <2.11 <2.09 <2.15 <2.15 <1.88 1.86 8.73
Lead 1.48 0.372 0.137 <0.156 <0.158 <0.153 0.503 0.619 0.508 0.461 0.457 <0.139 0.395
Magnesium <1.21 <1.19 <1.30 <1.56 <1.58 <1.53 <2.11 <2.09 <2.15 <2.15 <1.88 <1.39 <1.32
Manganese <0.121 <0.119 <0.130 <0.156 <0.158 <0.153 289 253 212 159 124 0.359 1.8
Nickel <0.121 <0.119 <0.130 <0.156 <0.158 <0.153 <0.211 <0.209 <0.215 <0.215 <0.188 <0.139 0.279
Potassium 326 148 88.6 47.4 19.5 14.9 23 30.7 18.9 22 22.5 14.3 <7.94
Sodium 67,100 39,300 25,600 15,400 7,350 3,510 4,760 4,750 4,820 4,720 4,730 3,910 612
Zirconium 1.27 0.456 0.304 <0.156 <0.158 <0.153 <0.211 <0.209 <0.215 <0.215 <0.188 <0.139 <0.132
Nitrate 87 1,740 917 369 171 84.8 100 102 101 98.2 97.7 89.8 20.6
Nitrite 40.8 514 278 122 63.7 36.9 39.4 40.2 42.1 44.2 45.4 38.5 16.8
Oxalate <40.0 3,010 5,710 9,490 4,360 <30.7 1,900 1,920 1,920 1,880 1,900 2,050 <27.6
Phosphate <40.0 <24.7 <26.6 <31.3 <31.9 <30.7 <42.3 <43.0 <43.0 <44.3 <42.5 <28.0 <27.6
Sulfate 1,370 68.2 37 <31.3 <31.9 1,480 <42.3 <43.0 <43.0 <44.3 <42.5 <28.0 60.3
< is below quantifiable limits.

C.7
WT
P-R
PT
-184, Rev. 0
Table C.3. Data from Solutions (CBM-3)
Sample ID
CBM3-DW-FIL
(mg/L soln)
CBM3-LE-R-0 (mg/kg soln)
CBM3-LE-R-2 (mg/kg soln)
CBM3-LE-R-4 (mg/kg soln)
CBM3-LE-S-0 (mg/kg soln)
CBM3-LE-S-2 (mg/kg soln)
CBM3-LE-S-4 (mg/kg soln)
CBM3-LE-S-6 (mg/kg soln)
CBM3-LE-S-8 (mg/kg soln)
CBM3-LE-S-10 (mg/kg soln)
CBM3-LE-S-12 (mg/kg soln)
CBM3-LE-C-0 (mg/kg soln)
Time 0.00 1.33 3.33 5.33 6.67 8.67 10.67 12.67 14.67 16.67 18.67 18.75
Aluminum 145 1,729 6,170 6,880 7,170 7,890 8,400 9,420 9,610 10,100 10,700 11,000
Calcium <0.22 NA NA NA NA NA NA NA NA NA 5.43
Chromium 0.38 3.50 8.13 13.20 16.20 18.10 18.80 19.80 20.00 20.30 21.00 20.50
Iron <0.05 25.0 34.2 37.1 43.5 39.8 64.4 28.8 29.6 35.5 34.4 33.4
Lead <0.39 NA NA NA NA NA NA NA NA NA NA 63.5
Magnesium NA NA NA NA NA NA NA NA NA NA NA <1.23
Manganese <0.005 <0.14 0.52 2.13 4.69 4.99 10.8 3.23 3.36 4.58 4.11 4.23
Nickel NA NA NA NA NA NA NA NA NA NA NA <0.123
Potassium 97.9 NA NA NA NA NA NA NA NA NA NA 577
Sodium 5,300 144,000 142,000 144,000 145,000 143,000 139,000 142,000 141,000 143,000 142,000 125,000
Zirconium <0.02 NA NA NA NA NA NA NA NA NA NA 10.8
Nitrate 24,100 NA NA NA NA NA NA NA NA NA NA NA
Nitrite 7,560 NA NA NA NA NA NA NA NA NA NA NA
Oxalate 795 NA NA NA NA NA NA NA NA NA NA NA
Phosphate 439 NA NA NA NA NA NA NA NA NA NA NA
Sulfate 889 NA NA NA NA NA NA NA NA NA NA NA < is below quantifiable limits. NA = not analyzed

C.8
WT
P-R
PT
-184, Rev. 0
Table C.3 (Contd)
Sample ID
CBM3-LE-C-2 (mg/kg soln)
CBM3-LE-C-4 (mg/kg soln)
CBM3-LE-C-6 (mg/kg soln)
CBM3-LE-C-8 (mg/kg soln)
CBM3-LE-C-10 (mg/kg soln)
CBM3-LE-C-12 (mg/kg soln)
CBM3-LC-FIL (mg/L soln)
CBM3-W-1
(mg/kg soln)
CBM3-W-2
(mg/kg soln)
CBM3-W-3
(mg/kg soln)
CBM3-W-4
(mg/kg soln)
CBM3-W-5
(mg/kg soln)
Time 20.75 22.75 24.75 26.75 28.75 30.75 58.25 60.27 61.10 61.88 62.67 63.15
Aluminum 11,100 11,200 11,300 11,100 11,300 11,200 702 7,950 6,110 4,000 2,790 1,900
Calcium 4.93 4.28 3.88 3.24 2.92 2.93 <0.21 <1.03 <2.61 <1.34 <1.62 <1.15
Chromium 20.9 20.9 21.1 21.0 21.1 20.8 1.31 NA NA NA NA NA
Iron 29.2 25.0 23.6 20.8 18.5 16.8 <0.06 5.82 2.93 2.14 <1.62 <1.15
Lead 62.1 54.9 52.8 45.5 44.4 41.3 <2.7 9.19 3.67 1.18 0.54 0.16
Magnesium <1.21 <1.21 <1.16 <1.22 <1.18 <1.16 NA <1.03 <2.61 <1.34 <1.62 <1.15
Manganese 3.69 2.75 2.69 2.03 1.83 1.60 <0.02 <0.103 <0.261 <0.134 <0.162 <0.115
Nickel <0.121 <0.121 <0.116 <0.122 <0.118 <0.116 NA <0.103 <0.261 <0.134 <0.162 <0.115
Potassium 586 579 568 570 593 581 34.4 504 338 227 152 105
Sodium 126,000 124,000 127,000 126,000 126,000 126,000 7,930 89,800 69,500 45.400 31,900 24,400
Zirconium 10.80 9.80 9.30 8.58 8.28 7.96 NA 3.29 1.76 0.81 0.36 0.21
Nitrate NA NA NA NA NA NA 4,540 3,720 2,790 1,950 1,300 895
Nitrite NA NA NA NA NA NA 1,570 1,270 837 598 392 268
Oxalate NA NA NA NA NA NA 136 448 982 2,010 3,290 6,060
Phosphate NA NA NA NA NA NA 102 79.4 54.8 36.6 25.0 16.5
Sulfate NA NA NA NA NA NA 185 153 101 72.4 51.6 32.4 < is below quantifiable limits. NA= not analyzed.

C.9
WT
P-R
PT
-184, Rev. 0
Table C.3 (Cont)
Sample ID
CBM3-W-6
(mg/kg soln)
CBM3-W-7
(mg/kg soln)
CBM3-W-8
(mg/kg soln)
CBM3-W-9
(mg/kg soln)
CBM3-W-10
(mg/kg soln)
CBM3-W-11
(mg/kg soln)
CBM3-W-12
(mg/kg soln)
CBM3-W-13
(mg/kg soln)
CBM3-W-14
(mg/kg soln)
CBM3-W-15
(mg/kg soln)
CBM3-W-16
(mg/kg soln)
CBM3-OL-05 (mg/kg soln)
Time 63.65 64.15 64.63 65.12 65.57 66.00 66.40 66.87 67.30 67.87 68.33 76.17
Aluminum 1,220 823 541 371 253 177 122 87 61 45 33 44
Calcium <1.88 <1.72 <1.51 <1.55 <1.38 <1.52 <1.54 <1.59 <1.62 <1.5 <1.21 1.87
Chromium NA NA NA NA NA NA NA NA NA NA NA NA
Iron <1.88 2.05 <1.51 <1.55 <1.38 <1.52 <1.54 <1.59 <1.62 <1.5 <1.21 1.87
Lead 0.19 <0.172 <0.151 <0.155 <0.138 <0.152 <0.154 <0.159 <0.162 <0.15 <0.121 0.20
Magnesium <1.88 <1.72 <1.51 <1.55 <1.38 <1.52 <1.54 <1.59 <1.62 <1.5 <1.21 2.04
Manganese <0.188 <0.172 <0.151 <0.155 <0.138 <0.152 <0.154 <0.159 <0.162 <0.15 <0.121 3,470
Nickel <0.188 <0.172 <0.151 <0.155 <0.138 <0.152 <0.154 <0.159 <0.162 <0.15 <0.121 0.20
Potassium 63.4 40.6 30.7 20.4 14.6 <9.1 <9.21 <9.56 <9.72 <8.97 <7.28 49
Sodium 17,600 14,800 12,600 10,200 7,020 5,250 3,630 2,520 1,800 1,340 1,020 10,000
Zirconium <0.188 <0.172 <0.151 <0.155 <0.138 <0.152 <0.154 <0.159 <0.162 <0.15 <0.121 0.20
Nitrate 530 351 225 157 104 73.1 52.7 39.5 30.9 24.3 17.7 679
Nitrite 167 114 76.3 54.7 38.1 29.5 23.3 19.1 16.8 <15 <12.1 <11.4
Oxalate 8,640 11,900 14,800 13,100 8,520 5,980 3,930 2,560 1,660 1,110 720 151
Phosphate <19 <17.4 <15.2 <15.7 <13.9 <15.2 <15.4 <16 <16.2 <15 <12.1 <11.4
Sulfate 23.5 <17.4 <15.2 <15.7 <13.9 <15.2 <15.4 <16 <16.2 <15 <12.1 97.7 < is below quantifiable limits. NA= not analyzed.

C.10
WT
P-R
PT
-184, Rev. 0
Table C.3 (Contd)
Sample ID
CBM3-OL-1
(mg/kg soln)
CBM3-OL-2
(mg/kg soln)
CBM3-OL-4
(mg/kg soln)
CBM3-OL-6
(mg/kg soln)
CBM3-OL-FIL (mg/kg soln)
CBM3-OW-1 (mg/kg soln)
CBM3-OW-2 (mg/kg soln)
CBM3-OW-3 (mg/kg soln)
CBM3-OW-4 (mg/kg soln)
CBM3-OW-5 (mg/kg soln)
CBM3-OW-6 (mg/kg soln)
CBM3-OW-7 (mg/kg soln)
Time 77.13 78.05 79.67 81.67 82.05 83.2 83.37 83.53 83.68 83.83 84.00 84.18
Aluminum 24 30 44 39 77 46.3 36.6 29.3 23.7 19.7 16.4 15.4
Calcium 3.77 3.08 <1.87 6.80 2.75 2.64 2.36 2.50 2.04 1.88 2.43 2.12
Chromium 3,950 4,090 5,150 4,210 3,940 4,110 3,220 2,480 1,900 1,480 1,140 855
Iron 2.00 <1.99 4.88 4.20 4.12 2.31 <1.59 1.88 <1.59 <1.17 <1.88 <1.73
Lead <0.189 <0.199 <0.204 <0.223 <0.127 <0.116 <0.159 <0.153 <0.159 <0.117 <0.188 <0.173
Magnesium <1.89 <1.99 <2.04 <2.23 <1.27 1.86 1.59 <1.53 <1.59 <1.17 <1.88 <1.73
Manganese 3,410 3,090 3,470 2,720 2,650 <0.116 <0.159 <0.153 <0.159 <0.117 <0.188 <0.173
Nickel <0.189 <0.199 <0.204 <0.223 <0.127 <0.116 <0.159 <0.153 <0.159 <0.117 <0.188 <0.173
Potassium 55.7 42.8 49.0 35.7 33.6 15.3 10.4 <9.16 <9.55 <7.01 <11.3 <10.4
Sodium 8,060 8,130 10,000 8,170 7,860 5,780 4,670 3,700 2,940 2,340 1,840 1,480
Zirconium <0.189 <0.199 <0.204 <0.204 0.20 <0.116 <0.144 <0.143 <0.159 <0.117 <0.178 <0.173
Nitrate 699 697 884 711 668 558 413 321 246 189 149 115
Nitrite <11.4 <12 <12.4 <13.5 <13 13.4 <16 <15.4 <16 <11.7 <18.9 <17.3
Oxalate 148 148 193 165 137 96.8 78.6 63.1 50.8 38.4 33.5 27.1
Phosphate <11.4 <12 <12.4 <13.5 <13 <11.7 <16 <15.4 <16 <11.7 <18.9 <17.3
Sulfate 84.4 80.7 94.6 76.3 75.4 43.5 32.8 26.5 21.1 16.7 <18.9 <17.3
< is below quantifiable limits.

C.11
WT
P-R
PT
-184, Rev. 0
Table C.3 (Contd)
Sample ID
CBM3-OW-8 (mg/kg soln)
CBM3-OW-9 (mg/kg soln)
CBM3-OW-10 (mg/kg soln)
CBM3-OW-11 (mg/kg soln)
CBM3-OW-12 (mg/kg soln)
CBM3-OW-13 (mg/kg soln)
CBM-FSC-FIL(mg/kg soln)
Time 84.38 84.60 84.80 85.02 85.25 85.52 86.10
Aluminum 10.9 10.5 9.03 7.34 9.31 6.26 8.0
Calcium <1.6 1.65 <1.87 <1.49 <1.67 <1.26 <1.54
Chromium 719 503 375 287 222 170 170
Iron <1.6 <1.26 <1.87 <1.49 <1.67 <1.26 <1.54
Lead <0.16 <0.126 <0.187 <0.149 <0.167 <0.126 <0.154
Magnesium <1.6 <1.26 <1.87 <1.49 <1.67 <1.26 <1.54
Manganese <0.16 <0.126 <0.187 <0.149 <0.167 <0.126 <0.154
Nickel <0.16 <0.126 <0.187 <0.149 <0.167 <0.126 <0.154
Potassium <9.57 <7.57 <11.2 <8.95 <10 <7.53 <9.23
Sodium 1,250 1,030 849 724 634 560 534
Zirconium <0.16 <0.126 <0.187 <0.149 <0.167 <0.126 <0.154
Nitrate 92.1 68.9 59.0 44.7 39.2 29.5 30.1
Nitrite <16 <12.6 <18.7 <15 <16.7 <12.6 <15
Oxalate 23.0 <12.6 <18.7 <15 <16.7 <12.6 <15
Phosphate <16 <12.6 <18.7 <15 <16.7 <12.6 <15
Sulfate <16 <12.6 <18.7 <15 <16.7 <12.6 <15
< is below quantifiable limits.

C.12
WT
P-R
PT
-184, Rev. 0
Table C.4. Data from Solutions (CBM-4)
Sample ID
CBM4-DW-FIL (mg/kg soln)
CBM4-LE-R-0 (mg/kg soln)
CBM4-LE-R-2 (mg/kg soln)
CBM4-LE-R-4 (mg/kg soln)
CBM4-LE-S-0 (mg/kg soln)
CBM4-LE-S-2 (mg/kg soln)
CBM4-LE-S-4 (mg/kg soln)
CBM4-LE-S-6 (mg/kg soln)
CBM4-LE-S-8 (mg/kg soln)
CBM4-LE-S-10 (mg/kg soln)
CBM4-LE-S-12 (mg/kg soln)
CBM4-LE-C-0 (mg/kg soln)
Time 0.00 14.38 16.47 18.97 19.87 21.87 23.87 25.90 27.87 29.87 31.87 31.87
Aluminum 3,100 2,920 5,540 6,760 6,930 7,690 8,220 8,870 9,550 10,100 10,500 10,500
Calcium <2.14 NA NA NA NA NA NA NA NA NA NA NA
Chromium 0.966 0.60 0.85 1.54 1.63 1.92 1.96 2.06 2.06 2.25 2.24 2.24
Iron 2.14 23.6 26.6 35.8 33.3 33.1 31.2 27.1 30.3 30.9 28.4 28.4
Lead 1.50 NA NA NA NA NA NA NA NA NA NA NA
Magnesium <2.14 NA NA NA NA NA NA NA NA NA NA NA
Manganese <0.107 <0.13 <0.129 <0.131 <0.139 0.28 0.57 0.497 0.593 0.48 0.352 0.352
Nickel <0.107 NA NA NA NA NA NA NA NA NA NA NA
Potassium 375 NA NA NA NA NA NA NA NA NA NA NA
Sodium 96,900 145,000 142,000 143,000 141,000 144,000 142,000 142,000 142,000 144,000 142,000 142,000
Zirconium 0.00 NA NA NA NA NA NA NA NA NA NA NA
Nitrate 16,500 NA NA NA NA NA NA NA NA NA NA NA
Nitrite 4,820 NA NA NA NA NA NA NA NA NA NA NA
Oxalate 3,270 NA NA NA NA NA NA NA NA NA NA NA
Phosphate 1,590 NA NA NA NA NA NA NA NA NA NA NA
Sulfate 13,000 NA NA NA NA NA NA NA NA NA NA NA < is below quantifiable limits. NA= not analyzed.
C.13
WT
P-R
PT
-184, Rev. 0
Table C.4 (Contd)
Sample ID
CBM4-LE-C-2 (mg/kg soln)
CBM4-LE-C-4 (mg/kg soln)
CBM4-LE-C-6 (mg/kg soln)
CBM4-LE-C-8 (mg/kg soln)
CBM4-LE-C-10 (mg/kg soln)
CBM4-LE-C-12 (mg/kg soln)
CBM4-LC-FIL (mg/kg soln)
CBM4-W-1
(mg/kg soln)
CBM4-W-2
(mg/kg soln)
CBM4-W-3
(mg/kg soln)
CBM4-W-4
(mg/kg soln)
CBM4-W-5
(mg/kg soln)
Time 33.93 35.93 37.93 39.93 41.93 43.97 60.72 61.70 62.32 62.85 63.37 63.75
Aluminum 11,000 11,000 10,900 11,000 11,100 11,000 11,600 8,940 7,140 5,410 4,130 2,980
Calcium 1.78 1.97 1.79 1.91 1.32 1.40 <2.3 <1.12 M1.49 <1.42 <1.41 <1.63
Chromium 2.33 2.32 2.36 2.39 2.32 2.31 2.50 1.94 1.45 1.11 0.913 0.691
Iron 24.8 24.1 21.4 20.4 16.8 15.2 12.8 5.02 7.93 <1.42 <1.41 2.40
Lead 55.6 52.4 48.0 48.2 43.4 40.0 24.7 11.7 4.22 1.95 0.874 0.358
Magnesium <1.19 <1.27 <1.25 <1.16 <1.17 <1.14 <2.3 <1.12 <1.49 <1.42 <1.41 <1.63
Manganese 0.269 0.248 0.194 0.157 <0.117 0.131 <0.115 <0.112 <0.149 <0.142 <0.141 <0.163
Nickel <0.119 <0.127 <0.125 <0.116 <0.117 <0.114 <0.115 <0.112 <0.149 <0.142 <0.141 <0.163
Potassium 189 178 183 186 171 180 233 169 133 96.5 74.7 50.1
Sodium 126,000 124,000 124,000 126,000 126,000 126,000 142,000 95,100 73,300 55,500 42,700 33,300
Zirconium 11.5 10.8 10.1 9.83 9.36 8.95 NA 5.93 3.63 1.95 0.978 0.578
Nitrate NA NA NA NA NA NA 4,070 3,660 2,610 1,990 1,470 1,040
Nitrite NA NA NA NA NA NA 1,450 1,310 829 621 453 321
Oxalate NA NA NA NA NA NA 122 338 755 1,420 2,460 3,870
Phosphate NA NA NA NA NA NA 385 358 233 176 130 90.9
Sulfate NA NA NA NA NA NA 3,350 3,160 2,030 1,540 1,140 836 < is below quantifiable limits. NA= not analyzed.

C.14
WT
P-R
PT
-184, Rev. 0
Table C.4 (Cont)
Sample ID
CBM4-W-6
(mg/kg soln)
CBM4-W-7
(mg/kg soln)
CBM4-W-8
(mg/kg soln)
CBM4-W-9
(mg/kg soln)
CBM4-W-10
(mg/kg soln)
CBM4-W-11
(mg/kg soln)
CBM4-W-12
(mg/kg soln)
CBM4-W-13
(mg/kg soln)
CBM4-W-14
(mg/kg soln)
CBM4-W-15
(mg/kg soln)
CBM4-W-16
(mg/kg soln)
CBM4-OL-05 (mg/kg soln)
Time 64.08 64.40 64.72 64.98 65.30 65.62 65.95 66.22 66.47 66.70 67.00 73.80
Aluminum 2,160 1,530 1,130 809 577 411 299 220 158 116 85.7 24.7
Calcium <2.06 <1.5 <1.77 1.82 <1.86 <1.66 <1.75 <1.72 <1.77 <1.49 <1.8 3.77
Chromium 0.432 0.418 0.329 0.238 <0.186 <0.166 <0.175 <0.172 <0.177 <0.149 <0.18 5,710
Iron <2.06 <1.5 <1.77 <1.57 3.82 <1.66 <1.75 <1.72 <1.77 <1.49 <1.8 4.59
Lead <0.206 <0.15 <0.177 <0.157 <0.186 <0.166 <0.175 <0.172 <0.177 <0.149 <0.18 <0.269
Magnesium <2.06 <1.5 <1.77 <1.57 <1.86 <1.66 <1.75 <1.72 <1.77 <1.49 <1.8 <2.69
Manganese <0.206 <0.15 <0.177 <0.157 <0.186 <0.166 <0.175 <0.172 <0.177 <0.149 <0.18 1,610
Nickel <0.206 <0.15 <0.177 <0.157 <0.186 <0.166 <0.175 <0.172 <0.177 <0.149 <0.18 <0.269
Potassium 36.8 29.4 19.0 14.3 14.2 <9.97 <10.5 <10.3 <10.6 <8.92 <10.8 49.9
Sodium 25,300 19,900 16,700 14,700 13,200 10,300 8,680 6,210 4,490 3,410 2,520 7,690
Zirconium 0.268 <0.15 <0.177 0.184 <0.187 <0.167 <0.176 <0.17 <0.178 <0.142 <0.168 <0.269
Nitrate 735 528 378 264 196 138 109 82.3 61.8 46.9 39.9 564
Nitrite 233 169 126 89.6 69.7 50.7 41.7 33.7 27.4 21.2 20.6 <16.2
Oxalate 6,040 8,380 10,800 13,600 15,800 12,600 9,670 6,680 5,060 3,270 2,480 376
Phosphate 66.1 49.5 36.7 25.6 19.8 <16.8 17.6 <17.3 <17.8 <14.9 <18.1 <16.2
Sulfate 607 430 317 218 160 112 87.1 64.4 46.8 34.5 25.1 126
< is below quantifiable limits.

C.15
WT
P-R
PT
-184, Rev. 0
Table C.4 (Contd)
Sample ID
CBM4-OL-1
(mg/kg soln)
CBM4-OL-2
(mg/kg soln)
CBM4-OL-4
(mg/kg soln)
CBM4-OL-6
(mg/kg soln)
CBM4-OL-FIL (mg/kg soln)
CBM4-OW-1 (mg/kg soln)
CBM4-OW-2 (mg/kg soln)
CBM4-OW-3 (mg/kg soln)
CBM4-OW-4 (mg/kg soln)
CBM4-OW-5 (mg/kg soln)
CBM4-OW-6 (mg/kg soln)
CBM4-OW-7 (mg/kg soln)
Time 74.30 75.30 77.30 79.30 79.30 80.43 80.57 80.75 80.87 80.97 81.08 81.25
Aluminum 54.6 41.2 32.4 12.1 12.1 40.3 37.4 39.5 34.0 31.3 29.4 30.9
Calcium 9.28 7.30 8.36 4.18 4.18 7.55 6.05 4.26 4.06 2.73 2.09 2.21
Chromium 5,990 5,880 6,160 5,900 5,900 4,540 3,430 2,360 1,750 1,250 864 582
Iron <4.53 4.14 4.81 5.08 5.08 2.1 1.86 <1.98 <1.81 <1.57 <1.56 <1.61
Lead <0.453 <0.304 <0.373 <0.235 <0.235 <0.204 <0.165 <0.198 <0.181 <0.157 <0.156 <0.161
Magnesium <4.53 <3.04 <3.73 <2.35 <2.35 <2.04 <1.65 <1.98 <1.81 <1.57 <1.56 <1.61
Manganese 1,710 1,740 1,320 607 607 <0.204 <0.165 <0.198 <0.181 <0.157 <0.156 <0.161
Nickel <0.453 <0.304 <0.373 <0.235 <0.235 <0.204 <0.165 <0.198 <0.181 <0.157 <0.156 <0.161
Potassium 44.4 42.9 46.1 46.0 46.0 28.4 21.9 19.4 13.6 <9.43 <9.38 <9.69
Sodium 8,070 7,960 8,290 7,810 7,810 5,740 4,140 3,030 2,080 1,590 1,090 767
Zirconium <0.453 <0.304 <0.373 <0.235 <0.235 <0.204 <0.165 <0.198 <0.181 <0.157 <0.156 <0.162
Nitrate 583 578 611 585 585 410 300 212 160 115 82.8 63.9
Nitrite <18.2 <18.3 <15 <14.2 <14.2 26.4 20.4 20.6 <18.2 <15.7 <15.7 <16.2
Oxalate 349 386 524 676 676 228 180 123 95.4 74.6 57.9 44.7
Phosphate <18.2 <18.3 <15 <14.2 <14.2 <20.5 <16.6 <19.9 <18.2 <15.7 <15.7 <16.2
Sulfate 137 131 136 129 129 85.4 63.9 46.9 34.9 21.6 18.6 <16.2
< is below quantifiable limits.

C.16
WT
P-R
PT
-184, Rev. 0
Table C.4 (Contd)
Sample ID
CBM4-OW-7 (mg/kg soln)
CBM4-OW-8 (mg/kg soln)
CBM4-OW-9 (mg/kg soln)
CBM4-OW-10 (mg/kg soln)
CBM4-OW-11 (mg/kg soln)
CBM4-OW-12 (mg/kg soln)
CBM4-OW-13 (mg/kg soln)
CBM4-FSC-FIL(mg/kg soln)
Time 81.25 81.63 81.90 82.18 82.50 82.88 83.28 86.97
Aluminum 30.9 21.0 16.2 15.9 10.3 9.13 7.71 12.4
Calcium 2.21 2.06 1.68 1.77 1.63 1.69 1.42 <3.92
Chromium 582 402 287 199 137 97.4 67.0 348
Iron <1.61 <1.7 <1.42 <1.77 <1.63 <1.69 <1.42 <3.92
Lead <0.161 <0.17 <0.142 <0.177 <0.163 <0.169 <0.142 <0.392
Magnesium <1.61 <1.7 <1.42 <1.77 <1.63 <1.69 <1.42 <3.92
Manganese <0.161 <0.17 <0.142 <0.177 <0.163 <0.169 <0.142 <0.392
Nickel <0.161 <0.17 <0.142 <0.177 <0.163 <0.169 <0.142 <0.392
Potassium <9.69 <10.2 <8.51 <10.6 <9.78 <10.1 9.18 <39.2
Sodium 767 647 715 578 477 408 356 780
Zirconium <0.162 <0.171 <0.142 <0.177 <0.164 <0.17 <0.142 NA
Nitrate 63.9 47.8 36.6 31.7 25.7 22.9 18.3 48.1
Nitrite <16.2 <17 <14.2 <17.7 <16.3 <16.9 <14.2 <19.6
Oxalate 44.7 33.9 26.0 24.5 <16.3 <16.9 <14.2 <31.6
Phosphate <16.2 <17 <14.2 <17.7 <16.3 <16.9 <14.2 <19.6
Sulfate <16.2 <17 <14.2 22.8 <16.3 <16.9 <14.2 <19.6 < is below quantifiable limits. NA= not analyzed.

C.17
WT
P-R
PT
-184, Rev. 0
Table C.5 (Contd)
Sample ID
CBM5-DW-FIL (mg/kg soln)
CBM5-LE-R-0 (mg/kg soln)
CBM5-LE-R-2 (mg/kg soln)
CBM5-LE-R-4 (mg/kg soln)
CBM5-LE-S-0 (mg/kg soln)
CBM5-LE-S-2 (mg/kg soln)
CBM5-LE-S-4 (mg/kg soln)
CBM5-LE-S-6 (mg/kg soln)
CBM5-LE-S-8 (mg/kg soln)
CBM5-LE-S-10 (mg/kg soln)
CBM5-LE-S-12 (mg/kg soln)
CBM5-LE-C-0 (mg/kg soln)
Time 0.00 3.28 5.23 7.27 8.53 10.53 12.53 14.53 16.53 18.53 20.53 20.53
Aluminum 3,130 2,900 6,340 6,800 6,920 7,860 8,320 9,130 9,670 10,400 10,900 10,900
Calcium <2.77 NA NA NA NA NA NA NA NA NA NA NA
Chromium 1.03 0.47 0.71 1.07 1.30 1.51 1.57 1.65 1.66 1.78 1.83 1.83
Iron <2.77 31.2 32.8 38.9 42.2 41.4 41.4 43.5 42.8 40.7 39.4 39.4
Lead <0.139 NA NA NA NA NA NA NA NA NA NA NA
Magnesium <2.77 NA NA NA NA NA NA NA NA NA NA NA
Manganese <0.139 <0.138 <0.129 0.21 0.98 1.78 1.57 1.43 1.28 1.01 0.887 0.887
Nickel <0.139 NA NA NA NA NA NA NA NA NA NA NA
Potassium 758 NA NA NA NA NA NA NA NA NA NA NA
Sodium 95,900 148,000 149,000 146,000 149,000 149,000 148,000 149,000 145,000 151,000 148,000 148,000
Zirconium NA NA NA NA NA NA NA NA NA NA NA NA
Nitrate 19,400 NA NA NA NA NA NA NA NA NA NA NA
Nitrite 5,710 NA NA NA NA NA NA NA NA NA NA NA
Oxalate 760 NA NA NA NA NA NA NA NA NA NA NA
Phosphate 1,880 NA NA NA NA NA NA NA NA NA NA NA
Sulfate 16,200 NA NA NA NA NA NA NA NA NA NA NA < is below quantifiable limits. NA= not analyzed,

C.18
WT
P-R
PT
-184, Rev. 0
Table C.5 (Contd)
Sample ID
CBM5-LE-C-2 (mg/kg soln)
CBM5-LE-C-4 (mg/kg soln)
CBM5-LE-C-6 (mg/kg soln)
CBM5-LE-C-8 (mg/kg soln)
CBM5-LE-C-10 (mg/kg soln)
CBM5-LE-C-12 (mg/kg soln)
CBM5-LC-FIL (mg/kg soln)
CBM5-W-1
(mg/kg soln)
CBM5-W-2
(mg/kg soln)
CBM5-W-3
(mg/kg soln)
CBM5-W-4
(mg/kg soln)
CBM5-W-5
(mg/kg soln)
Time 22.53 24.53 26.53 28.18 30.18 32.18 50.52 51.72 52.58 53.28 53.85 54.42
Aluminum 11,200 11,300 11,500 11,100 11,000 10,900 11,500 6,320 4,280 2,850 1,830 1,200
Calcium 3.38 3.13 2.48 2.21 2.02 1.75 <2.64 <1.23 <1.58 <1.55 <1.6 <1.41
Chromium 1.87 1.92 1.90 1.91 1.83 1.89 1.88 1.48 0.944 0.659 0.482 0.389
Iron 35.8 31.3 25.9 22.8 18.5 17.1 12.8 6.13 3.03 2.14 <1.6 <1.41
Lead <0.124 <0.119 <0.12 <0.121 <0.117 <0.12 <0.132 <0.122 <0.158 <0.155 <0.16 <0.147
Magnesium <1.24 <1.19 <1.2 <1.21 <1.17 <1.2 <1.32 <1.22 <1.58 <1.55 <1.6 <1.47
Manganese 0.752 0.537 0.353 0.234 0.143 <0.12 <0.132 <0.122 <0.158 <0.155 <0.16 <0.147
Nickel <0.124 <0.119 <0.12 <0.121 <0.117 <0.12 <0.132 <0.122 <0.158 <0.155 <0.16 <0.147
Potassium 231 205 221 218 204 220 266 158 118 74 42.5 29.1
Sodium 129,000 130,000 131,000 127,000 126,000 126,000 142,000 87,200 57,400 38,300 26,800 20,000
Zirconium 16.3 15.1 14.2 13.0 12.0 11.6 NA 4.97 1.84 0.665 0.267 <0.141
Nitrate NA NA NA NA NA NA 7,650 3,030 1,780 1,110 678 439
Nitrite NA NA NA NA NA NA 2,370 1,040 524 329 207 135
Oxalate NA NA NA NA NA NA 295 570 1,620 3,220 5,980 8,800
Phosphate NA NA NA NA NA NA 115 306 159 95.7 58.9 37.7
Sulfate NA NA NA NA NA NA 295 2,580 1,390 893 569 379 < is below quantifiable limits. NA= not analyzed.

C.19
WT
P-R
PT
-184, Rev. 0
Table C.5 (Contd)
Sample ID
CBM5-W-6
(mg/kg soln)
CBM5-W-7
(mg/kg soln)
CBM5-W-8
(mg/kg soln)
CBM5-W-9
(mg/kg soln)
CBM5-W-10
(mg/kg soln)
CBM5-W-11
(mg/kg soln)
CBM5-W-12
(mg/kg soln)
CBM5-W-13
(mg/kg soln)
CBM5-W-14
(mg/kg soln)
CBM5-W-15
(mg/kg soln)
CBM5-W-16
(mg/kg soln)
CBM5-OL-05 (mg/kg soln)
Time 54.92 55.52 55.97 56.43 56.98 57.22 57.58 57.87 58.18 58.53 58.92 64.52
Aluminum 780 499 321 216 260 214 181 127 87.1 63.4 47.4 65.6
Calcium <1.58 <1.54 <1.81 <1.45 <2.01 <2.1 <1.69 <1.57 <1.96 <1.67 <1.77 4.12
Chromium 0.321 0.243 0.240 0.165 0.189 0.219 0.197 0.17 <0.213 <0.168 <0.177 5,410
Iron <1.58 <1.54 <1.81 <1.45 <2.01 <2.1 <1.69 <1.57 <1.96 <1.67 <1.77 3.28
Lead <0.157 <0.155 <0.181 <0.146 <0.202 <0.21 <0.178 <0.157 <0.213 <0.168 <0.177 <0.229
Magnesium <1.57 <1.55 <1.81 <1.46 <2.02 <2.1 <1.78 <1.57 <1.96 <1.67 <1.77 <2.29
Manganese <0.157 <0.155 <0.181 <0.146 <0.202 <0.21 <0.178 <0.157 <0.213 <0.168 <0.177 574
Nickel <0.157 <0.155 <0.181 <0.146 <0.202 <0.21 <0.178 <0.157 <0.213 <0.168 <0.177 <0.229
Potassium 19.8 15.9 <10.9 <8.77 <12.1 <12.6 <10.7 <9.41 ,12.8 <10.1 <10.6 46.6
Sodium 20,000 16,500 14,300 10,200 6,580 6,190 4,650 2,680 1,940 1,450 1,150 8,490
Zirconium <0.158 <0.154 <0.181 <0.145 <0.201 <0.21 <0.169 <0.157 <0.196 <0.167 <0.177 <0.229
Nitrate 270 175 112 76.0 93.8 78.2 64.7 48.3 41.1 29.6 35.5 780
Nitrite 87.7 59.4 41.9 29.8 37.6 33.1 27.3 21.5 22.4 <16.8 19.2 22.9
Oxalate 12,400 15,800 11,800 7,430 5,360 3,550 2,610 1,800 1,170 767 1,080 319
Phosphate 24.4 16.8 18.2 <14.6 <20.1 <21 <17.8 <15.7 <21.4 <16.8 <17.7 14.7
Sulfate 238 151 92.5 64.5 77.8 62.7 51.3 35.3 26.5 18.4 24.1 260
< is below quantifiable limits.
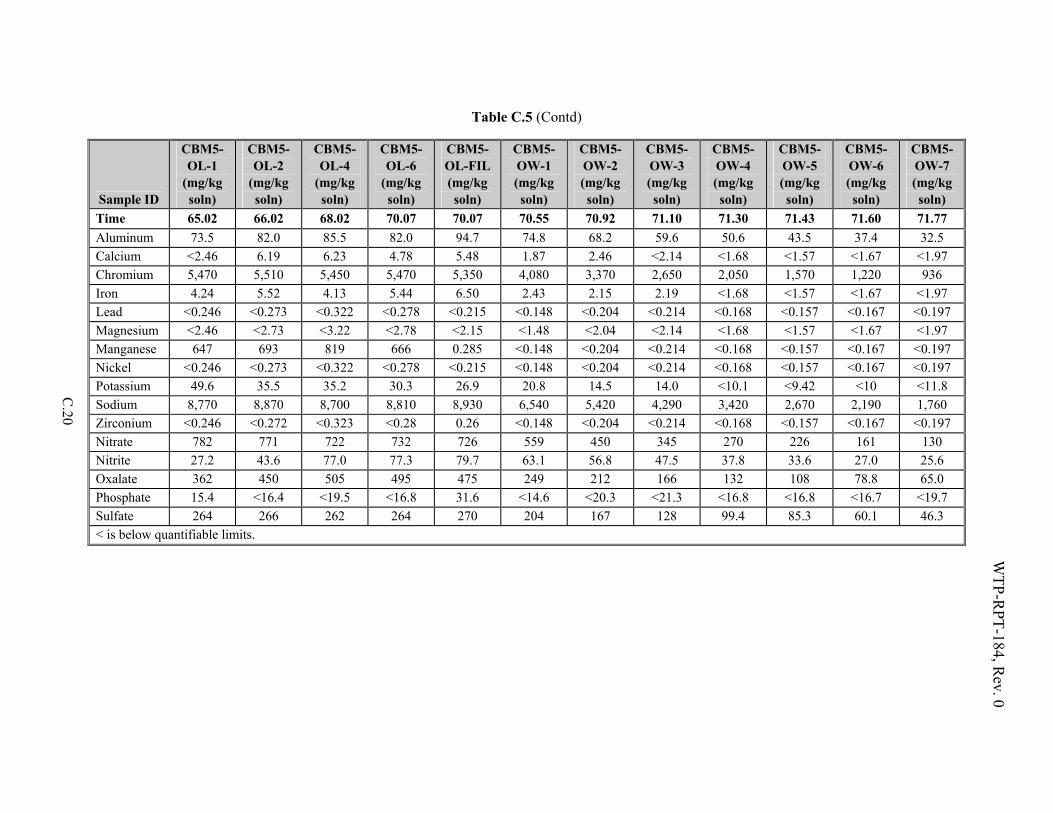
C.20
WT
P-R
PT
-184, Rev. 0
Table C.5 (Contd)
Sample ID
CBM5-OL-1
(mg/kg soln)
CBM5-OL-2
(mg/kg soln)
CBM5-OL-4
(mg/kg soln)
CBM5-OL-6
(mg/kg soln)
CBM5-OL-FIL (mg/kg soln)
CBM5-OW-1 (mg/kg soln)
CBM5-OW-2 (mg/kg soln)
CBM5-OW-3 (mg/kg soln)
CBM5-OW-4 (mg/kg soln)
CBM5-OW-5 (mg/kg soln)
CBM5-OW-6 (mg/kg soln)
CBM5-OW-7 (mg/kg soln)
Time 65.02 66.02 68.02 70.07 70.07 70.55 70.92 71.10 71.30 71.43 71.60 71.77
Aluminum 73.5 82.0 85.5 82.0 94.7 74.8 68.2 59.6 50.6 43.5 37.4 32.5
Calcium <2.46 6.19 6.23 4.78 5.48 1.87 2.46 <2.14 <1.68 <1.57 <1.67 <1.97
Chromium 5,470 5,510 5,450 5,470 5,350 4,080 3,370 2,650 2,050 1,570 1,220 936
Iron 4.24 5.52 4.13 5.44 6.50 2.43 2.15 2.19 <1.68 <1.57 <1.67 <1.97
Lead <0.246 <0.273 <0.322 <0.278 <0.215 <0.148 <0.204 <0.214 <0.168 <0.157 <0.167 <0.197
Magnesium <2.46 <2.73 <3.22 <2.78 <2.15 <1.48 <2.04 <2.14 <1.68 <1.57 <1.67 <1.97
Manganese 647 693 819 666 0.285 <0.148 <0.204 <0.214 <0.168 <0.157 <0.167 <0.197
Nickel <0.246 <0.273 <0.322 <0.278 <0.215 <0.148 <0.204 <0.214 <0.168 <0.157 <0.167 <0.197
Potassium 49.6 35.5 35.2 30.3 26.9 20.8 14.5 14.0 <10.1 <9.42 <10 <11.8
Sodium 8,770 8,870 8,700 8,810 8,930 6,540 5,420 4,290 3,420 2,670 2,190 1,760
Zirconium <0.246 <0.272 <0.323 <0.28 0.26 <0.148 <0.204 <0.214 <0.168 <0.157 <0.167 <0.197
Nitrate 782 771 722 732 726 559 450 345 270 226 161 130
Nitrite 27.2 43.6 77.0 77.3 79.7 63.1 56.8 47.5 37.8 33.6 27.0 25.6
Oxalate 362 450 505 495 475 249 212 166 132 108 78.8 65.0
Phosphate 15.4 <16.4 <19.5 <16.8 31.6 <14.6 <20.3 <21.3 <16.8 <16.8 <16.7 <19.7
Sulfate 264 266 262 264 270 204 167 128 99.4 85.3 60.1 46.3
< is below quantifiable limits.

C.21
WT
P-R
PT
-184, Rev. 0
Table C.5 (Contd)
Sample ID
CBM5-OW-8 (mg/kg soln)
CBM5-OW-9 (mg/kg soln)
CBM5-OW-10 (mg/kg soln)
CBM5-OW-11 (mg/kg soln)
CBM5-OW-12 (mg/kg soln)
CBM5-OW-13 (mg/kg soln)
CBM5-FSC-FIL(mg/kg soln)
Time 71.95 72.13 72.35 72.58 72.85 73.15 75.52
Aluminum 28.8 25.6 22.6 20.3 19.2 17.6 24.6
Calcium 1.58 <1.77 <1.81 <1.74 <1.78 <1.63 <3.57
Chromium 723 581 449 347 274 218 240
Iron <1.49 <1.77 <1.81 <1.74 <1.78 <1.63 <3.57
Lead <0.149 <0.177 <0.181 <0.174 <0.178 <0.163 <0.178
Magnesium <1.49 <1.77 <1.81 <1.74 <1.78 <1.63 <3.57
Manganese <0.149 <0.177 <0.181 <0.174 <0.178 <0.163 <0.178
Nickel <0.149 <0.177 <0.181 <0.174 <0.178 <0.163 <0.178
Potassium <8.95 <10.6 <10.9 <10.4 <10.7 <9.79 <35.7
Sodium 1,440 1,210 1,020 857 746 667 859
Zirconium <0.149 <0.177 <0.181 <0.174 <0.178 <0.163 <0.178
Nitrate 101 83.5 66.9 54.5 46.1 38.4 44.6
Nitrite 19.6 19.7 18.0 <17.1 <17.6 <16.2 <17.8
Oxalate 55.5 45.0 36.7 30.6 30.4 21.8 45.2
Phosphate <19.7 <14.9 <17.6 <17.8 <17.6 <16.2 <17.8
Sulfate 36.9 31.1 21.5 <17.1 <17.6 <16.2 <17.8
< is below quantifiable limits.


WTP-RPT-184, Rev. 0
Appendix D
Physical Property Data for Cold-CUF Runs


WTP-RPT-184, Rev. 0
D.1
Appendix D: Physical Property Data for Cold-CUF Runs
Table D.1. Initial Blended Component Slurries Physical-Property Measurements
CBM-1 CBM-2 CBM-3 CBM-4 CBM-5
Slurry Density (g/mL) 1.26 1.26 1.26 1.26 1.26 Supernate Density (g/mL) 1.23 1.23 1.22 1.23 1.23 Total Solids (wt%) 32.2 31.6 31.6 32.3 32.4 Dissolved Solids (wt%) 27.9 27.9 26.9 28.0 27.9 Undissolved Solids (wt%) 4.3 3.7 4.7 4.3 4.5
Table D.2. Dewatered Blended Component Slurries Physical-Property Measurements
CBM-1 CBM-2 CBM-3 CBM-4 CBM-5
Slurry Density (g/mL) 1.37 1.36 1.36 1.37 1.41 Supernate Density (g/mL) 1.23 1.23 1.22 1.23 1.23 Total Solids (wt%) 44.2 44.6 42.7 42.0 44.1 Dissolved Solids (wt%) 30.0 30.0 26.9 28.0 27.9 Undissolved Solids (wt%) 20.3 20.9 21.7 19.5 22.5
Table D.3. Post-Caustic Leaching Dewatered Blended Component Slurries Physical-Property Measurements
CBM-1 CBM-2 CBM-3 CBM-4 CBM-5
Slurry Density (g/mL) 1.37 1.23 1.40 1.41 1.41 Supernate Density (g/mL) 1.25 1.24 1.28 1.28 1.28 Total Solids (wt%) 52.5 44.7 46.8 42.5 49.4 Dissolved Solids (wt%) 26.8 29.5 39.3 37.8 42.4 Undissolved Solids (wt%) 35.1 21.7 12.4 7.5 12.1
Table D.4. Post-Caustic Leach Washed Blended Component Slurries Physical-Property Measurements
CBM-1 CBM-2 CBM-3 CBM-4 CBM-5
Slurry Density (g/mL) 1.14 1.18 --- 1.10 1.17 Supernate Density (g/mL) 1.06 1.06 --- 1.01 1.00 Total Solids (wt%) 18.9 23.8 28.1 19.8 22.2 Dissolved Solids (wt%) 2.19 9.83 0.40 0.93 0.29 Undissolved Solids (wt%) 17.1 15.5 27.8 19.0 22.0

WTP-RPT-184, Rev. 0
D.2
Table D.5. Post-Oxidative Leached Component Slurries Physical-Property Measurements
CBM-1 CBM-2 CBM-3 CBM-4 CBM-5
Slurry Density (g/mL) 1.11 1.17 1.09 1.10 1.11 Supernate Density (g/mL) 1.00 1.00 --- --- 1.02 Total Solids (wt%) 16.6 22.9 11.03 15.05 14.49 Dissolved Solids (wt%) 0.83 1.02 2.84 2.56 2.90 Undissolved Solids (wt%) 15.9 22.1 8.4 12.8 11.9
Table D.6. Post-Oxidative Leached and Washed (Final) Blended Component Slurries Physical-Property Measurements
CBM-1 CBM-2 CBM-3 CBM-4 CBM-5
Slurry Density (g/mL) 1.24 1.16 1.18 1.17 1.13 Supernate Density (g/mL) 1.00 1.00 0.998 0.999 0.999 Total Solids (wt%) 28.3 22.7 24.42 20.81 23.39 Dissolved Solids (wt%) 0.28 0.00 0.19 0.00 0.19 Undissolved Solids (wt%) 28.1 22.7 24.3 20.8 23.2
Table D.7. Chromium Added and Dewatered Blended Component Slurries Physical-Property Measurements
CBM-3 CBM-4 CBM-5
Slurry Density (g/mL) 1.07 1.14 1.13 Supernate Density (g/mL) -- 1.01 1.01 Total Solids (wt%) 11.8 23.7 22.8 Dissolved Solids (wt%) 3.51 3.16 3.06 Undissolved Solids (wt%) 8.62 21.2 20.4

WTP-RPT-184, Rev. 0
Appendix E
Description of Crossflow Ultrafiltration System

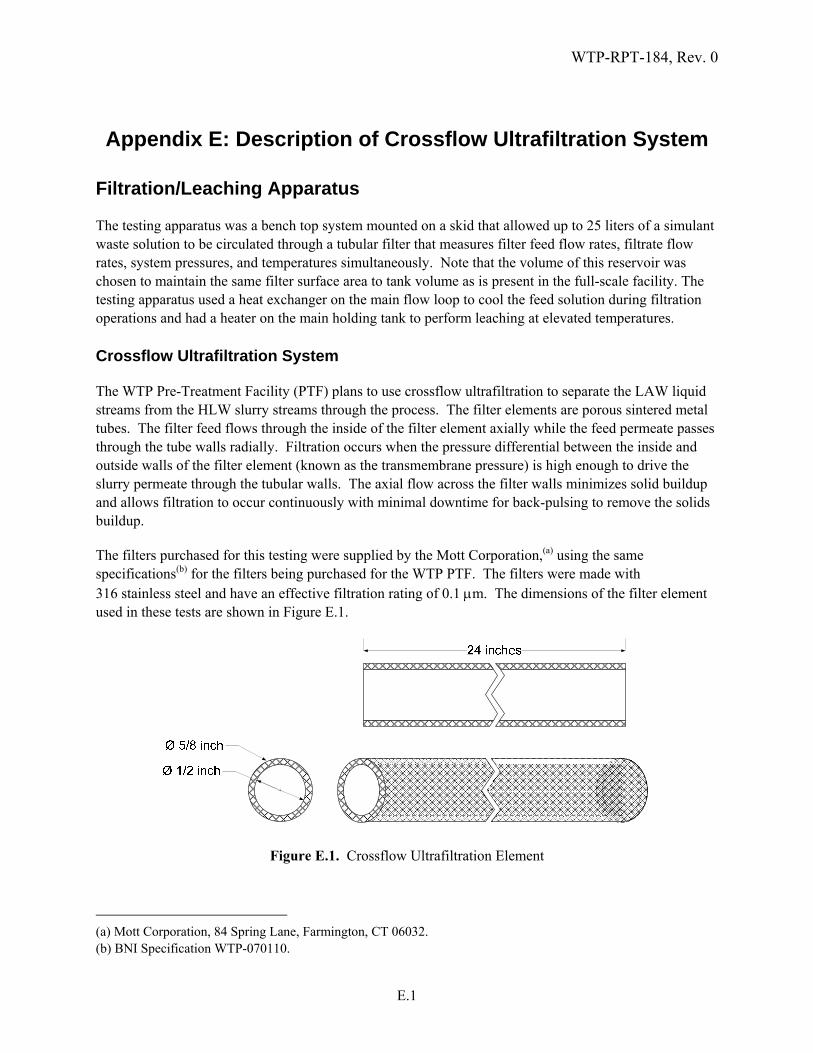
WTP-RPT-184, Rev. 0
E.1
Appendix E: Description of Crossflow Ultrafiltration System
Filtration/Leaching Apparatus
The testing apparatus was a bench top system mounted on a skid that allowed up to 25 liters of a simulant waste solution to be circulated through a tubular filter that measures filter feed flow rates, filtrate flow rates, system pressures, and temperatures simultaneously. Note that the volume of this reservoir was chosen to maintain the same filter surface area to tank volume as is present in the full-scale facility. The testing apparatus used a heat exchanger on the main flow loop to cool the feed solution during filtration operations and had a heater on the main holding tank to perform leaching at elevated temperatures. Crossflow Ultrafiltration System
The WTP Pre-Treatment Facility (PTF) plans to use crossflow ultrafiltration to separate the LAW liquid streams from the HLW slurry streams through the process. The filter elements are porous sintered metal tubes. The filter feed flows through the inside of the filter element axially while the feed permeate passes through the tube walls radially. Filtration occurs when the pressure differential between the inside and outside walls of the filter element (known as the transmembrane pressure) is high enough to drive the slurry permeate through the tubular walls. The axial flow across the filter walls minimizes solid buildup and allows filtration to occur continuously with minimal downtime for back-pulsing to remove the solids buildup.
The filters purchased for this testing were supplied by the Mott Corporation,(a) using the same specifications(b) for the filters being purchased for the WTP PTF. The filters were made with 316 stainless steel and have an effective filtration rating of 0.1 m. The dimensions of the filter element used in these tests are shown in Figure E.1.
Figure E.1. Crossflow Ultrafiltration Element
(a) Mott Corporation, 84 Spring Lane, Farmington, CT 06032. (b) BNI Specification WTP-070110.

WTP-RPT-184, Rev. 0
E.2
The filter element for the laboratory simulant development task was received already installed in a tube-in-tube configuration with an outer tube surrounding the filter element to capture the permeate while the inlet and the outlet of the filter (which extend past the shell and provide access to the inside diameter of the filter) were welded to steel tubing of a matching outer and inner diameter. The shell side had two 3/8-inch stainless steel tubes exiting from the filter assembly, one in the center to collect filtrate from the filter and the other near the inlet of the filter to function as a drain. Pressure ports (¼-inch stainless steel tubing) were installed on the inlet and outlet connections to the assembly to measure the pressure inside the filter. O-ring face seal fittings (Swagelok(a) VCO®) were also placed on the inlet and outlet filter feed tube connections for easy installation to the filtration/leaching skid. Figure E.2 and Figure E.3 show the crossflow ultrafiltration system.
Filter Element
Inlet Filter Feed
Outlet Pressure Gauge Port
Inlet Pressure Gauge Port
Exiting Filtrate
Drain Port
Outlet Filter Feed
Figure E.2. Crossflow Ultrafiltration System Filter Assembly Sketch (Not to Scale)
Figure E.3. Crossflow Ultrafiltration System Assembly
Crossflow Ultrafiltration System
The filter described in the section above was installed in a bench-top testing apparatus that circulates the test filtration simulants through the inside of the filter and diverts the filter permeate to a collection bottle or recycles it back into the slurry reservoir. Figure E.4 shows a piping diagram of the testing apparatus. Figure E.5 is a photograph of the assembled testing apparatus. The testing apparatus is commonly referred to as the crossflow ultrafiltration system.
(a) Swagelok Company, 31400 Aurora Road, Solon, Ohio, 44139.

WTP-RPT-184, Rev. 0
E.3
Slurry Reservoir
Tank
Pump
F
Magnetic Flow Meter
Heat Exchanger
Crossflow Filter
P1 P2
P3
PermeateRemoval
Mass Flow Meter
PermeateRecycle
Back Pulse Air Pressure Supply (100 psig max)
In-LineGraduatedCylinder
Permeate Flow
Slurry Circulation Loop
Rotameter
Relief
ChemicalFeed
Funnel
BackPulseTank
TC
Figure E.4. Piping Diagram of Crossflow Ultrafiltration System (Not to Scale)
Figure E.5. Crossflow Ultrafiltration System

WTP-RPT-184, Rev. 0
E.4
The crossflow ultrafiltration system has four main parts:
Slurry reservoir tank
Slurry recirculation loop
Permeate flow loop
Permeate back pulse chamber.
The slurry reservoir was a cylindrical 304-L stainless steel tank. There were two different tanks, one of 10-liter and the other of 25-liter capacity that could be used with the testing apparatus depending on the test that was to be performed. Note that the volume of this reservoir was chosen to maintain the same filter surface area to tank volume as is present in the full-scale facility. The larger reservoir, as shown in Figure E.5, permitted scaled leaching tests to be performed. The smaller reservoir allowed smaller volumes of simulant to be used. Agitation in the tank was provided with an overhead mixer using a 2-inch-diameter, three-blade marine propeller. To allow the system to be easily drained, the bottom of the tanks were sloped at a 15° angle. Baffles were installed on the tank wall to make sure that the slurry mixing was homogenous. Heat tape was installed around the walls of the tank for leaching at elevated temperatures. The heat tape was connected to a temperature controller that adjusted the electrical load to the heat tape based on a thermocouple input. A dual, Type-K thermocouple was installed inside the reservoir tank (extending just below the overhead mixing impeller) to measure the temperature of the slurry inside the reservoir. One of the thermocouple elements was connected to the heat tape’s temperature controller and the other to a data-collection system.
The slurry recirculation loop directed slurry flow from the slurry reservoir, through the filter, and back into the slurry reservoir for filtration operations. The bottom of the slurry reservoir was connected to the suction side of the slurry recirculation pump—a progressive cavity rotary lobe pump. The discharge of the pump flowed through a single-pass shell-and-tube heat exchanger used to remove excess heat from the system caused by mechanical energy input from the mixer and pump as well as heat generated from frictional flow.
An exterior chiller circulated a water/antifreeze mixture through the exterior shell of the heat exchanger to remove heat away from the circulating slurry on the tube side of the heat exchanger. The chiller controlled the chilling-fluid temperature by monitoring the temperature of the slurry exiting the heat exchanger via a resistance temperature detector (RTD) installed in the discharge line.
The slurry then flowed through a magnetic flow sensor that monitored the volumetric flow of the slurry inside the slurry recirculation loop. The sensor’s output was displayed on an external panel meter that generated an analog output signal monitored by a data-collection system. The data from this device were used to calculate the axial velocity (AV) inside the filter element.
The flowing slurry then entered the filter. Digital pressure gauges were installed on the inlet and outlet ports of the filter, which displayed the pressure at both locations in pounds per inch squared-gauge (psig) with an uncertainty of ± 1 psig. The gauges also transmit analog output signals to the data-collection system. The data from these devices were used to calculate the average pressure inside the filter and the axial pressure drop across the element.

WTP-RPT-184, Rev. 0
E.5
A manual pinch valve was located at the filter’s discharge. The valve was used to adjust the pressure inside the filter to drive permeate flow through the filter membrane wall. It was also connected to the slurry reservoir tank and was closed completely when the reservoir tank was isolated for leaching.
The permeate flow loop started at the center of the filter assembly where a polyethylene tube connected the filter to a manifold of ¼-inch stainless steel piping that directed the filter permeate through a series of measurement devices. A digital pressure gauge was installed at this point to measure the pressure on the permeate side of the filter in psig. Like the other two digital gauges, this instrument transmitted an analog output signal to the data-collection system. The transmembrane pressure (TMP) across the filter was then calculated by subtracting the pressure on the permeate side of the filter from the average pressure of the slurry inside the filter.
Flow from the filter was either diverted through a mass flow meter that could be calibrated up to 180 mL/min or to a user-calibrated rotameter that can measure flow up to 30 mL/s. The mass flow meter also measured the density of the permeate flow and transmitted two analog output signals to the data-collection system for the volumetric flow rate and the density. An in-line glass cylinder was installed on the discharge of both meters to take manual measurements of the permeate flow rate. Measurements were taken by closing a valve at the bottom of the cylinder and allowing the permeate to fill the glass cylinder. The liquid volume in the glass cylinder was measured by volume markings on the outside. The permeate flow rate was calculated from observed changes in permeate volume in the cylinder over a measured time interval.
Permeate exited through a 3-way valve connected to the slurry reservoir tank. This valve directed permeate either back to the slurry reservoir tank to be mixed back with the slurry or to a sampling hose used to collect permeate into sample containers.
The permeate back-pulse chamber was to the right of the permeate flow loop and connected to the filter at the same location as the permeate pressure gauge. The chamber was an approximately 500-mL steel vessel with a sight glass to track the permeate volume inside the chamber. The vessel had three entry ports:
¼-inch line with a two-way toggle valve on the bottom connecting the vessel to the permeate side of the filter
¼-inch line with a two-way valve connecting the top of the vessel to a funnel
¼-inch line with a three-way valve connecting the top of the vessel to a compressed air line and vent line connected to the top of the slurry reservoir tank.
The bottom line was used to direct permeate flow between the chamber and the filter. The funnel on the top of the chamber was used to introduce cleaning and rinse solutions directly to the vessel. The compressed gas line was used to pressurize the fluid in the chamber and to vent the chamber to atmospheric pressure.
To back-pulse the filter, the vessel was first vented to atmospheric pressure. Next, permeate was allowed to fill the chamber by opening the toggle valve. Once the chamber was half full of permeate (as seen through the sight glass), the toggle valve was closed. The three-way valve was then positioned to allow compressed gas at 80 psig to fill the chamber and pressurize the fluid. The three-way valve was then positioned to isolate the now pressurized chamber. The slurry pressure inside the filter was then dropped

WTP-RPT-184, Rev. 0
E.6
below the pressure of the compressed gas line (< 20 psig). The toggle valve at the bottom of the tank was opened, allowing the pressurized permeate inside the chamber to flow backwards through the filter element. The toggle valve was closed when the permeate level was below the visible portion of the sight glass. After the back-pulse was completed, the three-way valve was positioned to vent the chamber back to atmospheric pressure.
WTP-RPT-184, Rev. 0
Appendix F
APYRAL Boehmite Product Description


WTP-RPT-184, Rev. 0
F.1
Appendix F: APYRAL Boehmite Product Description


WTP-RPT-184, Rev. 0
Appendix G
Operating Conditions for Crossflow Ultrafiltration Runs


WTP-RPT-184, Rev. 0
G.1
Appendix G: Operating Conditions for Crossflow Ultrafiltration Runs
Table G.1. Timeline of the CBM-1 Test
Time (hrs) Process Step Action Samples 0 Start of test 11.25 kg of 5 wt% UDS slurry CBM-IN-SL 0-5.75 Initial dewatering Removed 33.68 kg supernate and
added 34.04 kg feed CBM-DW-SL and CBM-DW-
FIL 7 Preparation for caustic
leaching Added 6.94 kg of 19 M NaOH and 9.54 kg of DIW
7.25-11.25 Caustic leaching Heated to 100°C CBM-LE-R-0,2,4 11.25-23.25 Caustic leaching Leached at 100°C CBM-LE-S-0,2,4,6,8,10,12 23.25-35.25 Caustic leaching Cooled from 100°C to 45°C CBM-LE-C-2,4,6,8,10,12 36.5-43.5 Caustic leach dewater Removed 22.26 kg supernate CBM-LC-SL and CBM-LC-FIL44.5-48 Caustic leach washing Added 5.01 kg of 1.57 M NaOH and
removed 4.00 kg supernate CBM-W1-FIL
48.75-53.5 Caustic leach washing Added 4.89 kg of 0.68 M NaOH and removed 4.96 kg supernate
CBM-W2-FIL
54.5-55.5 Caustic leach washing Added 4.84 kg of 0.26 M NaOH and removed 4.92 kg supernate
CBM-W3-FIL
56.25-56.75 Caustic leach washing Added 4.82 kg of 0.08 M NaOH and removed 4.95 kg supernate
CBM-W4-FIL
58-58.5 Caustic leach washing Added 4.81 kg of 0.03 M NaOH and removed 4.80 kg supernate
CBM-W5-FIL
59-59.4 Caustic leach washing Added 4.80 kg of 0.01 M NaOH and removed 4.72 kg supernate
CBM-W6-FIL, CBM-WC-FIL, and CBM-WS-SL
62.5 NaOH concentration adjustment
Added 9.9 g of 19 M NaOH CBM-POL-SUP
63.75-69.75 Oxidative leaching Added 640 mL of 0.2 M KMnO4 CBM-OL-05,1,2,4,6 and CBM-OL-SL
71.5-72.25 Oxidative leach washing Added 4.70 kg of 0.01 M NaOH and removed 6.0 kg supernate
No sample taken.
73.3-74 Oxidative leach washing Added 4.79 kg of 0.01 M NaOH and removed 2.53 kg supernate
No sample taken.
266-266.5 Oxidative leach washing Added 2.33 kg of 0.01 M NaOH and removed 2.35 kg supernate.
CBM-W3-OL
267-267.75 Oxidative leach washing Added 2.40 kg of 0.01 M NaOH and removed 2.48 kg supernate
CBM-FSC-SL


WTP-RPT-184, Rev. 0
G.3
Table G.2. Timeline for Test CBM-2
Time (hrs) Process Step Action Samples 0 Start of test 11.33 kg of 5 wt% UDS slurry CBM25-IN-SL 0-14.75 Initial dewatering Added 33.86 kg slurry and
removed 34.67 kg supernate CBM25-DW-SL and
CBM25-DW-FIL 15.25 Preparation for caustic
leaching Added 6.94 kg of 19 M NaOH and 9.54 kg DIW
No sample taken.
16.25-24.4 Caustic leaching Heated from 25°C to 100°C CBM25-LE-R-0,2,4 24.4-36.4 Caustic leaching Leached at 100°C CBM25-LE-S-
0,2,4,6,8,10,12 36.4-48.25 Caustic leaching Cooled from 100°C to 45°C CBM25-LE-C-
0,2,4,6,8,10,12 49.25-60.4 Caustic leach dewater Removed 20.30 kg supernate. CBM25-LC-SL and
CBM25-LC-FIL 60.6-64.6 Caustic leach washing Added 5.01 kg of 1.57 M NaOH
and removed 5.56 kg supernate CBM25-W1-FIL
64.6-67.6 Caustic leach washing Added 4.89 kg of 0.68 M NaOH and removed 5.10 kg supernate
CBM25-W2-FIL
68.6-70 Caustic leach washing Added 4.88 kg of 0.26 M NaOH and removed 5.06 kg supernate
CBM25-W3-FIL
70.25-71.25 Caustic leach washing Added 4.81 kg of 0.08 M NaOH and removed 4.89 kg supernate
CBM25-W4-FIL
71.8-72.8 Caustic leach washing Added 4.80 kg of 0.03 M NaOH and removed 4.87 kg supernate
CBM25-W5-FIL
73-74 Caustic leach washing Added 4.80 kg of 0.01 M NaOH and removed 4.81 kg supernate
CBM25-W6-FIL, CBM25-WC-FIL, CBM25-WS-SL,
and CBM25-POL-SUP 76-82 Oxidative leaching Added 128 mL of 1 M NaMnO4 CBM25-OL-05,1,2,4,6 and
CBM25-OL-SL 83.25-84 Oxidative leach washing Added 4.81 kg of 0.01 M NaOH
and removed 4.87 kg supernate No sample taken.
84.25-86.25 Oxidative leach washing Added 4.80 kg of 0.01 M NaOH and removed 4.83 kg supernate
No sample taken.
86.5-88.8 Oxidative leach washing Added 4.80 kg of 0.01 M NaOH and removed 4.82 kg supernate
CBM25-W3-OL
89-91.5 Oxidative leach washing Added 4.80 kg of 0.01 M NaOH and removed 4.81 kg supernate
CBM25-FSC-SL

WTP-RPT-184, Rev. 0
G.4
Table G.3. Timeline of the CBM-3 Test
Time (hrs) Process Step Action Samples 0 Start of test Added 28.37 kg of
5 wt% UDS slurry CBM3-IN-SL
0-5.5 Initial dewatering Removed 21.68 kg supernate
CBM3-DW-SL and CBM3-DW-FIL
6.25-7 Preparation for caustic leaching
Added 8.57 kg of 19 M NaOH and
7.92 kg DIW
No sample taken.
7-12.3 Caustic leaching Heated from 25°C to 100°C
CBM3-LE-R-0,2,4
12.3-24.3 Caustic leaching Leached at 100°C CBM3-LE-S-0,2,4,6,8,10,12
24.3-36.3 Caustic leaching Cooled from 100°C to 25°C
CBM3-LE-C-0,2,4,6,8,10,12
49.3-63.5 Caustic leach dewater
Removed 19.27 kg supernate
CBM3-LC-SL and CBM3-LC-FIL
65-74 Caustic leach washing
Added 11.76 kg of 0.01 M NaOH and removed 11.76 kg
supernate
CBM3-WC-FIL and CBM3-WS-SL
75.5 CrOOH slurry addition
Added 1.73 kg CrOOH slurry
No sample taken.
75.75 CrOOH slurry washing
Added 15 L of 0.01 M NaOH
No sample taken.
75.75-79.75 CrOOH slurry wash dewatering
Removed 16.34 kg of supernate
CBM3-CW-SL
81.3-87.3 Oxidative leaching
Added .326 L of 1 M NaMnO4
CBM3-OL-05,1,2,4,6, CBM3-OL-SL, and
CBM3-OL-FIL 88-92.2 Oxidative leach
washing Added ~9 kg of
0.01 M NaOH and removed 9.05 kg
supernate
No sample taken.
92.3-92.75 Final dewatering Removed 0.95 kg supernate
CBM3-FSC-SL

WTP-RPT-184, Rev. 0
G.5
Table G.4. Timeline for test CBM-4
Time (hrs) Process Step Action Samples 0 Start of test Added 26.25 kg of
5 wt% UDS slurry CBM4-IN-SL
0-8.7 Initial dewatering Removed 19.64 kg supernate
CBM4-DW-SL and CBM4-DW-FIL
14 Preparation for caustic leaching
Added 8.66 kg of 19 M NaOH and
8.08 kg DIW
No sample taken.
14-19.5 Caustic leaching Heated from 25°C to 100°C
CBM4-LE-R-0,2,4
19.5-31.5 Caustic leaching Leached at 100°C CBM4-LE-S-0,2,4,6,8,10,12
31.5-43.5 Caustic leaching Cooled from 100°C to 25°C
CBM4-LE-C-0,2,4,6,8,10,12
45-60 Caustic leach dewater
Removed 19.17 kg supernate
CBM4-LC-SL and CBM4-LC-FIL
61-66.5 Caustic leach washing
Added 12.09 kg of 0.01 M NaOH and removed 11.34 kg
supernate
CBM4-WC-FIL and CBM4-WS-SL
68 CrOOH slurry addition
Added 1.73 kg CrOOH slurry
No sample taken.
78.25 CrOOH slurry washing
Added 14.92 kg of 0.01 M NaOH
No sample taken.
78.5-80.7 CrOOH slurry wash dewatering
Removed 16.65 kg of supernate
CBM4-CW-SL
89.3-95 Oxidative leaching
Added .326 L of 1 M NaMnO4
CBM4-OL-05,1,2,4,6, CBM4-OL-SL, and
CBM4-OL-FIL 96.1-98.8 Oxidative leach
washing Added 9.42 kg of 0.01 M NaOH and removed 9.25 kg
supernate
No sample taken.
99-101.5 Final dewatering Removed 0.40 kg supernate
CBM4-FSC-SL

WTP-RPT-184, Rev. 0
G.6
Table G.5. Timeline for test CBM-5
Time (hrs) Process Step Action Samples 0 Start of test Added 26.25 kg of
5 wt% UDS slurry CBM5-IN-SL
0-9.75 Initial dewatering Removed 20.66 kg supernate
CBM5-DW-SL and CBM5-DW-FIL
13 Preparation for caustic leaching
Added 8.57 kg of 19 M NaOH and
7.92 kg DIW
No sample taken.
13-18.3 Caustic leaching Heated from 25°C to 100°C
CBM5-LE-R-0,2,4
18.3-30.3 Caustic leaching Leached at 100°C CBM5-LE-S-0,2,4,6,8,10,12
30.3-42.3 Caustic leaching Cooled from 100°C to 25°C
CBM5-LE-C-0,2,4,6,8,10,12
43.1-60 Caustic leach dewater
Removed 19.19 kg supernate
CBM5-LC-SL and CBM5-LC-FIL
60.5-68.3 Caustic leach washing
Added 11.25 kg of 0.01 M NaOH and removed 11.41 kg
supernate
CBM5-WC-FIL and CBM5-WS-SL
69 CrOOH slurry addition
Added 1.73 kg of CrOOH slurry
No sample taken.
69 CrOOH slurry washing
Added 14.36 kg of 0.01 M NaOH
No sample taken.
69.3-71.5 CrOOH slurry wash dewatering
Removed 15.48 kg of supernate
CBM5-CW-SL
73.75-79.75 Oxidative leaching
Added .326 L of 1 M NaMnO4
CBM5-OL-05,1,2,4,6, CBM5-OL-SL, and
CBM5-OL-FIL 80.3-83 Oxidative leach
washing Added 9.24 kg of 0.01 M NaOH and removed 9.27 kg
supernate
No sample taken.
84-85.3 Final dewatering Removed 1.21 kg of supernate
CBM5-FSC-SL and CBM5-FSC-FIL
WTP-RPT-184, Rev. 0
Appendix H
Letters of Request for Approval for Test Plan Hold Points


WTP-RPT-184, Rev. 0
H.1
Appendix H: Letters of Request for Approval for Test Plan Hold Points

WTP-RPT-184, Rev. 0
H.2

WTP-RPT-184, Rev. 0
H.3

WTP-RPT-184, Rev. 0
H.4

WTP-RPT-184, Rev. 0
H.5

WTP-RPT-184, Rev. 0
H.6

WTP-RPT-184, Rev. 0
H.7

WTP-RPT-184, Rev. 0
H.8

WTP-RPT-184, Rev. 0
H.9

WTP-RPT-184, Rev. 0
H.10

WTP-RPT-184, Rev. 0
H.11


PNNL-18176 WTP-RPT-184, Rev. 0
Distr. 1
Distribution No. of Copies ONSITE
4 Bechtel National, Inc. WTP R&T Docs (2) H4-02 P. S. Sundar H4-02 S. Barnes H4-02
11 Pacific Northwest National Laboratory
P. M. Aker K5-25 E. C. Buck P7-27 D. E. Kurath K3-52 R. A. Peterson P7-22 D. E. Rinehart K6-24 R. L. Russell (3) K6-24 H. D. Smith K6-24 Information Release P8-55 Project File K3-52