research article application of box-behnken design in...
TRANSCRIPT
Hindawi Publishing CorporationInternational Journal of Polymer ScienceVolume 2013, Article ID 104502, 8 pageshttp://dx.doi.org/10.1155/2013/104502
Research ArticleApplication of Box-Behnken Design in Optimization ofGlucose Production from Oil Palm Empty Fruit Bunch Cellulose
Satriani Aga Pasma, Rusli Daik, Mohamad Yusof Maskat, and Osman Hassan
School of Chemical Sciences and Food Technology, Faculty of Science and Technology, Universiti Kebangsaan Malaysia,43600 Bangi, Selangor, Malaysia
Correspondence should be addressed to Rusli Daik; [email protected]
Received 23 July 2013; Accepted 8 October 2013
Academic Editor: Yulin Deng
Copyright © 2013 Satriani Aga Pasma et al. This is an open access article distributed under the Creative Commons AttributionLicense, which permits unrestricted use, distribution, and reproduction in any medium, provided the original work is properlycited.
Oil palm empty fruit bunch fiber (OPEFB) is a lignocellulosic waste from palm oil mills. It contains mainly cellulose from whichglucose can be derived to serve as raw materials for valuable chemicals such as succinic acid. A three-level Box-Behnken designcombined with the canonical and ridge analysis was employed to optimize the process parameters for glucose production fromOPEFB cellulose using enzymatic hydrolysis. Organosolv pretreatment was used to extract cellulose from OPEFB using ethanoland water as the solvents. The extracted cellulose was characterized by thermogravimetric analysis, FTIR spectroscopy, and fieldemission scanning electron microscopy. Hydrolysis parameters including amount of enzyme, amount of cellulose, and reactiontime were investigated. The experimental results were fitted with a second-order polynomial equation by a multiple regressionanalysis and found that more than 97% of the variations could be predicted by the models. Using the ridge analysis, the optimalconditions reaction time found for the production of glucose was 76 hours and 30 min, whereas the optimum amount of enzymeand cellulose was 0.5mL and 0.9 g, respectively. Under these optimal conditions, the corresponding response value predicted forglucose concentration was 169.34 g/L, which was confirmed by validation experiments.
1. Introduction
Bioconversion of lignocellulosic waste materials to chemicalsand fuels are receiving interest as they are low cost, renewable,and widespread in nature [1]. Malaysia is well acknowledgedfor its potential in renewable resources of lignocellulosicmaterials such as oil palm waste, sugar cane bagasse, andrice straw. At present Malaysia is the largest exporter andproducer of palm oil and its production accounts approxi-mately 40–60% of world total palm oil over the 25 years [2, 3].In the process of extraction of palm oil from oil palm fruit,a lignocellulosic material, namely, OPEFB, is generated asa main solid residue, with every ton of fresh fruit bunchesproducing ∼0.22 ton of OPEFB [4]. In Malaysia, ∼17 milliontons of OPEFB is produced every year. Commonly, thisbiomass is burnt in incinerators, and it does not only createenvironmental pollution problems but it also offers limitedvalue to the industry. Several approaches have been devel-oped to utilize OPEFB fibres to produce valuable materials
including paper pulp, composite boards, thermoset polymer,and activated carbon [5].
OPEFB consists of 67% of holocellulose (cellulose andhemicellulose) and 24% of lignin [6]. Cellulose (𝛽-glucan) isa polymer of glucose [7] and can be used as a substrate forthe production of a wide variety of compounds by chemicaland biochemical processes. One such compound is succinicacid, which is extensively used in food, pharmaceuticals, andmanufacturing of biodegradable polymers [8]. Productionof glucose from OPEFB cellulose increased the yield andconcentration of glucose produced compared to using acidor base pretreated OPEFB as reported before. Enzymatichydrolysis using cellulase from Trichoderma reesei (a mix-ture of endoglucanases, exoglucanases, and 𝛽-glucosidase) iswidely used for the degradation of cellulose into soluble oligoglucan/oligomers, cellobiose, and glucose [9]. In this project,a mixture of two enzymes was used to carry out the reaction.NovozymeCelluclast 1.5 L is a brand for cellulase enzyme thatis capable to break the cellulose chains, particularly at middle
2 International Journal of Polymer Science
and chain end sections into cellobiose (the dimer of glucose).Whereas, Novozyme 188 that mainly contains 𝛽-glucosidasewas used to optimize the glucose production since it breaksthe cellobiose chains into glucose.
Optimization of parameters in reaction is one of themost important stages in the development of an efficient andeconomic production of high value products from renewablesources. The traditional “one-factor-at-a-time approach” istime consuming, and moreover the interactions betweenindependent variables are not considered. Response surfacemethodology (RSM) is an effective optimization tool whereinmany factors and their interactions can be identified withfewer experimental trials [10].
RSM has been widely used in various fields includingfood process operations, new product development, biotech-nology-media composition, and bioprocessing such as enzy-matic hydrolysis and fermentation [10]. The RSM is a collec-tion of mathematical and statistical techniques for designingexperiments, building models, evaluating the effects of fac-tors, and searching optimum condition of factors for desiredresponses. The optimization process of this methodologyinvolves studying the response of statistically designed com-binations, estimating the coefficients by fitting it in math-ematical model that fits best the experimental conditions,predicting the response of the fitted model, and checkingthe adequacy of the model. Central composite design (CCD)and Box-Behnken design (BBD) are amongst the mostcommonly used in various experiments [11]. Box-Behnkendesign allows calculation of the response to be made atintermediate levels which were not experimentally studied. Athree-level Box-Behnken design was employed in the presentstudy and the optimal conditions were determined througha minimal experiment number compared with other designs[12].
The objective of this study is to optimize the glucose pro-duction from OPEFB cellulose via enzymatic hydrolysis withthe help of Box-Behnken design, followed by canonical andridge analyses. OPEFB was treated by organosolv method forlignin and hemicellulose removal. In this context, reactiontime, amount of enzyme, and amount of substrates were opti-mized. Enzymatic hydrolysis was also carried out on com-mercially available cellulose for comparison purpose.
2. Materials and Methods
2.1. Raw Material. OPEFB fibers were collected from localpalm oil mill (UnitedOil Palm Industries SdnBhd,Malaysia),sun dried, and ground to particles with diameter of <1mm.The OPEFB biomass was then oven dried at 105∘C overnightand was analyzed following the standard method for deter-mination of its main composition [13].
2.2. Chemicals and Enzymes. Two types of standard cellulosefrom Sigma-Aldrich were used in this study, namely, fibercellulose and microcrystalline cellulose. Solvent and otherchemicals were obtained from R&M Chemicals. Celluclast1.5 L (cellulase) andNovozyme 188 (cellobiase) were obtainedfrom Novozymes Malaysia SdnBhd.
2.3. Autonydrolysis Pretreatment. Autohydrolysis pre-treat-ment was conducted for the delignification process ofOPEFB. OPEFB fibers (30 grams) were loaded into 4 L stain-less steel reactor (98 kPa, 120∘C) and were supplemented withappropriate amount of deionized water. The autohydrolysiswas carried out at 120∘C for 1-2 hours.
2.4. Organosolv Treatment. Autohydrolyzed OPEFB (10grams) was milled and mixed with 80% aqueous ethanol(EtOH/H
2O: 8/2 v/v) and 0.2%w/w sulphuric acid as catalyst
[14]. The mixture was heated at 120∘C for 1 hour and filteredand washed with methanol [14]. This was followed bytreatment with hydrogen peroxide (H
2O2) 2% for 4 hours at
50∘C to obtain cellulose.
2.5. Enzymatic Hydrolysis. Enzymatic hydrolysis experimentwas carried out in a 100mL shaking flask at 40∘C and 145 rpminside an incubator shaker.The cellulase-catalysed hydrolysisof different cellulose substrates (untreated or pretreated) wascarried out in a stirred flask. In a typical hydrolysis reaction,500mg of cellulose was added to 9mL acetate buffer (50mm,pH 4) and incubated for 2 hours (40∘C; 145 rpm). After thispreincubation step, hydrolysis was initiated by adding 0.1mLof 10mg/mL cellulase (activity: 700 EGU/g). The reactionmedium was withdrawn repeatedly at a specific time intervalto determine the progress of the reaction which was stoppedby incubating the withdrawn sample at 90∘C for 20min[15]. Then, the sample was diluted in ultrapure water andfiltered (0.2 𝜇m) prior to analysis by high performance liquidchromatography (HPLC).
The same procedure was also performed for the celluloseextracted fromOPEFB.The reaction was carried out at 40∘C,for 48–94 hours. The amount of cellulose and enzyme usedwas varied from300mg to 500mg and from0.3mL to 0.7mL,respectively.
2.6. Box-Behnken Design. Based on the preliminary one-factor-at-a-time experiments, variables such as duration ofreaction, amount of samples, and total enzymes were identi-fied to have strong effects on the response. Therefore, thesefactors were selected as the variables tested in the 15-runexperiment of the Box-Behnken design experiment.
Table 1 shows the Box-Behnken design matrix of theexperiment of 15 trials. As shown in Table 1, the threefactors chosen for this study were designated as 𝑋
1, 𝑋2, and
𝑋
3and prescribed into three levels, coded +1, 0, −1 for high,
intermediate, and low value, respectively. Three test variableswere coded according to the following equation:
𝑥
𝑖=
𝑋
𝑖− 𝑋
𝑜
Δ𝑋
𝑖 = 1, 2, 3, (1)
where 𝑥𝑖is the coded value of an independent variable; 𝑋
𝑖is
the actual value of an independent variable; 𝑋𝑜is the actual
value of an independent variable at centre point; and Δ𝑋 isthe step change value of an independent variable. All exper-iments were carried out in triplicate, and the averages ofglucose concentration were taken as response [12].
International Journal of Polymer Science 3
Table 1: Levels and code of variables chosen for Box-Behnkendesign.
Variables Symbol Coded levelsUncoded Coded
−1 0 +1Hydrolysis reaction time (h) X1 x1 48 76 94Amount of enzymes (mL) X2 x2 0.1 0.2 0.3Amount of samples (g) X3 x3 0.3 0.5 0.7
For predicting the optimal point, a second-order polyno-mial model was fitted to correlate the relationship betweenindependent variables and response (glucose concentration).The equation for three factors is stated as follows:
𝑌 = 𝛽
0+ 𝛽
1𝑥
1+ 𝛽
2𝑥
2+ 𝛽
3𝑥
3+ 𝛽
12𝑥
1𝑥
2
+ 𝛽
13𝑥
1𝑥
3+ 𝛽
23𝑥
2𝑥
3+ 𝛽
11𝑥
2
1
+ 𝛽
22𝑥
2
2
+ 𝛽
33𝑥
2
3
,
(2)
where 𝑌 is the predicted response; 𝛽0is model constant;
𝑥
1, 𝑥2, and 𝑥
3are independent variables; 𝛽
1, 𝛽2, and 𝛽
3are
linear coefficients; 𝛽12, 𝛽13
and 𝛽23
are cross-product coeffi-cients; and 𝛽
11, 𝛽22, and 𝛽
33are the quadratic coefficients.The
quality of fit of the polynomial model equation was expressedby the coefficient of determination 𝑅2.
2.7. Statistical Data Analysis. The analyses of regression andvariance were carried out using the RSREG procedure of theStatistical Analysis System (SAS) (Version 9.03, SAS InstituteInc., Cary, NC, USA). Both canonical and ridge analyses werealso carried out.
2.8. Characterization. Fourier transform infrared spectra ofraw and treated OPEFB fibers were recorded using PerkinElmer Fourier Transform Infrared (FTIR) model GX. Thepowdered samples for each type were mixed with KBr andcompressed into pellets. Samples were scanned from 400 to4000 cm−1. Thermogravimetric analysis (TGA) was carriedout using a Mettler Toledo model TGA/SDTA 851e. Samplesof approximately 6mg were placed in alumina pans andheated from 30 to 800∘C at 10∘Cmin−1, under a dynamic flowof nitrogen (50mLmin−1). Morphology of the samples wasexamined by using Zeiss Field Emission Scanning ElectronMicroscope (FESEM) model Supra 46VP. FESEM imageswere recorded using an accelerating voltage of 3–5 kV.
The glucose concentration was determined by usingHighPerformance Liquid Chromatography (HPLC) and glucosemeter. The system used for HPLC was Waters HPLC system,and evaporative light scattering detectors (ELSD) was usedas detectors. Glucose was determined using a Zorbax NH
2
column and acetonitrile : water 80 : 20 as the mobile phaseat a flow rate of 1mL/min. The retention time of glucose is13.32min (rsd ± 0.56%). Quantification was based on cali-bration curves established using standard glucose purchasedfrom Sigma-Aldrich.
Tran
smitt
ance
(%)
Wavenumber (cm−1)
ab
c
40001000 2000 3000
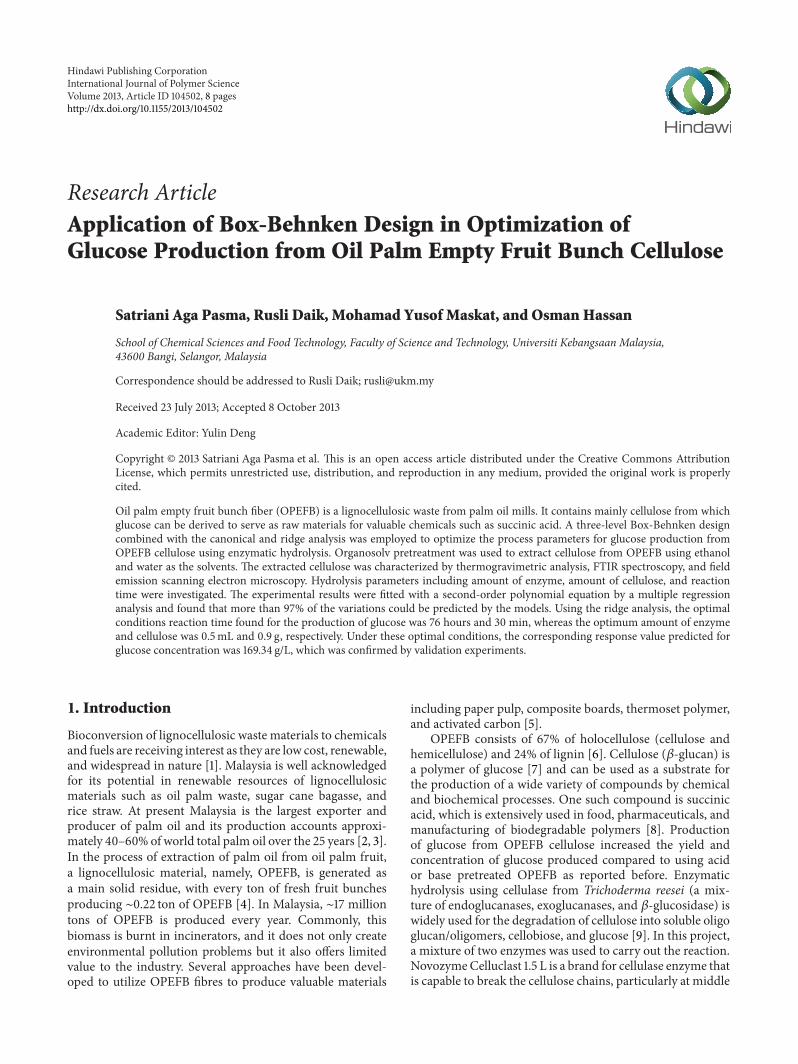
Figure 1: FTIR spectra for (a) raw OPEFB, (b) delignified OPEFB,and (c) OPEFB cellulose.
3. Results and Discussion
3.1. Characterization of OPEFB Cellulose
3.1.1. FTIR Spectroscopy. Figure 1 shows the FTIR spectraof cellulose extracted from OPEFB (OPEFB cellulose), rawOPEFB, and delignified OPEFB.The peaks ascribed to ligninappeared at 1501 and 1512 cm−1 that are due to C=C stretchingand C=C aromatic skeletal vibration of lignin, respectively.However, the two peaks of lignin were not observed inthe FTIR spectra of the delignified OPEFB (Figure 1,b)and OPEFB cellulose (Figure 1,c). The peak attributed tohemicellulose was observed in the spectra of the raw OPEFBand delignified OPEFB (Figure 1,b) at 1732–1735 cm−1 dueto C=O stretching. However, the corresponding peaks weredisappeared in the spectrum of OPEFB cellulose (Figure 1,c).This observation indicated that the organosolv treatmentwas able to remove the lignin as well as hemicellulose fromOPEFB fibers. The peak observed at 898 cm−1 is attributedto the presence of 𝛽-glucoside linkage between glucose unitsin cellulose [16]. All FTIR spectra in this study showed a 𝛽-glucoside linkage peak including the FTIR spectrum for theobtained OPEFB cellulose (Figure 1,c).
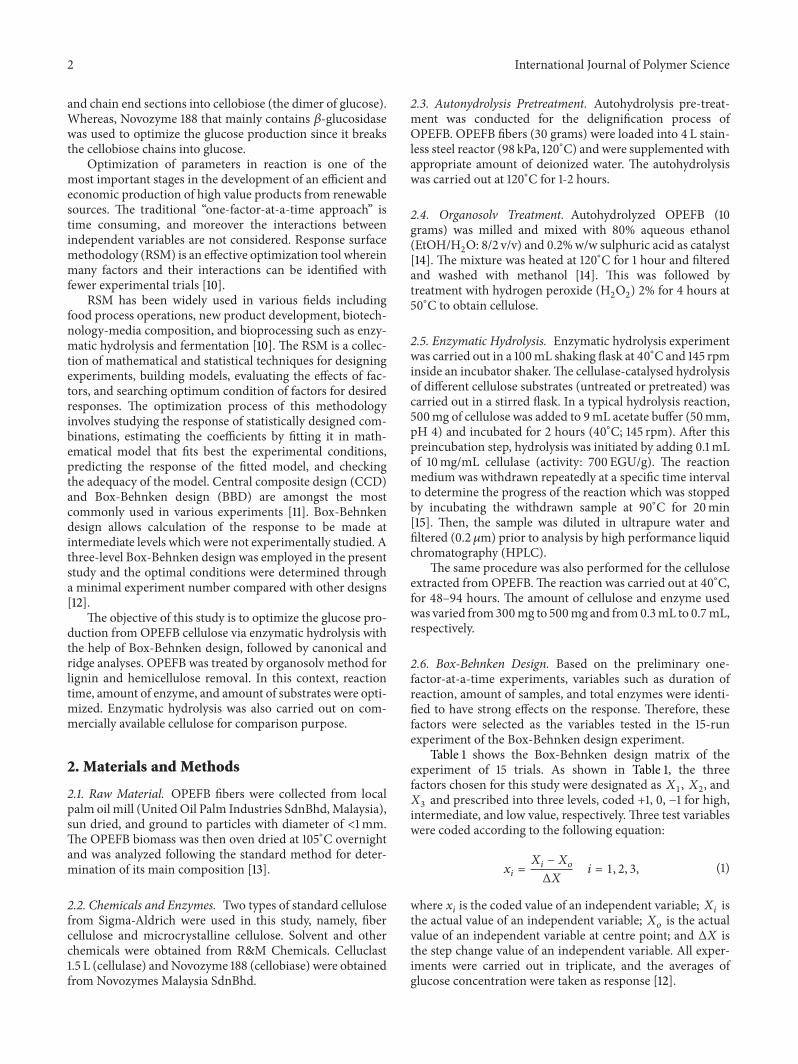
3.1.2.Thermal Analysis of OPEFB Cellulose. Figure 2 presentsthe TGA thermograms and the correspondingDTG curves ofthe raw OPEFB, delignified OPEFB, and OPEFB cellulose. Aclear “shoulder” at around 250–300∘C is normally assignedto the thermal decomposition of hemicellulose [17]. Thehigh temperature “tails” around 400–600∘C were normallyascribed to degradation of lignin. For the raw OPEFB (Fig-ure 2(c)), hemicelluloses shoulder peaks were not obviousbecause it is overlapped with main peaks of cellulose. Inthe thermogram for delignified OPEFB (Figure 2(b)), thefirst peak appears at around 300∘C (shoulder) resemblingthe thermal decomposition of hemicellulose. There is no tailappears within the range of 400–600∘C indicating that thedelignification process was successful. In the case of celluloseobtained from organosolv and H
2O2treatments, there is no
shoulder and tails present in the thermogram indicating that
4 International Journal of Polymer Science
0
20
40
60
80
100
30 108 187 265 343 422 500 578 657 735
Wei
ght l
oss (
%)
ab
c
Temperature (∘C)
0.00E + 00
−5.00E − 04
−1.00E − 03
−1.50E − 03
−2.00E − 03
−2.50E − 03
1/t
ime (
1/s)
ab
c
Temperature (∘C)30 108 187 265 343 422 500 578 657 735
(A)
(B)
Figure 2: TGA thermograms and DTG curves of (a) OPEFBcellulose, (b) delignified OPEFB, and (c) raw OPEFB.
lignin and hemicellulose were successfully removed.Thermaldecomposition at around 310∘C showed that OPEFB cellulosewas successfully obtained (Figure 2(a)).
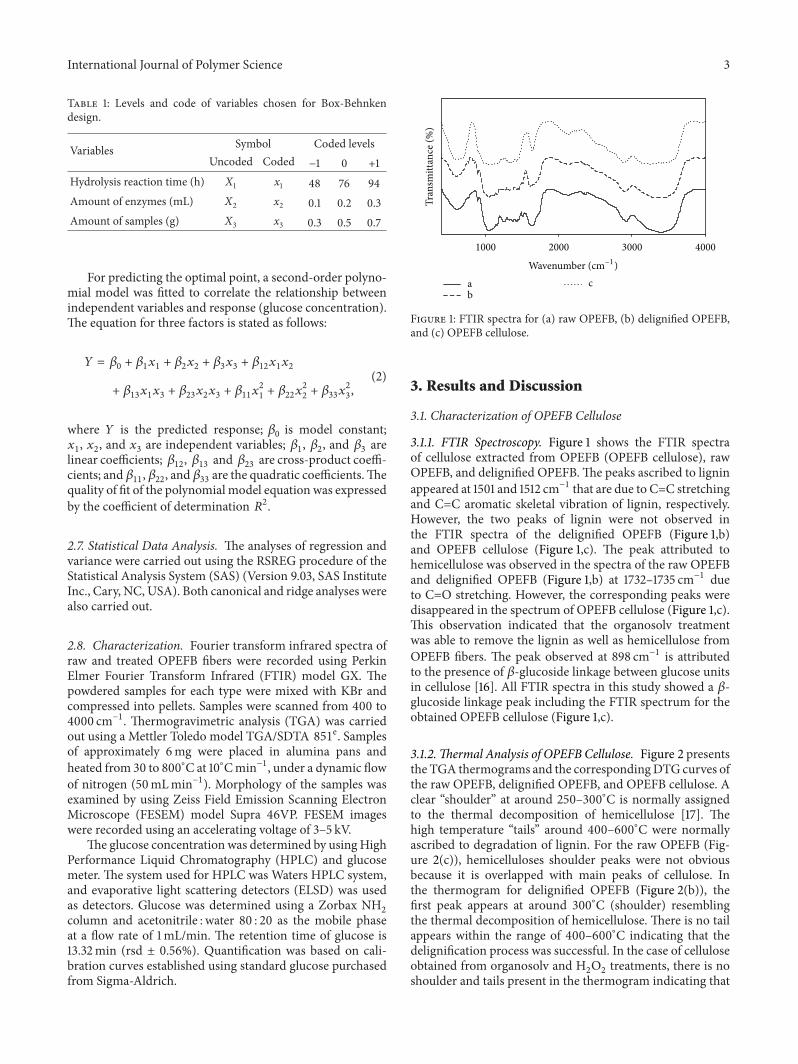
3.1.3. Morphology of OPEFB Fibers. SEMmicrographs of rawOPEFB, delignified OPEFB, and obtained cellulose (OPEFBcellulose) are shown in Figure 3. A rigid appearance canbe seen for raw OPEFB material (Figure 3(a)). The figureshows that raw OPEFB fibers exhibit stiff and hard surfaces.Delignification of OPEFB reduced the stiff appearance andsome parts of the fibers were split and became more refined.The images also showed that some fibers were broken. Figure3(c) shows the SEM image of obtained cellulose (OPEFBcellulose) after delignification and organosolv treatment.Theappearance is quite different and the length and diameter offibers were reduced. This is probably due to the decrease inspiral angle around the fibre axis and increase in molecularorientation after pretreatment. A fair amount of randomness
Table 2: Effect of different parameters on enzymatic hydrolysis ofOPEFB cellulose.
Run Amount ofsubstrate (g)
Total enzymes(mL)
Reaction time(Hours)
Glucoseconcentration
(g/L)1 0.7 0.2 48 91.82 0.5 0.1 94 97.23 0.5 0.3 48 97.24 0.5 0.3 94 93.65 0.3 0.2 48 55.86 0.3 0.2 94 39.67 0.7 0.2 48 122.48 0.7 0.2 94 167.49 0.3 0.1 76 21.610 0.7 0.3 76 97.211 0.7 0.1 76 48.612 0.7 0.3 76 100.813 0.5 0.2 76 52.214 0.5 0.2 76 54.015 0.5 0.2 76 55.8
is introduced to the orientation of the crystallites due toremoval of noncellulosicmatters [15] leading to the formationof fibers with smaller diameter and length.
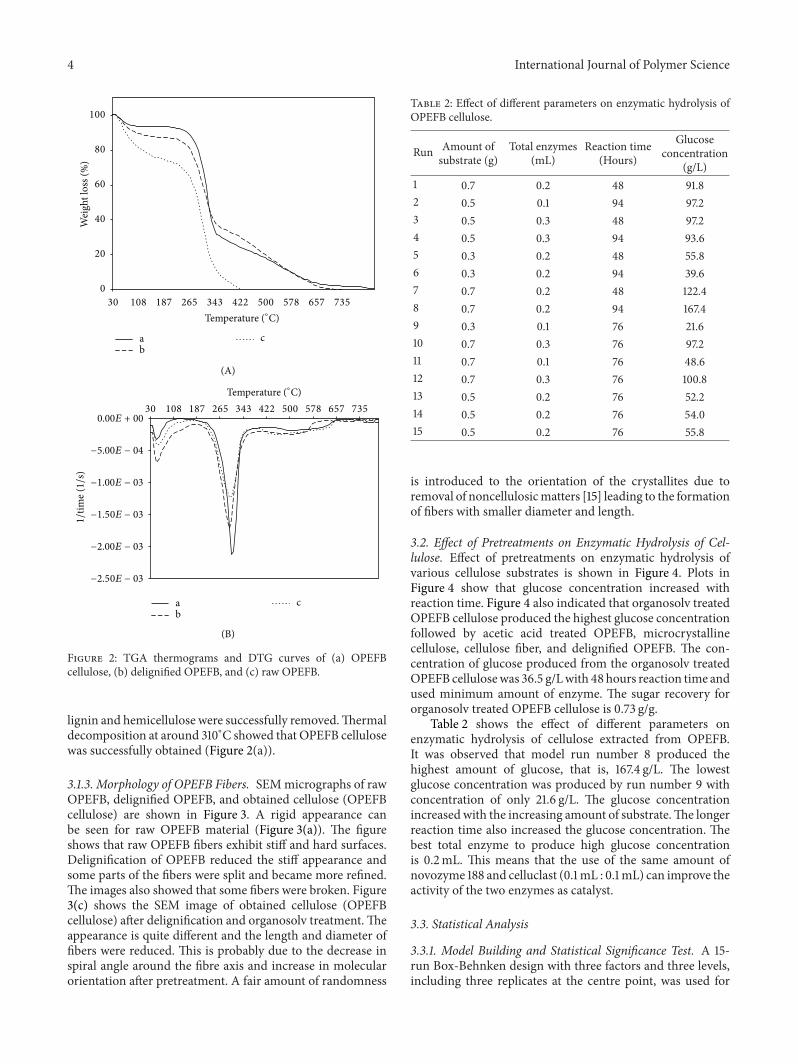
3.2. Effect of Pretreatments on Enzymatic Hydrolysis of Cel-lulose. Effect of pretreatments on enzymatic hydrolysis ofvarious cellulose substrates is shown in Figure 4. Plots inFigure 4 show that glucose concentration increased withreaction time. Figure 4 also indicated that organosolv treatedOPEFB cellulose produced the highest glucose concentrationfollowed by acetic acid treated OPEFB, microcrystallinecellulose, cellulose fiber, and delignified OPEFB. The con-centration of glucose produced from the organosolv treatedOPEFB cellulosewas 36.5 g/Lwith 48 hours reaction time andused minimum amount of enzyme. The sugar recovery fororganosolv treated OPEFB cellulose is 0.73 g/g.
Table 2 shows the effect of different parameters onenzymatic hydrolysis of cellulose extracted from OPEFB.It was observed that model run number 8 produced thehighest amount of glucose, that is, 167.4 g/L. The lowestglucose concentration was produced by run number 9 withconcentration of only 21.6 g/L. The glucose concentrationincreased with the increasing amount of substrate.The longerreaction time also increased the glucose concentration. Thebest total enzyme to produce high glucose concentrationis 0.2mL. This means that the use of the same amount ofnovozyme 188 and celluclast (0.1mL : 0.1mL) can improve theactivity of the two enzymes as catalyst.
3.3. Statistical Analysis
3.3.1. Model Building and Statistical Significance Test. A 15-run Box-Behnken design with three factors and three levels,including three replicates at the centre point, was used for

International Journal of Polymer Science 5
(a) (b)
(c)
Figure 3: SEM images of (a) raw OPEFB fibers (b) delignified OPEFB (c) OPEFB cellulose.
05
10152025303540
0 2 6 8 12 16 24 36 40 48Reaction time (h)
Cellulose fiberCellulose microcrystallineOPEFB after delignificationOPEFB treated with acetic acidCellulose extracted from OPEFB
Glu
cose
conc
entr
atio
n (g
/L)
Figure 4: Effect of pre-treatments on enzymatic hydrolysis ofvarious cellulose substrates.
appropriate second-order responses surface.The three centrepoint runs were added to provide as a measure of processstability and inherent variability. The considerable variationin the glucose concentration produced fromOPEFB celluloseunder different conditions is shown in Table 3. The glucoseconcentration predicted by the final quadratic model alongwith corresponding values observed was given too. The
Table 3: Box-Behnken design with experimental and predictedvalues of glucose concentration.
Run x1 x2 x3Glucose concentration (g/L)
Predicted Experimental Difference1 −1 −1 0 94.95 91.8 −3.152 −1 −1 0 94.95 97.2 2.253 1 1 0 94.95 97.2 2.254 1 1 0 94.95 93.6 −1.355 −1 0 −1 65.00 55.8 −9.206 1 0 −1 34.40 39.6 5.207 −1 0 1 127.60 122.4 −5.208 1 0 1 158.20 167.4 9.209 0 −1 −1 22.35 21.6 −0.7510 0 1 −1 107.95 97.2 −10.7511 0 −1 −1 22.35 48.6 26.2512 0 1 1 115.55 100.8 −14.7513 0 0 0 54.00 52.2 −1.8014 0 0 0 54.00 54.0 0.0015 0 0 0 54.00 55.8 1.80
agreement between the yield predicted by the model and theexperimental data is very strong, with a small difference inglucose concentration.
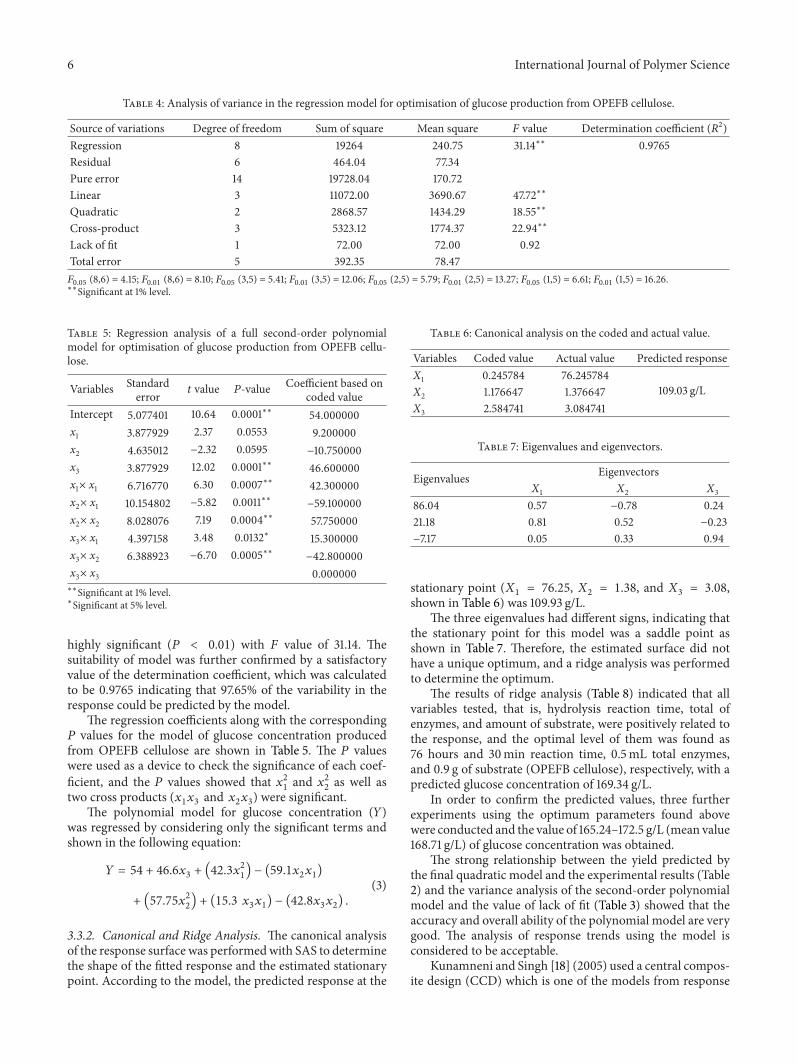
Furthermore, the model capability was checked usingthe 𝐹-test and determination coefficient 𝑅2. The analysis ofvariance (Table 4) showed that this regression model was
6 International Journal of Polymer Science
Table 4: Analysis of variance in the regression model for optimisation of glucose production from OPEFB cellulose.
Source of variations Degree of freedom Sum of square Mean square 𝐹 value Determination coefficient (𝑅2)Regression 8 19264 240.75 31.14∗∗ 0.9765Residual 6 464.04 77.34Pure error 14 19728.04 170.72Linear 3 11072.00 3690.67 47.72∗∗
Quadratic 2 2868.57 1434.29 18.55∗∗
Cross-product 3 5323.12 1774.37 22.94∗∗
Lack of fit 1 72.00 72.00 0.92Total error 5 392.35 78.47𝐹0.05
(8,6) = 4.15; 𝐹0.01
(8,6) = 8.10; 𝐹0.05
(3,5) = 5.41; 𝐹0.01
(3,5) = 12.06; 𝐹0.05
(2,5) = 5.79; 𝐹0.01
(2,5) = 13.27; 𝐹0.05
(1,5) = 6.61; 𝐹0.01
(1,5) = 16.26.∗∗Significant at 1% level.
Table 5: Regression analysis of a full second-order polynomialmodel for optimisation of glucose production from OPEFB cellu-lose.
Variables Standarderror 𝑡 value 𝑃-value Coefficient based on
coded valueIntercept 5.077401 10.64 0.0001∗∗ 54.000000x1 3.877929 2.37 0.0553 9.200000x2 4.635012 −2.32 0.0595
−10.750000x3 3.877929 12.02 0.0001∗∗ 46.600000x1× x1 6.716770 6.30 0.0007∗∗ 42.300000x2× x1 10.154802 −5.82 0.0011∗∗
−59.100000x2× x2 8.028076 7.19 0.0004∗∗ 57.750000x3× x1 4.397158 3.48 0.0132∗ 15.300000x3× x2 6.388923 −6.70 0.0005∗∗
−42.800000x3× x3 0.000000∗∗Significant at 1% level.∗Significant at 5% level.
highly significant (𝑃 < 0.01) with 𝐹 value of 31.14. Thesuitability of model was further confirmed by a satisfactoryvalue of the determination coefficient, which was calculatedto be 0.9765 indicating that 97.65% of the variability in theresponse could be predicted by the model.
The regression coefficients along with the corresponding𝑃 values for the model of glucose concentration producedfrom OPEFB cellulose are shown in Table 5. The 𝑃 valueswere used as a device to check the significance of each coef-ficient, and the 𝑃 values showed that 𝑥2
1
and 𝑥22
as well astwo cross products (𝑥
1𝑥
3and 𝑥
2𝑥
3) were significant.
The polynomial model for glucose concentration (𝑌)was regressed by considering only the significant terms andshown in the following equation:
𝑌 = 54 + 46.6𝑥
3+ (42.3𝑥
2
1
) − (59.1𝑥
2𝑥
1)
+ (57.75𝑥
2
2
) + (15.3 𝑥
3𝑥
1) − (42.8𝑥
3𝑥
2) .
(3)
3.3.2. Canonical and Ridge Analysis. The canonical analysisof the response surface was performedwith SAS to determinethe shape of the fitted response and the estimated stationarypoint. According to the model, the predicted response at the
Table 6: Canonical analysis on the coded and actual value.
Variables Coded value Actual value Predicted responseX1 0.245784 76.245784
109.03 g/LX2 1.176647 1.376647X3 2.584741 3.084741
Table 7: Eigenvalues and eigenvectors.
Eigenvalues EigenvectorsX1 X2 X3
86.04 0.57 −0.78 0.2421.18 0.81 0.52 −0.23−7.17 0.05 0.33 0.94
stationary point (𝑋1= 76.25, 𝑋
2= 1.38, and 𝑋
3= 3.08,
shown in Table 6) was 109.93 g/L.The three eigenvalues had different signs, indicating that
the stationary point for this model was a saddle point asshown in Table 7. Therefore, the estimated surface did nothave a unique optimum, and a ridge analysis was performedto determine the optimum.
The results of ridge analysis (Table 8) indicated that allvariables tested, that is, hydrolysis reaction time, total ofenzymes, and amount of substrate, were positively related tothe response, and the optimal level of them was found as76 hours and 30min reaction time, 0.5mL total enzymes,and 0.9 g of substrate (OPEFB cellulose), respectively, with apredicted glucose concentration of 169.34 g/L.
In order to confirm the predicted values, three furtherexperiments using the optimum parameters found abovewere conducted and the value of 165.24–172.5 g/L (mean value168.71 g/L) of glucose concentration was obtained.
The strong relationship between the yield predicted bythe final quadratic model and the experimental results (Table2) and the variance analysis of the second-order polynomialmodel and the value of lack of fit (Table 3) showed that theaccuracy and overall ability of the polynomial model are verygood. The analysis of response trends using the model isconsidered to be acceptable.
Kunamneni and Singh [18] (2005) used a central compos-ite design (CCD) which is one of the models from response

International Journal of Polymer Science 7
Table 8: Results of ridge analysis.
Radii Yield(g/L)
Standarderror
Actual valueX1 X2 X3
0.0 54.000000 5.077401 76.000000 0.200000 0.5000000.1 59.135102 5.088990 76.027497 0.162679 0.5886060.2 65.148586 5.111521 76.071382 0.099157 0.6572740.3 72.467739 5.161894 76.123974 0.023639 0.7086320.4 81.311717 5.312751 76.179672 0.055354 0.7500240.5 91.774748 5.661294 76.236446 0.135154 0.7859460.6 103.899910 6.293774 76.293615 0.215023 0.8186620.7 117.709117 7.258911 76.350935 0.294764 0.8493610.8 133.214604 8.565148 76.408309 0.374337 0.8787090.9 150.423721 10.197117 76.465695 0.45375 0.9071111.0 169.341156 12.132559 76.533077 0.533021 0.934823
surface methodology (RSM) to optimize the effect of fourvariables (precooking-amylase dose, postcooking-amylasedose, glucoamylase dose, and saccharification temperature)in the optimization of glucose production from maize starch[18]. As comparison, they did 28 experiments for 4 factorsand finally obtained a coefficient determination of 0.9558,whereas in this project only 3 factors with 15 experimentswere used and the coefficient determination value obtainedis 0.9765.
Although many experiments are completed at the canon-ical analysis, the ridge analysis is very useful to find outthe maximum response which may occur in the experimentwhen the results of the canonical analysis shows a saddle,stationary point, and no unique optimum in the estimatedsurface [19]. Based on the ridge analysis, the optimal reactiontime, total of enzymes, and amount of samples for glucoseproduction were determined in this study with a good pre-dicted hydrolysis reaction rate without further experimentalwork. An average glucose concentration of 168.71 g/L wasobtained in three further validation experiments using theoptimum reaction parameters. As compared to those ofexperimental (167.4 g/L) and predicted value (169.34 g/L),there is a good correlation amongst those three results verify-ing the validity of the response model and the actuality ofoptimal point.
4. Conclusions
Enzymatic hydrolysis of OPEFB cellulose was successfullycarried out at 40∘C under various amounts of samples, totalenzymes, and reaction time (48–94 hours). Box-Behnkendesign was shown to be useful in investigating those threecritical variables. Through the canonical and ridge analysesof the second-order polynomial model, a maximum glucoseconcentration of 168.71 g/L was obtained under the followingconditions: 76 hours and 30 minutes hydrolysis reactiontime used 0.5mL enzymes and 0.9 gram samples/OPEFBcellulose. In summary, within the reaction conditions testedthe concentration of glucose produced is proportional to thereaction time, total enzymes, and amount of samples.
Acknowledgments
The authors express their acknowledgements to UniversitiKebangsaan Malaysia and Malaysia Government for thefinancial support of this work (UKM-AP-2011-20).
References
[1] S. H. A. Rahman, J. P. Choudhury, and A. L. Ahmad, “Produc-tion of xylose from oil palm empty fruit bunch fiber using sul-furic acid,” Biochemical Engineering Journal, vol. 30, no. 1, pp.97–103, 2006.
[2] S.-P. Fan, S. Zakaria, C.-H. Chia Chin-Hua et al., “Comparativestudies of products obtained from solvolysis liquefaction ofoil palm empty fruit bunch fibres using different solvents,”Bioresource Technology, vol. 102, no. 3, pp. 3521–3526, 2011.
[3] T. L. Chew and S. Bhatia, “Catalytic processes towards the pro-duction of biofuels in a palm oil and oil palm biomass-basedbiorefinery,” Bioresource Technology, vol. 99, no. 17, pp. 7911–7922, 2008.
[4] A. Ahmadzadeh and S. Zakaria, “Kinetics of oil palm emptyfruit bunch phenolysis in the presence of sulfuric acid as acatalyst,” Journal of Applied Polymer Science, vol. 106, no. 5, pp.3529–3533, 2007.
[5] L. Jimenez, L. Serrano, A. Rodrıguez, and R. Sanchez, “Soda-anthraquinone pulping of palm oil empty fruit bunches andbeating of the resulting pulp,” Bioresource Technology, vol. 100,no. 3, pp. 1262–1267, 2009.
[6] A. Rodrıguez, L. Serrano, A. Moral, A. Perez, and L. Jimenez,“Use of high-boiling point organic solvents for pulping oil palmempty fruit bunches,” Bioresource Technology, vol. 99, no. 6, pp.1743–1749, 2008.
[7] C. E. Wyman, “Ethanol from lignocellulosic biomass: technol-ogy, economics, and opportunities,”Bioresource Technology, vol.50, no. 1, pp. 3–15, 1994.
[8] P. Zheng, L. Fang, Y. Xu, J.-J. Dong, Y. Ni, and Z.-H. Sun,“Succinic acid production from corn stover by simultaneoussaccharification and fermentation using Actinobacillus succino-genes,” Bioresource Technology, vol. 101, no. 20, pp. 7889–7894,2010.
[9] E. Husson, S. Buchoux, C. Avondo et al., “Enzymatic hydrolysisof ionic liquid-pretreated celluloses: contribution of CP-MAS13CNMR and SEM,” Bioresource Technology, vol. 102, no. 15, pp.7335–7342, 2011.
[10] S. H. A. Rahman, J. P. Choudhury, A. L. Ahmad, and A. H.Kamaruddin, “Optimization studies on acid hydrolysis of oilpalm empty fruit bunch fiber for production of xylose,” Bio-resource Technology, vol. 98, no. 3, pp. 554–559, 2007.
[11] G. E. P. Box, W. G. Hunter, and J. S. Hunter, Statistic for Experi-menters, John Wiley & Sons, New York, NY, USA, 1978.
[12] C.-H. Dong, X.-Q. Xie, X.-L. Wang, Y. Zhan, and Y.-J. Yao,“Application of Box-Behnken design in optimisation for poly-saccharides extraction from cultured mycelium of Cordycepssinensis,” Food and Bioproducts Processing, vol. 87, no. 2, pp. 139–144, 2009.
[13] Chemical Analysis and Testing Standard Procedure, “NationalRenewable Energy Laboratories,” Golden, Co., NREL, 002-004,1996.
[14] R. El Hage, L. Chrusciel, L. Desharnais, and N. Brosse, “Effectof autohydrolysis of Miscanthus x giganteus on lignin structureand organosolv delignification,”Bioresource Technology, vol. 101,no. 23, pp. 9321–9329, 2010.
8 International Journal of Polymer Science
[15] A.-I. Yeh, Y.-C.Huang, and S.H. Chen, “Effect of particle size onthe rate of enzymatic hydrolysis of cellulose,”Carbohydrate Poly-mers, vol. 79, no. 1, pp. 192–199, 2010.
[16] R. Martın-Sampedro, A. Rodrıguez, A. Ferrer, L. L. Garcıa-Fuentevilla, and M. E. Eugenio, “Biobleaching of pulp fromoil palm empty fruit bunches with laccase and xylanase,”Bioresource Technology, vol. 110, pp. 371–378, 2012.
[17] H. Zhao, C. L. Jones, G. A. Baker, S. Xia, O. Olubajo, and V. N.Person, “Regenerating cellulose from ionic liquids for an accele-rated enzymatic hydrolysis,” Journal of Biotechnology, vol. 139,no. 1, pp. 47–54, 2009.
[18] A. Kunamneni and S. Singh, “Response surface optimization ofenzymatic hydrolysis of maize starch for higher glucose pro-duction,”Biochemical Engineering Journal, vol. 27, no. 2, pp. 179–190, 2005.
[19] D. G. Lin, “Evolutionary technique of factorial experiment,”Journal of Tropical Crops, vol. 13, pp. 51–56, 1992.

Submit your manuscripts athttp://www.hindawi.com
ScientificaHindawi Publishing Corporationhttp://www.hindawi.com Volume 2014
CorrosionInternational Journal of
Hindawi Publishing Corporationhttp://www.hindawi.com Volume 2014
Polymer ScienceInternational Journal of
Hindawi Publishing Corporationhttp://www.hindawi.com Volume 2014
Hindawi Publishing Corporationhttp://www.hindawi.com Volume 2014
CeramicsJournal of
Hindawi Publishing Corporationhttp://www.hindawi.com Volume 2014
CompositesJournal of
NanoparticlesJournal of
Hindawi Publishing Corporationhttp://www.hindawi.com Volume 2014
Hindawi Publishing Corporationhttp://www.hindawi.com Volume 2014
International Journal of
Biomaterials
Hindawi Publishing Corporationhttp://www.hindawi.com Volume 2014
NanoscienceJournal of
TextilesHindawi Publishing Corporation http://www.hindawi.com Volume 2014
Journal of
NanotechnologyHindawi Publishing Corporationhttp://www.hindawi.com Volume 2014
Journal of
CrystallographyJournal of
Hindawi Publishing Corporationhttp://www.hindawi.com Volume 2014
The Scientific World JournalHindawi Publishing Corporation http://www.hindawi.com Volume 2014
Hindawi Publishing Corporationhttp://www.hindawi.com Volume 2014
CoatingsJournal of
Advances in
Materials Science and EngineeringHindawi Publishing Corporationhttp://www.hindawi.com Volume 2014
Smart Materials Research
Hindawi Publishing Corporationhttp://www.hindawi.com Volume 2014
Hindawi Publishing Corporationhttp://www.hindawi.com Volume 2014
MetallurgyJournal of
Hindawi Publishing Corporationhttp://www.hindawi.com Volume 2014
BioMed Research International
MaterialsJournal of
Hindawi Publishing Corporationhttp://www.hindawi.com Volume 2014
Nano
materials
Hindawi Publishing Corporationhttp://www.hindawi.com Volume 2014
Journal ofNanomaterials