soundabsorptionperformanceofoilpalmempty · pdf filesoundabsorptionperformanceofoilpalmempty...
TRANSCRIPT
23I SVC23rd International Congress on Sound & Vibration
10-14 July 2016Athens, Greece
SOUND ABSORPTION PERFORMANCE OF OIL PALM EMPTYFRUIT BUNCH FIBERSOr Khai Hee, Azma Putra, Mohd Jailani Mohd Nor, Mohd Zulkefli Selamat and LimZhi YingUniversiti Teknikal Malaysia Melaka – UTeM, Centre for Advanced Research on Energy (CARe), Hang TuahJaya, Durian Tunggal, 76100 Melaka, Malaysiaemail: [email protected]
The conventional acoustic absorbers are made from synthetic materials which are not only causingglobal warming and pollutions during its production, but also harmful to human. Thus, scientistshave turned their attention to find sustainable and ’green’ materials which have the potential toreplace synthetic materials. Oil Palm Empty Fruit Bunch (OPEFB) fiber is a biodegradable mate-rial and is available in abundance quantity as agricultural waste in Malaysia. In this study, soundabsorption performance of OPEFB fiber is investigated. The impedance tube testing accordingto ISO 10534-2 was conducted to measure the sound absorption coefficient. Samples of rawOPEFB fibers with different masses and thicknesses are tested. In the experimental work, theeffects of fiber density (or fiber mass), thickness and air gap on sound absorption coefficient areexplored. Increment in fiber density showed improvement of sound absorption performance inhigh frequency region. The increase in thickness and application of air gap enhanced the soundabsorption performance, especially at lower frequency region. At thickness of 50 mm, OPEFBfibers with density of 292 kg/m3 showed good sound absorption performance where the soundabsorption coefficient achieved 0.9 in average above 1 kHz. Comparison with industrial acousticrock wool showed that OPEFB fibers possess similar sound absorption performance at the samethickness of 50 mm. Delany-Bazley model is used to validate the experimental work. It is foundthat the mathematical model is able to predict the trend of the sound absorption performance curvewith minor deviation.
1. Introduction
Acoustic absorber is a material used to absorb sound energy. Recently, the utilization of ’green’and sustainable materials as acoustic absorber are expanding in the research sector due to its benefitsover synthetic materials. The conventional acoustic absorbers are made of synthetic materials such asrock wool, glass wool and foam glass, which are harmful to the environment and human’s health [1].
Numerous studies have been done on the natural fibers to explore its potential as sound absorbingmaterials. Those studies include research on bamboo fibers [2], tea-leaf-fibers [3], Arenga Pinnatafibers [4], coir fibers [5, 6], sugarcane fibers [7], paddy fibers [8], date palm fibers [9] and kenaf fibersheets [10]. The findings showed that the sound absorption performance can be improved by increas-ing the fiber density. Enhancement of sound absorption performance, especially at lower frequencyregion can be done by increasing the thickness of the sample and by providing air gap behind thesample. Ersoy and Küçük [3] and Putra et al. [8] discovered that the addition of fabric on the surfaceof the sample can enhance the sound absorption bandwidth and increases the level of absorption (α).Comparison with the synthetic material such as glass wool showed that the fibrous natural materialhas comparable sound absorption performance [8].
1
The 23rd International Congress of Sound and Vibration
Delany and Bazley [11] had developed empirical formulas to predict the sound absorption coeffi-cient of fibrous absorbent materials. The empirical formulas only depend on flow resistance, which isaffected by the bulk density and size of the fiber. Thus, the measurement of sound absorption coeffi-cient can be done with simple lab equipments and requires a short amount of time. Fouladi et al. [6]analyzed the acoustical properties of coir fiber by using two analytical models, namely Delany-Bazleyand Biot-Allard. They found out that Delany-Bazley model is easier to use compared to Biot-Allardmodel, which will be beneficial for the application of natural fibers in the industry.
Conventionally, oil palm empty fruit bunch (OPEFB) fibers are used as fertilizers, mulching ma-terial, reinforcement materials in polymer composites and burning fuel in boilers to supply electricityfor the mill [12, 13]. As the agricultural by-product, the quantity of the OPEFB is still abundant andcausing environmental problems in Malaysia. Thus, due to its abundant quantity and the availabilityof technology to extract the fibers [12], OPEFB fibers can be a good alternative to act as ’green’ andsustainable acoustic absorber. The purposes of this study are to determine the sound absorption per-formance of OPEFB fibers and to discuss the application of Delany-Bazley model in predicting thesound absorption performance of OPEFB fibers, which according to the author’s knowledge has notbeen investigated by other researchers.
2. Methodology
2.1 Experimental Works
2.1.1 Preparation of The Samples
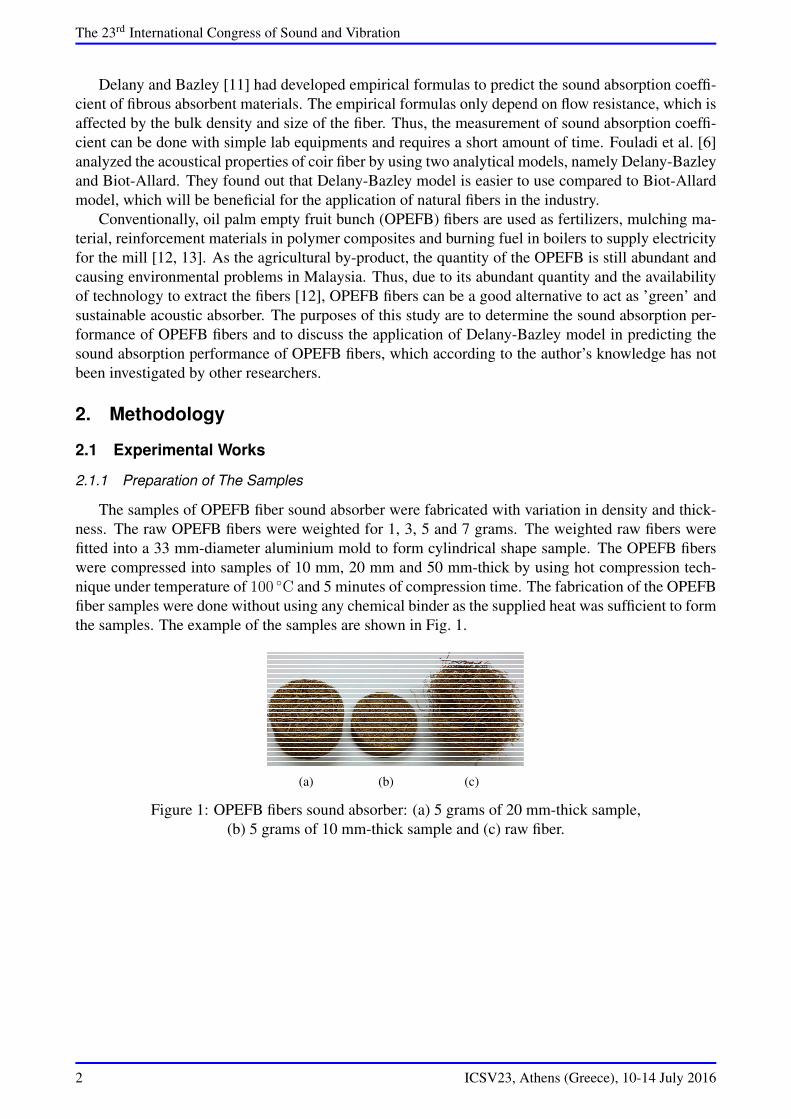
The samples of OPEFB fiber sound absorber were fabricated with variation in density and thick-ness. The raw OPEFB fibers were weighted for 1, 3, 5 and 7 grams. The weighted raw fibers werefitted into a 33 mm-diameter aluminium mold to form cylindrical shape sample. The OPEFB fiberswere compressed into samples of 10 mm, 20 mm and 50 mm-thick by using hot compression tech-nique under temperature of 100 ◦C and 5 minutes of compression time. The fabrication of the OPEFBfiber samples were done without using any chemical binder as the supplied heat was sufficient to formthe samples. The example of the samples are shown in Fig. 1.
(a) (b) (c)
Figure 1: OPEFB fibers sound absorber: (a) 5 grams of 20 mm-thick sample,(b) 5 grams of 10 mm-thick sample and (c) raw fiber.
2 ICSV23, Athens (Greece), 10-14 July 2016
The 23rd International Congress of Sound and Vibration
2.1.2 Experimental Setup
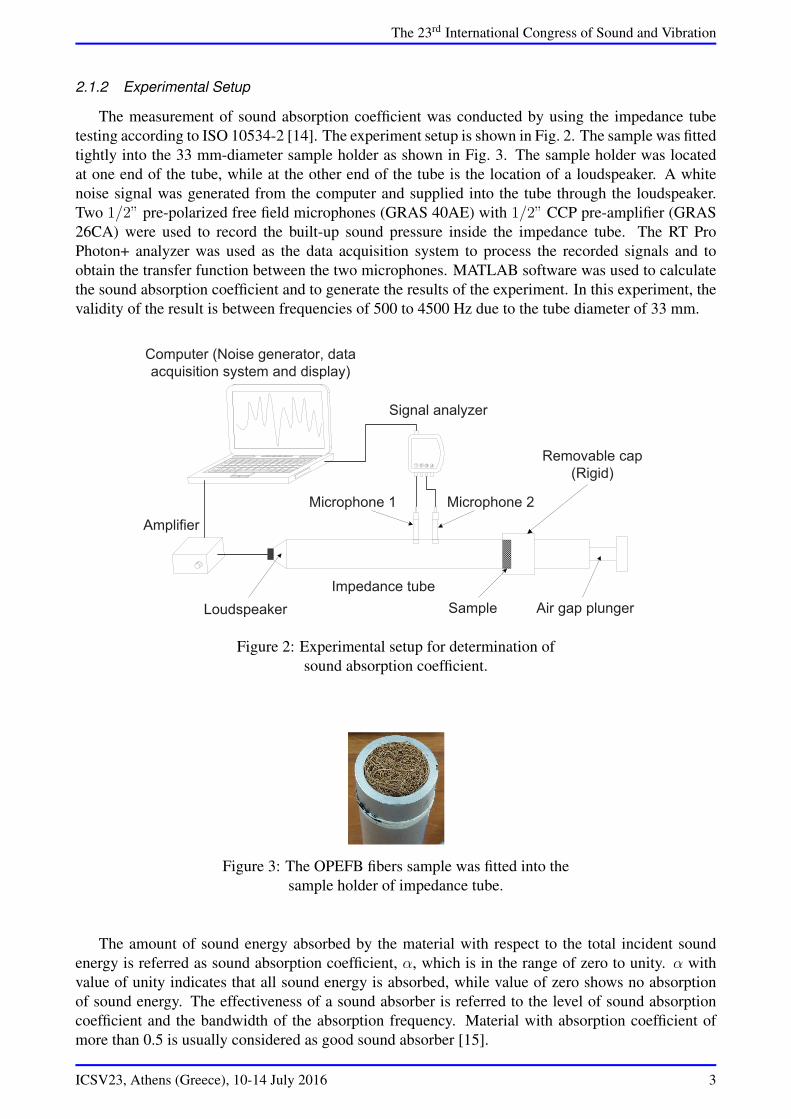
The measurement of sound absorption coefficient was conducted by using the impedance tubetesting according to ISO 10534-2 [14]. The experiment setup is shown in Fig. 2. The sample was fittedtightly into the 33 mm-diameter sample holder as shown in Fig. 3. The sample holder was locatedat one end of the tube, while at the other end of the tube is the location of a loudspeaker. A whitenoise signal was generated from the computer and supplied into the tube through the loudspeaker.Two 1/2” pre-polarized free field microphones (GRAS 40AE) with 1/2” CCP pre-amplifier (GRAS26CA) were used to record the built-up sound pressure inside the impedance tube. The RT ProPhoton+ analyzer was used as the data acquisition system to process the recorded signals and toobtain the transfer function between the two microphones. MATLAB software was used to calculatethe sound absorption coefficient and to generate the results of the experiment. In this experiment, thevalidity of the result is between frequencies of 500 to 4500 Hz due to the tube diameter of 33 mm.
Signal analyzer
Computer (Noise generator, data
acquisition system and display)
Amplifier
Impedance tube
Loudspeaker
Microphone 1 Microphone 2
Sample
Removable cap
(Rigid)
Air gap plunger
Figure 2: Experimental setup for determination ofsound absorption coefficient.
Figure 3: The OPEFB fibers sample was fitted into thesample holder of impedance tube.
The amount of sound energy absorbed by the material with respect to the total incident soundenergy is referred as sound absorption coefficient, α, which is in the range of zero to unity. α withvalue of unity indicates that all sound energy is absorbed, while value of zero shows no absorptionof sound energy. The effectiveness of a sound absorber is referred to the level of sound absorptioncoefficient and the bandwidth of the absorption frequency. Material with absorption coefficient ofmore than 0.5 is usually considered as good sound absorber [15].
ICSV23, Athens (Greece), 10-14 July 2016 3

The 23rd International Congress of Sound and Vibration
2.2 Mathematical Model
In this paper, Delany-Bazley model [6, 11] was studied as the predictive approach to obtain thesound absorption coefficient curve for OPEFB fibers. The characteristic impedance Z0 and propaga-tion constant γ of a layer of homogeneous porous material are shown in Eqs. (1) and (2) [6]. The Z0
and γ are dependent on the frequency of the analysis and flow resistivity of the porous material, i.e.OPEFB fibers.
Z0 = ρ0c0
{[1 + c1
(fρ0σ
)c2]− i
[c3
(fρ0σ
)c4]}(1)
γ = k0
{[c5
(fρ0σ
)c6]− i
[1 + c7
(fρ0σ
)c8]}(2)
where ρ is density of air, c0 is speed of sound, c1-c8 is Delany-Bazley regression constants [11], f isfrequency of sound, σ is flow resistivity and k0 = 2πf/c0 is wave number of air.
The surface acoustic impedanceZ of a rigidly-backed material of thickness t is shown in Eq. (3) [11].
Z = Z0 coth γt (3)
The normal incidence sound absorption coefficient of OPEFB fibers based on Delany-Bazleymodel is shown in Eq. (4) [11], which is derived from Eq. (3).
α = 1−∣∣∣∣∣Z − ρ0c0Z + ρ0c0
∣∣∣∣∣2
(4)
3. Results and Discussion
Figure 4 shows the sound absorption coefficient for 10 mm-thick samples with different densities.The bulk density of the sample is defined as the ratio of mass m of the fiber, over the total volume Vof the cylindrical shape sample given by ρbulk = m/V . At the same thickness of 10 mm, density of351 and 585 kg/m3 shows good sound absorption coefficient where α > 0.5 above 2 kHz, which isa typical frequency range for a fibrous type absorber. From Fig. 4, it can be seen that there is someimprovement in the absorption coefficient as the density or mass of the fibers increases. The increasein density resulted in increase of flow resistivity and tortuosity, which enable more sound waves to beabsorbed. However, excessive amount of fibers can limit the porosity in the sample and thus impacttowards poor sound absorption performance. As shown in Fig. 4, sample with density of 818 kg/m3
shows α < 0.5 for the whole tested frequencies. Similar poor absorption performance can also be seenfrom the curve represented by sample with density of 117 kg/m3. In this case, insufficient amount offibers caused the reduction of the total sound energy to be absorbed.
The results on the effect of thickness can be seen in Fig. 5. Figure 5 shows that the incrementin thickness improves the peak of the absorption coefficient curve and shifts the peak of the curve tothe lower frequency region. This is due to more sound energy can be absorbed across the increasingthickness of the sample via increase of flow resistivity and tortuosity. By shifting from Fig. 5(a) toFig. 5(b), the improvement on the sound absorption performance curves can be seen clearly as widercoverage of absorption coefficient with α > 0.5.
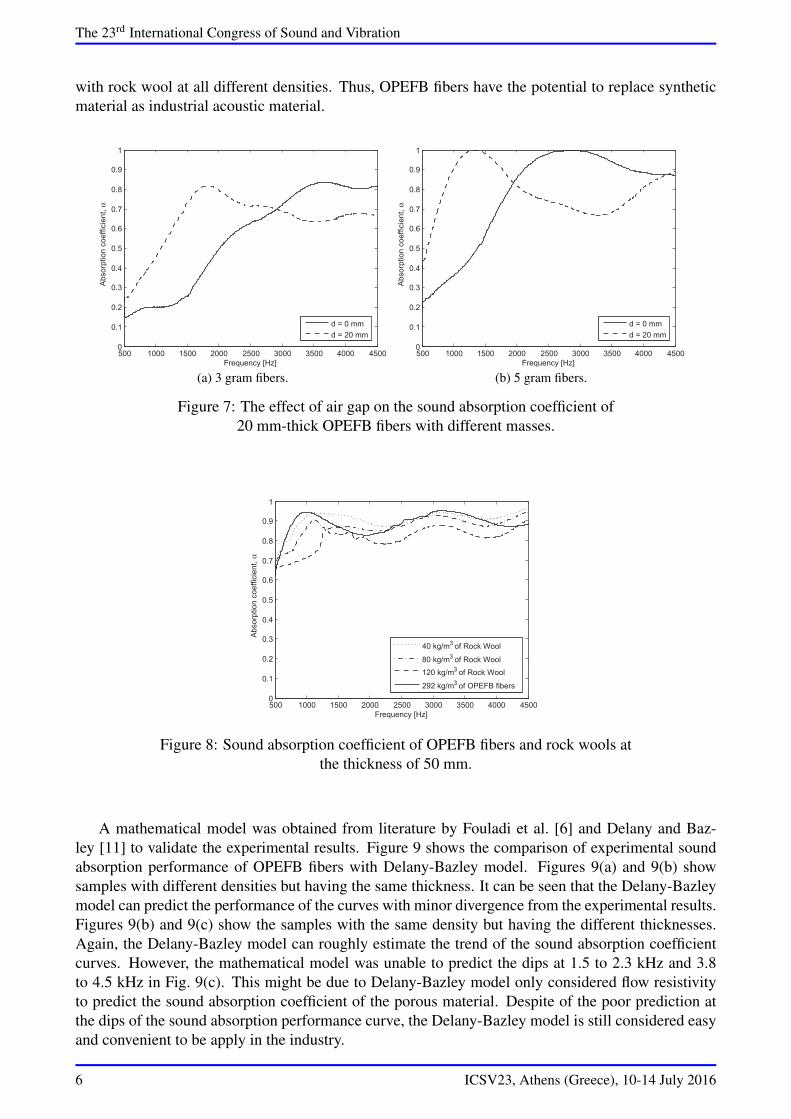
The application of air gap behind the sample can also be used to improve the sound absorptioncoefficient at lower frequency region. Figure 6 illustrates the air gap thickness denoted by d, which isimplemented behind the sample. Figure 7 shows the utilization of air gaps for OPEFB fibers sampleswith same thickness of 20 mm but 2 different masses. It can be observed that air gap shifts thesound absorption coefficient curve to the left or lower frequency region. However, improvement of
4 ICSV23, Athens (Greece), 10-14 July 2016

The 23rd International Congress of Sound and Vibration
500 1000 1500 2000 2500 3000 3500 4000 45000
0.1
0.2
0.3
0.4
0.5
0.6
0.7
0.8
0.9
1
Frequency [Hz]
Absorp
tion c
oeff
icie
nt,
α
117 kg/m3 (1 g)
351 kg/m3 (3 g)
585 kg/m3 (5 g)
818 kg/m3 (7 g)
Figure 4: The sound absorption coefficient of OPEFB fibers withdifferent fiber densities for 10 mm-thick samples.
500 1000 1500 2000 2500 3000 3500 4000 45000
0.1
0.2
0.3
0.4
0.5
0.6
0.7
0.8
0.9
1
Frequency [Hz]
Absorp
tion c
oeff
icie
nt,
α
10 mm
20 mm
(a) 3 gram fibers.
500 1000 1500 2000 2500 3000 3500 4000 45000
0.1
0.2
0.3
0.4
0.5
0.6
0.7
0.8
0.9
1
Frequency [Hz]
Absorp
tion c
oeff
icie
nt,
α
10 mm
20 mm
(b) 5 gram fibers.
Figure 5: The sound absorption coefficient of OPEFB fibers withdifferent masses and thicknesses.
Sample Air gap
Rigid aluminium surface
d Air gap plunger
Figure 6: Illustration of air gap behind the sample in the impedance tube.
sound absorption coefficient at lower frequency region is compromised with the degradation of soundabsorption at higher frequency region.
Sound absorption performance of OPEFB fibers was compared with the industrial synthetic ma-terial, i.e. rock wool. The comparison of the sound absorption coefficient is shown in Fig. 8. Atthe same thickness of 50 mm, the OPEFB fibers have shown similar sound absorption performance
ICSV23, Athens (Greece), 10-14 July 2016 5
The 23rd International Congress of Sound and Vibration
with rock wool at all different densities. Thus, OPEFB fibers have the potential to replace syntheticmaterial as industrial acoustic material.
500 1000 1500 2000 2500 3000 3500 4000 45000
0.1
0.2
0.3
0.4
0.5
0.6
0.7
0.8
0.9
1
Frequency [Hz]
Absorp
tion c
oeff
icie
nt,
α
d = 0 mm
d = 20 mm
(a) 3 gram fibers.
500 1000 1500 2000 2500 3000 3500 4000 45000
0.1
0.2
0.3
0.4
0.5
0.6
0.7
0.8
0.9
1
Frequency [Hz]
Absorp
tion c
oeff
icie
nt,
α
d = 0 mm
d = 20 mm
(b) 5 gram fibers.
Figure 7: The effect of air gap on the sound absorption coefficient of20 mm-thick OPEFB fibers with different masses.
500 1000 1500 2000 2500 3000 3500 4000 45000
0.1
0.2
0.3
0.4
0.5
0.6
0.7
0.8
0.9
1
Frequency [Hz]
Absorp
tion c
oeff
icie
nt,
α
40 kg/m3 of Rock Wool
80 kg/m3 of Rock Wool
120 kg/m3 of Rock Wool
292 kg/m3 of OPEFB fibers
Figure 8: Sound absorption coefficient of OPEFB fibers and rock wools atthe thickness of 50 mm.
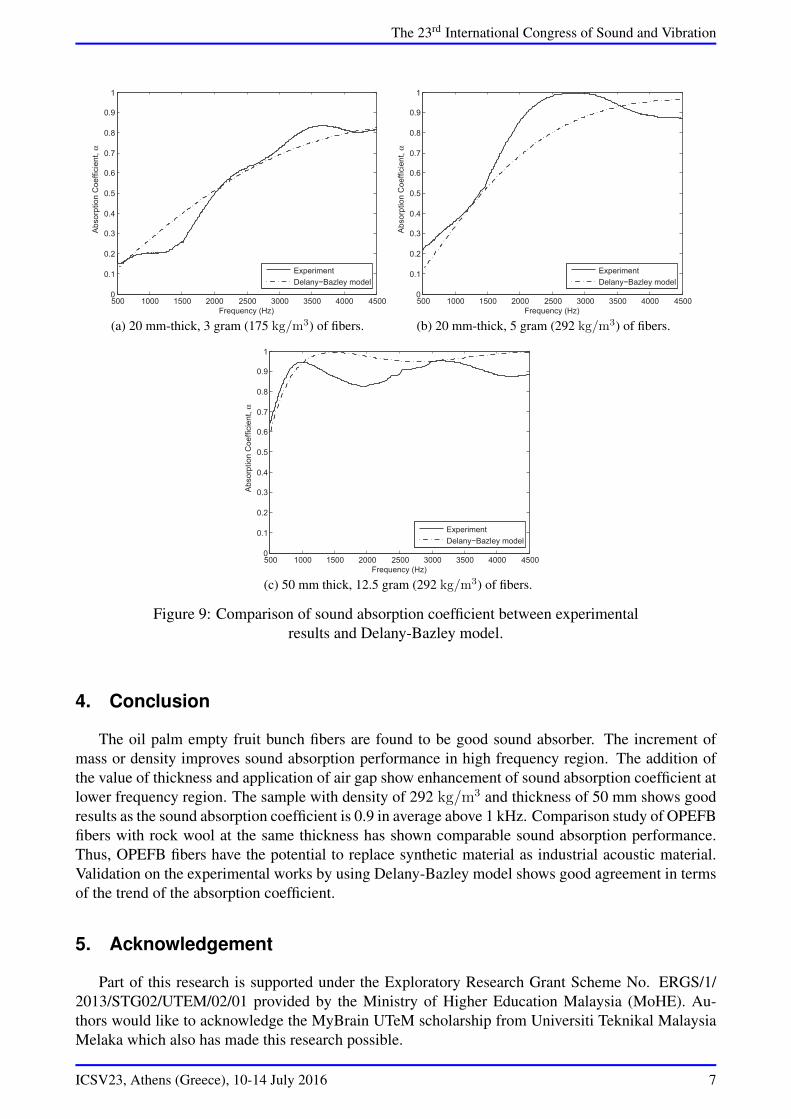
A mathematical model was obtained from literature by Fouladi et al. [6] and Delany and Baz-ley [11] to validate the experimental results. Figure 9 shows the comparison of experimental soundabsorption performance of OPEFB fibers with Delany-Bazley model. Figures 9(a) and 9(b) showsamples with different densities but having the same thickness. It can be seen that the Delany-Bazleymodel can predict the performance of the curves with minor divergence from the experimental results.Figures 9(b) and 9(c) show the samples with the same density but having the different thicknesses.Again, the Delany-Bazley model can roughly estimate the trend of the sound absorption coefficientcurves. However, the mathematical model was unable to predict the dips at 1.5 to 2.3 kHz and 3.8to 4.5 kHz in Fig. 9(c). This might be due to Delany-Bazley model only considered flow resistivityto predict the sound absorption coefficient of the porous material. Despite of the poor prediction atthe dips of the sound absorption performance curve, the Delany-Bazley model is still considered easyand convenient to be apply in the industry.
6 ICSV23, Athens (Greece), 10-14 July 2016
The 23rd International Congress of Sound and Vibration
500 1000 1500 2000 2500 3000 3500 4000 45000
0.1
0.2
0.3
0.4
0.5
0.6
0.7
0.8
0.9
1
Frequency (Hz)
Absorp
tion C
oeff
icie
nt,
α
Experiment
Delany−Bazley model
(a) 20 mm-thick, 3 gram (175 kg/m3) of fibers.
500 1000 1500 2000 2500 3000 3500 4000 45000
0.1
0.2
0.3
0.4
0.5
0.6
0.7
0.8
0.9
1
Frequency (Hz)
Absorp
tion C
oeff
icie
nt,
α
Experiment
Delany−Bazley model
(b) 20 mm-thick, 5 gram (292 kg/m3) of fibers.
500 1000 1500 2000 2500 3000 3500 4000 45000
0.1
0.2
0.3
0.4
0.5
0.6
0.7
0.8
0.9
1
Frequency (Hz)
Absorp
tion C
oeff
icie
nt,
α
Experiment
Delany−Bazley model
(c) 50 mm thick, 12.5 gram (292 kg/m3) of fibers.
Figure 9: Comparison of sound absorption coefficient between experimentalresults and Delany-Bazley model.
4. Conclusion
The oil palm empty fruit bunch fibers are found to be good sound absorber. The increment ofmass or density improves sound absorption performance in high frequency region. The addition ofthe value of thickness and application of air gap show enhancement of sound absorption coefficient atlower frequency region. The sample with density of 292 kg/m3 and thickness of 50 mm shows goodresults as the sound absorption coefficient is 0.9 in average above 1 kHz. Comparison study of OPEFBfibers with rock wool at the same thickness has shown comparable sound absorption performance.Thus, OPEFB fibers have the potential to replace synthetic material as industrial acoustic material.Validation on the experimental works by using Delany-Bazley model shows good agreement in termsof the trend of the absorption coefficient.
5. Acknowledgement
Part of this research is supported under the Exploratory Research Grant Scheme No. ERGS/1/2013/STG02/UTEM/02/01 provided by the Ministry of Higher Education Malaysia (MoHE). Au-thors would like to acknowledge the MyBrain UTeM scholarship from Universiti Teknikal MalaysiaMelaka which also has made this research possible.
ICSV23, Athens (Greece), 10-14 July 2016 7
The 23rd International Congress of Sound and Vibration
REFERENCES
1. Asdrubali, F. Survey on the acoustical properties of new sustainable materials for noise control, Proceed-ings of Euronoise 2006, Tampere, Finland, 30 May-1 June, (2006).
2. Koizumi, T., Tsujiuchi, N. and Adachi, A. The development of sound absorbing materials using naturalbamboo fibers, High performance structures and composites, 4, 157-166, (2002).
3. Ersoy, S. and Küçük, H. Investigation of industrial tea-leaf-fibre waste material for its sound absorptionproperties, Applied Acoustics, 70 (1), 215-220, (2009).
4. Ismail, L., Ghazali, M.I., Mahzan, S. and Zaidi, A.M.A. Sound absorption of Arenga Pinnata natural fiber,World Academy of Science, Engineering and Technology, 67, 804-806, (2010).
5. Fouladi, M.H., Nor, M.J.M., Ayub, M. and Leman, Z.A. Utilization of coir fiber in multilayer acousticabsorption panel, Applied Acoustics, 71 (3), 241-249, (2010).
6. Fouladi, M.H., Ayub, M. and Nor, M.J.M. Analysis of coir fiber acoustical characteristics, Applied Acous-tics, 72 (1), 35-42, (2011).
7. Putra, A., Abdullah, Y., Efendy, H., Farid, W.M., Ayob, M.R. and Py, M.S. Utilizing sugarcane wastedfibers as a sustainable acoustic absorber, Procedia Engineering, 53 (1), 632-638, (2013).
8. Putra, A., Abdullah, Y., Efendy, H., Mohamad, W.M.F.W. and Salleh, N.L. Biomass from paddy wastefibers as sustainable acoustic material, Advances in Acoustics and Vibration, 2013, 1-7, (2013).
9. Al-Rahman, L.A., Raja, R.I., Rahman, R.A. and Ibrahim, Z. Comparison of acoustic characteristics of datepalm fibre and oil palm fibre, Research Journal of Applied Sciences, Engineering and Technology, 7 (8),1656-1661, (2014).
10. Lim, Z.Y., Putra, A., Nor, M.J.M. and Yaakob, M.Y. Preliminary study on sound absorption of natural kenaffiber, Proceedings of Mechanical Engineering Research Day 2015: MERD’15, 95-96, March, (2015).
11. Delany, M.E. and Bazley, E.N. Acoustical properties of fibrous absorbent materials, Applied Acoustics,3 (2), 105-116, (1970).
12. Shinoj, S., Visvanathan, R., Panigrahi, S. and Kochubabu, M. Oil palm fiber (OPF) and its composites: Areview, Industrial Crops and Products, 33 (1), 7-22, (2011).
13. Mahjoub, R., Bin Mohamad Yatim, J. and Mohd Sam, A.R. A review of structural performance of oil palmempty fruit bunch fiber in polymer composites, Advances in Materials Science and Engineering, 2013,1-9, (2013).
14. BS EN ISO 10534-2:2001. Acoustics - Determination of sound absorption coefficient and impedance inimpedance tubes - Part 2: Transfer-function method, ISO 10534-2, (2001).
15. Maa, D.Y. Theory and design of microperforated panel sound-absorbing constructions, Scientia Sinica,18 (1), (1975).
8 ICSV23, Athens (Greece), 10-14 July 2016