research article a fault diagnosis approach for gas...
TRANSCRIPT
Research ArticleA Fault Diagnosis Approach for Gas Turbine ExhaustGas Temperature Based on Fuzzy C-Means Clustering andSupport Vector Machine
Zhi-tao Wang1 Ning-bo Zhao1 Wei-ying Wang12 Rui Tang2 and Shu-ying Li1
1College of Power and Energy Engineering Harbin Engineering University Harbin 150001 China2Harbin Marine Boiler amp Turbine Research Institute Harbin 150078 China
Correspondence should be addressed to Ning-bo Zhao zhaoningbo314126com
Received 16 October 2014 Revised 26 November 2014 Accepted 27 November 2014
Academic Editor Enrico Zio
Copyright copy 2015 Zhi-tao Wang et al This is an open access article distributed under the Creative Commons Attribution Licensewhich permits unrestricted use distribution and reproduction in any medium provided the original work is properly cited
As an important gas path performance parameter of gas turbine exhaust gas temperature (EGT) can represent the thermal healthcondition of gas turbine In order to monitor and diagnose the EGT effectively a fusion approach based on fuzzy C-means (FCM)clustering algorithm and support vectormachine (SVM) classificationmodel is proposed in this paper Considering the distributioncharacteristics of gas turbine EGT FCM clustering algorithm is used to realize clustering analysis and obtain the state pattern onthe basis of which the preclassification of EGT is completedThen SVMmulticlassification model is designed to carry out the statepattern recognition and fault diagnosis As an example the historical monitoring data of EGT from an industrial gas turbine isanalyzed and used to verify the performance of the fusion fault diagnosis approach presented in this paperThe results show that thisapproach canmake full use of the unsupervised feature extraction ability of FCM clustering algorithm and the sample classificationgeneralization properties of SVMmulticlassificationmodel which offers an effective way to realize the online condition recognitionand fault diagnosis of gas turbine EGT
1 Introduction
With the development of high efficiency and clean energygas turbine plays an increasingly significant role in dif-ferent domains such as aviation and marine propulsionsystems electric power stations and natural gas transporta-tion petroleum [1] With the increasing demand of securityoperation for gas turbine the traditional regularmaintenancetechnology has been unable to fully keep up with the actualdemand and gas turbine health management technologyhas gradually become one of the most problems concernedby researchers and users in recent years [2] In order toguarantee the gas turbine to run efficiently under the safereliable condition many sensors are often used to monitorthe health state of gas turbine in the practical applicationMassive amounts of data gathered by these sensors areeasy to make difficulties in data analysis and affect themaintenance decision Therefore the choices of appropriatemonitor parameters signal processing methods and data
mining techniques are very important to realize the healthmanagement of gas turbine
Exhaust gas temperature (EGT) is an important gas pathperformance parameter of gas turbine which can representthe thermal health condition of gas turbine [3 4] Consid-ering the characteristics of different gas path performancemonitoring parameters the multiple linear regression mod-els for analyzing the relationship between EGT and otherparameters were established by Song et al [5] Their resultsshowed that there were strong linear correlations betweendifferent gas path performance parameters and all the lowturbine outlet pressure high rotational speed high pressurecompressor outlet temperature low rotational speed andhigh pressure compressor outlet pressure could be reflectedthrough the change of EGT Yilmaz [6] also found thesimilar results by analyzing the relationship between EGTand other engine operational parameters at two differentpower settings includingmaximum continuous and take-offin the CFM56-7B turbofan engine Hence EGT is often used
Hindawi Publishing CorporationMathematical Problems in EngineeringVolume 2015 Article ID 240267 11 pageshttpdxdoiorg1011552015240267
2 Mathematical Problems in Engineering
as an important parameter to evaluate the health state of gasturbine and determine the maintenance policy [7]
In the past half century different methods have beendeveloped to monitor and diagnose the EGT of gas tur-bine Wang and Yang [8] analyzed many faults of PG6551Bindustrial gas turbine such as turbine ablation combustioncomponent and fuel system failure They found that theuniformity of EGT could effectively reflect the feature ofabove fault Chen et al [9] proposed a general regres-sion neural network (GRNN) approach to construct anautodetection network for EGT sensors on the basis thatthey also studied the optimizing design of network anderror controlling and developed the method of thresholdfor sensor detection Based on the advantage of artificialneural networks (ANN) Muthuraman et al [10] devel-oped an autoassociative neural network approach to detectcombustor-related damage bymonitoring EGT Błachnio andPawlak [11] established a nonlinear observer and chose EGTas the important parameter to evaluate the health state ofturbine blades Korczewski [12ndash14] analyzed the change rulesof EGT for a naval gas turbine engine under steady andunsteady operation conduction in detail And they proposedan effective approach for detecting and evaluating the failuresof the flow section and supply system of gas turbine byusing EGT Kenyon et al [15] developed an intelligent systemfor detection of EGT anomalies in gas turbines by usingthe strong nonlinear mapping ability of ANN Consideringthe characteristics of gas turbine operation control basedon thermocouple measured exhaust temperatures Xia et al[16] discussed the application of Fiber-Bragg-grating-basedsensing technology in the EGT measuring of gas turbineTheir results demonstrated that the fiber sensing method wasmore valuable for the monitoring and fault diagnosis of gasturbine because it could well reflect the changing of EGTIn order to increase the operational availability of industrialgas turbines Yang et al [17] presented a generalization ofmultidimensional linear regression to facilitate multisensorfault detection and signal reconstruction through the useof analytical optimization Gulen et al [18] discussed therelationship between EGT and other gas turbine performanceparameters on the basis of which an important diagnosticparameter named profile factor that was the ratio of themaximum exhaust thermocouple and the average of allexhaust temperature thermocouples was used to evaluate theperformance of combustor and the whole gas turbine in theirpaper
From the reviews discussed above it is noted that theaverage EGT is often used to evaluate the health state ofgas turbine in most researches However it may be moreimportant and valuable to extract the relationship amongdifferent EGT sensors in order to realize condition moni-tor and fault diagnosis of gas turbine effectively Althoughmany studies have presented the effects of EGT distributioncharacteristics on health state of gas turbine or its hotsections and many analyses were discussed in detail therewas still a lack of systematic research in the area of onlineautomatic identification and fault diagnosis for gas turbineEGT Besides EGT can be affected by many uncertain factorsin the practical applications which make it difficult to realize
fault diagnosis quickly by using traditional model-drivenapproachTherefore it is very useful to develop a data-drivenapproach based on artificial intelligence technology in orderto improve fault diagnosis accuracy
The fault diagnosis of gas turbine EGT based on data-driven approach essentially is the cluster and classificationof fault information In the concrete implementation processthe training samples including normal and fault informationneed to be obtained firstly Then the fault diagnosis modelbased on artificial intelligence algorithm can be establishedand trained by using training samples The feature informa-tion collected from sensors will be inputted to thewell trainedfault diagnosis model and we can get the diagnostic resultsfinally Obviously the establishment of fault information fea-tures space and design of artificial intelligence algorithm aretwo key steps to realize accurate fault diagnosis of gas turbineEGT As mentioned above many specific state patterns orfault types of gas turbine EGT cannot be determined directlybased on experience in the practical applications due tothe effects of many uncertain factors Besides enough priorknowledge including specific fault types is indispensable forthe supervised artificial intelligence algorithms (such as ANN[19] and SVM [20])
Considering the distribution characteristics of gas turbineEGT and the deficiencies of present literatures a fusionapproach based on FCM clustering algorithm and SVMclassification model (FCM-SVM) is proposed in this paperFirstly FCM clustering algorithm is used to realize clusteringanalysis and obtain the state patterns of EGT which meansthat the preclassification of EGT is completed Then SVMmulticlassification model is designed to carry out the statepattern recognition and fault diagnosis of EGT As an exam-ple the historical monitoring data of EGT from an industrialgas turbine is analyzed to verify the effectiveness of the FCM-SVM approach finally
The rest of this paper is organized as follows In Section 2the distribution characteristics of gas turbine EGT aredescribed briefly Section 3 introduces the basic theory ofFCM clustering algorithm and SVM classification model indetail The fusion fault diagnosis approach which combinesFCM clustering with SVM is discussed in Section 4 Appli-cation examples and discussion are included in Section 5Finally Section 6 presents some conclusions
2 Signal Feature of Gas Turbine EGTAs mentioned above it is very important to choose theappropriate measured parameters to monitor and diagnosethe health state of gas turbine Gas path and vibration param-eters are two main types in the practical applications [2 21]Theoretically as the most important gas path performanceparameter for gas turbine the outlet temperature of com-bustor chamber can not only affect the overall performanceof engine but also directly determine the ultimate strengthof turbine blade For example the creep life of hot channelcomponents can reduce the order of magnitude when theoutlet temperature of combustor chamber increases 50∘C [4]which may cause major fault and incur great maintenancecostsHowever the outlet temperature of combustor chamber
Mathematical Problems in Engineering 3
200
400
600
0
30
6090
120
150
180
210
240270
300
330
0
200
400
600
EGT (normal)Average EGT
Minimum EGTMaximum EGT
Tem
pera
ture
(∘C)
Figure 1 EGT profile of gas turbine with normal condition
0
200
400
600
0
30
6090
120
150
180
210
240270
300
330
200
400
600
Tem
pera
ture
(∘C)
EGT (fault)Average EGT
Minimum EGTMaximum EGT
Figure 2 EGT profile of gas turbine with fault condition
is usually so high that it cannot bemeasured directly by usingconventional sensors According to the well-defined Bray-ton thermodynamic cycle there is a consistent relationshipbetween the outlet temperature of combustor chamber andEGT Therefore EGT as a measured parameter is often usedfor gas engine control condition monitoring fault diagnosisand maintenance decisions
Comparedwith the average EGT EGT profile can containmore information about the health state of gas turbineFigures 1 and 2 show two EGT profiles with the same average
EGT of an industrial gas turbine that has 12 EGT sensorsFrom Figures 1 and 2 it is easy to see that the EGT profiles ofnormal and fault condition are different although the averageEGT are the same This means that the fault informationis incorrect or incomplete if only the average EGT is usedto monitor the health state of gas turbine Besides Figures1 and 2 also show that all the sensors should give similaroutputs when gas turbine operates in normal condition Ifthe component of gas turbine is failure different temperatureswill be observed Therefore the uniformity of EGT can moreeffectively reflect the health state of gas turbine especially forsteady state condition
In order to quantitatively describe the uniformity of EGTMao [22] presented three indexes which can be calculated bythe following functions Assume that there are 119899 sensors andtheir original outputs are 119879
119894 119894 = 1 119899 respectively
1198671= 1198791015840
1
minus 1198791015840
119899
1198672= 1198791015840
1
minus 1198791015840
119899minus1
1198673= 1198791015840
1
minus 1198791015840
119899minus2
(1)
where 1198791015840119894
is the transform value of 119879119894and 1198791015840
1
gt 1198791015840
2
gt sdot sdot sdot gt
1198791015840
119899minus2
gt 1198791015840
119899minus1
gt 1198791015840
119899
According to above indexes it is obvious that all the
values of 1198671 1198672 and 119867
3are smaller when gas turbine
operates in normal condition If a sensor fails it usuallycauses 119867
1or three indexes to increase But the values of 119867
1
and 1198672or all three indexes can increase due to hot sections
failure However it is worth pointing out that the aboveindexes only consider 4 EGT and others are ignored Besidesit is difficult to diagnose the specific cause of failure when thesensor is fault because the above indexes ignore the adjacentinformation between different sensors Therefore there aresome limitations to evaluate the uniformity of EGTonly usingthe above three indexes In order to solve this problem all themeasured EGT are used to realize cluster and fault diagnosisin this paper
3 Basic Theory
31 Fuzzy C-Means Clustering Algorithm As an unsuper-vised machine learning method FCM clustering algorithmwas improved by Bezdek [23] in 1981 in order to solve thehard clustering problem by using fuzzy set theory In theFCM clustering algorithm membership degree function isused to indicate the extent to which each data point belongsto each cluster and this information is also used to updatethe values of cluster centers [24] Based on the conceptof fuzzy C-partition FCM clustering algorithm has beenapplied successfully in a wide variety of applications such asimage segmentation [25] data mining [26] thermal systemmonitoring [27] and fault diagnosis [28]
For the sample set119883 = 1199091 1199092 119909
119899 the object of FCM
clustering algorithm is to divide the sample set into 119888 groups
4 Mathematical Problems in Engineering
and obtain the cluster centers by minimizing the followingdissimilarity function [29]
min 119869119898(119880 119881) =
119888
sum
119894=1
119899
sum
119896=1
119906119898
119894119896
1198892
119894119896
(2)
where 119898 is the fuzzy weighting parameter varying in therange [1infin] The bigger the 119898 the more fuzzy the finalcluster result 119880 is fuzzy partition matrix 119881 is cluster centermatrix and 119899 and 119888 are the number of samples and clustercenters respectively 119906
119894119896is the fuzzy membership degree of
the 119896th sample in the 119894th cluster and it should be meeting thefollowing three constraints [30]
119906119894119896isin [0 1] 1 le 119894 le 119888 1 le 119896 le 119899
119888
sum
119894=1
119906119894119896= 1 1 le 119896 le 119899
119899
sum
119896=1
119906119894119896isin (0 119899) 1 le 119894 le 119888
(3)
For the distance 119889119894119896between 119896th sample 119909
119896and the centre
of 119894th cluster 119881119894 it can be calculated by using Euclidean
distance as follows
119889119894119896=1003817100381710038171003817119909119896minus 119881119894
1003817100381710038171003817= radic
119898
sum
119895=1
(119909119896119895minus 119881119894119895)
2
1 le 119894 le 119888 1 le 119896 le 119899
(4)
119881119894119895can be calculated by utilizing the following formula-
tion
119881119894119895=
sum119899
119896=1
119906119898
119894119896
119909119896119895
sum119899
119896=1
119906119898
119894119896
1 le 119894 le 119888 1 le 119895 le 119898 (5)
In essence fuzzy cluster is performed through an iterativeoptimization by updating fuzzy membership degree [29]
119906(119904+1)
119894119896
=
1
sum119888
119895=1
(119889(119904)
119894119896
119889(119904)
119895119896
)
2(119898minus1)
1 le 119894 le 119888 1 le 119896 le 119899
(6)
where 119904 is the iterative stepWhen the below requirement ismet we can stop iteration
and obtain the cluster result10038171003817100381710038171003817119880(119904+1)
minus 119880(119904)10038171003817100381710038171003817le 120576 (7)
where 120576 is the iterative threshold in the range [0 1]Based on above method the cluster process of FCM
clustering algorithm is virtually to determine the fuzzymembership degree and cluster centers through continuousiteration which is shown in Figure 3
32 Support Vector Machine Classification Model Comparedwith the conventional classifiers support vector machine(SVM) developed by Vapnik [31] can effectively solve theclassification problem by implementing the structure risk
Start
No
Yes
Compute Euclidean distance
Output cluster result
Give iterative threshold and initializefuzzy partition matrix randomly U(0)
Calculate the cluster center matrix V
Update fuzzy partition matrix U(s+1)
U(s+1) minus U(s) le 120576
s = s + 1
Figure 3 Calculation flowchart of fuzzy C-means clustering algo-rithm
Original space Higher dimensional feature space
120593(x)
Figure 4 Classification of two classes using SVM
minimization based on statistical learning theory NowadaysSVM has been widely and successfully applied to detectionand diagnosis of machine conditions due to its high accuracyand good generalization for a smaller number of samples[32 33]
SVM is initially used to deal with binary classificationproblems Its core idea is to transform the sample datafrom original space to a higher dimensional feature spacethrough some nonlinear mapping functions and then findthe optimal separating hyperplane in this feature space torealize linear classification Figure 4 shows the classificationprinciple based on SVM for the nonlinear classificationproblem
For the nonlinear training sample data set including twoclasses 119909
119894 119910119894 119894 = 1 2 119899 119909 isin 119877
119899 119910 isin minus1 +1 119899is the number of samples The nonlinear mapping function120593(119909) will be used to transform the sample data from originalspace to a higher dimensional feature space and the optimal
Mathematical Problems in Engineering 5
separating hyperplane can be constructed to maximize themargin between the two classes by the following linearfunction
119891 (119909) = [120596 sdot 120593 (119909)] + 119887 (8)
where 120596 is the normal vector of optimal separating hyper-plane and 119887 is a scalar
In essence the solution of optimal separating hyperplaneis the corresponding constraint optimization problem
min 1
2
1205962
+ 119862
119899
sum
119894=1
120577119894
st 119910119894[120596 sdot 120593 (119909
119894) + 119887] + 120577
119894ge 1 1 le 119894 le 119899
120577119894ge 0 1 le 119894 le 119899
(9)
where 119862 is the penalty factor that can realize the trade-offbetween empirical risk and confidence interval 120577
119894is slack
factorCombining the method of Lagrange multipliers the
above convex optimization problem can be simplified into thedual quadratic optimization problem
max 119871 (119886) =
119899
sum
119894=1
119886119894minus
1
2
119899
sum
119894119895=1
119886119894119886119895119910119894119910119895120593 (119909119894) sdot 120593 (119909
119895)
st 119886119894ge 0 1 le 119894 le 119899
119899
sum
119894=1
119886119894119910119894= 0
(10)
where 119886 is Lagrangian multiplierThen the nonlinear decision function is described as
119891 (119909) = sign(119899
sum
119894119895=1
119886119894119910119894(120593 (119909119894) sdot 120593 (119909
119895)) + 119887) (11)
In order to calculate the value of 120593(119909119894) sdot 120593(119909
119895) the kernel
function 119870(119909119894 119909119895) is used and the above function can be
expressed as
119891 (119909) = sign(119899
sum
119894119895=1
119886119894119910119894119870(119909119894 119909119895) + 119887) (12)
For the SVM there are many kinds of kernel functionsuch as linear kernel polynomial kernel polynomial kerneland radial basis function (RBF) kernel Compared with otherkernel functions the RBF kernel can obtain the higherclassification accuracy in many practical applications [34]Therefore the RBF kernel is used in this study
As previously mentioned SVM is initially designed forbinary classification However there are often many faults inthe practical applications which mean that it is necessary todevelop a method to deal with a multiclassification problemCurrently different methods have been developed for themulticlassification based on SVM such as ldquoone-against-onerdquoldquoone-against-allrdquo and directed acyclic graph (DAG) Accord-ing to the comparison results obtained by Hsu and Lin [35]
the ldquoone-against-onerdquo method is more suitable for practicaluse than other methods For the sample set including 119888 class119888(119888 minus 1)2 SVM classifiers can be constructed by using ldquoone-against-onerdquo method and every SVM classifier is trained
4 Fusion Fault Diagnosis Modeling of EGTBased on FCM-SVM Approach
As the supervised artificial intelligencemethod enough priorknowledge including specific fault types is necessary for SVMclassification model However the fault types of gas turbineEGT cannot be determined directly based on experiencein the practical applications due to the effects of manyuncertain factors In order to achieve the automatic monitorand diagnosis of EGT effectively a fusion approach basedon FCM clustering algorithm and SVM classification model(FCM-SVM) is proposed Firstly FCM clustering algorithmis used to realize clustering analysis and obtain the statepatterns which means that the preclassification of EGT iscompleted Then SVMmulticlassification model is designedand used to carry out the online state pattern recognition andfault diagnosis of gas turbine EGT
Figure 5 shows the fusion fault diagnosis framework ofgas turbine EGT based on FCM-SVM approachThe detailedmodeling processes are as follows
Step 1 Generated sufficient EGT samples from the historicaldatabase and the essential preprocessing upon EGT data arecarried out before data analysis such as supplementary dataeliminating noise and outliers
Step 2 According to the cluster process which is shown inFigure 3 FCM clustering algorithm is used to obtain theinitial clustering results of gas turbine EGT
Step 3 Cluster validity index 120582(119888) is used to evaluate thevalidity of clustering and determine the number of clustersThe 119888 is optimum when 120582(119888) reaches its maximum value
120582 (119888) =
sum119888
119894=1
(sum119899
119896=1
119906119898
119894119896
)1003817100381710038171003817119881119894minus 119909
1003817100381710038171003817
2
(119888 minus 1)
sum119888
119894=1
sum119899
119896=1
119906119898
119894119896
1003817100381710038171003817119909119896minus 119881119894
1003817100381710038171003817
2
(119899 minus 119888)
(13)
119909 =
sum119888
119894=1
sum119899
119896=1
119906119898
119894119896
119909119896
119899
(14)
Step 4 After obtaining the optimal clustering results the faultdiagnosis sample set including specific fault types can beestablished
Step 5 SVMmulticlassificationmodel will be designed basedon ldquoone-against-onerdquo method and trained by using faultdiagnosis sample set
Step 6 Themeasured EGT obtained from real gas turbine arepreprocessed and inputted to the well trained SVMmulticlas-sification model Then we can get the final diagnostic results
Step 7 The measured EGT also are stored into the historicaldatabase and used for later analysis
6 Mathematical Problems in Engineering
Data preprocessed
Clustering analysis based on FCM clustering algorithm
Establish fault diagnosissample set
Historical database
Adjust clustering number
SVM classifier 1
Comprehensive evaluation
SVM classifier 2
SVM classifier N
Output result
Initial clustering number
Online measured EGT
Optimal clustering
Evaluate cluster validity index
Yes
No
EGT state pattern extraction based on FCM clustering algorithm
Well trained SVM multi-classification model
EGT fault diagnosis based on SVM multi-classification model
Data preprocessed
Figure 5 Fusion fault diagnosis framework of gas turbine EGT based on FCM-SVM approach
5 Case Study and Discussions
In order to demonstrate the effectiveness of FCM-SVMapproach introduced in this paper the historical monitoringdata of EGT from one industrial single shaft gas turbine willbe analyzed as a case study in this section
51 Sample Data As an industrial single shaft gas turbineTaurus70 is made in solar turbines incorporated and used forpower generation 12 thermocouple temperature sensors areused tomeasure the EGT and the average EGT is about 505∘Cwhen gas turbine operates in a normal state
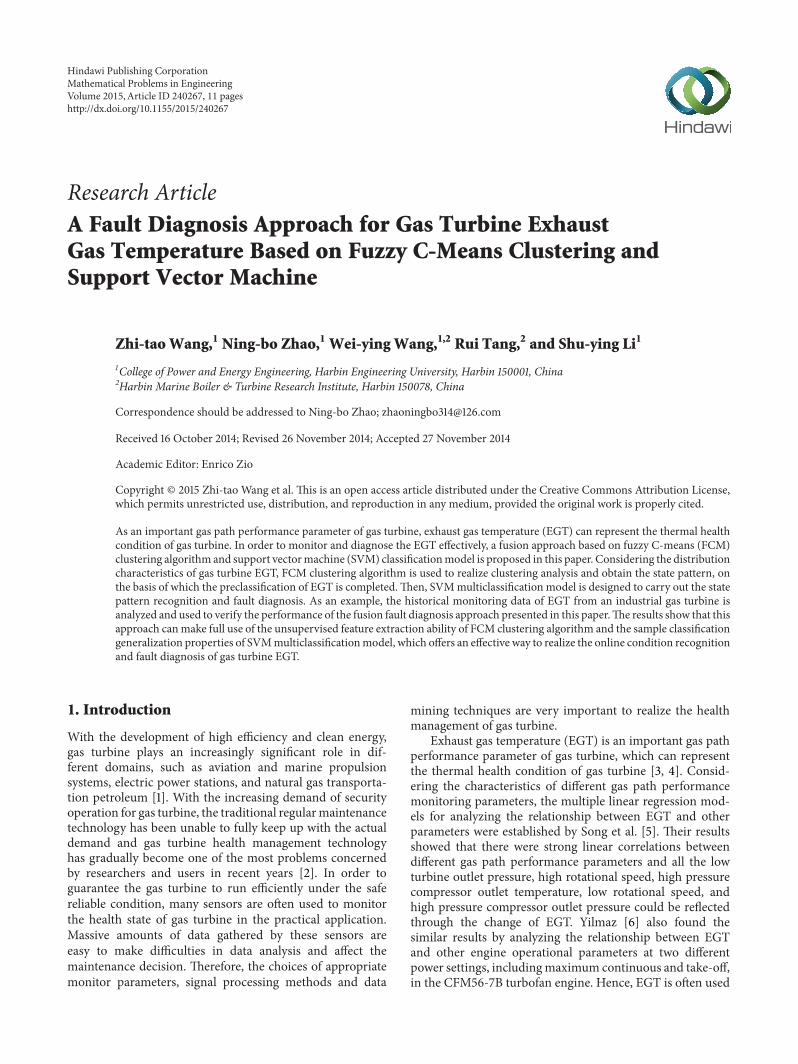
Figure 6 shows the changing curves of 12 EGT varyingwith time under normal running state of gas turbine Andthe EGT profiles can be seen in Figure 7 From Figures 6and 7 it is clear that there is significant difference betweenthe measured outputs of different thermocouple temperature
sensors at the same time evenwhen the gas turbine is runningin a normal state Therefore much feature information willbe ignored which can decrease the fault diagnosis accuracyif only the average EGT is used to evaluate and analyse thehealth state of EGT Considering the operating conditionsof gas turbine 490-group data including 4 classes are takento establish the original sample set 470 samples are selectedrandomly as training samples and the remaining 20 samplesare selected as testing samples
52 Optimal Clustering of EGTBased on FCMClusteringAlgo-rithm For the FCMclustering algorithm it is very importantto determine an appropriate number of clusters which iscalled cluster validity problem In this study the clusternumber is decided automatically by using the introducedcluster validity index which is shown in (13) Consideringthe computation complexity and accuracy the scope of the
Mathematical Problems in Engineering 7
0 50 100 150 200 250 300 350 400460
470
480
490
500
510
520
530
Time (min)
Average EGT
Tem
pera
ture
(∘C)
EGT 1
EGT 2
EGT 3
EGT 4
EGT 5
EGT 6
EGT 7
EGT 8
EGT 9
EGT 10
EGT 11
EGT 12
Figure 6 Real-time measured EGT curve of gas turbine withnormal condition
0
200
400
600
0
30
6090
120
150
180
210
240270
300
330
200
400
600
Measured EGT
Tem
pera
ture
(∘C)
Average EGTMinimum EGTMaximum EGT
Figure 7 Real-time measured EGT profile of gas turbine withnormal condition
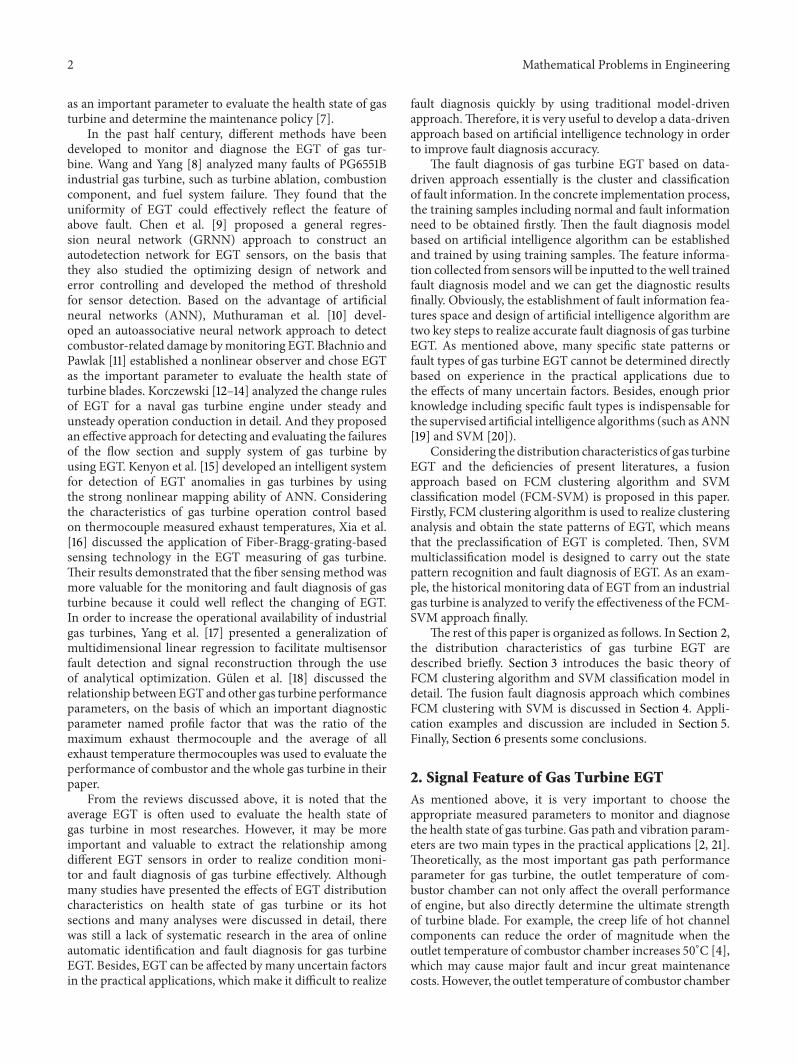
number of clusters is commonly [2 radic119899] in practical processand 119899 is the number of samples For the 470 training samplesshown in Table 1 the FCM clustering algorithm can stepwiseiterate from 2 to 21 clusters Figure 8 shows the changingtrends of cluster validity index 120582(119888) as a function of thenumber of clusters Based on the result shown in Figure 8 itis clear that 120582(119888) increases at first and then drops down with
0 4 8 12 16 20 24
0
2
4
6
The number of clusters
Clus
ter v
alid
ity in
dextimes10
minus6
Figure 8 The effect of the number of clusters on cluster validityindex 120582(119888)
0 100 200 300 400 500 60020
40
60
80
100
120
140
F1 classF2 class
F3 classF4 class
H1 (∘C)
H2
(∘C)
Figure 9 Graphic clustering result by using1198671
and1198672
the increases of the number of clusters And 120582(119888) can reachits maximum value when the number of clusters is 4 whichis in agreement with the real samples class Therefore it isconcluded that the FCM clustering algorithm is suitable foroptimal clustering of gas turbine EGT
Considering the high dimension characteristics of sam-ples it is difficult to realize graphical analysis directly Inthis paper three temperature uniformity indexes describedby Mao [22] are used to further analyze and evaluate thecluster results of gas turbine EGT by using graphic approachFigures 9ndash11 show the cluster results of gas turbine EGT basedon FCM clustering algorithm It may be clearly observed inFigures 9ndash11 that all the three temperature uniformity indexesof F1 class are relatively small (0∘C le 119867
1le 30∘C 0∘C le
1198672le 30∘C and 0∘C le 119867
3le 30∘C) This means that 12 ther-
mocouple temperature sensors give the almost same outputs
8 Mathematical Problems in Engineering
Table 1 The original sample set of gas turbine EGT
Number 1198791∘C 1198792∘C 1198793∘C 1198794∘C 1198795∘C 1198796∘C 1198797∘C 1198798∘C 1198799∘C 11987910∘C 11987911∘C 11987912∘C1 4936847 5193781 5102112 5217342 4881656 4713032 4755255 493422 4868506 513879 5183308 51492662 4978859 5243516 513879 52409 493422 4755255 4800065 4978859 489743 5175453 523043 51911633 4963108 521996 5123073 52409 4905316 473151 4789526 4970984 4881656 5157123 5209489 51675984 5002478 5246133 513355 5269688 4936847 4771075 4818502 499723 4918456 5191163 523043 52068715 4978859 5217342 5117833 5227812 4913201 4739427 4786891 4965733 4889544 5159742 5206871 51675986 499723 5248751 5141408 5264454 49421 4763166 4813235 4991981 4921084 5188545 5238282 52016357 4957857 5206871 5123073 5233047 4907945 4734149 4778983 4952605 4889544 5141408 5209489 51675988 4994606 5251368 5130931 5264454 493422 4760529 4815869 4984109 4915829 518069 5225195 51937819 4965733 523043 513355 52409 4918456 4755255 4805334 4978859 4892173 5172835 5217342 51806910 4978859 523043 513879 5251368 4926339 4752617 4805334 4976234 4902688 5172835 5235664 5199018
486 4986733 5253986 5149266 525922 4939474 4763166 4821135 4981484 4905316 5185927 5227812 5191163487 4986733 5235664 5149266 5267071 4931593 4765803 4821135 4976234 4907945 5185927 523043 51964488 4986733 523043 5125692 5248751 4926339 4757892 4800065 4970984 4889544 518069 5217342 518069489 4984109 5225195 5130931 52409 4918456 4749979 4802699 4973609 4894802 5170217 5212107 5188545490 4994606 5233047 5146647 5256602 4926339 4757892 4810601 4981484 4910573 5170217 5217342 5199018
0 100 200 300 400 500 600
20
40
60
80
100
120
140
H1 (∘C)
H3
(∘C)
F1 classF2 class
F3 classF4 class
Figure 10 Graphic clustering result by using1198671
and1198673
which belongs to normal state Compared with F1 class F2class has the following characteristics 40∘C le 119867
1le 70∘C
30∘C le 119867
2le 45
∘C and 30∘C le 119867
3le 45
∘CThe actual experimental results show that the fundamentalreason for this phenomenon is turbine blade wear which cancause a difference of enthalpy drop between different turbineblade passages For the F3 class all the three temperatureuniformity indexes are very large (140∘C le 119867
1 110∘C le
1198672 and 110
∘C le 1198673) due to the effects of gas turbine
load rejection In addition a careful inspection of Figures 9and 10 reveals that the temperature uniformity index 119867
1is
significantly larger than the other two indexes (500∘C le 1198671
30 60 90 120 1500
20
40
60
80
100
120
140
H2 (∘C)
H3
(∘C)
F1 classF2 class
F3 classF4 class
Figure 11 Graphic clustering result by using1198672
and1198673
0∘C le 119867
2le 30∘C and 0∘C le 119867
3le 30∘C) It means that one
of the 12 thermocouple temperature sensors is fault which canresult in a smaller output
53 EGT Fault Diagnosis Based on SVM ClassificationModel According to the optimal clustering results the faultdiagnosis training sample set including fault types can beestablished which is shown in Table 2 Then on this basiswe can develop 6 SVM classifiers based on ldquoone-against-onerdquo method Table 3 shows the fault diagnosis performanceof SVM multiclassification model for the training samplesFrom Table 3 it is clear that the fault diagnosis accuracy rate
Mathematical Problems in Engineering 9
Table 2 Fault diagnosis training sample set of EGT
Type 1198791∘C 1198792∘C 1198793∘C 1198794∘C 1198795∘C 1198796∘C 1198797∘C 1198798∘C 1198799∘C 11987910∘C 11987911∘C 11987912∘C
F1
4936847 5193781 5102112 5217342 4881656 4713032 4755255 493422 4868506 513879 5183308 51492664978859 5243516 513879 52409 493422 4755255 4800065 4978859 489743 5175453 523043 51911634963108 521996 5123073 52409 4905316 473151 4789526 4970984 4881656 5157123 5209489 51675985002478 5246133 513355 5269688 4936847 4771075 4818502 499723 4918456 5191163 523043 5206871
F2
489743 5115213 5023465 5120453 4810601 4649604 4742065 4902688 4807968 5028711 5112593 50627994894802 5120453 5028711 513617 4821135 4665472 4739427 4907945 4821135 5044445 5125692 50759064879026 5109973 5010349 5123073 4800065 4652249 4723592 4902688 4805334 5023465 5109973 50654214884285 5120453 5036579 5128312 4807968 4668116 473151 4907945 4818502 5028711 5128312 5075906
F3
4448924 448348 4871684 4745367 4616006 4275448 2444364 3338674 2361834 3233517 431559 41976374440943 448348 4858542 472955 4613361 427009 2447409 3341505 2367968 3224955 4307567 42030124448924 4486136 4858542 4740095 4610715 4275448 2447409 3344335 2361834 322781 431559 42056994430299 4480823 4858542 4732187 460807 427009 2438271 3338674 2361834 3219244 4302217 4203012
F4
4723592 4633729 4546267 4683976 minus177778 4713032 4813235 4768439 4562188 4625787 468926 47921614723592 4646959 4543612 4686618 minus177778 4710391 4826401 4771075 4554228 4620493 4694544 4773712470511 4615197 451174 4668116 minus177778 4694544 4807968 4742065 4543612 4604602 467869 47842554707751 462314 4517055 4668116 minus177778 4697186 4813235 4755255 454892 4601953 467869 4771075
Table 3 Fault diagnosis performance of SVM multiclassificationmodel for training samples
Type Number oftraining samples
Number ofaccurate diagnoses Accuracy rate
F1 200 200 100F2 200 200 100F3 20 20 100F4 50 50 100
of trained SVM multiclassification model is 100 for thetraining samples which means that the SVM multiclassifi-cation model has been well trained for fault diagnosis of gasturbine EGT
Then the testing samples shown in Table 1 are used tofurther demonstrate the effectiveness of SVM multiclassifi-cation model Table 4 shows the comparison between actualresults and fault diagnosis results by using the well trainedSVMmulticlassification model for testing samples Based onthe results shown in Table 4 it is demonstrated that the welltrained SVM multiclassification model can effectively diag-nose the fault of gas turbine EGTwith a 95 accuracy rate forthe testing samples Besides the reason of misclassificationis that the sample data is obtained when the turbine bladewear or corrosion is not severe In order to compare withother models backpropagation (BP) neural network modelis also employed to make the same fault diagnosis and theresults are also listed in Table 4 The comparative analysisshows that SVM classification model can improve the fault
diagnosis accuracy of gas turbine EGT significantly comparedwith BP neural network model All these indicate that SVMis more suitable for fault diagnosis of gas turbine EGT
6 Conclusions
Considering the distribution characteristics of gas turbineEGT and its effect on the health state of gas turbine a fusionapproach based on FCM clustering algorithm and SVM clas-sification model (FCM-SVM) is proposed and successfullyapplied to an industrial gas turbine in this paper In theanalysis presented in this study it is demonstrated that FCM-SVM based approach can make full use of the unsupervisedfeature extraction ability of FCM clustering algorithm andthe sample classification generalization properties of SVMmulticlassification model which offers an effective way torealize the online condition recognition and fault diagnosis ofgas turbine EGT In the concrete implementation process theintroduced FCM clustering algorithm is a good alternativeto achieve automatic identification of the fault types of gasturbine EGT In other words it is effective to overcome theinfluence of experience judgment on fault types Besidesthe introduction of SVM multiclassification model has agreat potential to improve the fault diagnosis performanceof gas turbine EGT It is worth noticing that the studyof this paper is only focused on researching the artificialintelligence approach for the condition recognition and faultdiagnosis of gas turbine EGT but ignores the effects ofmany other parameters such as inlet temperature of gas
10 Mathematical Problems in Engineering
Table 4 The comparison results of different fault diagnosis models for testing samples
Number SVM1 SVM2 SVM3 SVM4 SVM5 SVM6 SVMmodel BP model Actual results1 F1 F1 F1 F2 F2 F3 F1 F1 F12 F1 F1 F1 F2 F2 F3 F1 F1 F13 F1 F1 F1 F2 F2 F3 F1 F1 F14 F1 F1 F1 F2 F2 F3 F1 F2 F15 F1 F1 F1 F2 F2 F3 F1 F1 F16 F2 F1 F1 F2 F2 F3 F2 F2 F27 F1 F1 F1 F2 F2 F3 F1 F1 F28 F2 F1 F1 F2 F2 F3 F2 F2 F29 F2 F1 F1 F2 F2 F3 F2 F2 F210 F2 F1 F1 F2 F2 F3 F2 F1 F211 F2 F3 F1 F3 F2 F3 F3 F3 F312 F2 F3 F1 F3 F2 F3 F3 F3 F313 F2 F3 F1 F3 F2 F3 F3 F3 F314 F2 F3 F1 F3 F2 F3 F3 F3 F315 F2 F3 F1 F3 F2 F3 F3 F3 F316 F1 F3 F4 F3 F4 F4 F4 F4 F417 F1 F3 F4 F3 F4 F4 F4 F4 F418 F1 F3 F4 F3 F4 F4 F4 F4 F419 F1 F3 F4 F3 F4 F4 F4 F4 F420 F1 F3 F4 F3 F4 F4 F4 F4 F4
turbine Therefore more studies and improvement about theapplication of this approach are needed further
Conflict of Interests
The authors declare that there is no conflict of interestsregarding the publication of this paper
References
[1] W Y Wang Z Q Xu R Tang S Y Li and W Wu ldquoFaultdetection and diagnosis for gas turbines based on a kernelizedinformation entropy modelrdquo The Scientific World Journal vol2014 Article ID 617162 13 pages 2014
[2] A J Volponi ldquoGas turbine engine health management pastpresent and future trendsrdquo Journal of Engineering for GasTurbines and Power vol 136 no 5 Article ID 051201 2014
[3] T Palme F Liard and DTherkorn ldquoSimilarity based modelingfor turbine exit temperature spreadmonitoring on gas turbinesrdquoin Proceedings of the ASME Turbo Expo 2013 Turbine Techni-cal Conference and Exposition (GT rsquo13) American Society ofMechanical Engineers San Antonio Tex USA June 2013
[4] P E Patrick Hamilton and D Ha ldquoExhaust gas temperaturecapabilities now in system 1 softwarerdquo Product Update vol 25no 1 pp 88ndash89 2005
[5] Y X Song K X Zhang and Y S Shi ldquoResearch on aeroengineperformance parameters forecast based on multiple linearregression forecastingmethodrdquo Journal of Aerospace Power vol24 no 2 pp 427ndash431 2009
[6] I Yilmaz ldquoEvaluation of the relationship between exhaustgas temperature and operational parameters in CFM56-7B enginesrdquo Proceedings of the Institution of Mechanical
EngineersmdashPart G Journal of Aerospace Engineering vol 223no 4 pp 433ndash440 2009
[7] E M He and L T Song ldquoAnalysis of EGT and measures toincrease the EGTmarginrdquoAviation EngineeringampMaintenancevol 6 pp 20ndash21 1999
[8] X F Wang and J M Yang ldquoAnalysis and treatment of largerexhaust dispersity fault for PG6551B gas turbinerdquo Gas TurbineTechnology vol 17 no 2 pp 58ndash61 2004
[9] J Chen Y H Wang and S L Weng ldquoApplication of generalregression neural network in fault detection of exhaust temper-ature sensors on gas turbinesrdquo Proceedings of the Chinese Societyof Electrical Engineering vol 29 no 32 pp 92ndash97 2009
[10] S Muthuraman J Twiddle M Singh and N Connolly ldquoCon-dition monitoring of SSE gas turbines using artificial neuralnetworksrdquo Insight Non-Destructive Testing and Condition Mon-itoring vol 54 no 8 pp 436ndash439 2012
[11] J Błachnio and W I Pawlak ldquoDamageability of gas turbineblades-evaluation of exhaust gas temperature in front of theturbine using a non-linear observerrdquo inAdvances inGas TurbineTechnology chapter 19 pp 435ndash464 2011
[12] Z Korczewski ldquoExhaust gas temperature measurements indiagnostic examination of naval gas turbine enginesrdquo PolishMaritime Research vol 18 no 2 pp 37ndash43 2011
[13] Z Korczewski ldquoExhaust gas temperature measurements indiagnostic examination of naval gas turbine enginesmdashpart IIunsteady processesrdquo Polish Maritime Research vol 18 no 3 pp37ndash42 2011
[14] Z Korczewski ldquoExhaust gas temperature measurements indiagnostic examination of naval gas turbine enginesrdquo PolishMaritime Research vol 18 no 4 pp 49ndash53 2011
[15] A D Kenyon VM Catterson and S D JMcArthur ldquoDevelop-ment of an intelligent system for detection of exhaust gas tem-perature anomalies in gas turbinesrdquo Insight Non-Destructive
Mathematical Problems in Engineering 11
Testing and Condition Monitoring vol 52 no 8 pp 419ndash4232010
[16] H Xia D Byrd S Dekate and B Lee ldquoHigh-density fiberoptical sensor and instrumentation for gas turbine operationcondition monitoringrdquo Journal of Sensors vol 2013 Article ID206738 10 pages 2013
[17] Z Yang B W K Ling and C Bingham ldquoFault detection andsignal reconstruction for increasing operational availability ofindustrial gas turbinesrdquo Measurement vol 46 no 6 pp 1938ndash1946 2013
[18] S C Gulen P R Griffin and S Paolucci ldquoReal-time on-lineperformance diagnostics of heavy-duty industrial gas turbinesrdquoJournal of Engineering for Gas Turbines and Power vol 124 no4 pp 910ndash921 2002
[19] D H Seo T S Roh and D W Choi ldquoDefect diagnosticsof gas turbine engine using hybrid SVM-ANN with modulesystem in off-design conditionrdquo Journal of Mechanical Scienceand Technology vol 23 no 3 pp 677ndash685 2009
[20] Y Hao J G Sun G Q Yang and J Bai ldquoThe application ofsupport vectormachines to gas turbine performance diagnosisrdquoChinese Journal of Aeronautics vol 18 no 1 pp 15ndash19 2005
[21] W X Wang and W Z An ldquoEngine vibration fault diagnosisresearch based on fuzzy clustering method of gas turbinerdquo GasTurbine Technology vol 26 no 3 pp 44ndash47 2013
[22] H J Mao ldquoAnalysis of exhaust temperature monitor andprotection function for gas turbinerdquo Huadian Technology vol31 no 8 pp 11ndash15 2009
[23] J C Bezdek Pattern Recognition with Fuzzy Objective FunctionAlgorithms Kluwer Academic New York NY USA 1981
[24] S Wikaisuksakul ldquoA multi-objective genetic algorithm withfuzzy c-means for automatic data clusteringrdquo Applied SoftComputing vol 24 pp 679ndash691 2014
[25] W Cai S Chen and D Zhang ldquoFast and robust fuzzy c-meansclustering algorithms incorporating local information for imagesegmentationrdquo Pattern Recognition vol 40 no 3 pp 825ndash8382007
[26] S N Omkar S Suresh T R Raghavendra and V ManildquoAcoustic emission signal classification using fuzzy C-meansclusteringrdquo in Proceedings of the 9th International Conference onNeural Information Processing vol 4 pp 1827ndash1831 2002
[27] H Zhao P H Wang J Qian Z Su and X Peng ldquoModeling fortarget-value of boiler monitoring parameters based on fuzzy C-means clustering algorithmrdquo Proceedings of the Chinese Societyof Electrical Engineering vol 31 no 32 pp 16ndash22 2011
[28] C Xu P Zhang G Ren and J Fu ldquoEngine wear fault diagnosisbased on improved semi-supervised fuzzy c-means clusteringrdquoJournal ofMechanical Engineering vol 47 no 17 pp 55ndash60 2011
[29] H B Sahu S S Mahapatra and D C Panigrahi ldquoFuzzyc-means clustering approach for classification of Indian coalseams with respect to their spontaneous combustion suscepti-bilityrdquo Fuel Processing Technology vol 104 pp 115ndash120 2012
[30] N R Pal and J C Bezdek ldquoOn cluster validity for the fuzzy c-means modelrdquo IEEE Transactions on Fuzzy Systems vol 3 no3 pp 370ndash379 1995
[31] VN VapnikTheNature of Statistical LearningTheory Springer1995
[32] Q Hu Z He Z Zhang and Y Zi ldquoFault diagnosis of rotatingmachinery based on improved wavelet package transform andSVMs ensemblerdquoMechanical Systems and Signal Processing vol21 no 2 pp 688ndash705 2007
[33] AWidodo and B S Yang ldquoSupport vectormachine inmachinecondition monitoring and fault diagnosisrdquo Mechanical Systemsand Signal Processing vol 21 no 6 pp 2560ndash2574 2007
[34] J Yang Y Zhang and Y Zhu ldquoIntelligent fault diagnosis ofrolling element bearing based on SVMs and fractal dimensionrdquoMechanical Systems and Signal Processing vol 21 no 5 pp2012ndash2024 2007
[35] C W Hsu and C J Lin ldquoA comparison of methods formulticlass support vector machinesrdquo IEEE Transactions onNeural Networks vol 13 no 2 pp 415ndash425 2002
Submit your manuscripts athttpwwwhindawicom
Hindawi Publishing Corporationhttpwwwhindawicom Volume 2014
MathematicsJournal of
Hindawi Publishing Corporationhttpwwwhindawicom Volume 2014
Mathematical Problems in Engineering
Hindawi Publishing Corporationhttpwwwhindawicom
Differential EquationsInternational Journal of
Volume 2014
Applied MathematicsJournal of
Hindawi Publishing Corporationhttpwwwhindawicom Volume 2014
Probability and StatisticsHindawi Publishing Corporationhttpwwwhindawicom Volume 2014
Journal of
Hindawi Publishing Corporationhttpwwwhindawicom Volume 2014
Mathematical PhysicsAdvances in
Complex AnalysisJournal of
Hindawi Publishing Corporationhttpwwwhindawicom Volume 2014
OptimizationJournal of
Hindawi Publishing Corporationhttpwwwhindawicom Volume 2014
CombinatoricsHindawi Publishing Corporationhttpwwwhindawicom Volume 2014
International Journal of
Hindawi Publishing Corporationhttpwwwhindawicom Volume 2014
Operations ResearchAdvances in
Journal of
Hindawi Publishing Corporationhttpwwwhindawicom Volume 2014
Function Spaces
Abstract and Applied AnalysisHindawi Publishing Corporationhttpwwwhindawicom Volume 2014
International Journal of Mathematics and Mathematical Sciences
Hindawi Publishing Corporationhttpwwwhindawicom Volume 2014
The Scientific World JournalHindawi Publishing Corporation httpwwwhindawicom Volume 2014
Hindawi Publishing Corporationhttpwwwhindawicom Volume 2014
Algebra
Discrete Dynamics in Nature and Society
Hindawi Publishing Corporationhttpwwwhindawicom Volume 2014
Hindawi Publishing Corporationhttpwwwhindawicom Volume 2014
Decision SciencesAdvances in
Discrete MathematicsJournal of
Hindawi Publishing Corporationhttpwwwhindawicom
Volume 2014 Hindawi Publishing Corporationhttpwwwhindawicom Volume 2014
Stochastic AnalysisInternational Journal of
2 Mathematical Problems in Engineering
as an important parameter to evaluate the health state of gasturbine and determine the maintenance policy [7]
In the past half century different methods have beendeveloped to monitor and diagnose the EGT of gas tur-bine Wang and Yang [8] analyzed many faults of PG6551Bindustrial gas turbine such as turbine ablation combustioncomponent and fuel system failure They found that theuniformity of EGT could effectively reflect the feature ofabove fault Chen et al [9] proposed a general regres-sion neural network (GRNN) approach to construct anautodetection network for EGT sensors on the basis thatthey also studied the optimizing design of network anderror controlling and developed the method of thresholdfor sensor detection Based on the advantage of artificialneural networks (ANN) Muthuraman et al [10] devel-oped an autoassociative neural network approach to detectcombustor-related damage bymonitoring EGT Błachnio andPawlak [11] established a nonlinear observer and chose EGTas the important parameter to evaluate the health state ofturbine blades Korczewski [12ndash14] analyzed the change rulesof EGT for a naval gas turbine engine under steady andunsteady operation conduction in detail And they proposedan effective approach for detecting and evaluating the failuresof the flow section and supply system of gas turbine byusing EGT Kenyon et al [15] developed an intelligent systemfor detection of EGT anomalies in gas turbines by usingthe strong nonlinear mapping ability of ANN Consideringthe characteristics of gas turbine operation control basedon thermocouple measured exhaust temperatures Xia et al[16] discussed the application of Fiber-Bragg-grating-basedsensing technology in the EGT measuring of gas turbineTheir results demonstrated that the fiber sensing method wasmore valuable for the monitoring and fault diagnosis of gasturbine because it could well reflect the changing of EGTIn order to increase the operational availability of industrialgas turbines Yang et al [17] presented a generalization ofmultidimensional linear regression to facilitate multisensorfault detection and signal reconstruction through the useof analytical optimization Gulen et al [18] discussed therelationship between EGT and other gas turbine performanceparameters on the basis of which an important diagnosticparameter named profile factor that was the ratio of themaximum exhaust thermocouple and the average of allexhaust temperature thermocouples was used to evaluate theperformance of combustor and the whole gas turbine in theirpaper
From the reviews discussed above it is noted that theaverage EGT is often used to evaluate the health state ofgas turbine in most researches However it may be moreimportant and valuable to extract the relationship amongdifferent EGT sensors in order to realize condition moni-tor and fault diagnosis of gas turbine effectively Althoughmany studies have presented the effects of EGT distributioncharacteristics on health state of gas turbine or its hotsections and many analyses were discussed in detail therewas still a lack of systematic research in the area of onlineautomatic identification and fault diagnosis for gas turbineEGT Besides EGT can be affected by many uncertain factorsin the practical applications which make it difficult to realize
fault diagnosis quickly by using traditional model-drivenapproachTherefore it is very useful to develop a data-drivenapproach based on artificial intelligence technology in orderto improve fault diagnosis accuracy
The fault diagnosis of gas turbine EGT based on data-driven approach essentially is the cluster and classificationof fault information In the concrete implementation processthe training samples including normal and fault informationneed to be obtained firstly Then the fault diagnosis modelbased on artificial intelligence algorithm can be establishedand trained by using training samples The feature informa-tion collected from sensors will be inputted to thewell trainedfault diagnosis model and we can get the diagnostic resultsfinally Obviously the establishment of fault information fea-tures space and design of artificial intelligence algorithm aretwo key steps to realize accurate fault diagnosis of gas turbineEGT As mentioned above many specific state patterns orfault types of gas turbine EGT cannot be determined directlybased on experience in the practical applications due tothe effects of many uncertain factors Besides enough priorknowledge including specific fault types is indispensable forthe supervised artificial intelligence algorithms (such as ANN[19] and SVM [20])
Considering the distribution characteristics of gas turbineEGT and the deficiencies of present literatures a fusionapproach based on FCM clustering algorithm and SVMclassification model (FCM-SVM) is proposed in this paperFirstly FCM clustering algorithm is used to realize clusteringanalysis and obtain the state patterns of EGT which meansthat the preclassification of EGT is completed Then SVMmulticlassification model is designed to carry out the statepattern recognition and fault diagnosis of EGT As an exam-ple the historical monitoring data of EGT from an industrialgas turbine is analyzed to verify the effectiveness of the FCM-SVM approach finally
The rest of this paper is organized as follows In Section 2the distribution characteristics of gas turbine EGT aredescribed briefly Section 3 introduces the basic theory ofFCM clustering algorithm and SVM classification model indetail The fusion fault diagnosis approach which combinesFCM clustering with SVM is discussed in Section 4 Appli-cation examples and discussion are included in Section 5Finally Section 6 presents some conclusions
2 Signal Feature of Gas Turbine EGTAs mentioned above it is very important to choose theappropriate measured parameters to monitor and diagnosethe health state of gas turbine Gas path and vibration param-eters are two main types in the practical applications [2 21]Theoretically as the most important gas path performanceparameter for gas turbine the outlet temperature of com-bustor chamber can not only affect the overall performanceof engine but also directly determine the ultimate strengthof turbine blade For example the creep life of hot channelcomponents can reduce the order of magnitude when theoutlet temperature of combustor chamber increases 50∘C [4]which may cause major fault and incur great maintenancecostsHowever the outlet temperature of combustor chamber
Mathematical Problems in Engineering 3
200
400
600
0
30
6090
120
150
180
210
240270
300
330
0
200
400
600
EGT (normal)Average EGT
Minimum EGTMaximum EGT
Tem
pera
ture
(∘C)
Figure 1 EGT profile of gas turbine with normal condition
0
200
400
600
0
30
6090
120
150
180
210
240270
300
330
200
400
600
Tem
pera
ture
(∘C)
EGT (fault)Average EGT
Minimum EGTMaximum EGT
Figure 2 EGT profile of gas turbine with fault condition
is usually so high that it cannot bemeasured directly by usingconventional sensors According to the well-defined Bray-ton thermodynamic cycle there is a consistent relationshipbetween the outlet temperature of combustor chamber andEGT Therefore EGT as a measured parameter is often usedfor gas engine control condition monitoring fault diagnosisand maintenance decisions
Comparedwith the average EGT EGT profile can containmore information about the health state of gas turbineFigures 1 and 2 show two EGT profiles with the same average
EGT of an industrial gas turbine that has 12 EGT sensorsFrom Figures 1 and 2 it is easy to see that the EGT profiles ofnormal and fault condition are different although the averageEGT are the same This means that the fault informationis incorrect or incomplete if only the average EGT is usedto monitor the health state of gas turbine Besides Figures1 and 2 also show that all the sensors should give similaroutputs when gas turbine operates in normal condition Ifthe component of gas turbine is failure different temperatureswill be observed Therefore the uniformity of EGT can moreeffectively reflect the health state of gas turbine especially forsteady state condition
In order to quantitatively describe the uniformity of EGTMao [22] presented three indexes which can be calculated bythe following functions Assume that there are 119899 sensors andtheir original outputs are 119879
119894 119894 = 1 119899 respectively
1198671= 1198791015840
1
minus 1198791015840
119899
1198672= 1198791015840
1
minus 1198791015840
119899minus1
1198673= 1198791015840
1
minus 1198791015840
119899minus2
(1)
where 1198791015840119894
is the transform value of 119879119894and 1198791015840
1
gt 1198791015840
2
gt sdot sdot sdot gt
1198791015840
119899minus2
gt 1198791015840
119899minus1
gt 1198791015840
119899
According to above indexes it is obvious that all the
values of 1198671 1198672 and 119867
3are smaller when gas turbine
operates in normal condition If a sensor fails it usuallycauses 119867
1or three indexes to increase But the values of 119867
1
and 1198672or all three indexes can increase due to hot sections
failure However it is worth pointing out that the aboveindexes only consider 4 EGT and others are ignored Besidesit is difficult to diagnose the specific cause of failure when thesensor is fault because the above indexes ignore the adjacentinformation between different sensors Therefore there aresome limitations to evaluate the uniformity of EGTonly usingthe above three indexes In order to solve this problem all themeasured EGT are used to realize cluster and fault diagnosisin this paper
3 Basic Theory
31 Fuzzy C-Means Clustering Algorithm As an unsuper-vised machine learning method FCM clustering algorithmwas improved by Bezdek [23] in 1981 in order to solve thehard clustering problem by using fuzzy set theory In theFCM clustering algorithm membership degree function isused to indicate the extent to which each data point belongsto each cluster and this information is also used to updatethe values of cluster centers [24] Based on the conceptof fuzzy C-partition FCM clustering algorithm has beenapplied successfully in a wide variety of applications such asimage segmentation [25] data mining [26] thermal systemmonitoring [27] and fault diagnosis [28]
For the sample set119883 = 1199091 1199092 119909
119899 the object of FCM
clustering algorithm is to divide the sample set into 119888 groups
4 Mathematical Problems in Engineering
and obtain the cluster centers by minimizing the followingdissimilarity function [29]
min 119869119898(119880 119881) =
119888
sum
119894=1
119899
sum
119896=1
119906119898
119894119896
1198892
119894119896
(2)
where 119898 is the fuzzy weighting parameter varying in therange [1infin] The bigger the 119898 the more fuzzy the finalcluster result 119880 is fuzzy partition matrix 119881 is cluster centermatrix and 119899 and 119888 are the number of samples and clustercenters respectively 119906
119894119896is the fuzzy membership degree of
the 119896th sample in the 119894th cluster and it should be meeting thefollowing three constraints [30]
119906119894119896isin [0 1] 1 le 119894 le 119888 1 le 119896 le 119899
119888
sum
119894=1
119906119894119896= 1 1 le 119896 le 119899
119899
sum
119896=1
119906119894119896isin (0 119899) 1 le 119894 le 119888
(3)
For the distance 119889119894119896between 119896th sample 119909
119896and the centre
of 119894th cluster 119881119894 it can be calculated by using Euclidean
distance as follows
119889119894119896=1003817100381710038171003817119909119896minus 119881119894
1003817100381710038171003817= radic
119898
sum
119895=1
(119909119896119895minus 119881119894119895)
2
1 le 119894 le 119888 1 le 119896 le 119899
(4)
119881119894119895can be calculated by utilizing the following formula-
tion
119881119894119895=
sum119899
119896=1
119906119898
119894119896
119909119896119895
sum119899
119896=1
119906119898
119894119896
1 le 119894 le 119888 1 le 119895 le 119898 (5)
In essence fuzzy cluster is performed through an iterativeoptimization by updating fuzzy membership degree [29]
119906(119904+1)
119894119896
=
1
sum119888
119895=1
(119889(119904)
119894119896
119889(119904)
119895119896
)
2(119898minus1)
1 le 119894 le 119888 1 le 119896 le 119899
(6)
where 119904 is the iterative stepWhen the below requirement ismet we can stop iteration
and obtain the cluster result10038171003817100381710038171003817119880(119904+1)
minus 119880(119904)10038171003817100381710038171003817le 120576 (7)
where 120576 is the iterative threshold in the range [0 1]Based on above method the cluster process of FCM
clustering algorithm is virtually to determine the fuzzymembership degree and cluster centers through continuousiteration which is shown in Figure 3
32 Support Vector Machine Classification Model Comparedwith the conventional classifiers support vector machine(SVM) developed by Vapnik [31] can effectively solve theclassification problem by implementing the structure risk
Start
No
Yes
Compute Euclidean distance
Output cluster result
Give iterative threshold and initializefuzzy partition matrix randomly U(0)
Calculate the cluster center matrix V
Update fuzzy partition matrix U(s+1)
U(s+1) minus U(s) le 120576
s = s + 1
Figure 3 Calculation flowchart of fuzzy C-means clustering algo-rithm
Original space Higher dimensional feature space
120593(x)
Figure 4 Classification of two classes using SVM
minimization based on statistical learning theory NowadaysSVM has been widely and successfully applied to detectionand diagnosis of machine conditions due to its high accuracyand good generalization for a smaller number of samples[32 33]
SVM is initially used to deal with binary classificationproblems Its core idea is to transform the sample datafrom original space to a higher dimensional feature spacethrough some nonlinear mapping functions and then findthe optimal separating hyperplane in this feature space torealize linear classification Figure 4 shows the classificationprinciple based on SVM for the nonlinear classificationproblem
For the nonlinear training sample data set including twoclasses 119909
119894 119910119894 119894 = 1 2 119899 119909 isin 119877
119899 119910 isin minus1 +1 119899is the number of samples The nonlinear mapping function120593(119909) will be used to transform the sample data from originalspace to a higher dimensional feature space and the optimal
Mathematical Problems in Engineering 5
separating hyperplane can be constructed to maximize themargin between the two classes by the following linearfunction
119891 (119909) = [120596 sdot 120593 (119909)] + 119887 (8)
where 120596 is the normal vector of optimal separating hyper-plane and 119887 is a scalar
In essence the solution of optimal separating hyperplaneis the corresponding constraint optimization problem
min 1
2
1205962
+ 119862
119899
sum
119894=1
120577119894
st 119910119894[120596 sdot 120593 (119909
119894) + 119887] + 120577
119894ge 1 1 le 119894 le 119899
120577119894ge 0 1 le 119894 le 119899
(9)
where 119862 is the penalty factor that can realize the trade-offbetween empirical risk and confidence interval 120577
119894is slack
factorCombining the method of Lagrange multipliers the
above convex optimization problem can be simplified into thedual quadratic optimization problem
max 119871 (119886) =
119899
sum
119894=1
119886119894minus
1
2
119899
sum
119894119895=1
119886119894119886119895119910119894119910119895120593 (119909119894) sdot 120593 (119909
119895)
st 119886119894ge 0 1 le 119894 le 119899
119899
sum
119894=1
119886119894119910119894= 0
(10)
where 119886 is Lagrangian multiplierThen the nonlinear decision function is described as
119891 (119909) = sign(119899
sum
119894119895=1
119886119894119910119894(120593 (119909119894) sdot 120593 (119909
119895)) + 119887) (11)
In order to calculate the value of 120593(119909119894) sdot 120593(119909
119895) the kernel
function 119870(119909119894 119909119895) is used and the above function can be
expressed as
119891 (119909) = sign(119899
sum
119894119895=1
119886119894119910119894119870(119909119894 119909119895) + 119887) (12)
For the SVM there are many kinds of kernel functionsuch as linear kernel polynomial kernel polynomial kerneland radial basis function (RBF) kernel Compared with otherkernel functions the RBF kernel can obtain the higherclassification accuracy in many practical applications [34]Therefore the RBF kernel is used in this study
As previously mentioned SVM is initially designed forbinary classification However there are often many faults inthe practical applications which mean that it is necessary todevelop a method to deal with a multiclassification problemCurrently different methods have been developed for themulticlassification based on SVM such as ldquoone-against-onerdquoldquoone-against-allrdquo and directed acyclic graph (DAG) Accord-ing to the comparison results obtained by Hsu and Lin [35]
the ldquoone-against-onerdquo method is more suitable for practicaluse than other methods For the sample set including 119888 class119888(119888 minus 1)2 SVM classifiers can be constructed by using ldquoone-against-onerdquo method and every SVM classifier is trained
4 Fusion Fault Diagnosis Modeling of EGTBased on FCM-SVM Approach
As the supervised artificial intelligencemethod enough priorknowledge including specific fault types is necessary for SVMclassification model However the fault types of gas turbineEGT cannot be determined directly based on experiencein the practical applications due to the effects of manyuncertain factors In order to achieve the automatic monitorand diagnosis of EGT effectively a fusion approach basedon FCM clustering algorithm and SVM classification model(FCM-SVM) is proposed Firstly FCM clustering algorithmis used to realize clustering analysis and obtain the statepatterns which means that the preclassification of EGT iscompleted Then SVMmulticlassification model is designedand used to carry out the online state pattern recognition andfault diagnosis of gas turbine EGT
Figure 5 shows the fusion fault diagnosis framework ofgas turbine EGT based on FCM-SVM approachThe detailedmodeling processes are as follows
Step 1 Generated sufficient EGT samples from the historicaldatabase and the essential preprocessing upon EGT data arecarried out before data analysis such as supplementary dataeliminating noise and outliers
Step 2 According to the cluster process which is shown inFigure 3 FCM clustering algorithm is used to obtain theinitial clustering results of gas turbine EGT
Step 3 Cluster validity index 120582(119888) is used to evaluate thevalidity of clustering and determine the number of clustersThe 119888 is optimum when 120582(119888) reaches its maximum value
120582 (119888) =
sum119888
119894=1
(sum119899
119896=1
119906119898
119894119896
)1003817100381710038171003817119881119894minus 119909
1003817100381710038171003817
2
(119888 minus 1)
sum119888
119894=1
sum119899
119896=1
119906119898
119894119896
1003817100381710038171003817119909119896minus 119881119894
1003817100381710038171003817
2
(119899 minus 119888)
(13)
119909 =
sum119888
119894=1
sum119899
119896=1
119906119898
119894119896
119909119896
119899
(14)
Step 4 After obtaining the optimal clustering results the faultdiagnosis sample set including specific fault types can beestablished
Step 5 SVMmulticlassificationmodel will be designed basedon ldquoone-against-onerdquo method and trained by using faultdiagnosis sample set
Step 6 Themeasured EGT obtained from real gas turbine arepreprocessed and inputted to the well trained SVMmulticlas-sification model Then we can get the final diagnostic results
Step 7 The measured EGT also are stored into the historicaldatabase and used for later analysis
6 Mathematical Problems in Engineering
Data preprocessed
Clustering analysis based on FCM clustering algorithm
Establish fault diagnosissample set
Historical database
Adjust clustering number
SVM classifier 1
Comprehensive evaluation
SVM classifier 2
SVM classifier N
Output result
Initial clustering number
Online measured EGT
Optimal clustering
Evaluate cluster validity index
Yes
No
EGT state pattern extraction based on FCM clustering algorithm
Well trained SVM multi-classification model
EGT fault diagnosis based on SVM multi-classification model
Data preprocessed
Figure 5 Fusion fault diagnosis framework of gas turbine EGT based on FCM-SVM approach
5 Case Study and Discussions
In order to demonstrate the effectiveness of FCM-SVMapproach introduced in this paper the historical monitoringdata of EGT from one industrial single shaft gas turbine willbe analyzed as a case study in this section
51 Sample Data As an industrial single shaft gas turbineTaurus70 is made in solar turbines incorporated and used forpower generation 12 thermocouple temperature sensors areused tomeasure the EGT and the average EGT is about 505∘Cwhen gas turbine operates in a normal state
Figure 6 shows the changing curves of 12 EGT varyingwith time under normal running state of gas turbine Andthe EGT profiles can be seen in Figure 7 From Figures 6and 7 it is clear that there is significant difference betweenthe measured outputs of different thermocouple temperature
sensors at the same time evenwhen the gas turbine is runningin a normal state Therefore much feature information willbe ignored which can decrease the fault diagnosis accuracyif only the average EGT is used to evaluate and analyse thehealth state of EGT Considering the operating conditionsof gas turbine 490-group data including 4 classes are takento establish the original sample set 470 samples are selectedrandomly as training samples and the remaining 20 samplesare selected as testing samples
52 Optimal Clustering of EGTBased on FCMClusteringAlgo-rithm For the FCMclustering algorithm it is very importantto determine an appropriate number of clusters which iscalled cluster validity problem In this study the clusternumber is decided automatically by using the introducedcluster validity index which is shown in (13) Consideringthe computation complexity and accuracy the scope of the
Mathematical Problems in Engineering 7
0 50 100 150 200 250 300 350 400460
470
480
490
500
510
520
530
Time (min)
Average EGT
Tem
pera
ture
(∘C)
EGT 1
EGT 2
EGT 3
EGT 4
EGT 5
EGT 6
EGT 7
EGT 8
EGT 9
EGT 10
EGT 11
EGT 12
Figure 6 Real-time measured EGT curve of gas turbine withnormal condition
0
200
400
600
0
30
6090
120
150
180
210
240270
300
330
200
400
600
Measured EGT
Tem
pera
ture
(∘C)
Average EGTMinimum EGTMaximum EGT
Figure 7 Real-time measured EGT profile of gas turbine withnormal condition
number of clusters is commonly [2 radic119899] in practical processand 119899 is the number of samples For the 470 training samplesshown in Table 1 the FCM clustering algorithm can stepwiseiterate from 2 to 21 clusters Figure 8 shows the changingtrends of cluster validity index 120582(119888) as a function of thenumber of clusters Based on the result shown in Figure 8 itis clear that 120582(119888) increases at first and then drops down with
0 4 8 12 16 20 24
0
2
4
6
The number of clusters
Clus
ter v
alid
ity in
dextimes10
minus6
Figure 8 The effect of the number of clusters on cluster validityindex 120582(119888)
0 100 200 300 400 500 60020
40
60
80
100
120
140
F1 classF2 class
F3 classF4 class
H1 (∘C)
H2
(∘C)
Figure 9 Graphic clustering result by using1198671
and1198672
the increases of the number of clusters And 120582(119888) can reachits maximum value when the number of clusters is 4 whichis in agreement with the real samples class Therefore it isconcluded that the FCM clustering algorithm is suitable foroptimal clustering of gas turbine EGT
Considering the high dimension characteristics of sam-ples it is difficult to realize graphical analysis directly Inthis paper three temperature uniformity indexes describedby Mao [22] are used to further analyze and evaluate thecluster results of gas turbine EGT by using graphic approachFigures 9ndash11 show the cluster results of gas turbine EGT basedon FCM clustering algorithm It may be clearly observed inFigures 9ndash11 that all the three temperature uniformity indexesof F1 class are relatively small (0∘C le 119867
1le 30∘C 0∘C le
1198672le 30∘C and 0∘C le 119867
3le 30∘C) This means that 12 ther-
mocouple temperature sensors give the almost same outputs
8 Mathematical Problems in Engineering
Table 1 The original sample set of gas turbine EGT
Number 1198791∘C 1198792∘C 1198793∘C 1198794∘C 1198795∘C 1198796∘C 1198797∘C 1198798∘C 1198799∘C 11987910∘C 11987911∘C 11987912∘C1 4936847 5193781 5102112 5217342 4881656 4713032 4755255 493422 4868506 513879 5183308 51492662 4978859 5243516 513879 52409 493422 4755255 4800065 4978859 489743 5175453 523043 51911633 4963108 521996 5123073 52409 4905316 473151 4789526 4970984 4881656 5157123 5209489 51675984 5002478 5246133 513355 5269688 4936847 4771075 4818502 499723 4918456 5191163 523043 52068715 4978859 5217342 5117833 5227812 4913201 4739427 4786891 4965733 4889544 5159742 5206871 51675986 499723 5248751 5141408 5264454 49421 4763166 4813235 4991981 4921084 5188545 5238282 52016357 4957857 5206871 5123073 5233047 4907945 4734149 4778983 4952605 4889544 5141408 5209489 51675988 4994606 5251368 5130931 5264454 493422 4760529 4815869 4984109 4915829 518069 5225195 51937819 4965733 523043 513355 52409 4918456 4755255 4805334 4978859 4892173 5172835 5217342 51806910 4978859 523043 513879 5251368 4926339 4752617 4805334 4976234 4902688 5172835 5235664 5199018
486 4986733 5253986 5149266 525922 4939474 4763166 4821135 4981484 4905316 5185927 5227812 5191163487 4986733 5235664 5149266 5267071 4931593 4765803 4821135 4976234 4907945 5185927 523043 51964488 4986733 523043 5125692 5248751 4926339 4757892 4800065 4970984 4889544 518069 5217342 518069489 4984109 5225195 5130931 52409 4918456 4749979 4802699 4973609 4894802 5170217 5212107 5188545490 4994606 5233047 5146647 5256602 4926339 4757892 4810601 4981484 4910573 5170217 5217342 5199018
0 100 200 300 400 500 600
20
40
60
80
100
120
140
H1 (∘C)
H3
(∘C)
F1 classF2 class
F3 classF4 class
Figure 10 Graphic clustering result by using1198671
and1198673
which belongs to normal state Compared with F1 class F2class has the following characteristics 40∘C le 119867
1le 70∘C
30∘C le 119867
2le 45
∘C and 30∘C le 119867
3le 45
∘CThe actual experimental results show that the fundamentalreason for this phenomenon is turbine blade wear which cancause a difference of enthalpy drop between different turbineblade passages For the F3 class all the three temperatureuniformity indexes are very large (140∘C le 119867
1 110∘C le
1198672 and 110
∘C le 1198673) due to the effects of gas turbine
load rejection In addition a careful inspection of Figures 9and 10 reveals that the temperature uniformity index 119867
1is
significantly larger than the other two indexes (500∘C le 1198671
30 60 90 120 1500
20
40
60
80
100
120
140
H2 (∘C)
H3
(∘C)
F1 classF2 class
F3 classF4 class
Figure 11 Graphic clustering result by using1198672
and1198673
0∘C le 119867
2le 30∘C and 0∘C le 119867
3le 30∘C) It means that one
of the 12 thermocouple temperature sensors is fault which canresult in a smaller output
53 EGT Fault Diagnosis Based on SVM ClassificationModel According to the optimal clustering results the faultdiagnosis training sample set including fault types can beestablished which is shown in Table 2 Then on this basiswe can develop 6 SVM classifiers based on ldquoone-against-onerdquo method Table 3 shows the fault diagnosis performanceof SVM multiclassification model for the training samplesFrom Table 3 it is clear that the fault diagnosis accuracy rate
Mathematical Problems in Engineering 9
Table 2 Fault diagnosis training sample set of EGT
Type 1198791∘C 1198792∘C 1198793∘C 1198794∘C 1198795∘C 1198796∘C 1198797∘C 1198798∘C 1198799∘C 11987910∘C 11987911∘C 11987912∘C
F1
4936847 5193781 5102112 5217342 4881656 4713032 4755255 493422 4868506 513879 5183308 51492664978859 5243516 513879 52409 493422 4755255 4800065 4978859 489743 5175453 523043 51911634963108 521996 5123073 52409 4905316 473151 4789526 4970984 4881656 5157123 5209489 51675985002478 5246133 513355 5269688 4936847 4771075 4818502 499723 4918456 5191163 523043 5206871
F2
489743 5115213 5023465 5120453 4810601 4649604 4742065 4902688 4807968 5028711 5112593 50627994894802 5120453 5028711 513617 4821135 4665472 4739427 4907945 4821135 5044445 5125692 50759064879026 5109973 5010349 5123073 4800065 4652249 4723592 4902688 4805334 5023465 5109973 50654214884285 5120453 5036579 5128312 4807968 4668116 473151 4907945 4818502 5028711 5128312 5075906
F3
4448924 448348 4871684 4745367 4616006 4275448 2444364 3338674 2361834 3233517 431559 41976374440943 448348 4858542 472955 4613361 427009 2447409 3341505 2367968 3224955 4307567 42030124448924 4486136 4858542 4740095 4610715 4275448 2447409 3344335 2361834 322781 431559 42056994430299 4480823 4858542 4732187 460807 427009 2438271 3338674 2361834 3219244 4302217 4203012
F4
4723592 4633729 4546267 4683976 minus177778 4713032 4813235 4768439 4562188 4625787 468926 47921614723592 4646959 4543612 4686618 minus177778 4710391 4826401 4771075 4554228 4620493 4694544 4773712470511 4615197 451174 4668116 minus177778 4694544 4807968 4742065 4543612 4604602 467869 47842554707751 462314 4517055 4668116 minus177778 4697186 4813235 4755255 454892 4601953 467869 4771075
Table 3 Fault diagnosis performance of SVM multiclassificationmodel for training samples
Type Number oftraining samples
Number ofaccurate diagnoses Accuracy rate
F1 200 200 100F2 200 200 100F3 20 20 100F4 50 50 100
of trained SVM multiclassification model is 100 for thetraining samples which means that the SVM multiclassifi-cation model has been well trained for fault diagnosis of gasturbine EGT
Then the testing samples shown in Table 1 are used tofurther demonstrate the effectiveness of SVM multiclassifi-cation model Table 4 shows the comparison between actualresults and fault diagnosis results by using the well trainedSVMmulticlassification model for testing samples Based onthe results shown in Table 4 it is demonstrated that the welltrained SVM multiclassification model can effectively diag-nose the fault of gas turbine EGTwith a 95 accuracy rate forthe testing samples Besides the reason of misclassificationis that the sample data is obtained when the turbine bladewear or corrosion is not severe In order to compare withother models backpropagation (BP) neural network modelis also employed to make the same fault diagnosis and theresults are also listed in Table 4 The comparative analysisshows that SVM classification model can improve the fault
diagnosis accuracy of gas turbine EGT significantly comparedwith BP neural network model All these indicate that SVMis more suitable for fault diagnosis of gas turbine EGT
6 Conclusions
Considering the distribution characteristics of gas turbineEGT and its effect on the health state of gas turbine a fusionapproach based on FCM clustering algorithm and SVM clas-sification model (FCM-SVM) is proposed and successfullyapplied to an industrial gas turbine in this paper In theanalysis presented in this study it is demonstrated that FCM-SVM based approach can make full use of the unsupervisedfeature extraction ability of FCM clustering algorithm andthe sample classification generalization properties of SVMmulticlassification model which offers an effective way torealize the online condition recognition and fault diagnosis ofgas turbine EGT In the concrete implementation process theintroduced FCM clustering algorithm is a good alternativeto achieve automatic identification of the fault types of gasturbine EGT In other words it is effective to overcome theinfluence of experience judgment on fault types Besidesthe introduction of SVM multiclassification model has agreat potential to improve the fault diagnosis performanceof gas turbine EGT It is worth noticing that the studyof this paper is only focused on researching the artificialintelligence approach for the condition recognition and faultdiagnosis of gas turbine EGT but ignores the effects ofmany other parameters such as inlet temperature of gas
10 Mathematical Problems in Engineering
Table 4 The comparison results of different fault diagnosis models for testing samples
Number SVM1 SVM2 SVM3 SVM4 SVM5 SVM6 SVMmodel BP model Actual results1 F1 F1 F1 F2 F2 F3 F1 F1 F12 F1 F1 F1 F2 F2 F3 F1 F1 F13 F1 F1 F1 F2 F2 F3 F1 F1 F14 F1 F1 F1 F2 F2 F3 F1 F2 F15 F1 F1 F1 F2 F2 F3 F1 F1 F16 F2 F1 F1 F2 F2 F3 F2 F2 F27 F1 F1 F1 F2 F2 F3 F1 F1 F28 F2 F1 F1 F2 F2 F3 F2 F2 F29 F2 F1 F1 F2 F2 F3 F2 F2 F210 F2 F1 F1 F2 F2 F3 F2 F1 F211 F2 F3 F1 F3 F2 F3 F3 F3 F312 F2 F3 F1 F3 F2 F3 F3 F3 F313 F2 F3 F1 F3 F2 F3 F3 F3 F314 F2 F3 F1 F3 F2 F3 F3 F3 F315 F2 F3 F1 F3 F2 F3 F3 F3 F316 F1 F3 F4 F3 F4 F4 F4 F4 F417 F1 F3 F4 F3 F4 F4 F4 F4 F418 F1 F3 F4 F3 F4 F4 F4 F4 F419 F1 F3 F4 F3 F4 F4 F4 F4 F420 F1 F3 F4 F3 F4 F4 F4 F4 F4
turbine Therefore more studies and improvement about theapplication of this approach are needed further
Conflict of Interests
The authors declare that there is no conflict of interestsregarding the publication of this paper
References
[1] W Y Wang Z Q Xu R Tang S Y Li and W Wu ldquoFaultdetection and diagnosis for gas turbines based on a kernelizedinformation entropy modelrdquo The Scientific World Journal vol2014 Article ID 617162 13 pages 2014
[2] A J Volponi ldquoGas turbine engine health management pastpresent and future trendsrdquo Journal of Engineering for GasTurbines and Power vol 136 no 5 Article ID 051201 2014
[3] T Palme F Liard and DTherkorn ldquoSimilarity based modelingfor turbine exit temperature spreadmonitoring on gas turbinesrdquoin Proceedings of the ASME Turbo Expo 2013 Turbine Techni-cal Conference and Exposition (GT rsquo13) American Society ofMechanical Engineers San Antonio Tex USA June 2013
[4] P E Patrick Hamilton and D Ha ldquoExhaust gas temperaturecapabilities now in system 1 softwarerdquo Product Update vol 25no 1 pp 88ndash89 2005
[5] Y X Song K X Zhang and Y S Shi ldquoResearch on aeroengineperformance parameters forecast based on multiple linearregression forecastingmethodrdquo Journal of Aerospace Power vol24 no 2 pp 427ndash431 2009
[6] I Yilmaz ldquoEvaluation of the relationship between exhaustgas temperature and operational parameters in CFM56-7B enginesrdquo Proceedings of the Institution of Mechanical
EngineersmdashPart G Journal of Aerospace Engineering vol 223no 4 pp 433ndash440 2009
[7] E M He and L T Song ldquoAnalysis of EGT and measures toincrease the EGTmarginrdquoAviation EngineeringampMaintenancevol 6 pp 20ndash21 1999
[8] X F Wang and J M Yang ldquoAnalysis and treatment of largerexhaust dispersity fault for PG6551B gas turbinerdquo Gas TurbineTechnology vol 17 no 2 pp 58ndash61 2004
[9] J Chen Y H Wang and S L Weng ldquoApplication of generalregression neural network in fault detection of exhaust temper-ature sensors on gas turbinesrdquo Proceedings of the Chinese Societyof Electrical Engineering vol 29 no 32 pp 92ndash97 2009
[10] S Muthuraman J Twiddle M Singh and N Connolly ldquoCon-dition monitoring of SSE gas turbines using artificial neuralnetworksrdquo Insight Non-Destructive Testing and Condition Mon-itoring vol 54 no 8 pp 436ndash439 2012
[11] J Błachnio and W I Pawlak ldquoDamageability of gas turbineblades-evaluation of exhaust gas temperature in front of theturbine using a non-linear observerrdquo inAdvances inGas TurbineTechnology chapter 19 pp 435ndash464 2011
[12] Z Korczewski ldquoExhaust gas temperature measurements indiagnostic examination of naval gas turbine enginesrdquo PolishMaritime Research vol 18 no 2 pp 37ndash43 2011
[13] Z Korczewski ldquoExhaust gas temperature measurements indiagnostic examination of naval gas turbine enginesmdashpart IIunsteady processesrdquo Polish Maritime Research vol 18 no 3 pp37ndash42 2011
[14] Z Korczewski ldquoExhaust gas temperature measurements indiagnostic examination of naval gas turbine enginesrdquo PolishMaritime Research vol 18 no 4 pp 49ndash53 2011
[15] A D Kenyon VM Catterson and S D JMcArthur ldquoDevelop-ment of an intelligent system for detection of exhaust gas tem-perature anomalies in gas turbinesrdquo Insight Non-Destructive
Mathematical Problems in Engineering 11
Testing and Condition Monitoring vol 52 no 8 pp 419ndash4232010
[16] H Xia D Byrd S Dekate and B Lee ldquoHigh-density fiberoptical sensor and instrumentation for gas turbine operationcondition monitoringrdquo Journal of Sensors vol 2013 Article ID206738 10 pages 2013
[17] Z Yang B W K Ling and C Bingham ldquoFault detection andsignal reconstruction for increasing operational availability ofindustrial gas turbinesrdquo Measurement vol 46 no 6 pp 1938ndash1946 2013
[18] S C Gulen P R Griffin and S Paolucci ldquoReal-time on-lineperformance diagnostics of heavy-duty industrial gas turbinesrdquoJournal of Engineering for Gas Turbines and Power vol 124 no4 pp 910ndash921 2002
[19] D H Seo T S Roh and D W Choi ldquoDefect diagnosticsof gas turbine engine using hybrid SVM-ANN with modulesystem in off-design conditionrdquo Journal of Mechanical Scienceand Technology vol 23 no 3 pp 677ndash685 2009
[20] Y Hao J G Sun G Q Yang and J Bai ldquoThe application ofsupport vectormachines to gas turbine performance diagnosisrdquoChinese Journal of Aeronautics vol 18 no 1 pp 15ndash19 2005
[21] W X Wang and W Z An ldquoEngine vibration fault diagnosisresearch based on fuzzy clustering method of gas turbinerdquo GasTurbine Technology vol 26 no 3 pp 44ndash47 2013
[22] H J Mao ldquoAnalysis of exhaust temperature monitor andprotection function for gas turbinerdquo Huadian Technology vol31 no 8 pp 11ndash15 2009
[23] J C Bezdek Pattern Recognition with Fuzzy Objective FunctionAlgorithms Kluwer Academic New York NY USA 1981
[24] S Wikaisuksakul ldquoA multi-objective genetic algorithm withfuzzy c-means for automatic data clusteringrdquo Applied SoftComputing vol 24 pp 679ndash691 2014
[25] W Cai S Chen and D Zhang ldquoFast and robust fuzzy c-meansclustering algorithms incorporating local information for imagesegmentationrdquo Pattern Recognition vol 40 no 3 pp 825ndash8382007
[26] S N Omkar S Suresh T R Raghavendra and V ManildquoAcoustic emission signal classification using fuzzy C-meansclusteringrdquo in Proceedings of the 9th International Conference onNeural Information Processing vol 4 pp 1827ndash1831 2002
[27] H Zhao P H Wang J Qian Z Su and X Peng ldquoModeling fortarget-value of boiler monitoring parameters based on fuzzy C-means clustering algorithmrdquo Proceedings of the Chinese Societyof Electrical Engineering vol 31 no 32 pp 16ndash22 2011
[28] C Xu P Zhang G Ren and J Fu ldquoEngine wear fault diagnosisbased on improved semi-supervised fuzzy c-means clusteringrdquoJournal ofMechanical Engineering vol 47 no 17 pp 55ndash60 2011
[29] H B Sahu S S Mahapatra and D C Panigrahi ldquoFuzzyc-means clustering approach for classification of Indian coalseams with respect to their spontaneous combustion suscepti-bilityrdquo Fuel Processing Technology vol 104 pp 115ndash120 2012
[30] N R Pal and J C Bezdek ldquoOn cluster validity for the fuzzy c-means modelrdquo IEEE Transactions on Fuzzy Systems vol 3 no3 pp 370ndash379 1995
[31] VN VapnikTheNature of Statistical LearningTheory Springer1995
[32] Q Hu Z He Z Zhang and Y Zi ldquoFault diagnosis of rotatingmachinery based on improved wavelet package transform andSVMs ensemblerdquoMechanical Systems and Signal Processing vol21 no 2 pp 688ndash705 2007
[33] AWidodo and B S Yang ldquoSupport vectormachine inmachinecondition monitoring and fault diagnosisrdquo Mechanical Systemsand Signal Processing vol 21 no 6 pp 2560ndash2574 2007
[34] J Yang Y Zhang and Y Zhu ldquoIntelligent fault diagnosis ofrolling element bearing based on SVMs and fractal dimensionrdquoMechanical Systems and Signal Processing vol 21 no 5 pp2012ndash2024 2007
[35] C W Hsu and C J Lin ldquoA comparison of methods formulticlass support vector machinesrdquo IEEE Transactions onNeural Networks vol 13 no 2 pp 415ndash425 2002
Submit your manuscripts athttpwwwhindawicom
Hindawi Publishing Corporationhttpwwwhindawicom Volume 2014
MathematicsJournal of
Hindawi Publishing Corporationhttpwwwhindawicom Volume 2014
Mathematical Problems in Engineering
Hindawi Publishing Corporationhttpwwwhindawicom
Differential EquationsInternational Journal of
Volume 2014
Applied MathematicsJournal of
Hindawi Publishing Corporationhttpwwwhindawicom Volume 2014
Probability and StatisticsHindawi Publishing Corporationhttpwwwhindawicom Volume 2014
Journal of
Hindawi Publishing Corporationhttpwwwhindawicom Volume 2014
Mathematical PhysicsAdvances in
Complex AnalysisJournal of
Hindawi Publishing Corporationhttpwwwhindawicom Volume 2014
OptimizationJournal of
Hindawi Publishing Corporationhttpwwwhindawicom Volume 2014
CombinatoricsHindawi Publishing Corporationhttpwwwhindawicom Volume 2014
International Journal of
Hindawi Publishing Corporationhttpwwwhindawicom Volume 2014
Operations ResearchAdvances in
Journal of
Hindawi Publishing Corporationhttpwwwhindawicom Volume 2014
Function Spaces
Abstract and Applied AnalysisHindawi Publishing Corporationhttpwwwhindawicom Volume 2014
International Journal of Mathematics and Mathematical Sciences
Hindawi Publishing Corporationhttpwwwhindawicom Volume 2014
The Scientific World JournalHindawi Publishing Corporation httpwwwhindawicom Volume 2014
Hindawi Publishing Corporationhttpwwwhindawicom Volume 2014
Algebra
Discrete Dynamics in Nature and Society
Hindawi Publishing Corporationhttpwwwhindawicom Volume 2014
Hindawi Publishing Corporationhttpwwwhindawicom Volume 2014
Decision SciencesAdvances in
Discrete MathematicsJournal of
Hindawi Publishing Corporationhttpwwwhindawicom
Volume 2014 Hindawi Publishing Corporationhttpwwwhindawicom Volume 2014
Stochastic AnalysisInternational Journal of
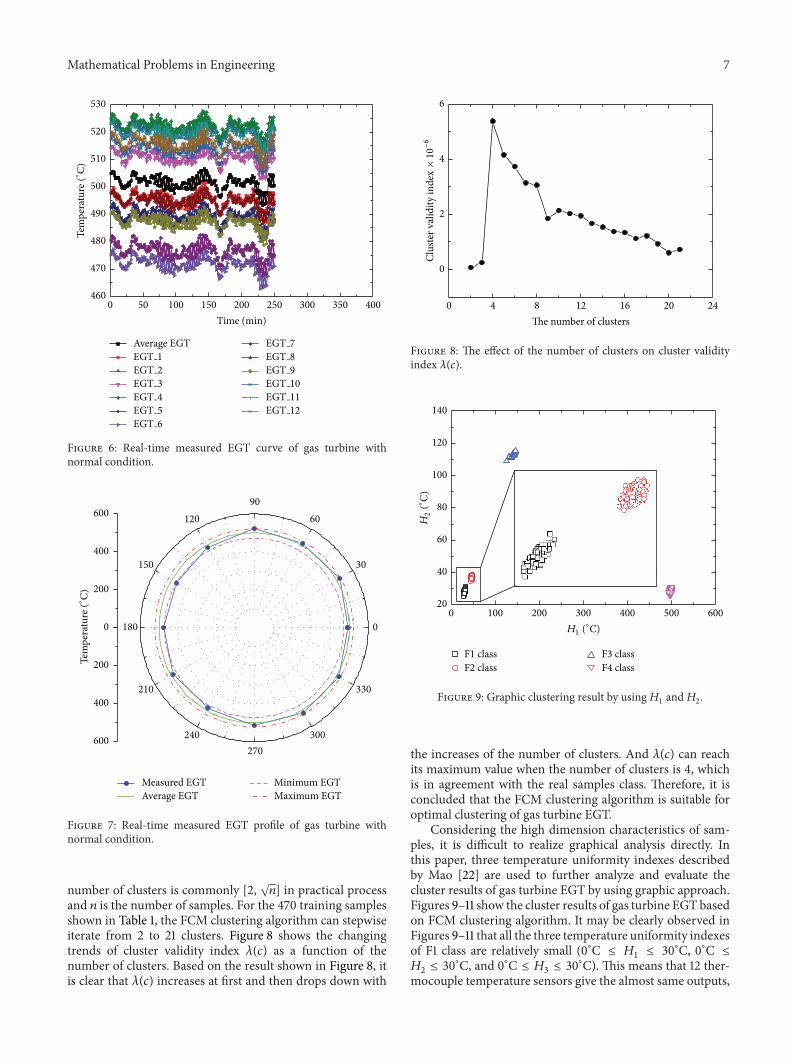
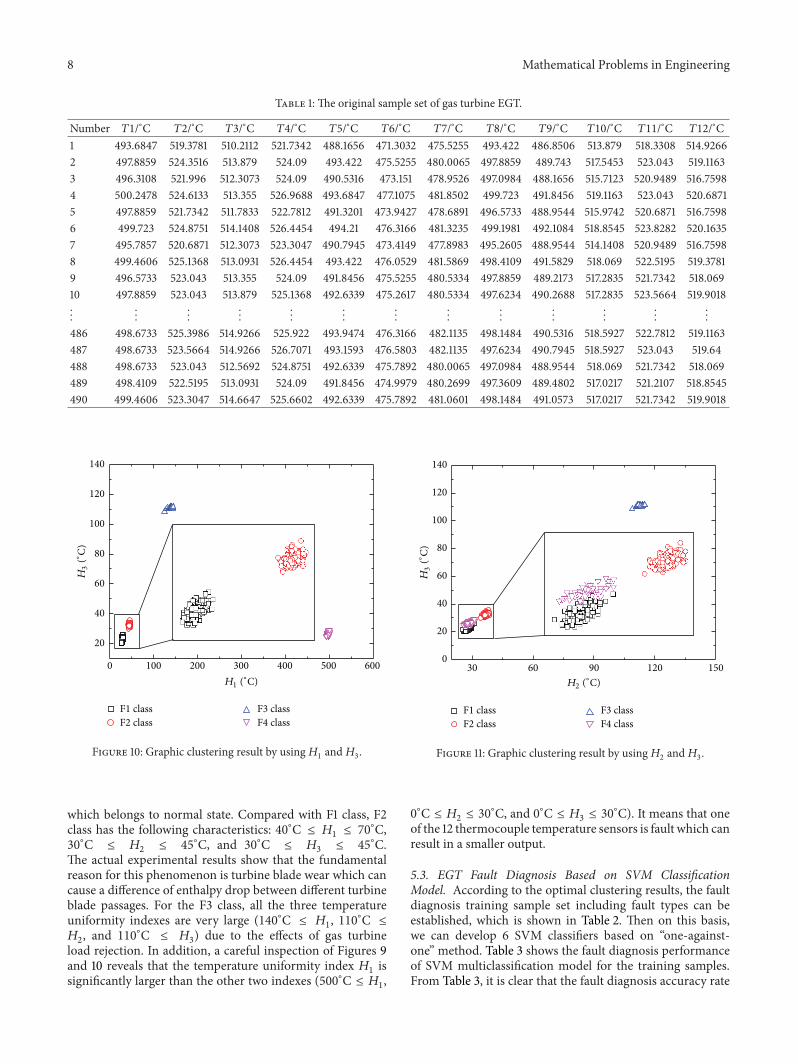