a comparative study on fault detection methods for gas
TRANSCRIPT
energies
Article
A Comparative Study on Fault Detection Methods for GasTurbine Combustion Systems
Jinfu Liu *, Zhenhua Long, Mingliang Bai , Linhai Zhu and Daren Yu
�����������������
Citation: Liu, J.; Long, Z.; Bai, M.;
Zhu, L.; Yu, D. A Comparative Study
on Fault Detection Methods for Gas
Turbine Combustion Systems.
Energies 2021, 14, 389. https://
doi.org/10.3390/en14020389
Received: 14 November 2020
Accepted: 8 January 2021
Published: 12 January 2021
Publisher’s Note: MDPI stays neu-
tral with regard to jurisdictional clai-
ms in published maps and institutio-
nal affiliations.
Copyright: © 2021 by the authors. Li-
censee MDPI, Basel, Switzerland.
This article is an open access article
distributed under the terms and con-
ditions of the Creative Commons At-
tribution (CC BY) license (https://
creativecommons.org/licenses/by/
4.0/).
Harbin Institute of Technology, Harbin 150001, China; [email protected] (Z.L.);[email protected] (M.B.); [email protected] (L.Z.); [email protected] (D.Y.)* Correspondence: [email protected]
Abstract: As one of the core components of gas turbines, the combustion system operates in ahigh-temperature and high-pressure adverse environment, which makes it extremely prone to faultsand catastrophic accidents. Therefore, it is necessary to monitor the combustion system to detect ina timely way whether its performance has deteriorated, to improve the safety and economy of gasturbine operation. However, the combustor outlet temperature is so high that conventional sensorscannot work in such a harsh environment for a long time. In practical application, temperaturethermocouples distributed at the turbine outlet are used to monitor the exhaust gas temperature (EGT)to indirectly monitor the performance of the combustion system, but, the EGT is not only affectedby faults but also influenced by many interference factors, such as ambient conditions, operatingconditions, rotation and mixing of uneven hot gas, performance degradation of compressor, etc.,which will reduce the sensitivity and reliability of fault detection. For this reason, many scholarshave devoted themselves to the research of combustion system fault detection and proposed manyexcellent methods. However, few studies have compared these methods. This paper will introducethe main methods of combustion system fault detection and select current mainstream methodsfor analysis. And a circumferential temperature distribution model of gas turbine is established tosimulate the EGT profile when a fault is coupled with interference factors, then use the simulationdata to compare the detection results of selected methods. Besides, the comparison results areverified by the actual operation data of a gas turbine. Finally, through comparative research andmechanism analysis, the study points out a more suitable method for gas turbine combustion systemfault detection and proposes possible development directions.
Keywords: gas turbine model; combustion system; fault detection; comparative study
1. Introduction
In the process of gas turbine development, with the improvement of its efficiency,the combustor outlet temperature is getting higher and higher [1]. The adverse workingenvironment leads to a high incidence of combustion system faults. In addition, it is veryexpensive, and once it suffers a fault and is damaged, it may also pose a serious threatto the safety of downstream nozzles and blades, causing huge losses [2]. For instance,through visual analysis following the failure and numerical simulations of a second rotorstage in heavy-duty gas turbine, Sawinski et al. [3] found that the increase in combustiontemperature, which may be caused by combustion system faults, would greatly increasethe probability of turbine failure. Implementation of prognostics and health management(PHM) can help gas turbines run safely and economically by improving their reliability,safety, and availability, while reducing the operational costs [4,5]. Anomaly detection playsan important role in PHM systems, which can detect performance degradation immediatelyand clear faults before they have fully developed. Therefore, the early fault detection ofgas turbine combustion systems is particularly important.
The combustor of gas turbines is generally of an annular or ring tube type. The fuelenters the combustor through a number of fuel nozzles for combustion. Each combustor has
Energies 2021, 14, 389. https://doi.org/10.3390/en14020389 https://www.mdpi.com/journal/energies
Energies 2021, 14, 389 2 of 31
the same structure and is evenly arranged along the circumferential direction. Ideally, thetemperature at the outlet of each combustor is basically identical, and when a combustor fails,it will affect the temperature of the gas in it and cause fluctuations at its outlet temperature [6].However, the temperature at the exit of combustor varies from 1300 to 1700 ◦C, dependingon the power of the gas turbine [1] and conventional temperature sensors cannot workfor a long time at such high temperatures, but the temperature fluctuation at the outlet ofcombustor will cause abnormal temperature of the corresponding gas path at the turbineoutlet [7]. In practical applications, temperature measuring thermocouples placed at theturbine outlet are used to monitor the EGT distribution to indirectly monitor the performanceof the combustion system. The thermocouples are arranged uniformly in the circumferentialdirection at the turbine outlet, so the measured EGT can reflect the status of the combustionsystem. Ideally, the temperature measured by each thermocouple should also be identical. Inpractice, due to manufacturing and installation errors and subtle differences in fuel supply, thevalues of each thermocouple are not exactly the same, although the difference is very small.When the wall of the combustor or a transition section cracks, deformation, ablation andcarbon deposition, uneven fuel distribution, jet angle deflection occur [5], and this will causethe exit temperature of the faulty combustor to deviate from the temperature of other normalcombustors, which is manifested as a local high temperature or a local low temperaturein the circumferential direction. These local temperature anomalies will pass through theturbine to the thermocouples. If the reading of one or several adjacent thermocouples aresignificantly higher or lower than that of other thermocouples, it indicates that the combustorcorresponding to the thermocouple is faulted, that is, we have a combustion system faultdetection method based on the EGT distribution.
In addition to the method of using the EGT distribution to detect faults, there arealso the methods of using fuel efficiency to measure the status of combustion system [8];using endoscopes for non-destructive testing after shutdown [9] and methods based onelectrostatic monitoring technology [10–14], etc. At present, the most widely used methodis to monitor the EGT distribution for fault detection. It provides the most relevantinformation about the performance of combustion systems [15]. When the unit is operatingnormally, the EGT distribution is uniform; the more uneven the EGT distribution, thegreater the probability of a malfunction of the combustion system.
However, the malfunction of the combustion system is not the only factor that cancause an uneven temperature distribution [16]. During the operation of a gas turbine,there are many interfering factors, including ambient conditions, operating conditions,component performance degradation, the manufacturing and installation errors of thermo-couples, etc. The fluctuating and uneven signal of the EGT caused by a malfunction of thecombustion system is very feeble. In the early stage of the combustion system fault, even ifthe combustor burns through and forms palm-sized damage, the resulting EGT change isonly 5–10 ◦C [17]. Comparing with the EGT change caused by the combustion system fault,the change caused by these non-fault interference factors can easily submerge that causedby faults, so that the faults cannot be detected as soon as possible. At the same time, thehot gas will rotate with the turbine blades, and its swirl angle will change with the changeof operating conditions. There is also a blending effect between the gas from differentcombustion chambers, which will reduce the unevenness of the EGT distribution. Theseinterference factors will reduce the sensitivity and increase the difficulty of anomaly detec-tion. In order to overcome these difficulties, researchers have carried out a large number ofstudies and proposed a series of methods for fault detection of combustion systems. Thesestudies can be divided into two types, spread-based methods and model-based methods.
The spread-based methods use the EGT dispersion to detect faults. If the values ofsome thermocouples differ greatly from those of other thermocouples, it means that thecombustion system is faulty [18,19]. As one of the most widely used monitor systems,the MARK VI system [20] produced by GE utilizes temperature differences between themaximum EGT and the three minimum EGTs. It defines a parameter, called allowableexhaust temperature dispersion, which is a function of the average EGT and the compressor

Energies 2021, 14, 389 3 of 31
outlet temperature. The higher the ratio of the temperature differences to the allowableexhaust temperature dispersion, the greater the possibility of a fault. The hot protection andcold protection of the TELEPERM XP system [21], produced by, utilizes the temperaturedeviation of a single thermocouple from the average EGT for warning, and uses thedeviation to determine whether to perform other protection actions. The system introducedin [22], in addition to monitoring deviations, also monitors the changes in the maximum,median and average values of EGT. Gulen et al. [23] introduced a heavy-duty industrialgas turbine real-time online performance diagnostic system. In the system, excessive andsudden changes or consistent upward trends in the ratio of the maximum EGT to theaverage of EGT indicate the potential combustor faults. The spread-based method is veryintuitive, so it has been widely used in industry.
The model-based methods use the EGT distribution model for fault detection, and theycan be divided into two categories. The first type is the use of established gas turbine models,including physical models and data-driven models. After inputing the operation and otherparameters, the established model outputs the estimated exhaust temperature. When thegas turbine is normal, the estimated value is basically the same as the actual value and theresidual error is small; when the residual error exceeds the threshold, it indicates that a faulthas occurred. The physical models are established using prior physical knowledge of the gasturbine. Basseville et al. [24,25] established a physical model of EGT and calculated the gasswirl angle based on the principle of gas turbine. Korczewski et al. [26] established an EGTmodel based on the thermodynamic and gas flow process of a gas turbine. Medina et al. [27]established a physical model with multiple combustors according to the Brayton cycle andalso considered the rotation of hot gas in the turbine. The data-driven models use measurableparameters from the gas turbine’s historical data to establish the EGT map, which does notrequire a clear understanding of the gas turbine’s structure. Tarassenko et al. [28] proposedan EGT model based on a feed-forward neural network. According to the spatial distributioncharacteristics of thermocouples, the temperature of a thermocouple is estimated by usingthe temperatures of four thermocouples which are opposite the objective thermocouple inspace. Bai et al. [29] proposed the concept of gas turbine normal pattern extraction for thefirst time, and based on nonlinear autoregressive with exogenous inputs network and priorknowledge fusion to extract the unchanged features of normal patterns from historical normaldata and detect their changes for anomaly detection. Kenyon et al. [30] built an exhausttemperature influence model based on a neural network to eliminate the influence of changesin operating conditions on the detection results. Liu et al. [31] used the convolutional neuralnetwork to extract useful information from the exhaust temperature and eliminated theinfluence of the gas rotation effect and common mode interference on the detection. Yan [32],based on deep learning (DL), proposed a deep semi-supervised anomaly detection method,first extracting feature information from the EGT through DL, and then using a one-classclassification to establish an EGT model and detect faults. Yildirim et al. [33], Ylmaz [15] andSong et al. [34] used multiple linear regression methods to establish the relationship betweenthe EGT and measurable parameters. Zhu et al. [35] used a genetic algorithm (GA) to selectthe best input parameters firstly, and then established a mapping model between selectedparameters and EGT using a support vector machine (SVM) with a linear kernel function.The second type of model-based method uses modeling parameters as detection factorsand reflects the performance of the combustion system through changes in the detectionfactors. Liu et al. [36], based on gas turbine principle and Fisher discriminant analysis,established an EGT mechanism model and proposed a new detection factor, called the EGTvector. Medina et al. [27] used statistical techniques and wavelet analysis algorithms to detectchanges in combustion system parameters.
It can be seen that there are many methods for combustion system fault detection.However, regardless of which method is more suitable, there is always a lack of comparativestudies in this area. This paper will select several representative methods with differentdetection principles and compare their detection results on combustion system faults andprovide relevant suggestions for further study. However, due to the fact faults may be

Energies 2021, 14, 389 4 of 31
coupled with many interference factors, the change rules of EGT are complicated. It isdifficult to fully reveal the detection results of various methods under the influence ofdifferent interference factors by using the gas turbine data in actual operation. To thisend, this paper is going to establish a gas turbine model that can be used in the study ofcombustion system fault detection, and then simulate the EGT when different interferencefactors are coupled with the combustion system fault, comparing the detection methods topoint out the more suitable method for the combustion system fault detection. The actualoperation data of a Taurus 70 gas turbine is then used to verify the comparison results, andthe results are analyzed based on the mechanism. The methods compared in this paper are:the proposed method based on a Brayton cycle, GE’s MARK VI gas turbine monitoringsystem, Siemens’ TELEPERERM XP (TXP) monitoring system, Tarassenko’s [28] proposedmethod based on EGT spatial characteristic, a data-driven EGT model in given in [35], andLiu’s [36] proposed “EGT vector”, etc.
The rest of this paper is organized as follows: Section 2 introduces the detectionmechanism and detection principles of the selected six methods. In Section 3, a circumfer-ential temperature distribution model for gas turbine combustion system fault detectionis established and the model utilized to simulate the EGT data when various interferencefactors are coupled with faults. Section 4 introduces a comparison parameter, called sensi-tivity factor, and compares the detection results of the selected methods. The comparisonresults are verified by using the actual operation data of a gas turbine, and results areanalyzed, then the key to sensitive detection is revealed in Section 5. Finally, Section 6summarizes the whole paper and presents suggestions for the future development of gasturbine combustion system fault detection methods.
2. Detection Mechanism and Methods
In this section, the detection mechanisms of EGT distribution-based approaches areintroduced. Based on the mechanism, many different detection methods are proposed andthe mainstream methods’ detection principles are introduced too.
2.1. Detection Mechanism
The three major components of a gas turbine are the compressor, burner and turbine.The compressor consumes work to compress air and then send it into burner wherethe fuel is combusted to produce a high-temperature and high-pressure gas. Then thehot gas enters the turbine to drive the rotor to do work, which drives the compressor,auxiliary equipment and generators to work. The burners of gas turbines are generallyof the annular or ring tube type. The fuel enters the combustor through a number of fuelnozzles for combustion. Each combustor has the same structure and is evenly arrangedalong the circumferential direction. When a combustor faults, the temperature of gas init will be affected. Therefore, if the outlet temperature of the combustor can be detected,the monitoring of the working status of combustors can be achieved. However, thecombustor outlet temperature is too high and conventional thermocouples cannot workin that condition for a long time. At present, the general practice is to uniformly arrangetemperature measurement thermocouples along the circumferential direction at the turbineoutlet, and indirectly monitor the status of combustors, as shown in Figure 1.
Ideally, the hot gas temperature from different combustors is basically identical, so thecorresponding gas path’s temperature and the temperature measured by the thermocouplesshould be the same too. In practice, due to manufacturing and installation errors and slightdifferences in fuel supply, the readings of each thermocouple are not exactly the same,but the differences are very small. However, when the wall of combustor or transitionsection suffers cracks, deformation, ablation, carbon deposition, uneven fuel distributionor a jet angle deflection occurs, it will cause the outlet temperature of the faulty combustorto deviate from the temperature of other normal combustors, and such a deviation willpass through the turbine to the thermocouples. If the readings of one or several adjacentthermocouples are significantly different from those of other thermocouples, it indicates

Energies 2021, 14, 389 5 of 31
that the combustor corresponding to the thermocouple is faulty, as shown in Figure 2. Thatis to say, the fault detection of the combustion system is achieved based on the method ofEGT distribution.
Energies 2021, 14, x FOR PEER REVIEW 5 of 32
Figure 1. Schematic diagram of exhaust thermocouples.
Ideally, the hot gas temperature from different combustors is basically identical, so the corresponding gas path’s temperature and the temperature measured by the thermo-couples should be the same too. In practice, due to manufacturing and installation errors and slight differences in fuel supply, the readings of each thermocouple are not exactly the same, but the differences are very small. However, when the wall of combustor or transition section suffers cracks, deformation, ablation, carbon deposition, uneven fuel distribution or a jet angle deflection occurs, it will cause the outlet temperature of the faulty combustor to deviate from the temperature of other normal combustors, and such a deviation will pass through the turbine to the thermocouples. If the readings of one or several adjacent thermocouples are significantly different from those of other thermocou-ples, it indicates that the combustor corresponding to the thermocouple is faulty, as shown in Figure 2. That is to say, the fault detection of the combustion system is achieved based on the method of EGT distribution.
Figure 2. Influence of fault on EGT.
2.2. Method Based on Brayton Cycle The operation of a gas turbine obeys the Brayton cycle, so the EGT can be calculated,
using the measurable parameters, combined with Brayton cycle and the basic principles of the gas turbine [29]. Basseville [24] and Zhang [25] proposed a mechanism-based EGT model;Korczewski [26] established an EGT model based on the Brayton cycle. In [35], Zhu also deduced by Brayton cycle that the most relevant parameters with EGT are the compressor inlet temperature T1 and fuel flow qmf. In [29], Bai pointed out an EGT model based on Brayton cycle, which is a function of qmf, T1 and the compressor outlet pressure P2. Considering that ambient pressure P1 is easier to measure and it is the most relevant to P2, the EGT model derived based on Brayton cycle can be summarized as the following equation:
( )4, 1 1, ,i i mfT f q T P= (1)
Figure 1. Schematic diagram of exhaust thermocouples.
Energies 2021, 14, x FOR PEER REVIEW 5 of 32
Figure 1. Schematic diagram of exhaust thermocouples.
Ideally, the hot gas temperature from different combustors is basically identical, so the corresponding gas path’s temperature and the temperature measured by the thermo-couples should be the same too. In practice, due to manufacturing and installation errors and slight differences in fuel supply, the readings of each thermocouple are not exactly the same, but the differences are very small. However, when the wall of combustor or transition section suffers cracks, deformation, ablation, carbon deposition, uneven fuel distribution or a jet angle deflection occurs, it will cause the outlet temperature of the faulty combustor to deviate from the temperature of other normal combustors, and such a deviation will pass through the turbine to the thermocouples. If the readings of one or several adjacent thermocouples are significantly different from those of other thermocou-ples, it indicates that the combustor corresponding to the thermocouple is faulty, as shown in Figure 2. That is to say, the fault detection of the combustion system is achieved based on the method of EGT distribution.
Figure 2. Influence of fault on EGT.
2.2. Method Based on Brayton Cycle The operation of a gas turbine obeys the Brayton cycle, so the EGT can be calculated,
using the measurable parameters, combined with Brayton cycle and the basic principles of the gas turbine [29]. Basseville [24] and Zhang [25] proposed a mechanism-based EGT model;Korczewski [26] established an EGT model based on the Brayton cycle. In [35], Zhu also deduced by Brayton cycle that the most relevant parameters with EGT are the compressor inlet temperature T1 and fuel flow qmf. In [29], Bai pointed out an EGT model based on Brayton cycle, which is a function of qmf, T1 and the compressor outlet pressure P2. Considering that ambient pressure P1 is easier to measure and it is the most relevant to P2, the EGT model derived based on Brayton cycle can be summarized as the following equation:
( )4, 1 1, ,i i mfT f q T P= (1)
Figure 2. Influence of fault on EGT.
2.2. Method Based on Brayton Cycle
The operation of a gas turbine obeys the Brayton cycle, so the EGT can be calculated,using the measurable parameters, combined with Brayton cycle and the basic principles ofthe gas turbine [29]. Basseville [24] and Zhang [25] proposed a mechanism-based EGT model;Korczewski [26] established an EGT model based on the Brayton cycle. In [35], Zhu alsodeduced by Brayton cycle that the most relevant parameters with EGT are the compressor inlettemperature T1 and fuel flow qmf. In [29], Bai pointed out an EGT model based on Braytoncycle, which is a function of qmf, T1 and the compressor outlet pressure P2. Considering thatambient pressure P1 is easier to measure and it is the most relevant to P2, the EGT modelderived based on Brayton cycle can be summarized as the following equation:
T4,i = fi
(qm f , T1, P1
)(1)
This is an EGT distribution model based on thermodynamic principle, where T4,irepresents the temperature at the i-th thermocouple. This also verifies the rationality ofcombustion system fault detection based on the EGT distribution. During the normaloperation of the gas turbine, the mapping relationship between inputs and output is stable,so the temperature at each thermocouple is basically equal and stable. When a combustorfails, the temperature at the corresponding measuring point will deviate from the outputof the model. When the residual exceeds the alarm threshold, it is considered that thecombustion system has faulted. This is also the detection principle of the model-basedmethod, as shown in Figure 3. In this paper, the EGT model based on the Brayton cycle isestablished by Extreme Learning Machine (ELM) with the compressor inlet temperature,compressor inlet pressure and fuel flow as inputs.

Energies 2021, 14, 389 6 of 31
Energies 2021, 14, x FOR PEER REVIEW 6 of 32
This is an EGT distribution model based on thermodynamic principle, where T4,i rep-resents the temperature at the i-th thermocouple. This also verifies the rationality of com-bustion system fault detection based on the EGT distribution. During the normal opera-tion of the gas turbine, the mapping relationship between inputs and output is stable, so the temperature at each thermocouple is basically equal and stable. When a combustor fails, the temperature at the corresponding measuring point will deviate from the output of the model. When the residual exceeds the alarm threshold, it is considered that the combustion system has faulted. This is also the detection principle of the model-based method, as shown in Figure 3. In this paper, the EGT model based on the Brayton cycle is established by Extreme Learning Machine (ELM) with the compressor inlet temperature, compressor inlet pressure and fuel flow as inputs.
ModelInputs
Actual EGT
Estimated EGT
Residual
Compare
Figure 3. Schematic diagram of model-based fault detection method.
After verifying the rationality of fault detection based on EGT distribution, scholars began to utilize this feature to perform fault detection. The characteristic manifests that the greater the deviation of temperature between different measuring points, namely the higher the EGT dispersion, the higher the probability of combustion system faults. There-fore, the fault detection can also be realized by monitoring the EGT dispersion, and the US company GE and Germany’s Siemens have developed relevant gas turbine monitoring systems to monitor combustion based on this principle.
2.3. Gas Turbine Monitoring System Based on EGT Dispersion At present, the MARK VI system produced by GE and TELEPERERM XP (TXP) sys-
tem produced by Siemens are widely used in gas turbine monitoring. They are based on the spread-based method, and monitor the EGT dispersion to detect faults.
2.3.1. The Mark VI System Produced by GE Based on years of experience, GE defines a parameter S, allowable exhaust tempera-
ture dispersion, which is the function of compressor outlet temperature T2 and the average EGT value T4,avg, as shown in Equation (2). The difference between the maximum EGT and the three minimum EGTs is used to measure the dispersion, as shown in Equation (3):
( ) ( )170750
4, 2 50 5060 0.145 0.08 100avgS T T= + − + (2)
1 4,max 4,min1
2 4,max 4,min 2
3 4,max 4,min3
S T TS T TS T T
= −= −= −
(3)
The units of the above equations are °F. The higher the ratio of the EGT dispersion to the allowable EGT dispersion, the greater the possibility of a fault. GE has also set up three empirical parameters K1, K2 and K3, where generally K1 = 1.0, K2 = 5.0 and K3 = 0.8. The discriminant principle is shown in Figure 4 [37].
Figure 3. Schematic diagram of model-based fault detection method.
After verifying the rationality of fault detection based on EGT distribution, scholarsbegan to utilize this feature to perform fault detection. The characteristic manifests that thegreater the deviation of temperature between different measuring points, namely the higherthe EGT dispersion, the higher the probability of combustion system faults. Therefore,the fault detection can also be realized by monitoring the EGT dispersion, and the UScompany GE and Germany’s Siemens have developed relevant gas turbine monitoringsystems to monitor combustion based on this principle.
2.3. Gas Turbine Monitoring System Based on EGT Dispersion
At present, the MARK VI system produced by GE and TELEPERERM XP (TXP) systemproduced by Siemens are widely used in gas turbine monitoring. They are based on thespread-based method, and monitor the EGT dispersion to detect faults.
2.3.1. The Mark VI System Produced by GE
Based on years of experience, GE defines a parameter S, allowable exhaust temperaturedispersion, which is the function of compressor outlet temperature T2 and the average EGTvalue T4,avg, as shown in Equation (2). The difference between the maximum EGT and thethree minimum EGTs is used to measure the dispersion, as shown in Equation (3):
S =(
60 + 0.145T4,avg − 0.08T2|75050
)∣∣∣170
50+ (100) (2)
S1 = T4,max − T4,min1S2 = T4,max − T4,min2S3 = T4,max − T4,min3
(3)
The units of the above equations are ◦F. The higher the ratio of the EGT dispersionto the allowable EGT dispersion, the greater the possibility of a fault. GE has also set upthree empirical parameters K1, K2 and K3, where generally K1 = 1.0, K2 = 5.0 and K3 = 0.8.The discriminant principle is shown in Figure 4 [37].
Energies 2021, 14, x FOR PEER REVIEW 7 of 32
0
Communication failure
1 2
The first block adjacent to S S 1 2
The second block adjacent to S S
3
The third block/ 0.75S S >2
/S
S
3 0.8K =
1 1.0K = 2 5.0K =1 /S S
1 1/S S K>
Combustiondetection alarm
Thermocouplefault alarm
Figure 4. Discriminant diagram of combustion monitoring system in MARK VI system.
2.3.2. The TXP System Produced by Siemens The TXP monitoring system of Siemens also uses the dispersion of EGT for fault de-
tection. It is based on the deviation between the EGT of each measuring point and the average EGT value. The protection logic is shown in Table 1 [21].
Table 1. EGT protection logic of the TELEPERX XP system.
Name Judgment Logic
Hot protection Comparing the average EGT value with the highest temperature, if the deviation reaches the threshold, the alarm will be given; if the
protection action value is reached, it will be blocked.
High temperature protection The temperature of three or more measuring points is higher than
the protection action value, it will be blocked.
Cold protection
Comparing the average EGT value with the lowest temperature, if the deviations of two consecutive measuring points are above the
threshold, the alarm will be given; if the deviations of three consec-utive measuring points are above the threshold, the gas turbine will maintain the load; if the deviations of four or more consecu-tive measuring points are above the threshold, it will be blocked.
In practical applications, the system also considers the influence of compressor outlet temperature, turbine rotational speed and other factors on the EGT, and corrects the EGT. The equation is as follows [21]:
( ) ( )4, 4, 1 3 2 2 2 01 /cor actT T K K T T K N N= − + × × − × − (4)
where, T4,corr is the corrected EGT; T4act is the measured valve; N is the actual turbine rota-tional speed; N0 is the rated turbine rotational speed; K1, K2 and K3 are constants. When the deviation r1 between a certain EGT and the average value exceeds the hot protection threshold, it will alarm. When the readings of two consecutive measuring points are lower than the average value, and the difference, r2 and r3, exceed the cold protection threshold, it will alarm too.
4,max 4,
4, 4,
4, 4, 1
12
3
avg
avg i
avg i
r T Tr T Tr T T +
= −
= −
= −
(5)
The MARK VI system utilizes a ratio and the TXP utilizes a difference, meanwhile, the threshold band of MARK VI and TXP system is fixed, and it will not change with the change of working conditions and environmental conditions. Different monitoring results will give warnings under the same threshold band. Therefore, many researchers have pro-posed detection methods that the threshold band will flexibly change with the monitoring
Figure 4. Discriminant diagram of combustion monitoring system in MARK VI system.

Energies 2021, 14, 389 7 of 31
2.3.2. The TXP System Produced by Siemens
The TXP monitoring system of Siemens also uses the dispersion of EGT for faultdetection. It is based on the deviation between the EGT of each measuring point and theaverage EGT value. The protection logic is shown in Table 1 [21].
Table 1. EGT protection logic of the TELEPERX XP system.
Name Judgment Logic
Hot protection
Comparing the average EGT value with the highesttemperature, if the deviation reaches the threshold, the
alarm will be given; if the protection action value is reached,it will be blocked.
High temperature protection The temperature of three or more measuring points ishigher than the protection action value, it will be blocked.
Cold protection
Comparing the average EGT value with the lowesttemperature, if the deviations of two consecutive measuringpoints are above the threshold, the alarm will be given; ifthe deviations of three consecutive measuring points are
above the threshold, the gas turbine will maintain the load;if the deviations of four or more consecutive measuring
points are above the threshold, it will be blocked.
In practical applications, the system also considers the influence of compressor outlettemperature, turbine rotational speed and other factors on the EGT, and corrects the EGT.The equation is as follows [21]:
T4,cor = T4,act − (K1 + K3 × T2)× T2 − K2 × (1− N/N0) (4)
where, T4,corr is the corrected EGT; T4act is the measured valve; N is the actual turbinerotational speed; N0 is the rated turbine rotational speed; K1, K2 and K3 are constants.When the deviation r1 between a certain EGT and the average value exceeds the hotprotection threshold, it will alarm. When the readings of two consecutive measuring pointsare lower than the average value, and the difference, r2 and r3, exceed the cold protectionthreshold, it will alarm too.
r1 = T4,max − T4,avgr2 = T4,avg − T4,i
r3 = T4,avg − T4,i+1
(5)
The MARK VI system utilizes a ratio and the TXP utilizes a difference, meanwhile,the threshold band of MARK VI and TXP system is fixed, and it will not change withthe change of working conditions and environmental conditions. Different monitoringresults will give warnings under the same threshold band. Therefore, many researchershave proposed detection methods that the threshold band will flexibly change with themonitoring results. The measurement results of different thermocouples have their owndetection threshold band. The following methods are ones where the threshold band canflexibly change following the monitoring results.
2.4. Method Based on EGT Spatial Characteristic
The combustion system of a gas turbine is usually composed of several combustorswith the same structure and uniformly arranged in the circumferential direction. Ideally,the combustion state of each combustor is basically identical, so the EGT distribution atthe turbine outlet is basically uniform. Moreover, the probability of multiple combustors’faulting at the same time is very small, so the temperature of the thermocouple corre-sponding to the faulty combustor will be significantly different from that measured byothers. However, due to the effect of blending and diffusion, the temperature of severaladjacent thermocouples will also be affected. In other words, the temperature field of a

Energies 2021, 14, 389 8 of 31
combustor will affect several adjacent thermocouples; at the same time, the temperatureof a thermocouple will also be affected by the state of multiple combustors, as shown inFigure 5. However, the temperature of several thermocouples opposite to this thermo-couple corresponding to the faulty combustor in space is not affected by the faulty one.Therefore, in [28], Tarassenko used the spatial distribution characteristics of thermocouplesand an artificial neural network (ANN) to establish the mapping between the EGT mea-surement point and the four opposite thermocouples, as shown in Figure 6, whereby theEGT model is established.
Energies 2021, 14, x FOR PEER REVIEW 8 of 32
results. The measurement results of different thermocouples have their own detection threshold band. The following methods are ones where the threshold band can flexibly change following the monitoring results.
2.4. Method Based on EGT Spatial Characteristic The combustion system of a gas turbine is usually composed of several combustors
with the same structure and uniformly arranged in the circumferential direction. Ideally, the combustion state of each combustor is basically identical, so the EGT distribution at the turbine outlet is basically uniform. Moreover, the probability of multiple combustors’ faulting at the same time is very small, so the temperature of the thermocouple corre-sponding to the faulty combustor will be significantly different from that measured by others. However, due to the effect of blending and diffusion, the temperature of several adjacent thermocouples will also be affected. In other words, the temperature field of a combustor will affect several adjacent thermocouples; at the same time, the temperature of a thermocouple will also be affected by the state of multiple combustors, as shown in Figure 5. However, the temperature of several thermocouples opposite to this thermocou-ple corresponding to the faulty combustor in space is not affected by the faulty one. There-fore, in [28], Tarassenko used the spatial distribution characteristics of thermocouples and an artificial neural network (ANN) to establish the mapping between the EGT measure-ment point and the four opposite thermocouples, as shown in Figure 6, whereby the EGT model is established.
Influence of every combustor
Combustor
Thermocouple Figure 5. Influence of combustors on thermocouples.
1
Functionalestimator
Inputs
Output
Figure 6. Relative positioning of inputs and output thermocouples.
In addition, the hot gas will swirl in the turbine with the rotation of the rotator, and the swirl angle has a nonlinear relationship with the turbine rotational speed N. Therefore, Tarassenko took N as the fifth input parameter to estimate the EGT. The estimated model based on EGT spatial characteristic is as follows:
( )4, 4,iT g T N∧
=
(6)
where, , is the estimated temperature of the i-th thermocouple and is the vector composed of the four opposite thermocouples’ temperature. The nonlinear function g is determined by an ANN with five inputs, one hidden unit and one output. In this paper,
Figure 5. Influence of combustors on thermocouples.
Energies 2021, 14, x FOR PEER REVIEW 8 of 32
results. The measurement results of different thermocouples have their own detection threshold band. The following methods are ones where the threshold band can flexibly change following the monitoring results.
2.4. Method Based on EGT Spatial Characteristic The combustion system of a gas turbine is usually composed of several combustors
with the same structure and uniformly arranged in the circumferential direction. Ideally, the combustion state of each combustor is basically identical, so the EGT distribution at the turbine outlet is basically uniform. Moreover, the probability of multiple combustors’ faulting at the same time is very small, so the temperature of the thermocouple corre-sponding to the faulty combustor will be significantly different from that measured by others. However, due to the effect of blending and diffusion, the temperature of several adjacent thermocouples will also be affected. In other words, the temperature field of a combustor will affect several adjacent thermocouples; at the same time, the temperature of a thermocouple will also be affected by the state of multiple combustors, as shown in Figure 5. However, the temperature of several thermocouples opposite to this thermocou-ple corresponding to the faulty combustor in space is not affected by the faulty one. There-fore, in [28], Tarassenko used the spatial distribution characteristics of thermocouples and an artificial neural network (ANN) to establish the mapping between the EGT measure-ment point and the four opposite thermocouples, as shown in Figure 6, whereby the EGT model is established.
Influence of every combustor
Combustor
Thermocouple Figure 5. Influence of combustors on thermocouples.
1
Functionalestimator
Inputs
Output
Figure 6. Relative positioning of inputs and output thermocouples.
In addition, the hot gas will swirl in the turbine with the rotation of the rotator, and the swirl angle has a nonlinear relationship with the turbine rotational speed N. Therefore, Tarassenko took N as the fifth input parameter to estimate the EGT. The estimated model based on EGT spatial characteristic is as follows:
( )4, 4,iT g T N∧
=
(6)
where, , is the estimated temperature of the i-th thermocouple and is the vector composed of the four opposite thermocouples’ temperature. The nonlinear function g is determined by an ANN with five inputs, one hidden unit and one output. In this paper,
Figure 6. Relative positioning of inputs and output thermocouples.
In addition, the hot gas will swirl in the turbine with the rotation of the rotator, andthe swirl angle has a nonlinear relationship with the turbine rotational speed N. Therefore,Tarassenko took N as the fifth input parameter to estimate the EGT. The estimated modelbased on EGT spatial characteristic is as follows:
∧T4,i = g
(→T4, N
)(6)
where, T4,i is the estimated temperature of the i-th thermocouple and→T4 is the vector
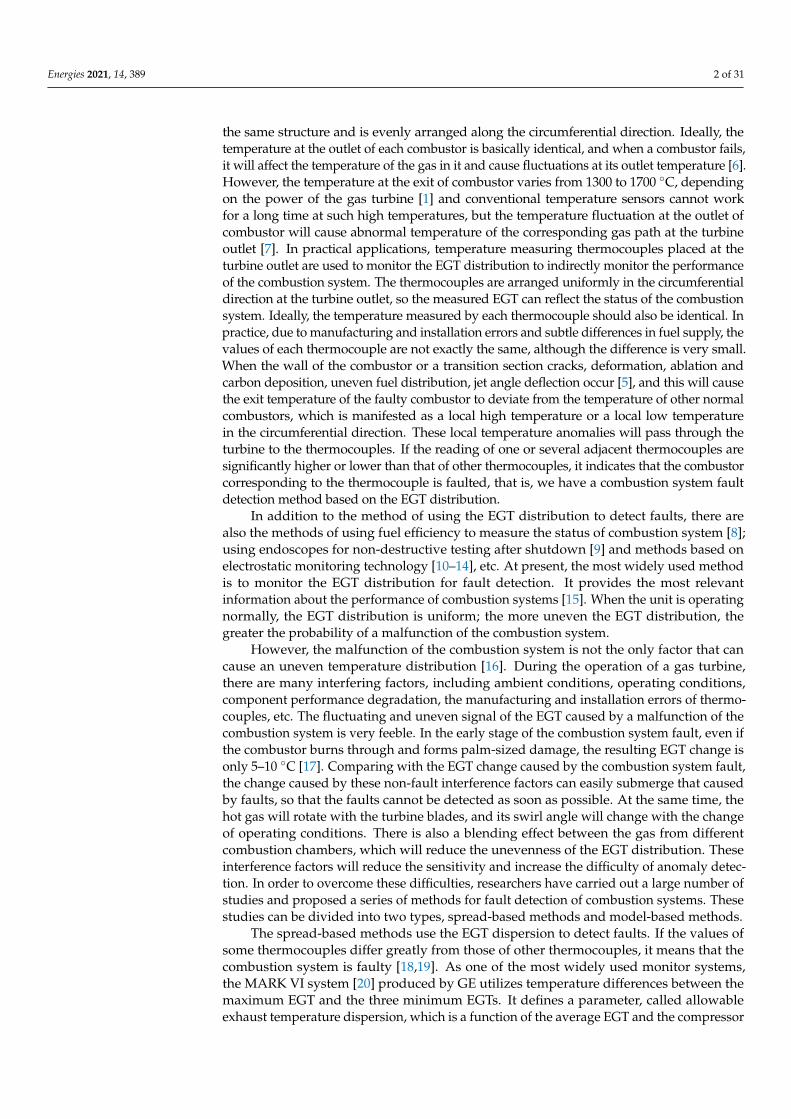
composed of the four opposite thermocouples’ temperature. The nonlinear function g isdetermined by an ANN with five inputs, one hidden unit and one output. In this paper,the single hidden layer feedforward neural network is achieved by using ELM, as shownin Figure 7.
This method belongs to model-based methods, which utilize the established model tocalculate the estimated EGT according to the input parameters and compare them withthe actual value to obtain a residual; the mechanism is shown in Figure 3. At the sametime, this is also a method of artificially selecting input parameters, according to the EGTspatial distribution characteristics. In addition, GA, cross-correlation coefficient analysis,particle swarm optimization (PSO) and other algorithms are used to select the measurableparameters with the greatest correlation with EGT, and these parameters are used asinputs to estimate EGT. The EGT distribution models established in this way belong to thedata-driven model class.
Energies 2021, 14, 389 9 of 31
Energies 2021, 14, x FOR PEER REVIEW 9 of 32
the single hidden layer feedforward neural network is achieved by using ELM, as shown in Figure 7.
Input layer Hidden layer Otput layer
……
i nT +
1i nT + +
2i nT + +
3i nT + +
N
4,iT∧
Figure 7. Structure of established ANN in this method.
This method belongs to model-based methods, which utilize the established model to calculate the estimated EGT according to the input parameters and compare them with the actual value to obtain a residual; the mechanism is shown in Figure 3. At the same time, this is also a method of artificially selecting input parameters, according to the EGT spatial distribution characteristics. In addition, GA, cross-correlation coefficient analysis, particle swarm optimization (PSO) and other algorithms are used to select the measurable parameters with the greatest correlation with EGT, and these parameters are used as in-puts to estimate EGT. The EGT distribution models established in this way belong to the data-driven model class.
2.5. Method Based on Data-Driven Model Data-driven models use historical data of gas turbines and do not require accurate
physical-mathematical models of the system. In recent years, the research of data-driven methods for gas turbine fault detection and diagnosis has attracted extensive attention [38–41]. In [35], through a mechanism analysis, Zhu extracted the frequent pattern model (FPM) of the EGT and found that the FPM would not change without the change of struc-ture. When the structure changes, the actual EGT will deviate from the value of the FPM, which can be used as the basis for fault detection. Three parameters with the highest cor-relation with EGT are selected from hundreds of measurable parameters by using GA, which are average EGT value T4,avg, compressor inlet temperature T1 and compressor out-let pressure P2. Zhu compared the modeling results of the SVM using different kernel functions and found that the linear kernel function has the best performance. Therefore, the SVM with linear kernel function is used to describe the FPM, as shown in the following equation:
( )4, 4, 1 2, ,i i avgT f T T P= (7)
The methods based on data-driven models also utilize the residual between the model outputs and the actual value for fault detection. In a model-based method, in ad-dition to using the residuals for fault detection, there are also fault detection methods us-ing modeling parameters.
2.6. Method Based on EGT Vector In [36], Liu integrated the prior knowledge of gas turbine, established an EGT model,
and used the modeling parameters to detect faults. The detection factor is called “EGT vector”. The mechanism of fault detection using modeling parameters is as follows. The gas turbine system can be described as:
Figure 7. Structure of established ANN in this method.
2.5. Method Based on Data-Driven Model
Data-driven models use historical data of gas turbines and do not require accuratephysical-mathematical models of the system. In recent years, the research of data-drivenmethods for gas turbine fault detection and diagnosis has attracted extensive attention [38–41].In [35], through a mechanism analysis, Zhu extracted the frequent pattern model (FPM) of theEGT and found that the FPM would not change without the change of structure. When thestructure changes, the actual EGT will deviate from the value of the FPM, which can be usedas the basis for fault detection. Three parameters with the highest correlation with EGT areselected from hundreds of measurable parameters by using GA, which are average EGT valueT4,avg, compressor inlet temperature T1 and compressor outlet pressure P2. Zhu compared themodeling results of the SVM using different kernel functions and found that the linear kernelfunction has the best performance. Therefore, the SVM with linear kernel function is used todescribe the FPM, as shown in the following equation:
T4,i = fi(T4,avg, T1, P2
)(7)
The methods based on data-driven models also utilize the residual between the modeloutputs and the actual value for fault detection. In a model-based method, in additionto using the residuals for fault detection, there are also fault detection methods usingmodeling parameters.
2.6. Method Based on EGT Vector
In [36], Liu integrated the prior knowledge of gas turbine, established an EGT model,and used the modeling parameters to detect faults. The detection factor is called “EGT vec-tor”. The mechanism of fault detection using modeling parameters is as follows. The gasturbine system can be described as:
yt = F(θt, Xt) + vt (8)
where yt and the variable Xt are measurable parameters, such as temperature, rotationalspeed, pressure, power, etc.; νt is the white noise independent of Xt; θt is the performanceparameter of the system. The performance parameter θt represents the inherent structuralcharacteristics of system. If there is no fault, the system structure is basically unchanged,and accordingly the performance parameters will not change. When the fault occurs, theperformance parameters change, which leads to the change of measurement parameters.Therefore, the change of performance parameters can be determined by observing thechanges of measurable parameters to realize the fault detection of gas turbine. In [36],Liu utilized this feature to establish an EGT vector for fault detection of combustionsystem. Liu used the prior knowledge of gas turbines and combined the principles ofthermodynamic to derive the EGT distribution model, as shown in Equation (9):
T4,i = αiT4,avg + βiT1 + σiP2 + ci (9)

Energies 2021, 14, 389 10 of 31
This is a multiple linear regression model where T4,i is the estimated EGT of the i-ththermocouple. Since βiT1 + σiP2 + ci is very small, only αi is used as the detection factor andall α make up EGT vector. The EGT vector is the performance parameters of this system, andit is obtained by using the measurable parameters according to the least square method. Whena certain αi exceeds the threshold, it proves that the combustion system has malfunctioned.
It can be found that the input parameters of this model are the same as those of thedata-driven model described in Section 2.5. It also shows that these three parameters arereasonable as the model inputs, but the difference is that Liu uses modeling parametersas detection factors, and the model is a multiple linear regression model; Zhu uses theresiduals for fault detection. What’s more, the established SVM model uses linear kernelfunction, but according to the principle of SVM and the architecture of SVM, as shown inFigure 8, the relationship between input parameters and output parameters is not a simplemultiple linear relationships, on the contrary, this is a non-linear mapping.
Energies 2021, 14, x FOR PEER REVIEW 10 of 32
( ),t t t ty F X vθ= + (8)
where yt and the variable Xt are measurable parameters, such as temperature, rotational speed, pressure, power, etc.; νt is the white noise independent of Xt; θt is the performance parameter of the system. The performance parameter θt represents the inherent structural characteristics of system. If there is no fault, the system structure is basically unchanged, and accordingly the performance parameters will not change. When the fault occurs, the performance parameters change, which leads to the change of measurement parameters. Therefore, the change of performance parameters can be determined by observing the changes of measurable parameters to realize the fault detection of gas turbine. In [36], Liu utilized this feature to establish an EGT vector for fault detection of combustion system. Liu used the prior knowledge of gas turbines and combined the principles of thermody-namic to derive the EGT distribution model, as shown in Equation (9):
4, 4, 1 2i i avg i i iT T T P cα β σ= + + + (9)
This is a multiple linear regression model where T4,i is the estimated EGT of the i-th thermocouple. Since βiT1 + σiP2 + ci is very small, only αi is used as the detection factor and all α make up EGT vector. The EGT vector is the performance parameters of this system, and it is obtained by using the measurable parameters according to the least square method. When a certain αi exceeds the threshold, it proves that the combustion system has malfunctioned.
It can be found that the input parameters of this model are the same as those of the data-driven model described in Section 2.5. It also shows that these three parameters are reasonable as the model inputs, but the difference is that Liu uses modeling parameters as detection factors, and the model is a multiple linear regression model; Zhu uses the residuals for fault detection. What’s more, the established SVM model uses linear kernel function, but according to the principle of SVM and the architecture of SVM, as shown in Figure 8, the relationship between input parameters and output parameters is not a simple multiple linear relationships, on the contrary, this is a non-linear mapping.
(1)x
(2)x
. . .( )x n
1( , )K X X
2( , )K X X
( , )mK X X
. . .
Output Y
Bias b
Inputs X
Kernel function Figure 8. Architecture of SVM.
3. Establish EGT Distribution Model for Comparative Study and Fault Simulation When using EGT distribution for fault detection, non-fault interference factors such
as ambient conditions, operating conditions, hot gas rotation and mixing will influence the fault signal in the EGT profile, which makes the change rules of EGT intricate and complicated. It is difficult to fully reveal the detection effect of various methods under the influence of different interference factors by using the actual operational data of gas tur-bines. In this section, the modular modeling idea is adopted to establish a gas turbine model that can be used for combustion system fault detection research. After completing the establishment of the model, the EGT distribution under different conditions is simu-lated.
Figure 8. Architecture of SVM.
3. Establish EGT Distribution Model for Comparative Study and Fault Simulation
When using EGT distribution for fault detection, non-fault interference factors suchas ambient conditions, operating conditions, hot gas rotation and mixing will influencethe fault signal in the EGT profile, which makes the change rules of EGT intricate andcomplicated. It is difficult to fully reveal the detection effect of various methods underthe influence of different interference factors by using the actual operational data of gasturbines. In this section, the modular modeling idea is adopted to establish a gas turbinemodel that can be used for combustion system fault detection research. After completing theestablishment of the model, the EGT distribution under different conditions is simulated.
The traditional gas turbine model simplifies the combustion system into a whole,which reflects the overall characteristics and can only reflect the characteristics of the aver-age EGT. In order to study the problem of gas turbine combustion system fault detection,which requires the gas turbine model to reflect the characteristics of EGT distribution,including the influence of combustion system fault on that. At the same time, the gasturbine model has to reflect the influence of various complex interference factors on theEGT distribution. The traditional gas turbine model obviously cannot meet the purposeof this paper. Therefore, the gas turbine model established in this section needs to havea multi-combustor burner structure, the fuel flow of each combustor can be controlledindependently, and the inherent structural characteristics of different combustors can alsobe reflected. In order to cooperate with the multi-combustor burner module, it is necessaryto establish a multi-channel turbine module to characterize the working process of thecorresponding combustor outlet gas in turbine. Besides, it is necessary to reflect the mixingand rotating process of hot gas in turbine channel.
The gas turbine model for combustion system fault detection is improved on the basisof the traditional model. Its atmospheric parameter module, compressor module and shaftdynamic module are similar to those of traditional gas turbine model, specific methods referto reference [42]. The main differences are the burner module, turbine module, mixing androtating module. In this section, a model based on the GE-9FA gas turbine will be established.

Energies 2021, 14, 389 11 of 31
3.1. Multi-Combustor Burner Module
In order to characterize the state of each combustor and reflect the differences betweenthem, the burner module cannot be simplified into a whole in the gas turbine model.The gas turbine model established in this section has 18 combustors. The modelingmethod of each combustor module is the same as that of single combustor in [42], andthe parameters of each combustor module can be set separately. The difference is that theenergy distribution coefficient µi of each combustor and the energy it can obtain Qi areintroduced, as shown in Equation (10). The µi of each combustor are different, which canreflect its inherent structural information. The flow path of each combustor is relativelyindependent and the inlet and outlet parameters are also independent. The structure of theimproved burner module is shown in Figure 9.
Qi = µi ·Q18∑
i=1µi = 1
(10)
Energies 2021, 14, x FOR PEER REVIEW 11 of 32
The traditional gas turbine model simplifies the combustion system into a whole, which reflects the overall characteristics and can only reflect the characteristics of the av-erage EGT. In order to study the problem of gas turbine combustion system fault detec-tion, which requires the gas turbine model to reflect the characteristics of EGT distribu-tion, including the influence of combustion system fault on that. At the same time, the gas turbine model has to reflect the influence of various complex interference factors on the EGT distribution. The traditional gas turbine model obviously cannot meet the purpose of this paper. Therefore, the gas turbine model established in this section needs to have a multi-combustor burner structure, the fuel flow of each combustor can be controlled in-dependently, and the inherent structural characteristics of different combustors can also be reflected. In order to cooperate with the multi-combustor burner module, it is necessary to establish a multi-channel turbine module to characterize the working process of the corresponding combustor outlet gas in turbine. Besides, it is necessary to reflect the mix-ing and rotating process of hot gas in turbine channel.
The gas turbine model for combustion system fault detection is improved on the basis of the traditional model. Its atmospheric parameter module, compressor module and shaft dynamic module are similar to those of traditional gas turbine model, specific methods refer to reference [42]. The main differences are the burner module, turbine module, mix-ing and rotating module. In this section, a model based on the GE-9FA gas turbine will be established.
3.1. Multi-Combustor Burner Module In order to characterize the state of each combustor and reflect the differences be-
tween them, the burner module cannot be simplified into a whole in the gas turbine model. The gas turbine model established in this section has 18 combustors. The modeling method of each combustor module is the same as that of single combustor in [42], and the parameters of each combustor module can be set separately. The difference is that the energy distribution coefficient μi of each combustor and the energy it can obtain Qi are introduced, as shown in Equation (10). The μi of each combustor are different, which can reflect its inherent structural information. The flow path of each combustor is relatively independent and the inlet and outlet parameters are also independent. The structure of the improved burner module is shown in Figure 9.
18
11
i i
ii
Q Qμ
μ=
= ⋅
= (10)
Figure 9. Burner module with multi-combustor.
Figure 9. Burner module with multi-combustor.
3.2. Multi-Channel Turbine Module
Firstly, we assume that the hot gas from each combustor does not mix, and thenexpands to work in the turbine channel. In order to correspond with the burner module, it isnecessary to establish the virtual turbine sub-module with the same number of combustors.Each virtual turbine sub-module is treated as a turbine channel to characterizes the workingprocess of the corresponding combustor outlet hot gas in turbine. The sum of all virtualturbines’ work is the total work of the gas turbine. The modeling process of each turbinechannel is similar to that of traditional model in [42]. The established multi-channel turbinemodule is shown in Figure 10.
Energies 2021, 14, x FOR PEER REVIEW 12 of 32
3.2. Multi-Channel Turbine Module Firstly, we assume that the hot gas from each combustor does not mix, and then ex-
pands to work in the turbine channel. In order to correspond with the burner module, it is necessary to establish the virtual turbine sub-module with the same number of combus-tors. Each virtual turbine sub-module is treated as a turbine channel to characterizes the working process of the corresponding combustor outlet hot gas in turbine. The sum of all virtual turbines’ work is the total work of the gas turbine. The modeling process of each turbine channel is similar to that of traditional model in [42]. The established multi-chan-nel turbine module is shown in Figure 10.
Figure 10. Multi-channel turbine module.
3.3. Mixing Module In Section 3.2, it is assumed that the gases from each combustor does not mix with
each other. In fact, there is mixing between hot gases, and the mixing process can be di-vided into three stages. The first is the mixing of the hot gas in the transition between the burner outlet and the turbine inlet; the second is the mixing between the turbine stator and the blades; finally, there is mixing between the turbine outlet and the thermocouples. In this paper, these three mixing stages are combined into a total mixing module for mod-eling purposes.
The sensors for measuring the outlet temperature of gas turbines are evenly arranged in the circumferential direction at the turbine outlet, and the number of thermocouples is not necessarily the same as that of combustors. Taking the GE-9FA heavy-duty gas turbine as an example, it has 18 combustors and 31 thermocouples at the turbine outlet. As shown in Figure 11, the position of the #18 combustor is defined as 0° in this paper. At the same time, the influence rule of each combustor on temperature is that the center is the highest, and the farther away from the center, the lower the temperature. Therefore, the tempera-ture at each position of the turbine outlet is the result of the common influence of multi-combustor. We refer to the solution in [27], assuming that the gas flows in a straight line in turbine, and the influence of each combustor on temperature is normally distributed, as shown in Figure 12.
Figure 10. Multi-channel turbine module.

Energies 2021, 14, 389 12 of 31
3.3. Mixing Module
In Section 3.2, it is assumed that the gases from each combustor does not mix with eachother. In fact, there is mixing between hot gases, and the mixing process can be divided intothree stages. The first is the mixing of the hot gas in the transition between the burner outletand the turbine inlet; the second is the mixing between the turbine stator and the blades;finally, there is mixing between the turbine outlet and the thermocouples. In this paper, thesethree mixing stages are combined into a total mixing module for modeling purposes.
The sensors for measuring the outlet temperature of gas turbines are evenly arrangedin the circumferential direction at the turbine outlet, and the number of thermocouplesis not necessarily the same as that of combustors. Taking the GE-9FA heavy-duty gasturbine as an example, it has 18 combustors and 31 thermocouples at the turbine outlet. Asshown in Figure 11, the position of the #18 combustor is defined as 0◦ in this paper. At thesame time, the influence rule of each combustor on temperature is that the center is thehighest, and the farther away from the center, the lower the temperature. Therefore, thetemperature at each position of the turbine outlet is the result of the common influence ofmulti-combustor. We refer to the solution in [27], assuming that the gas flows in a straightline in turbine, and the influence of each combustor on temperature is normally distributed,as shown in Figure 12.
Energies 2021, 14, x FOR PEER REVIEW 13 of 32
Figure 11. Combustors and thermocouples distribution of GE-9FA.
Figure 12. Influence of multi-combustor on burner outlet temperature.
Finally, the turbine outlet temperature distribution function is shown as follows:
( ) ( )
( ) [ ]
54
4 41
2
exp , 2 4
profile jj
j
jj
T x T f x
xf x A x
απ π
σ
=
= ⋅
− = ⋅ − ∈
,
(11)
where x is the position of a certain point at the turbine outlet; fj(x) is the influence function of the j-th combustor on exhaust temperature (T4); aj is the position of the j-th combustor; A and σ are two constants; is the EGT.
3.4. Rotating Module After the hot gas from the combustor enters the turbine, it will rotate at a certain
angle with the rotation of turbine. In this paper, according to the method mentioned in [43], the velocity triangle theory is used to calculate the swirl angle. The reference model in this paper is a GE-9FA, which has a three-stage turbine, so the swirl angle to be calcu-lated is shown in Table 2, and the velocity triangle of hot gas in turbine is shown in Figure 13.
Figure 11. Combustors and thermocouples distribution of GE-9FA.
Energies 2021, 14, x FOR PEER REVIEW 13 of 32
Figure 11. Combustors and thermocouples distribution of GE-9FA.
Figure 12. Influence of multi-combustor on burner outlet temperature.
Finally, the turbine outlet temperature distribution function is shown as follows:
( ) ( )
( ) [ ]
54
4 41
2
exp , 2 4
profile jj
j
jj
T x T f x
xf x A x
απ π
σ
=
= ⋅
− = ⋅ − ∈
,
(11)
where x is the position of a certain point at the turbine outlet; fj(x) is the influence function of the j-th combustor on exhaust temperature (T4); aj is the position of the j-th combustor; A and σ are two constants; is the EGT.
3.4. Rotating Module After the hot gas from the combustor enters the turbine, it will rotate at a certain
angle with the rotation of turbine. In this paper, according to the method mentioned in [43], the velocity triangle theory is used to calculate the swirl angle. The reference model in this paper is a GE-9FA, which has a three-stage turbine, so the swirl angle to be calcu-lated is shown in Table 2, and the velocity triangle of hot gas in turbine is shown in Figure 13.
Figure 12. Influence of multi-combustor on burner outlet temperature.
Finally, the turbine outlet temperature distribution function is shown as follows:
Tpro f ile4 (x) =
54∑
j=1T j
4 · f j(x)
f j(x) = A · exp(−( x−αj
σ
)2)
, x ∈ [2π, 4π]
(11)

Energies 2021, 14, 389 13 of 31
where x is the position of a certain point at the turbine outlet; fj(x) is the influence functionof the j-th combustor on exhaust temperature (T4); aj is the position of the j-th combustor;
A and σ are two constants; Tpro f ile4 is the EGT.
3.4. Rotating Module
After the hot gas from the combustor enters the turbine, it will rotate at a certain anglewith the rotation of turbine. In this paper, according to the method mentioned in [43], thevelocity triangle theory is used to calculate the swirl angle. The reference model in thispaper is a GE-9FA, which has a three-stage turbine, so the swirl angle to be calculated isshown in Table 2, and the velocity triangle of hot gas in turbine is shown in Figure 13.
Table 2. Calculation of Swirl Angle.
Names Symbols
The first stageSwirl angle in the first stage stator
Swirl angle between the first stage blade and statorSwirl angle in the first stage blade
d11
d12
d13
Swirl angle between the first and the second stage d14
The second stage
Swirl angle in the second stage statorSwirl angle between the second stage blade and
statorSwirl angle in the second stage blade
d21
d22
d23
Swirl angle between the second and the third stage d24
The third stage
Swirl angle in the third stage statorSwirl angle between the third stage blade and stator
Swirl angle in the third stage bladeSwirl angle in the exhaust pipe
d31
d32
d23
d5
Energies 2021, 14, x FOR PEER REVIEW 14 of 32
Table 2. Calculation of Swirl Angle.
Names Symbols
The first stage Swirl angle in the first stage stator
Swirl angle between the first stage blade and stator Swirl angle in the first stage blade
Swirl angle between the first and the second stage
The second stage Swirl angle in the second stage stator
Swirl angle between the second stage blade and stator Swirl angle in the second stage blade
Swirl angle between the second and the third stage
The third stage
Swirl angle in the third stage stator Swirl angle between the third stage blade and stator
Swirl angle in the third stage blade Swirl angle in the exhaust pipe
The first stage stator
The second stage stator
The first stage blade
12α
1b
11d
2
1d
3
1d
14d
21d
1u
2u
12β
12w
0c
1L
12c
11β11w
11α1u
11c
1u1d
Figure 13. Calculation diagram of gas swirl angle based on velocity triangle.
Where, c0 is the inlet velocity of the first stage stator; is the absolute velocity at the outlet of the first stage stator; is the relative velocity at the outlet of the first stage stator; u1 is the circumferential velocity of the first stage blade; b1 is the axial distance be-tween the first stage stator and the first stage blade; d1 is the axial distance between the first stage blade and the second stage stator; the velocity triangle of the second stage and the third stage turbine are similar to this. The swirl angles in Table 2 can be calculated by using the velocity triangle theory. The swirl angle D is:
( )=
+++++=3
15
24
14321
i
iii ddddddD (12)
In Section 3.3, it is assumed that the hot gas flows along a straight line in the turbine. Here, the swirl angle of hot gas in turbine is used to modify Equation (11), and the EGT distribution function considering mixing and rotating is obtained:
Figure 13. Calculation diagram of gas swirl angle based on velocity triangle.
Where, c0 is the inlet velocity of the first stage stator; c11 is the absolute velocity at the
outlet of the first stage stator; w11 is the relative velocity at the outlet of the first stage stator;
u1 is the circumferential velocity of the first stage blade; b1 is the axial distance between thefirst stage stator and the first stage blade; d1 is the axial distance between the first stageblade and the second stage stator; the velocity triangle of the second stage and the third

Energies 2021, 14, 389 14 of 31
stage turbine are similar to this. The swirl angles in Table 2 can be calculated by using thevelocity triangle theory. The swirl angle D is:
D =3
∑i=1
(di
1 + di2 + di
3
)+ d1
4 + d24 + d5 (12)
In Section 3.3, it is assumed that the hot gas flows along a straight line in the turbine.Here, the swirl angle of hot gas in turbine is used to modify Equation (11), and the EGTdistribution function considering mixing and rotating is obtained:
Tpro f ile4 (x) =
54∑
j=1T j
4 · f ′j (x)
f ′j (x) = A · exp(−( x−αj−D
σ
)2)
, x ∈ [2π, 4π]
(13)
3.5. Overall Model
The distribution model established in this paper is the same as the traditional gasturbine in the components of compressor module, ambient module and shaft dynamicmodule, etc., so it is not necessary to go into details here. The gas turbine circumferentialtemperature distribution model for combustion system fault detection based on the GE-9FAis shown in Figure 14 where g is the flow; P2, P3 are the compressor outlet pressure andturbine inlet pressure, respectively; T is the temperature; n is the rotational speed; Pc, Pt,Pf are the compressor power consumption, turbine power and load power, respectively.This model has a multi-combustor burner and a multi-channel turbine structure, cancharacterize the mixing and rotating effects of gas in turbine and can simulate the influenceof many factors on EGT distribution, such as changes in ambient conditions, fuel flowfluctuations, fuel flow changes in each combustor, combustion efficiency changes, andcomponent performance degradation.
Energies 2021, 14, x FOR PEER REVIEW 15 of 32
( ) ( )
( ) [ ]
54'
4 41
2' exp , 2 4
profile jj
j
jj
T x T f x
x Df x A x
απ π
σ
=
= ⋅
− − = ⋅ − ∈
,
(13)
3.5. Overall Model The distribution model established in this paper is the same as the traditional gas
turbine in the components of compressor module, ambient module and shaft dynamic module, etc., so it is not necessary to go into details here. The gas turbine circumferential temperature distribution model for combustion system fault detection based on the GE-9FA is shown in Figure 14 where g is the flow; P2, P3 are the compressor outlet pressure and turbine inlet pressure, respectively; T is the temperature; n is the rotational speed; Pc, Pt, Pf are the compressor power consumption, turbine power and load power, respec-tively. This model has a multi-combustor burner and a multi-channel turbine structure, can characterize the mixing and rotating effects of gas in turbine and can simulate the influence of many factors on EGT distribution, such as changes in ambient conditions, fuel flow fluctuations, fuel flow changes in each combustor, combustion efficiency changes, and component performance degradation.
,2mg 2 2 P T
n cP
3 3 P T
n
TurbinePassage
1#
TurbinePassage
18#
ⅡⅡ
BlendingModule
RotatingModule
&
,3mg
tP
T
T
T
,3mg
2 2 P T 3 3 P T
,2mgCombustionChamber
1#
CombustionChamber
18#
......
Burner Module
ncP
tP
fP
Compressor Module Shaft Dynamic ModuleTurbine Module
Ambient ConditionModule
Fuel
Load
Exhaust Gas cool cool coolg P T
Figure 14. Circumferential temperature distribution model for combustion system fault detection.
3.6. Fault Simulation Due to the fact that it is difficult for actual gas turbine operation data to fully reveal
the influence of various interference factors on EGT, and the operational data of different interference factors coupled with combustion system fault is scarce, it is impossible to compare the detection effect of the various detection methods under different conditions. Therefore, it is necessary to use the model to simulate the EGT distribution when different interference factors are coupled with combustion system faults and systematically com-pare the detection effect of the selected methods by using simulated data. This paper will simulate the EGT distribution when the combustor fails, the coupling of faults and ambi-ent temperature changes, the coupling of faults and atmospheric pressure changes, the coupling of faults and compressor performance degradation and the coupling of faults and fuel flow changes.
Figure 14. Circumferential temperature distribution model for combustion system fault detection.
3.6. Fault Simulation
Due to the fact that it is difficult for actual gas turbine operation data to fully revealthe influence of various interference factors on EGT, and the operational data of differentinterference factors coupled with combustion system fault is scarce, it is impossible to comparethe detection effect of the various detection methods under different conditions. Therefore, it isnecessary to use the model to simulate the EGT distribution when different interference factors

Energies 2021, 14, 389 15 of 31
are coupled with combustion system faults and systematically compare the detection effect ofthe selected methods by using simulated data. This paper will simulate the EGT distributionwhen the combustor fails, the coupling of faults and ambient temperature changes, thecoupling of faults and atmospheric pressure changes, the coupling of faults and compressorperformance degradation and the coupling of faults and fuel flow changes.
The first is the fault simulation of the combustion system. The typical faults ofcombustion systems include uneven fuel distribution, carbon deposition in fuel nozzles,jamming of nozzles and burning through of flame tube. Various fault factors will cause thefuel flow fluctuation or combustion efficiency fluctuation of the failure combustor, whichwill lead to the change of energy generated in the combustor, which is represented by thechange of energy distribution coefficient (µi). Therefore, in the combustion system faultsetting, various faults are represented as fluctuations in the µi of the combustor. In thispaper, the µi of the faulty combustor is set to decrease slowly within 5000 s and then stopdeveloping. As for changes in ambient temperature and atmospheric pressure, we setthe corresponding changes in the ambient condition module. This paper sets the ambienttemperature to rise by 10 ◦C in 5000 s and the atmospheric pressure to drop by 100 Pa in5000 s, respectively, accompanied by the fault of a combustor. With the operation of thegas turbine, fouling and blade wear will occur in the compressor, which leads to a slightdecrease in its efficiency. In the simulation, the compressor efficiency is set to drop by5% within 5000 s, accompanied by the fault of a combustor. During the operation of gasturbine, the load change will lead to the change of fuel flow. Here, we simulate the fuel flowincreases by 5% in 5000 s, accompanied by the combustor fault. Due to the space limitation,this section only shows the EGT of single fault and the EGT when the fault is coupledwith ambient temperature increases, as shown in Figure 15. Among them, different colorsrepresent different thermocouples. It can be seen that the #27 and #28 thermocouples aresignificantly affected by the faulty combustor.
Energies 2021, 14, x FOR PEER REVIEW 16 of 32
The first is the fault simulation of the combustion system. The typical faults of com-bustion systems include uneven fuel distribution, carbon deposition in fuel nozzles, jam-ming of nozzles and burning through of flame tube. Various fault factors will cause the fuel flow fluctuation or combustion efficiency fluctuation of the failure combustor, which will lead to the change of energy generated in the combustor, which is represented by the change of energy distribution coefficient (μi). Therefore, in the combustion system fault setting, various faults are represented as fluctuations in the μi of the combustor. In this paper, the μi of the faulty combustor is set to decrease slowly within 5000 s and then stop developing. As for changes in ambient temperature and atmospheric pressure, we set the corresponding changes in the ambient condition module. This paper sets the ambient tem-perature to rise by 10 °C in 5000 s and the atmospheric pressure to drop by 100 Pa in 5000 s, respectively, accompanied by the fault of a combustor. With the operation of the gas turbine, fouling and blade wear will occur in the compressor, which leads to a slight de-crease in its efficiency. In the simulation, the compressor efficiency is set to drop by 5% within 5000 s, accompanied by the fault of a combustor. During the operation of gas tur-bine, the load change will lead to the change of fuel flow. Here, we simulate the fuel flow increases by 5% in 5000 s, accompanied by the combustor fault. Due to the space limita-tion, this section only shows the EGT of single fault and the EGT when the fault is coupled with ambient temperature increases, as shown in Figure 15. Among them, different colors represent different thermocouples. It can be seen that the #27 and #28 thermocouples are significantly affected by the faulty combustor.
(a) (b)
Figure 15. Change of EGT under different situation: (a) Single fault; (b) Fault couples with ambient temperature increases
4. Sensitivity Factor and Comparison In this section, we introduce how to compare the detection effects of each methods,
and use the simulation data in Section 3 to test the detection effect of the selected methods.
4.1. Sensitivity Factor In the Introduction, it was introduced that the EGT is affected by many interference
factors, such as changes in ambient conditions, operating conditions, component perfor-mance degradation, fluctuations in fuel flow, rotation and the blending of hot gases. The faint information of temperature changes caused by combustion system faults will be sub-merged by these strong interference signals. From the perspective of pattern recognition, the samples of normal operation and abnormal operation can be regarded as different classes. As shown in Figure 16a, due to the influence of various interference factors, the intra-class distance is too large, the inter-class distance between the normal and abnormal class samples is too small. This causes the boundary between the normal and the abnormal class samples is fuzzy and it cannot be distinguished. This makes the sensitive detection
Figure 15. Change of EGT under different situation: (a) Single fault; (b) Fault couples with ambienttemperature increases.
4. Sensitivity Factor and Comparison
In this section, we introduce how to compare the detection effects of each methods,and use the simulation data in Section 3 to test the detection effect of the selected methods.
4.1. Sensitivity Factor
In the Introduction, it was introduced that the EGT is affected by many interferencefactors, such as changes in ambient conditions, operating conditions, component perfor-mance degradation, fluctuations in fuel flow, rotation and the blending of hot gases. Thefaint information of temperature changes caused by combustion system faults will be sub-merged by these strong interference signals. From the perspective of pattern recognition,the samples of normal operation and abnormal operation can be regarded as differentclasses. As shown in Figure 16a, due to the influence of various interference factors, the

Energies 2021, 14, 389 16 of 31
intra-class distance is too large, the inter-class distance between the normal and abnormalclass samples is too small. This causes the boundary between the normal and the abnormalclass samples is fuzzy and it cannot be distinguished. This makes the sensitive detection ofthe combustion system faults more difficult and it is difficult for the monitoring systemto detect the abnormality in time and give an alarm in an early stages of faults. However,if the fault detection method can suppress the influence of various non-fault interferencefactors, compress the intra-class distance, and expand the inter-class distance, reduce oreven eliminate the class overlapping, as shown in Figure 16b, this can achieve the sensitivedetection of early faults, detect anomalies in a timely way and send out alarms, which caneffectively prevent the huge losses caused by the deterioration of the faults. The methodthat can achieve such a detection effect is a good method.
Energies 2021, 14, x FOR PEER REVIEW 17 of 32
of the combustion system faults more difficult and it is difficult for the monitoring system to detect the abnormality in time and give an alarm in an early stages of faults. However, if the fault detection method can suppress the influence of various non-fault interference factors, compress the intra-class distance, and expand the inter-class distance, reduce or even eliminate the class overlapping, as shown in Figure 16b, this can achieve the sensitive detection of early faults, detect anomalies in a timely way and send out alarms, which can effectively prevent the huge losses caused by the deterioration of the faults. The method that can achieve such a detection effect is a good method.
Therefore, the sensitivity of the detection method can be measured by the ratio of inter-class distance to intra-class distance [44], as shown in Equation (14). The larger the ratio is, the easier the normal and abnormal samples can be distinguished, and the earlier the faults can be detected. However, the requirements of calculation intra-class distance and inter-class distance are extremely high to sample data, and the data measured by gas turbine monitoring system can hardly meet the requirements. Therefore, according to this idea, this paper defines a parameter, sensitivity factor K. It is the ratio of the deviation (d1) of the detection factor before and after fault to the threshold bandwidth (d2), as shown in Equation (15), the d1 and d2 are shown Detection result of the method based on EGT spatial characteristic in single fault.
01
bSKS
= (14)
1
2
dKd
= (15)
1 2 intra-class distance inter-class
distance
b
SSS
1S 1S2S 2S
bS bS
( )a ( )b
Figure 16. Intra-class and inter-class in pattern recognition.
The deviation of the detection factor (d1) corresponds to the inter-class distance, and the width of the threshold band (d2) corresponds to the intra-class distance. The larger the K value is, the more the detection method can suppress the influence of interference fac-tors and the more sensitive it is on early faint faults. At the same time, the time (t) required to detect fault is also taken as a comparative parameter. The shorter the time required, the more sensitive the detection method is too. After determining how to compare the test results, the follow-up contents are the comparative study of the selected methods in dif-ferent situations.
4.2. Single Fault Under this situation, the set operating state is that the gas turbine runs normally in
the first 5000 s, a soft fault occurs in a combustor at 5000–10,000 s, and the fault stops developing at 10,000 s. Because the fault combustor has the greatest impact on the #27 thermocouple, as shown in Figure 15, the detection results of some methods only show
Figure 16. Intra-class and inter-class in pattern recognition.
Therefore, the sensitivity of the detection method can be measured by the ratio ofinter-class distance to intra-class distance [44], as shown in Equation (14). The larger theratio is, the easier the normal and abnormal samples can be distinguished, and the earlierthe faults can be detected. However, the requirements of calculation intra-class distanceand inter-class distance are extremely high to sample data, and the data measured by gasturbine monitoring system can hardly meet the requirements. Therefore, according to thisidea, this paper defines a parameter, sensitivity factor K. It is the ratio of the deviation (d1)of the detection factor before and after fault to the threshold bandwidth (d2), as shown inEquation (15), the d1 and d2 are shown Detection result of the method based on EGT spatialcharacteristic in single fault.
K0 =SbS1
(14)
K =d1
d2(15)
The deviation of the detection factor (d1) corresponds to the inter-class distance, andthe width of the threshold band (d2) corresponds to the intra-class distance. The larger theK value is, the more the detection method can suppress the influence of interference factorsand the more sensitive it is on early faint faults. At the same time, the time (t) requiredto detect fault is also taken as a comparative parameter. The shorter the time required,the more sensitive the detection method is too. After determining how to compare thetest results, the follow-up contents are the comparative study of the selected methods indifferent situations.
4.2. Single Fault
Under this situation, the set operating state is that the gas turbine runs normally in thefirst 5000 s, a soft fault occurs in a combustor at 5000–10,000 s, and the fault stops developingat 10,000 s. Because the fault combustor has the greatest impact on the #27 thermocouple, asshown in Figure 15, the detection results of some methods only show the monitoring of the#27 thermocouple. The test results of the six selected methods are as follows.

Energies 2021, 14, 389 17 of 31
4.2.1. Detection Result of GE’s MARK VI Monitoring System
This detection method utilizes the EGT dispersion for fault detection. The unit oftemperature in the data is ◦C and after converting it to ◦F, we calculate the allowabledispersion S and maximum exhaust temperature dispersion S1, and calculate their ratio.For a single fault, the detection result is shown in Figure 17. It can be seen from the resultthat the ratio of maximum temperature dispersion to allowable dispersion increased in theprocess, but it did not exceed the threshold, namely 1. According to its alarm mechanism,shown in Figure 4, the monitoring system will not give an alarm in this process.
Energies 2021, 14, x FOR PEER REVIEW 18 of 32
the monitoring of the #27 thermocouple. The test results of the six selected methods are as follows.
4.2.1. Detection Result of GE’s MARK VI Monitoring System This detection method utilizes the EGT dispersion for fault detection. The unit of
temperature in the data is °C and after converting it to °F, we calculate the allowable dis-persion S and maximum exhaust temperature dispersion S1, and calculate their ratio. For a single fault, the detection result is shown in Figure 17. It can be seen from the result that the ratio of maximum temperature dispersion to allowable dispersion increased in the process, but it did not exceed the threshold, namely 1. According to its alarm mechanism, shown in Figure 4, the monitoring system will not give an alarm in this process.
Figure 17. Detection result of MARK VI system in single fault.
4.2.2. Detection Result of Siemens’ TXP Monitoring System The hot protection of TXP monitoring system utilizes the deviation (r1) between the
maximum EGT and the average EGT for fault detection; while the cold protection is to monitor the value (r2, r3) that the temperature of two consecutive measuring points lower than the average EGT. Referring to the protection temperature introduced in [45], 30 °C is selected as the hot protection deviation threshold, and 50 °C is the cold protection thresh-old. That is, when the deviation exceeds the threshold value, the system will give an alarm. The result is shown in Figure 18. It can be seen from the detection result that the deviation of the cold protection has increased significantly, but the deviation has never exceeded the alarm threshold. According to its alarm mechanism, the system also did not issue an alarm during the entire process.
Figure 18. Detection result of TXP system in single fault.
1000 3000 5000 7000 9000 11,000 13,000 15,000time/ s
0.2
0.3
0.4
0.5
0.6
0.7
0.8detection result of GE's MARK VI system
1000 3000 5000 7000 9000 11,000 13,000 15,000time/ s
5
10
15hot protection
1000 5000 10,000 15,000time/ s
-10
0
10
20
cold protection
1000 5000 10,000 15,000time/ s
-10
0
10
20
30cold protection
Figure 17. Detection result of MARK VI system in single fault.
4.2.2. Detection Result of Siemens’ TXP Monitoring System
The hot protection of TXP monitoring system utilizes the deviation (r1) between themaximum EGT and the average EGT for fault detection; while the cold protection is tomonitor the value (r2, r3) that the temperature of two consecutive measuring points lowerthan the average EGT. Referring to the protection temperature introduced in [45], 30 ◦C isselected as the hot protection deviation threshold, and 50 ◦C is the cold protection threshold.That is, when the deviation exceeds the threshold value, the system will give an alarm. Theresult is shown in Figure 18. It can be seen from the detection result that the deviation ofthe cold protection has increased significantly, but the deviation has never exceeded thealarm threshold. According to its alarm mechanism, the system also did not issue an alarmduring the entire process.
Energies 2021, 14, x FOR PEER REVIEW 18 of 32
the monitoring of the #27 thermocouple. The test results of the six selected methods are as follows.
4.2.1. Detection Result of GE’s MARK VI Monitoring System This detection method utilizes the EGT dispersion for fault detection. The unit of
temperature in the data is °C and after converting it to °F, we calculate the allowable dis-persion S and maximum exhaust temperature dispersion S1, and calculate their ratio. For a single fault, the detection result is shown in Figure 17. It can be seen from the result that the ratio of maximum temperature dispersion to allowable dispersion increased in the process, but it did not exceed the threshold, namely 1. According to its alarm mechanism, shown in Figure 4, the monitoring system will not give an alarm in this process.
Figure 17. Detection result of MARK VI system in single fault.
4.2.2. Detection Result of Siemens’ TXP Monitoring System The hot protection of TXP monitoring system utilizes the deviation (r1) between the
maximum EGT and the average EGT for fault detection; while the cold protection is to monitor the value (r2, r3) that the temperature of two consecutive measuring points lower than the average EGT. Referring to the protection temperature introduced in [45], 30 °C is selected as the hot protection deviation threshold, and 50 °C is the cold protection thresh-old. That is, when the deviation exceeds the threshold value, the system will give an alarm. The result is shown in Figure 18. It can be seen from the detection result that the deviation of the cold protection has increased significantly, but the deviation has never exceeded the alarm threshold. According to its alarm mechanism, the system also did not issue an alarm during the entire process.
Figure 18. Detection result of TXP system in single fault.
1000 3000 5000 7000 9000 11,000 13,000 15,000time/ s
0.2
0.3
0.4
0.5
0.6
0.7
0.8detection result of GE's MARK VI system
1000 3000 5000 7000 9000 11,000 13,000 15,000time/ s
5
10
15hot protection
1000 5000 10,000 15,000time/ s
-10
0
10
20
cold protection
1000 5000 10,000 15,000time/ s
-10
0
10
20
30cold protection
Figure 18. Detection result of TXP system in single fault.

Energies 2021, 14, 389 18 of 31
4.2.3. Detection Result of the Method Based on EGT Spatial Characteristic
This model-based method utilizes the residuals between the estimated and actual EGTfor fault detection. Firstly, the data of the first 5000 s without fault is used to train model,and the detection threshold is determined according to Pauta criterion. This criterion is:
ri = T4,i −∧T4,i
σ =
√n∑
i=1
(ri− 1
n
n∑
i=1ri
)2
n−1
(16)
where, n is the number of samples in the training set. According to the Pauta criterion, asshown in Figure 19, set the detection threshold to (-3σ, 3σ). When the residuals exceed thisrange, it is considered that a fault occurs.
Energies 2021, 14, x FOR PEER REVIEW 19 of 32
4.2.3. Detection Result of the Method Based on EGT Spatial Characteristic
This model-based method utilizes the residuals between the estimated and actual EGT for fault detection. Firstly, the data of the first 5000 s without fault is used to train model, and the detection threshold is determined according to Pauta criterion. This crite-rion is:
4,4,
2
1 1
1
=1
ii i
n n
i ii i
r T T
r rn
nσ
∧
= =
= −
−
−
(16)
where, n is the number of samples in the training set. According to the Pauta criterion, as shown in Figure 19, set the detection threshold to (‒3σ, 3σ). When the residuals exceed this range, it is considered that a fault occurs.
+3σ-3σ -2σ -1σ O +1σ +2σ
99.73%95.45%68.27%
Φ(δ)
δ
Figure 19. The diagram of Pauta criterion.
Since the temperature of #27 thermocouple has the largest difference before and after the fault, it is modeled here. We select the temperature of #10, #11, #12, #13 thermocouples which are opposite to #27 thermocouple and rotational speed as inputs, and the output is the estimated temperature of #27 thermocouple. The unstable data of the first 50 s when the model is in the transition phase is removed. The residuals variation is shown in Figure 20. The detection threshold determined by the Pauta criterion is (−8.253, 8.253). The detec-tion result of the model based on EGT spatial characteristics is shown in Figure 21. The blue line represents the change of residuals, and the black line is the threshold band.
Figure 20. Prediction error.
50 1000 2000 3000 4000 5000time/s
-10
-8
-6
-4
-2
0
2
4
6
8 Prediction error
Figure 19. The diagram of Pauta criterion.
Since the temperature of #27 thermocouple has the largest difference before and afterthe fault, it is modeled here. We select the temperature of #10, #11, #12, #13 thermocoupleswhich are opposite to #27 thermocouple and rotational speed as inputs, and the output isthe estimated temperature of #27 thermocouple. The unstable data of the first 50 s when themodel is in the transition phase is removed. The residuals variation is shown in Figure 20.The detection threshold determined by the Pauta criterion is (−8.253, 8.253). The detectionresult of the model based on EGT spatial characteristics is shown in Figure 21. The blueline represents the change of residuals, and the black line is the threshold band.
Energies 2021, 14, x FOR PEER REVIEW 19 of 32
4.2.3. Detection Result of the Method Based on EGT Spatial Characteristic
This model-based method utilizes the residuals between the estimated and actual EGT for fault detection. Firstly, the data of the first 5000 s without fault is used to train model, and the detection threshold is determined according to Pauta criterion. This crite-rion is:
4,4,
2
1 1
1
=1
ii i
n n
i ii i
r T T
r rn
nσ
∧
= =
= −
−
−
(16)
where, n is the number of samples in the training set. According to the Pauta criterion, as shown in Figure 19, set the detection threshold to (‒3σ, 3σ). When the residuals exceed this range, it is considered that a fault occurs.
+3σ-3σ -2σ -1σ O +1σ +2σ
99.73%95.45%68.27%
Φ(δ)
δ
Figure 19. The diagram of Pauta criterion.
Since the temperature of #27 thermocouple has the largest difference before and after the fault, it is modeled here. We select the temperature of #10, #11, #12, #13 thermocouples which are opposite to #27 thermocouple and rotational speed as inputs, and the output is the estimated temperature of #27 thermocouple. The unstable data of the first 50 s when the model is in the transition phase is removed. The residuals variation is shown in Figure 20. The detection threshold determined by the Pauta criterion is (−8.253, 8.253). The detec-tion result of the model based on EGT spatial characteristics is shown in Figure 21. The blue line represents the change of residuals, and the black line is the threshold band.
Figure 20. Prediction error.
50 1000 2000 3000 4000 5000time/s
-10
-8
-6
-4
-2
0
2
4
6
8 Prediction error
Figure 20. Prediction error.
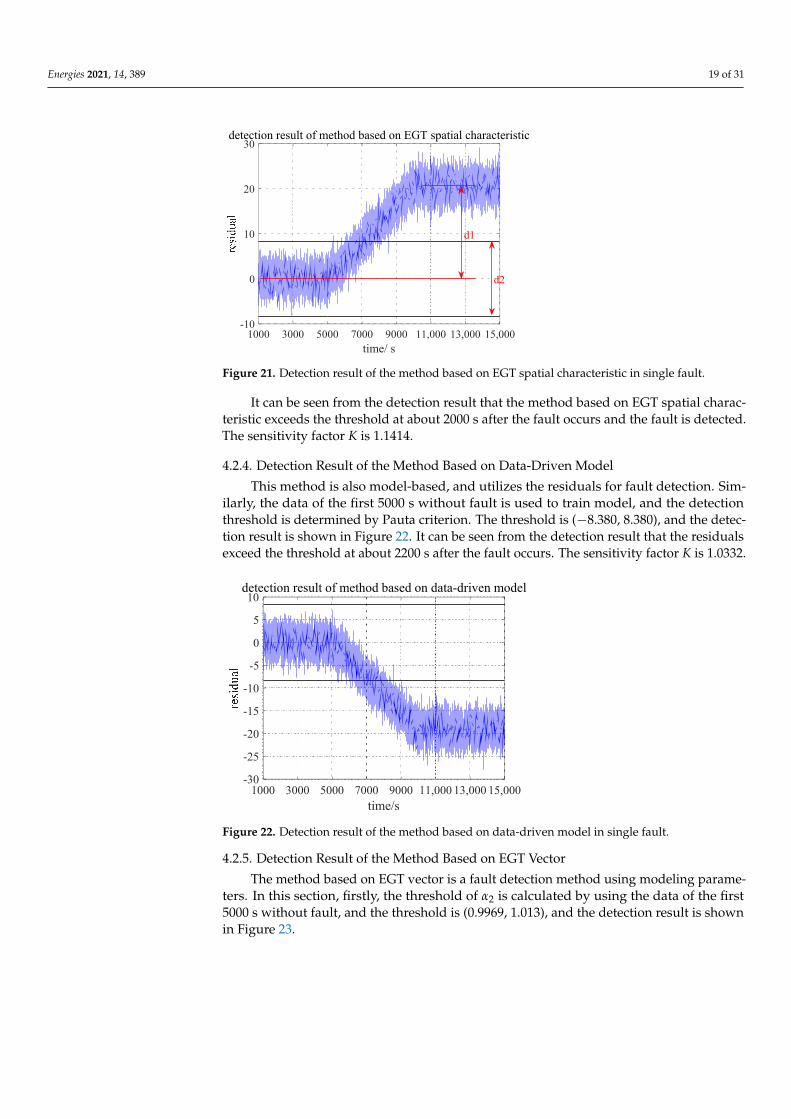
Energies 2021, 14, 389 19 of 31Energies 2021, 14, x FOR PEER REVIEW 20 of 32
Figure 21. Detection result of the method based on EGT spatial characteristic in single fault.
It can be seen from the detection result that the method based on EGT spatial charac-teristic exceeds the threshold at about 2000 s after the fault occurs and the fault is detected. The sensitivity factor K is 1.1414.
4.2.4. Detection Result of the Method Based on Data-Driven Model This method is also model-based, and utilizes the residuals for fault detection. Simi-
larly, the data of the first 5000 s without fault is used to train model, and the detection threshold is determined by Pauta criterion. The threshold is (−8.380, 8.380), and the detec-tion result is shown in Figure 22. It can be seen from the detection result that the residuals exceed the threshold at about 2200 s after the fault occurs. The sensitivity factor K is 1.0332.
Figure 22. Detection result of the method based on data-driven model in single fault.
4.2.5. Detection Result of the Method Based on EGT Vector The method based on EGT vector is a fault detection method using modeling param-
eters. In this section, firstly, the threshold of α2 is calculated by using the data of the first 5000 s without fault, and the threshold is (0.9969, 1.013), and the detection result is shown in Figure 23.
It can be seen from the detection result that the method based on EGT vector exceeds the threshold at about 1200 s after the fault occurs. The sensitivity factor K is 1.4073.
1000 3000 5000 7000 9000 11,000 13,000 15,000time/ s
-10
0
10
20
30detection result of method based on EGT spatial characteristic
d1
d2
1000 3000 5000 7000 9000 11,000 13,000 15,000time/s
-30
-25
-20
-15
-10
-5
0
5
10detection result of method based on data-driven model
Figure 21. Detection result of the method based on EGT spatial characteristic in single fault.
It can be seen from the detection result that the method based on EGT spatial charac-teristic exceeds the threshold at about 2000 s after the fault occurs and the fault is detected.The sensitivity factor K is 1.1414.
4.2.4. Detection Result of the Method Based on Data-Driven Model
This method is also model-based, and utilizes the residuals for fault detection. Sim-ilarly, the data of the first 5000 s without fault is used to train model, and the detectionthreshold is determined by Pauta criterion. The threshold is (−8.380, 8.380), and the detec-tion result is shown in Figure 22. It can be seen from the detection result that the residualsexceed the threshold at about 2200 s after the fault occurs. The sensitivity factor K is 1.0332.
Energies 2021, 14, x FOR PEER REVIEW 20 of 32
Figure 21. Detection result of the method based on EGT spatial characteristic in single fault.
It can be seen from the detection result that the method based on EGT spatial charac-teristic exceeds the threshold at about 2000 s after the fault occurs and the fault is detected. The sensitivity factor K is 1.1414.
4.2.4. Detection Result of the Method Based on Data-Driven Model This method is also model-based, and utilizes the residuals for fault detection. Simi-
larly, the data of the first 5000 s without fault is used to train model, and the detection threshold is determined by Pauta criterion. The threshold is (−8.380, 8.380), and the detec-tion result is shown in Figure 22. It can be seen from the detection result that the residuals exceed the threshold at about 2200 s after the fault occurs. The sensitivity factor K is 1.0332.
Figure 22. Detection result of the method based on data-driven model in single fault.
4.2.5. Detection Result of the Method Based on EGT Vector The method based on EGT vector is a fault detection method using modeling param-
eters. In this section, firstly, the threshold of α2 is calculated by using the data of the first 5000 s without fault, and the threshold is (0.9969, 1.013), and the detection result is shown in Figure 23.
It can be seen from the detection result that the method based on EGT vector exceeds the threshold at about 1200 s after the fault occurs. The sensitivity factor K is 1.4073.
1000 3000 5000 7000 9000 11,000 13,000 15,000time/ s
-10
0
10
20
30detection result of method based on EGT spatial characteristic
d1
d2
1000 3000 5000 7000 9000 11,000 13,000 15,000time/s
-30
-25
-20
-15
-10
-5
0
5
10detection result of method based on data-driven model
Figure 22. Detection result of the method based on data-driven model in single fault.
4.2.5. Detection Result of the Method Based on EGT Vector
The method based on EGT vector is a fault detection method using modeling parame-ters. In this section, firstly, the threshold of α2 is calculated by using the data of the first5000 s without fault, and the threshold is (0.9969, 1.013), and the detection result is shownin Figure 23.

Energies 2021, 14, 389 20 of 31Energies 2021, 14, x FOR PEER REVIEW 21 of 32
Figure 23. Detection result of the method based on EGT vector in single fault.
4.2.6. Detection Result of the Method Based on Brayton Cycle The method based on the Brayton cycle in this paper is also a model-based method,
which uses residuals for fault detection too. It is also achieved by ELM. It is trained by using the data of the first 5000 s without fault, and the threshold is (−8.442, 8.442), and the detection result is shown in Figure 24.
Figure 24. Detection result of the method based on Brayton cycle in single fault.
It can be seen from the detection result that the method based on Brayton cycle ex-ceeds the threshold at about 2000 s after the fault occurs. The sensitivity factor K is 1.1133. Under the situation of single fault, the detection time t and sensitivity factor K of the method based on EGT vector are the best.
4.3. Fault Couples with Ambient Temperature Increases As for the situation that fault is coupled with ambient temperature increases, the set
operating state is that the gas turbine runs normally in the first 5000 s. A soft fault occurs in the combustor at 5000–10,000 s and, at this time, the ambient temperature increases 10 °C slowly. The fault and ambient temperature stop developing at 10,000 s. Due to space limitations, the detection results of those selected methods are not described in detail here. The detection results of MARK VI and TXP system are shown in Figure 25a,b. The moni-toring ratio and deviation have increased obviously, however, according to the alarm mechanism, neither system will give an alarm for the coupling situation. The detection result of the method based on EGT spatial characteristics is shown in Figure 25c. The fault is detected at about 2000 s after the fault occurs, and the sensitivity factor K is 0.6629. The detection result of the method based on data-driven model is shown in Figure 25d, its detection factor always does not exceed the threshold, so it will not give an alarm, and the
1000 3000 5000 7000 9000 11,000 13,000 15,000time/s
0.95
0.96
0.97
0.98
0.99
1
1.01
1.02detection result of method based on EGT vector
1000 3000 5000 7000 9000 11,000 13,000 15,000time/s
-10
0
10
20
30detection result of method based on Brayton cycle
Figure 23. Detection result of the method based on EGT vector in single fault.
It can be seen from the detection result that the method based on EGT vector exceedsthe threshold at about 1200 s after the fault occurs. The sensitivity factor K is 1.4073.
4.2.6. Detection Result of the Method Based on Brayton Cycle
The method based on the Brayton cycle in this paper is also a model-based method,which uses residuals for fault detection too. It is also achieved by ELM. It is trained byusing the data of the first 5000 s without fault, and the threshold is (−8.442, 8.442), and thedetection result is shown in Figure 24.
Energies 2021, 14, x FOR PEER REVIEW 21 of 32
Figure 23. Detection result of the method based on EGT vector in single fault.
4.2.6. Detection Result of the Method Based on Brayton Cycle The method based on the Brayton cycle in this paper is also a model-based method,
which uses residuals for fault detection too. It is also achieved by ELM. It is trained by using the data of the first 5000 s without fault, and the threshold is (−8.442, 8.442), and the detection result is shown in Figure 24.
Figure 24. Detection result of the method based on Brayton cycle in single fault.
It can be seen from the detection result that the method based on Brayton cycle ex-ceeds the threshold at about 2000 s after the fault occurs. The sensitivity factor K is 1.1133. Under the situation of single fault, the detection time t and sensitivity factor K of the method based on EGT vector are the best.
4.3. Fault Couples with Ambient Temperature Increases As for the situation that fault is coupled with ambient temperature increases, the set
operating state is that the gas turbine runs normally in the first 5000 s. A soft fault occurs in the combustor at 5000–10,000 s and, at this time, the ambient temperature increases 10 °C slowly. The fault and ambient temperature stop developing at 10,000 s. Due to space limitations, the detection results of those selected methods are not described in detail here. The detection results of MARK VI and TXP system are shown in Figure 25a,b. The moni-toring ratio and deviation have increased obviously, however, according to the alarm mechanism, neither system will give an alarm for the coupling situation. The detection result of the method based on EGT spatial characteristics is shown in Figure 25c. The fault is detected at about 2000 s after the fault occurs, and the sensitivity factor K is 0.6629. The detection result of the method based on data-driven model is shown in Figure 25d, its detection factor always does not exceed the threshold, so it will not give an alarm, and the
1000 3000 5000 7000 9000 11,000 13,000 15,000time/s
0.95
0.96
0.97
0.98
0.99
1
1.01
1.02detection result of method based on EGT vector
1000 3000 5000 7000 9000 11,000 13,000 15,000time/s
-10
0
10
20
30detection result of method based on Brayton cycle
Figure 24. Detection result of the method based on Brayton cycle in single fault.
It can be seen from the detection result that the method based on Brayton cycle exceedsthe threshold at about 2000 s after the fault occurs. The sensitivity factor K is 1.1133. Underthe situation of single fault, the detection time t and sensitivity factor K of the methodbased on EGT vector are the best.
4.3. Fault Couples with Ambient Temperature Increases
As for the situation that fault is coupled with ambient temperature increases, the setoperating state is that the gas turbine runs normally in the first 5000 s. A soft fault occurs in thecombustor at 5000–10,000 s and, at this time, the ambient temperature increases 10 ◦C slowly.The fault and ambient temperature stop developing at 10,000 s. Due to space limitations, thedetection results of those selected methods are not described in detail here. The detectionresults of MARK VI and TXP system are shown in Figure 25a,b. The monitoring ratio anddeviation have increased obviously, however, according to the alarm mechanism, neithersystem will give an alarm for the coupling situation. The detection result of the method based

Energies 2021, 14, 389 21 of 31
on EGT spatial characteristics is shown in Figure 25c. The fault is detected at about 2000 safter the fault occurs, and the sensitivity factor K is 0.6629. The detection result of the methodbased on data-driven model is shown in Figure 25d, its detection factor always does notexceed the threshold, so it will not give an alarm, and the value of its sensitivity factor is notdiscussed. The detection results of the method based on EGT vector and Brayton cycle areshown in Figure 25e,f. The fault is detected at about 1500 s and 2000 s after fault occurs, thesensitivity factors K are 1.1839 and 0.6195, respectively.
Energies 2021, 14, x FOR PEER REVIEW 22 of 32
value of its sensitivity factor is not discussed. The detection results of the method based on EGT vector and Brayton cycle are shown in Figure 25e,f. The fault is detected at about 1500 s and 2000 s after fault occurs, the sensitivity factors K are 1.1839 and 0.6195, respec-tively.
Similarly, from the comparison results, it can be seen that the fault detection method based on EGT vector still has the best detection effect, its detection time t and sensitivity factor K are the best, so its detection sensitivity for early fault is the highest.
(a) (b)
(c) (d)
(e) (f)
Figure 25. Detection results when fault couples with ambient temperature increases: (a) detection result of GE’s MARK VI system; (b) detection result of Siemens’ TXP system; (c) detection result of method based on EGT spatial characteristic; (d) detection result of method based on data-driven model; (e) detection result of method based on EGT vector; (f) detection result of method based on Brayton cycle.
1000 3000 5000 7000 9000 11,000 13,000 15,000time/ s
0.2
0.3
0.4
0.5
0.6
0.7
0.8detection result of GE's MARK VI system
r1/ ℃
r2/ ℃
r3/ ℃
dete
ctio
n fa
ctor
resid
ual
Figure 25. Detection results when fault couples with ambient temperature increases: (a) detectionresult of GE’s MARK VI system; (b) detection result of Siemens’ TXP system; (c) detection result ofmethod based on EGT spatial characteristic; (d) detection result of method based on data-drivenmodel; (e) detection result of method based on EGT vector; (f) detection result of method based onBrayton cycle.

Energies 2021, 14, 389 22 of 31
Similarly, from the comparison results, it can be seen that the fault detection methodbased on EGT vector still has the best detection effect, its detection time t and sensitivityfactor K are the best, so its detection sensitivity for early fault is the highest.
4.4. Results of Comparative Study Using Simulation Data
This section also compares the detection results of these methods under the situationthat fault couples with atmospheric pressure change, fault couples with compressor perfor-mance degradation and fault couples with fuel flow change. Due to space limitations, thedetection results’ figures of each method are not listed here. The time t required of eachdetection method to detect the fault under different fault situation are shown in Table 3.The sensitivity factor K of each method under different situations are shown in Table 4.Among them, the best results are bolded. For the case that the fault is not detected, denotedby “-” in the table, the value of the sensitivity factor K is not discussed.
Table 3. The time required to detect fault.
FaultsMethods
MARK VI TXPEGT
Spatial CharacteristicData-Driven
ModelEGT
VectorBrytonCycle
1. Single fault - - 2000 s 2200 s 1200 s 2000 s2. Fault and ambienttemperature change - - 2000 s - 1500 s 2000 s
3. Fault and atmosphericpressure change - - 2000 s 2200 s 1200 s 2200 s
4. Fault and fuel flow change - - - 4500 s 1000 s 1450 s5. Fault and compressor
performance degradation - - - 2500 s 1200 s -
Table 4. Sensitivity factor K.
FaultsMethods EGT Spatial Characteristic Data-Driven Model EGT Vector Bryton Cycle
1. Single fault 1.1414 1.0332 1.4073 1.11332. Fault and ambient temperature change 0.6629 - 1.1839 0.61953. Fault and atmospheric pressure change 1.0687 1.0244 1.3494 1.0686
4. Fault and fuel flow change - 0.3958 1.5181 1.16815. Fault and compressor performance
degradation - 0.9251 1.3896 -
The indicators monitored by MARK VI and TXP system both increased after the faultoccurs, but they did not exceed the alarm threshold, so no alarm will be sent out in thewhole process. It can be seen from the detection results that the methods based on EGTspatial characteristic, based on data-driven model and based on Brayton cycle can detectthe fault, but there are situations that fault cannot be detected.
It is analyzed in Section 4.1 that the key to early fault sensitive detection is to suppressthe influence of interference factors on EGT distribution and extract stable informationreflecting the combustion system fault from the complex coupled EGT signals. That is tosay, the methods based on EGT spatial characteristics, based on a data-driven model andbased on the Brayton cycle have poor suppression effects on some interference factors. Atthe same time, whether it is the time needed to detect the fault or the sensitivity factor K,the method based on EGT vector has the best detection effect under all simulated faultsituations. Besides, from Tables 3 and 4, it can be found that the larger the sensitivity factorK is, the shorter the time required for fault detection, this phenomenon is the same as theresult analyzed in Section 4.1, which also shows that the sensitivity factor K can representthe sensitivity of different methods for fault detection. Through the comparative studyusing simulation data, it can be seen that the method based on EGT vector has the bestdetection effect and the highest sensitivity to fault signals, and the fault signals can beextracted sensitively in the weak signs of the early fault.

Energies 2021, 14, 389 23 of 31
5. Verification and Analysis
This section will utilize actual gas turbine operating data to verify the results ofcomparative study using simulation data in the previous section, and then analyze thedetection results from the mechanism.
5.1. Verifying by Actual Data
In this paper, the actual operating data comes from a single-spool Taurus70 gas turbinewhich has 14-stage compressor blades, 3-stage turbine blades and 12 combustors. The ratedrotational speed is 15,200 r/min and the rated power is 6890 KW. The EGT is measuredby 12 thermocouples evenly arranged in the circumferential direction at the turbine outlet.During the 23,052 min of normal operation, data is recorded every minute. The changesin EGT, ambient temperature, compressor outlet pressure and rotational speed are shownin Figure 26. According to the method mentioned in [46], the data of fault is constructedby normal data. The exhaust temperature of #1 thermocouple is set to drop 10 ◦C slowlywithin 15,000~20,000 min, as shown in Figure 27.
Energies 2021, 14, x FOR PEER REVIEW 24 of 32
5.1. Verifying by Actual Data In this paper, the actual operating data comes from a single-spool Taurus70 gas tur-
bine which has 14-stage compressor blades, 3-stage turbine blades and 12 combustors. The rated rotational speed is 15,200 r/min and the rated power is 6890 KW. The EGT is measured by 12 thermocouples evenly arranged in the circumferential direction at the turbine outlet. During the 23,052 min of normal operation, data is recorded every minute. The changes in EGT, ambient temperature, compressor outlet pressure and rotational speed are shown in Figure 26. According to the method mentioned in [46], the data of fault is constructed by normal data. The exhaust temperature of #1 thermocouple is set to drop 10 °C slowly within 15,000~20,000 min, as shown in Figure 27.
Figure 26. Operation date.
Figure 27. EGT of #1 thermocouple before and after setting a fault.
The MARK VI system and TXP system are spread-based methods and they utilize EGT dispersion for fault detection, the results of the two systems are shown in Figure 28a,b. It can be seen that the monitoring values of the two systems do not exceed the
0 0.5 1 1.5 2time/min 104
500
550
600
Thermocouple #1temperature after setting faultthe actual temperature
Figure 26. Operation date.
Energies 2021, 14, x FOR PEER REVIEW 24 of 32
5.1. Verifying by Actual Data In this paper, the actual operating data comes from a single-spool Taurus70 gas tur-
bine which has 14-stage compressor blades, 3-stage turbine blades and 12 combustors. The rated rotational speed is 15,200 r/min and the rated power is 6890 KW. The EGT is measured by 12 thermocouples evenly arranged in the circumferential direction at the turbine outlet. During the 23,052 min of normal operation, data is recorded every minute. The changes in EGT, ambient temperature, compressor outlet pressure and rotational speed are shown in Figure 26. According to the method mentioned in [46], the data of fault is constructed by normal data. The exhaust temperature of #1 thermocouple is set to drop 10 °C slowly within 15,000~20,000 min, as shown in Figure 27.
Figure 26. Operation date.
Figure 27. EGT of #1 thermocouple before and after setting a fault.
The MARK VI system and TXP system are spread-based methods and they utilize EGT dispersion for fault detection, the results of the two systems are shown in Figure 28a,b. It can be seen that the monitoring values of the two systems do not exceed the
0 0.5 1 1.5 2time/min 104
500
550
600
Thermocouple #1temperature after setting faultthe actual temperature
Figure 27. EGT of #1 thermocouple before and after setting a fault.

Energies 2021, 14, 389 24 of 31
The MARK VI system and TXP system are spread-based methods and they utilizeEGT dispersion for fault detection, the results of the two systems are shown in Figure 28a,b.It can be seen that the monitoring values of the two systems do not exceed the threshold,and there will be no alarm in the whole process, which is the same as the detection resultsof using the established temperature distribution model to simulate the early weak fault inSection 4.
Energies 2021, 14, x FOR PEER REVIEW 25 of 32
threshold, and there will be no alarm in the whole process, which is the same as the de-tection results of using the established temperature distribution model to simulate the early weak fault in Section 4.
The methods based on EGT spatial characteristic, based on data-driven model, based on EGT vector and based on the Brayton cycle are all model-based methods. Their models are trained by the first 15,000 min data without fault set, and the detection thresholds are obtained respectively. The detection results of these four methods are shown in Figure 28. The time required for these four methods to detect fault and sensitivity factor K are shown in Table 5.
(a) (b)
(c) (d)
(e) (f)
0 0.5 1 1.5 2time/min 104
0.3
0.4
0.5
0.6
0.7detection result of GE's MARK VI system
0 0.5 1 1.5 2time/min 104
10
15
20hot protection
0 1 2time/min 104
-10
0
10
20cold protection
0 1 2time/min 104
-2
0
2
4
6cold protection
1 1.2 1.4 1.6 1.8 2 2.2time/min 104
-5
0
5
10
15detection result of method based on EGT spatial characteristic
1 1.2 1.4 1.6 1.8 2 2.2time/min 104
-15
-10
-5
0
5detection result of method based on data-driven model
1 1.2 1.4 1.6 1.8 2 2.2time/min 104
1.13
1.135
1.14
1.145
1.15
1.155
1.16
1.165detection result of method based on EGT vector
Figure 28. Detection results using actual data: (a) detection result of GE’s MARK VI system; (b) detection result of Siemens’TXP system; (c) detection result of method based on EGT spatial characteristic; (d) detection result of method based ondata-driven model; (e) detection result of method based on EGT vector; (f) detection result of method based on Brayton cycle.

Energies 2021, 14, 389 25 of 31
The methods based on EGT spatial characteristic, based on data-driven model, basedon EGT vector and based on the Brayton cycle are all model-based methods. Their modelsare trained by the first 15,000 min data without fault set, and the detection thresholds areobtained respectively. The detection results of these four methods are shown in Figure 28.The time required for these four methods to detect fault and sensitivity factor K are shownin Table 5.
Table 5. Detection results using actual data.
ParametersMethod
ANN SVM New Detection Factor Brayton Cycle
The time required to detect fault 2000 min 2000 min 1900 min -Sensitivity factor K 1.4603 1.5839 1.9887 -
The established model based on the Brayton cycle cannot detect faults under thissituation, while the others have good performance. It can be seen from the results thatthe method based on EGT vector has the best detection effect. The time required for faultdetection is not significantly less than that of other methods, but its sensitivity factor Kis significantly greater than that of others. Therefore, its sensitivity of fault detection isobviously higher than that of others, which means that this method can detect the faultin an early stage, which is consistent with the results obtained by using simulation data.It also shows that the circumferential temperature distribution model of gas turbine forcombustion system fault detection can reflect the actual operation of gas turbine, and themodel is reasonable.
5.2. Analysis
This section will analyze the results from the mechanism, and the results of thecomparative study are summarized to point out what kind of methods are more suitablefor combustion system fault detection.
Firstly, as for MARK VI system, the reason why the alarm is not sent out may bethat the temperature of the measuring point affected by the faulty combustor is not thehighest or the three lowest, so the alarm mechanism of the combustion monitoring systemwill not be triggered. In addition, there are many factors that will cause the temperaturedispersion between the thermocouples. For example, the manufacturing installation errorwill cause the inherent temperature difference to the EGT, and the variation of operating orenvironmental conditions will also cause the difference between the EGT. The allowableexhaust temperature dispersion (S) defined by GE needs to suppress the influence ofvarious interference factors on the EGT distribution and prevent a high false alarm rate,so it cannot be set too small. However, the influence of combustion system fault on theEGT dispersion is faint at an early stage. The signal of EGT change caused by fault factorsis easily submerged by the signal of EGT change caused by interference factors. Thecombustion system has been damaged seriously once the alarm is generated. Similar to theMARK VI system, the TELEPEREM XP system is a gas turbine condition monitoring andprotection system. In order to suppress the influence of interference factors on EGT andreduce the false alarm rate, the alarm threshold is set wide. The alarm will only be issuedwhen the fault is serious. These systems can only protect the gas turbine, and they cannotidentify and warn the faint signs in an early stages of a fault. Severe damage has occurredto the components by the time these systems give an alarm.
Secondly, as for the method based on EGT spatial characteristic, under the situationsthat simulated faults are coupled with different interference factors, this method candetect fault well in some cases while other cases cannot. Comparing these two kinds ofcases, it can be found that the coupling condition of fault can be detected, such as faultcoupling with ambient temperature increases and fault coupling with atmospheric pressuredrops, the temperature change of the thermocouple corresponding to faulty combustor isobvious before and after fault. For the coupling condition that cannot detect fault, such asfault coupling with fuel flow increases and fault coupling with compressor performance

Energies 2021, 14, 389 26 of 31
degradation, the temperature of the thermocouple corresponding to the faulty combustorchanges little before and after the fault. That is, if the interference causes the temperatureof the thermocouple corresponding to the faulty combustor to change insignificantly beforeand after the fault, the malfunction cannot be detected even if the interference causes asignificant change in the temperature of the four thermocouples spatially opposite to thethermocouple. It shows that using the temperature of the four thermocouples opposite toit in space and rotational speed as inputs can prevent the influence of the combustor faultson input parameters and estimate the temperature of the thermocouple, but artificiallyselecting the temperature of the thermocouples as inputs cannot suppress the influenceof interference factors on the EGT. In the case of complex coupling, the fault cannotbe detected.
Thirdly, comparing the method based on data-driven model with the method basedon EGT vector, they both use the average EGT value, ambient temperature and compressoroutlet pressure as the model inputs. The method based on data-driven model is to detectfault by using residuals of estimated temperature and actual temperature, the method basedon EGT vector is to detect fault by using modeling parameters. In Section 4.1, it is analyzedthat the interference factors cause the intra-class distance too large and the inter-classdistance too small, namely, the sensitivity factor is too small, and the boundary betweennormal and abnormal samples is too blurry to distinguish. Therefore, it is necessary tosuppress the influence of various interference factors, compress the intra-class distance,expand the inter-class distance, and reduce or even eliminate the class overlap. Thedetection effect of the method based on data-driven model is not as good as that of themethod based on EGT vector. The reason why the latter is better than the former canbe analyzed from the perspective of pattern recognition. If the EGT at each moment→T4 = [T4,1, T4,2, . . . , T4,n] is regarded as a point in the high-dimensional sample space X,then each sample point can be projected into the new high-dimensional sample space byEquation (9), so the following equation can be obtained:
→α = wT
→T4 (17)
where wT represents the projection direction and vector→α = [α1, α2, . . . , αn] is a point in the
new high-dimensional sample space Y. Through appropriate projection and transformation,the vector
→α in the new sample space is used as the detection factor of early warning of
combustion system fault to effectively compress the intra-class distance, which makes iteasier to separate the normal samples from the abnormal samples. Under the premise of alow false alarm rate, the faults of combustion system can be detected as early as possibleand the fault signal has higher sensitivity. This makes the sensitivity factor K of the methodbased on EGT vector significantly larger than that of the method based on data-drivenmodel. In addition, there is another reason. Various interference factors have strongcommon-mode characteristics on the EGT. Under the influence of these interference factors,the exhaust temperature changes significantly, but it increases or decreases synchronouslyin general trend. Monitoring the difference between the EGT is the core of combustionsystem fault detection. The effects of various interference factors on EGT are synchronous,and they also affect the average EGT value equally. Therefore, the average value can be usedas the main characterization of the “mode” in the common-mode interference. Therefore,the average EGT can eliminate various common-mode interference, that is, suppress theinfluence of non-fault interference factors on fault detection. Moreover, the average valuehas a strong linear relationship with the temperature of each measuring point. Using theaverage value as an input parameter, and a linear model with the temperature of eachmeasuring point can best characterize the EGT distribution. Both models use the averageEGT as an input parameter, and it has been analyzed in Section 2.6 that although the kennelfunction used in SVM is linear, the relationship between the exhaust temperature and theaverage EGT value in this model is not linear, on the contrast, it is a non-linear model.Therefore, this will reduce the accuracy of the model and the sensitivity of detection, which

Energies 2021, 14, 389 27 of 31
also results in that the detection effect of the method based on data-driven model is not asgood as that of the method based on EGT vector.
What’s more, Miller [22] thought that the median EGT also contains the informationof various interference factors, so a fault detection method based on the median EGT wasproposed. In this paper, in order to obtain the most suitable method for fault detection andfind the best parameters for suppressing interference factors, the average EGT in the methodbased on EGT vector is replaced by the median EGT, as shown in the following equation:
T4,i = λiT4,median + βiT1 + σiP2 + ci (18)
where, T4,median is the median EGT, and the modeling parameter λ1 is used for fault detection.The detection result of the fault constructed by the actual data is shown in Figure 29. It exceedsthe threshold at about 2000 min after the fault occurs, and its sensitivity factor K is 1.5348. Atthe same time, in order to prevent the contingency of setting fault for only #1 thermocouple, theexhaust temperature data of 12 thermocouples are installed soft fault respectively, and obtain12 sets of fault data. The method based on EGT vector, respectively, with the average EGT asthe input and with the median EGT is used as the input to detect the fault of the 12 groupsof data, and the average sensitivity factor of the two methods are calculated respectively tomake the comparison results universal. The results are shown in Table 6. It shows that themethod using the average EGT as input has better performance and higher sensitivity to faultsignal. And the average EGT is better than the median EGT in fault detection for suppressinginterference factors.
Energies 2021, 14, x FOR PEER REVIEW 28 of 32
sensitivity of detection, which also results in that the detection effect of the method based on data-driven model is not as good as that of the method based on EGT vector.
What’s more, Miller [22] thought that the median EGT also contains the information of various interference factors, so a fault detection method based on the median EGT was proposed. In this paper, in order to obtain the most suitable method for fault detection and find the best parameters for suppressing interference factors, the average EGT in the method based on EGT vector is replaced by the median EGT, as shown in the following equation:
4, 4, 1 2i i median i i iT T T P cλ β σ= + + + (18)
where, T4,median is the median EGT, and the modeling parameter λ1 is used for fault detec-tion. The detection result of the fault constructed by the actual data is shown in Figure 29. It exceeds the threshold at about 2000 min after the fault occurs, and its sensitivity factor K is 1.5348. At the same time, in order to prevent the contingency of setting fault for only #1 thermocouple, the exhaust temperature data of 12 thermocouples are installed soft fault respectively, and obtain 12 sets of fault data. The method based on EGT vector, respec-tively, with the average EGT as the input and with the median EGT is used as the input to detect the fault of the 12 groups of data, and the average sensitivity factor of the two methods are calculated respectively to make the comparison results universal. The results are shown in Table 6. It shows that the method using the average EGT as input has better performance and higher sensitivity to fault signal. And the average EGT is better than the median EGT in fault detection for suppressing interference factors.
Figure 29. Detection result of method based on EGT vector taking median EGT as input.
Finally, the method based on Brayton cycle takes fuel flow, ambient temperature and atmospheric pressure as inputs and cannot detect fault which is constructed using actual operating data. Although the average EGT has a strong correlation with fuel flow, the interference factors, such as compressor performance degradation, cannot be character-ized by the input parameters of the model and these non-fault factors cannot be sup-pressed. This also results in the method failing to detect fault when the simulated fault is coupled with compressor performance degradation. Therefore, replacing the average EGT with the fuel flow cannot suppress the influence of interference factors on the EGT and cannot achieve the sensitive detection for faults.
Table 6. Sensitivity factor.
Average EGT Median EGT #1 Thermocouple fault 1.9887 1.5348
Average value of 12 groups of faults 1.5476 1.4006
1 1.2 1.4 1.6 1.8 2 2.2time/min 104
0.875
0.88
0.885
0.89
0.895
0.9
0.905
0.91 based on median EGT
Figure 29. Detection result of method based on EGT vector taking median EGT as input.
Table 6. Sensitivity factor.
Average EGT Median EGT
#1 Thermocouple fault 1.9887 1.5348Average value of 12 groups of faults 1.5476 1.4006
Finally, the method based on Brayton cycle takes fuel flow, ambient temperature andatmospheric pressure as inputs and cannot detect fault which is constructed using actualoperating data. Although the average EGT has a strong correlation with fuel flow, theinterference factors, such as compressor performance degradation, cannot be characterizedby the input parameters of the model and these non-fault factors cannot be suppressed.This also results in the method failing to detect fault when the simulated fault is coupledwith compressor performance degradation. Therefore, replacing the average EGT withthe fuel flow cannot suppress the influence of interference factors on the EGT and cannotachieve the sensitive detection for faults.

Energies 2021, 14, 389 28 of 31
6. Conclusions
At present, combustion system fault detection methods mainly utilize EGT distributionsto extract fault signals based on temperature deviations. However, faults are not the onlyinfluencing factors. Various interference factors will affect the EGT profile and they can easilymask the temperature changes caused by faults. From the perspective of pattern recognition,the existence of interference factors makes the boundary between fault class and normal classindistinct and indistinguishable. Therefore, the key to combustion system fault detectionis to suppress the influence of interference factors on EGT, extract fault signal from EGT,and improve the sensitivity of early faint symptom identification. For this reason, manyresearchers have proposed lots of methods. In this paper, they are divided into spread-basedmethod and model-based method. However, there is a lack of comparative study on whichmethod has the most obvious suppression effect on interference factors and which is the mostsensitive to fault information. Therefore, six mainstream fault detection methods, based ondifferent principles, are selected for comparative study in this paper, in an attempt to revealthe most suitable method for combustion system fault detection through comparative studyand to find the parameters with the most obvious effect on the suppression of interferencefactors, so as to provide ideas for subsequent research.
This paper systematically studies the detection mechanism of the six selected detectionmethods, and gives a brief introduction. Before the comparative study, considering thatthe actual gas turbine operating data is difficult to fully reveal the EGT distribution undervarious interference conditions, it is impossible to systematically compare the detectioneffects of various methods under different conditions. To this end, this paper establishes agas turbine circumferential temperature distribution model with a multi-combustor burner,multi-channel turbine, considering gas mixing and rotation. It can be used for combustionsystem fault detection research, and this model is used to simulate the EGT data underdifferent fault situations. Besides, the sensitivity factor K was defined by referring to thedefinitions of intra-class distance and inter-class distance, which can reflect the sensitivityof the detection method to fault signals and the suppression effect on interference factors.Then the simulation data are used to compare the selected methods. After the relevantresults are obtained, the actual gas turbine operating data is used to construct a combustorfault situation, and the comparison in this case is used to verify the results obtained bysimulation data. Finally, the comparison results are briefly analyzed. The results show that:
The GE MARK VI system and Siemens TELEEREM XP system use spread-basedmethods and utilize the EGT dispersion for fault detection. These methods are veryintuitive, so they are widely used in industrial production, but, in order to prevent theinfluence of interference factors on the false alarm rate, a wide detection threshold is set,which makes them not sensitive enough to extract the weak signals in an early stages offaults, and the cannot trigger early warnings. When the system sends out an alarm, thecomponents may have already been seriously damaged. In addition, the monitoring pointsmay not include the thermocouples corresponding to the faulty combustor, so the detectioneffect of these systems is not good.
The model-based method can monitor the temperature change of each measuringpoint, and it is better than spread-based method. However, the detection results of thesemethods are uneven. Among the selected methods, the method based on EGT vectorhas the best performance. Comparing with the method based on EGT dispersion, wecan know that all measurement points should be monitored during fault detection andmethods suppressing interference factors should be found to improve detection sensitivity.Comparing with the method based on EGT spatial distribution characteristics, it can beseen that a good detection method should be based on the basic understanding of thefault mechanism of combustion system, and integrate the prior knowledge of gas turbinein the modeling process to select appropriate parameters to establish the model, so asto effectively suppress the influence of interference factors on EGT. Comparing with themethod based on data-driven model selected in this paper, it is found that using modelingparameters as detection index can effectively compress the intra-class distance, which

Energies 2021, 14, 389 29 of 31
makes the abnormal samples more easily separated from normal samples. Meanwhile,the influence of interference factors on the EGT has a strong common-mode characteristic,and the average EGT can be used as the main characterization of the “mode”. Using theaverage EGT can suppress all kinds of common-mode interference. And because there isa strong linear relationship between the exhaust temperature and the average EGT, theestablished model should be linear. Comparing with the method based on the Braytoncycle established in this paper and the method based on EGT vector taking median EGT asinput, it can be seen that although the fuel flow has a strong correlation with average EGT,neither the fuel flow nor the median EGT can be used to replace the average EGT, whichwill affect the sensitivity of the detection method.
To sum up, in the study of gas turbine combustion system fault detection the averageEGT value can effectively suppress the influence of interference factors on the exhausttemperature, and a linear model should be established between the temperature of eachmeasuring point and the average EGT. In addition, using modeling parameters for faultdetection can effectively improve the sensitivity, at the same time, it has a low false alarmrate, and can achieve the identification and early warning for weak faults signs.
Author Contributions: Conceptualization, Z.L. and J.L.; Methodology, M.B., L.Z.; Supervision, D.Y.and J.L. All authors have read and agreed to the published version of the manuscript.
Funding: This paper is funded by National Natural Science Foundation of China under Grant No.51976042, National Science and Technology Major Project of China under Grant No. 2017-I-0007-0008,National Science and Technology Major Project of China under Grant No. 2017-V-0005-0055.
Acknowledgments: The authors would like to thank reviewers and editors for their valuable sug-gestions to refine this work.
Conflicts of Interest: The authors declare no conflict of interest.
References1. Hongde, J.; Jing, R.; Xueying, L.; Qinxue, T. Status and Development Trend of the Heavy Duty Gas Turbine. Chin. J. Electr. Eng.
2014, 34, 5096–5102.2. Mao, H.-J. Analysis of exhaust temperature monitor and protection function for gas turbine. Huadian Technol. 2009, 31, 11–15.3. Sławinski, D.; Ziółkowski, P.; Badur, J. Thermal failure of a second rotor stage in heavy duty gas turbine. Eng. Fail. Anal. 2020,
115, 104672. [CrossRef]4. Volponi, A.J. Gas Turbine Engine Health Management: Past, Present, and Future Trends. J. Eng. Gas Turbines Power 2014, 136, 051201.
[CrossRef]5. Tahan, M.; Tsoutsanis, E.; Muhammad, M.; Karim, Z.A. Performance-based health monitoring, diagnostics and prognostics for
condition-based maintenance of gas turbines: A review. Appl. Energy 2017, 198, 122–144. [CrossRef]6. Jiang, H.-N. The importance of exhaust temperature spread monitor during gas turbine operation. Gas Turbine Technol. 2007, 20, 13–16.7. Liu, J.; Liu, J.; Yu, D. Anomaly Detection Method of Gas Turbine Combustion System Based on Exhaust Temperature Distribution
Mode. In Proceedings of the Intelligent Power Plant Technology Development Seminar and Proceedings of 2013 Conference onPower Plant Automation, Shanghai, China, 12 October 2013; Available online: https://kns.cnki.net/KCMS/detail/detail.aspx?dbcode=CPFD&filename=ZGDG201310002025 (accessed on 10 November 2020). (In Chinese).
8. Li, Y.G. Gas Turbine Performance and Health Status Estimation Using Adaptive Gas Path Analysis. J. Eng. Gas Turbines Power2010, 132, 041701. [CrossRef]
9. Ge, J. Application of Endoscope in Gas Turbine Power Plant. Energy Environ. 2015, 2, 32–33. (In Chinese)10. Sajben, M.; Peng, T.C.; Shaeffer, J.E. Evaluation of Experiments Using Electrostatic Probes to Detect. Imminent Failure of Jet Engine
Gas-Path Components; Air Force Flight Dynamics Laboratory, Patterson Air Force Base: Wright, OH, USA, 1975.11. Couch, R.; Robert, P. Detecting Abnormal Turbine Engine Deterioration Using Electrostatic Methods. J. Aircr. 1978, 15, 692–695.
[CrossRef]12. Powrie, H.; McNicholas, K. Gas Path Monitoring during Accelerated Mission Testing of a Demonstrator Engine. In Proceedings
of the 33rd Joint Propulsion Conference and Exhibit, Seattle, WA, USA, 6–9 July 1997. [CrossRef]13. Li, Y.; Zuo, H.; Liu, P. Gas path electrostatic monitoring of turbo-shaft engine: An exploratory experiment. Acta Aeronaut.
Astronaut. Sin. 2010, 11, 2174–2181. (In Chinese)14. Wen, Z.; Zuo, H.; Li, Y. Techniques and Experiments for Electrostatic Monitoring of Airway Particles. J. Aerosp. Dyn. 2008, 12,
2321–2326. (In Chinese)15. Yılmaz, I. Evaluation of the relationship between exhaust gas temperature and operational parameters in CFM56-7B engines.
Proc. Inst. Mech. Eng. Part G 2009, 223, 433–440. [CrossRef]

Energies 2021, 14, 389 30 of 31
16. Knowles, M. Gas turbine Temperature spread monitoring detection of combustion system deterioration. In Turbo Expo: Power forLand, Sea, and Air; The American Society of Mechanical Engineers: New York, NY, USA, 1994; Volume 78873, p. V005T17A002.
17. Zhu, L. Early Warning of High Temperature Components of Gas Turbine; Harbin Institute of Technology: Harbin, China, 2016. (In Chinese)18. Hamilton, P.E.P.; Ha, D. Exhaust gas temperature capabilities now in system 1 software. Prod. Update 2005, 25, 88–89.19. General Electric Company. Heavy Duty Gas Turbine Monitoring & Protection; General Electric Company: Boston, MA, USA, 2015.20. Johnson, D.; Gilbert, K.E.; Buckley, L.P. The SPEEDTRONIC Mark IV Control™, a distributed fault tolerant gas turbine control
system. In Turbo Expo: Power for Land, Sea, and Air; The American Society of Mechanical Engineers: New York, NY, USA, 1983;Volume 79559, p. V005T13A007. [CrossRef]
21. Yu, H.; Xuewen, C. Control system Introduction for Siemens V94.3A gas turbine. Shanghai Electr. Power 2006, 19, 152–155. (In Chinese)22. Miller, K.W.; Iasillo, R.J.; Lemmon, M.F. Method of Monitoring for Combustion Anomalies in a Gas Turbomachine and a Gas
Turbomachine Including a Combustion Anomaly Detection System. U.S. Patent 9,790,834, 17 October 2017.23. Gulen, S.C.; Griffin, P.R.; Paolucci, S. Real-Time On-Line Performance Diagnostics of Heavy-Duty Industrial Gas Turbines. J. Eng.
Gas Turbines Power 2002, 124, 910–921. [CrossRef]24. Basseville, M.; Benveniste, A.; Mathis, G.; Zhang, Q. Monitoring the Combustion Set of a Gas Turbine. IFAC Proc. Vol. 1994, 27,
375–380. [CrossRef]25. Zhang, Q.; Basseville, M.; Benveniste, A. Early warning of slight changes in systems. Automation 1994, 30, 95–113. [CrossRef]26. Korczewski, Z. Exhaust gas temperature measurements in diagnostic examination of naval gas turbine engines. Pol. Marit. Res.
2011, 18, 37–43. [CrossRef]27. Medina, P.; Saez, D.; Roman, R. On Line Fault Detection and Isolation in Gas Turbine Combustion Chambers. In Proceedings of
the ASME Turbo Expo, Berlin, Germany, 9–13 June 2008; pp. 315–324.28. Tarassenko, L.; Nairac, A.; Townsend, N.; Buxton, I.; Cowley, P. Novelty detection for the identification of abnormalities. Int. J.
Syst. Sci. 2000, 31, 1427–1439. [CrossRef]29. Bai, M.; Liu, J.; Chai, J.; Zhao, X.; Yu, D. Anomaly detection of gas turbines based on normal pattern extraction. Appl. Therm. Eng.
2020, 166, 114664. [CrossRef]30. Kenyon, A.D.; Catterson, V.M.; McArthur, S.D.J. Development of an intelligent system for detection of exhaust gas temperature
anomalies in gas turbines. Insight-Non-Destr. Test. Cond. Monit. 2010, 52, 419–423. [CrossRef]31. Liu, J.; Liu, J.; Yu, D.; Kang, M.; Yan, W.; Wang, Z.; Pecht, M.G. Fault Detection for Gas Turbine Hot Components Based on a
Convolutional Neural Network. Energies 2018, 11, 2149. [CrossRef]32. Yan, W. Detecting Gas Turbine Combustor Anomalies Using Semi-supervised Anomaly Detection with Deep Representation
Learning. Cogn. Comput. 2020, 12, 398–411. [CrossRef]33. Yildirim, M.T.; Kurt, B. Aircraft Gas Turbine Engine Health Monitoring System by Real Flight Data. Int. J. Aerosp. Eng. 2018, 2018, 1–12.
[CrossRef]34. Song, Y.X.; Zhang, K.X.; Shi, Y.S. Research on aeroengine performance parameters forecast based on multiple linear regression
forecasting method. J. Aerosp. Power 2009, 24, 427–431.35. Liu, J.; Zhu, L.; Ma, Y.; Liu, J.; Zhou, W.; Yu, D. Anomaly detection of hot components in gas turbine based on frequent pattern
extraction. Sci. China Ser. E Technol. Sci. 2017, 61, 567–586. [CrossRef]36. Liu, J.; Jiao, L.; Jie, W.; Zhongqi, W.; Yu, D. Early Fault Detection of Hot Components in Gas Turbines. J. Eng. Gas Turbines Power
2016, 139, 021201. [CrossRef]37. Lifan, Y.; Yanlan, Y. Combustion failure analysis of 9F gas turbine. Power Gener. Equip. 2008, 22, 219–223. (In Chinese)38. Pang, S.; Yang, X.; Zhang, X. Aero Engine Component Fault Diagnosis Using Multi-Hidden-Layer Extreme Learning Machine
with Optimized Structure. Int. J. Aerosp. Eng. 2016, 2016, 1–11. [CrossRef]39. Romessis, C.; Mathioudakis, K. Bayesian Network Approach for Gas Path Fault Diagnosis. J. Eng. Gas Turbines Power 2004, 128, 64–72.
[CrossRef]40. Liu, J.; Bai, M.; Jiang, N.; Yu, D. A novel measure of attribute significance with complexity weight. Appl. Soft Comput. 2019, 82, 105543.
[CrossRef]41. Xu, Q.Y.; Meng, X.Y.; Han, X.J.; Meng, S. Gas Turbine Fault Diagnosis Based on Wavelet Neural Network. In Proceedings of the
2007 International Conference on Wavelet Analysis and Pattern Recognition, Beijing, China, 2–4 November 2007; IEEE: NewYork, NY, USA, 2017; Volume 2, pp. 738–741.
42. Wenjie, Z. Simulation Study of Single-Shaft Heavy-Duty Gas Turbine Based on Simulink; Tsinghua University: Beijing, China, 2011.(In Chinese)
43. Zhang, Q. Contribution à la Surveillance de Procédés Industriels. Ph.D. Thesis, University of Rennes I, Rennes, France, 1991.44. Buja, A.; Swayne, D.F.; Littman, M.L.; Dean, N.; Hofmann, H.; Chen, L. Data Visualization With Multidimensional Scaling. J.
Comput. Graph. Stat. 2008, 17, 444–472. [CrossRef]

Energies 2021, 14, 389 31 of 31
45. Yonggang, L. Analysis and countermeasures for exhaust deviation of Siemens SGT5-4000F(+) gas turbine. Intern. Combust. EngineAccessories 2018, 6, 44–46. (In Chinese)
46. Liu, J.; Kang, M.; Liu, J.; Wang, Z.; Yu, D.; Pecht, M.G. A Comparative Study on Anomaly Detection of the CombustionSystem in Gas Turbines. In Proceedings of the Society for Machinery Failure Prevention Technology Annual Conference2017: 50 Years of Failure Prevention Technology Innovation, MFPT 2017, Virginia Beach, VA, USA, 16–18 May 2017; Availableonline: https://www.engineeringvillage.com/share/document.url?mid=cpx_bb6fc77160ff7e10bdM605410178163176&database=cpx&view=abstract (accessed on 10 November 2020).