research and assessment of biogas evolved during anaerobic digestion of
TRANSCRIPT

ECOLOGICAL CHEM ISTRY AND ENGINEERING S
Vol. 18, No. 4 2011
Rokas VILNIŠKIS1, Pranas BALTRĖNAS1, Saulius VASAREVIČIUS1 and Edita BALTRĖNAITĖ1*
RESEARCH AND ASSESSMENT OF BIOGAS EVOLVED DURING ANAEROBIC DIGESTION
OF BIODEGRADABLE AGRICULTURAL WASTE
BADANIA I OCENA SKŁADU CHEMICZNEGO BIOGAZU Z ODPADÓW ROLNICZYCH PODCZAS FERMENTACJI MEZOFILNEJ
W WARUNKACH BEZTLENOWYCH
Abstract: One of the methods for managing biodegradable waste generating in the Lithuanian agriculture is its anaerobic digestion in a bioreactor. This way of management would allow the recovery of biogas that can be used as an alternative to natural gas. The article analyses agricultural biodegradable waste and its use for the production of biogas in bioreactors. There were performed investigations through anaerobic digestion of pig manure (PM), hen manure (HM) and cow manure (CM) together with green waste biomass (GW) (GW accounted for 1, 2 or 5% of manure of the dry mass). GW is used to improve the ratio of nitrogen and carbon in the substrate (the optimal C:N is 25:1) which predetermines the composition and yield of released biogas. Before the experiment the substrate was prepared so as the dry matter in its content accounted for 10% of the total mass. Investigations were carried out in mesophilic conditions (t = 35 ±1ºC). There were performed measurements of the yield of evolved biogas and methane, oxygen and sulphur hydrogen in it.
Keywords: biogas, agricultural biodegradable waste, methane, anaerobic digestion, bioreactor
Introduction
An economic crisis that emerged in Western Europe and USA 37 years ago (1973), having led to a continuous rise in the prices of fossil energy resources, particularly of oil and natural gas, accelerated search for alternative energy resources and studies on the possibilities of their use. Then, scientists and business people focused on biomass (wood, reed, sea vegetation, grain cultures, etc.) [1]. Currently the fossil fuel accounts for around 88% of the global energy demand [2].
During these days with the prices of fossil resources continuing to grow and an increasing focus being laid on waste management, one of the most promising methods of 1 Department of Environmental Protection, Vilnius Gediminas Technical University, Saulėtekio al. 11, Vilnius, LT-10223, Lithuania, phone +37 05 251 21 31, fax +37 05 274 47 26 * Corresponding author: [email protected]

Rokas Vilniškis, Pranas Baltrėnas, Saulius Vasarevičius and Edita Baltrėnaitė
410
waste handling aimed at transforming organic waste into alternative energy and reducing access of organic waste to landfills as well as obtaining fertilisers, is anaerobic waste digestion in bioreactors [3, 4]. Furthermore, due to a significant rise in fossil fuel prices, an increasing amount of biofuel is produced from cultivated plants. A growing production of biofuel from cultivated plants has a negative effect on food prices and therefore scientific research on alternative energy production is becoming more and more important [5].
Anaerobic treatment of organic waste treatment is applied in farmers’ farms, urban wastewater treatment plants, landfills, and food, light industry, bioethanol and biodiesel enterprises. The anaerobic method is used to treat animal and poultry manure, the organic part of municipal waste, sewage sludge from residential areas, wastes from food industry. The anaerobic treatment and use of organic waste for energy recovery is encouraged by increasingly stringent requirements related to environment protection, increasing costs of waste utilisation and growing prices of energy resources [6].
Apart from that, biological of organic waste results in the evolvement of gas with the prevailing amounts of methane (50÷70%) and carbon dioxide in it. Both methane and carbon dioxide are gases that cause the greenhouse effect [7, 8].
Methane is the main and most valuable component of biogas. If methane account for more than 60%, biogas is considered to be a valuable fuel [9, 10]. Beside biogas consists of NH4, CO2 and H2O, also N2, H2S and O2.
The use of biogas for heat and electricity production in a co-generation plant would significantly reduce methane emissions from agricultural biodegradable waste. Waste digestion in a bioreactor and the use of the recovered biogas for heat and electricity production instead of fossil fuel would also reduce CO2 emissions in the Lithuanian energy sector. Furthermore, the use of biogas for energy recovery could be an additional source of income for farmers.
Raw materials for biogas production
Various types of biomass containing carbohydrates, proteins, fats and cellulose can be used for the production of biogas [11]. Livestock manure, plant residues, waste from the food industry and agriculture, sewage sludge, organic municipal waste, waste from public catering establishments, including energy plants, are suitable for biogas production. Biogas can also be collected from landfills by special devices.
The main flows of biodegradable waste generated by industrial and other activities accumulate in agriculture, food industry enterprises and wastewater treatment plants. It should be noted that agricultural biodegradable waste accounts for 80% of the country’s biodegradable waste [2].
The main part of agricultural organic waste accumulates in cattle farms. In many cases subsidiary shops-slaughterhouses for the processing of production are equipped near major cattle farms. Therefore, apart from manure, these farms generate slaughter-house waste which is also suitable for the production of biogas and is used as an additive to enhance the output of biogas.
As many small-sized farms do not keep records of generating manure amounts, the quantities of manure are calculated in accordance with the number of livestock and poultry that are kept on these farms. On the basis of the data of a survey conducted in 2009, almost

Research and assessment of biogas evolved during anaerobic digestion of biodegradable …
411
all slurry is applied as an organic fertiliser on farmers’ or agricultural companies’ fields. The amounts of manure accumulating in the Lithuanian agriculture are presented in Table 1.
Table 1
Manure amounts generating in the Lithuanian agriculture, 2009 [12]
Animal type Amount of animals, in thou. Manure yield (from an
animal) [Mg/year] Manure amount [thou. Mg/year]
Cattle 800.3 14.8 11840 Pigs 1114.7 1.7 1895
Poultry 9397.1 0.025 235 Total 13970
Biogas formation process, composition and properties
Biogas, like natural gas, consists of methane (CH4) and carbon dioxide (CO2) which is suitable for gas-stoves and heating boilers [13]. In order to improve the quality of biogas, it is necessary to remove CO2 which generally accounts for 30÷45% in biogas and less than 1% in natural gas, as well as other impurities, particularly H2S. After biogas is cleaned, it can be used by internal combustion engines of cars. Biogas is an effective natural gas, so emissions released by vehicles which use biogas are similar to those of vehicles using natural gas. However, the use of biogas causes lesser pollution of the environment as it is a renewable fuel and when burning emits a carbon amount similar to that it has absorbed from the atmosphere. The use of biogas also ensures that methane (gas causing the greenhouse effect) generating in agriculture is retained but not emitted into the atmosphere.
The use of biogas in cattle farms reduces expenditure on heat and power. The ratio of the main components of biogas, CH4 and CO2, depends on the primary composition of the substrate and the properties of the fermentation process (temperature, duration of preservation and work load of the bioreactor). Biogas also contains small quantities of H2, N2 and H2S (Table 2).
The calorific value of biogas varies from 5000 to 7000 kcal/m3 and depends on the concentration of CH4 in it. For comparison, one cubic metre of biogas is equal to 0.7 m3 of natural gas, 0.7 kg of fuel oil, 0.6 kg of kerosene, 0.4 kg of petrol, 3.5 kg of wood, 12 kg of manure briquettes, 4 kWh of electrical energy, 0.5 kg of carbon and 0.43 kg of butane [14].
Table 2
The main properties of biogas and its components [15]
Components Property and measurement unit CH4 CO2 H2 H2S
Biogas (60% CH4+40% CO2)
Theoretical content 55÷70 30÷45 < 1 < 3 100 Calorific value [MJ/m3] 37.7 - 10.8 22.8 22.6
Flash point [ºC] 650÷750 - 530÷590 290÷487 650÷750 Lower explosive limits [%] 5÷15 - 4÷74 4÷42 6÷12
Density [kg/m3] 0.72 1.98 0,09 1.54 1.2 Critical temperature [ºC] –82.5 31.0 - 100 –82.5 Critical pressure [MPa] 4.6 7.3 1.3 8.9 7.3÷8.9
Biogas has been used in practice for many years already. Production of biogas from organic
waste has been widely used in such developed countries as USA, France, Germany, Finland,
Rokas Vilniškis, Pranas Baltrėnas, Saulius Vasarevičius and Edita Baltrėnaitė
412
Israel, and others. It is widely spread in rural areas where thousands of biogas power plants produce tens and hundreds millions cubic metres of biogas used for daily energy demand. In agriculture livestock manure can be used as a load for a bioreactor. The highest output of biogas is obtained from poultry litter, a slightly smaller - pig and cow manure. An average gas yield from cow manure is equal to 0.4 m3 per 1 kilogram [16].
Microorganisms have no warmth regulations mechanisms and therefore the ambient temperature is the most important factor predetermining the rate of their reproduction and the intensity of biochemical reactions. On the basis of temperature which is the most favourable for microorganisms, they are subdivided into psychophilic, mesophilic and thermophilic. The optimum temperature for psychophilic microorganisms is 10÷20ºC, for mesophilic - 25÷37ºC and for thermophilic - 50÷60ºC [15].
The highest reproduction rate of microorganisms and intensity of their biochemical reactions are under thermophilic conditions. Alternation of a temperature regime during the process is not recommended because bacteria of one sort die and others begin to propagate.
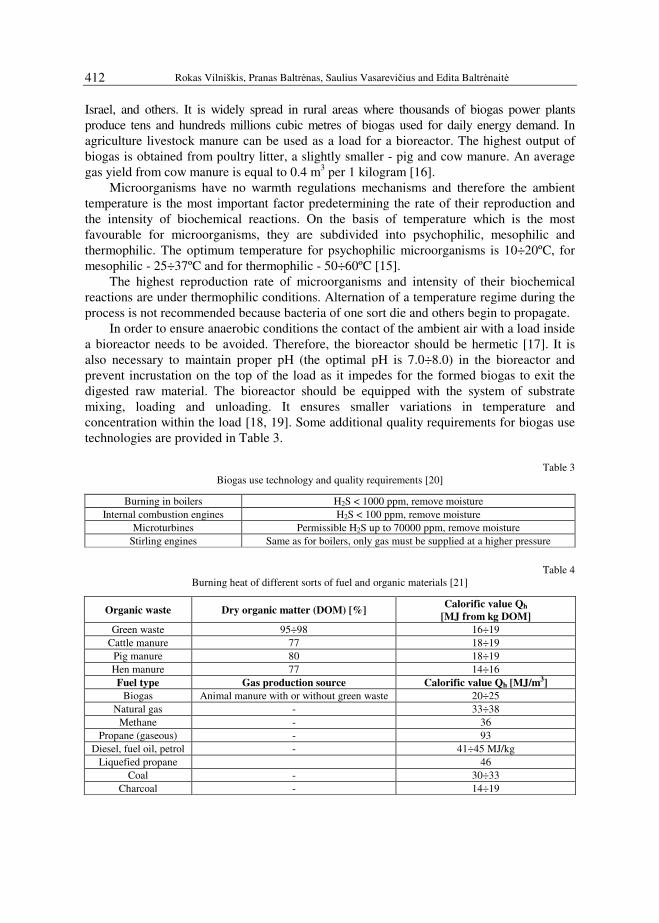
In order to ensure anaerobic conditions the contact of the ambient air with a load inside a bioreactor needs to be avoided. Therefore, the bioreactor should be hermetic [17]. It is also necessary to maintain proper pH (the optimal pH is 7.0÷8.0) in the bioreactor and prevent incrustation on the top of the load as it impedes for the formed biogas to exit the digested raw material. The bioreactor should be equipped with the system of substrate mixing, loading and unloading. It ensures smaller variations in temperature and concentration within the load [18, 19]. Some additional quality requirements for biogas use technologies are provided in Table 3.
Table 3
Biogas use technology and quality requirements [20]
Burning in boilers H2S < 1000 ppm, remove moisture Internal combustion engines H2S < 100 ppm, remove moisture
Microturbines Permissible H2S up to 70000 ppm, remove moisture Stirling engines Same as for boilers, only gas must be supplied at a higher pressure
Table 4
Burning heat of different sorts of fuel and organic materials [21]
Organic waste Dry organic matter (DOM) [%] Calorific value Qh
[MJ from kg DOM] Green waste 95÷98 16÷19
Cattle manure 77 18÷19 Pig manure 80 18÷19 Hen manure 77 14÷16 Fuel type Gas production source Calorific value Qh [MJ/m3]
Biogas Animal manure with or without green waste 20÷25 Natural gas - 33÷38
Methane - 36 Propane (gaseous) - 93
Diesel, fuel oil, petrol - 41÷45 MJ/kg Liquefied propane 46
Coal - 30÷33 Charcoal - 14÷19

Research and assessment of biogas evolved during anaerobic digestion of biodegradable …
413
To start the fermentation process, ie the development of bacteria, the substrate can be specially prepared. However, generally, fresh manure can be used.
The technologies of biogas production from agricultural biodegradable waste are environment-friendly as they do not produce waste. In addition, all pathogens in the substrate are killed after digestion.
The calorific value of organic waste and other sorts of fuel is given in Table 4. Methane is the main and the most valuable component of biogas, while a small content of H2 and H2S nearly has no influence on the calorific value of biogas. If methane content is above 60%, biogas is considered to be a valuable fuel.
The aim of the work is to identify the amount of biogas evolving from pig, hen, cow manure and green waste, its composition, time required for complete digestion of the substrate, the optimal duration of substrate retention in the bioreactor.
Biogas research methodology
Investigations were carried out under laboratory conditions. In the analysis of the quantitative and qualitative content of biogas, the substrate of different composition (organic waste) was used.
For the purpose of obtaining biogas, pig manure (PM), cow manure (CM) and hen
manure (HM) with green waste (GW) (grass) were used as sources for the load of the bioreactor (Table 5). These types of organic waste were selected due to the fact that their amounts generating in Lithuania are one of the biggest.
Table 5
Agricultural biodegradable waste used for investigations
Pig manure + GW [%] Cow manure + GW [%] Hens manure + GW [%] 99 + 1 99 + 1 99 + 1 95 + 5 95 + 5 95 + 5
90 + 10 90 + 10 90 + 10
Fig. 1. A periodic operation bioreactor was used for analysis
In order to evaluate an influence of green waste on the quantity and quality of evolved biogas, 9 different substrates with different proportions of green biomass were prepared (1,

Rokas Vilniškis, Pranas Baltrėnas, Saulius Vasarevičius and Edita Baltrėnaitė
414
5 and 10% of the total dry mass of PM, CM and HM). Substrates were prepared for the experiment so that the total dry matters of manure and green waste made 10% of the total mass. Where a mixture contained more than 10% of the dry mass it was diluted with water. The dry part of the substrate was determined by desiccating the substrate at a temperature of 105ºC and calculated upon determining its weight before and after the desiccation.
A laboratory bioreactor of periodic operation was used for investigations (Fig. 1, Table 6). A temperature of 35 ±1ºC was maintained inside the bioreactor.
Table 6
Parameters of the laboratory bioreactor
Parameter Bioreactor Type of bioreactor Laboratory bioreactor of semi-uninterrupted operation
Operating capacity [dm3] 4.5 Mixing Manual Heating Electrical
Operating temperature [ºC] 35±1
The biomass was loaded into the bioreactor of periodic operation at the beginning of
the analysis and removed upon analysis completion when biogas did not evolve any longer. Biomass was not additionally supplied to the bioreactor during the experiment. The aim of this analysis was to determine the total amount of biogas evolved from the loaded biomass.
A low capacity bioreactor was used during the experiment (5 dm3). The biomass was mixed manually once a day.
A pH analysis was performed twice: at the time of loading biomass into the bioreactor and at the end of the experiment (when the biomass was removed out of the bioreactor). Biogas was accumulated in a 4.5 dm3 capacity tank.
The following was determined during the analysis: the amount of biogas, the concentrations of methane, hydrogen sulphide and oxygen in biogas and also pH of the digested substrate.
The value of pH was determined by a standardised potentiometric technique. Measurement was done in accordance with LST ISO 10523:1994.
The amount of biogas was measured, once a day, according to the gas volume that accumulated inside the drum.
Fig. 2. Gas analyser INCA 4000

Research and assessment of biogas evolved during anaerobic digestion of biodegradable …
415
The gas which accumulated inside the gas accumulation tank was, on a daily basis, passed through a gas analyser via a flexible hose fitted in the close end of the tank upon opening a valve. The concentration of methane, hydrogen sulphide, carbon dioxide and oxygen was measured with the analyser INCA 4000 (Fig. 2).
Device’s measurement range: oxygen - 0÷25%, hydrogen sulphide - 0÷100 ppm, methane - 0÷100%.
Research results
Pig manure with green waste
Investigations covered the measurement of the quality and composition of biogas evolved during the biological digestion of pig manure (PM) mixed with green waste (GW). During the experiment’s first days the amount of biogas that evolved from PM and GW was increasing and reached its highest value on the 3rd to 5th days. In the case a PM and 1% grass substrate mixture, the highest biogas yield was reached on the 5th day and it was equal to 0.697 m3 from one cubic metre of the substrate per day (Fig. 3). Biogas evolvement lasted for 21 days. The total amount of biogas accumulated during 21 days was 6.29 m3/m3.
Fig. 3. Concentration of methane and hydrogen sulphide in biogas and their yield during biological
digestion of pig manure with 1% of GW
On the experiment’s first day the concentration of methane was 13.6%, but on the second day it jumped up to 43.3%. Afterward it was continually decreasing and at the end of the experiment reached 26.2%.
The concentration of evolving hydrogen sulphide in biogas was the highest on experiment’s 7th to 14th days being as high as 204·10–6 m3/m3·d (207 ppm). As shown in Figure 3, at the beginning and at the end of the experiment the concentration of hydrogen sulphide was lower and used to vary between 80·10–6÷100·10–6 m3/m3·d.
During anaerobic digestion of PM with 5% of GW (Fig. 4), the highest amount of biogas evolved during the first 5 days of the experiment, while the largest amount of biogas accumulated on the experiment’s 4th day - 0.580 m3/m3·d. The concentration of biogas that

Rokas Vilniškis, Pranas Baltrėnas, Saulius Vasarevičius and Edita Baltrėnaitė
416
evolved from the 7th to 18th day was similar and varied from 170 to 0.230 m3/m3·d. Throughout the entire period of the experiment 5.53 m3/m3 of biogas evolved.
Fig. 4. Concentration of methane and hydrogen sulphide in biogas and their yield during biological
digestion of pig manure with 5% of GW
On the experiment’s first day the concentration of methane was 14.5% and was gradually increasing all the time. The highest concentration of methane was reached on the experiment’s 13th to 21st days accounting for 53÷54%. The concentration of hydrogen sulphide was the lowest at the beginning of the experiment reaching 89·10–6 m3/m3·d (90 ppm). From the experiment’s 6th day H2S concentration started growing reaching its highest value on the 17th day (246·10–6 m3/m3·d).
Fig. 5. Concentration of oxygen in biogas
During the experiment the concentration of oxygen (Fig. 5) was decreasing. At the beginning of the experiment the concentration of oxygen reached 4.2%, but at the end of the experiment fell to 0.2%. A decrease in the concentration of oxygen shows that anaerobic

Research and assessment of biogas evolved during anaerobic digestion of biodegradable …
417
conditions were ensured. As regards the anaerobic digestion of PM with 10% of grass (Fig. 6), the highest amount of biogas evolved during the first 2 days of the experiment - 0.619 and 0.658 m3/m3·d, respectively. From the 3rd to 8th days the recorded decrease of biogas was up to 0.194 m3/m3·d. A similar amount of gas formed on the 8th to the 17th day of the experiment and varied from 0.155 to 0.213 m3/m3·d. A total of 5.57 m3/m3 of biogas evolved throughout the experiment.
On the experiment’s first day the concentration of methane was 10.6% and was gradually decreasing all the time.
The maximal concentration of methane was recorded on the experiment’s 13th - 21st days, ie 53÷54%. The concentration of hydrogen sulphide reached its highest value on the 9th - 14th days.
Fig. 6. Concentration of methane and hydrogen sulphide in biogas and their yield during biological
digestion of pig manure with 10% of GW
Fig. 7. Concentration of methane in different combinations of pig manure with GW

Rokas Vilniškis, Pranas Baltrėnas, Saulius Vasarevičius and Edita Baltrėnaitė
418
As the comparison of methane concentrations in different substrates presented in Figure 7 shows, the lowest concentration of methane throughout the experiment was in PM with 1% GW. It was influenced by a poorer C:N ratio. In the substrates which contained 5% and 10% of GW of PM dry mass, the methane concentration was higher and from the experiment’s 13th day exceeded 50%.
All the substrates in question produced similar amounts of biogas. Although the highest amount of biogas evolved from PM with 1% of GW throughout the experiment, the concentration of methane was the lowest (Fig. 8).
6.29
5.53 5.57
5.00
5.20
5.40
5.60
5.80
6.00
6.20
6.40
Pig manure and greenwaste (1 %)
Pig manure and greenwaste (5 %)
Pig manure and greenwaste (10 %)
Tot
al b
ioga
s qu
anti
ty in
m3 f
rom
1 m
3 of
subs
trat
e
Fig. 8. Biogas amount that generated throughout the entire experiment from 1 m3 of substrate
Hen manure with green waste
From the experiment’s 1st to 3rd days a sudden increase in a quantity of biogas was observed (Fig. 9). On the experiment’s second day the yield of biogas reached 0.542 m3/m3·d. The highest yield of biogas was recorded on the experiment’s 3rd day reaching 0.813 m3/m3·d. After the third day of the experiment the yield of biogas began to decrease and continued decreasing until the end of the experiment. The total amount of gas produced during 14 days was 3.44 m3/m3.
On the experiment’s first day methane concentration in the evolved biogas was minor reaching 6.2%. Afterward a growth in the concentration of methane was observed and the highest concentration was reached on the experiment’s 6th day (39%). This was predetermined by an intensive process of methanogenesis. From the experiment’s 7th day variations in the concentration of methane were minor and it stood at 30% at the end of experiment.
The lowest concentration of hydrogen sulphide was at the beginning of the experiment (25 ppm). Later it varied from 25 to 38 ppm.
In the beginning the concentration of oxygen reached 4.9% (Fig. 13) and was gradually falling until the end of the experiment. A reduction in the concentration of oxygen shows that anaerobic conditions have been ensured.

Research and assessment of biogas evolved during anaerobic digestion of biodegradable …
419
The pH value of the load and the substrate varied insignificantly. Load’s pH was about 6.2 and the pH of the digested substrate was close to neutral, ie 6.8.
Fig. 9. Concentration of methane and hydrogen sulphide in biogas and their yield during biological
digestion of hen manure with 1% of GW
Fig. 10. Concentration of methane and hydrogen sulphide in biogas and their yield during biological
digestion of HM with 5% of grass
During the anaerobic digestion of HM with 5% of GW, like in the case of 1% of GW, a significant increase in the quantity of biogas was recorded from the 1st to the 3rd day of the experiment (Fig. 10). However, the quantity of evolved biogas was higher during the first days of the experiment and the yield of biogas reached 0.754 m3/m3·d on the experiment’s second day. The highest yield of biogas, 0.968 m3/m3·d, was reached on the

Rokas Vilniškis, Pranas Baltrėnas, Saulius Vasarevičius and Edita Baltrėnaitė
420
experiment’s 3rd day. Later the amount of evolved biogas was decreasing. The total amount of biogas evolved during 14 days was 4.80 m3/ m3, showing a 1.36 m3 increase against the amount of evolved biogas from the same amount of dry organic matter when using the substrate of HM with 1% of GGW (green garden waste).
From the beginning of the experiment the concentration of methane was increasing and on the 6th day was the highest (48%). Continuing the experiment the concentration of methane was insignificantly falling and stood at 35% at the end of the experiment. The concentration of hydrogen sulphide in biogas was the lowest at the beginning of the investigation (20 ppm). On the experiment’s 4th day it rose to 40 ppm and remained similar until the end of the experiment. The concentration of oxygen (Fig. 13) at the beginning of the experiment reached 4.2% and was gradually falling until the end of the experiment. A decrease in the concentration of oxygen shows that anaerobic conditions have been ensured. The load’s and substrate’s pH was changing insignificantly. The load’s pH was 6.1, while the digested substrate’s pH was close to neutral - 6.9. When analysing a substrate mixture of hen manure and 10% of GW the maximal output of biogas was reached on the experiment’s 3rd and 4th days, which was 1.060 and 1.100 m3/m3·d , respectively (Fig. 11). Further, like in the case of other mixtures of HM and GW, the output of biogas decreased. The total amount of gas evolved during 14 days was 6.33 m3/m3. This is the highest amount of evolved biogas out of all three mixtures of hen manure and GW. The highest value of methane concentration was measured on the 9th day (40%). However, already from the beginning of the 2nd day it reached 30% and varied from 30 to 40% until the experiment’s 14th day.
Fig. 11. Concentration of methane and hydrogen sulphide in biogas and their yield during biological
digestion of hen manure with 10% of GW
The concentration of sulphur hydrogen in biogas was the lowest at the beginning of the experiment, ie (35 ppm) and varied from 34 to 45 ppm until the experiment’s 14th day.

Research and assessment of biogas evolved during anaerobic digestion of biodegradable …
421
The concentration of oxygen was gradually decreasing throughout the experiment (Fig. 13). At the beginning of the experiment the concentration of oxygen reached 5.1% but at the end of the experiment it fell to 0.4%. A decrease in the concentration of oxygen shows that anaerobic conditions have been ensured.
Fig. 12. Concentration of methane in different combinations of hen manure and green waste
Fig. 13. Concentration of oxygen in biogas under anaerobic digestion of hen manure with GW
The pH value of the load and substrate varied insignificantly. The load’s pH was about 6.2 and the digested substrate’s pH was close to neutral, 6.9. This shows a well-balanced activity of anaerobic bacteria.
As the obtained results show, green waste has a positive influence on both the amount of evolved biogas and the concentration of methane in biogas.
Rokas Vilniškis, Pranas Baltrėnas, Saulius Vasarevičius and Edita Baltrėnaitė
422
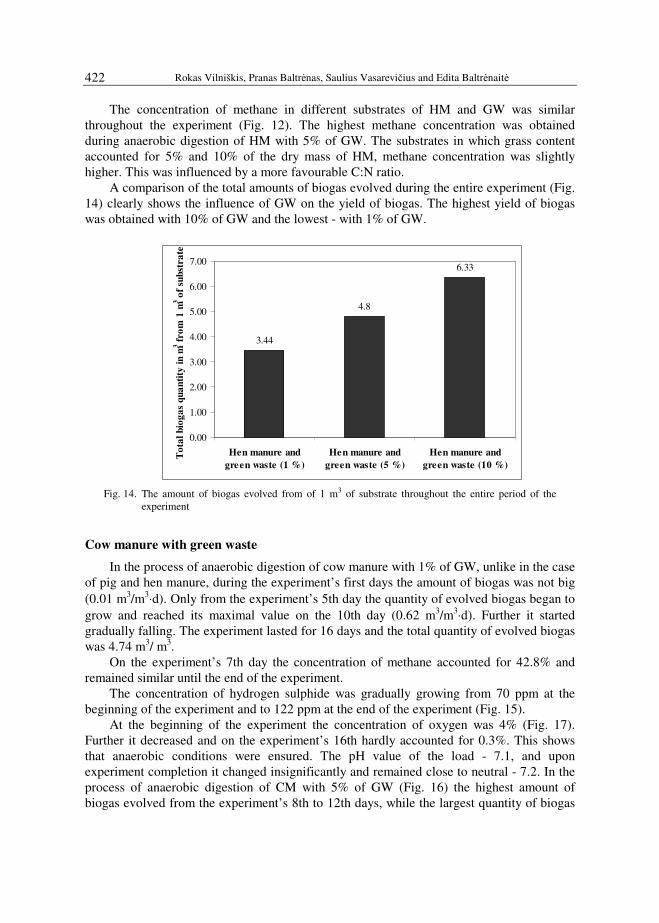
The concentration of methane in different substrates of HM and GW was similar throughout the experiment (Fig. 12). The highest methane concentration was obtained during anaerobic digestion of HM with 5% of GW. The substrates in which grass content accounted for 5% and 10% of the dry mass of HM, methane concentration was slightly higher. This was influenced by a more favourable C:N ratio.
A comparison of the total amounts of biogas evolved during the entire experiment (Fig. 14) clearly shows the influence of GW on the yield of biogas. The highest yield of biogas was obtained with 10% of GW and the lowest - with 1% of GW.
3.44
4.8
6.33
0.00
1.00
2.00
3.00
4.00
5.00
6.00
7.00
Hen manure andgreen waste (1 %)
Hen manure andgreen waste (5 %)
Hen manure andgreen waste (10 %)
Tot
al b
ioga
s qu
anti
ty in
m3 f
rom
1 m
3 of
subs
trat
e
Fig. 14. The amount of biogas evolved from of 1 m3 of substrate throughout the entire period of the
experiment
Cow manure with green waste
In the process of anaerobic digestion of cow manure with 1% of GW, unlike in the case of pig and hen manure, during the experiment’s first days the amount of biogas was not big (0.01 m3/m3
⋅d). Only from the experiment’s 5th day the quantity of evolved biogas began to grow and reached its maximal value on the 10th day (0.62 m3/m3
⋅d). Further it started gradually falling. The experiment lasted for 16 days and the total quantity of evolved biogas was 4.74 m3/ m3.
On the experiment’s 7th day the concentration of methane accounted for 42.8% and remained similar until the end of the experiment.
The concentration of hydrogen sulphide was gradually growing from 70 ppm at the beginning of the experiment and to 122 ppm at the end of the experiment (Fig. 15).
At the beginning of the experiment the concentration of oxygen was 4% (Fig. 17). Further it decreased and on the experiment’s 16th hardly accounted for 0.3%. This shows that anaerobic conditions were ensured. The pH value of the load - 7.1, and upon experiment completion it changed insignificantly and remained close to neutral - 7.2. In the process of anaerobic digestion of CM with 5% of GW (Fig. 16) the highest amount of biogas evolved from the experiment’s 8th to 12th days, while the largest quantity of biogas
Research and assessment of biogas evolved during anaerobic digestion of biodegradable …
423
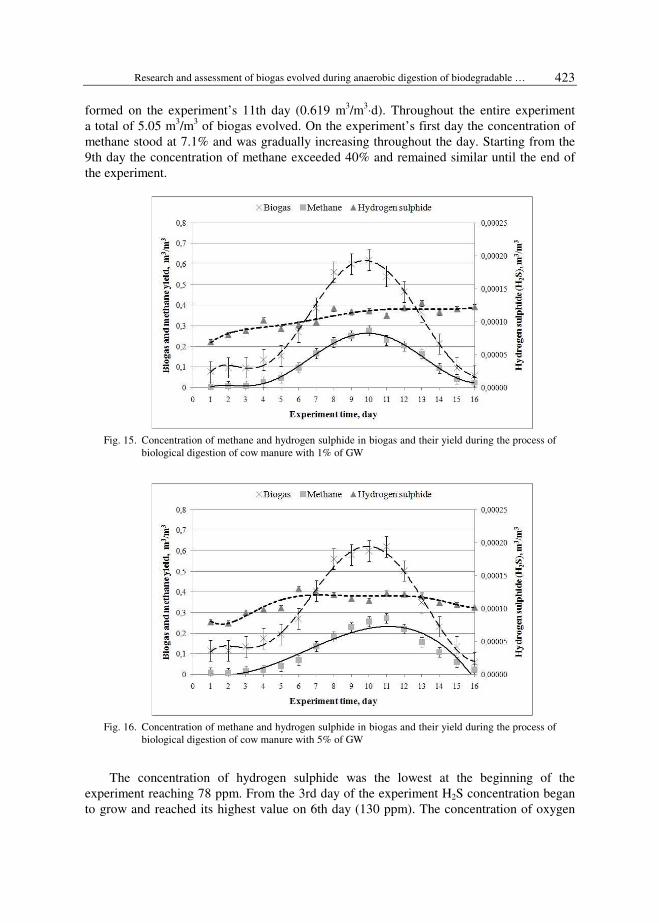
formed on the experiment’s 11th day (0.619 m3/m3⋅d). Throughout the entire experiment
a total of 5.05 m3/m3 of biogas evolved. On the experiment’s first day the concentration of methane stood at 7.1% and was gradually increasing throughout the day. Starting from the 9th day the concentration of methane exceeded 40% and remained similar until the end of the experiment.
Fig. 15. Concentration of methane and hydrogen sulphide in biogas and their yield during the process of
biological digestion of cow manure with 1% of GW
Fig. 16. Concentration of methane and hydrogen sulphide in biogas and their yield during the process of
biological digestion of cow manure with 5% of GW
The concentration of hydrogen sulphide was the lowest at the beginning of the experiment reaching 78 ppm. From the 3rd day of the experiment H2S concentration began to grow and reached its highest value on 6th day (130 ppm). The concentration of oxygen

Rokas Vilniškis, Pranas Baltrėnas, Saulius Vasarevičius and Edita Baltrėnaitė
424
(Fig. 17) decreased from 5.2% at the beginning of the experiment to 0.3% at the end of the experiment. Anaerobic conditions have been ensured. The load’s pH was 6.9. After 16 days the digested substrate’s pH remained close to neutral - 7.1.
In the process of anaerobic digestion of cow manure with 10% of GW (Fig. 18) total of 0.12 m3/m3
⋅ d of biogas formed during the first day. From the 6th day the amount of biogas began to grow and reached the highest value (0.60 m3/m3
⋅ d) after 10 days from the beginning of the experiment. Due to the lack of nutrients for anaerobic bacteria, from the experiment’s 12th day the amount of evolved biogas started decreasing. From the beginning of the experiment the concentration of methane was continually decreasing and from the experiment’s 10th day exceeded 40% (Fig. 18).
The concentration of hydrogen sulphide was the lowest at the beginning of the experiment (80 ppm). Later, H2S concentration increased and from the 5th day varied between 100÷120 ppm.
Fig. 17. Concentration of oxygen in biogas under anaerobic digestion of CM with GW
Fig. 18. Concentration of methane and hydrogen sulphide in biogas and their yield during the process of
biological digestion of cow manure with 10% of GW

Research and assessment of biogas evolved during anaerobic digestion of biodegradable …
425
Fig. 19. Concentration of methane in different combinations of cow manure with GW
0.0
1.0
2.0
3.0
4.0
5.0
6.0
7.0
Hen manure Pig manure Cow manure
Bio
gas
yiel
d m
3 f
rom
1 m
3 s
ubst
rate
1%GW
5%GW
10%GW
Fig. 20. The amount of biogas evolved from of 1 m3 of substrate throughout the entire period of the
experiment
The concentration of oxygen was decreasing throughout the entire period of the experiment (Fig. 17). At the beginning of the experiment oxygen concentration reached 4.1% and decreased to 0.3% at the end of the experiment. A decrease in oxygen concentration shows that anaerobic conditions have been ensured. The load’s pH was 7.1. After 16 days the digested substrate’s pH remained close to neutral - 7.2. In all mixtures of CM with GW the highest concentration of methane was at the end of the experiment (Fig. 19). The highest concentration of methane was achieved during the anaerobic digestion of cow manure with 10% of GW. Throughout the entire experiment the highest quantity of biogas evolved from cow manure with 10% of GW of the total dry mass of cow manure (Fig. 20).
Conclusions
1. The analysed substrates of manure and green waste can be used for the production of biogas. As the investigations show, it is appropriate to mix animal and poultry manure

Rokas Vilniškis, Pranas Baltrėnas, Saulius Vasarevičius and Edita Baltrėnaitė
426
with waste of vegetable origin, thus increasing the concentration of methane in biogas as well as its yield.
2. The highest quantity of biogas evolved during biological digestion of hen manure with 10% of GW. During 14 days the total quantity of evolved biogas amounted to 6.33 m3/m3.
3. When digesting the substrates of hen manure the highest quantity of methane concentration, 48%, was achieved with 5% of GW.
4. The highest energy value (the largest quantity of methane) was in the substrates of pig manure with GW. The concentration of methane in PM with 10% of GW reached 54.4%. Such biogas is considered to be a valuable fuel.
5. In the process of digesting cow manure with green garden waste the quantity of evolving biogas increased when the portion of GW in the substrate was increased. The total biogas quantity obtained when using cow manure with 10% of GW amounted to 5.48 m3/m3.
6. The concentration of hydrogen sulphide in the substrates analysed was 20÷300 ppm. Such concentration of hydrogen sulphide is not big and its usage in boilers without additional cleaning of biofuel from hydrogen sulphide is possible.
7. The amount of oxygen in evolved gas showed a decreasing tendency, and at the same time anaerobic conditions were maintained.
References [1] Savickas J.: Energy aspects of biogass production in Lithuania (Biodujų gamybos energetikos aspektai
Lietuvoje). Mokslas ir technika, 2009, 1, 14-17 (in Lithuanian). [2] Weiland P.: Appl. Microbiol. Biotechnol., 2010, 85(4), 849-860. [3] Kvasauskas M.: Experimental research of biogas production from pig amnure and meat waste (Biodujų
eksperimentiniai tyrimai naudojant kiaulių mėšlą ir mėsos atliekas). Mokslas - Lietuvos ateitis, 2008, 1, 81-90 (in Lithuanian).
[4] Misevičius A. and Baltrėnas P.: J. Environ. Eng. Landsc., 2011, 19(2), 167-177. [5] Ahn H.K., Smith M.C., Kondrad S.L. and White J.W.: Appl. Biochem. Biotech., 2009, 160(4), 965-975. [6] Navickas K., Župerka V. and Venslauskas K.: Anaerobic processing of animal by-products for production
of biogass (Gyvūninės kilmės šalutinių produktų anaerobinis perdirbimas į biodujas). LŽŪU ŽŪI Instituto ir LŽŪ Universiteto mokslo darbai, 2007, 39(4), 60-68 (in Lithuanian).
[7] Zigmontienė A. and Zuokaitė E.: J. Environ. Eng. Landsc., 2010, 18(2), 128-136. [8] Kvasauskas M. and Baltrėnas P.: J. Environ. Eng. Landsc., 2009, 17(4), 205-211. [9] Noyola A., Morgan-Sagastume L.M. and Lopez-Hernandez E.J.: Revs. in Environ. Sci. Biotechnol., 2006, 5,
93-114. [10] Čepanko V. and Baltrėnas P.: Polish J. Environ. Stud., 2011, 20(6), 1411-1418. [11] Braun R.: Anaerobic digestion: a multi-facetted process for energy, environmental management and rural
development. [In:] Improvement of Crop Plants for Industrial End Uses. P. Ranalli (Ed.). Springer, Dordrecht 2007, 335-415.
[12] Lithuanian Department of Statistics [interactive]. 2009 [2010 01 02], http://www.stat.gov.lt/lt/. [13] Weiss A., Jérôme V., Freitag R. and Mayer H.K.: Appl. Biochem. Biotech., 2008, 81(1), 163-173. [14] Asankulova A. and Obozov A. D.: Appl. Solar Ener., 2007, 43(4), 262-265. [15] Savickas J. and Vrubliauskas S.: Feasibility of biogas production and use in Lithuanian (Biodujų gamybos
ir panaudojimo galimybės Lietuvoje). Technologija, 1997, 38, 11-13 (in Lithuanian). [16] Angelidak I. and Ellegaard L.: Appl. Biochem. Biotech., 2003, 109, 95-105. [17] Mödinger F.: Sustainable clay brick production [2009 11 18], http://www.tbe-euro.com/downloads/biogas-
reactors.pdf. [18] Kujawski O.: Environ. Protect. Eng., 2009, 3, 27-39. [19] Machnicka A., Grűbel K., Suschka J.: Arch. Environ. Protect., 2009, 35(3), 11-20.

Research and assessment of biogas evolved during anaerobic digestion of biodegradable …
427
[20] Zicari S.M.: Removal of hydrogen sulfide from biogas using cow-manure compost [2009 10 12], http://www.thefuelman.com/Documents/H2S_removal.pdf.
[21] Lewandowski W.M., Radziemska E., Ryms M., Ostrowski P.: Ecol. Chem. Eng. S., 2011, 18(1), 39-47.
BADANIA I OCENA SKŁADU CHEMICZNEGO BIOGAZU Z ODPADÓW ROLNICZYCH PODCZAS FERMENTACJI MEZOFILNEJ W WARUNKACH
BEZTLENOWYCH
Wydział Inżynerii Ochrony Środowiska, Politechnika Wileńska im. Giedymina, Litwa
Abstrakt: Fermentacja beztlenowa w reaktorach jest jedną z metod wykorzystania odpadów rolniczych na terenie Litwy. Zagospodarowując odpady w taki sposób, można uzyskać biogaz, który jest alternatywą do innych źródeł energii oraz obecnie może zastąpić gaz ziemny. W artykule zaprezentowano sposoby wykorzystania odpadów rolniczych, ulegających biodegradacji, do produkcji biogazu w komorach fermentacyjnych. W badaniach były analizowane odpady trzody chlewnej (PM), drobiu (PL) oraz krów (CD), które podlegały fermentacji beztlenowej wraz z odpadami zielonymi (GW). Udział odpadów zielonych w całkowitej masie sięgał 1, 2 lub 5% suchej masy. Odpady zielone były wykorzystane do uzyskania odpowiedniej proporcji azotu i węgla w biomasie (optymalna wartość C:N jest 25: 1), ponieważ od tych składników najbardziej zależy ilość i jakość wytwarzanego biogazu. Przed eksperymentem substrat z biomasy został zmieszany z wodą tak, że część masy suchej wynosiła ok. 10%. Badania przeprowadzono w warunkach fermentacji mezofilnej (t = 35 ±1ºC). W czasie eksperymentu w biogazie oznaczono stężenie metanu, tlenu oraz siarkowodoru.
Słowa kluczowe: odpady z rolnictwa ulegające biodegradacji, fermentacja, biogaz, bioreaktor, metan