investigations on biogas recovery from anaerobic digestion
TRANSCRIPT
sustainability
Article
Investigations on Biogas Recovery from Anaerobic Digestion ofRaw Sludge and Its Mixture with Agri-Food Wastes:Application to the Largest Industrial Estate in Oman
Salah Jellali 1,*, Yassine Charabi 1, Muhammad Usman 1 , Abdullah Al-Badi 1,2 and Mejdi Jeguirim 3
�����������������
Citation: Jellali, S.; Charabi, Y.;
Usman, M.; Al-Badi, A.; Jeguirim, M.
Investigations on Biogas Recovery
from Anaerobic Digestion of Raw
Sludge and Its Mixture with
Agri-Food Wastes: Application to the
Largest Industrial Estate in Oman.
Sustainability 2021, 13, 3698. https://
doi.org/10.3390/su13073698
Academic Editor: Sara González
García
Received: 17 February 2021
Accepted: 19 March 2021
Published: 26 March 2021
Publisher’s Note: MDPI stays neutral
with regard to jurisdictional claims in
published maps and institutional affil-
iations.
Copyright: © 2021 by the authors.
Licensee MDPI, Basel, Switzerland.
This article is an open access article
distributed under the terms and
conditions of the Creative Commons
Attribution (CC BY) license (https://
creativecommons.org/licenses/by/
4.0/).
1 PEIE Research Chair for the Development of Industrial Estates and Free Zones, Center for EnvironmentalStudies and Research, Sultan Qaboos University, Al-Khoud 123, Muscat, Oman; [email protected] (Y.C.);[email protected] (M.U.); [email protected] (A.A.-B.)
2 Department of Electrical and Computer Engineering, College of Engineering, Sultan Qaboos University,Al-Khoud 123, Muscat, Oman
3 The Institute of Materials Science of Mulhouse (IS2M), University of Haute Alsace, University of Strasbourg,CNRS, UMR 7361, F-68100 Mulhouse, France; [email protected]
* Correspondence: [email protected]
Abstract: This work is intended to evaluate the technical, environmental, and economic feasibility ofconverting the sludge produced at an industrial estate’s wastewater treatment plant (WWTP) in Omaninto energy through anaerobic digestion (AD). In this study, three different scenarios were analyzed.They concerned the digestion of the total amount of the produced sludge alone (240 m3 day−1)(scenario 1), and its co-digestion with wet agri-food wastes (AFW) at rates of two tonnes day−1
(scenario 2) and ten tonnes day−1 (scenario 3). Based on the analyses of sludge samples, an intensiveliterature review regarding sludge and AFW Physico-chemical and energetic characteristics and theuse of the cost–benefit analysis (CBA) approach, it was found that, for the overall duration of theproject (20 years), the AD of the sludge alone (scenario 1) permitted the production of 43.9 GWh ofelectricity, the reduction of greenhouse gas (GHG) emissions (more than 37,000 tonnes equivalentCO2 (TCO2)) and exhibited positive net present value (NPV: $393,483) and an internal return rate(IRR) of 19.4%. Co-digesting sludge with AFW significantly increased all of these key performanceindicators. For instance, scenario 3 results in the recovery of electrical energy of 82.2 GWh and avoidsthe emission of 70,602 tCO2. Moreover, a higher NPV and IRR of $851,876 and 21.8%, respectively,and a payback period (PBP) of only seven years were calculated. The sensitivity analysis revealedthat a decrease in total expenses by 15% results in a significant increase of the NPV and the IRR to$1,418,704 and 33.9%, respectively, for scenario 3. Considering a pessimistic assumption (an increaseof the total expenses by 15%), all studied scenarios remain attractive. For instance, for scenario 3,the NPV, IRR, and PBP were evaluated to $285,047, 13.5%, and 9 years, respectively. Therefore, theco-digestion of sludge with agri-food wastes for energy recovery purposes could be considered apromising, eco-friendly, and economically viable approach in the Omani industrial estates.
Keywords: sludge; agri-food wastes; biogas; electricity; greenhouse gas emission; feasibility study
1. Introduction
Enormous amounts of sludge are produced worldwide in wastewater treatment plants(WWTP) [1]. These solid wastes could represent a real threat to the environment and hu-man health [2]. Therefore, concerned stakeholders, including public/private organisms,scientists, and civil society, are looking forward to minimize their production [3] and tofind out the adapted and sustainable management solutions [1]. These solutions should betechnically feasible, economically viable, eco-friendly, and socially acceptable [4]. Variousapproaches and technologies have been applied to reduce their negative impacts on theenvironment and/or to convert them into valuable resources. Such technologies mainly
Sustainability 2021, 13, 3698. https://doi.org/10.3390/su13073698 https://www.mdpi.com/journal/sustainability
Sustainability 2021, 13, 3698 2 of 20
include dumping in wild/controlled landfills and composting for subsequent use in agri-culture, fabrication of building materials, and energy extraction [5–7]. Sludge valorizationfor energy recovery has emerged as a promising and sustainable approach since it permitsconverting them into energy (electricity or heat or electricity/heat) that could be useddirectly in situ for the WWTP’s functioning. The principal used technologies for thispurpose include combustion, gasification, pyrolysis, and anaerobic digestion (AD) [8–10].The AD process is a biological process by which the organic compounds contained in agiven solid/liquid waste are converted into biogas by using microorganisms. This processinvolves a series of four biochemical stages including [10,11]: (i) hydrolysis, where complexorganic molecules are converted into simple sugars, fatty acids, and peptides; (ii) acido-genesis consisting in the fermentation of the hydrolysis products into short-chain volatileorganic acids such as alcohols, butyrate, carbonic acids, and propionates; (iii) acetogenesiswhere the latter products are converted into acetate, carbon dioxide, and hydrogen; and(iv) methanogenesis where these by-products were converted into methane. Comparedto the other technologies, the AD process is highly advantageous due to its lower cost,lower energy consumption, and its ability to produce biogas, which is composed mainly of60–70% of methane, 30–40% of carbon dioxide, and traces of other gases such as H2S [9,10].This biogas can be either cleaned and upgraded to produce bio-methane (that can substitutethe natural gas) using water scrubbers [12] or converted into heat or electricity via thermalreactors such as boilers, turbines, and generators [9,10]. The generated energy could beused in the WWTP covering a significant proportion of its needs or even sold to the supplygrid [13,14]. Therefore, through the biogas recovery, the AD installations could representa concrete opportunity for WWTPs to improve their energy independence. WWTPs canfurther reduce their operational costs and increase their overall environmental performanceby shifting from fossil fuels to renewable energy production and reuse [14].
Anaerobic digestion is being applied as a sustainable way to manage the producedsludge in WWTPs in various countries in the world [14,15]. For instance, in 2019, inChina, about 6.8% of the total produced sludge (2.68 million tonnes (wet basis)) weretreated by this technology [15]. They are theoretically generating 132 Mm3 of methaneand 1.47 million tons of fertilizer [15]. In the Unites States of America (USA), in 2017,about 1240 large-scale WWTPs were equipped with anaerobic digesters [16]. In theEuropean Union (EU), at the end of the last decade, approximately 50% of the WWTPswere equipped with anaerobic digestion facilities [17]. According to the latest reportpublished in 2020 by the EurObserv’ER barometer which measures the progress made byrenewable energies in each of the 28 countries of the EU [18], the overall primary energyproduction from biogas was estimated to be 16,629.8 Kilotonne of Oil Equivalent (KTOE).The contribution of the sewage sludge was determined to be more than 1593 KTOE (about9.6%). In addition, the gross amount of produced electricity from biogas generated fromthe AD of biomasses including sludge was estimated to about 62,463 GWh. This electricitywas mostly produced by Germany, Italy, and United Kingdom with percentages of 52.6%,13.3%, and 12.1%, respectively.
In addition to the sludge from WWTPs, in industrial estates, large amounts of agri-food wastes (AFW) are produced [19]. These wastes are not appropriately exploited sincethey are generally dumped in landfills, where they could constitute a serious threat to theenvironment and human health [19]. Simultaneously, various AFW has higher energeticpotential production than sludge due to their more important volatile organic mattercontents and degradation rates [20–22]. Indeed, these two parameters’ average valuesare assessed to 90% and 75% for AFW [23,24] and only 45% and 48% for sludge [10,25],respectively. Therefore, the co-digestion of sludge with AFW has emerged as an interestingway to manage these two kinds of solid wastes [26–28].
Oman has established nine industrial estates in various regions of the country. Al-Russayl, in Muscat, is the largest industrial estate in the country. This industrial estatecollects and treats all the produced wastewaters in a centralized WWTP. Due to the signifi-cant volumes of the generated sludge, its handling in this WWTP represents a substantial
Sustainability 2021, 13, 3698 3 of 20
environmental and social concern. Furthermore, despite their significant energy potentialand other valuable resource contents, the whole amount of the produced sludge is dumpedinto a landfill after its dewatering and drying. This operation might have an importantenvironmental negative impact on water and soil resources and air through the emissionof GHG. Thus, this sludge’s treatment/valorization (through AD process) could partiallyresolve these social and environmental issues and offer a relevant economic opportunityto convert it into energy (especially electricity). This generated energy could be injectedinto the national distribution company grid or directly used in the WWTP to substitute thecommercial electricity.
On the other hand, despite the proven efficiency of the AD process for WWTPs’sludge and AFW at both laboratory and field scales, relatively few studies have focusedon the technical, environmental, and economic viability of this technology at industrial-moderate-sized WWTPs by using tailored approaches such as the cost–benefit analysismethod (CBA). Indeed, CBA has been pointed out among various available economicanalytical tools as a well-established method for assessing the projects’ viability dealingwith solid wastes conversion into energy through AD process [29]. This method allows thedetermination, versus time, of various cost and benefits indicators essential for facilitatingdecision-makers’ help and orientation. Therefore, this work’s main objective is to studythe technical, environmental, and economic feasibility of converting the sludge producedat Al-Russayl industrial estate into electricity through the AD process. The economicefficiency of its co-digestion with agri-food wastes produced at the same industrial estatewill also be assessed under various options.
2. Materials and Methods2.1. WWTP of the Al Russayl Industrial Estate
This study concerns the Al Russayl industrial estate which is the largest one in Oman.It covers 10.8 km2 and contains 334 industries operating in various sectors, includingmainly agri-food, steel, aluminum, textile, etc.
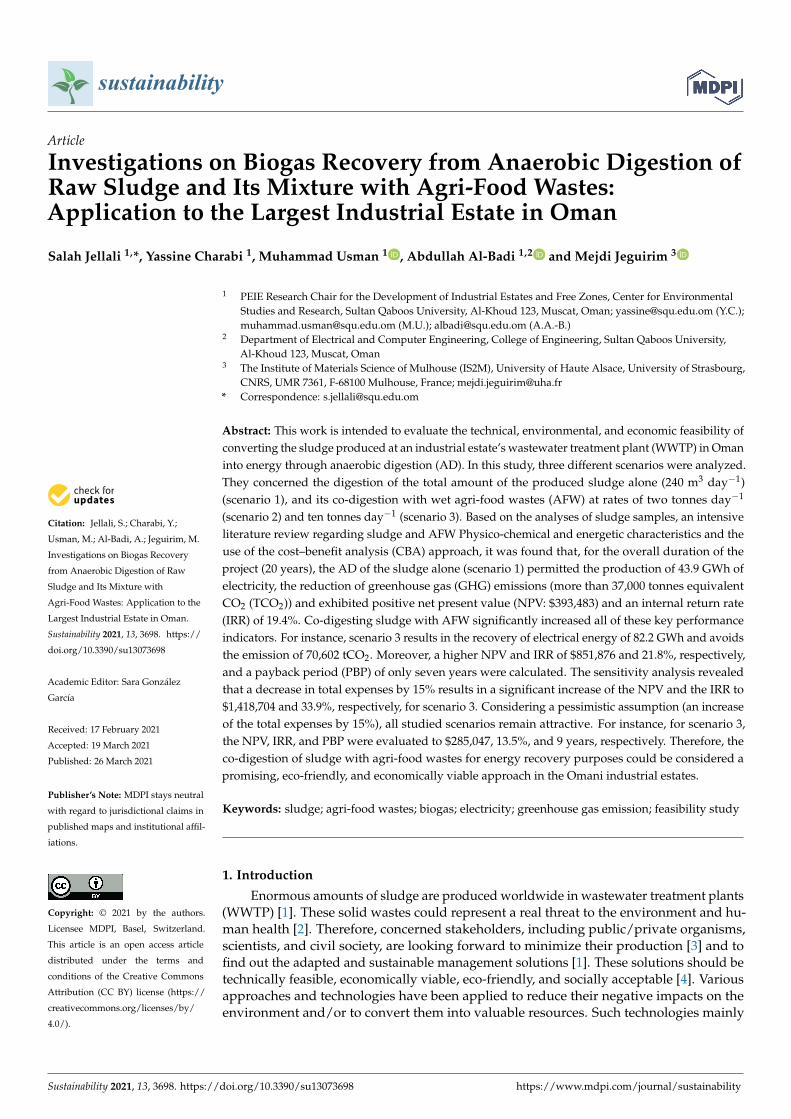
According to a 2019 estimation, the average consumed water in this industrial estateis about 4639 m3 day−1. The entire wastewater amount generated by this industrial estateis collected and treated by a centralized WWTP. In 2019, the average treated wastewateramount in this WWTP was assessed to be about 2270 m3 day−1. The design, main operatingparameters, and the flow diagram for wastewater and sludge in this WWTP are given inFigure 1. The wastewater treatment plant is constituted of the following systems: (i) a barscreen chamber that removes objects having size higher than 3 cm such as plastics, stones,and wood wastes etc.; (ii) a balancing tank with a volume of 420 m3 where the wastewateris collected and homogenized; (iii) a dissolved air flotation unit where the air injection at aflow rate of 200 m3 h−1 is applied to remove oil and greases; (iv) coagulation–flocculationtanks that permit the removal of suspended and colloidal solids; (v) an anoxic tank, havinga volume of 362 m3, that allows the denitrification of wastewater; (vi) a moving bedbioreactor (MBBR) tank with a volume capacity of 796 m3 allowing the removal of theorganic pollutants, vii) a clarifier with a volume of 1250 m3 where the wastewaters areseparated from the sludge that was created during the biological treatment; viii) a chlorinetank with a volume of 165 m3 that permits the disinfection of the treated wastewaters; and(ix) three parallel tertiary filtration units filled with various materials (from up to bottom:anthracite, activated carbon, fine sand, silex, fine pebbles, and finally coarse pebbles).The discharged wastewater after treatment has a physicochemical–biological quality thatpermits its reuse for the irrigation of surrounding green spaces.
Sustainability 2021, 13, 3698 4 of 20Sustainability 2021, 13, x FOR PEER REVIEW 4 of 20
Figure 1. The design and main operating conditions of Al-Russayl wastewater treatment plant. (DAF: dissolved air flota-tion; MBBR: Moving bed bioreactor).
The total produced sludge amount by this WWTP is 240 m3 day−1 (Figure 1). It is collected from both the coagulation–flocculation and the MBBR biological treatment units at equivalent amounts (120 m3 day−1 for each one). The produced sludge’s water content varies between 95% and 98%, with an average value of 96.5%. This sludge is dewatered in situ by adding various chemicals (like polymers) and centrifugation. The dewatered sludge with a water content of about 75% is then sun-dried inside the WWTP site and then transferred to landfills for dumping. Therefore, this sludge’s adapted management repre-sents an important task to be urgently undertaken to turn them into valuable resources (energy recovery, for instance).
2.2. Preliminary Characterization of Sludge The sludge of Al Russayl industrial estate was subjected to a preliminary characteri-
zation including (i) pH determination for a solid–liquid ratio of 1:5 by a precisely cali-brated electrode, (ii) total organic carbon assessment by using the Walkley–Black method, and (iii) the majority of the heavy metals contents were determined through an induc-tively coupled plasma, mass spectroscopy (ICP-MS) apparatus after a solid–liquid extrac-tion according to the experimental protocol given by Khadhar et al. [30]. A selective elec-trode quantified fluoride contents.
2.3. Methods and Data Used for the Feasibility Study The technical, environmental, and economic feasibility of the conversion of the pro-
duced sludge in the WWTP of Al-Russayl into energy by the AD process was carried out for the following three scenarios:
Scenario 1: The anaerobic digestion of the sludge alone produced in the WWTP; Scenario 2: The anaerobic co-digestion of the sludge produced in the WWTP mixed
with 2 tonnes day−1 of agri-food wastes (wet basis);
Bar screeningChamber: 3 cm
Balancing tankV=420 m3
DAF unit + coagulation-flocculation chambers
Anoxic tankV=362 m3
MBBR V=796 m3
Tertiary filtration reactors
Influent:2510 m3/day
Treated wastewater for reuse:
2270 m3/day
Sludge dewatering240 m3/day Sludge drying
Primary sludge: 120 m3/day
Secondary sludge: 120 m3/day
2390 m3/day
Chlorine contact tank: V=165 m3
ClarifierV=1250 m32270
m3/day
Sludge return
Figure 1. The design and main operating conditions of Al-Russayl wastewater treatment plant. (DAF: dissolved air flotation;MBBR: Moving bed bioreactor).
The total produced sludge amount by this WWTP is 240 m3 day−1 (Figure 1). It iscollected from both the coagulation–flocculation and the MBBR biological treatment unitsat equivalent amounts (120 m3 day−1 for each one). The produced sludge’s water contentvaries between 95% and 98%, with an average value of 96.5%. This sludge is dewateredin situ by adding various chemicals (like polymers) and centrifugation. The dewateredsludge with a water content of about 75% is then sun-dried inside the WWTP site andthen transferred to landfills for dumping. Therefore, this sludge’s adapted managementrepresents an important task to be urgently undertaken to turn them into valuable resources(energy recovery, for instance).
2.2. Preliminary Characterization of Sludge
The sludge of Al Russayl industrial estate was subjected to a preliminary characteriza-tion including (i) pH determination for a solid–liquid ratio of 1:5 by a precisely calibratedelectrode, (ii) total organic carbon assessment by using the Walkley–Black method, and(iii) the majority of the heavy metals contents were determined through an inductivelycoupled plasma, mass spectroscopy (ICP-MS) apparatus after a solid–liquid extractionaccording to the experimental protocol given by Khadhar et al. [30]. A selective electrodequantified fluoride contents.
2.3. Methods and Data Used for the Feasibility Study
The technical, environmental, and economic feasibility of the conversion of the pro-duced sludge in the WWTP of Al-Russayl into energy by the AD process was carried outfor the following three scenarios:
Scenario 1: The anaerobic digestion of the sludge alone produced in the WWTP;Scenario 2: The anaerobic co-digestion of the sludge produced in the WWTP mixed
with 2 tonnes day−1 of agri-food wastes (wet basis);
Sustainability 2021, 13, 3698 5 of 20
Scenario 3: The anaerobic co-digestion of the sludge produced in the WWTP mixedwith 10 tonnes day−1 of agri-food wastes (wet basis);
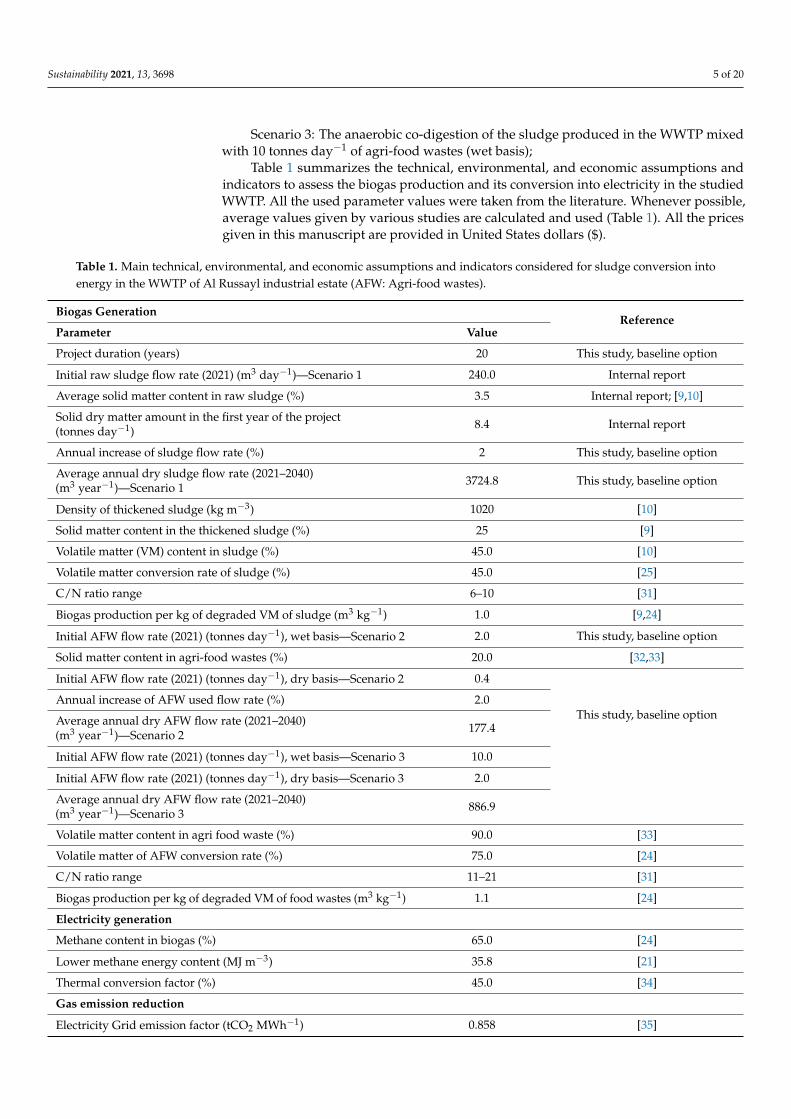
Table 1 summarizes the technical, environmental, and economic assumptions andindicators to assess the biogas production and its conversion into electricity in the studiedWWTP. All the used parameter values were taken from the literature. Whenever possible,average values given by various studies are calculated and used (Table 1). All the pricesgiven in this manuscript are provided in United States dollars ($).
Table 1. Main technical, environmental, and economic assumptions and indicators considered for sludge conversion intoenergy in the WWTP of Al Russayl industrial estate (AFW: Agri-food wastes).
Biogas GenerationReference
Parameter Value
Project duration (years) 20 This study, baseline option
Initial raw sludge flow rate (2021) (m3 day−1)—Scenario 1 240.0 Internal report
Average solid matter content in raw sludge (%) 3.5 Internal report; [9,10]
Solid dry matter amount in the first year of the project(tonnes day−1) 8.4 Internal report
Annual increase of sludge flow rate (%) 2 This study, baseline option
Average annual dry sludge flow rate (2021–2040)(m3 year−1)—Scenario 1 3724.8 This study, baseline option
Density of thickened sludge (kg m−3) 1020 [10]
Solid matter content in the thickened sludge (%) 25 [9]
Volatile matter (VM) content in sludge (%) 45.0 [10]
Volatile matter conversion rate of sludge (%) 45.0 [25]
C/N ratio range 6–10 [31]
Biogas production per kg of degraded VM of sludge (m3 kg−1) 1.0 [9,24]
Initial AFW flow rate (2021) (tonnes day−1), wet basis—Scenario 2 2.0 This study, baseline option
Solid matter content in agri-food wastes (%) 20.0 [32,33]
Initial AFW flow rate (2021) (tonnes day−1), dry basis—Scenario 2 0.4
This study, baseline optionAnnual increase of AFW used flow rate (%) 2.0
Average annual dry AFW flow rate (2021–2040)(m3 year−1)—Scenario 2 177.4
Initial AFW flow rate (2021) (tonnes day−1), wet basis—Scenario 3 10.0
Initial AFW flow rate (2021) (tonnes day−1), dry basis—Scenario 3 2.0
Average annual dry AFW flow rate (2021–2040)(m3 year−1)—Scenario 3 886.9
Volatile matter content in agri food waste (%) 90.0 [33]
Volatile matter of AFW conversion rate (%) 75.0 [24]
C/N ratio range 11–21 [31]
Biogas production per kg of degraded VM of food wastes (m3 kg−1) 1.1 [24]
Electricity generation
Methane content in biogas (%) 65.0 [24]
Lower methane energy content (MJ m−3) 35.8 [21]
Thermal conversion factor (%) 45.0 [34]
Gas emission reduction
Electricity Grid emission factor (tCO2 MWh−1) 0.858 [35]
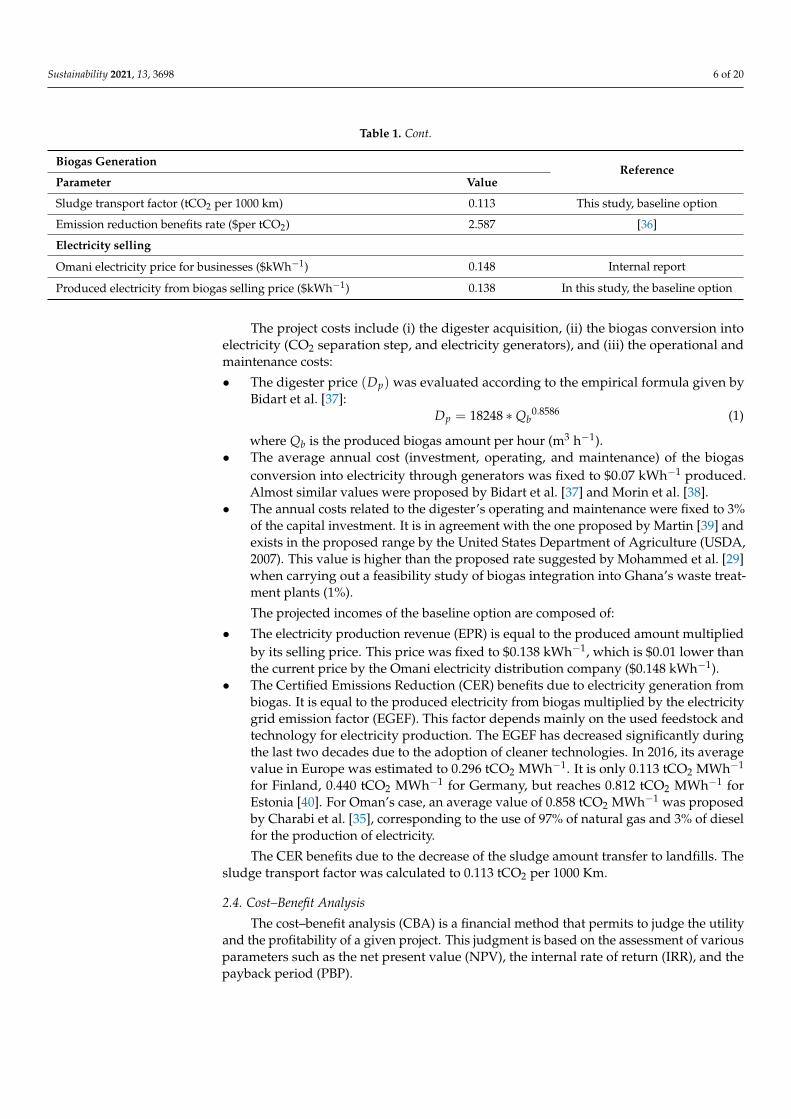
Sustainability 2021, 13, 3698 6 of 20
Table 1. Cont.
Biogas GenerationReference
Parameter Value
Sludge transport factor (tCO2 per 1000 km) 0.113 This study, baseline option
Emission reduction benefits rate ($per tCO2) 2.587 [36]
Electricity selling
Omani electricity price for businesses ($kWh−1) 0.148 Internal report
Produced electricity from biogas selling price ($kWh−1) 0.138 In this study, the baseline option
The project costs include (i) the digester acquisition, (ii) the biogas conversion intoelectricity (CO2 separation step, and electricity generators), and (iii) the operational andmaintenance costs:
• The digester price (Dp) was evaluated according to the empirical formula given byBidart et al. [37]:
Dp = 18248 ∗ Qb0.8586 (1)
where Qb is the produced biogas amount per hour (m3 h−1).• The average annual cost (investment, operating, and maintenance) of the biogas
conversion into electricity through generators was fixed to $0.07 kWh−1 produced.Almost similar values were proposed by Bidart et al. [37] and Morin et al. [38].
• The annual costs related to the digester’s operating and maintenance were fixed to 3%of the capital investment. It is in agreement with the one proposed by Martin [39] andexists in the proposed range by the United States Department of Agriculture (USDA,2007). This value is higher than the proposed rate suggested by Mohammed et al. [29]when carrying out a feasibility study of biogas integration into Ghana’s waste treat-ment plants (1%).
The projected incomes of the baseline option are composed of:
• The electricity production revenue (EPR) is equal to the produced amount multipliedby its selling price. This price was fixed to $0.138 kWh−1, which is $0.01 lower thanthe current price by the Omani electricity distribution company ($0.148 kWh−1).
• The Certified Emissions Reduction (CER) benefits due to electricity generation frombiogas. It is equal to the produced electricity from biogas multiplied by the electricitygrid emission factor (EGEF). This factor depends mainly on the used feedstock andtechnology for electricity production. The EGEF has decreased significantly duringthe last two decades due to the adoption of cleaner technologies. In 2016, its averagevalue in Europe was estimated to 0.296 tCO2 MWh−1. It is only 0.113 tCO2 MWh−1
for Finland, 0.440 tCO2 MWh−1 for Germany, but reaches 0.812 tCO2 MWh−1 forEstonia [40]. For Oman’s case, an average value of 0.858 tCO2 MWh−1 was proposedby Charabi et al. [35], corresponding to the use of 97% of natural gas and 3% of dieselfor the production of electricity.
The CER benefits due to the decrease of the sludge amount transfer to landfills. Thesludge transport factor was calculated to 0.113 tCO2 per 1000 Km.
2.4. Cost–Benefit Analysis
The cost–benefit analysis (CBA) is a financial method that permits to judge the utilityand the profitability of a given project. This judgment is based on the assessment of variousparameters such as the net present value (NPV), the internal rate of return (IRR), and thepayback period (PBP).
Sustainability 2021, 13, 3698 7 of 20
The NPV is defined as follows [29]:
NPV =n
∑t=1
(Bt − Ct)
(1 + r)t (2)
where Bt and Ct are the benefits and costs at the year “t”, “r” is the discount or interest rate,and “t” is the year number varying between 1 and 20.
The IRR refers to the discount rate, making the NVP of the cash flow equal to zero. Itis also considered as the average earning power of the project’s expenses over the projectlife [29]. Finally, the Payback period (PBP) is defined as the number of years necessary torecover the investment. Thus, it corresponds to the period where the cumulated benefitscover the cumulated expenses.
2.5. Sensitivity Analysis
The sensitivity of the cost-effectiveness of this project was assessed in comparisonwith the baseline conditions for the following options:
- Option 1: baseline conditions + generated electricity sold at the current price appliedby the Omani distribution company: $0.148 (7.25% higher than the one used for thebaseline conditions)
- Option 2: Baseline conditions + annual expenses decrease by 15%- Option 3: Baseline conditions + annual expenses increase by 15%
3. Results and Discussions3.1. Preliminary Physico-Chemical Characterization of Sludge
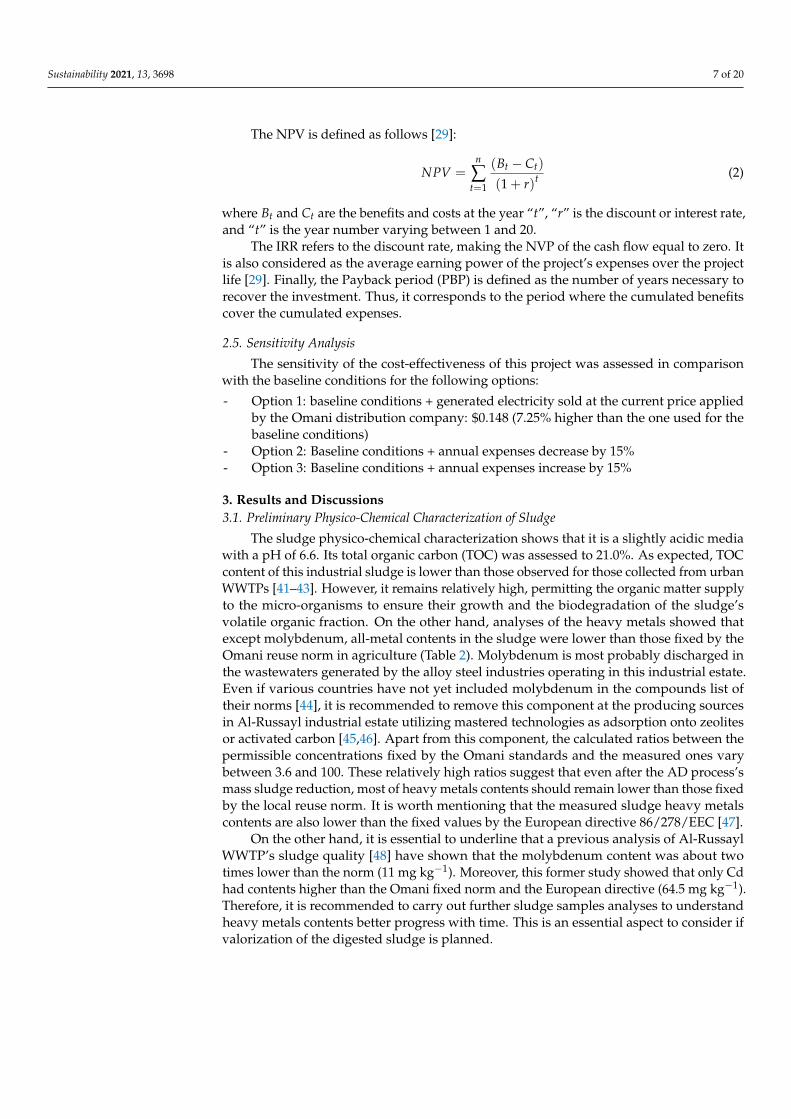
The sludge physico-chemical characterization shows that it is a slightly acidic mediawith a pH of 6.6. Its total organic carbon (TOC) was assessed to 21.0%. As expected, TOCcontent of this industrial sludge is lower than those observed for those collected from urbanWWTPs [41–43]. However, it remains relatively high, permitting the organic matter supplyto the micro-organisms to ensure their growth and the biodegradation of the sludge’svolatile organic fraction. On the other hand, analyses of the heavy metals showed thatexcept molybdenum, all-metal contents in the sludge were lower than those fixed by theOmani reuse norm in agriculture (Table 2). Molybdenum is most probably discharged inthe wastewaters generated by the alloy steel industries operating in this industrial estate.Even if various countries have not yet included molybdenum in the compounds list oftheir norms [44], it is recommended to remove this component at the producing sourcesin Al-Russayl industrial estate utilizing mastered technologies as adsorption onto zeolitesor activated carbon [45,46]. Apart from this component, the calculated ratios between thepermissible concentrations fixed by the Omani standards and the measured ones varybetween 3.6 and 100. These relatively high ratios suggest that even after the AD process’smass sludge reduction, most of heavy metals contents should remain lower than those fixedby the local reuse norm. It is worth mentioning that the measured sludge heavy metalscontents are also lower than the fixed values by the European directive 86/278/EEC [47].
On the other hand, it is essential to underline that a previous analysis of Al-RussaylWWTP’s sludge quality [48] have shown that the molybdenum content was about twotimes lower than the norm (11 mg kg−1). Moreover, this former study showed that only Cdhad contents higher than the Omani fixed norm and the European directive (64.5 mg kg−1).Therefore, it is recommended to carry out further sludge samples analyses to understandheavy metals contents better progress with time. This is an essential aspect to consider ifvalorization of the digested sludge is planned.
Sustainability 2021, 13, 3698 8 of 20
Table 2. Heavy metals contents in the used sludge in comparison with the standards for sludge reusein agriculture in Oman (according to 145/93 ministerial decision) and Europe (European directive86/278/EEC).
Metal Content(mg kg−1)
OmaniStandard
Ratio (OmaniStan-
dard/MeasuredContent)
EuropeanStandard
Arsenic <4 - - -
Boron 20 - - -
Barium 49 - - -
Cadmium <4 20 - 20–40
Cobalt 2 - - -
Chromium 190 1000 5.3 -
Copper 280 1000 3.6 1000–1750
Mercury 0.1 10 100 16–25
Manganese 210 - - -
Molybdenum 36 20 0.6 -
Nickel 29 300 10.3 300–400
Lead 90 1000 11.1 750–1200
Antimony <7 - - -
Selenium <2 50 - -
Vanadium 12 - - -
Zinc 270 3000 11.1 2500–4000
Total cyanide <0.5 - - -
Fluorides <500 - - -
It is important to underline that high contents of heavy metals in feedstocks couldnegatively impact the development of methanogens bacteria during the AD process [49,50].Therefore, the co-digestion of this industrial sludge with AFW would potentially contributeto the dilution of heavy metals contents and consequently to improve the blended biomass(sludge and AFW) conversion into biogas.
3.2. Biogas and Electricity Production Capacities
The produced sludge and agri-food wastes in generating biogas, methane, and elec-tricity were calculated based on the assumptions presented in Table 1 for the three selectedscenarios (see Section 2.5). Owing to the dry and hot climate of Oman, these wastes areexpected to be anaerobically digested under mesophilic conditions (temperature between30 and 38 ◦C) and for an average residence time of 20 days [9]. Indeed, low residencetimes (<10 days) do not allow optimal bacterial growth [11]. Whilst, increasing residencetimes over 20 days will not permit a significant improvement in volatile matter degradationand biogas production [10,51]. Moreover, the use of higher residence time is generallyaccompanied by higher capital cost (larger size of digester), and requires more energy forprocess operation such as sludge mixing [9]. Obtained results (Table 3) showed that the ADof the Al Russayl WWTP sludge alone (scenario 1) has a significant potential for biogasrecovery. Indeed, the average annual amounts of biogas and methane were estimated to bemore than 0.75 and 0.49 Million m3 year−1 (Mm3 year−1), respectively. As indicated above,the produced methane amount depends on the quantity and characteristics of the usedsludge and the temperature and hydraulic residence time [10,14]. For that reason, largeamounts of methane are produced in bigger WWTPs. For instance, in the Ankara WWTP, the
Sustainability 2021, 13, 3698 9 of 20
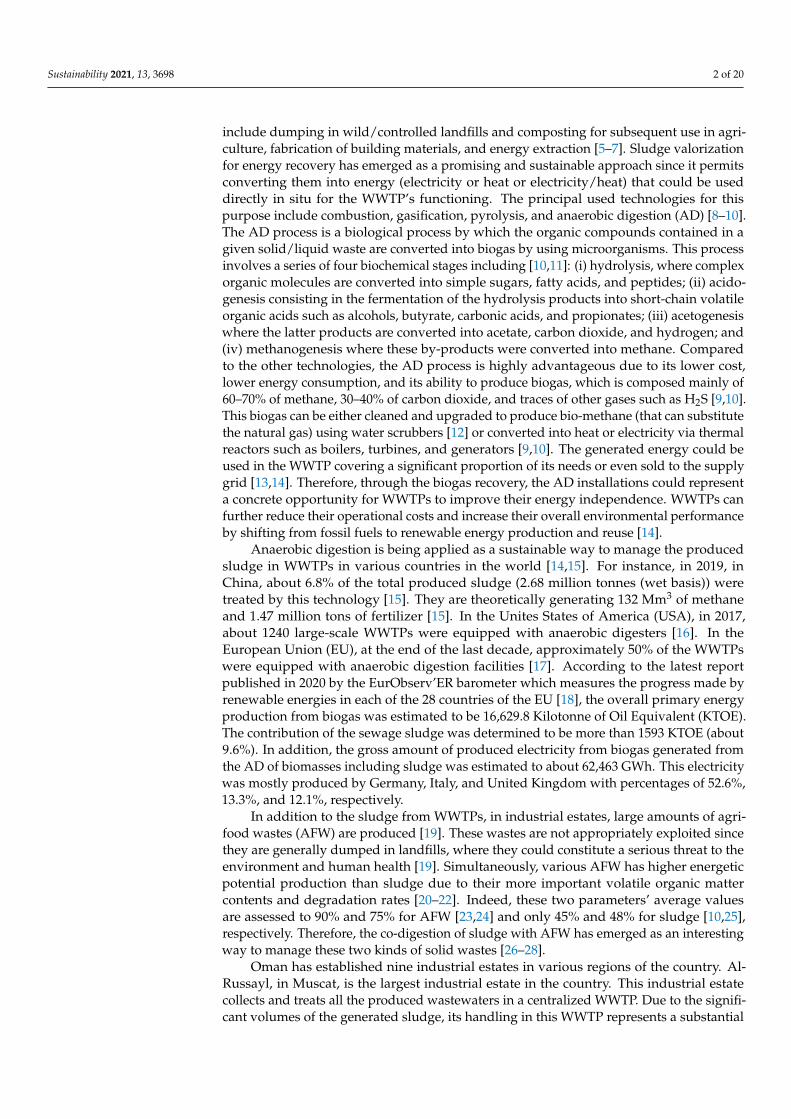
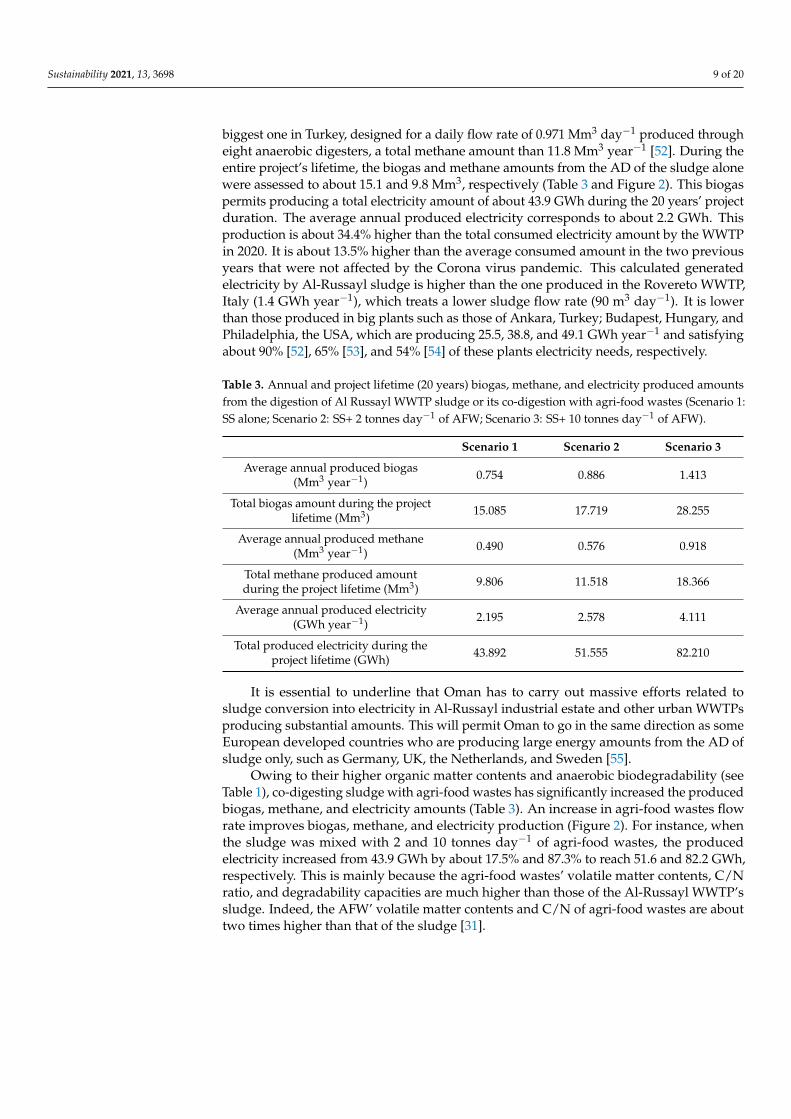
biggest one in Turkey, designed for a daily flow rate of 0.971 Mm3 day−1 produced througheight anaerobic digesters, a total methane amount than 11.8 Mm3 year−1 [52]. During theentire project’s lifetime, the biogas and methane amounts from the AD of the sludge alonewere assessed to about 15.1 and 9.8 Mm3, respectively (Table 3 and Figure 2). This biogaspermits producing a total electricity amount of about 43.9 GWh during the 20 years’ projectduration. The average annual produced electricity corresponds to about 2.2 GWh. Thisproduction is about 34.4% higher than the total consumed electricity amount by the WWTPin 2020. It is about 13.5% higher than the average consumed amount in the two previousyears that were not affected by the Corona virus pandemic. This calculated generatedelectricity by Al-Russayl sludge is higher than the one produced in the Rovereto WWTP,Italy (1.4 GWh year−1), which treats a lower sludge flow rate (90 m3 day−1). It is lowerthan those produced in big plants such as those of Ankara, Turkey; Budapest, Hungary, andPhiladelphia, the USA, which are producing 25.5, 38.8, and 49.1 GWh year−1 and satisfyingabout 90% [52], 65% [53], and 54% [54] of these plants electricity needs, respectively.
Table 3. Annual and project lifetime (20 years) biogas, methane, and electricity produced amountsfrom the digestion of Al Russayl WWTP sludge or its co-digestion with agri-food wastes (Scenario 1:SS alone; Scenario 2: SS+ 2 tonnes day−1 of AFW; Scenario 3: SS+ 10 tonnes day−1 of AFW).
Scenario 1 Scenario 2 Scenario 3
Average annual produced biogas(Mm3 year−1) 0.754 0.886 1.413
Total biogas amount during the projectlifetime (Mm3) 15.085 17.719 28.255
Average annual produced methane(Mm3 year−1) 0.490 0.576 0.918
Total methane produced amountduring the project lifetime (Mm3) 9.806 11.518 18.366
Average annual produced electricity(GWh year−1) 2.195 2.578 4.111
Total produced electricity during theproject lifetime (GWh) 43.892 51.555 82.210
It is essential to underline that Oman has to carry out massive efforts related tosludge conversion into electricity in Al-Russayl industrial estate and other urban WWTPsproducing substantial amounts. This will permit Oman to go in the same direction as someEuropean developed countries who are producing large energy amounts from the AD ofsludge only, such as Germany, UK, the Netherlands, and Sweden [55].
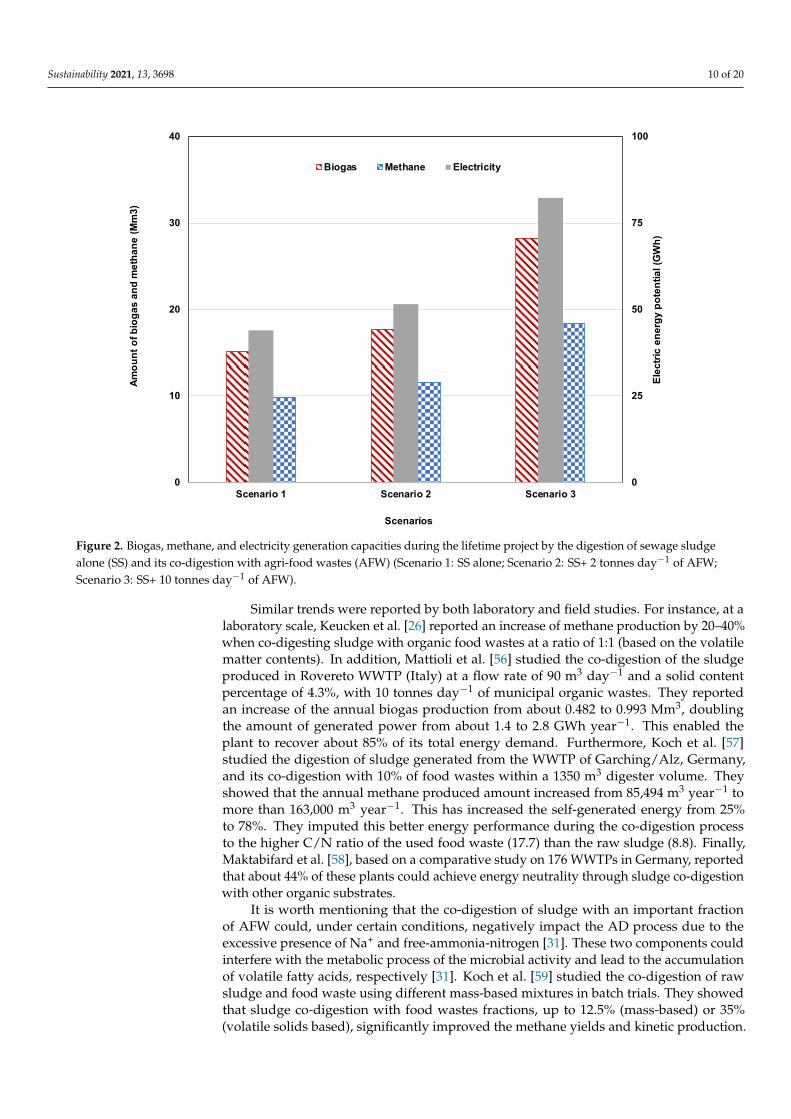
Owing to their higher organic matter contents and anaerobic biodegradability (seeTable 1), co-digesting sludge with agri-food wastes has significantly increased the producedbiogas, methane, and electricity amounts (Table 3). An increase in agri-food wastes flowrate improves biogas, methane, and electricity production (Figure 2). For instance, whenthe sludge was mixed with 2 and 10 tonnes day−1 of agri-food wastes, the producedelectricity increased from 43.9 GWh by about 17.5% and 87.3% to reach 51.6 and 82.2 GWh,respectively. This is mainly because the agri-food wastes’ volatile matter contents, C/Nratio, and degradability capacities are much higher than those of the Al-Russayl WWTP’ssludge. Indeed, the AFW’ volatile matter contents and C/N of agri-food wastes are abouttwo times higher than that of the sludge [31].
Sustainability 2021, 13, 3698 10 of 20Sustainability 2021, 13, x FOR PEER REVIEW 9 of 20
Figure 2. Biogas, methane, and electricity generation capacities during the lifetime project by the digestion of sewage sludge alone (SS) and its co-digestion with agri-food wastes (AFW) (Scenario 1: SS alone; Scenario 2: SS+ 2 tonnes day−1 of AFW; Scenario 3: SS+ 10 tonnes day−1 of AFW).
Table 3. Annual and project lifetime (20 years) biogas, methane, and electricity produced amounts from the digestion of Al Russayl WWTP sludge or its co-digestion with agri-food wastes (Scenario 1: SS alone; Scenario 2: SS+ 2 tonnes day−1 of AFW; Scenario 3: SS+ 10 tonnes day−1 of AFW).
Scenario 1 Scenario 2 Scenario 3 Average annual produced biogas (Mm3 year−1) 0.754 0.886 1.413
Total biogas amount during the project lifetime (Mm3) 15.085 17.719 28.255 Average annual produced methane (Mm3 year−1) 0.490 0.576 0.918
Total methane produced amount during the project lifetime (Mm3) 9.806 11.518 18.366 Average annual produced electricity (GWh year−1) 2.195 2.578 4.111
Total produced electricity during the project lifetime (GWh) 43.892 51.555 82.210
It is essential to underline that Oman has to carry out massive efforts related to sludge conversion into electricity in Al-Russayl industrial estate and other urban WWTPs pro-ducing substantial amounts. This will permit Oman to go in the same direction as some European developed countries who are producing large energy amounts from the AD of sludge only, such as Germany, UK, the Netherlands, and Sweden [55].
Owing to their higher organic matter contents and anaerobic biodegradability (see Table 1), co-digesting sludge with agri-food wastes has significantly increased the pro-duced biogas, methane, and electricity amounts (Table 3). An increase in agri-food wastes flow rate improves biogas, methane, and electricity production (Figure 2). For instance, when the sludge was mixed with 2 and 10 tonnes day−1 of agri-food wastes, the produced electricity increased from 43.9 GWh by about 17.5% and 87.3% to reach 51.6 and 82.2 GWh, respectively. This is mainly because the agri-food wastes’ volatile matter contents, C/N ratio, and degradability capacities are much higher than those of the Al-Russayl WWTP’s
0
25
50
75
100
0
10
20
30
40
Scenario 1 Scenario 2 Scenario 3
Elec
tric
ener
gy p
oten
tial (
GW
h)
Amou
nt o
f bio
gas
and
met
hane
(Mm
3)
Scenarios
Biogas Methane Electricity
Figure 2. Biogas, methane, and electricity generation capacities during the lifetime project by the digestion of sewage sludgealone (SS) and its co-digestion with agri-food wastes (AFW) (Scenario 1: SS alone; Scenario 2: SS+ 2 tonnes day−1 of AFW;Scenario 3: SS+ 10 tonnes day−1 of AFW).
Similar trends were reported by both laboratory and field studies. For instance, at alaboratory scale, Keucken et al. [26] reported an increase of methane production by 20–40%when co-digesting sludge with organic food wastes at a ratio of 1:1 (based on the volatilematter contents). In addition, Mattioli et al. [56] studied the co-digestion of the sludgeproduced in Rovereto WWTP (Italy) at a flow rate of 90 m3 day−1 and a solid contentpercentage of 4.3%, with 10 tonnes day−1 of municipal organic wastes. They reportedan increase of the annual biogas production from about 0.482 to 0.993 Mm3, doublingthe amount of generated power from about 1.4 to 2.8 GWh year−1. This enabled theplant to recover about 85% of its total energy demand. Furthermore, Koch et al. [57]studied the digestion of sludge generated from the WWTP of Garching/Alz, Germany,and its co-digestion with 10% of food wastes within a 1350 m3 digester volume. Theyshowed that the annual methane produced amount increased from 85,494 m3 year−1 tomore than 163,000 m3 year−1. This has increased the self-generated energy from 25%to 78%. They imputed this better energy performance during the co-digestion processto the higher C/N ratio of the used food waste (17.7) than the raw sludge (8.8). Finally,Maktabifard et al. [58], based on a comparative study on 176 WWTPs in Germany, reportedthat about 44% of these plants could achieve energy neutrality through sludge co-digestionwith other organic substrates.
It is worth mentioning that the co-digestion of sludge with an important fractionof AFW could, under certain conditions, negatively impact the AD process due to theexcessive presence of Na+ and free-ammonia-nitrogen [31]. These two components couldinterfere with the metabolic process of the microbial activity and lead to the accumulationof volatile fatty acids, respectively [31]. Koch et al. [59] studied the co-digestion of rawsludge and food waste using different mass-based mixtures in batch trials. They showedthat sludge co-digestion with food wastes fractions, up to 12.5% (mass-based) or 35%(volatile solids based), significantly improved the methane yields and kinetic production.
Sustainability 2021, 13, 3698 11 of 20
In our case, the AFW fraction is relatively low (0.7% for scenario 1 and 3.4% for scenario 2)which is expected not to negatively influence the AD process.
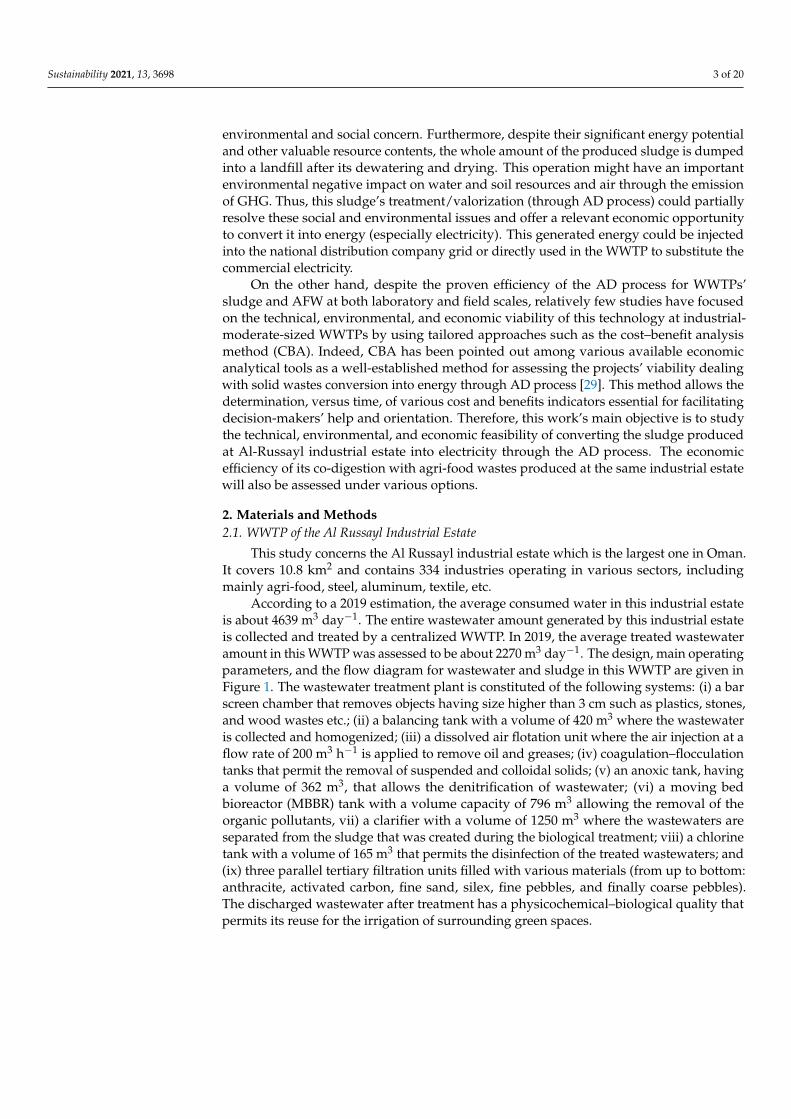
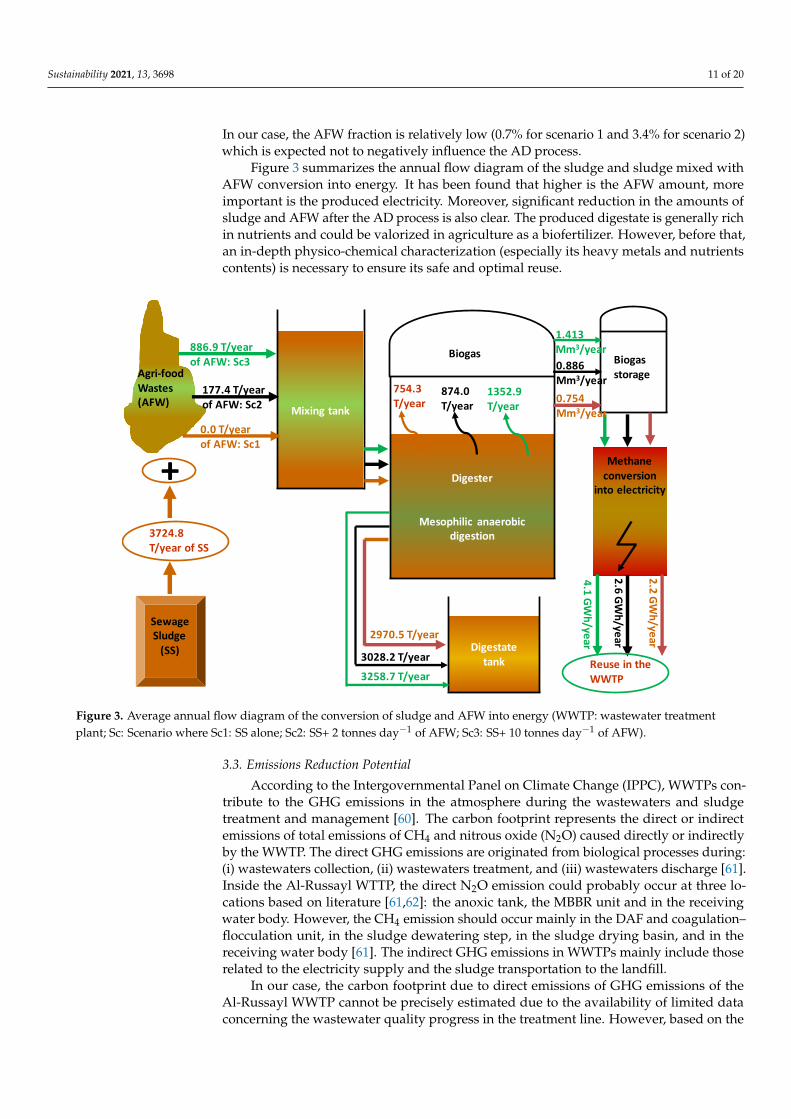
Figure 3 summarizes the annual flow diagram of the sludge and sludge mixed withAFW conversion into energy. It has been found that higher is the AFW amount, moreimportant is the produced electricity. Moreover, significant reduction in the amounts ofsludge and AFW after the AD process is also clear. The produced digestate is generally richin nutrients and could be valorized in agriculture as a biofertilizer. However, before that,an in-depth physico-chemical characterization (especially its heavy metals and nutrientscontents) is necessary to ensure its safe and optimal reuse.
Sustainability 2021, 13, x FOR PEER REVIEW 11 of 20
Figure 3. Average annual flow diagram of the conversion of sludge and AFW into energy (WWTP: wastewater treatment plant; Sc: Scenario where Sc1: SS alone; Sc2: SS+ 2 tonnes day−1 of AFW; Sc3: SS+ 10 tonnes day−1 of AFW).
3.3. Emissions Reduction Potential According to the Intergovernmental Panel on Climate Change (IPPC), WWTPs con-
tribute to the GHG emissions in the atmosphere during the wastewaters and sludge treat-ment and management [60]. The carbon footprint represents the direct or indirect emis-sions of total emissions of CH4 and nitrous oxide (N2O) caused directly or indirectly by the WWTP. The direct GHG emissions are originated from biological processes during: (i) wastewaters collection, (ii) wastewaters treatment, and (iii) wastewaters discharge [61]. Inside the Al-Russayl WTTP, the direct N2O emission could probably occur at three loca-tions based on literature [61,62]: the anoxic tank, the MBBR unit and in the receiving water body. However, the CH4 emission should occur mainly in the DAF and coagulation–floc-culation unit, in the sludge dewatering step, in the sludge drying basin, and in the receiv-ing water body [61]. The indirect GHG emissions in WWTPs mainly include those related to the electricity supply and the sludge transportation to the landfill.
In our case, the carbon footprint due to direct emissions of GHG emissions of the Al-Russayl WWTP cannot be precisely estimated due to the availability of limited data con-cerning the wastewater quality progress in the treatment line. However, based on the lit-erature, the direct N2O emission in the WWTPs could vary in a large range between 0.003% and 0.6% (Kg NO2-N/Kg total N (TN)) depending on the wastewaters loads and operating conditions [61,63]. Concerning the N2O emission in the water receiving body, it is generally fixed to 0.5% of the effluent TN content [60]. Regarding CH4 emission, it is usually more complicated to be evaluated in comparison to NO2. However, for the whole WWTP, it is generally up to 30% of the produced biogas [64]. In the receiving water bodies, the CH4 emission is equal to 0.025 kg CH4/kg of chemical oxygen demand (COD) of the effluent [60]. Regarding the sludge line, the CH4 is emitted during: the storage and de-watering of the digested sludge and the heat and electricity production unit (non-burned methane) at percentages of 2–4.5%, and 1.3–1.8% of the total produced CH4 amount [61]. In the current study, we focused mainly on the avoided indirect GHG emissions (CO2
Sewage Sludge
(SS)
Agri-foodWastes (AFW)
Mixing tank
Digester
Mesophilic anaerobic digestion
Digestatetank
3724.8 T/year of SS
886.9 T/year of AFW: Sc3
754.3 T/year
+
177.4 T/year of AFW: Sc2
0.0 T/year of AFW: Sc1
Biogas Biogas storage
0.886Mm3/year0.754Mm3/year
1.413Mm3/year
3028.2 T/year3258.7 T/year
2.2 GWh/year
2.6 GWh/year
4.1 GWh/year
Methane conversion
into electricity
Reuse in the WWTP
874.0T/year
1352.9T/year
2970.5 T/year
Figure 3. Average annual flow diagram of the conversion of sludge and AFW into energy (WWTP: wastewater treatmentplant; Sc: Scenario where Sc1: SS alone; Sc2: SS+ 2 tonnes day−1 of AFW; Sc3: SS+ 10 tonnes day−1 of AFW).
3.3. Emissions Reduction Potential
According to the Intergovernmental Panel on Climate Change (IPPC), WWTPs con-tribute to the GHG emissions in the atmosphere during the wastewaters and sludgetreatment and management [60]. The carbon footprint represents the direct or indirectemissions of total emissions of CH4 and nitrous oxide (N2O) caused directly or indirectlyby the WWTP. The direct GHG emissions are originated from biological processes during:(i) wastewaters collection, (ii) wastewaters treatment, and (iii) wastewaters discharge [61].Inside the Al-Russayl WTTP, the direct N2O emission could probably occur at three lo-cations based on literature [61,62]: the anoxic tank, the MBBR unit and in the receivingwater body. However, the CH4 emission should occur mainly in the DAF and coagulation–flocculation unit, in the sludge dewatering step, in the sludge drying basin, and in thereceiving water body [61]. The indirect GHG emissions in WWTPs mainly include thoserelated to the electricity supply and the sludge transportation to the landfill.
In our case, the carbon footprint due to direct emissions of GHG emissions of theAl-Russayl WWTP cannot be precisely estimated due to the availability of limited dataconcerning the wastewater quality progress in the treatment line. However, based on the
Sustainability 2021, 13, 3698 12 of 20
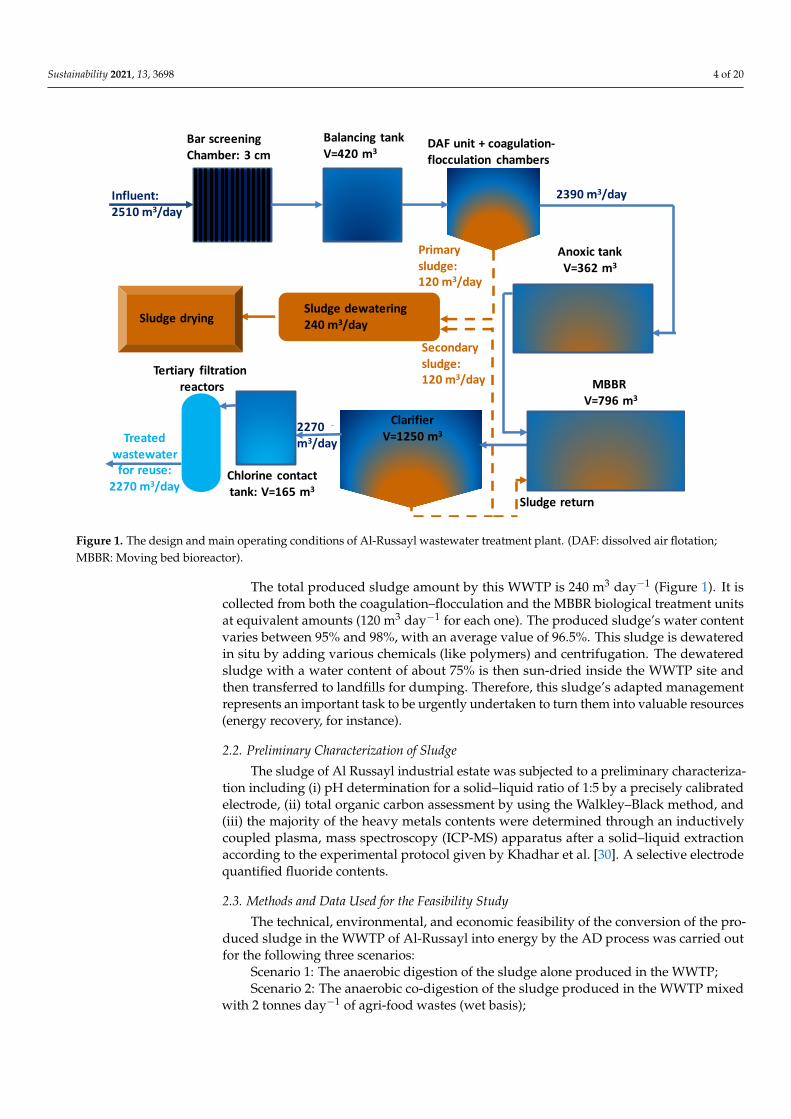
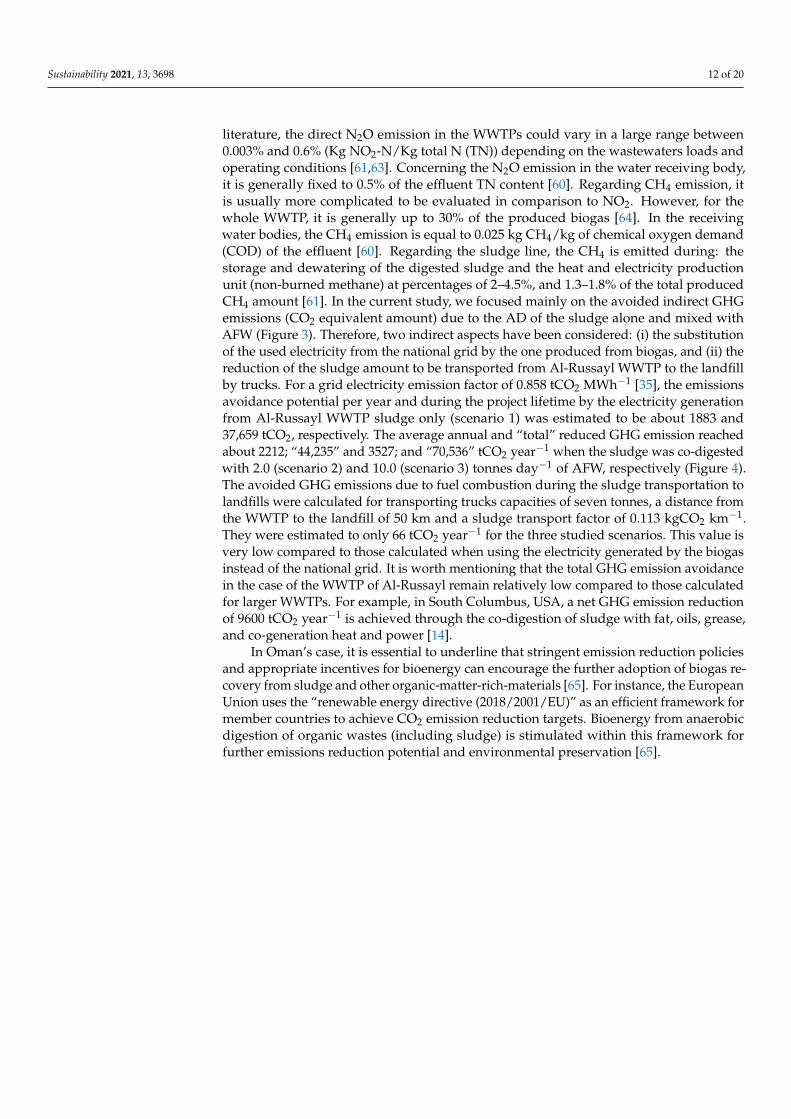
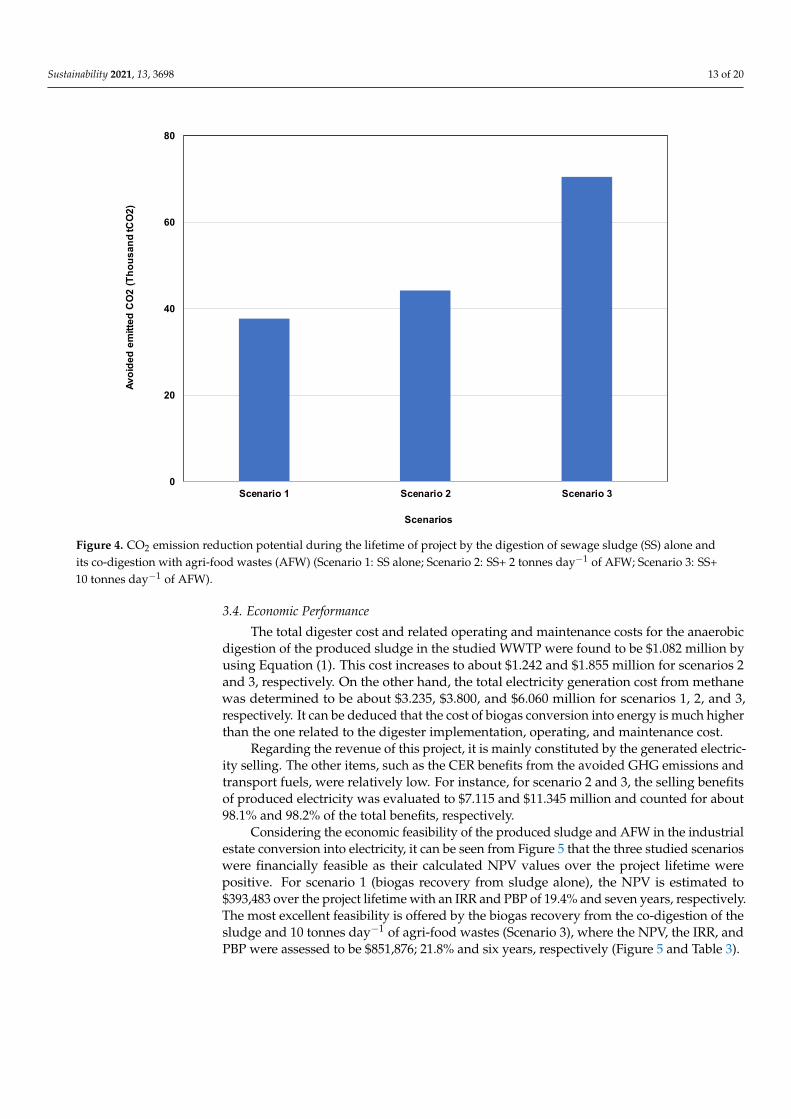
literature, the direct N2O emission in the WWTPs could vary in a large range between0.003% and 0.6% (Kg NO2-N/Kg total N (TN)) depending on the wastewaters loads andoperating conditions [61,63]. Concerning the N2O emission in the water receiving body,it is generally fixed to 0.5% of the effluent TN content [60]. Regarding CH4 emission, itis usually more complicated to be evaluated in comparison to NO2. However, for thewhole WWTP, it is generally up to 30% of the produced biogas [64]. In the receivingwater bodies, the CH4 emission is equal to 0.025 kg CH4/kg of chemical oxygen demand(COD) of the effluent [60]. Regarding the sludge line, the CH4 is emitted during: thestorage and dewatering of the digested sludge and the heat and electricity productionunit (non-burned methane) at percentages of 2–4.5%, and 1.3–1.8% of the total producedCH4 amount [61]. In the current study, we focused mainly on the avoided indirect GHGemissions (CO2 equivalent amount) due to the AD of the sludge alone and mixed withAFW (Figure 3). Therefore, two indirect aspects have been considered: (i) the substitutionof the used electricity from the national grid by the one produced from biogas, and (ii) thereduction of the sludge amount to be transported from Al-Russayl WWTP to the landfillby trucks. For a grid electricity emission factor of 0.858 tCO2 MWh−1 [35], the emissionsavoidance potential per year and during the project lifetime by the electricity generationfrom Al-Russayl WWTP sludge only (scenario 1) was estimated to be about 1883 and37,659 tCO2, respectively. The average annual and “total” reduced GHG emission reachedabout 2212; “44,235” and 3527; and “70,536” tCO2 year−1 when the sludge was co-digestedwith 2.0 (scenario 2) and 10.0 (scenario 3) tonnes day−1 of AFW, respectively (Figure 4).The avoided GHG emissions due to fuel combustion during the sludge transportation tolandfills were calculated for transporting trucks capacities of seven tonnes, a distance fromthe WWTP to the landfill of 50 km and a sludge transport factor of 0.113 kgCO2 km−1.They were estimated to only 66 tCO2 year−1 for the three studied scenarios. This value isvery low compared to those calculated when using the electricity generated by the biogasinstead of the national grid. It is worth mentioning that the total GHG emission avoidancein the case of the WWTP of Al-Russayl remain relatively low compared to those calculatedfor larger WWTPs. For example, in South Columbus, USA, a net GHG emission reductionof 9600 tCO2 year−1 is achieved through the co-digestion of sludge with fat, oils, grease,and co-generation heat and power [14].
In Oman’s case, it is essential to underline that stringent emission reduction policiesand appropriate incentives for bioenergy can encourage the further adoption of biogas re-covery from sludge and other organic-matter-rich-materials [65]. For instance, the EuropeanUnion uses the “renewable energy directive (2018/2001/EU)” as an efficient framework formember countries to achieve CO2 emission reduction targets. Bioenergy from anaerobicdigestion of organic wastes (including sludge) is stimulated within this framework forfurther emissions reduction potential and environmental preservation [65].
Sustainability 2021, 13, 3698 13 of 20
Sustainability 2021, 13, x FOR PEER REVIEW 12 of 20
equivalent amount) due to the AD of the sludge alone and mixed with AFW (Figure 3). Therefore, two indirect aspects have been considered: (i) the substitution of the used elec-tricity from the national grid by the one produced from biogas, and (ii) the reduction of the sludge amount to be transported from Al-Russayl WWTP to the landfill by trucks. For a grid electricity emission factor of 0.858 tCO2 MWh−1 [35], the emissions avoidance po-tential per year and during the project lifetime by the electricity generation from Al-Rus-sayl WWTP sludge only (scenario 1) was estimated to be about 1883 and 37,659 tCO2, re-spectively. The average annual and “total” reduced GHG emission reached about 2212; “44,235” and 3527; and “70,536” tCO2 year−1 when the sludge was co-digested with 2.0 (scenario 2) and 10.0 (scenario 3) tonnes day−1 of AFW, respectively (Figure 4). The avoided GHG emissions due to fuel combustion during the sludge transportation to land-fills were calculated for transporting trucks capacities of seven tonnes, a distance from the WWTP to the landfill of 50 km and a sludge transport factor of 0.113 kgCO2 km−1. They were estimated to only 66 tCO2 year−1 for the three studied scenarios. This value is very low compared to those calculated when using the electricity generated by the biogas in-stead of the national grid. It is worth mentioning that the total GHG emission avoidance in the case of the WWTP of Al-Russayl remain relatively low compared to those calculated for larger WWTPs. For example, in South Columbus, USA, a net GHG emission reduction of 9600 tCO2 year−1 is achieved through the co-digestion of sludge with fat, oils, grease, and co-generation heat and power [14].
Figure 4. CO2 emission reduction potential during the lifetime of project by the digestion of sewage sludge (SS) alone and its co-digestion with agri-food wastes (AFW) (Scenario 1: SS alone; Scenario 2: SS+ 2 tonnes day−1 of AFW; Scenario 3: SS+ 10 tonnes day−1 of AFW).
In Oman’s case, it is essential to underline that stringent emission reduction policies and appropriate incentives for bioenergy can encourage the further adoption of biogas recovery from sludge and other organic-matter-rich-materials [65]. For instance, the Eu-ropean Union uses the “renewable energy directive (2018/2001/EU)” as an efficient frame-work for member countries to achieve CO2 emission reduction targets. Bioenergy from
0
20
40
60
80
Scenario 1 Scenario 2 Scenario 3
Avoi
ded
emitt
ed C
O2
(Tho
usan
d tC
O2)
Scenarios
Figure 4. CO2 emission reduction potential during the lifetime of project by the digestion of sewage sludge (SS) alone andits co-digestion with agri-food wastes (AFW) (Scenario 1: SS alone; Scenario 2: SS+ 2 tonnes day−1 of AFW; Scenario 3: SS+10 tonnes day−1 of AFW).
3.4. Economic Performance
The total digester cost and related operating and maintenance costs for the anaerobicdigestion of the produced sludge in the studied WWTP were found to be $1.082 million byusing Equation (1). This cost increases to about $1.242 and $1.855 million for scenarios 2and 3, respectively. On the other hand, the total electricity generation cost from methanewas determined to be about $3.235, $3.800, and $6.060 million for scenarios 1, 2, and 3,respectively. It can be deduced that the cost of biogas conversion into energy is much higherthan the one related to the digester implementation, operating, and maintenance cost.
Regarding the revenue of this project, it is mainly constituted by the generated electric-ity selling. The other items, such as the CER benefits from the avoided GHG emissions andtransport fuels, were relatively low. For instance, for scenario 2 and 3, the selling benefitsof produced electricity was evaluated to $7.115 and $11.345 million and counted for about98.1% and 98.2% of the total benefits, respectively.
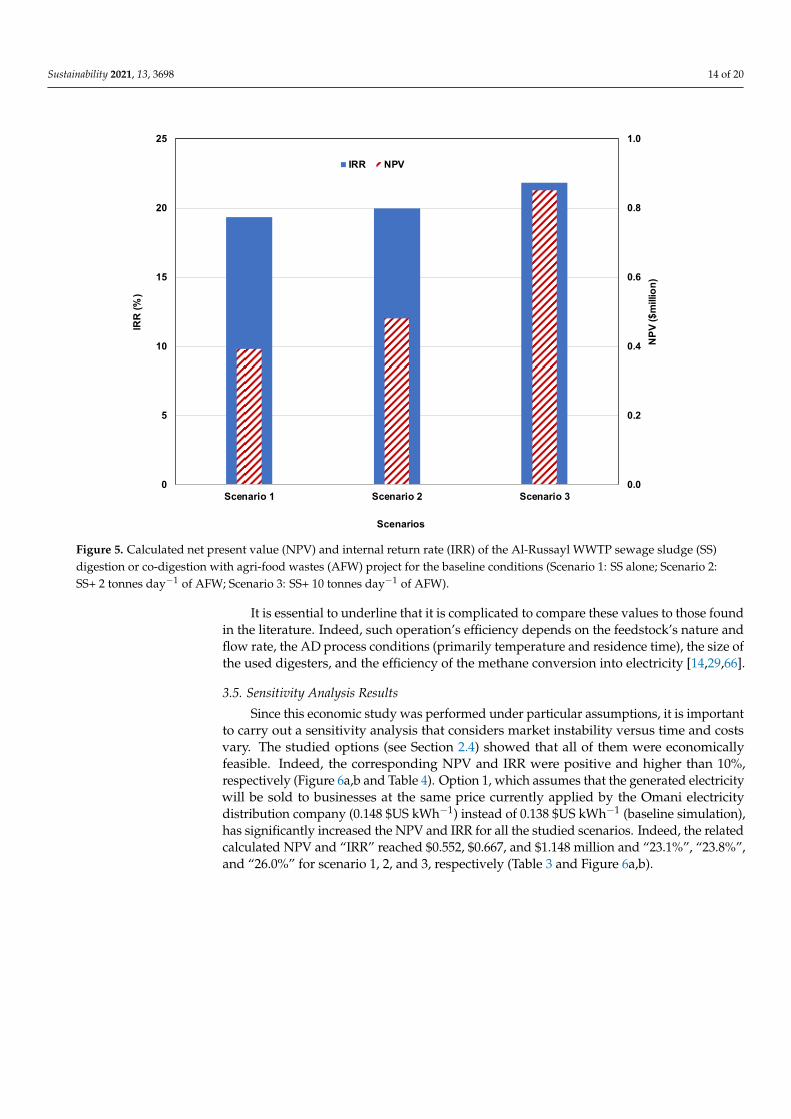
Considering the economic feasibility of the produced sludge and AFW in the industrialestate conversion into electricity, it can be seen from Figure 5 that the three studied scenarioswere financially feasible as their calculated NPV values over the project lifetime werepositive. For scenario 1 (biogas recovery from sludge alone), the NPV is estimated to$393,483 over the project lifetime with an IRR and PBP of 19.4% and seven years, respectively.The most excellent feasibility is offered by the biogas recovery from the co-digestion of thesludge and 10 tonnes day−1 of agri-food wastes (Scenario 3), where the NPV, the IRR, andPBP were assessed to be $851,876; 21.8% and six years, respectively (Figure 5 and Table 3).
Sustainability 2021, 13, 3698 14 of 20
Sustainability 2021, 13, x FOR PEER REVIEW 13 of 20
anaerobic digestion of organic wastes (including sludge) is stimulated within this frame-work for further emissions reduction potential and environmental preservation [65].
3.4. Economic Performance The total digester cost and related operating and maintenance costs for the anaerobic
digestion of the produced sludge in the studied WWTP were found to be $1.082 million by using Equation (1). This cost increases to about $1.242 and $1.855 million for scenarios 2 and 3, respectively. On the other hand, the total electricity generation cost from methane was determined to be about $3.235, $3.800, and $6.060 million for scenarios 1, 2, and 3, respectively. It can be deduced that the cost of biogas conversion into energy is much higher than the one related to the digester implementation, operating, and maintenance cost.
Regarding the revenue of this project, it is mainly constituted by the generated elec-tricity selling. The other items, such as the CER benefits from the avoided GHG emissions and transport fuels, were relatively low. For instance, for scenario 2 and 3, the selling ben-efits of produced electricity was evaluated to $7.115 and $11.345 million and counted for about 98.1% and 98.2% of the total benefits, respectively.
Considering the economic feasibility of the produced sludge and AFW in the indus-trial estate conversion into electricity, it can be seen from Figure 5 that the three studied scenarios were financially feasible as their calculated NPV values over the project lifetime were positive. For scenario 1 (biogas recovery from sludge alone), the NPV is estimated to $393,483 over the project lifetime with an IRR and PBP of 19.4% and seven years, re-spectively. The most excellent feasibility is offered by the biogas recovery from the co-digestion of the sludge and 10 tonnes day−1 of agri-food wastes (Scenario 3), where the NPV, the IRR, and PBP were assessed to be $851,876; 21.8% and six years, respectively (Figure 5 and Table 3).
0.0
0.2
0.4
0.6
0.8
1.0
0
5
10
15
20
25
Scenario 1 Scenario 2 Scenario 3
NPV
($m
illio
n)
IRR
(%)
Scenarios
IRR NPV
Figure 5. Calculated net present value (NPV) and internal return rate (IRR) of the Al-Russayl WWTP sewage sludge (SS)digestion or co-digestion with agri-food wastes (AFW) project for the baseline conditions (Scenario 1: SS alone; Scenario 2:SS+ 2 tonnes day−1 of AFW; Scenario 3: SS+ 10 tonnes day−1 of AFW).
It is essential to underline that it is complicated to compare these values to those foundin the literature. Indeed, such operation’s efficiency depends on the feedstock’s nature andflow rate, the AD process conditions (primarily temperature and residence time), the size ofthe used digesters, and the efficiency of the methane conversion into electricity [14,29,66].
3.5. Sensitivity Analysis Results
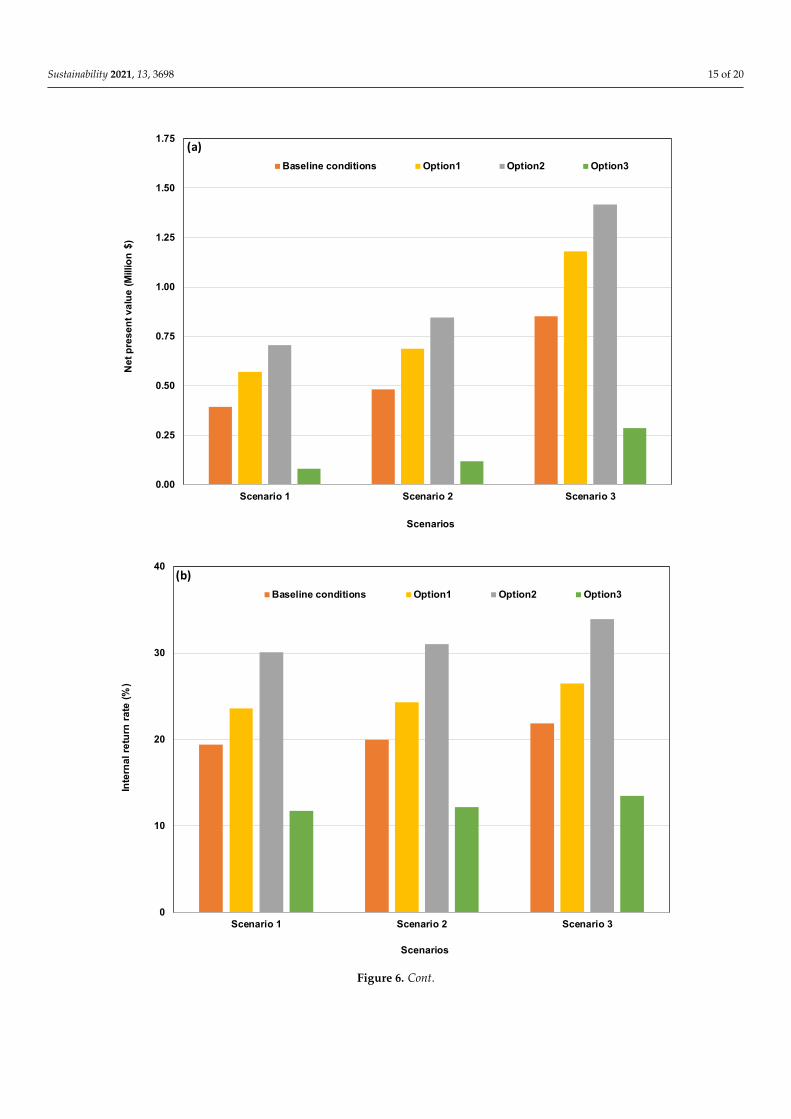
Since this economic study was performed under particular assumptions, it is importantto carry out a sensitivity analysis that considers market instability versus time and costsvary. The studied options (see Section 2.4) showed that all of them were economicallyfeasible. Indeed, the corresponding NPV and IRR were positive and higher than 10%,respectively (Figure 6a,b and Table 4). Option 1, which assumes that the generated electricitywill be sold to businesses at the same price currently applied by the Omani electricitydistribution company (0.148 $US kWh−1) instead of 0.138 $US kWh−1 (baseline simulation),has significantly increased the NPV and IRR for all the studied scenarios. Indeed, the relatedcalculated NPV and “IRR” reached $0.552, $0.667, and $1.148 million and “23.1%”, “23.8%”,and “26.0%” for scenario 1, 2, and 3, respectively (Table 3 and Figure 6a,b).
Sustainability 2021, 13, 3698 15 of 20Sustainability 2021, 13, x FOR PEER REVIEW 15 of 20
.
0.00
0.25
0.50
0.75
1.00
1.25
1.50
1.75
Scenario 1 Scenario 2 Scenario 3
Net
pre
sent
val
ue (M
illio
n $)
Scenarios
Baseline conditions Option1 Option2 Option3
(a)
0
10
20
30
40
Scenario 1 Scenario 2 Scenario 3
Inte
rnal
retu
rn ra
te (%
)
Scenarios
Baseline conditions Option1 Option2 Option3
(b)
Figure 6. Cont.
Sustainability 2021, 13, 3698 16 of 20Sustainability 2021, 13, x FOR PEER REVIEW 16 of 20
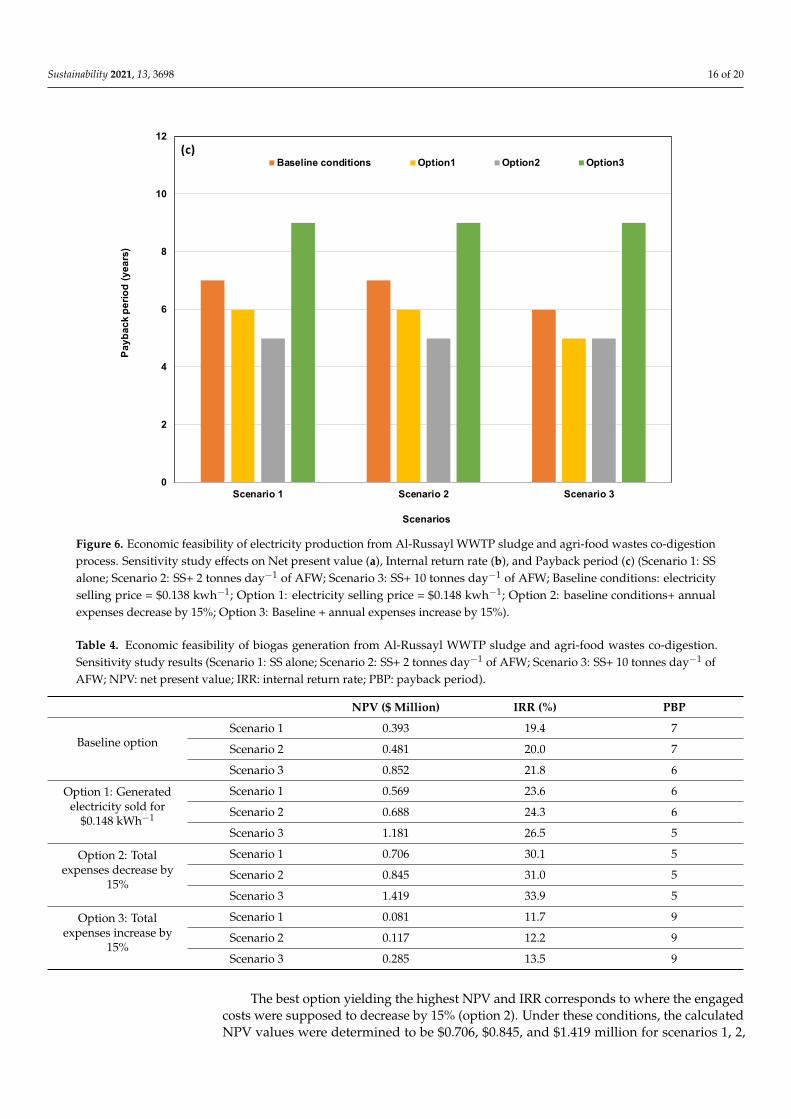
Figure 6. Economic feasibility of electricity production from Al-Russayl WWTP sludge and agri-food wastes co-digestion process. Sensitivity study effects on Net present value (a), Internal return rate (b), and Payback period (c) (Scenario 1: SS alone; Scenario 2: SS+ 2 tonnes day−1 of AFW; Scenario 3: SS+ 10 tonnes day−1 of AFW; Baseline conditions: electricity selling price = $0.138 kwh−1; Option 1: electricity selling price = $0.148 kwh−1; Option 2: baseline conditions+ annual expenses decrease by 15%; Option 3: Baseline + annual expenses increase by 15%).
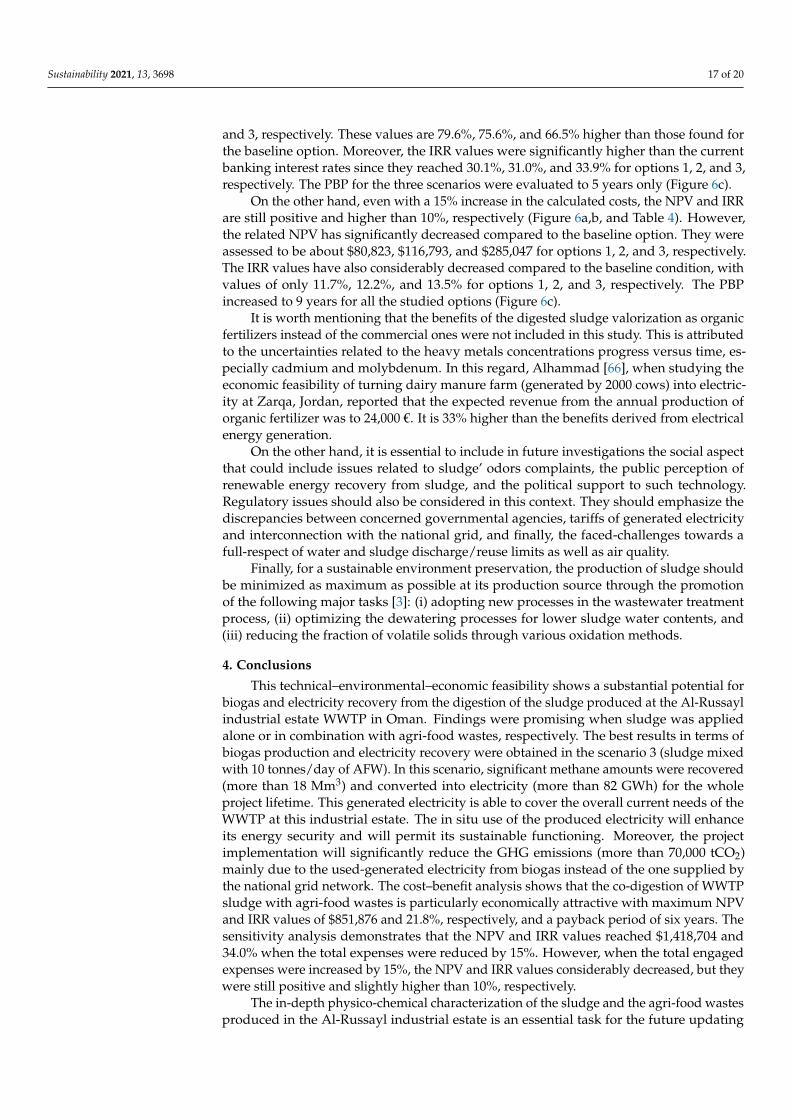
The best option yielding the highest NPV and IRR corresponds to where the engaged costs were supposed to decrease by 15% (option 2). Under these conditions, the calculated NPV values were determined to be $0.706, $0.845, and $1.419 million for scenarios 1, 2, and 3, respectively. These values are 79.6%, 75.6%, and 66.5% higher than those found for the baseline option. Moreover, the IRR values were significantly higher than the current banking interest rates since they reached 30.1%, 31.0%, and 33.9% for options 1, 2, and 3, respectively. The PBP for the three scenarios were evaluated to 5 years only (Figure 6c).
On the other hand, even with a 15% increase in the calculated costs, the NPV and IRR are still positive and higher than 10%, respectively (Figure 6a,b, and Table 4). However, the related NPV has significantly decreased compared to the baseline option. They were assessed to be about $80,823, $116,793, and $285,047 for options 1, 2, and 3, respectively. The IRR values have also considerably decreased compared to the baseline condition, with values of only 11.7%, 12.2%, and 13.5% for options 1, 2, and 3, respectively. The PBP in-creased to 9 years for all the studied options (Figure 6c).
It is worth mentioning that the benefits of the digested sludge valorization as organic fertilizers instead of the commercial ones were not included in this study. This is at-tributed to the uncertainties related to the heavy metals concentrations progress versus time, especially cadmium and molybdenum. In this regard, Alhammad [66], when stud-ying the economic feasibility of turning dairy manure farm (generated by 2000 cows) into electricity at Zarqa, Jordan, reported that the expected revenue from the annual produc-tion of organic fertilizer was to 24,000 €. It is 33% higher than the benefits derived from electrical energy generation.
0
2
4
6
8
10
12
Scenario 1 Scenario 2 Scenario 3
Payb
ack
perio
d (y
ears
)
Scenarios
Baseline conditions Option1 Option2 Option3(c)
Figure 6. Economic feasibility of electricity production from Al-Russayl WWTP sludge and agri-food wastes co-digestionprocess. Sensitivity study effects on Net present value (a), Internal return rate (b), and Payback period (c) (Scenario 1: SSalone; Scenario 2: SS+ 2 tonnes day−1 of AFW; Scenario 3: SS+ 10 tonnes day−1 of AFW; Baseline conditions: electricityselling price = $0.138 kwh−1; Option 1: electricity selling price = $0.148 kwh−1; Option 2: baseline conditions+ annualexpenses decrease by 15%; Option 3: Baseline + annual expenses increase by 15%).
Table 4. Economic feasibility of biogas generation from Al-Russayl WWTP sludge and agri-food wastes co-digestion.Sensitivity study results (Scenario 1: SS alone; Scenario 2: SS+ 2 tonnes day−1 of AFW; Scenario 3: SS+ 10 tonnes day−1 ofAFW; NPV: net present value; IRR: internal return rate; PBP: payback period).
NPV ($ Million) IRR (%) PBP
Baseline optionScenario 1 0.393 19.4 7
Scenario 2 0.481 20.0 7
Scenario 3 0.852 21.8 6
Option 1: Generatedelectricity sold for
$0.148 kWh−1
Scenario 1 0.569 23.6 6
Scenario 2 0.688 24.3 6
Scenario 3 1.181 26.5 5
Option 2: Totalexpenses decrease by
15%
Scenario 1 0.706 30.1 5
Scenario 2 0.845 31.0 5
Scenario 3 1.419 33.9 5
Option 3: Totalexpenses increase by
15%
Scenario 1 0.081 11.7 9
Scenario 2 0.117 12.2 9
Scenario 3 0.285 13.5 9
The best option yielding the highest NPV and IRR corresponds to where the engagedcosts were supposed to decrease by 15% (option 2). Under these conditions, the calculatedNPV values were determined to be $0.706, $0.845, and $1.419 million for scenarios 1, 2,
Sustainability 2021, 13, 3698 17 of 20
and 3, respectively. These values are 79.6%, 75.6%, and 66.5% higher than those found forthe baseline option. Moreover, the IRR values were significantly higher than the currentbanking interest rates since they reached 30.1%, 31.0%, and 33.9% for options 1, 2, and 3,respectively. The PBP for the three scenarios were evaluated to 5 years only (Figure 6c).
On the other hand, even with a 15% increase in the calculated costs, the NPV and IRRare still positive and higher than 10%, respectively (Figure 6a,b, and Table 4). However,the related NPV has significantly decreased compared to the baseline option. They wereassessed to be about $80,823, $116,793, and $285,047 for options 1, 2, and 3, respectively.The IRR values have also considerably decreased compared to the baseline condition, withvalues of only 11.7%, 12.2%, and 13.5% for options 1, 2, and 3, respectively. The PBPincreased to 9 years for all the studied options (Figure 6c).
It is worth mentioning that the benefits of the digested sludge valorization as organicfertilizers instead of the commercial ones were not included in this study. This is attributedto the uncertainties related to the heavy metals concentrations progress versus time, es-pecially cadmium and molybdenum. In this regard, Alhammad [66], when studying theeconomic feasibility of turning dairy manure farm (generated by 2000 cows) into electric-ity at Zarqa, Jordan, reported that the expected revenue from the annual production oforganic fertilizer was to 24,000 €. It is 33% higher than the benefits derived from electricalenergy generation.
On the other hand, it is essential to include in future investigations the social aspectthat could include issues related to sludge’ odors complaints, the public perception ofrenewable energy recovery from sludge, and the political support to such technology.Regulatory issues should also be considered in this context. They should emphasize thediscrepancies between concerned governmental agencies, tariffs of generated electricityand interconnection with the national grid, and finally, the faced-challenges towards afull-respect of water and sludge discharge/reuse limits as well as air quality.
Finally, for a sustainable environment preservation, the production of sludge shouldbe minimized as maximum as possible at its production source through the promotionof the following major tasks [3]: (i) adopting new processes in the wastewater treatmentprocess, (ii) optimizing the dewatering processes for lower sludge water contents, and(iii) reducing the fraction of volatile solids through various oxidation methods.
4. Conclusions
This technical–environmental–economic feasibility shows a substantial potential forbiogas and electricity recovery from the digestion of the sludge produced at the Al-Russaylindustrial estate WWTP in Oman. Findings were promising when sludge was appliedalone or in combination with agri-food wastes, respectively. The best results in terms ofbiogas production and electricity recovery were obtained in the scenario 3 (sludge mixedwith 10 tonnes/day of AFW). In this scenario, significant methane amounts were recovered(more than 18 Mm3) and converted into electricity (more than 82 GWh) for the wholeproject lifetime. This generated electricity is able to cover the overall current needs of theWWTP at this industrial estate. The in situ use of the produced electricity will enhanceits energy security and will permit its sustainable functioning. Moreover, the projectimplementation will significantly reduce the GHG emissions (more than 70,000 tCO2)mainly due to the used-generated electricity from biogas instead of the one supplied bythe national grid network. The cost–benefit analysis shows that the co-digestion of WWTPsludge with agri-food wastes is particularly economically attractive with maximum NPVand IRR values of $851,876 and 21.8%, respectively, and a payback period of six years. Thesensitivity analysis demonstrates that the NPV and IRR values reached $1,418,704 and34.0% when the total expenses were reduced by 15%. However, when the total engagedexpenses were increased by 15%, the NPV and IRR values considerably decreased, but theywere still positive and slightly higher than 10%, respectively.
The in-depth physico-chemical characterization of the sludge and the agri-food wastesproduced in the Al-Russayl industrial estate is an essential task for the future updating
Sustainability 2021, 13, 3698 18 of 20
and exploitation of this feasibility study. This characterization will mainly concern mainlytheir total solid and volatile matter contents, their potential degradability rate, and theircalorific energy potential.
The application of such a process in other existing WWTPs and future planned oneswill permit Oman to achieve the sustainable goals for low GHG emissions, sanitation, andwater resources protection. A thorough assessment of the techno–environment–economicfeasibility of biogas production from the co-digestion of sludge and agri-food wastesin the planned WWTP will enable the government to implement new sustainable andenvironmental-friendly plants. These plants should integrate the biogas recovery andconversion into electricity and the agronomic valorization of the generated digestate,which are essential steps towards circular economy concept application and sustainability.
Author Contributions: Conceptualization, S.J. and Y.C.; methodology, S.J., M.U., and Y.C.; validation,A.A.-B., and M.J.; formal analysis, S.J. and Y.C.; investigation, S.J., M.J., and Y.C.; data curation, Y.C.and M.J.; writing—original draft preparation, S.J; writing—review and editing, Y.C., M.U., A.A.-B.,and M.J; supervision, Y.C. and A.A.-B.; project administration, S.J.; funding acquisition, S.J., Y.C. andA.A.-B. All authors have read and agreed to the published version of the manuscript.
Funding: Madayn is gratefully acknowledged for the funding of this research work in the frameworkof the project number: Chair/DVC/Madayn/20/01.
Institutional Review Board Statement: Not applicable.
Informed Consent Statement: Not applicable.
Data Availability Statement: Data available on request.
Acknowledgments: Authors would like to thank Lokman Zaibet for his technical and scientific support.
Conflicts of Interest: The authors declare no conflict of interest.
References1. Gherghel, A.; Teodosiu, C.; De Gisi, S. A review on wastewater sludge valorisation and its challenges in the context of circular
economy. J. Clean. Prod. 2019, 228, 244–263. [CrossRef]2. Fijalkowski, K.; Rorat, A.; Grobelak, A.; Kacprzak, M.J. The presence of contaminations in sewage sludge—The current situation.
J. Environ. Manag. 2017, 203, 1126–1136. [CrossRef]3. Collivignarelli, M.C.; Abbà, A.; Miino, M.C.; Torretta, V. What Advanced Treatments Can Be Used to Minimize the Production of
Sewage Sludge in WWTPs? Appl. Sci. 2019, 9, 2650. [CrossRef]4. European Commission. Environmental, Economic and Social Impacts of the Use of Sewage Sludge on Land. Consultant Report
Options Impacts; Report by RPA, Milieu Ltd., WRc and European Commission, DG Environment under Study Contract DGENV.G.4/ETU/2008/0076r; European Commission: Brussels, Belgium, 2009.
5. Seleiman, M.F.; Santanen, A.; Mäkelä, P.S.A. Recycling sludge on cropland as fertilizer—Advantages and risks. Resour. Conserv.Recycl. 2020, 155, 104647. [CrossRef]
6. Chang, Z.; Long, G.; Zhou, J.L.; Ma, C. Valorization of sewage sludge in the fabrication of construction and building materials: Areview. Resour. Conserv. Recycl. 2020, 154, 104606. [CrossRef]
7. Raheem, A.; Sikarwar, V.S.; He, J.; Dastyar, W.; Dionysiou, D.D.; Wang, W.; Zhao, M. Opportunities and challenges in sustainabletreatment and resource reuse of sewage sludge: A review. Chem. Eng. J. 2018, 337, 616–641. [CrossRef]
8. Kor-Bicakci, G.; Eskicioglu, C. Recent developments on thermal municipal sludge pretreatment technologies for enhancedanaerobic digestion. Renew. Sustain. Energy Rev. 2019, 110, 423–443. [CrossRef]
9. Cao, Y.; Pawłowski, A. Sewage sludge-to-energy approaches based on anaerobic digestion and pyrolysis: Brief overview andenergy efficiency assessment. Renew. Sustain. Energy Rev. 2012, 16, 1657–1665. [CrossRef]
10. Oladejo, J.; Shi, K.; Luo, X.; Yang, G.; Wu, T. A Review of Sludge-to-Energy Recovery Methods. Energies 2019, 12, 60. [CrossRef]11. Lee, I.S.; Parameswaran, P.; Rittmann, B.E. Effects of solids retention time on methanogenesis in anaerobic digestion of thickened
mixed sludge. Bioresour. Technol. 2011, 102, 10266–10272. [CrossRef] [PubMed]12. Aryal, N.; Kvist, T. Alternative of Biogas Injection into the Danish Gas Grid System—A Study from Demand Perspective.
ChemEngineering 2018, 2, 43. [CrossRef]13. Mills, N.; Pearce, P.; Farrow, J.; Thorpe, R.B.; Kirkby, N.F. Environmental & economic life cycle assessment of current & future
sewage sludge to energy technologies. Waste Manag. 2014, 34, 185–195. [CrossRef]14. Shen, Y.; Linville, J.L.; Urgun-Demirtas, M.; Mintz, M.M.; Snyder, S.W. An overview of biogas production and utilization at
full-scale wastewater treatment plants (WWTPs) in the United States: Challenges and opportunities towards energy-neutralWWTPs. Renew. Sustain. Energy Rev. 2015, 50, 346–362. [CrossRef]
Sustainability 2021, 13, 3698 19 of 20
15. Wei, L.; Zhu, F.; Li, Q.; Xue, C.; Xia, X.; Yu, H.; Zhao, Q.; Jiang, J.; Bai, S. Development, current state and future trends of sludgemanagement in China: Based on exploratory data and CO2-equivaient emissions analysis. Environ. Int. 2020, 144, 106093.[CrossRef]
16. Scarlat, N.; Dallemand, J.F.; Fahl, F. Biogas: Developments and perspectives in Europe. Renew. Energy 2018, 129, 457–472.[CrossRef]
17. Werle, S.; Wilk, R.K. A review of methods for the thermal utilization of sewage sludge: The Polish perspective. Renew. Energy2010, 35, 1914–1919. [CrossRef]
18. EurObserv’ER Biogas Barometer. EurObserv’ER, 2020. Available online: https://www.eurobserv-er.org/biogas-barometer-2020/(accessed on 15 March 2021).
19. Torres-León, C.; Ramírez-Guzman, N.; Londoño-Hernandez, L.; Martinez-Medina, G.A.; Díaz-Herrera, R.; Navarro-Macias, V.;Alvarez-Pérez, O.B.; Picazo, B.; Villarreal-Vázquez, M.; Ascacio-Valdes, J.; et al. Food Waste and Byproducts: An Opportunity toMinimize Malnutrition and Hunger in Developing Countries. Front. Sustain. Food Syst. 2018, 2, 52. [CrossRef]
20. Czekała, W. Agricultural Biogas Plants as a Chance for the Development of the Agri-Food Sector. J. Ecol. Eng. 2018, 19, 179–183.[CrossRef]
21. Król, K.; Iskra, K.; Ferens, W.; Miodonski, J.M. Testing properties of sewage sludge for energy use. Environ. Prot. Eng. 2019, 45,epe190405. [CrossRef]
22. Ahmad, N.; Sahrin, N.; Talib, N.; Abdul Ghani, F. Characterization of energy content in food waste by using thermogravimetricanalyser (TGA) and elemental analyser (CHNS-O). J. Phys. Conf. Ser. 2019, 1349, 012140. [CrossRef]
23. Zhang, C.; Su, H.; Baeyens, J.; Tan, T. Reviewing the anaerobic digestion of food waste for biogas production. Renew. Sustain.Energy Rev. 2014, 38, 383–392. [CrossRef]
24. Kuo, J.; Dow, J. Biogas production from anaerobic digestion of food waste and relevant air quality implications. J. Air WasteManag. Assoc. 2017, 67, 1000–1011. [CrossRef] [PubMed]
25. Bertanza, G.; Canato, M.; Laera, G. Towards energy self-sufficiency and integral material recovery in waste water treatmentplants: Assessment of upgrading options. J. Clean. Prod. 2018, 170, 1206–1218. [CrossRef]
26. Keucken, A.; Habagil, M.; Batstone, D.; Jeppsson, U.; Arnell, M. Anaerobic Co-Digestion of Sludge and Organic Food Waste—Performance, Inhibition, and Impact on the Microbial Community. Energies 2018, 11, 2325. [CrossRef]
27. Guimarães, C.D.S.; Maia, D.R.D.S.; Serra, E.G. Construction of Biodigesters to Optimize the Production of Biogas from AnaerobicCo-Digestion of Food Waste and Sewage. Energies 2018, 11, 870. [CrossRef]
28. Morales-Polo, C.; del Mar Cledera-Castro, M.; Soria, B.Y.M. Reviewing the Anaerobic Digestion of Food Waste: From WasteGeneration and Anaerobic Process to Its Perspectives. Appl. Sci. 2018, 8, 1804. [CrossRef]
29. Mohammed, M.; Egyir, I.S.; Donkor, A.K.; Amoah, P.; Nyarko, S.; Boateng, K.K.; Ziwu, C. Feasibility study for biogas integrationinto waste treatment plants in Ghana. Egypt. J. Pet. 2017, 26, 695–703. [CrossRef]
30. Khadhar, S.; Sdiri, A.; Chekirben, A.; Azouzi, R.; Charef, A. Integration of sequential extraction, chemical analysis and statisticaltools for the availability risk assessment of heavy metals in sludge amended soils. Environ. Pollut. 2020, 263, 114543. [CrossRef]
31. Chow, W.L.; Chong, S.; Lim, J.W.; Chan, Y.J.; Chong, M.F.; Tiong, T.J.; Chin, J.K.; Pan, G.T. Anaerobic Co-Digestion of WastewaterSludge: A Review of Potential Co-Substrates and Operating Factors for Improved Methane Yield. Processes 2020, 8, 39. [CrossRef]
32. Islam, M.N.; Park, K.-J.; Yoon, H.-S. Methane Production Potential of Food Waste and Food Waste Mixture with Swine Manure inAnaerobic Digestion. J. Biosyst. Eng. 2012, 37, 100–105. [CrossRef]
33. Zhang, C.; Su, H.; Tan, T. Batch and semi-continuous anaerobic digestion of food waste in a dual solid-liquid system. Bioresour.Technol. 2013, 145, 10–16. [CrossRef] [PubMed]
34. Akbulut, A. Techno-economic analysis of electricity and heat generation from farm-scale biogas plant: Çiçekdagı case study.Energy 2012, 44, 381–390. [CrossRef]
35. Charabi, Y.; Al-Awadhi, T.; Choudri, B.S. Strategic pathways and regulatory choices for effective GHG reduction in hydrocarbonbased economy: Case of Oman. Energy Rep. 2018, 4, 653–659. [CrossRef]
36. Hamrick, K.; Gallant, M. State of the Voluntary Carbon Markets 2017; International Water Power & Dam Construction: London,UK, 2017.
37. Bidart, C.; Fröhling, M.; Schultmann, F. Electricity and substitute natural gas generation from the conversion of wastewatertreatment plant sludge. Appl. Energy 2014, 113, 404–413. [CrossRef]
38. Morin, P.; Marcos, B.; Moresoli, C.; Laflamme, C.B. Economic and environmental assessment on the energetic valorization oforganic material for a municipality in Quebec, Canada. Appl. Energy 2010, 87, 275–283. [CrossRef]
39. Martin, J.H.; Oemler, J.A. A Protocol for Quantifying and Reporting the Performance of Anaerobic Digestion Systems for LivestockManures. In Proceedings of the International Symposium on Air Quality and Waste Management for Agriculture, Broomfield,CO, USA, 16–19 September 2007.
40. European Environment Agency. EEA Greenhouse Gas—Data Viewer. Data Viewer Greenhouse Gas Emissions and Removals, Sent byCountries to UNFCCC EU Greenhouse Gas Monitoring Mechanism (EU Member States); European Environment Agency: Copenhagen,Denmark, 2019.
41. Adani, F.; Tambone, F. Long-term effect of sewage sludge application on soil humic acids. Chemosphere 2005, 60, 1214–1221.[CrossRef] [PubMed]

Sustainability 2021, 13, 3698 20 of 20
42. Zhang, J.; Sugir, M.E.; Li, Y.; Yuan, L.; Zhou, M.; Lv, P.; Yu, Z.; Wang, L.; Zhou, D. Effects of vermicomposting on the mainchemical properties and bioavailability of Cd/Zn in pure sludge. Environ. Sci. Pollut. Res. 2019, 26, 20949–20960. [CrossRef][PubMed]
43. Janowska, B.; Szymanski, K.; Sidełko, R.; Siebielska, I.; Walendzik, B. Assessment of mobility and bioavailability of mercurycompounds in sewage sludge and composts. Environ. Res. 2017, 156, 394–403. [CrossRef]
44. Collivignarelli, M.C.; Abbà, A.; Frattarola, A.; Miino, M.C.; Padovani, S.; Katsoyiannis, I.; Torretta, V. Legislation for the Reuse ofBiosolids on Agricultural Land in Europe: Overview. Sustainability 2019, 11, 6015. [CrossRef]
45. Verbinnen, B.; Block, C.; Hannes, D.; Lievens, P.; Vaclavikova, M.; Stefusova, K.; Gallios, G.; Vandecasteele, C. Removal ofMolybdate Anions from Water by Adsorption on Zeolite-Supported Magnetite. Water Environ. Res. 2012, 84, 753–760. [CrossRef][PubMed]
46. Zhu, H.; Huang, Q.; Fu, S.; Zhang, X.; Shi, M.; Liu, B. Removal of Molybdenum(VI) from Raw Water Using Nano Zero-ValentIron Supported on Activated Carbon. Water 2020, 12, 3162. [CrossRef]
47. Council of European Communities. Council Directive 86/278/EEC of 12 June 1986 on the protection of the environment, and inparticular of the soil, when sewage sludge is used in agriculture. Off. J. Eur. Communities 1986, 86, 278.
48. Baawain, M.S.; Al-Jabri, M.; Choudri, B.S. Characterization of Industrial Wastewater Sludge in Oman from Three DifferentRegions and Recommendations for Alternate Reuse Applications. Iran. J. Public Health 2015, 44, 1473–1481.
49. Alrawashdeh, K.A.B.; Gul, E.; Yang, Q.; Yang, H.; Bartocci, P.; Fantozzi, F. Effect of Heavy Metals in the Performance of AnaerobicDigestion of Olive Mill Waste. Processes 2020, 8, 1146. [CrossRef]
50. Abdel-Shafy, H.I.; Mansour, M.S.M. Biogas production as affected by heavy metals in the anaerobic digestion of sludge. Egypt. J.Pet. 2014, 23, 409–417. [CrossRef]
51. Appels, L.; Baeyens, J.; Degrève, J.; Dewil, R. Principles and potential of the anaerobic digestion of waste-activated sludge. Prog.Energy Combust. Sci. 2008, 34, 755–781. [CrossRef]
52. Berktay, A.; Nas, B. Biogas Production and Utilization Potential of Wastewater Treatment Sludge. Energy Sources Part A Recover.Util. Environ. Eff. 2008, 30, 179–188. [CrossRef]
53. Gurieff, N.; Bruus, J.; Nielsen, B.; Nawawi-Lansade, D.; Cantegril, M. Moving towards an energy neutral WWTP—The positiveimpact of ExelysTM continuous thermal hydrolysis in achieving this goal. Water Pr. Technol. 2012, 7, 1–8. [CrossRef]
54. Tarallo, S. Demonstrated Energy Neutrality Leadership: A Study of Five Champions of Change. Water Intell. Online 2015, 14.[CrossRef]
55. Bachmann, N. Sustainable Biogas Production in Municipal Wastewater Treatment Plants; IEA Bioenergy: Massongex, Switzerland, 2015.56. Mattioli, A.; Gatti, G.B.; Mattuzzi, G.P.; Cecchi, F.; Bolzonella, D. Co-digestion of the organic fraction of municipal solid waste
and sludge improves the energy balance of wastewater treatment plants: Rovereto case study. Renew. Energy 2017, 113, 980–988.[CrossRef]
57. Koch, K.; Plabst, M.; Schmidt, A.; Helmreich, B.; Drewes, J.E. Co-digestion of food waste in a municipal wastewater treatmentplant: Comparison of batch tests and full-scale experiences. Waste Manag. 2016, 47, 28–33. [CrossRef] [PubMed]
58. Maktabifard, M.; Zaborowska, E.; Makinia, J. Achieving energy neutrality in wastewater treatment plants through energy savingsand enhancing renewable energy production. Rev. Environ. Sci. Biotechnol. 2018, 17, 655–689. [CrossRef]
59. Koch, K.; Helmreich, B.; Drewes, J.E. Co-digestion of food waste in municipal wastewater treatment plants: Effect of differentmixtures on methane yield and hydrolysis rate constant. Appl. Energy 2015, 137, 250–255. [CrossRef]
60. Eggleston, H.S.; Buendia, L.; Miwa, K.; Ngara, T.; Tanabe, K. Energy. In IPCC Guidelines for National Greenhouse Gas Inventories;IPCC: Geneva, Switzerland, 2006; Volume 2.
61. Parravicini, V.; Svardal, K.; Krampe, J. Greenhouse Gas Emissions from Wastewater Treatment Plants. Energy Procedia 2016, 97,246–253. [CrossRef]
62. Chai, C.; Zhang, D.; Yu, Y.; Feng, Y.; Wong, M.S. Carbon Footprint Analyses of Mainstream Wastewater Treatment Technologiesunder Different Sludge Treatment Scenarios in China. Water 2015, 7, 918–938. [CrossRef]
63. Law, Y.; Ye, L.; Pan, Y.; Yuan, Z. Nitrous oxide emissions from wastewater treatment processes. Philos. Trans. R. Soc. B Biol. Sci.2012, 367, 1265–1277. [CrossRef]
64. Yoshida, H.; Mønster, J.; Scheutz, C. Plant-integrated measurement of greenhouse gas emissions from a municipal wastewatertreatment plant. Water Res. 2014, 61, 108–118. [CrossRef] [PubMed]
65. Edwards, J.; Othman, M.; Burn, S. A review of policy drivers and barriers for the use of anaerobic digestion in Europe, the UnitedStates and Australia. Renew. Sustain. Energy Rev. 2015, 52, 815–828. [CrossRef]
66. Alhammad, Z. Feasibility Study for a Biogas Plant in Jordan. J. Energy Res. Rev. 2019, 1–6. [CrossRef]