research & applications in global supercomputing: an
TRANSCRIPT

RESEARCH & APPLICATIONS IN GLOBAL SUPERCOMPUTING:
AN INTERDISCIPLINARY SCIENCE
Professor Richard S. SEGALL
Arkansas State University Department of Computer & Information Technology
College of Business State University, AR 72467-0130 USA
E-mail: [email protected]
WMSCI 2014, July 17-20, 2014, Orlando, FL

WHAT IS SUPERCOMPUTER? A supercomputer is a computer at the frontlines of
current processing capacity and speed of calculations.
First introduced in the 1960s, the supercomputers of the 1970s used only few processors, and in the 1990s machines with thousands of processors began to appear.
By the end of the 20th century supercomputers were massively parallel computing systems composed of tens of thousands of processors.
In contrast, supercomputers of the 21st century can use over 100,000 processors including those with graphic capabilities.

WHAT IS SUPERCOMPUTER? Sequoia, a third-generation Blue Gene machine from IBM, runs on
1.6 million processor cores. It can reach speeds of up to 20 petaflops. A petaflop, equals 1015 operations per second, which means that Sequoia can perform 20 x 1015 operations every second.
Sequoia requires 3,000 gallons of water per minute to cool it down. It uses 6 or 7 megawatts on average with peak usage approaching 9 1/2 megawatts. (One megawatt equals 1 million watts)., and that’s $6 or $7 million a year in power.
Source: http://techland.time.com/2012/06/19/what-exactly-is-a-supercomputer/

The University of Manchester Atlas Supercomputer in January 1963.
4

A liquid cooled Cray-2 supercomputer in 1985
5

A Blue Gene/P Supercomputer at Argonne National Laboratory (ANL) in 2012
6

Figure 1: SEQUOIA SUPERCOMPUTER AT LAWRENCE LIVERMORE LABS
Source: http://techland.time.com/2012/06/19/what-exactly-is-a-supercomputer/

PERFORMANCE OF FIRST 50 SUPERCOMPUTERS

TOP SUPERCOMPUTER IN WORLD [JUNE 2014] Tianhe-2, a supercomputer developed by China’s National
University of Defense Technology, is the world’s new No. 1 system with a performance of 33.86 petaflop/s on the Linpack benchmark, according to the 41stedition of the twice-yearly TOP500 list of the world’s most powerful supercomputers. The list was announced June 17 during the opening session of the 2013 International Supercomputing Conference in Leipzig, Germany.
Tianhe-2, or Milky Way-2, will be deployed at the National Supercomputer Center in Guangzho, China, by the end of the year. The surprise appearance of Tianhe-2, two years ahead of the expected deployment, marks China’s first return to the No. 1 position since November 2010, when Tianhe-1A was the top system. Tianhe-2 has 16,000 nodes, each with two Intel Xeon IvyBridge processors and three Xeon Phi processors for a combined total of 3,120,000 computing cores.
Source: http://www.top500.org/lists/2014/06/

HUMAN BRIAN PROJECT USING SUPERCOMPUTERS
Even in the 21st century, there are still a lot of unsolved mysteries when it comes to the human brain. It is a complicated machine that neuroscientists continually try to understand.
A new scientific endeavor hopes to unravel some of these mysteries by creating a highly detailed simulation of the human brain. Essentially, researchers will use a supercomputer to build a working replica of our minds.
With $1.6 billion in funding and more than 200 researchers, the Human Brain Project is the largest, most ambitious cooperative experiment of its kind. Serious hardware is necessary for a project of this kind — to pack the simulation into a single computer would require a system 1,000 times more powerful than today’s supercomputers.
The project began in 2012. It will take Europe 10 years to map all of the 100 billion neurons connected by 100,000 billion synapses that make up a human brain.
Source: www.humanbrainproject.eu

Source: http://mashable.com/2013/02/03/supercomputer-human-brain-project/
Video on YouTube at: (7:28) http://www.youtube.com/watch?v=JqMpGrM5ECo
The Human Brain Project - Video Overview http://www.youtube.com/watch?v=I5HaiMXANhA

Rank Site System Cores Rmax(TFlop/s) Rpeak (TFlop/s Power (kW)
1 National Super Computer Center in Guangzhou
China
Tianhe-2 (MilkyWay-2) - TH-IVB-FEP Cluster, Intel Xeon E5-2692 12C 2.200GHz, TH Express-2, Intel Xeon Phi 31S1P
NUDT
3,120,000 33,862.7 54,902.4 17,808
2 DOE/SC/Oak Ridge National Laboratory United States
Titan - Cray XK7 , Opteron 6274 16C 2.200GHz, Cray Gemini interconnect, NVIDIA K20x
Cray Inc.
560,640 17,590.0 27,112.5 8,209
3 DOE/NNSA/LLNL United States
Sequoia - BlueGene/Q, Power BQC 16C 1.60 GHz, Custom IBM
1,572,864 17,173.2 20,132.7 7,890
4 RIKEN Advanced Institute for Computational Science (AICS)
Japan
K computer, SPARC64 VIIIfx 2.0GHz, Tofu interconnect Fujitsu
705,024 10,510.0 11,280.4 12,660
5 DOE/SC/Argonne National Laboratory United States
Mira - BlueGene/Q, Power BQC 16C 1.60GHz, Custom IBM
786,432 8,586.6 10,066.3 3,945
6 Swiss National Supercomputing Centre (CSCS)
Switzerland
Piz Daint - Cray XC30, Xeon E5-2670 8C 2.600GHz, Aries interconnect , NVIDIA K20x
Cray Inc.
115,984 6,271.0 7,788.9 2,325
7 Texas Advanced Computing Center/Univ. of Texas
United States
Stampede - PowerEdge C8220, Xeon E5-2680 8C 2.700GHz, Infiniband FDR, Intel Xeon Phi SE10P
Dell
462,462 5,168.1 8,520.1 4,510
8 Forschungszentrum Juelich (FZJ) Germany
JUQUEEN - BlueGene/Q, Power BQC 16C 1.600GHz, Custom Interconnect
IBM
458,752 5,008.9 5,872.0 2,301
9 DOE/NNSA/LLNL United States
Vulcan - BlueGene/Q, Power BQC 16C 1.600GHz, Custom Interconnect
IBM
393,216 4,293.3 5,033.2 1,972
10 Leibniz Rechenzentrum Germany
SuperMUC - iDataPlex DX360M4, Xeon E5-2680 8C 2.70GHz, Infiniband FDR
IBM
147, 456 2,897.0 3,185.1 3,423
Figure 1: Top 10 Supercomputer Sites in the World as of November 2013. Source: http://www.top500.org/list/2013/11//#.U3_DUCjRhCg

2ND TOP SUPERCOMPUTER IN WORLD [NOVEMBER 2013]
Titan, a Cray XK7 system installed at the U.S. Department of Energy’s (DOE) Oak Ridge National Laboratory and previously the No. 1 system, is now ranked No. 2.
Titan achieved 17.59 petaflop/s on the Linpack benchmark using 261,632 of its NVIDIA K20x accelerator cores. Titan is one of the most energy efficient systems on the list, consuming a total of 8.21 MW and delivering 2,143 Mflops/W.
Source: http://www.top500.org/lists/2013/11/

DISTRIBUTION OF SUPERCOMPUTERS IN THE WORLD
Table 1 on next slide lists each of the countries in the world that have at least one supercomputer and ranks them accordingly to their system share of the top 500.
Performance measures of Rmax and Rpeak are also provided as well as number of cores.
Figure 2 below Table 1 provides a frequency curve for the count of the number of supercomputers for each of the countries presented in Table 1. This statistic shows the locations of the world's 500 most powerful supercomputers as of November 2013.
As of November 2013: 264 of the world's leading supercomputers were located in the United States.

TABLE 1: COUNT BY COUNTRY AND PERFORMANCE STATISTICS OF THE 500 MOST POWERFUL COMPUTERS IN THE WORLD AS OF NOVEMBER 2103
Countries Count System Share (%) Rmax (GFlops) Rpeak (GFlops) Cores United States 264 52.8 118,261,596 169,499,661 9,837,537China 63 12.6 48,549,093 89,432,561 4,925,804Japan 28 5.6 22,472,218 28,925,862 1,558,880United Kingdom 23 4.6 9,058,329 11,380,215 627,120France 22 4.4 9,489,912 11,228,571 720,416Germany 20 4 13,696,834 16,426,807 1,033,252India 12 2.4 3,040,297 3,812,719 188,252Canada 10 2 2,077,842 2,627,756 190,752Korea, South 5 1 1,258,060 1,760,092 154,224Sweden 5 1 1,067,767 1,297,036 95,680Russia 5 1 1,846,613 3,242,736 166,432Australia 5 1 2,180,151 2,635,546 145,036Italy 5 1 2,665,609 3,212,697 221,120Switzerland 5 1 7,765,418 9,632,162 253,904Netherlands 3 0.6 511,071 671,160 47,544Brazil 3 0.6 626,000 1,182,104 58,880Norway 3 0.6 735,400 873,164 54,400Saudi Arabia 3 0.6 1,165,315 1,827,011 128,272Ireland 2 0.4 268,565 343,310 30,996Israel 2 0.4 314,056 736,819 35,424Finland 2 0.4 378,000 436,301 20,976Hong Kong 2 0.4 352,937 658,368 47,520Poland 2 0.4 455,909 583,605 41,852Spain 2 0.4 1,199,031 1,357,824 65,280Belgium 1 0.2 152,348 175,718 8,448Austria 1 0.2 152,900 182,829 20,776Denmark 1 0.2 162,098 183,676 15,672Taiwan 1 0.2 177,100 231,859 26,244
Source: Top500, http://www.top500.org/statistics/list/#.U30G4SjRhCh
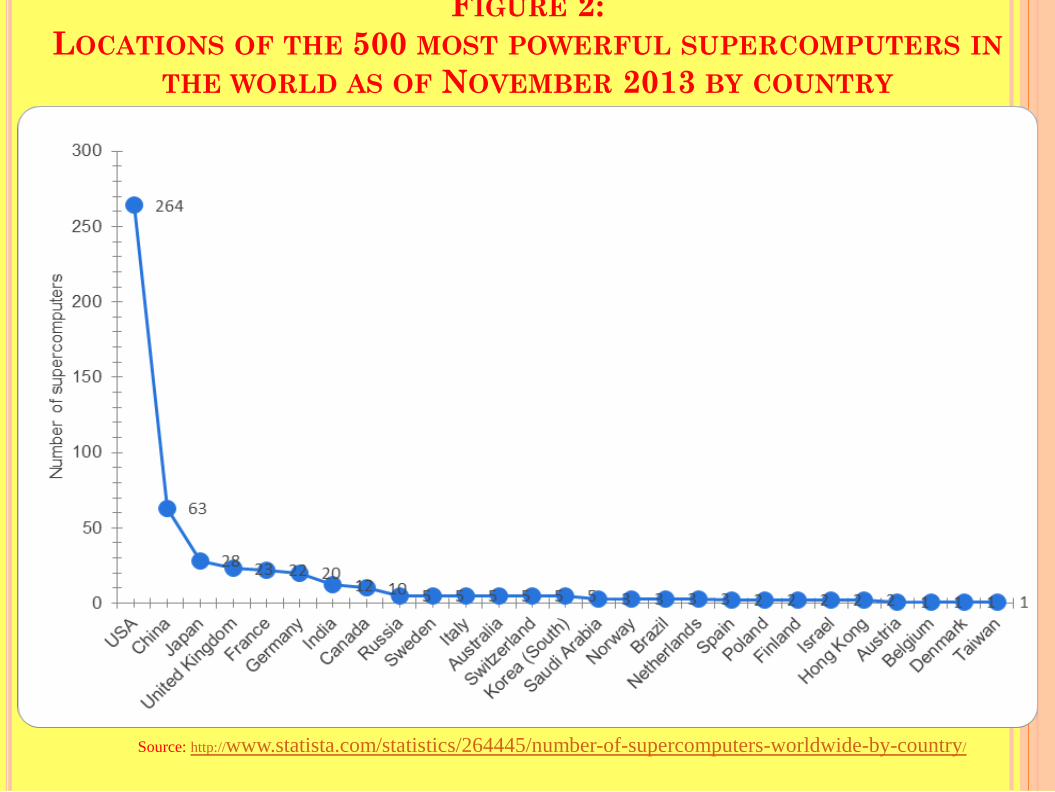
FIGURE 2: LOCATIONS OF THE 500 MOST POWERFUL SUPERCOMPUTERS IN
THE WORLD AS OF NOVEMBER 2013 BY COUNTRY
Source: http://www.statista.com/statistics/264445/number-of-supercomputers-worldwide-by-country/
VIDEO WEBLINKS

WEBLINKS OF VIDEOS SHOWN 1/) Supercomputing NACAR Wyoming Supercomputing
Center http://www.youtube.com/watch?v=NVogS2T-Wi8 2.) NCSA Accelerates Industry with Supercomputing http://www.youtube.com/watch?v=yaLwFPVHbNU 3.) Supercomputer Beagle can analyze 240 whole genomes
in two days http://www.youtube.com/watch?v=SLTgGNHj6nE 4.) Worlds Fastest Supercomputer Is A Scientific Time
Machine http://www.youtube.com/watch?v=8YTXaG5QbjM

TERAFLOPS PER COUNTRY
Figure 3 next provides the teraflops per country and log teraflops per country.
Log teraflops per country is provided as additional bar graph because of the magnitude of the numbers a more convenient scale is needed to compare these.
As Figure 3 illustrates, the United States is the
leader with China, Japan, Germany and France lagging behind.

FIGURE 3: TERAFLOPS AND LOG TERAFLOPS PER COUNTRY OF THE WORLD’S TOP 500 SUPERCOMPUTERS

FIGURE 4: MEGAFLOPS AND LOG MEGAFLOPS PER CAPITA BY COUNTRY OF THE WORLD’S TOP 500
SUPERCOMPUTERS
Figure 4 provides a comparison by introducing the factor of average country income by country of the top 500 supercomputers in the world by comparing the megaflops per capita by country.
As Figure 4 illustrates the country of Switzerland outpaces all other countries, including the United States, Japan, and Germany in both megaflops and log megaflops per capita.

FIGURE 4: MEGAFLOPS AND LOG MEGAFLOPS PER CAPITA BY COUNTRY OF THE WORLD’S TOP 500 SUPERCOMPUTERS

NUMBER OF PEOPLE PER SUPERCOMPUTER (BAR GRAPH) AND NUMBER OF SUPERCOMPUTERS BY COUNTRY (LINE GRAPH) AS OF NOVEMBER 2013
Figure 5 illustrates the number of people (in millions) per supercomputer by country as of November 2013 in bar graphs, and
Figure 5 shows that the India is the leader with 103.06 million because of its population followed by Brazil with 66.72 million and Russia with 28.71 million.
Figure 5 also overlays the bar graph with a connected line graph of the number of supercomputers and shows that United States is leader in number of supercomputers of 264 but the lowest in number of people per supercomputer with 1.19 million.

FIGURE 5: NUMBER OF PEOPLE PER SUPERCOMPUTER (BAR GRAPH) AND NUMBER OF SUPERCOMPUTERS BY COUNTRY (LINE GRAPH) AS OF NOVEMBER 2013
Source: http://imgur.com/r/dataisbeautiful/xvsmNbc

TABLE 2: COUNT BY GEOGRAPHICAL REGION AND PERFORMANCE STATISTICS OF
THE 500 MOST POWERFUL COMPUTERS IN THE WORLD AS OF NOVEMBER 2103
Table 2 provides the aggregation of the statistics in Table 1 for each geographical region of North America, Western Europe, Northern Europe, Southern Europe, Eastern Europe, Eastern Asia, South-central Asia, Western Asia, Australia and New Zealand, and South America.
Table 2 shows a count of 274 supercomputers for North America, and 99 in Eastern Asia, and 52 in Western Europe to account for 85% of the world’s supercomputers.
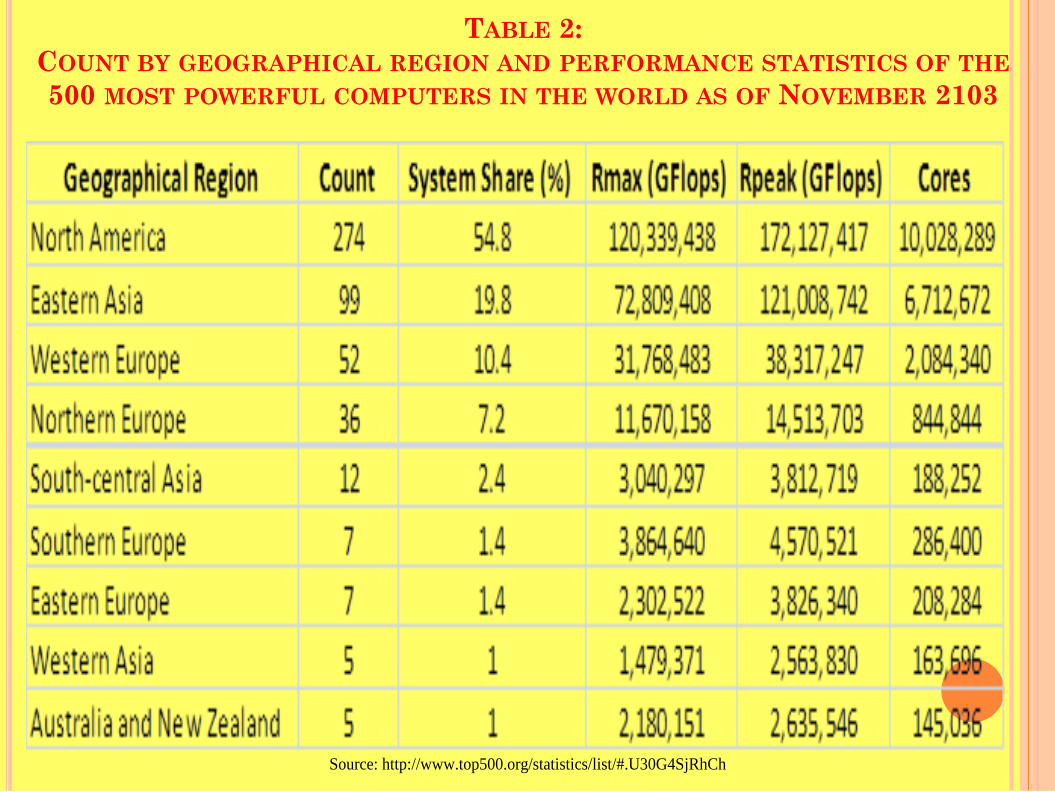
TABLE 2: COUNT BY GEOGRAPHICAL REGION AND PERFORMANCE STATISTICS OF THE 500 MOST POWERFUL COMPUTERS IN THE WORLD AS OF NOVEMBER 2103
Source: http://www.top500.org/statistics/list/#.U30G4SjRhCh

TABLE 3: ARCHITECTURE CLASSIFICATIONS OF THE
TOP 500 SUPERCOMPUTERS IN THE WORLD AS OF NOVEMBER 2013
Source: http://www.top500.org/statistics/list/#.U30G4SjRhCh
Table 3 provides a count of how many of the top 500 supercomputers use cluster versus massively parallel processors (MPP) and indicates that 84.6% of the worlds supercomputers use a cluster architecture.

TABLE 4: TYPES OF OPERATING SYSTEMS FOR THE TOP 500 SUPERCOMPUTER IN THE
WORLD AS OF NOVEMBER 2013 Source: http://www.top500.org/statistics/list/#.U30G4SjRhCh

TABLE 5: PROCESSOR GENERATION FOR THE TOP 500 SUPERCOMPUTERS IN
THE WORLD AS OF NOVEMBER 2013 Source: http://www.top500.org/statistics/list/#.U30G4SjRhCh
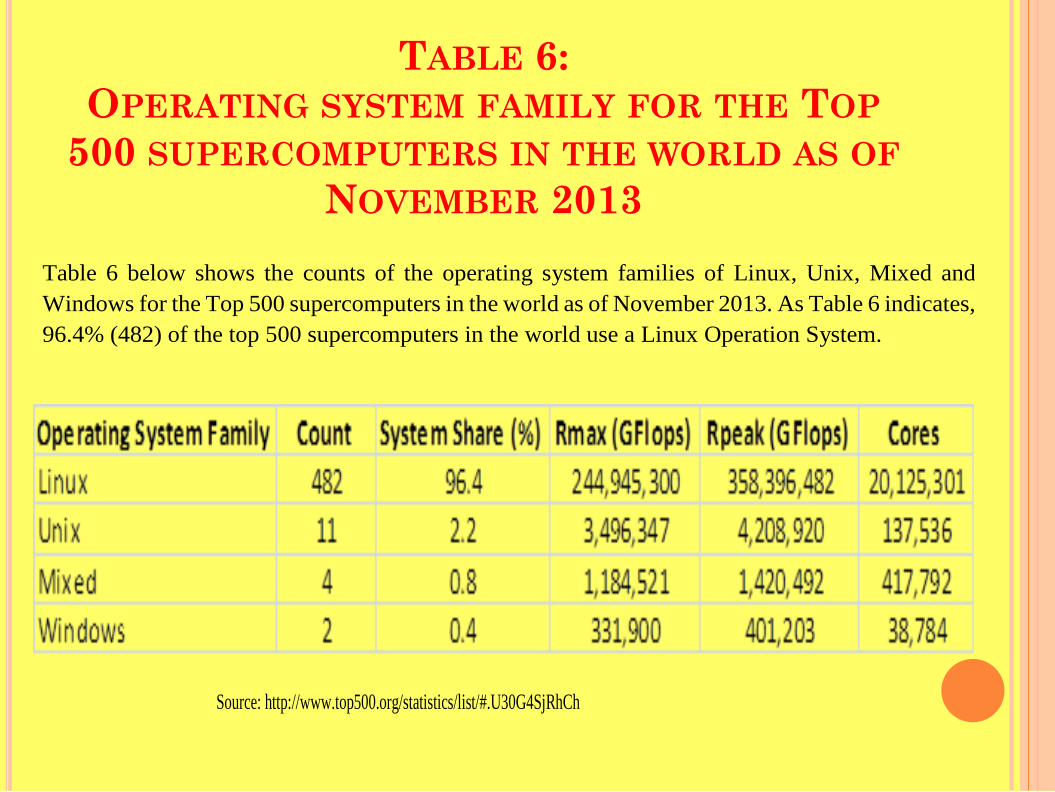
TABLE 6: OPERATING SYSTEM FAMILY FOR THE TOP
500 SUPERCOMPUTERS IN THE WORLD AS OF NOVEMBER 2013
Source: http://www.top500.org/statistics/list/#.U30G4SjRhCh
Table 6 below shows the counts of the operating system families of Linux, Unix, Mixed and Windows for the Top 500 supercomputers in the world as of November 2013. As Table 6 indicates, 96.4% (482) of the top 500 supercomputers in the world use a Linux Operation System.
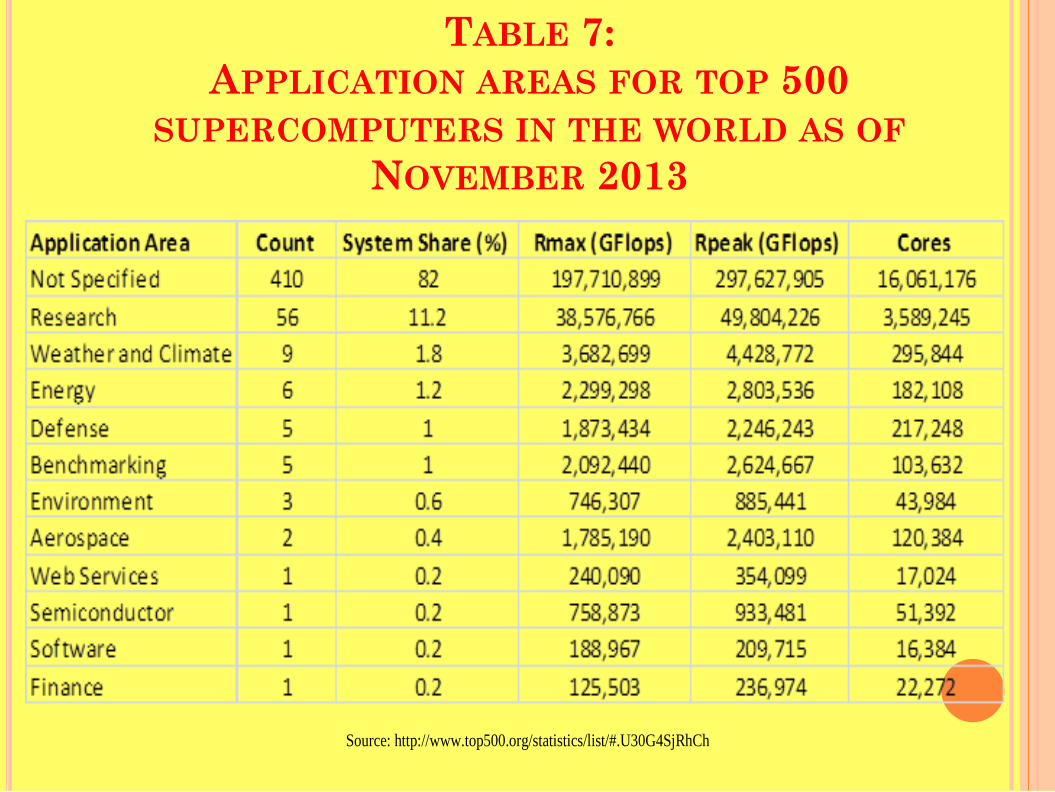
TABLE 7: APPLICATION AREAS FOR TOP 500
SUPERCOMPUTERS IN THE WORLD AS OF NOVEMBER 2013
Source: http://www.top500.org/statistics/list/#.U30G4SjRhCh
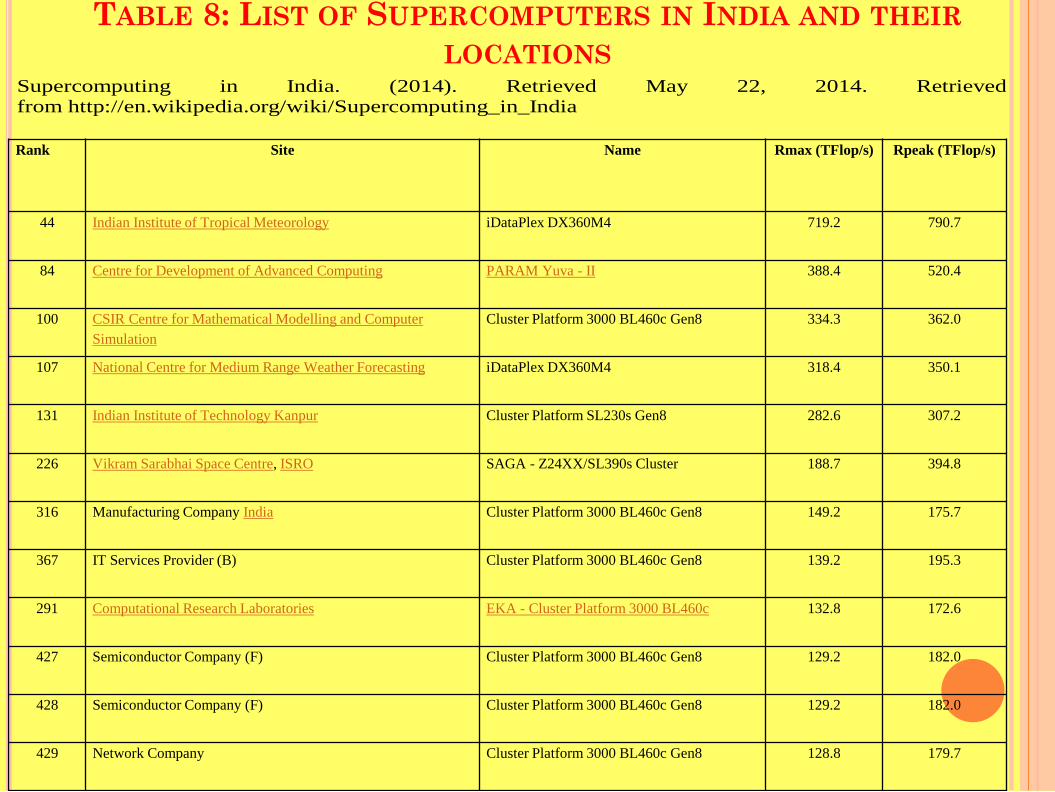
TABLE 8: LIST OF SUPERCOMPUTERS IN INDIA AND THEIR LOCATIONS
Rank Site Name Rmax (TFlop/s) Rpeak (TFlop/s)
44 Indian Institute of Tropical Meteorology iDataPlex DX360M4 719.2 790.7
84 Centre for Development of Advanced Computing PARAM Yuva - II 388.4 520.4
100 CSIR Centre for Mathematical Modelling and Computer Simulation
Cluster Platform 3000 BL460c Gen8 334.3 362.0
107 National Centre for Medium Range Weather Forecasting iDataPlex DX360M4 318.4 350.1
131 Indian Institute of Technology Kanpur Cluster Platform SL230s Gen8 282.6 307.2
226 Vikram Sarabhai Space Centre, ISRO SAGA - Z24XX/SL390s Cluster 188.7 394.8
316 Manufacturing Company India Cluster Platform 3000 BL460c Gen8 149.2 175.7
367 IT Services Provider (B) Cluster Platform 3000 BL460c Gen8 139.2 195.3
291 Computational Research Laboratories EKA - Cluster Platform 3000 BL460c 132.8 172.6
427 Semiconductor Company (F) Cluster Platform 3000 BL460c Gen8 129.2 182.0
428 Semiconductor Company (F) Cluster Platform 3000 BL460c Gen8 129.2 182.0
429 Network Company Cluster Platform 3000 BL460c Gen8 128.8 179.7
Supercomputing in India. (2014). Retrieved May 22, 2014. Retrieved from http://en.wikipedia.org/wiki/Supercomputing_in_India

TABLE 9: COMPARISON OF THE SUPERCOMPUTERS BETWEEN DIFFERENT COUNTRIES AS OF NOVEMBER 2013
Country Total Rmax (Gflops) Number of Computers in TOP500
System Share (%)
India 3,040,297 12 2.4
China 48,549,093 63 12.6
France 9,489,912 22 4.4
Germany 13,696,834 20 4
Japan 22,472,218 28 5.6
Russia 1,846,613 5 1
Poland 455,909 2 0.4
South Korea 1,258,060 5 1
UK 9,058,329 23 4.6
USA 118,261,596 264 52.8
Canada 2,077,842 10 2
Italy 2,665,609 5 1
Australia 2,180,151 5 1
Supercomputing in India. (2014). Retrieved May 22, 2014. Retrieved from http://en.wikipedia.org/wiki/Supercomputing_in_India
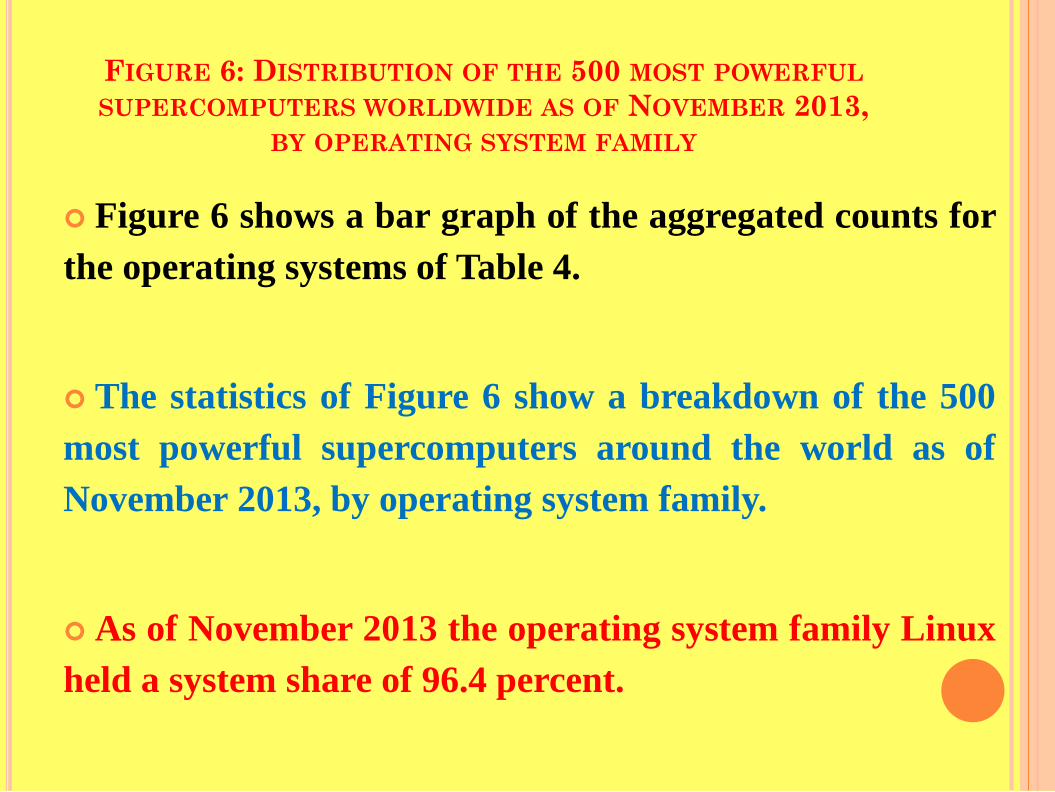
FIGURE 6: DISTRIBUTION OF THE 500 MOST POWERFUL SUPERCOMPUTERS WORLDWIDE AS OF NOVEMBER 2013,
BY OPERATING SYSTEM FAMILY
Figure 6 shows a bar graph of the aggregated counts for the operating systems of Table 4.
The statistics of Figure 6 show a breakdown of the 500 most powerful supercomputers around the world as of November 2013, by operating system family.
As of November 2013 the operating system family Linux held a system share of 96.4 percent.

FIGURE 6: DISTRIBUTION OF THE 500 MOST POWERFUL SUPERCOMPUTERS WORLDWIDE AS OF NOVEMBER 2013,
BY OPERATING SYSTEM FAMILY
Source: http://www.statista.com/statistics/249270/distribution-of-leading-supercomputers-worldwide-by-operating-system-family/

FIGURE 7: DISTRIBUTION OF THE 500 MOST POWERFUL SUPERCOMPUTERS AS OF NOVEMBER 2013, BY SEGMENT
Table 7 shows the numerical counts of the number of supercomputers used for each of the listed application areas as of November 2013.
As Table 7 illustrates, 82% (410) of the top 500 supercomputers in the world had a non-specified application area, followed by 11.2% (56) for research, and 1.8% (9) for weather.
Figure 7 on next slide shows Statista as an aggregated distribution of the 500 most powerful supercomputers as of November 2013 into only 7 categories instead of the 12 categories of Table 7, and thus showing a greater number and percentage (20.6%) of supercomputers being used for research area.

FIGURE 7: DISTRIBUTION OF THE 500 MOST POWERFUL SUPERCOMPUTERS AS OF NOVEMBER 2013, BY SEGMENT
Source: http://www.statista.com/statistics/264449/distribution-of-supercomputers-worldwide-by-segment/

FIGURE 8: SYSTEM SHARE OF INTERCONNECT FAMILIES USED IN THE MOST POWERFUL 500 SUPERCOMPUTERS
WORLDWIDE AS OF NOVEMBER 2013
Figure 8 shows the system share of interconnect families used in the 500 most powerful supercomputers around the world as of November 2013.
As of November 2013 Infiniband was the interconnect family used in 41.4 percent of the leading supercomputers.

FIGURE 8: SYSTEM SHARE OF INTERCONNECT FAMILIES USED IN THE MOST POWERFUL 500 SUPERCOMPUTERS WORLDWIDE AS OF NOVEMBER 2013
Source: http://www.statista.com/statistics/264446/distribution-of-interconnect-families-used-in-supercomputers
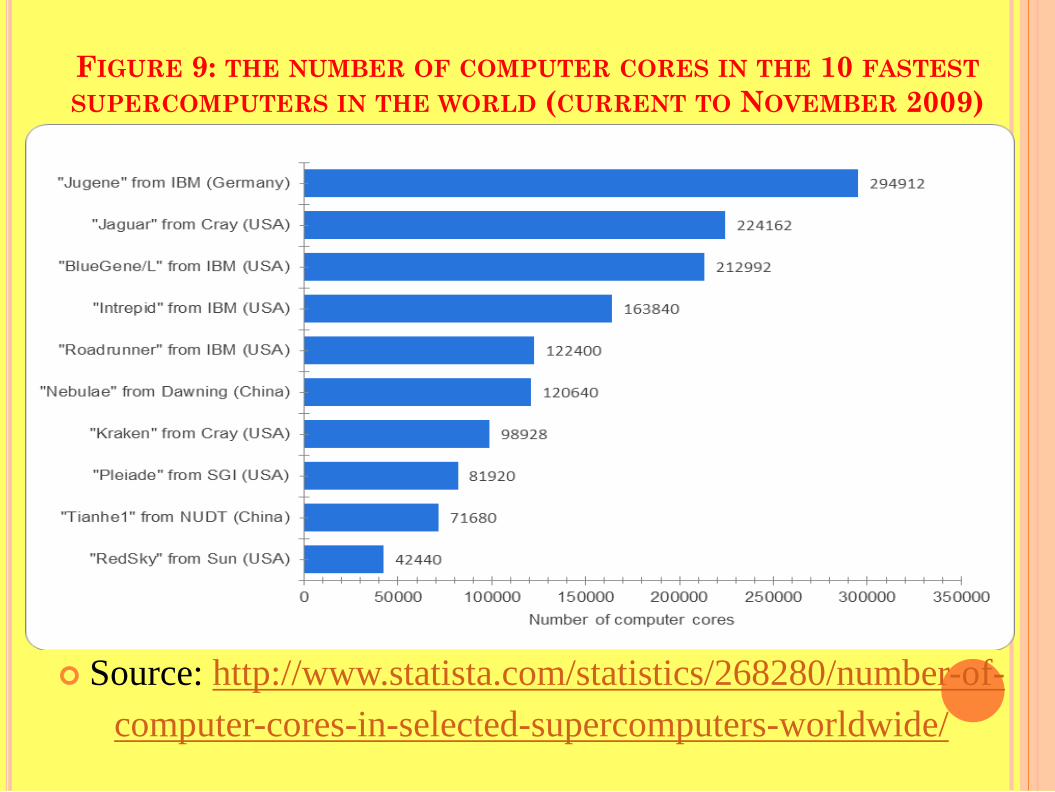
FIGURE 9: THE NUMBER OF COMPUTER CORES IN THE 10 FASTEST SUPERCOMPUTERS IN THE WORLD (CURRENT TO NOVEMBER 2009)
Source: http://www.statista.com/statistics/268280/number-of-computer-cores-in-selected-supercomputers-worldwide/
/

Table 10: Share of the 500 most powerful supercomputers worldwide as of November 2013, by
vendor.
Figure 10 shows a breakdown of the 500 most
powerful supercomputers around the world as of November 2013, by vendor (top 10 vendors only).
As of that time IBM had a system share of 32.8
percent of the top 500 supercomputers worldwide.

Table 10: Share of the 500 most powerful supercomputers worldwide as of November 2013, by vendor.
• Source: http://www.statista.com/statistics/249268/share-of-leading-supercomputers-worldwide-by-vendor/
Source: http://www.statista.com/statistics/249268/share-of-leading-supercomputers-worldwide-by-vendor/

• Steganography, the art of concealing a message within a message, is a type of encoding whose operations are required to remain secret, not only on the algorithmic level, but also that a steganographic function is being performed should be kept secret as well.
• Those properties justify, and make the use of supercomputers suitable for steganography. Steganography requires data manipulation and is linked to data-mining methodologies.
• Source: Dan Ophir (2014) 44

Figure 1: An example of steganographic manipulation: image (a), the original image, has been overlapped with image (b). In order to see this superimposed image, the observer has to look at the
picture at a distance of about 50 cm (the image is a private acquisition).

Figure 6: The indicated ternary tracts (gray) in the sequence of nucleotides of the p53 gene.
46
Data mining tools can check the distribution of nucleotides and compare them to randomly generated information. It was discovered that some binary tract appearances have a biological significance and this was also shown in ternary tracts. However, even though the appearance of ternary tracts is unusual, it was determined that these tracts are found in a subset of the significant binary tracts.
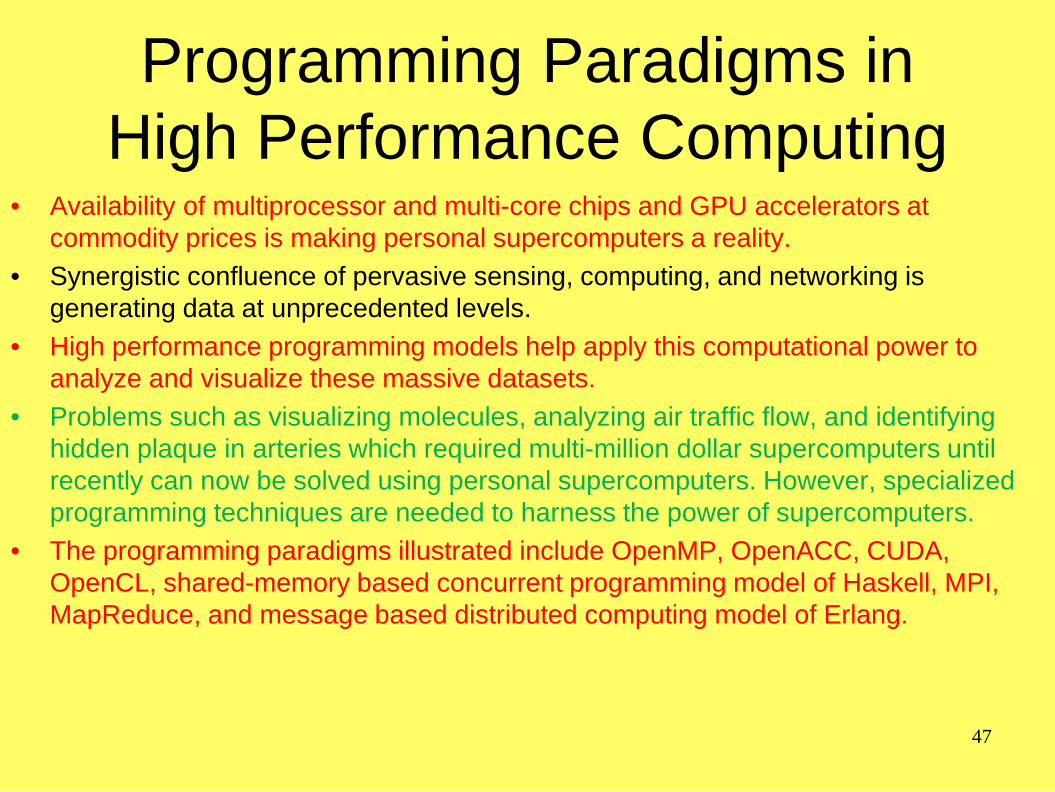
Programming Paradigms in
High Performance Computing • Availability of multiprocessor and multi-core chips and GPU accelerators at
commodity prices is making personal supercomputers a reality. • Synergistic confluence of pervasive sensing, computing, and networking is
generating data at unprecedented levels. • High performance programming models help apply this computational power to
analyze and visualize these massive datasets. • Problems such as visualizing molecules, analyzing air traffic flow, and identifying
hidden plaque in arteries which required multi-million dollar supercomputers until recently can now be solved using personal supercomputers. However, specialized programming techniques are needed to harness the power of supercomputers.
• The programming paradigms illustrated include OpenMP, OpenACC, CUDA, OpenCL, shared-memory based concurrent programming model of Haskell, MPI, MapReduce, and message based distributed computing model of Erlang.
47
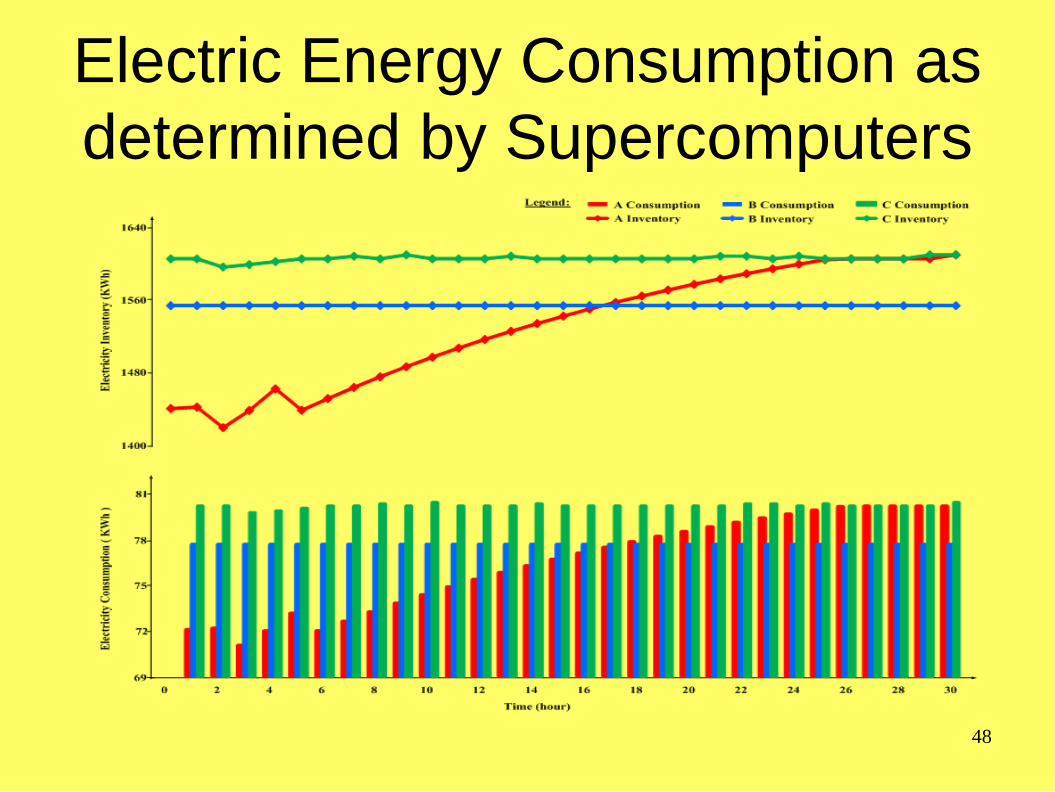
Electric Energy Consumption as determined by Supercomputers
48

Binary Logic is language of supercomputers
• Source: Jeremy Horne (2014)
49
p q r s (p & q) → [(r ≡ s) v (p → r)] 0 0 0 0 0 0 0 1 0 1 0 1 0 1 0 0 0 0 1 0 0 0 1 0 0 1 1 0 1 0
0 0 1 0 0 0 0 1 1 0 0 1 0 1 1 0 0 1 1 0 0 0 1 1 1 1 1 0 1 1 ... ... ... ... ... ... ... ... ... ... ... ... ... ... ... 1 1 0 0 1 1 1 1 0 1 0 1 1 0 0
1 1 0 1 1 1 1 0 0 0 1 0 1 0 0 1 1 1 0 1 1 1 1 1 0 0 1 1 1 1 1 1 1 1 1 1 1 1 1 1 1 1 1 1 1

Supercomputing Logic Source: Jeremy Horne (2014)
50
The Three Dimensional Hypercube, Function 13 Plate
f13 f0 f1 f2 f3 f4 f5 f6 f7 f8 f9 f10 f11 f12 f13 f14 f15 f0 f15 f15 f15 f15 f15 f15 f15 f15 f15 f15 f15 f15 f15 f15 f15 f15 f1 f14 f15 f14 f15 f14 f15 f14 f15 f14 f15 f14 f15 f14 f15 f14 f15 f2 f13 f13 f15 f15 f13 f13 f15 f15 f13 f13 f15 f15 f13 f13 f15 f15 f3 f12 f13 f14 f15 f12 f13 f14 f15 f12 f13 f14 f15 f12 f13 f14 f15 f4 f11 f11 f11 f11 f15 f15 f15 f15 f11 f11 f11 f11 f15 f15 f15 f15 f5 f10 f11 f10 f11 f14 f15 f14 f15 f10 f11 f10 f11 f14 f15 f14 f15 f6 f9 f9 f11 f11 f13 f13 f15 f15 f9 f9 f11 f11 f13 f13 f15 f15 f7 f8 f9 f10 f11 f12 f13 f14 f15 f8 f9 f10 f11 f12 f13 f14 f15 f8 f7 f7 f7 f7 f7 f7 f7 f7 f15 f15 f15 f15 f15 f15 f15 f15 f9 f6 f7 f6 f7 f6 f7 f6 f7 f14 f15 f14 f15 f14 f15 f14 f15 f10 f5 f5 f7 f7 f5 f5 f7 f7 f13 f13 f15 f15 f13 f13 f15 f15 f11 f4 f5 f6 f7 f4 f5 f6 f7 f12 f13 f14 f15 f12 f13 f14 f15 f12 f3 f3 f3 f3 f7 f7 f7 f7 f11 f11 f11 f11 f15 f15 f15 f15 f13 f2 f3 f2 f3 f6 f7 f6 f7 f10 f11 f10 f11 f14 f15 f14 f15 f14 f1 f1 f3 f3 f5 f5 f7 f7 f9 f9 f11 f11 f13 f13 f15 f15 f15 f0 f1 f2 f3 f4 f5 f6 f7 f8 f9 f10 f11 f12 f13 f14 f15
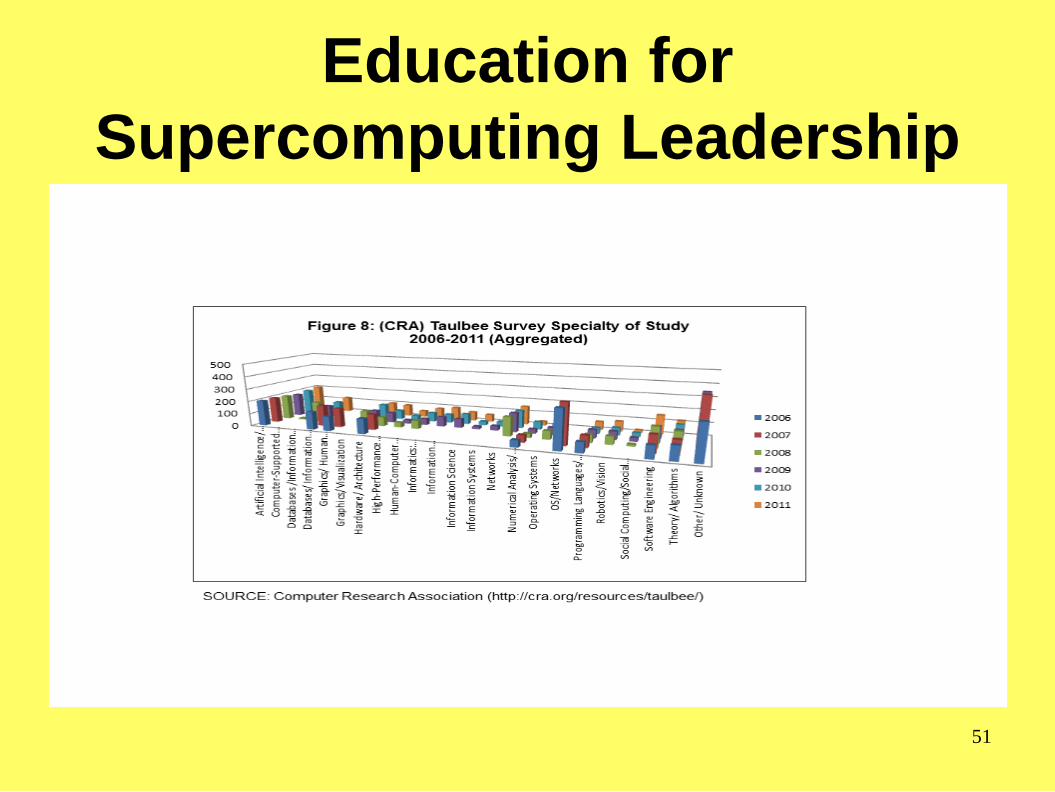
Education for Supercomputing Leadership
51

52

53

54

NEW SUPERCOMPUTER SPEEDS CANCER GENOME ANALYSIS TO SECONDS
OCTOBER 3, 2012 | BY DAN BOWMAN
Source: http://www.fiercehealthit.com/story/new-supercomputer-speeds-cancer-genome-analysis-seconds/2012-10-03
The launch of a new genomic supercomputing platform that can speed cancer genome analysis from months to seconds is the result of a collaboration announced in October 2012 between NantHealth, a health technology company founded by billionaire Patrick Soon-Shiong, and several other well-known companies, including Blue Shield of California, Verizon, Bank of America, AT&T, Intel and Hewlett-Packard.
=================================================================== The platform, which Soon-Shiong discussed October 3 , 2012 at Bipartisan Policy
Center gathering in Washington, D.C., analyzed more than 6,000 cancer genomes from more than 3,000 patients with 19 different cancer types in a total time span of 69 hours--or, one patient analysis every 47 seconds. Typically, according to the announcement, genomic analysis takes without supercomputers roughly eight to 10 weeks to complete.
=================================================================== "We can't reduce the cost of care and improve outcomes in cancer if we don't have the
capability to know the right treatment for the right patient before treatment begins," Soon-Shiong said in a statement. "We needed a national supercomputing infrastructure that brings genomic medicine into clinical practice. By placing supercomputers in the hands of physicians, that need is now a reality."

RESEARCH & APPLICATIONS IN GLOBAL SUPERCOMPUTING:
AN INTERDISCLINARY SCIENCE
Professor Richard S. SEGALL
Arkansas State University Department of Computer & Information Technology
College of Business State University, AR 72467-0130 USA
E-mail: [email protected]
WMSCI 2014, July 17-20, 2014, Orlando, FL


BACKGROUND ON
DR. SEGALL’S RESEARCH OF
SUPERCOMPUTING

SUPERCOMPUTING PUBLICATIONS CO-AUTHORED BY DR. RICHARD S. SEGALL:
1. Segall, Richard S.; Zhang, Qingyu; Cook, Jeffrey S., “Overview of Current Research in Global Supercomputing”, Proceedings of Fourty-Fourth Meeting of Southwest Decision Sciences Institute, Albuquerque, NM, March 12-16, 2013. 2. Segall, Richard S.; Zhang, Qingyu, “Open-Source Software Tools for Data Mining Analysis of Genomic and Spatial Images using High Performance Computing” Proceedings of 5th INFORMS Workshop on Data Mining & Health Informatics, Austin, TX, November 6, 2010. 3. Segall, Richard S., Zhang, Qingyu; Pierce, Ryan, “Data Mining Supercomputing with SAS JMP® Genomics”, Proceedings of 14th World Multi-Conference on Systemics, Cybernetics & Informatics: WMSCI 2010, Orlando, FL, June 29-July 2, 2010. 4. Segall, Richard S., Zhang, Qingyu; Pierce, Ryan M. “Data Mining Supercomputing with SAS JMP® Genomics: Research-in-Progress, Proceedings of 2010 Conference on Applied Research in Information Technology, sponsored by Acxiom Laboratory of Applied Research (ALAR),University of Central Arkansas (UCA), Conway, AR, April 9, 2010. 5. Segall, Richard S., Zhang, Qingyu; Pierce, Ryan M., “Visualization by Supercomputing Data Mining”, Proceedings of the 4th INFORMS Workshop on Data Mining and System Informatics, San Diego, CA, October 10, 2009.

OPEN-SOURCE SOFTWARE TOOLS FOR DATA MINING ANALYSIS OF GENOMIC AND SPATIAL IMAGES USING
HIGH PERFORMANCE COMPUTING
San Diego Supercomputer Center (SDSC)
“Dash” of SDSC is the first HPC system to use flash memory technology as an integrated, data-intensive resource primarily designed to support UC San Diego and UC researchers, in addition to researchers from the NSF TeraGrid.
Protein Data Bank: global resource of protein
information used by about 20,000 users per day.

TABLE 1: OPEN-SOURCE VISUALIZATION SOFTWARE AT SAN DIEGO SUPERCOMPUTER CENTER (SDSC)
[SOURCE: SEGALL & ZHANG (2010)] Software Name Free Open
Source (Yes/No) Description
GIMP Yes Image Manipulation Program
ImageMagick Yes Image Manipulation Program
Mesa3D Yes 3D Graphics Library
NCL (NCAR Command Language)
Yes with Binary Distribution
Scientific Visualization
ParaView Yes Visualization for large data sets
TecPlot No For complex data sets & 3D
VAPOR Yes For Ocean, Atmospheric & Solar
VisIT Yes Interactive parallel visualization
VISTA Yes Scalable robust volume renderer
OPEN-SOURCE SOFTWARE TOOLS FOR DATA MINING ANALYSIS OF GENOMIC AND SPATIAL IMAGES USING
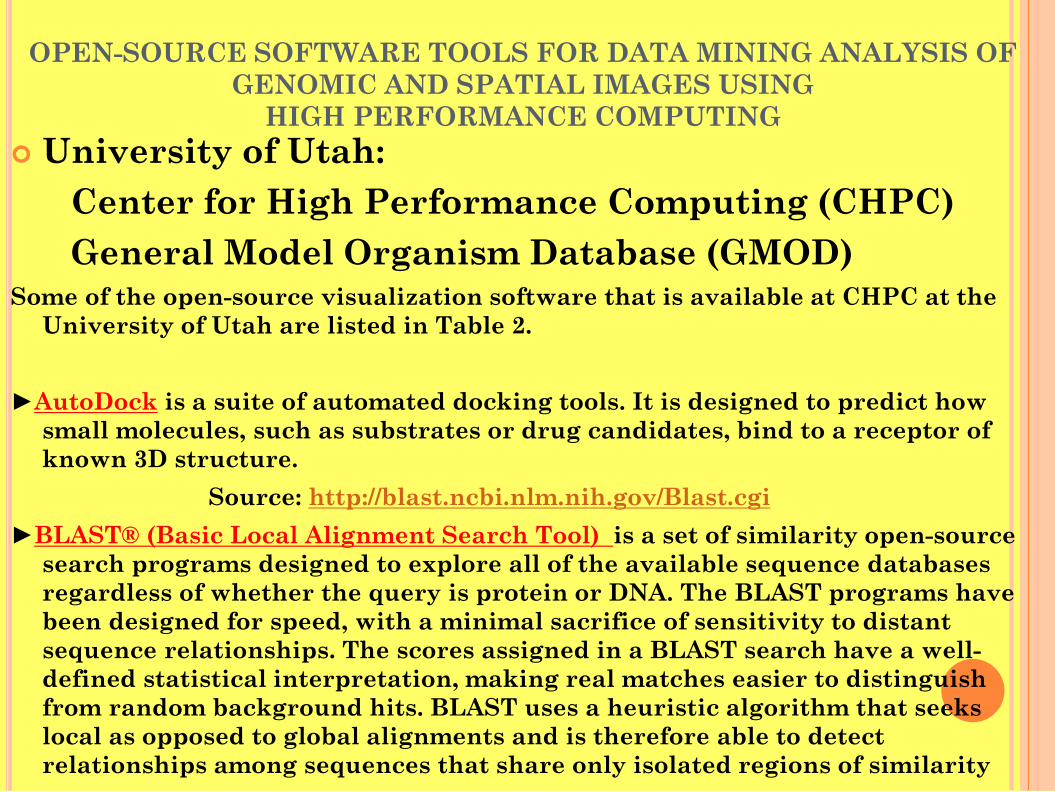
HIGH PERFORMANCE COMPUTING University of Utah: Center for High Performance Computing (CHPC) General Model Organism Database (GMOD) Some of the open-source visualization software that is available at CHPC at the
University of Utah are listed in Table 2. ►AutoDock is a suite of automated docking tools. It is designed to predict how
small molecules, such as substrates or drug candidates, bind to a receptor of known 3D structure.
Source: http://blast.ncbi.nlm.nih.gov/Blast.cgi ►BLAST® (Basic Local Alignment Search Tool) is a set of similarity open-source
search programs designed to explore all of the available sequence databases regardless of whether the query is protein or DNA. The BLAST programs have been designed for speed, with a minimal sacrifice of sensitivity to distant sequence relationships. The scores assigned in a BLAST search have a well-defined statistical interpretation, making real matches easier to distinguish from random background hits. BLAST uses a heuristic algorithm that seeks local as opposed to global alignments and is therefore able to detect relationships among sequences that share only isolated regions of similarity
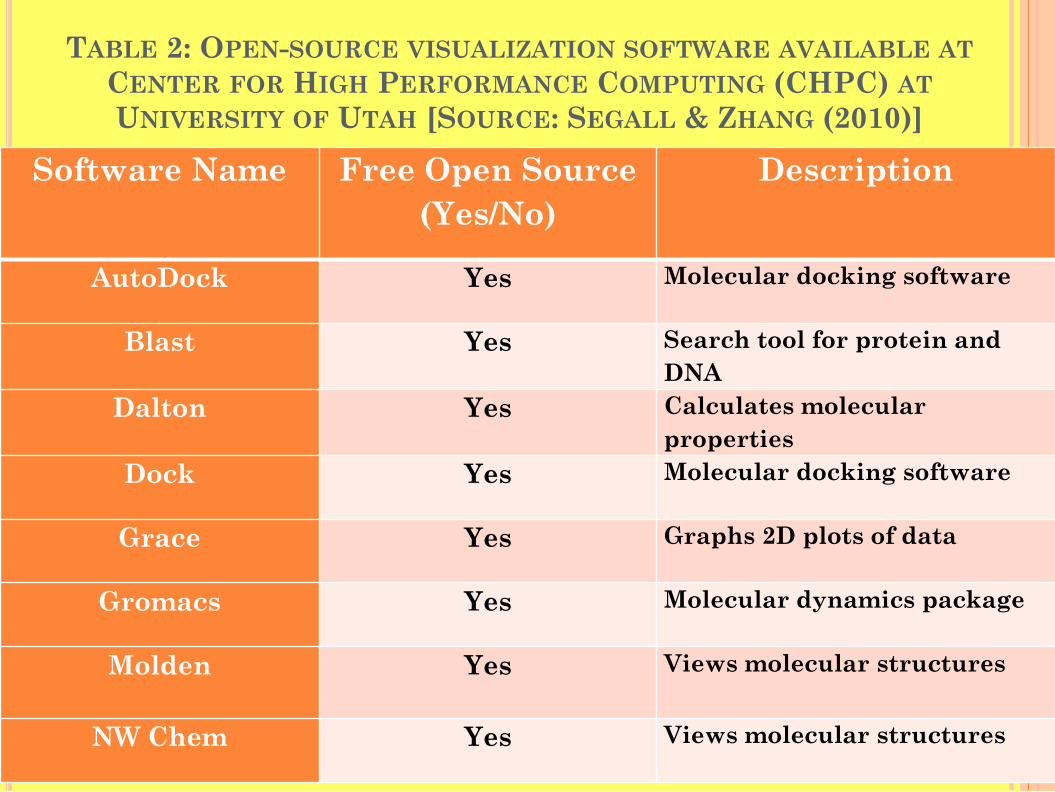
TABLE 2: OPEN-SOURCE VISUALIZATION SOFTWARE AVAILABLE AT CENTER FOR HIGH PERFORMANCE COMPUTING (CHPC) AT UNIVERSITY OF UTAH [SOURCE: SEGALL & ZHANG (2010)]
Software Name Free Open Source (Yes/No)
Description
AutoDock Yes Molecular docking software
Blast Yes Search tool for protein and DNA
Dalton Yes Calculates molecular properties
Dock Yes Molecular docking software
Grace Yes Graphs 2D plots of data
Gromacs Yes Molecular dynamics package
Molden Yes Views molecular structures
NW Chem Yes Views molecular structures

FIGURE 2: MESH VIEWER INTERFACED WITH OPEN-SOURCE VISTA VOLUME RENDERER
[Source: http://www.sdsc.edu/us/visservices/software/meshviewer/userguide.html]

FIGURE 3: COLOR –CODED SHAKING INTENSITIES OF 1906 SAN FRANCISCO EARTHQUAKE USING OPEN-SOURCE SOFTWARE OF
MESH VIEWER INTERACTIVE VOLUME VISUALIZATION
[Source: http://www.sdsc.edu/us/visservices/gallery/ ]

FIGURE 4: MOLECULAR STRUCTURE GENERATED USING DOCK 6 SOFTWARE
[Source:http://dock.compbio.ucsf.edu/DOCK_6/tutorials/grid_generation/generating_grid.htm]
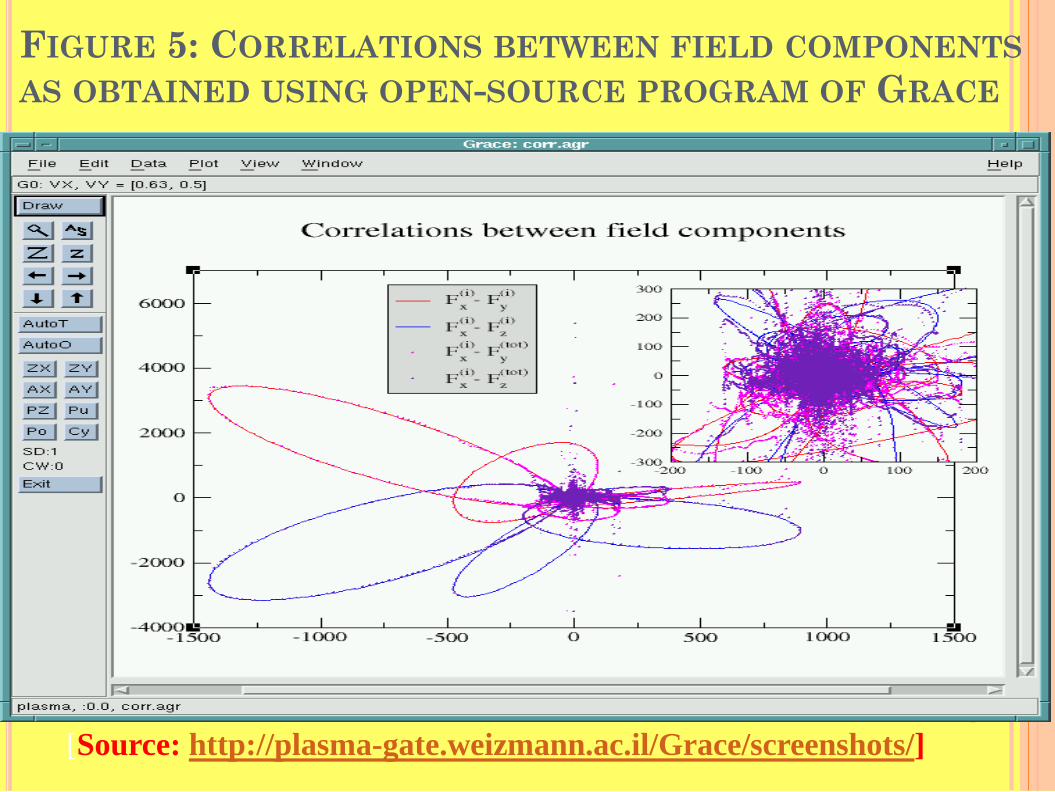
FIGURE 5: CORRELATIONS BETWEEN FIELD COMPONENTS AS OBTAINED USING OPEN-SOURCE PROGRAM OF GRACE
[Source: http://plasma-gate.weizmann.ac.il/Grace/screenshots/]

VISUALIZATION BY SUPERCOMPUTING DATA
MINING Richard S. Segall Arkansas State University Department of Computer & Information Technology College of Business, State University, AR 72467-0130, [email protected] Qingyu Zhang Arkansas State University Department of Computer & Information Technology College of Business, State University, AR 72467-0130, [email protected] Ryan M. Pierce Arkansas State University Student Affairs Technology Services State University, AR 72467-0348, [email protected]

AVIZO & SAS JMP® GENOMICS Supercomputing is today used for high performance data
mining and data intensive computing of large and distributed data sets.
Much software has been developed for visualization of data intensive computing for use with supercomputers, including that for large-scale parallel data mining.
Figures 4 to 19 illustrate the visualization of supercomputing for two selected software of Avizo® by Visualization Science Group and JMP® Genomics from SAS Institute.
Both software are used for supercomputing data mining at the University of Minnesota Supercomputing Institute for Advanced Computation Research. Avizo® is 3-D visualization software for scientific and industrial data that can process very large datasets at interactive speed. JMP® Genomics from SAS is used for discovering the biological patterns in genomics data.

AVIZO & SAS JMP® GENOMICS The research presented in Segall et al. (2009a)
using Avizo® includes that for scientific visualization of the human head, advanced vector field visualization of flow simulation around aircraft, visualization of static molecules as well as trajectories, and materials properties and structure for industrial tomography.
Similarly, the research presented in Segall et al. (2010a) using JMP® Genomics is for analyzing large microarray experiments for patient data of lung cancer and breast cancer tumors. Visualization plots created for these data sets include 2-D and 3-D plots, heat maps, dendograms, and data distribution plots.

BACKGROUND OF SUPERCOMPUTING DATA MINING
According to Wikipedia (2013), supercomputers or HPC (High Performance Computing) are used for highly calculation-intensive tasks such as problems involving quantum mechanical physics, weather forecasting, global warming, molecular modeling, physical simulations (such as for simulation of airplanes in wind tunnels and simulation of detonation of nuclear weapons).
According to Sanchez (1996), The Children’s Hospital of Pennsylvania took MRI scans of a child’s brain in 17 seconds using supercomputing for that which otherwise normally would require 17 minutes assuming no movement of the patient. Researchers at the University of Pennsylvania received the Supercomputing ’95 Data Mining Research Award.
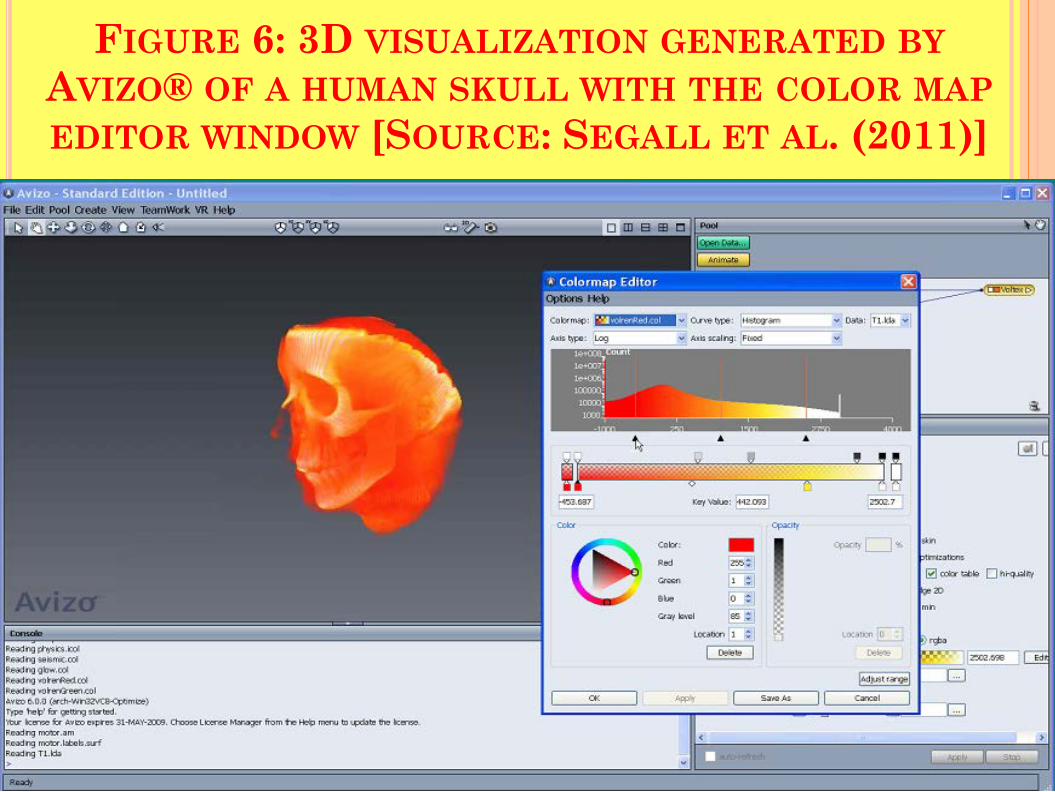
FIGURE 6: 3D VISUALIZATION GENERATED BY AVIZO® OF A HUMAN SKULL WITH THE COLOR MAP EDITOR WINDOW [SOURCE: SEGALL ET AL. (2011)]
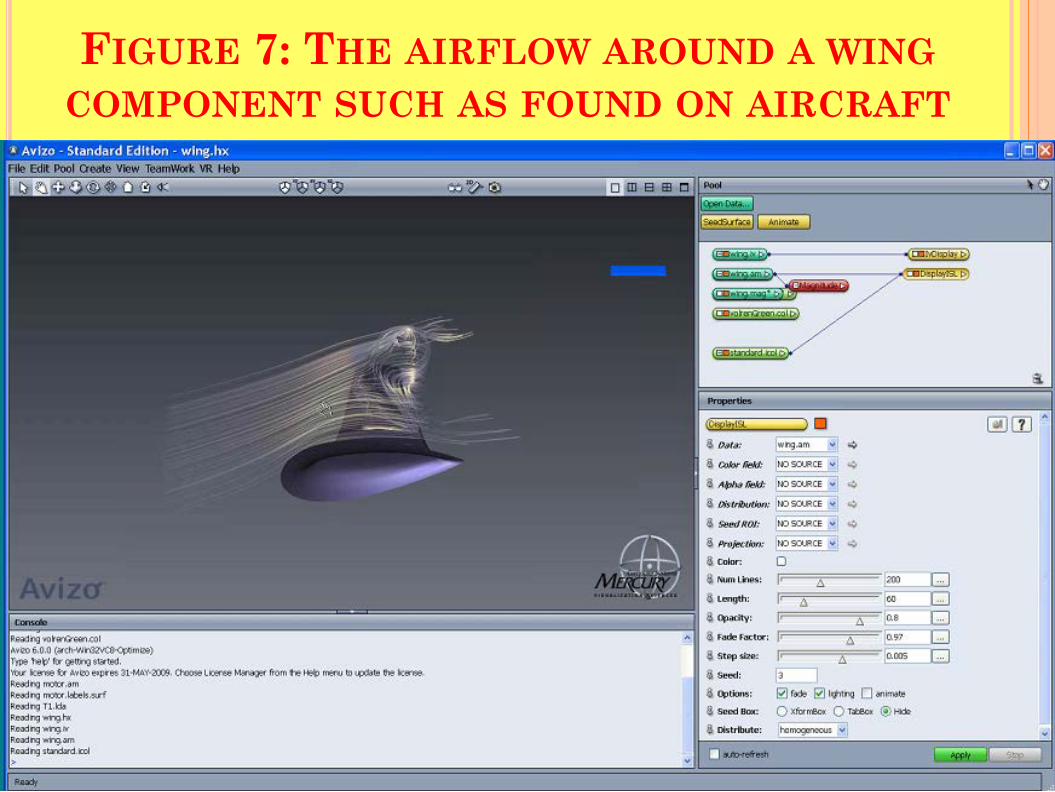
FIGURE 7: THE AIRFLOW AROUND A WING COMPONENT SUCH AS FOUND ON AIRCRAFT

FIGURE 8: AVIZO® WORKSPACE FOR THE 3D VISUALIZATION OF A COMPONENT OF
A MOTOR IN A FRONT VIEW

FIGURE 9: THE ATOMIC STRUCTURE OF 14 ATOMS HAVING 13 BONDS AND 1 RESIDUE [SOURCE: SEGALL ET AL. (2011)]

Data Mining Supercomputing with SAS JPM® Genomics
Dr. Richard S. Segall* and Dr. Qingyu Zhang* Arkansas State University
Department of Computer & Information Technology College of Business
State University, AR 72467-0130 [email protected] [email protected]
Ryan M. Pierce
Arkansas State University Student Affairs Technology Services
State University, AR 72567-0348 [email protected]
Published in Proceedings of 2010 Conference on Applied Research in Information Technology, sponsored by Acxiom Laboratory of Applied Research (ALAR),
University of Central Arkansas (UCA), Conway, AR, April 9, 2010. *Would like to acknowledge funding to support this research from a 2009 Summer Faculty Research Grant as
awarded by the College of Business at Arkansas State University.

SAS JMP® Genomics • Significance of Research: Data Mining Software that can
used on Supercomputers with large data intensity to discover biological patterns in genomics data at genetic level.
• Can be used to micro-array data or data summarized from next-generation technologies.
• Authors were awarded free license from SAS Institute, Inc. to perform this research.
• Applied to data from National Center of Biotechnology Information (NCBI) website :
• (1.) lung cancer (66 samples including pairwise samples from 27 patients)
• (2.) breast cancer data (64 microarray experiments used as training set to identify genes in grades 1 and 3).

Basic Expression Workflow of SAS JMP ® Genomics

Data Mining of Lung Cancer Microarrays using Supercomputing
• Data consists of 22,000 rows representing genes and 54 columns representing samples.
• Following slides show SAS JMP Genomics plots of: • Correlation analysis scatterplots of microarrays that have
cancer and those do not. • Dendogram of Hierarchical clustering of microarrays • Volcano plot of individual genes and their differences in
condition of cancer from normal tissues. • One-way analysis plots of fitting a selected gene number
1773 by condition and patient.

Arrays of Lung Cancer Data

Basic Expression Workflow of SAS JMP ® Genomics
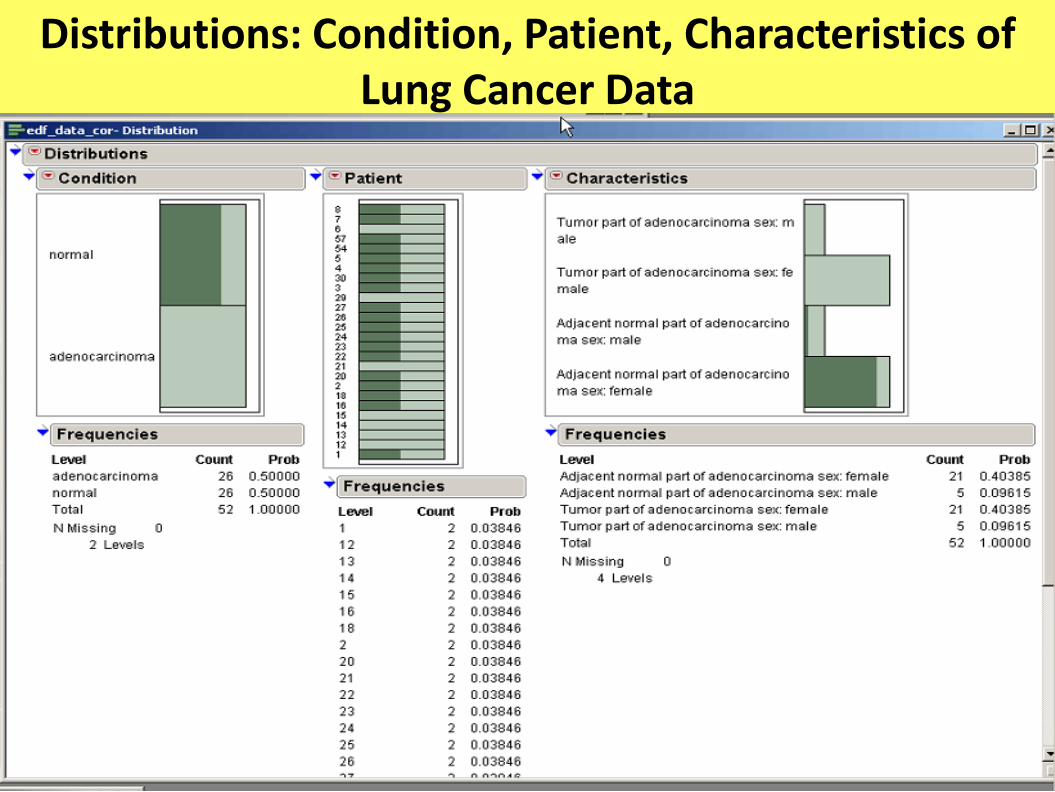
Distributions: Condition, Patient, Characteristics of Lung Cancer Data

Correlation Analysis of Principal Components of Lung Cancer Microarrays

Dendogram of Hierarchical Clustering of Lung Cancer Data
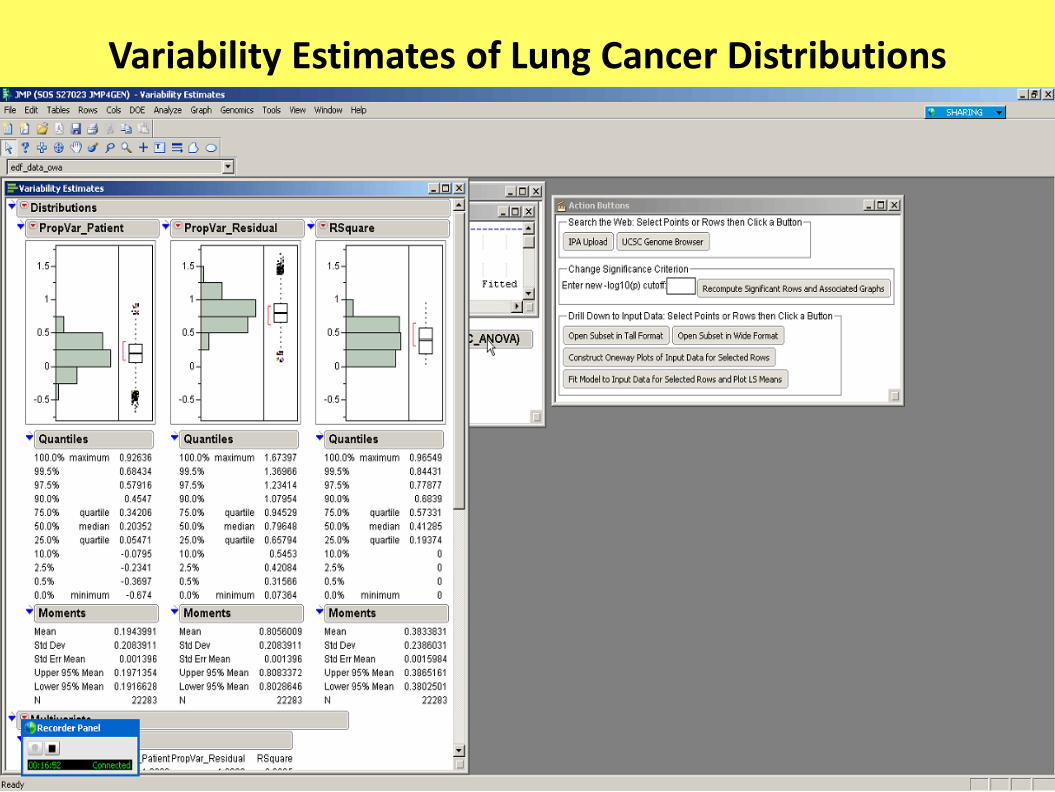
Variability Estimates of Lung Cancer Distributions

Volcano Plot of Lung Cancer Data
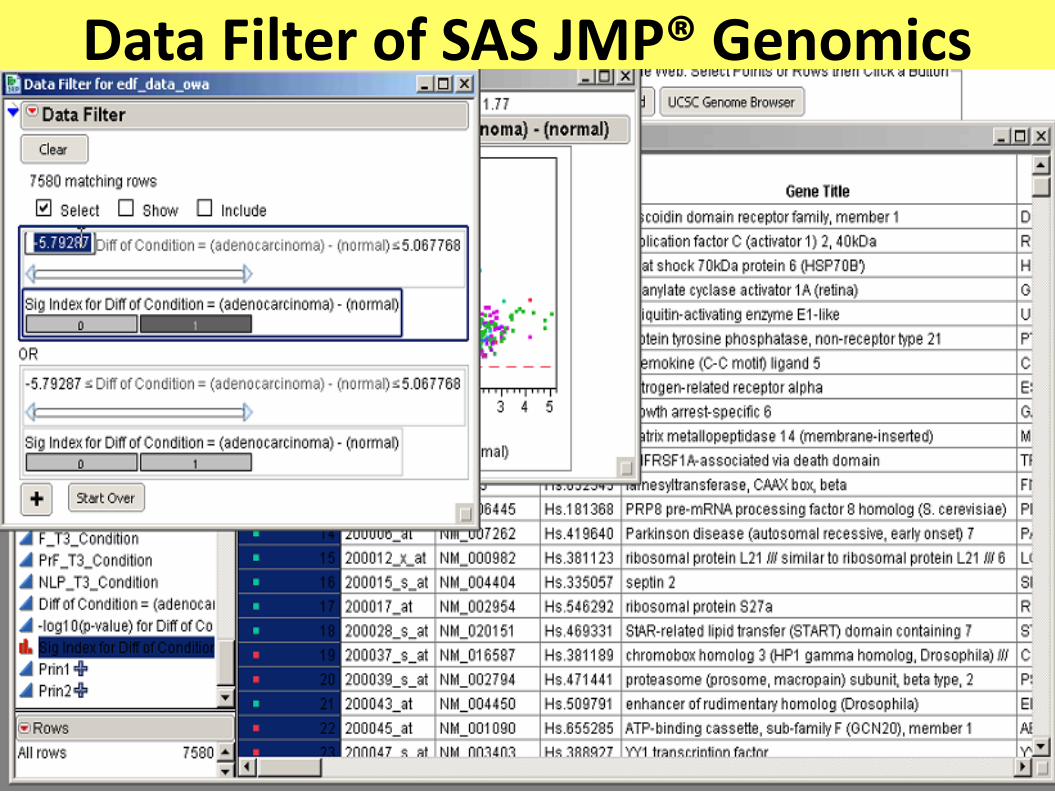
Data Filter of SAS JMP® Genomics

One-way Analysis by “Condition” or “Patient”

Data Mining of Breast Cancer Microarrays using Supercomputing
• Following slides show SAS JMP®Genomics plots of: • Box-plots of 50-iteration simple random cross-
validation root mean square error (RMSE) for 5 different models.
• Heat Map and Dendogram uses colors to indicate the intensity of correlation.
• Training set data with 235 ranked predictors for each of the 5 models.
• Distribution Results of Partition Tree Analysis. • Frequency distributions obtained from selecting
portion of Heat Map.

50-Iteration Simple Random Cross-Validation Root Mean Square Error for Breast Cancer

Heat Map and Dendrogram for Breast Cancer

Training Set Data for Breast Cancer

Partition Tree Results for Breast Cancer

Frequency Distributions by: Site, Grade & Node of Breast Cancer
Summary & Conclusions • Presented representative examples of information
quality at Minnesota and Barcelona Supercomputing Centers & US Department of Energy.
• Illustrates the interactive ability of using SAS JMP® Genomics to determine frequency distributions for selected variables in data mining.
• Provides other data mining visualization tools such as Volcano Plots for information quality.
• Both lung and breast cancer data used yielded distribution plots and other visualization plots for analysis of applying data mining at the micro-array level of data.

Summary & Conclusions • The data mining performed in this research was
performed to illustrate information quality:
• (a.) Uncover meaningful patterns and results at a high level of density of data.
• (b.) Such as investigating the interlinked biological pathways represented by the DNA sequencing, and
• (c.) Hence the use of supercomputers is a valuable tool in this research.

References 1. Bowman, D. (2012), “New supercomputer speeds cancer genome analysis
to seconds”, October 3, http://www.fiercehealthit.com/story/new-supercomputer-speeds-cancer-genome-analysis-seconds/2012-10-03
2. Cray corporation (2013), “Supercomputer-generated images playing role in contest”, Industry News, http://industry-news.cray.com/supercomputer-generated-images-playing-role-in-contest/
3. Image Spatial Data Analysis Group (2009), National Center for Supercomputing, University of Illinois at Urbana-Champaign, http://isda.ncsa.illinois.edu
4. Minnesota Supercomputing Institute (2012) ,”The Effect of Health Information Technology on Quality and Productivity” , https://www.msi.umn.edu/content/effect-health-information-technology-quality-and-productivity
5. NCBI (2006), “Gene Expression Profiling in Breast Cancer: Understanding the Molecular Basis of Histological Grade to Improve Prognosis”, Gene Expression Omnibus (GEO), Series GSE2990, National Center for Biotechnology Information, http://www.ncbi.nlm.nih.gov/geo/

References 6. NCBI (2007), “Expression data from Lung Cancer”, Gene
Expression Omnibus (GEO), Series GSE7670, National Center for Biotechnology Information, http://www.ncbi.nlm.nih.gov/geo/
7. Sanchez. E. (1996), Speedier: Penn researchers to link supercomputers to community problems, The Compass. V. 43, n.4., p. 14, September 17, http://www.upenn.edu/pennnews/features/1996/091796/research
8. SAS (2009), JMP® Genomics 4.0 Product Brief, http://www.jmp.com/software/genomics/pdf/103112_jmpg4_prodbrief.pdf
9. U.S. Department of Energy (2012) “Early career stars rise to data challenge”, http://ascr-discovery.science.doe.gov/newfaces/smarter_hpc4.shtml

99
Conclusions of this part of Research
• Novelty of research includes study of contrast of dimensionality of data at the micro-array level (e.g. Forest Cover vs. Human Lung).
• We utilized software that was never intended to be used at the micro-array level except for GeneSight. Selection of four software for this application is unique and the comparisons that we are able to make.
• Data mining of micro-array databases is a entirely new area that has only existed about 10 years, an immense amount of publications are biomedical research is now being directed in this area (e.g. Broad Institute affiliated with MIT, Harvard, Whitehead Institute, and affiliated hospitals founded in 2003).
• We expect this area of data mining of mico-array databases to become an influential factor in the way data mining could be performed for data bases of these dimensionalities.
RESEARCH & APPLICATIONS IN GLOBAL SUPERCOMPUTING:
AN INTERDISCLINARY SCIENCE
Professor Richard S. SEGALL
Arkansas State University Department of Computer & Information Technology
College of Business State University, AR 72467-0130 USA
E-mail: [email protected]
WMSCI 2014, July 17-20, 2014, Orlando, FL
